Corning Incorporated 2015 Annual Report One Riverfront ... · PDF fileOne Riverfront Plaza...
118
2015 Annual Report
Transcript of Corning Incorporated 2015 Annual Report One Riverfront ... · PDF fileOne Riverfront Plaza...
Corning IncorporatedOne Riverfront PlazaCorning, NY 14831-0001
U.S.A.
www.corning.com
02AR40015EN
© 2016 Corning Incorporated. All Rights Reserved.
2015 Annual Report
296423_Corning_CVR.indd 1 2/22/16 9:25 PM

Board of Directors
Donald W. Blair Retired Executive Vice President & Chief Financial Officer NIKE, Inc. Beaverton, OR(1) (4)Stephanie A. BurnsRetired Chairman& Chief Executive OfficerDow Corning CorporationSunset, SC(3)John A. Canning, Jr.Co-Founder & Chairman Madison Dearborn Partners, LLC Chicago, IL(4) (5) (6)Richard T. ClarkRetired Chairman, President& Chief Executive OfficerMerck & Co., Inc.Whitehouse Station, NJ(2) (5) (6)Robert F. Cummings, Jr.Retired Vice Chairmanof Investment BankingJPMorgan Chase & Co.New York, NY(4) (5) (6)Deborah A. HenrettaRetired Group President E-Business Procter & Gamble Cincinnati, OH(1) (3)Daniel P. HuttenlocherDean and Vice ProvostCornell University New York City Tech CampusNew York, NY(1) (4)Kurt M. LandgrafRetired President& Chief Executive OfficerEducational Testing ServicePrinceton, NJ(1) (2) (6)Kevin J. MartinVice PresidentFacebook, Inc.Washington, DC(3) (5)Deborah D. Rieman Executive Chairman MetaMarkets Group Woodside, CA(1) (2)Hansel E. Tookes IIRetired Chairman& Chief Executive OfficerRaytheon Aircraft CompanyPalm Beach Gardens, FL(2) (5) (6)
Wendell P. Weeks Chairman of the Board, Chief Executive Officer& PresidentCorning IncorporatedCorning, NY(6)Mark S. WrightonChancellor& Professor of ChemistryWashington University in St. LouisSt. Louis, MO(1) (4)
OfficersManagement Committee
James P. ClappinPresident —Corning Glass TechnologiesMartin J. CurranExecutive Vice President& Innovation OfficerJeffrey W. EvensonSenior Vice President& Chief Strategy OfficerLisa FerreroSenior Vice President& Chief Administrative OfficerClark S. KinlinExecutive Vice President —Corning Optical CommunicationsLawrence D. McRae Vice Chairman & Corporate Development OfficerDavid L. MorseExecutive Vice President & Chief Technology OfficerEric S. MusserExecutive Vice President — Corning Technologies & InternationalChristine M. Pambianchi Senior Vice President — Human ResourcesLewis A. SteversonSenior Vice President& General CounselR. Tony TripenySenior Vice President& Chief Financial OfficerWendell P. WeeksChairman of the Board,Chief Executive Officer& President
Other Officers
Thomas AppeltPresident — Corning International Emerging Markets
John R. IgelVice President& General Manager — Corning Optical Communications Linda E. JollyVice President & Corporate SecretaryWilfred M. Kenan, Jr.Vice President& Manufacturing Manager —Environmental TechnologiesJudith A. Lemke Vice President — TaxJohn P. MacMahon Senior Vice President — Global Compensation & BenefitsStephen P. MillerVice President — StrategyCorning Optical Communications & Corporate DevelopmentAvery H. Nelson IIIVice President & General Manager — Environmental TechnologiesTimothy J. ReganSenior Vice President — Worldwide Government AffairsMark S. RogusSenior Vice President& Treasurer Edward A. SchlesingerVice President& Corporate ControllerJohn M. SharkeyVice President& Chief of Staff to the CEOJames R. SteinerSenior Vice President& General Manager —Specialty MaterialsRonald L. VerkleerenVice President& General Manager —Corning Pharmaceutical TechnologiesLydia Kenton WalshVice President — Commercial Operations Life Sciences Curt WeinsteinVice President& General Manager —Advanced OpticsMariam O. Wright Senior Vice President — Global Manufacturing & QualityJohn Z. Zhang General Manager — Corning Display Technologies
Madapusi K. BadrinarayanVice President& Technology Executive —Science & TechnologyJohn P. Bayne, Jr.Vice President& General Manager —High Performance DisplaysThomas R. BeallVice President & Chief Intellectual Property Counsel Stefan Becker Vice President & Operations ControllerMichael A. BellSenior Vice President& General Manager,Optical Connectivity —Corning Optical CommunicationsGary S. Calabrese Senior Vice President — Global ResearchThomas G. CapekVice President& Chief Engineer Cheryl C. CappsVice President —Global Supply ManagementMark S. ClarkVice President& Chief Information OfficerJack H. ClelandSenior Vice President& Deputy General CounselCharles R. CraigSenior Vice President — Science & TechnologyMichael W. Donnelly Vice President — Business ServicesRichard M. EglenVice President& General Manager —Life SciencesLi FangPresident& General Manager —Corning Greater ChinaKimberly S. HartwellSenior Vice President& Chief Commercial Officer —Corning Optical CommunicationsClifford L. HundGeneral Manager & President — Corning East AsiaTimothy L. HuntVice President & Director — Corporate Product & Process Development
Board Committees
(1) Audit; (2) Compensation; (3) Corporate Relations; (4) Finance; (5) Nominating & Corporate Governance; (6) Executive © Corning Incorporated 2016. All Rights Reserved.
Corning is one of the world’s leading innovators in materials science. For more than 160 years, Corning has applied its unparalleled expertise in specialty glass, ceramics, and optical physics to develop products that have created new industries and transformed people’s lives.
296423_Corning_CVR.indd 2 3/2/16 6:41 PM
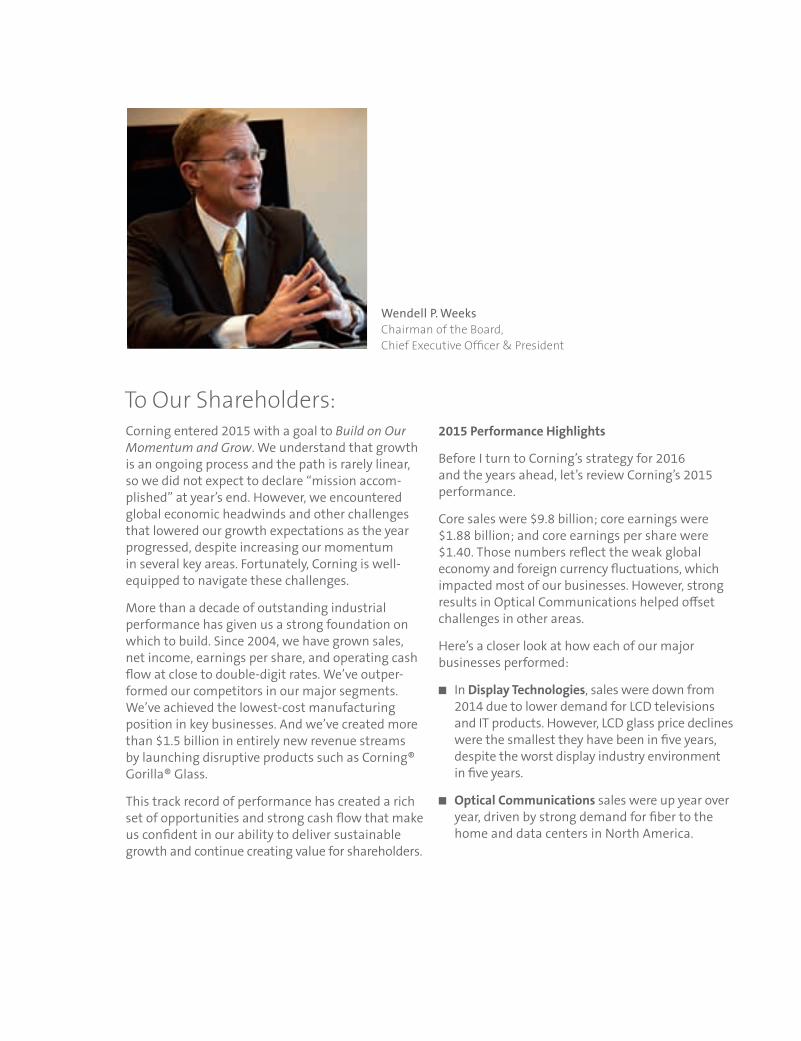
Wendell P. WeeksChairman of the Board, Chief Executive Officer & President
To Our Shareholders:Corning entered 2015 with a goal to Build on Our Momentum and Grow. We understand that growth is an ongoing process and the path is rarely linear, so we did not expect to declare “mission accom-plished” at year’s end. However, we encountered global economic headwinds and other challenges that lowered our growth expectations as the year progressed, despite increasing our momentum in several key areas. Fortunately, Corning is well-equipped to navigate these challenges. More than a decade of outstanding industrial performance has given us a strong foundation on which to build. Since 2004, we have grown sales, net income, earnings per share, and operating cash flow at close to double-digit rates. We’ve outper-formed our competitors in our major segments. We’ve achieved the lowest-cost manufacturing position in key businesses. And we’ve created more than $1.5 billion in entirely new revenue streams by launching disruptive products such as Corning® Gorilla® Glass. This track record of performance has created a rich set of opportunities and strong cash flow that make us confident in our ability to deliver sustainable growth and continue creating value for shareholders.
2015 Performance Highlights
Before I turn to Corning’s strategy for 2016 and the years ahead, let’s review Corning’s 2015 performance. Core sales were $9.8 billion; core earnings were $1.88 billion; and core earnings per share were $1.40. Those numbers reflect the weak global economy and foreign currency fluctuations, which impacted most of our businesses. However, strong results in Optical Communications helped offset challenges in other areas. Here’s a closer look at how each of our major businesses performed: n In Display Technologies, sales were down from 2014 due to lower demand for LCD televisions and IT products. However, LCD glass price declines were the smallest they have been in five years, despite the worst display industry environment in five years. n Optical Communications sales were up year over year, driven by strong demand for fiber to the home and data centers in North America.
296423_Corning_Narr_R2.indd 1 3/2/16 1:15 AM

n In Specialty Materials, Gorilla Glass volume was up versus 2014. However, segment sales were down overall due to the completion of a large aerospace and defense program, softer demand in the semiconductor industry, and the weaker euro.
n Environmental Technologies sales were down year over year due to the declining euro and end-market weakness in China for both passenger cars and heavy-duty diesel trucks.
n In Life Sciences, sales were lower than expected, due to the weak euro.
Despite the economic headwinds, growth in Optical Communications was sufficient to produce aggre-gate growth in our non-Display segments. These results once again demonstrate the value of our diverse business portfolio.
New Growth Drivers
Corning grows primarily through innovation. We invest strongly in research, development, and engineering (RD&E) to innovate in our existing busi-nesses, while also creating entirely new businesses to drive growth in the years ahead. We then supple-ment that organic growth by pursuing acquisitions and ventures to enhance our product portfolio and extend our market access.
In 2015, we introduced several new products and advanced key innovation programs. n We launched Corning Lotus® NXT Glass, which has become the leading glass substrate for high-performance displays. n The first televisions to use our new Corning Iris™ Glass as a light-guide plate became commercially available. n We introduced our EDGE8™ solution, a new full-connectivity system for data centers. n We commercialized FLORA™ substrates, which reduce the dangerous emissions that occur upon engine startup. n We expanded our drug-discovery portfolio with the introduction of HepatoCells™ for toxicology and drug metabolism studies, and TransportoCells™ for testing drug-drug interactions.
n We reached a major milestone in our efforts to extend Gorilla Glass into new markets, with Ford’s introduction of the Ford GT. This is the first production vehicle to use Gorilla Glass for multiple glazing applications, including the windshield, rear engine cover, and acoustic separation wall.
We faced challenges as well. The exact timing and impact of innovations remain difficult to predict. The adoption of some products (such as Gorilla Glass 4) proceeded more quickly than anticipated, while others (such as our ONE™ Cellular Solutions) are proceeding more slowly. However, when we assess Corning’s overall innovation portfolio, we are pleased with the robustness of our pipeline and the oppor-tunities for both near-term and long-term growth.
On the acquisition front, we extended our leader-ship in Optical Communications with the addition of TR Manufacturing, Inc.; Samsung Electronics Co., Ltd.’s fiber business; and iBwave Solutions. These acquisitions had an immediate positive impact on Corning’s bottom line, in addition to improving our competitive position. We also acquired Gerresheimer’s glass tubing business and entered into an equity venture to capture an exciting opportunity in pharmaceutical packaging that we believe has the potential to become a very signifi-cant new business.
Our Strategy and Capital Allocation Framework
Let’s turn to how we are focusing Corning’s portfolio and utilizing our financial strength to drive growth and create value for shareholders.
Capital Allocation Plans
We expect to generate more than $20 billion between 2016 and 2019. In October 2015, we announced our plan to invest $10 billion of that cash in RD&E, capital expenditures, and acquisitions to drive growth in the years ahead. We also announced that we will distribute at least $10 billion (approxi-mately half of our current market cap) to sharehold-ers. We are committed to increasing the dividend by at least 10 percent annually through 2019, and we will continue to be opportunistic on share repurchases. We are executing on that commitment. Last October, Corning’s board of directors increased our repurchase authorization by $4 billion; between October 2015 and January of this year, we executed a $1.25 billion accelerated share repurchase; and in February, our board authorized a 12.5 percent quar-terly common stock dividend increase.
296423_Corning_Narr_R2.indd 2 3/2/16 1:15 AM

Focusing Our Portfolio
The core of what Corning does is invent, make, and sell. We create value by inventing category-defining products, using transformative manufacturing plat-forms, and building strong, trust-based relationships with global leaders in their industries. We’re seek-ing to augment that value-creation through a more focused and cohesive portfolio that improves our probability of success, reduces the cost of innovation, and increases the barriers to entry.
The framework focuses our portfolio on a set of reinforcing capabilities with strong inter-connections. Corning’s best-in-the-world capabilities include three core technologies, four manufacturing and engineering platforms, and five market-access platforms. Our probability of success increases as we apply more of these world-class capabilities; our cost of innovation declines as we re-apply talent and leverage our existing assets; and we create higher, more sustainable competitive barriers when we combine multiple capabilities.
n We reached a major milestone in our efforts to extend Gorilla Glass into new markets, with Ford’s introduction of the Ford GT. This is the first production vehicle to use Gorilla Glass for multiple glazing applications, including the windshield, rear engine cover, and acoustic separation wall.
We faced challenges as well. The exact timing and impact of innovations remain difficult to predict. The adoption of some products (such as Gorilla Glass 4) proceeded more quickly than anticipated, while others (such as our ONE™ Cellular Solutions) are proceeding more slowly. However, when we assess Corning’s overall innovation portfolio, we are pleased with the robustness of our pipeline and the oppor-tunities for both near-term and long-term growth.
On the acquisition front, we extended our leader-ship in Optical Communications with the addition of TR Manufacturing, Inc.; Samsung Electronics Co., Ltd.’s fiber business; and iBwave Solutions. These acquisitions had an immediate positive impact on Corning’s bottom line, in addition to improving our competitive position. We also acquired Gerresheimer’s glass tubing business and entered into an equity venture to capture an exciting opportunity in pharmaceutical packaging that we believe has the potential to become a very signifi-cant new business.
Our Strategy and Capital Allocation Framework
Let’s turn to how we are focusing Corning’s portfolio and utilizing our financial strength to drive growth and create value for shareholders.
Capital Allocation Plans
We expect to generate more than $20 billion between 2016 and 2019. In October 2015, we announced our plan to invest $10 billion of that cash in RD&E, capital expenditures, and acquisitions to drive growth in the years ahead. We also announced that we will distribute at least $10 billion (approxi-mately half of our current market cap) to sharehold-ers. We are committed to increasing the dividend by at least 10 percent annually through 2019, and we will continue to be opportunistic on share repurchases. We are executing on that commitment. Last October, Corning’s board of directors increased our repurchase authorization by $4 billion; between October 2015 and January of this year, we executed a $1.25 billion accelerated share repurchase; and in February, our board authorized a 12.5 percent quar-terly common stock dividend increase.
Focusing our portfolio means we are directing 80 percent or more of our resources to opportunities that draw from at least two of these three capabili-ties sets. Few competitors can match our expertise in any one of our focus capabilities, and when we combine capabilities, we can create market-leading positions and margins. Of course, we recognize that Corning is the natural leader for some great oppor-tunities that do not require multiple capabilities. Our framework allows us to apply up to 20 percent of our resources on these opportunities. However, we know that those initiatives are riskier, so we only pursue them if the potential payoff is exceptional.
We developed this approach based on experience. Gorilla Glass is a great example of re-applying talent and leveraging our manufacturing and market- access platforms. To develop Gorilla Glass, we re-applied our expertise in glass science to deliver a new-to-the-world product faster and at lower cost than anyone else could have done. To manufacture it, we used fusion technology and manufacturing assets built for our Display business. That saved us about $800 million in capital, significantly enhancing our return on investment.
Focused PortfolioHigher Success Rate, Lower Costs, and Better Cohesion
Vapor Deposition
Fusion
Extrusion
Precision Forming
Optical Communications
Mobile Consumer Electronics
Display
Automotive
Life Sciences Vessels
Focus > 80% of resources on opportunities that leverage capabilities from at least two of three columns.
Core Technologies3 Manufacturing &
Engineering Platforms4 Market-AccessPlatforms5
Glass Science
CeramicScience
Optical Physics
296423_Corning_Narr_R2.indd 3 3/2/16 1:15 AM

Our track record in Optical Communications demonstrates how combining capabilities creates higher and more sustainable competitive advantages. Using glass science, optical physics, and vapor deposition, we have dramatically increased the performance and lowered the cost of optical fiber. Ceramic science helped us improve connectors and reduce signal loss. We use extrusion to make cabling. And we use precision forming to make connectors. Not only have our customers benefited from this combination of our world-class capabilities, we’ve benefited as well. For instance, in the passive optical markets we serve, we capture 20 percent of the revenue, but 30 percent of the profits.
Focusing our portfolio also means that we will peri-odically add assets that complement our capabilities and divest or realign assets that fall outside our core capabilities. In December, we announced our plans to exchange Corning’s 50 percent interest in Dow Corning Corporation for a subsidiary that will hold approximately 40 percent ownership in Hemlock Semiconductor Group and $4.8 billion in cash. We believe this transaction creates significant value for shareholders. The realignment will be accretive to Corning’s EPS, and our position in Hemlock allows us to capture potential upside from a rebound in the solar market. The $4.8 billion is approximately 30 times the equity earnings from Dow Corning’s silicones business, and we expect the realignment to be essentially tax free.
Opportunities Ahead
Corning’s technologies and manufacturing plat-forms are becoming increasingly relevant to a broad range of industries, as illustrated in our depiction of The Glass Age (opposite page). For example, automakers are looking to make cars lighter, safer, sleeker, and more interactive, which creates disruptive innovation opportunities for Corning.
We believe Gorilla Glass offers compelling benefits including lighter weight for better fuel economy and vehicle handling; toughness and damage resistance to make vehicles safer and more durable; and an optically advantaged surface for head-up displays and touch technology. Best of all, we can leverage our existing capabilities and trust-based relationships to develop the new products. The automotive industry represents a potential glass market larger in square feet than the current LCD market, so we are understandably excited about this opportunity. In January, we entered into a joint venture with Saint-Gobain Sekurit to produce light-weight auto glazing. We look forward to providing updates on this initiative and other growth oppor-tunities as we progress.
Closing Thoughts
No doubt, we will continue to face challenges in 2016. But we’re confident in Corning’s long-term growth prospects and our ability to execute, because we have a strong record of performance, a robust innovation portfolio, and distinct capabilities that are becoming increasingly vital. Most impor-tantly, we always keep our eyes on the prize — not just another 165 years of innovation and independence for Corning, but also a world with cleaner air, unlimited bandwidth, more effective medicine, richer entertainment experiences, and more efficient communication. When you invest in Corning, you are investing in that world, too. Thank you for helping us bring it to life.
Sincerely,
Wendell P. WeeksChairman of the Board, Chief Executive Officer, and President
296423_Corning_Narr_R2.indd 4 3/2/16 1:15 AM
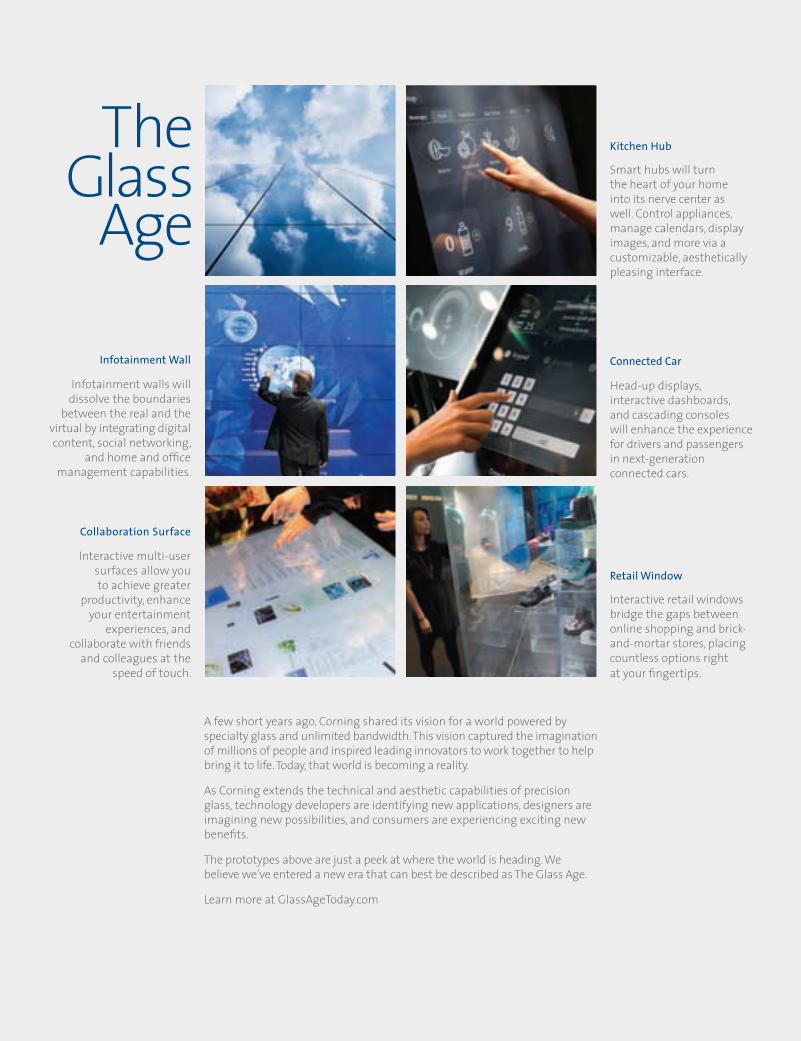
Smart hubs will turn the heart of your home into its nerve center as well. Control appliances, manage calendars, display images, and more via a customizable, aesthetically pleasing interface.
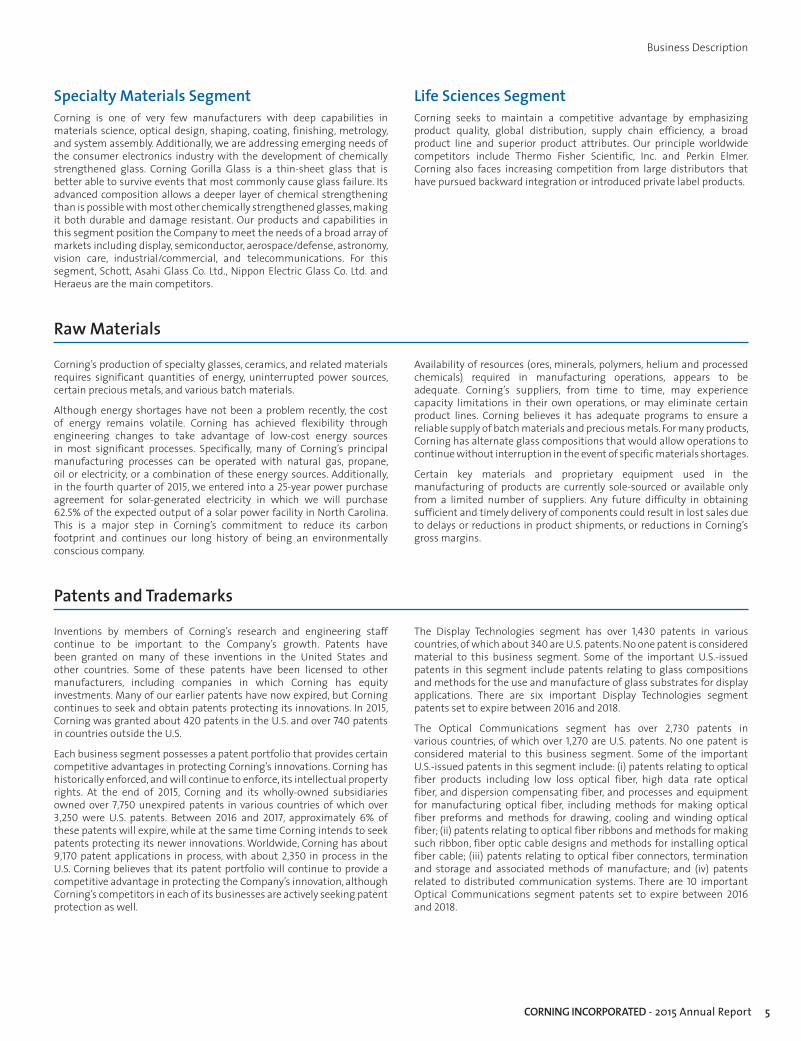
Connected CarInfotainment Wall
Head-up displays, interactive dashboards, and cascading consoles will enhance the experience for drivers and passengers in next-generation connected cars.
Infotainment walls will dissolve the boundaries
between the real and the virtual by integrating digital content, social networking,
and home and office management capabilities.
Kitchen Hub
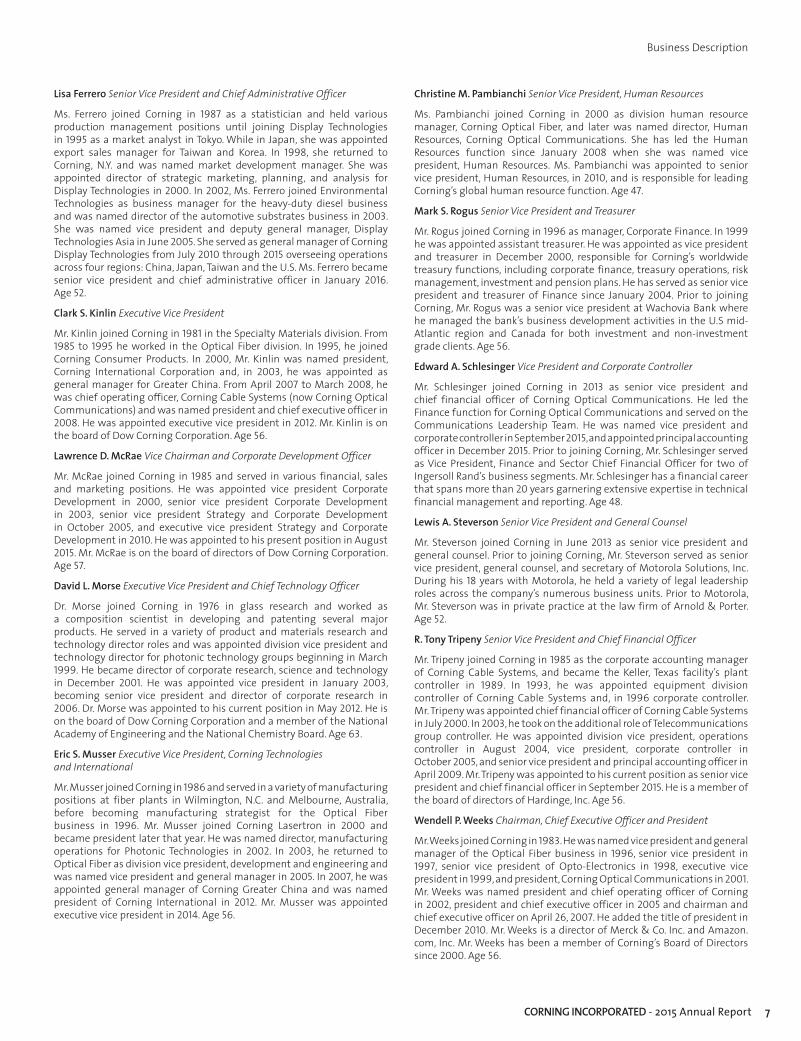
Interactive retail windows bridge the gaps between online shopping and brick-and-mortar stores, placing countless options right at your fingertips.
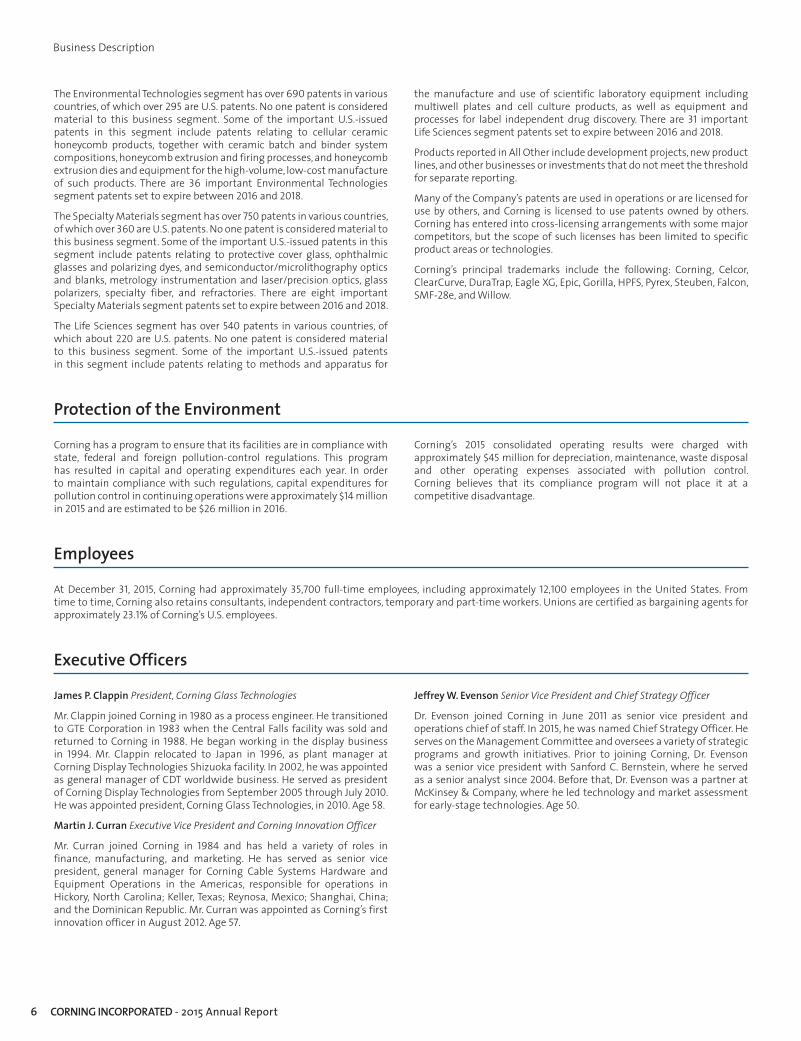
Interactive multi-user surfaces allow you to achieve greater
productivity, enhance your entertainment
experiences, and collaborate with friends
and colleagues at the speed of touch.
Collaboration Surface
Retail Window
A few short years ago, Corning shared its vision for a world powered by specialty glass and unlimited bandwidth. This vision captured the imagination of millions of people and inspired leading innovators to work together to help bring it to life. Today, that world is becoming a reality.
As Corning extends the technical and aesthetic capabilities of precision glass, technology developers are identifying new applications, designers are imagining new possibilities, and consumers are experiencing exciting new benefits.
The prototypes above are just a peek at where the world is heading. We believe we’ve entered a new era that can best be described as The Glass Age.
Learn more at GlassAgeToday.com
296423_Corning_Narr_R2.indd 5 3/2/16 1:15 AM

Financial Highlights: In millions, except per share amounts
As reported — GAAP Core performance*
2015 2014 2013 2015 2014 2013
Net Sales $ 9,111 $ 9,715 $ 7,819 $ 9,800 $ 9,955 $ 7,780
Net income attributable to Corning Incorporated $ 1,339 $ 2,472 $ 1,961 $ 1,882 $ 2,023 $ 1,656
Diluted earnings per common share attributable to Corning Incorporated $ 1.00 $ 1.73 $ 1.34 $ 1.40 $ 1.42 $ 1.13
* Core performance measures are non-GAAP financial measures. The reconciliation between these non-GAAP measures and their most directly comparable GAAP measure is provided on pages 29 through 32 of this Annual Report, as well as on the company’s website. Core performance measures are adjusted to exclude the impact of changes in Japanese yen and Korean won foreign exchange rates, as well as other items that do not reflect ongoing operations of the company.
296423_Corning_Narr_R2.indd 6 3/2/16 1:15 AM

Corning Incorporated 2015 Annual Report
Index
Business Description �������������������������������������������������������������������������������������������������������������������������������������������������������� 1Risk Factors ������������������������������������������������������������������������������������������������������������������������������������������������������������������������ 8Legal Proceedings ������������������������������������������������������������������������������������������������������������������������������������������������������������� 14Market for Registrant’s Common Equity, Related Stockholder Matters and Issuer Purchases of Equity Securities ���������������������������������������������������������������������������������������������������������������������������� 16Selected Financial Data (Unaudited) ���������������������������������������������������������������������������������������������������������������������������� 17Management’s Discussion and Analysis of Financial Condition and Results of Operations �������������������������������� 18Quantitative and Qualitative Disclosures About Market Risks �������������������������������������������������������������������������������� 51Management’s Annual Report on Internal Control Over Financial Reporting ������������������������������������������������������� 52Report of Independent Registered Public Accounting Firm �������������������������������������������������������������������������������������� 53Consolidated Statements of Income ����������������������������������������������������������������������������������������������������������������������������� 54Consolidated Statements of Comprehensive Income ������������������������������������������������������������������������������������������������ 55Consolidated Balance Sheets ����������������������������������������������������������������������������������������������������������������������������������������� 56Consolidated Statements of Cash Flows ���������������������������������������������������������������������������������������������������������������������� 57Consolidated Statements of Changes in Shareholders’ Equity ��������������������������������������������������������������������������������� 58Notes to Consolidated Financial Statements �������������������������������������������������������������������������������������������������������������� 591� Summary of Significant Accounting Policies ��������������������������������������������������������������������������������������������������������������������������������������������������� 592� Restructuring, Impairment and Other Charges ����������������������������������������������������������������������������������������������������������������������������������������������� 633� Available-for-Sale Investments �������������������������������������������������������������������������������������������������������������������������������������������������������������������������� 644� Significant Customers ������������������������������������������������������������������������������������������������������������������������������������������������������������������������������������������ 655� Inventories, Net of Inventory Reserves �������������������������������������������������������������������������������������������������������������������������������������������������������������� 656� Income Taxes ��������������������������������������������������������������������������������������������������������������������������������������������������������������������������������������������������������� 657� Investments ����������������������������������������������������������������������������������������������������������������������������������������������������������������������������������������������������������� 688� Acquisitions ����������������������������������������������������������������������������������������������������������������������������������������������������������������������������������������������������������� 729� Property, Plant and Equipment, Net of Accumulated Depreciation ������������������������������������������������������������������������������������������������������������� 7510� Goodwill and Other Intangible Assets �������������������������������������������������������������������������������������������������������������������������������������������������������������� 7611� Other Assets and Other Liabilities ��������������������������������������������������������������������������������������������������������������������������������������������������������������������� 7712� Debt ������������������������������������������������������������������������������������������������������������������������������������������������������������������������������������������������������������������������ 7813� Employee Retirement Plans �������������������������������������������������������������������������������������������������������������������������������������������������������������������������������� 7914� Commitments, Contingencies and Guarantees ����������������������������������������������������������������������������������������������������������������������������������������������� 8715� Hedging Activities ������������������������������������������������������������������������������������������������������������������������������������������������������������������������������������������������ 8816� Fair Value Measurements ������������������������������������������������������������������������������������������������������������������������������������������������������������������������������������ 9017� Shareholders’ Equity �������������������������������������������������������������������������������������������������������������������������������������������������������������������������������������������� 9118� Earnings Per Common Share ������������������������������������������������������������������������������������������������������������������������������������������������������������������������������� 9419� Share-based Compensation �������������������������������������������������������������������������������������������������������������������������������������������������������������������������������� 9520� Reportable Segments ������������������������������������������������������������������������������������������������������������������������������������������������������������������������������������������� 96Valuation Accounts and Reserves ���������������������������������������������������������������������������������������������������������������������������������� 101Quarterly Operating Results ������������������������������������������������������������������������������������������������������������������������������������������� 102

This page intentionally left blank.

1CORNING INCORPORATED - 2015 Annual Report
Corning Incorporated and its consolidated subsidiaries are hereinafter sometimes referred to as the “Company,” the “Registrant,” “Corning,” or “we.”
This report contains forward-looking statements that involve a number of risks and uncertainties. These statements relate to our future plans, objectives, expectations and estimates and may contain words such as “believes,” “expects,” “anticipates,” “estimates,” “forecasts,” or similar expressions. Our actual results could differ materially from what is expressed or forecasted in our forward-looking statements. Some of the factors that could contribute to these differences include those discussed under “Forward-Looking Statements,” “Risk Factors,” “Management’s Discussion and Analysis of Financial Condition and Results of Operations,” and elsewhere in this report.
Business Description
General
Corning traces its origins to a glass business established in 1851. The present corporation was incorporated in the State of New York in December 1936. The Company’s name was changed from Corning Glass Works to Corning Incorporated on April 28, 1989.
Corning Incorporated is one of the world’s leading innovators in materials science. For more than 160 years, Corning has applied its unparalleled expertise in specialty glass, ceramics, and optical physics to develop products that have created new industries and transformed people’s lives. We succeed through sustained investment in research and development, a unique combination of material and process innovation, and close collaboration with customers to solve tough technology challenges. Corning operates in five reportable segments: Display Technologies, Optical Communications, Environmental Technologies, Specialty Materials and Life Sciences, and manufactures and processes products at approximately 89 plants in 17 countries.
Display Technologies SegmentCorning’s Display Technologies segment manufactures glass substrates for liquid crystal displays (“LCDs”) that are used primarily in LCD televisions, notebook computers and flat panel desktop monitors. This segment develops, manufactures and supplies high quality glass substrates using technology expertise and a proprietary fusion manufacturing process, which Corning invented and is the cornerstone of the Company’s technology leadership in the LCD industry. The highly automated process yields glass substrates with a pristine surface and excellent thermal dimensional stability and uniformity – essential attributes for the production of large, high performance LCDs. Corning’s fusion process is scalable and we believe it is the most cost effective process in producing large size substrates.
We are recognized for providing product innovations that enable our customers to produce larger, lighter, thinner and higher-resolution displays more affordably. Some of the product innovations that we have launched over the past ten years utilizing our world-class processes and capabilities include the following:
• EAGLE XG®, the industry’s first LCD glass substrate that is free of heavy metals;
• EAGLE XG® Slim glass, a line of thin glass substrates which enables lighter-weight portable devices and thinner televisions and monitors;
• Corning® Willow™ Glass, our ultra-thin flexible glass for use in next-generation consumer electronic technologies, including curved displays for immersive viewing or mounting on non-flat surfaces. This glass is also used in a variety of non-display applications, such as decorative laminates for interior architecture and advanced semiconductor packaging; and
• The family of Corning Lotus™ Glass, high-performance display glass developed to enable cutting-edge technologies, including organic light-emitting diode (“OLED”) displays and next generation LCDs. These substrate glasses provide industry-leading levels of low total pitch variation, resulting in brighter, more energy-efficient displays with higher resolutions for consumers and better yields for panel makers.
Through the end of 2013, the Display Technologies segment also included the equity affiliate Samsung Corning Precision Materials Co., Ltd. (“Samsung Corning Precision Materials”), of which Corning owned 57.5% and Samsung Display Co., Ltd. (“Samsung Display”) owned 42.5%. As described more fully in Note 8 (Acquisitions) to the Consolidated Financial Statements, to extend Corning’s leadership in specialty glass and drive earnings growth, Corning entered into a series of strategic and financial agreements with Samsung Display intended to strengthen product and technology collaborations between the two companies. Corning completed the acquisition of Samsung Corning Precision Materials on January 15, 2014.
In the fourth quarter of 2015, Corning announced that with the support of the Hefei government it will locate a Gen 10.5 glass manufacturing facility adjacent to the BOE Technology Group Co. Ltd. (BOE) plant in the Hefei XinZhan General Pilot Zone in Anhui Province, China. Glass substrate production from the new facility is expected to support BOE’s plan to begin mass production of LCD panels for large-size televisions by the third quarter of 2018.
As part of this investment, Corning and BOE have entered into a long-term supply agreement that commits BOE to the purchase of Gen 10.5 glass substrates from the Corning manufacturing facility in Hefei. BOE also has extended its long-term supply agreement with Corning to purchase glass substrates for Gen 8.5 and smaller sizes. This investment will enable Corning to become the first manufacturer of TFT-grade Gen 10.5 substrates. At 2,940 mm x 3,370 mm, Gen 10.5 will be the largest LCD glass substrate available, providing the most economical cuts for 65-inch and 75-inch televisions. The Gen 10.5 substrates manufactured at the Hefei facility will use Corning® EAGLE XG® slim glass.

2 CORNING INCORPORATED - 2015 Annual Report
Business Description
Corning has LCD glass manufacturing operations in the United States, South Korea, Japan, Taiwan and China. Following the acquisition of Samsung Corning Precision Materials, Corning services all specialty glass customers in all regions directly, utilizing its manufacturing facilities throughout Asia.
Patent protection and proprietary trade secrets are important to the Display Technologies segment’s operations. Refer to the material under the heading “Patents and Trademarks” for information relating to patents and trademarks.
The Display Technologies segment represented 34% of Corning’s sales in 2015.
Optical Communications SegmentCorning invented the world’s first low-loss optical fiber in 1970. Since that milestone, we have continued to pioneer optical fiber, cable and connectivity solutions. As global bandwidth demand driven by video usage grows exponentially, telecommunications networks continue to migrate from copper to optical-based systems that can deliver the required cost-effective bandwidth-carrying capacity. Our unrivaled experience puts us in a unique position to design and deliver optical solutions that reach every edge of the communications network.
This segment is classified into two main product groupings – carrier network and enterprise network. The carrier network product group consists primarily of products and solutions for optical-based communications infrastructure for services such as video, data and voice communications. The enterprise network product group consists primarily of optical-based communication networks sold to businesses, governments and individuals for their own use.
Our carrier network product portfolio begins with optical fiber products, including Vascade® submarine optical fibers for use in submarine networks; LEAF® optical fiber for long-haul, regional and metropolitan networks; SMF-28® ULL fiber for more scalable long-haul and regional networks; SMF-28e+™ single-mode optical fiber that provides additional transmission wavelengths in metropolitan and access networks; ClearCurve® ultra-bendable single-mode fiber for use in multiple-dwelling units and fiber-to-the-home applications; and Corning® SMF-28® Ultra Fiber, designed for high performance across the range of long-haul, metro, access, and fiber-to-the-home network applications, combining the benefits of industry-leading attenuation and improved macrobend performance in one fiber. A portion of our optical fiber is sold directly to end users and third-party cablers around the world. Corning’s remaining fiber production is cabled internally and sold to end users as either bulk cable or as part of an integrated optical solution. Corning’s cable products support various outdoor, indoor/outdoor and indoor applications and include a broad range of loose tube, ribbon and drop cable designs with flame-retardant versions available for indoor and indoor/outdoor use.
In addition to optical fiber and cable, our carrier network product portfolio also includes hardware and equipment products, including cable assemblies, fiber optic hardware, fiber optic connectors, optical components and couplers, closures, network interface devices, and other accessories. These products may be sold as individual components or as part of integrated optical connectivity solutions designed for various carrier network applications. Examples of these solutions include our FlexNAPTM terminal distribution system, which provides pre-connectorized distribution and drop cable assemblies for cost-effectively deploying Fiber-to-the-Home (“FTTH”) networks; and the CentrixTM platform, which provides a high-density fiber management system with industry-leading density and innovative jumper routing that can be deployed in a wide variety of carrier switching centers.
To keep pace with surging demand for mobile bandwidth, Corning has a full complement of operator-grade distributed antenna systems (“DAS”), including the recently developed Optical Network Evolution (“ONE”) wireless platform. ONE is the first all-optical converged cellular and Wi-Fi® solution built on an all-optical backbone with modular service support. The ONE™ Wireless Platform provides virtually unlimited bandwidth, and meets all of the wireless service needs of large-scale enterprises at a lower cost than the typical DAS solution.
In addition to our optical-based portfolio, Corning’s carrier network portfolio also contains select copper-based products including subscriber demarcation, connection and protection devices, xDSL (different variations of digital subscriber lines) passive solutions and outside plant enclosures. In addition, Corning offers coaxial RF interconnects for the cable television industry as well as for microwave applications for GPS, radars, satellites, manned and unmanned military vehicles, and wireless and telecommunications systems.
Our enterprise network product portfolio also includes optical fiber products, including ClearCurve® ultra-bendable multimode fiber for data centers and other enterprise network applications; InfiniCor® fibers for local area networks; and more recently ClearCurve® VSDN® ultra-bendable optical fiber designed to support emerging high-speed interconnects between computers and other consumer electronics devices. The remainder of Corning’s fiber production is cabled internally and sold to end users as either bulk cable or as part of an integrated optical solution. Corning’s cable products include a broad range of tight-buffered, loose tube and ribbon cable designs with flame-retardant versions available for indoor and indoor/outdoor applications that meet local building code requirements.
Corning’s hardware and equipment products for enterprise network applications include cable assemblies, fiber optic hardware, fiber optic connectors, optical components and couplers, closures and other accessories. These products may be sold as individual components or as part of integrated optical connectivity solutions designed for various network applications. Examples of enterprise network solutions include the Pretium EDGE® platform, which provides high-density pre-connectorized solutions for data center applications, and continues to evolve with recent updates for upgrading to 40/100G applications and port tap modules for network monitoring; the previously mentioned ONE Wireless platform, which spans both carrier and enterprise network applications; and our recently introduced optical connectivity solutions to support customer initiatives.
Corning operates manufacturing facilities worldwide. Our optical fiber manufacturing facilities are located in North Carolina, China and India. Cabling operations include facilities in North Carolina, Germany, Poland, China and smaller regional locations and equity affiliates. Our manufacturing operations for hardware and equipment products are located in Texas, Arizona, Mexico, Brazil, Denmark, Germany, Poland, Israel, Australia and China.
Patent protection is important to the segment’s operations. The segment has an extensive portfolio of patents relating to its products, technologies and manufacturing processes. The segment licenses certain of its patents to third parties and generates revenue from these licenses, although the royalty income is not currently material to this segment’s operating results. Corning is licensed to use certain patents owned by others, which are considered important to the segment’s operations. Refer to the material under the heading “Patents and Trademarks” for information relating to the Company’s patents and trademarks.
The Optical Communications segment represented 33% of Corning’s sales for 2015.

3CORNING INCORPORATED - 2015 Annual Report
Business Description
Environmental Technologies SegmentCorning’s Environmental Technologies segment manufactures ceramic substrates and filter products for emissions control in mobile and stationary applications around the world. In the early 1970s, Corning developed an economical, high-performance cellular ceramic substrate that is now the standard for catalytic converters in vehicles worldwide. As global emissions control regulations tighten, Corning has continued to develop more effective and durable ceramic substrate and filter products for gasoline and diesel applications. Corning manufactures substrate and filter products in New York, Virginia, China, Germany and South Africa. Corning sells its ceramic substrate and filter products worldwide to catalyzers and manufacturers of emission control systems who then sell to automotive and diesel vehicle or engine manufacturers. Although most sales are made to the emission control systems manufacturers, the use of Corning substrates and filters is generally required by the specifications of the automotive and diesel vehicle or engine manufacturers.
Patent protection is important to the segment’s operations. The segment has an extensive portfolio of patents relating to its products, technologies and manufacturing processes. Corning is licensed to use certain patents owned by others, which are also considered important to the segment’s operations. Refer to the material under the heading “Patents and Trademarks” for information relating to the Company’s patents and trademarks.
The Environmental Technologies segment represented 12% of Corning’s sales for 2015.
Specialty Materials SegmentThe Specialty Materials segment manufactures products that provide more than 150 material formulations for glass, glass ceramics and fluoride crystals to meet demand for unique customer needs. Consequently, this segment operates in a wide variety of commercial and industrial markets that include display optics and components, semiconductor optics components, aerospace and defense, astronomy, ophthalmic products, telecommunications components and cover glass that is optimized for portable display devices.
Our cover glass, known as Corning® Gorilla® Glass, is a thin sheet glass designed specifically to function as a cover glass for display devices such as tablets, notebook PCs and mobile phones. Elegant and lightweight, Corning Gorilla Glass is durable enough to resist many real-world events that commonly cause glass failure, enabling exciting new applications in technology and design. Early in 2012, Corning launched Corning® Gorilla® Glass 2, the next generation in our Corning Gorilla Glass suite of products. Corning Gorilla Glass 2 enables up to a 20% reduction in glass thickness over previous generations of competitive glass, while maintaining the industry-leading damage resistance, toughness and scratch-resistance. In 2013, we introduced Corning® Gorilla® Glass 3 with Native Damage Resistance and Corning® Gorilla® Glass NBT™, designed to help protect touch notebook displays and handheld devices from scratches and other forms of damage that come from everyday handling and use. And in the fourth quarter of 2014, Corning announced its latest breakthrough innovation in consumer electronics material design, Corning® Gorilla® Glass 4, which delivers the highest damage resistance performance versus all alternative compositions, and has the capability to significantly improve device drop performance.
Corning Gorilla Glass is manufactured in Kentucky, South Korea, Japan and Taiwan.
Semiconductor optics manufactured by Corning includes high-performance optical material products, optical-based metrology instruments, and optical assemblies for applications in the global semiconductor industry. Corning’s semiconductor optics products are manufactured in New York.
Other specialty glass products include glass lens and window components and assemblies and are made in New York, New Hampshire, Kentucky and France or sourced from China.
Patent protection is important to the segment’s operations. The segment has a growing portfolio of patents relating to its products, technologies and manufacturing processes. Brand recognition and loyalty, through well-known trademarks, are important to the segment. Refer to the material under the heading “Patents and Trademarks” for information relating to the Company’s patents and trademarks.
The Specialty Materials segment represented approximately 12% of Corning’s sales for 2015.
Life Sciences SegmentAs a leading developer, manufacturer and global supplier of scientific laboratory products for 100 years, Corning’s Life Sciences segment collaborates with researchers and drug manufacturers seeking new approaches to increase efficiencies, reduce costs and compress timelines. Using unique expertise in the fields of materials science, surface science, optics, biochemistry and biology, the segment provides innovative solutions that improve productivity and enable breakthrough discoveries.
Life Sciences laboratory products include consumables (plastic vessels, specialty surfaces and media), as well as general labware and equipment, that are used for cell culture research, bioprocessing, genomics, drug discovery, microbiology and chemistry. Corning sells life science products under these primary brands: Corning, Falcon, PYREX, Axygen, and Gosselin. The products are marketed worldwide, primarily through distributors to pharmaceutical and biotechnology companies, academic institutions, hospitals, government entities, and other facilities. Corning manufactures these products in the United States in Maine, New York, New Jersey, California, Utah, Virginia, Massachusetts and North Carolina, and outside of the U.S. in Mexico, France, Poland, and China.
In addition to being a global leader in laboratory consumables for life science research, Corning continues to develop and produce innovative technologies aimed at the growing biologic drug production markets.
Patent protection is important to the segment’s operations. The segment has a growing portfolio of patents relating to its products, technologies and manufacturing processes. Brand recognition and loyalty, through well-known trademarks, are important to the segment. Refer to the material under the heading “Patents and Trademarks” for more information.
The Life Sciences segment represented approximately 9% of Corning’s sales for 2015.

4 CORNING INCORPORATED - 2015 Annual Report
Business Description
All OtherAll other segments that do not meet the quantitative threshold for separate reporting have been grouped as “All Other.” This group is primarily comprised of the results of Corning’s Pharmaceutical Technologies business, which consists of a pharmaceutical glass vessel business and a glass tubing business used in the pharmaceutical packaging industry. This segment also includes Corning Precision Materials’ non-LCD business and new product lines and development projects such as precision laser cutting/shaping technologies, advanced flow reactors and adjacency businesses in pursuit of thin, strong glass, as well as certain corporate investments such as Eurokera and Keraglass equity affiliates.
The All Other segment represented less than 1% of Corning’s sales for 2015.
Additional explanation regarding Corning and its five reportable segments, as well as financial information about geographic areas, is presented in Management’s Discussion and Analysis of Financial Condition and Results of Operations and Note 20 (Reportable Segments) to the Consolidated Financial Statements.
Corporate Investments
Corning and The Dow Chemical Company (“Dow Chemical”) each own half of Dow Corning Corporation (“Dow Corning”), an equity company headquartered in Michigan that manufactures silicone products worldwide. Dow Corning is a leader in silicon-based technology and innovation, offering more than 7,000 products and services. Dow Corning is the majority-owner of Hemlock Semiconductor Group (“Hemlock”), a market leader in the production of high purity polycrystalline silicon for the semiconductor and solar energy industries. Dow Corning’s sales were $5,649 million in 2015.
On December 11, 2015, Corning announced its intention to exchange its 50% equity interest in Dow Corning Corporation for 100% of the stock of a newly formed entity that will become a wholly-owned subsidiary of Corning Incorporated. The newly formed entity will hold approximately 40% ownership in Hemlock Semiconductor Group and approximately $4.8 billion in cash. Upon completion of this strategic realignment, which is expected to close during the first half of 2016, Dow Chemical, an equal owner of Dow Corning with Corning since 1943, will assume 100% ownership of Dow Corning.
Additional discussion about Dow Corning appears in Part II – Item 3. Legal Proceedings section and in Note 7 (Investments) to the Consolidated Financial Statements. Dow Corning’s financial statements are attached in Item 15, Exhibits and Financial Statement Schedules.
Corning and PPG Industries, Inc. each own half of Pittsburgh Corning Corporation (“PCC”), an equity company in Pennsylvania that manufactures glass products for architectural and industrial uses. PCC filed for Chapter 11 bankruptcy reorganization in April 2000. Corning also owns half of Pittsburgh Corning Europe N.V. (“PCE”), a Belgian corporation that manufactures glass products for industrial uses primarily in Europe. Additional discussion about PCC and PCE appears in the Legal Proceedings section.
Additional information about corporate investments is presented in the Legal Proceedings section and in Note 7 (Investments) to the Consolidated Financial Statements.
Competition
Corning competes across all of its product lines with many large and varied manufacturers, both domestic and foreign. Some of these competitors are larger than Corning, and some have broader product lines. Corning strives to maintain and improve its market position through technology and product innovation. For the future, Corning believes its competitive advantage lies in its commitment to research and development, and its commitment to quality. There is no assurance that Corning will be able to maintain or improve its market position or competitive advantage.
Display Technologies SegmentWe believe Corning is the largest worldwide producer of glass substrates for LCD displays. The environment for LCD glass substrate products is very competitive and Corning believes it has sustained its competitive advantages by investing in new products, providing a consistent and reliable supply, and continually improving its proprietary fusion manufacturing process. This process allows us to deliver glass that is larger, thinner and lighter, with exceptional surface quality and without heavy metals. Asahi Glass Co. Ltd. and Nippon Electric Glass Co. Ltd. are Corning’s principal competitors in display glass substrates.
Optical Communications SegmentCompetition within the communications equipment industry is intense among several significant companies. Corning is a leading competitor in the segment’s principal product groups, which include carrier and enterprise networks. The competitive landscape includes industry consolidation, price pressure and competition for the innovation
of new products. These competitive conditions are likely to persist. Corning believes its large scale manufacturing experience, fiber process, technology leadership and intellectual property yield cost advantages relative to several of its competitors.
The primary competing producers of the Optical Communications segment are Commscope and Prysmian Group.
Environmental Technologies SegmentCorning has a major market position in worldwide automotive ceramic substrate products, as well as a strong presence in the heavy duty and light duty diesel vehicle market. The Company believes its competitive advantage in automotive ceramic substrate products for catalytic converters and diesel filter products for exhaust systems is based upon global presence, customer service, engineering design services and product innovation. Corning’s Environmental Technologies products face principal competition from NGK Insulators, Ltd. and Ibiden Co. Ltd.
5CORNING INCORPORATED - 2015 Annual Report
Business Description
Specialty Materials SegmentCorning is one of very few manufacturers with deep capabilities in materials science, optical design, shaping, coating, finishing, metrology, and system assembly. Additionally, we are addressing emerging needs of the consumer electronics industry with the development of chemically strengthened glass. Corning Gorilla Glass is a thin-sheet glass that is better able to survive events that most commonly cause glass failure. Its advanced composition allows a deeper layer of chemical strengthening than is possible with most other chemically strengthened glasses, making it both durable and damage resistant. Our products and capabilities in this segment position the Company to meet the needs of a broad array of markets including display, semiconductor, aerospace/defense, astronomy, vision care, industrial/commercial, and telecommunications. For this segment, Schott, Asahi Glass Co. Ltd., Nippon Electric Glass Co. Ltd. and Heraeus are the main competitors.
Life Sciences SegmentCorning seeks to maintain a competitive advantage by emphasizing product quality, global distribution, supply chain efficiency, a broad product line and superior product attributes. Our principle worldwide competitors include Thermo Fisher Scientific, Inc. and Perkin Elmer. Corning also faces increasing competition from large distributors that have pursued backward integration or introduced private label products.
Raw Materials
Corning’s production of specialty glasses, ceramics, and related materials requires significant quantities of energy, uninterrupted power sources, certain precious metals, and various batch materials.
Although energy shortages have not been a problem recently, the cost of energy remains volatile. Corning has achieved flexibility through engineering changes to take advantage of low-cost energy sources in most significant processes. Specifically, many of Corning’s principal manufacturing processes can be operated with natural gas, propane, oil or electricity, or a combination of these energy sources. Additionally, in the fourth quarter of 2015, we entered into a 25-year power purchase agreement for solar-generated electricity in which we will purchase 62.5% of the expected output of a solar power facility in North Carolina. This is a major step in Corning’s commitment to reduce its carbon footprint and continues our long history of being an environmentally conscious company.
Availability of resources (ores, minerals, polymers, helium and processed chemicals) required in manufacturing operations, appears to be adequate. Corning’s suppliers, from time to time, may experience capacity limitations in their own operations, or may eliminate certain product lines. Corning believes it has adequate programs to ensure a reliable supply of batch materials and precious metals. For many products, Corning has alternate glass compositions that would allow operations to continue without interruption in the event of specific materials shortages.
Certain key materials and proprietary equipment used in the manufacturing of products are currently sole-sourced or available only from a limited number of suppliers. Any future difficulty in obtaining sufficient and timely delivery of components could result in lost sales due to delays or reductions in product shipments, or reductions in Corning’s gross margins.
Patents and Trademarks
Inventions by members of Corning’s research and engineering staff continue to be important to the Company’s growth. Patents have been granted on many of these inventions in the United States and other countries. Some of these patents have been licensed to other manufacturers, including companies in which Corning has equity investments. Many of our earlier patents have now expired, but Corning continues to seek and obtain patents protecting its innovations. In 2015, Corning was granted about 420 patents in the U.S. and over 740 patents in countries outside the U.S.
Each business segment possesses a patent portfolio that provides certain competitive advantages in protecting Corning’s innovations. Corning has historically enforced, and will continue to enforce, its intellectual property rights. At the end of 2015, Corning and its wholly-owned subsidiaries owned over 7,750 unexpired patents in various countries of which over 3,250 were U.S. patents. Between 2016 and 2017, approximately 6% of these patents will expire, while at the same time Corning intends to seek patents protecting its newer innovations. Worldwide, Corning has about 9,170 patent applications in process, with about 2,350 in process in the U.S. Corning believes that its patent portfolio will continue to provide a competitive advantage in protecting the Company’s innovation, although Corning’s competitors in each of its businesses are actively seeking patent protection as well.
The Display Technologies segment has over 1,430 patents in various countries, of which about 340 are U.S. patents. No one patent is considered material to this business segment. Some of the important U.S.-issued patents in this segment include patents relating to glass compositions and methods for the use and manufacture of glass substrates for display applications. There are six important Display Technologies segment patents set to expire between 2016 and 2018.
The Optical Communications segment has over 2,730 patents in various countries, of which over 1,270 are U.S. patents. No one patent is considered material to this business segment. Some of the important U.S.-issued patents in this segment include: (i) patents relating to optical fiber products including low loss optical fiber, high data rate optical fiber, and dispersion compensating fiber, and processes and equipment for manufacturing optical fiber, including methods for making optical fiber preforms and methods for drawing, cooling and winding optical fiber; (ii) patents relating to optical fiber ribbons and methods for making such ribbon, fiber optic cable designs and methods for installing optical fiber cable; (iii) patents relating to optical fiber connectors, termination and storage and associated methods of manufacture; and (iv) patents related to distributed communication systems. There are 10 important Optical Communications segment patents set to expire between 2016 and 2018.
6 CORNING INCORPORATED - 2015 Annual Report
Business Description
The Environmental Technologies segment has over 690 patents in various countries, of which over 295 are U.S. patents. No one patent is considered material to this business segment. Some of the important U.S.-issued patents in this segment include patents relating to cellular ceramic honeycomb products, together with ceramic batch and binder system compositions, honeycomb extrusion and firing processes, and honeycomb extrusion dies and equipment for the high-volume, low-cost manufacture of such products. There are 36 important Environmental Technologies segment patents set to expire between 2016 and 2018.
The Specialty Materials segment has over 750 patents in various countries, of which over 360 are U.S. patents. No one patent is considered material to this business segment. Some of the important U.S.-issued patents in this segment include patents relating to protective cover glass, ophthalmic glasses and polarizing dyes, and semiconductor/microlithography optics and blanks, metrology instrumentation and laser/precision optics, glass polarizers, specialty fiber, and refractories. There are eight important Specialty Materials segment patents set to expire between 2016 and 2018.
The Life Sciences segment has over 540 patents in various countries, of which about 220 are U.S. patents. No one patent is considered material to this business segment. Some of the important U.S.-issued patents in this segment include patents relating to methods and apparatus for
the manufacture and use of scientific laboratory equipment including multiwell plates and cell culture products, as well as equipment and processes for label independent drug discovery. There are 31 important Life Sciences segment patents set to expire between 2016 and 2018.
Products reported in All Other include development projects, new product lines, and other businesses or investments that do not meet the threshold for separate reporting.
Many of the Company’s patents are used in operations or are licensed for use by others, and Corning is licensed to use patents owned by others. Corning has entered into cross-licensing arrangements with some major competitors, but the scope of such licenses has been limited to specific product areas or technologies.
Corning’s principal trademarks include the following: Corning, Celcor, ClearCurve, DuraTrap, Eagle XG, Epic, Gorilla, HPFS, Pyrex, Steuben, Falcon, SMF-28e, and Willow.
Protection of the Environment
Corning has a program to ensure that its facilities are in compliance with state, federal and foreign pollution-control regulations. This program has resulted in capital and operating expenditures each year. In order to maintain compliance with such regulations, capital expenditures for pollution control in continuing operations were approximately $14 million in 2015 and are estimated to be $26 million in 2016.
Corning’s 2015 consolidated operating results were charged with approximately $45 million for depreciation, maintenance, waste disposal and other operating expenses associated with pollution control. Corning believes that its compliance program will not place it at a competitive disadvantage.
Employees
At December 31, 2015, Corning had approximately 35,700 full-time employees, including approximately 12,100 employees in the United States. From time to time, Corning also retains consultants, independent contractors, temporary and part-time workers. Unions are certified as bargaining agents for approximately 23.1% of Corning’s U.S. employees.
Executive Officers
James P� Clappin President, Corning Glass Technologies
Mr. Clappin joined Corning in 1980 as a process engineer. He transitioned to GTE Corporation in 1983 when the Central Falls facility was sold and returned to Corning in 1988. He began working in the display business in 1994. Mr. Clappin relocated to Japan in 1996, as plant manager at Corning Display Technologies Shizuoka facility. In 2002, he was appointed as general manager of CDT worldwide business. He served as president of Corning Display Technologies from September 2005 through July 2010. He was appointed president, Corning Glass Technologies, in 2010. Age 58.
Martin J� Curran Executive Vice President and Corning Innovation Officer
Mr. Curran joined Corning in 1984 and has held a variety of roles in finance, manufacturing, and marketing. He has served as senior vice president, general manager for Corning Cable Systems Hardware and Equipment Operations in the Americas, responsible for operations in Hickory, North Carolina; Keller, Texas; Reynosa, Mexico; Shanghai, China; and the Dominican Republic. Mr. Curran was appointed as Corning’s first innovation officer in August 2012. Age 57.
Jeffrey W� Evenson Senior Vice President and Chief Strategy Officer
Dr. Evenson joined Corning in June 2011 as senior vice president and operations chief of staff. In 2015, he was named Chief Strategy Officer. He serves on the Management Committee and oversees a variety of strategic programs and growth initiatives. Prior to joining Corning, Dr. Evenson was a senior vice president with Sanford C. Bernstein, where he served as a senior analyst since 2004. Before that, Dr. Evenson was a partner at McKinsey & Company, where he led technology and market assessment for early-stage technologies. Age 50.
7CORNING INCORPORATED - 2015 Annual Report
Business Description
Lisa Ferrero Senior Vice President and Chief Administrative Officer
Ms. Ferrero joined Corning in 1987 as a statistician and held various production management positions until joining Display Technologies in 1995 as a market analyst in Tokyo. While in Japan, she was appointed export sales manager for Taiwan and Korea. In 1998, she returned to Corning, N.Y. and was named market development manager. She was appointed director of strategic marketing, planning, and analysis for Display Technologies in 2000. In 2002, Ms. Ferrero joined Environmental Technologies as business manager for the heavy-duty diesel business and was named director of the automotive substrates business in 2003. She was named vice president and deputy general manager, Display Technologies Asia in June 2005. She served as general manager of Corning Display Technologies from July 2010 through 2015 overseeing operations across four regions: China, Japan, Taiwan and the U.S. Ms. Ferrero became senior vice president and chief administrative officer in January 2016. Age 52.
Clark S� Kinlin Executive Vice President
Mr. Kinlin joined Corning in 1981 in the Specialty Materials division. From 1985 to 1995 he worked in the Optical Fiber division. In 1995, he joined Corning Consumer Products. In 2000, Mr. Kinlin was named president, Corning International Corporation and, in 2003, he was appointed as general manager for Greater China. From April 2007 to March 2008, he was chief operating officer, Corning Cable Systems (now Corning Optical Communications) and was named president and chief executive officer in 2008. He was appointed executive vice president in 2012. Mr. Kinlin is on the board of Dow Corning Corporation. Age 56.
Lawrence D� McRae Vice Chairman and Corporate Development Officer
Mr. McRae joined Corning in 1985 and served in various financial, sales and marketing positions. He was appointed vice president Corporate Development in 2000, senior vice president Corporate Development in 2003, senior vice president Strategy and Corporate Development in October 2005, and executive vice president Strategy and Corporate Development in 2010. He was appointed to his present position in August 2015. Mr. McRae is on the board of directors of Dow Corning Corporation. Age 57.
David L� Morse Executive Vice President and Chief Technology Officer
Dr. Morse joined Corning in 1976 in glass research and worked as a composition scientist in developing and patenting several major products. He served in a variety of product and materials research and technology director roles and was appointed division vice president and technology director for photonic technology groups beginning in March 1999. He became director of corporate research, science and technology in December 2001. He was appointed vice president in January 2003, becoming senior vice president and director of corporate research in 2006. Dr. Morse was appointed to his current position in May 2012. He is on the board of Dow Corning Corporation and a member of the National Academy of Engineering and the National Chemistry Board. Age 63.
Eric S� Musser Executive Vice President, Corning Technologies and International
Mr. Musser joined Corning in 1986 and served in a variety of manufacturing positions at fiber plants in Wilmington, N.C. and Melbourne, Australia, before becoming manufacturing strategist for the Optical Fiber business in 1996. Mr. Musser joined Corning Lasertron in 2000 and became president later that year. He was named director, manufacturing operations for Photonic Technologies in 2002. In 2003, he returned to Optical Fiber as division vice president, development and engineering and was named vice president and general manager in 2005. In 2007, he was appointed general manager of Corning Greater China and was named president of Corning International in 2012. Mr. Musser was appointed executive vice president in 2014. Age 56.
Christine M� Pambianchi Senior Vice President, Human Resources
Ms. Pambianchi joined Corning in 2000 as division human resource manager, Corning Optical Fiber, and later was named director, Human Resources, Corning Optical Communications. She has led the Human Resources function since January 2008 when she was named vice president, Human Resources. Ms. Pambianchi was appointed to senior vice president, Human Resources, in 2010, and is responsible for leading Corning’s global human resource function. Age 47.
Mark S� Rogus Senior Vice President and Treasurer
Mr. Rogus joined Corning in 1996 as manager, Corporate Finance. In 1999 he was appointed assistant treasurer. He was appointed as vice president and treasurer in December 2000, responsible for Corning’s worldwide treasury functions, including corporate finance, treasury operations, risk management, investment and pension plans. He has served as senior vice president and treasurer of Finance since January 2004. Prior to joining Corning, Mr. Rogus was a senior vice president at Wachovia Bank where he managed the bank’s business development activities in the U.S mid-Atlantic region and Canada for both investment and non-investment grade clients. Age 56.
Edward A� Schlesinger Vice President and Corporate Controller
Mr. Schlesinger joined Corning in 2013 as senior vice president and chief financial officer of Corning Optical Communications. He led the Finance function for Corning Optical Communications and served on the Communications Leadership Team. He was named vice president and corporate controller in September 2015, and appointed principal accounting officer in December 2015. Prior to joining Corning, Mr. Schlesinger served as Vice President, Finance and Sector Chief Financial Officer for two of Ingersoll Rand’s business segments. Mr. Schlesinger has a financial career that spans more than 20 years garnering extensive expertise in technical financial management and reporting. Age 48.
Lewis A� Steverson Senior Vice President and General Counsel
Mr. Steverson joined Corning in June 2013 as senior vice president and general counsel. Prior to joining Corning, Mr. Steverson served as senior vice president, general counsel, and secretary of Motorola Solutions, Inc. During his 18 years with Motorola, he held a variety of legal leadership roles across the company’s numerous business units. Prior to Motorola, Mr. Steverson was in private practice at the law firm of Arnold & Porter. Age 52.
R� Tony Tripeny Senior Vice President and Chief Financial Officer
Mr. Tripeny joined Corning in 1985 as the corporate accounting manager of Corning Cable Systems, and became the Keller, Texas facility’s plant controller in 1989. In 1993, he was appointed equipment division controller of Corning Cable Systems and, in 1996 corporate controller. Mr. Tripeny was appointed chief financial officer of Corning Cable Systems in July 2000. In 2003, he took on the additional role of Telecommunications group controller. He was appointed division vice president, operations controller in August 2004, vice president, corporate controller in October 2005, and senior vice president and principal accounting officer in April 2009. Mr. Tripeny was appointed to his current position as senior vice president and chief financial officer in September 2015. He is a member of the board of directors of Hardinge, Inc. Age 56.
Wendell P� Weeks Chairman, Chief Executive Officer and President
Mr. Weeks joined Corning in 1983. He was named vice president and general manager of the Optical Fiber business in 1996, senior vice president in 1997, senior vice president of Opto-Electronics in 1998, executive vice president in 1999, and president, Corning Optical Communications in 2001. Mr. Weeks was named president and chief operating officer of Corning in 2002, president and chief executive officer in 2005 and chairman and chief executive officer on April 26, 2007. He added the title of president in December 2010. Mr. Weeks is a director of Merck & Co. Inc. and Amazon.com, Inc. Mr. Weeks has been a member of Corning’s Board of Directors since 2000. Age 56.

8 CORNING INCORPORATED - 2015 Annual Report
Risk Factors
Document Availability
A copy of Corning’s 2015 Annual Report on Form 10-K filed with the Securities and Exchange Commission is available upon written request to Corporate Secretary, Corning Incorporated, One Riverfront Plaza, Corning, NY 14831. The Annual Report on Form 10-K, quarterly reports on Form 10-Q, current reports on Form 8-K, and amendments pursuant to Section 13(a) or 15(d) of the Exchange Act of 1934 and other filings are available as soon
as reasonably practicable after such material is electronically filed or furnished to the SEC, and can be accessed electronically free of charge, through the Investor Relations page on Corning’s website at www.corning.com. The information contained on the Company’s website is not included in, or incorporated by reference into, this Annual Report on Form 10-K.
Risk FactorsWe operate in rapidly changing economic and technological environments that present numerous risks, many of which are driven by factors that we cannot control or predict. Our operations and financial results are subject to various risks and uncertainties, including those described below, that could adversely affect our business, financial condition, results of operations, cash flows, and the trading price of our common stock or debt. The following discussion of “risk factors” identifies the most significant factors that may adversely affect our business, operations, financial position or future financial performance. This information should be read in conjunction with MD&A and the consolidated financial statements and related notes incorporated by reference into this report. The following discussion of risks is not all inclusive but is designed to highlight what we believe are important factors to consider, as these factors could cause our future results to differ from those in the forward-looking statements and from historical trends.
As a global company, we face many risks which could adversely impact our ongoing operations and reported financial results
We are a global company and derive a substantial portion of our revenues from, and have significant operations, outside of the United States. Our international operations include manufacturing, assembly, sales, research and development, customer support, and shared administrative service centers.
Compliance with laws and regulations increases our costs. These laws and regulations include U.S. laws and local laws which include data privacy requirements, employment and labor laws, tax laws, anti-competition regulations, prohibitions on payments to governmental officials, import and trade restrictions and export requirements. Non-compliance or violations could result in fines, criminal sanctions against us, our officers or our employees, and prohibitions on the conduct of our business. Such violations could result in prohibitions on our ability to offer our products and services in one or more countries and could also materially damage our reputation, our brand, our international expansion efforts, our ability to attract and retain employees, our business and our operating results. Our success depends, in part, on our ability to anticipate and manage these risks.
We are also subject to a variety of other risks in managing a global organization, including those related to:
• General economic conditions in each country or region;
• Many complex regulatory requirements affecting international trade and investment, including anti-dumping laws, export controls, the Foreign Corrupt Practices Act and local laws prohibiting improper payments. Our operations may be adversely affected by changes in the substance or enforcement of these regulatory requirements, and by actual or alleged violations of them;
• Fluctuations in currency exchange rates, convertibility of currencies and restrictions involving the movement of funds between jurisdictions and countries;
• Sovereign and political risks that may adversely affect Corning’s profitability and assets;
• Geographical concentration of our factories and operations and regional shifts in our customer base;
• Periodic health epidemic concerns;
• Political unrest, confiscation or expropriation of our assets by foreign governments, terrorism and the potential for other hostilities;
• Difficulty in protecting intellectual property, sensitive commercial and operations data, and information technology systems generally;
• Differing legal systems, including protection and treatment of intellectual property and patents;
• Complex or unclear tax regimes;
• Complex tariffs, trade duties and other trade barriers including anti-dumping duties;
• Difficulty in collecting obligations owed to us such as accounts receivable;
• Natural disasters such as floods, earthquakes, tsunamis and windstorms; and
• Potential power loss or disruption affecting manufacturing.
Our sales could be negatively impacted by the actions of one or more key customers, or the circumstances to which they are subject, leading to the substantial reduction in orders for our products
In 2015, Corning’s ten largest customers accounted for 45% of our sales.
A relatively small number of customers accounted for a high percentage of net sales in our reportable segments. For 2015, three customers of the Display Technologies segment accounted for 62% of total segment net sales when combined. In the Optical Communications segment in 2015, two customers accounted for 22% of total segment net sales when combined. In the Environmental Technologies segment in 2015, three customers accounted for 86% of total segment sales in aggregate. In the Specialty Materials segment, three customers accounted for 56% of total segment sales in 2015 when combined. In the Life Sciences segment, two customers accounted for 46% of total segment sales in 2015 in aggregate. As a result of mergers and consolidations between customers, Corning’s customer base could become more concentrated.

9CORNING INCORPORATED - 2015 Annual Report
Risk Factors
Our Optical Communications segment customers’ purchases of our products are affected by their capital expansion plans, general market and economic uncertainty and regulatory changes, including broadband policy. Sales in the Optical Communications segment are expected to be impacted by the pace of fiber-to-the-premises deployments and data center expansions. Our sales will be dependent on planned targets for homes passed and connected and construction of new and/or expansion of existing data centers. Changes in our customers’ deployment plans could adversely affect future sales.
In the Environmental Technologies segment, sales of our ceramic substrate and filter products for automotive and diesel emissions tend to fluctuate with vehicle production. Changes in laws and regulations for air quality and emission controls may also influence future sales. Sales in our Environmental Technologies segment are mainly to three catalyzers and emission system control manufacturers. Our customers sell these systems to automobile and diesel engine original equipment manufacturers. Sales in this segment may be affected by adverse developments in the global vehicle or freight hauling industries or by such factors as higher fuel prices that may affect vehicle sales or downturns in freight traffic.
Certain sales in our Specialty Materials segment track worldwide economic cycles and our customers’ responses to those cycles. In addition, any positive trends in prior years in the sales of strengthened glass may not continue. We may experience losses relating to our inability to supply contracted quantities of this glass and processes planned to produce new versions of this glass may not be successful.
Sales in our Life Sciences segment are concentrated with two large distributors who are also competitors, and the balance is to a variety of pharmaceutical and biotechnology companies, hospitals, universities, and other research facilities. Changes in our distribution arrangements in this segment may adversely affect this segment’s financial results.
Our operations and financial performance could be negatively impacted, if the markets for our products do not develop and expand as we anticipate
The markets for our products are characterized by rapidly changing technologies, evolving industry or regulatory standards and new product introductions. Our success is dependent on the successful introduction of new products, or upgrades of current products, and our ability to compete with new technologies. The following factors related to our products and markets, if they do not continue as in the recent past, could have an adverse impact on our operations:
• our ability to introduce advantaged products such as glass substrates for liquid crystal displays, optical fiber and cable and hardware and equipment, and environmental substrate and filter products at competitive prices;
• our ability to manufacture glass substrates and strengthened glass, to satisfy our customers’ technical requirements and our contractual obligations; and
• our ability to develop new products in response to government regulations and laws.
We face pricing pressures in each of our businesses that could adversely affect our financial performance
We face pricing pressure in each of our businesses as a result of intense competition, emerging technologies, or over-capacity. We may not be able to achieve proportionate reductions in costs or sustain our current rate of cost reduction to offset pricing pressures. We anticipate pricing pressures will continue in the future in all our businesses.
Any of these items could cause our sales, profitability and cash flows to be significantly reduced.
We face risks due to foreign currency fluctuations
Because we have significant customers and operations outside the U.S., fluctuations in foreign currencies, especially the Japanese yen, New Taiwan dollar, South Korean won, and euro, will significantly impact our sales, profit and cash flows. Foreign exchange rates may make our products less competitive in countries where local currencies decline in value relative to the U.S. dollar and Japanese yen. Sales in our Display Technologies segment, representing 34% of Corning’s sales in 2015, are denominated in Japanese yen. Corning hedges significant translation, transaction and balance sheet currency exposures and uses a variety of derivative instruments to reduce the impact of foreign currency fluctuations associated with certain monetary assets and liabilities as well as operating results including our net profits.
A large portion of our sales, profit and cash flows are transacted in non-U.S. dollar currencies and we expect that we will continue to realize gains or losses with respect to these exposures, net of gains or losses from our hedging programs. For example, we will experience foreign currency gains and losses in certain instances if it is not possible or cost effective to hedge our foreign currency exposures or should we elect not to hedge certain foreign currency exposures. Alternatively, we may experience gains or losses if the underlying exposure which we have hedged change (increases or decreases) and we are unable to reverse, unwind, or terminate the hedges concurrent with the change in the underlying notional exposure. The objective of our hedging activities is to mitigate the risk associated with foreign currency exposures. We are also exposed to potential losses in the event of non-performance by our counterparties to these derivative contracts. Neither we nor our counterparties are required to post collateral for these financial instruments. Our ultimate realized loss or gain with respect to currency fluctuations will generally depend on the size and type of cross-currency exposures that we enter into, the currency exchange rates associated with these exposures and changes in those rates, whether we have entered into foreign currency forward contracts to offset these exposures and other factors. All of these factors could materially impact our results of operations, anticipated future results, financial position and cash flows, the timing of which is variable and generally outside of our control.

10 CORNING INCORPORATED - 2015 Annual Report
Risk Factors
If the financial condition of our customers declines, our credit risks could increase
We have experienced, and in the future may experience, losses as a result of our inability to collect our accounts receivable. If our customers or our indirect customers fail to meet their payment obligations for our products, we could experience reduced cash flows and losses in excess of amounts reserved. Many customers of our Display Technologies and Specialty Materials segments are thinly capitalized and/or unprofitable. In our Optical Communications segment, certain large infrastructure projects are subject to governmental funding, which, if terminated, could adversely impact the financial strength of our customers. These factors may result in an inability to collect receivables or a possible loss in business.
The success of our business depends on our ability to develop and produce advantaged products that meet our customers’ needs
Our business relies on continued global demand for our brands and products. To achieve business goals, we must develop and sell products that appeal to our customers, original equipment manufacturers and distributors. This is dependent on a number of factors, including our ability to manage and maintain key customer relationships, our ability to produce products that meet the quality, performance and price expectations of our customers. The manufacturing of our products involves complex and precise processes. In some cases, existing manufacturing may be insufficient to achieve the requirements of our customers. We will need to develop new manufacturing processes and techniques to maintain profitable operations. While we continue to fund projects to improve our manufacturing techniques and processes and lower our costs, we may not achieve satisfactory manufacturing costs that will fully enable us to meet our profitability targets.
In addition, our continued success in selling products that appeal to our customers is dependent on our ability to innovate, with respect to both products and operations, and on the availability and effectiveness of legal protection for our innovations. Failure to continue to deliver quality and competitive products to the marketplace, to adequately protect our intellectual property rights, to supply products that meet applicable regulatory requirements or to predict market demands for, or gain market acceptance of, our products, could have a negative impact on our business, results of operations and financial condition.
Our future financial performance depends on our ability to purchase a sufficient amount of materials, precious metals, parts, and manufacturing equipment to meet the demands of our customers
Our ability to meet customer demand depends, in part, on our ability to obtain timely and adequate delivery of materials, precious metals, parts and components from our suppliers. We may experience shortages that could adversely affect our operations. There can be no assurances that we will not encounter problems in the future. Furthermore, certain manufacturing equipment, raw materials or components are available only from a single source or limited sources. We may not be able to find alternate sources in a timely manner. A reduction, interruption or delay of supply, or a significant increase in the price for supplies, such as manufacturing equipment, precious metals, raw materials or energy, could have a material adverse effect on our businesses.
If our products, including materials purchased from our suppliers, experience performance issues, our business will suffer
Our business depends on the production of products of consistently high quality. Our products, components and materials purchased from our suppliers, are typically tested for quality. These testing procedures are limited to evaluating our products under likely and foreseeable failure scenarios. For various reasons, our products, including materials purchased from our suppliers, may fail to perform as a customer expected. In some cases, product redesigns or additional expense may be required to address such issues. A significant or systemic quality issue could result in customer relations problems, lost sales, reduced volumes, product recalls and financial damages and penalties.
We have incurred, and may in the future incur, goodwill and other intangible asset impairment charges
At December 31, 2015, Corning had goodwill and other intangible assets of $2,086 million. In the fourth quarter of 2015, we recorded a charge of $29 million for the impairment of goodwill resulting from a small acquisition in 2014. While we believe the estimates and judgments about future cash flows used in the goodwill impairment tests are reasonable, we cannot provide assurance that additional impairment charges in the future will not be required if the expected cash flow estimates as projected by management do not occur, especially if an economic recession occurs and continues for a lengthy period or becomes severe, or if acquisitions and investments made by the Company fail to achieve expected returns.
We operate in a highly competitive environment
We operate in a highly competitive environment, and our outlook depends on the company’s share of industry sales based on our ability to compete with others in the marketplace. The Company competes on the basis of product attributes, customer service, quality and price. There can be no assurance that our products will be able to compete successfully with other companies’ products. Our share of industry sales could be reduced due to aggressive pricing or product strategies pursued by competitors, unanticipated product or manufacturing difficulties, product performance failures, our failure to price our products competitively, our failure to produce our products at a competitive cost or unexpected, emerging technologies or products. We expect that we will face continuous competition from existing competitors, low cost manufacturers and new entrants. We believe we must invest in research and development, engineering, manufacturing and marketing capabilities, and continue to improve customer service in order to remain competitive. We cannot provide assurance that we will be able to maintain or improve our competitive position.
We may need to change our pricing models to compete successfully
We face intense competition in all of our businesses, particularly LCD glass, and general economic and business conditions can put pressure on us to change our prices. If our competitors offer significant discounts on certain products or develop products that the marketplace considers more valuable, we may need to lower prices or offer other favorable terms in order to retain our customers and market positions. Any such changes may reduce our profitability and cash flow. Any broad-based change to our prices and pricing policies could cause our revenues to decline or be delayed as we implement and our customers adjust to the new pricing policies. If we do not adapt our pricing models to reflect changes in customer use of our products or changes in customer demand, our revenues could decrease.

11CORNING INCORPORATED - 2015 Annual Report
Risk Factors
LCD glass generates a significant amount of the Company’s profits and cash flow, and any events that adversely affect the market for LCD glass substrates could have a material and negative impact on our financial results
Corning’s ability to generate profits and operating cash flow depends largely upon the level of profitability of our LCD glass business. As a result, any event that adversely affects our Display business could have a significant impact on our consolidated financial results. These events could include loss of patent protection, increased costs associated with manufacturing, and increased competition from the introduction of new, and more desirable products. If any of these events had a material adverse effect on the sales of our LCD glass, such an event could result in material charges and a significant reduction in profitability.
Additionally, emerging material technologies could replace our glass substrates for certain applications, including display glass, cover glass and others, resulting in a decline in demand for our products. Existing or new production capacity for glass substrates may exceed the demand for them. Technologies for displays, cover glass and other applications in competition with our glass may reduce or eliminate the need for our glass substrates. New process technologies developed by our competitors may also place us at a cost or quality disadvantage. Our own process technologies may be acquired or used unlawfully by others, enabling them to compete with us. Our inability to manufacture glass substrates to the specifications required by our customers may result in loss of revenue, margins and profits or liabilities for failure to supply. A scarcity of resources, limitations on technology, personnel or other factors resulting in a failure to produce commercial quantities of glass substrates could have adverse financial consequences to us.
Changes in our effective tax rate or tax liability may have an adverse effect on our results of operations
Our effective tax rate could be adversely impacted by several factors, including:
• changes in the relative amounts of income before taxes in the various jurisdictions in which we operate that have differing statutory tax rates;
• changes in tax treaties and regulations or the interpretation of them;
• changes to our assessment about the realizability of our deferred tax assets that are based on estimates of our future results, the prudence and feasibility of possible tax planning strategies, and the economic environments in which we do business;
• the outcome of current and future tax audits, examinations, or administrative appeals;
• changes in generally accepted accounting principles that affect the accounting for taxes; and
• limitations or adverse findings regarding our ability to do business in some jurisdictions.
We may have additional tax liabilities
We are subject to income taxes in the U.S. and many foreign jurisdictions and are commonly audited by various tax authorities. In the ordinary course of our business, there are many transactions and calculations where the ultimate tax determination is uncertain. Significant judgment is required in determining our worldwide provision for income taxes. Although we believe our tax estimates are reasonable, the final determination of tax audits and any related litigation could be materially different from our historical income tax provisions and accruals. The results of an audit or litigation could have a material effect on our financial statements in the period or periods for which that determination is made.
A significant amount of our net profits and cash flows are generated from outside the U.S., and certain repatriation of funds currently held in foreign jurisdictions may result in higher effective tax rates for the company. In addition, there have been proposals to change U.S. tax laws that could significantly impact how U.S. global corporations are taxed on foreign earnings. Although we cannot predict whether or in what form proposed legislation may pass, if enacted certain anti-deferral proposals could have a material adverse impact on our tax expense and cash flow.
Our business depends on our ability to attract and retain talented employees
The loss of the services of any member of our senior management team or key research and development or engineering personnel without adequate replacement, or the inability to attract new qualified personnel, could have a material adverse effect on our operations and financial performance.
We are subject to strict environmental regulations and regulatory changes that could result in fines or restrictions that interrupt our operations
Some of our manufacturing processes generate chemical waste, waste water, other industrial waste or greenhouse gases, and we are subject to numerous laws and regulations relating to the use, storage, discharge and disposal of such substances. We have installed anti-pollution equipment for the treatment of chemical waste and waste water at our facilities. We have taken steps to control the amount of greenhouse gases created by our manufacturing operations. However, we cannot provide assurance that environmental claims will not be brought against us or that government regulators will not take steps toward adopting more stringent environmental standards.
Any failure on our part to comply with any present or future environmental regulations could result in the assessment of damages or imposition of fines against us, or the suspension/cessation of production or operations. In addition, environmental regulations could require us to acquire costly equipment, incur other significant compliance expenses or limit or restrict production or operations and thus materially and negatively affect our financial condition and results of operations.
Changes in regulations and the regulatory environment in the U.S. and other countries, such as those resulting from the regulation and impact of global warming and CO2 abatement, may affect our businesses and their results in adverse ways by, among other things, substantially increasing manufacturing costs, limiting availability of scarce resources, especially energy, or requiring limitations on production and sale of our products or those of our customers.
We may experience difficulties in enforcing our intellectual property rights, which could result in loss of market share, and we may be subject to claims of infringement of the intellectual property rights of others
We rely on patent and trade secret laws, copyright, trademark, confidentiality procedures, controls and contractual commitments to protect our intellectual property rights. Despite our efforts, these protections may be limited and we may encounter difficulties in protecting our intellectual property rights or obtaining rights to additional intellectual property necessary to permit us to continue or expand our businesses. We cannot provide assurance that the patents that we hold or may obtain will provide meaningful protection against our competitors. Changes in or enforcement of laws concerning intellectual property, worldwide, may affect our ability to prevent or address the misappropriation of, or the unauthorized use of, our intellectual property, potentially resulting in loss of market share. Litigation may be necessary to enforce our intellectual property rights. Litigation is inherently uncertain and outcomes are often unpredictable. If we cannot protect our intellectual property rights against unauthorized copying or use, or other misappropriation, we may not remain competitive.

12 CORNING INCORPORATED - 2015 Annual Report
Risk Factors
The intellectual property rights of others could inhibit our ability to introduce new products. Other companies hold patents on technologies used in our industries and are aggressively seeking to expand, enforce and license their patent portfolios. We periodically receive notices from, or have lawsuits filed against us by third parties claiming infringement, misappropriation or other misuse of their intellectual property rights and/or breach of our agreements with them. These third parties often include entities that do not have the capabilities to design, manufacture, or distribute products or that acquire intellectual property like patents for the sole purpose of monetizing their acquired intellectual property through asserting claims of infringement and misuse. Such claims of infringement or misappropriation may result in loss of revenue, substantial costs, or lead to monetary damages or injunctive relief against us.
Current or future litigation or regulatory investigations may harm our financial condition or results of operations
As described in Legal Proceedings in this Form 10-K, we are engaged in litigation and regulatory matters. Litigation and regulatory proceedings may be uncertain, and adverse rulings could occur, resulting in significant liabilities, penalties or damages. Such current or future substantial legal liabilities or regulatory actions could have a material adverse effect on our business, financial condition, cash flows and reputation.
We may not capture significant revenues from our current research and development efforts for several years, if at all
Developing our products through research and development is expensive and the investment often involves a long return on investment cycle. We have made and expect to continue to make significant investments in research and development and related product opportunities. Accelerated product introductions and short product life cycles require high levels of expenditures for research and development that could adversely affect our operating results if not offset by increases in our gross margin. We believe that we must continue to dedicate a significant amount of resources to our research and development efforts to maintain our competitive position.
Business disruptions could affect our operating results
A significant portion of our manufacturing, research and development activities and certain other critical business operations are concentrated in a few geographic areas. A major earthquake, fire or other catastrophic event that results in the destruction or disruption of any of our critical facilities could severely affect our ability to conduct normal business operations and, as a result, our future financial results could be materially and adversely affected.
Additionally, a significant amount of the specialized manufacturing capacity for our Display Technologies segment is concentrated in three overseas countries and it is reasonably possible that the operations of one or more such facilities could be disrupted. Due to the specialized nature of the assets and the customers’ locations, it may not be possible to find replacement capacity quickly or substitute production from facilities in other countries. Accordingly, loss of these facilities could produce a near-term severe impact on our Display business and the Company as a whole.
We face risks through equity affiliates that we do not control
Corning’s net income includes equity earnings from affiliated companies. For the year ended December 31, 2015, we recognized $299 million of equity earnings, of which approximately 94% came from Dow Corning (which makes silicone and high purity polycrystalline products).
On December 11, 2015, Corning announced its intention to exchange its 50% equity interest in Dow Corning for 100% of the stock of a newly formed entity that will become a wholly-owned subsidiary of Corning Incorporated. The newly formed entity will hold approximately 40% ownership in Hemlock Semiconductor Group and approximately $4.8 billion in cash. Upon completion of this strategic realignment, which is expected to close during the first half of 2016, Dow Chemical, an equal owner of Dow Corning with Corning since 1943, will assume 100% ownership of Dow Corning.
Going forward, we face the risk that our other equity investments may not perform at the levels expected. In addition, we rely on the internal controls and financial reporting controls of these entities and their failure to maintain effectiveness or comply with applicable standards or regulations may adversely affect us.
We may not have adequate insurance coverage for claims against us
We face the risk of loss resulting from product liability, asbestos, securities, fiduciary liability, intellectual property, antitrust, contractual, warranty, environmental, fraud and other lawsuits, whether or not such claims are valid. In addition, our product liability, fiduciary, directors and officers, property policies including business interruption, natural catastrophe and comprehensive general liability insurance may not be adequate to cover such claims or may not be available to the extent we expect in the future. A successful claim that exceeds or is not covered by our policies could require us to make substantial unplanned payments. Some of the carriers in our historical primary and excess insurance programs are in liquidation and may not be able to respond if we should have claims reaching their policies. The financial health of other insurers may deteriorate. Several of our insurance carriers are litigating with us the extent, if any, of their obligation to provide insurance coverage for asbestos liabilities asserted against us. The results of that litigation may adversely affect our insurance coverage for those risks. In addition, we may not be able to obtain adequate insurance coverage for certain types of risk such as political risks, terrorism or war.
Our global operations are subject to extensive trade and anti-corruption laws and regulations
Due to the international scope of our operations, we are subject to a complex system of import- and export-related laws and regulations, including U.S. regulations issued by Customs and Border Protection, the Bureau of Industry and Security, the Office of Antiboycott Compliance, the Directorate of Defense Trade Controls and the Office of Foreign Assets Control, as well as the counterparts of these agencies in other countries. Any alleged or actual violations may subject us to government scrutiny, investigation and civil and criminal penalties, and may limit our ability to import or export our products or to provide services outside the United States. We cannot predict the nature, scope or effect of future regulatory requirements to which our operations might be subject or the manner in which existing laws might be administered or interpreted.
In addition, the U.S. Foreign Corrupt Practices Act and similar foreign anti-corruption laws generally prohibit companies and their intermediaries from making improper payments or providing anything of value to improperly influence foreign government officials for the purpose of obtaining or retaining business, or obtaining an unfair advantage. Recent years have seen a substantial increase in the global enforcement of anti-corruption laws. Our continued operation and expansion outside the United States, including in developing countries, could increase the risk of alleged violations. Violations of these laws may result in severe criminal or civil sanctions, could disrupt our business, and result in an adverse effect on our reputation, business and results of operations or financial condition.

13CORNING INCORPORATED - 2015 Annual Report
Risk Factors
Moreover, several of our related partners are domiciled in areas of the world with laws, rules and business practices that differ from those in the United States, and we face the reputational and legal risk that our related partners may violate applicable laws, rules and business practices.
Acquisitions, equity investments and strategic alliances may have an adverse effect on our business
We expect to continue making acquisitions and entering into equity investments and strategic alliances as part of our business strategy. These transactions involve significant challenges and risks including that a transaction may not advance our business strategy, that we do not realize a satisfactory return on our investment, or that we experience difficulty integrating new employees, business systems, and technology, or diversion of management’s attention from our other businesses. It may take longer than expected to realize the full benefits, such as increased revenue and cash flow, enhanced efficiencies, or market share, or those benefits may ultimately be smaller than anticipated, or may not be realized. These events could harm our operating results or financial condition.
Improper disclosure of personal data could result in liability and harm our reputation
We store and process personally-identifiable information of our employees and, in some case, our customers. At the same time, the continued occurrence of high-profile data breaches provides evidence of the increasingly hostile information security environment. This environment demands that we continuously improve our design and coordination of security controls across our business groups and geographies. Despite these efforts, it is possible our security controls over personal data, our training of employees and vendors on data security, and other practices we follow may not prevent the improper disclosure of personally identifiable information. Improper disclosure of this information could harm our reputation or subject us to liability under laws that protect personal data, resulting in increased costs or loss of revenue.
Significant macroeconomic events, changes in regulations, or a crisis in the financial markets could limit our access to capital
We utilize credit in both the capital markets and from banks to facilitate company borrowings, hedging transactions, leases and other financial transactions. We maintain a $2 billion revolving credit agreement to fund potential liquidity needs and to backstop certain transactions. An adverse macroeconomic event or changes in bank regulations could limit our ability to gain access to credit or to renew the revolving credit agreement upon expiration. Additionally, a financial markets crisis may limit our ability to access liquidity.
Adverse economic conditions may adversely affect our cash investments
We maintain an investment portfolio of various types of securities with varying maturities and credit quality. These investments are subject to general credit, liquidity, market, and interest rate risks, which may be exacerbated by unusual events that have affected global financial markets. We also make significant investments in U.S. government securities, either directly, or through investment in money market funds. If global credit and equity markets experience prolonged periods of decline, or if the U.S. defaults on its debt obligations or its debt is downgraded, our investment portfolio may be adversely impacted and we could determine that more of our investments have experienced an other-than-temporary decline in fair value, requiring impairment charges that could adversely impact our financial results.
Information technology dependency and security vulnerabilities could lead to reduced revenue, liability claims, or competitive harm
The Company is increasingly dependent on sophisticated information technology and infrastructure. Any significant breakdown, intrusion, interruption or corruption of these systems or data breaches could have a material adverse effect on our business. Like other global companies, we have, from time to time, experienced incidents related to our information technology (“IT”) systems, and expect that such incidents will continue, including malware and computer virus attacks, unauthorized access, systems failures and disruptions. We have measures and defenses in place against unauthorized access, but we may not be able to prevent, immediately detect, or remediate such events.
We use electronic IT in our manufacturing processes and operations and other aspects of our business. Our IT systems may be vulnerable to disruptions from computer viruses, natural disasters, unauthorized access, cyber-attack and other similar disruptions. A material breach in the security of our IT systems could include the theft of our intellectual property or trade secrets. Such disruptions or security breaches could result in the theft, unauthorized use or publication of our intellectual property and/or confidential business information, harm our competitive position, reduce the value of our investment in research and development and other strategic initiatives, or otherwise adversely affect our business.
Additionally, utilities and other operators of critical energy infrastructure that serve our facilities face heightened security risks, including cyber-attack. In the event of such an attack, disruption in service from our utility providers could disrupt our manufacturing operations which rely on a continuous source of power (electrical, gas, etc.).
International trade policies may impact demand for our products and our competitive position
Government policies on international trade and investment such as import quotas, capital controls or tariffs, whether adopted by individual governments or addressed by regional trade blocs, can affect the demand for our products and services, impact the competitive position of our products or prevent us (including our equity affiliates/joint ventures) from being able to sell products in certain countries. The implementation of more restrictive trade policies, such as higher tariffs or new barriers to entry, in countries in which we sell large quantities of products and services could negatively impact our business, results of operations and financial condition. For example, a government’s adoption of “buy national” policies or retaliation by another government against such policies could have a negative impact on our results of operations. These policies also affect our equity companies.

14 CORNING INCORPORATED - 2015 Annual Report
Legal ProceedingsDow Corning Corporation� Corning and Dow Chemical each own 50% of the common stock of Dow Corning.
Dow Corning Breast Implant Litigation
In May 1995, Dow Corning filed for bankruptcy protection to address pending and claimed liabilities arising from many thousands of breast implant product lawsuits. On June 1, 2004, Dow Corning emerged from Chapter 11 with a Plan of Reorganization (the “Plan”) which provided for the settlement or other resolution of implant claims. The Plan also includes releases for Corning and Dow Chemical as shareholders in exchange for contributions to the Plan.
Under the terms of the Plan, Dow Corning has established and is funding a Settlement Trust and a Litigation Facility to provide a means for tort claimants to settle or litigate their claims. Inclusive of insurance, Dow Corning has paid approximately $1.8 billion to the Settlement Trust. As of December 31, 2015, Dow Corning had recorded a reserve for breast implant litigation of $291 million. See Note 7 (Investments) to the Consolidated Financial Statements for additional detail.
Other Dow Corning Claims Arising From Bankruptcy Proceedings
As a separate matter arising from the bankruptcy proceedings, Dow Corning is defending claims asserted by a number of commercial creditors who claim additional interest at default rates and enforcement costs, during the period from May 1995 through June 2004. As of December 31, 2015, Dow Corning has estimated the liability to commercial creditors to be within the range of $104 million to $341 million. As Dow Corning management believes no single amount within the range appears to be a better estimate than any other amount within the range, Dow Corning has recorded the minimum liability within the range. Should Dow Corning not prevail in this matter, Corning’s equity earnings would be reduced by its 50% share of the amount in excess of $104 million, net of applicable tax benefits. There are a number of other claims in the bankruptcy proceedings against Dow Corning awaiting resolution by the U.S. District Court, and it is reasonably possible that Dow Corning may record bankruptcy-related charges in the future. The remaining tort claims against Dow Corning are expected to be channeled by the Plan into facilities established by the Plan or otherwise defended by the Litigation Facility.
Pittsburgh Corning Corporation and Asbestos Litigation� Corning and PPG Industries, Inc. (“PPG”) each own 50% of the capital stock of Pittsburgh Corning Corporation (“PCC”). Over a period of more than two decades, PCC and several other defendants were named in numerous lawsuits involving claims alleging personal injury from exposure to asbestos. On April 16, 2000, PCC filed for Chapter 11 reorganization in the U.S. Bankruptcy Court for the Western District of Pennsylvania. At the time PCC filed for bankruptcy protection, there were approximately 11,800 claims pending against Corning in state court lawsuits alleging various theories of liability based on exposure to PCC’s asbestos products and typically requesting monetary damages in excess of one million dollars per claim. Corning has defended those claims on the basis of the separate corporate status of PCC and the absence of any facts supporting claims of direct liability arising from PCC’s asbestos products.
PCC Plan of Reorganization
Corning, with other relevant parties, has been involved in ongoing efforts to develop a Plan of Reorganization that would resolve the concerns and objections of the relevant courts and parties. On November 12, 2013, the Bankruptcy Court issued a decision finally confirming an Amended PCC Plan of Reorganization (the “Amended PCC Plan” or the “Plan”). On September 30, 2014, the United States District Court for the Western District of Pennsylvania (the “District Court”) affirmed the Bankruptcy Court’s decision confirming the Amended PCC Plan. On October 30, 2014, one of the objectors to the Plan appealed the District Court’s affirmation of the Plan to the United States Court of Appeals for the Third Circuit (the “Third Circuit Court of Appeals”). On January 6, 2016, all pending appeals of the Plan were withdrawn and Corning expects that the Plan will become effective in April 2016.
Under the Plan as affirmed by the Bankruptcy Court and affirmed by the District Court, Corning is required to contribute its equity interests in PCC and Pittsburgh Corning Europe N.V. (“PCE”), a Belgian corporation, and to contribute $290 million in a fixed series of payments, recorded at present value. Corning will contribute its equity interest in PCC and PCE on the Plan’s Funding Effective Date, which is expected to occur in June 2016. Corning has the option to use its common stock rather than cash to make these payments, but the liability is fixed by dollar value and not the number of shares. The Plan requires Corning to make: (1) one payment of $70 million one year from the date the Plan becomes effective and certain conditions are met; and (2) five additional payments of $35 million, $50 million, $35 million, $50 million and $50 million, respectively, on each of the five subsequent anniversaries of the first payment, the final payment of which is subject to reduction based on the application of credits under certain circumstances.
Non-PCC Asbestos Litigation
In addition to the claims against Corning related to its ownership interest in PCC, Corning is also the defendant in approximately 9,700 other cases (approximately 37,300 claims) alleging injuries from asbestos related to its Corhart business and similar amounts of monetary damages per case (the “non-PCC asbestos claims”). When PCC filed for bankruptcy protection, the Court granted a preliminary injunction to suspend all asbestos cases against PCC, PPG and Corning – including these non-PCC asbestos claims (the “Stay”). The Stay remains in place as of the date of this filing; however, given that the Amended PCC Plan is now affirmed by the District Court and the Third Circuit Court of Appeals, Corning anticipates the Stay will be lifted in the second half of 2016. These non-PCC asbestos claims have been covered by insurance without material impact to Corning to date. As of December 31, 2015, Corning had received for these claims approximately $19 million in insurance payments. When the Stay is lifted, these non-PCC asbestos claims will be allowed to proceed against Corning. In prior periods, Corning recorded in its estimated asbestos litigation liability an additional $150 million for these and any future non-PCC asbestos claims.

15CORNING INCORPORATED - 2015 Annual Report
Legal Proceedings
Total Estimated Liability for the Amended PCC Plan and the Non-PCC Asbestos Claims
The liability for the Amended PCC Plan and the non-PCC asbestos claims was estimated to be $678 million at December 31, 2015, compared with an estimate of liability of $681 million at December 31, 2014. The $678 million liability is comprised of $238 million of the fair value of PCE, $290 million for the fixed series of payments, and $150 million for the non-PCC asbestos claims, all referenced in the preceding paragraphs. With respect to the PCE liability, at December 31, 2015 and 2014, the fair value of $238 million and $241 million of our interest in PCE significantly exceeded its carrying value of $154 million and $162 million, respectively. There have been no impairment indicators for our investment in PCE and we continue to recognize equity earnings of this affiliate. At the time Corning recorded this liability, it determined it lacked the ability to recover the carrying amount of its investment in PCC and its investment was other than temporarily impaired. As a result, we reduced our investment in PCC to zero. As the fair value in PCE is significantly higher than book value, management believes that the risk of an additional loss in an amount materially higher than the fair value of the liability is remote. With respect to the liability for other asbestos litigation, the liability for non-PCC asbestos claims was estimated based upon industry data for asbestos claims since Corning does not have recent claim history due to the Stay issued by the Bankruptcy Court. The estimated liability represents the undiscounted projection of claims and related legal fees over the next 20 years. The amount may need to be adjusted in future periods as more data becomes available; however, we cannot estimate any additional losses at this time. For the years ended December 31, 2015 and 2014, Corning recorded asbestos litigation income of $15 million and expense of $9 million, respectively. At December 31, 2015, $440 million of the obligation, consisting of the $290 million for the fixed series of payments and $150 million for the non-PCC asbestos claims, is classified as a non-current liability, as installment payments for the cash portion of the obligation are not planned to commence until more than 12 months after the Amended PCC Plan becomes effective. The amount of the obligation related to the fair value of PCE, $238 million, was reclassified to a current liability in the fourth quarter of 2015, as the contribution of the assets is expected to be made within the next twelve months.
Non-PCC Asbestos Claims Insurance Litigation
Several of Corning’s insurers have commenced litigation in state courts for a declaration of the rights and obligations of the parties under insurance policies, including rights that may be affected by the potential resolutions described above. Corning has resolved these issues with a majority of its relevant insurers, and is vigorously contesting these cases with the remaining relevant insurers. Management is unable to predict the outcome of the litigation with these remaining insurers.
Environmental Litigation� Corning has been named by the United States Environmental Protection Agency (the “EPA”) under the Superfund Act or by state governments under similar state laws, as a potentially responsible party for 17 active hazardous waste sites. Under the Superfund Act, all parties who may have contributed any waste to a hazardous waste site, identified by the EPA, are jointly and severally liable for the cost of cleanup unless the EPA agrees otherwise. It is Corning’s policy to accrue for its estimated liability related to Superfund sites and other environmental liabilities related to property owned by Corning based on expert analysis and continual monitoring by both internal and external consultants. At December 31, 2015 and 2014, Corning had accrued approximately $37 million (undiscounted) and $43 million (undiscounted), respectively, for the estimated liability for environmental cleanup and related litigation. Based upon the information developed to date, management believes that the accrued reserve is a reasonable estimate of the Company’s liability and that the risk of an additional loss in an amount materially higher than that accrued is remote.
Chinese Anti-Dumping Investigation Involving Optical Fiber Preforms Produced in the United States� On March 19, 2014, the Chinese Ministry of Commerce (“MOFCOM”) initiated an anti-dumping investigation involving optical fiber preforms originating in the United States and Japan. On July 23, 2015, MOFCOM announced its Final Determination that included a dumping margin of 41.79% against Corning. The company is evaluating its options to appeal MOFCOM’s decision.
Department of Justice Grand Jury Subpoena� In March 2012, Corning received a grand jury subpoena issued in the United States District Court for the Eastern District of Michigan from the U.S. Department of Justice in connection with an investigation into conduct relating to possible antitrust law violations involving certain automotive products, including catalytic converters, diesel particulate filters, substrates and monoliths. The subpoena required Corning to produce to the Department of Justice certain documents from the period January 1999 to March 2012. In November 2012, Corning received another subpoena from the Department of Justice, with the same scope, but extending the time frame for the documents to be produced back to January 1, 1988. Corning’s policy is to comply with all laws and regulations, including all antitrust and competition laws. Antitrust investigations can result in substantial liability for the Company. Currently, Corning cannot estimate the ultimate financial impact, if any, resulting from the investigation. Such potential impact, if an antitrust violation by Corning is found, could however, be material to the results of operations of Corning in a particular period.

16 CORNING INCORPORATED - 2015 Annual Report
Market for Registrant’s Common Equity, Related Stockholder Matters and Issuer Purchases of Equity Securities(a) Corning Incorporated common stock is listed on the New York Stock Exchange. In addition, it is traded on the Boston, Midwest, Pacific and Philadelphia
stock exchanges. Common stock options are traded on the Chicago Board Options Exchange. The ticker symbol for Corning Incorporated is “GLW.”
The following table sets forth the high and low sales price of Corning’s common stock as reported on the New York Stock Exchange Composite Tape.
First quarter Second quarter Third quarter Fourth quarter2015Price range
High $ 25.16 $ 22.98 $ 20.02 $ 19.29Low $ 21.89 $ 19.57 $ 15.24 $ 16.36
2014Price range
High $ 20.99 $ 22.20 $ 22.37 $ 23.52Low $ 16.55 $ 20.17 $ 19.23 $ 17.03
As of December 31, 2015, there were approximately 16,622 registered holders of common stock and approximately 492,337 beneficial shareholders.
On February 3, 2016, Corning’s Board of Directors declared a 12.5% increase in the Company’s quarterly common stock dividend, which increased the quarterly dividend from $0.12 to $0.135 per share of common stock, beginning with the dividend to be paid in the first quarter of 2016. This increase marks the fifth dividend increase since October 2011. The Board previously increased the quarterly dividend 20%, from $0.10 to $0.12, on December 3, 2014. The Company paid four quarterly dividends of $0.12 during the year ended December 31, 2015 and paid four quarterly dividends of $0.10 during the year ended December 31, 2014.
Performance Graph
The following graph illustrates the cumulative total shareholder return over the last five years of Corning’s common stock, the S&P 500 and the S&P Communications Equipment Companies (in which Corning is currently included). The graph includes the capital weighted performance results of those companies in the communications equipment company classification that are also included in the S&P 500.
S&P 500Corning Incorporated S&P Communications Equipment
COMPARISON OF FIVE-YEAR CUMULATIVE TOTAL RETURN AMONG CORNING INCORPORATED, S&P 500 AND S&P COMMUNICATIONS EQUIPMENT
(Fiscal Years Ended December 31)Indexed to 100
2013201220112010 2014 2015
$0
$50
$100
$150
$200
(b) Not applicable.

17CORNING INCORPORATED - 2015 Annual Report
Selected Financial Data (Unaudited)
(c) The following table provides information about our purchases of our common stock during the fiscal fourth quarter of 2015:
ISSUER PURCHASES OF EQUITY SECURITIES
PeriodNumber of shares
purchased(1)Average price paid
per share(1)
Number of shares purchased as part of publicly announced
plans or programs(2)
Approximate dollar value of shares that may yet be purchased under the plans
or programs(2)
October 1-31, 2015 54,513,746 $ 18.77 54,500,524 $ 4,521,528,007November 1-30, 2015 10,654 $ 18.82 $ 4,521,528,007December 1-31, 2015 141,145 $ 18.42 $ 4,521,528,007Total at December 31, 2015 54,665,545 $ 18.77 54,500,524 $ 4,521,528,007
(1) These columns reflect the following transactions during the fourth quarter of 2015: (i) the deemed surrender to us of 86,015 shares of common stock to satisfy tax withholding obligations in connection with the vesting of employee restricted stock units; (ii) the surrender to us of 79,006 shares of common stock to satisfy tax withholding obligations in connection with the vesting of restricted stock issued to employees; and (iii) the purchase of 54,500,524 shares of common stock in conjunction with the repurchase programs announced on July 15, 2015.
(2) On July 15, 2015, Corning’s Board of Directors authorized the repurchase of up to $2 billion worth of shares of common stock between the date of announcement and December 31, 2016. On October 26, 2015, Corning’s Board of Directors supplemented this program with the authorization to repurchase an additional $4 billion worth of shares of common stock.
Selected Financial Data (Unaudited)(In millions, except per share amounts and number of employees)
Years ended December 31,2015 2014 2013 2012 2011
Results of operationsNet sales $ 9,111 $ 9,715 $ 7,819 $ 8,012 $ 7,890Research, development and engineering expenses $ 769 $ 815 $ 710 $ 769 $ 668Equity in earnings of affiliated companies $ 299 $ 266 $ 547 $ 810 $ 1,471Net income attributable to Corning Incorporated $ 1,339 $ 2,472 $ 1,961 $ 1,636 $ 2,817Earnings per common share attributable to Corning Incorporated:
Basic $ 1.02 $ 1.82 $ 1.35 $ 1.10 $ 1.80Diluted $ 1.00 $ 1.73 $ 1.34 $ 1.09 $ 1.78
Cash dividends declared per common share $ 0.36 $ 0.52 $ 0.39 $ 0.32 $ 0.23Shares used in computing per share amounts:
Basic earnings per common share 1,219 1,305 1,452 1,494 1,562Diluted earnings per common share 1,343 1,427 1,462 1,506 1,583
Financial position
Working capital $ 5,455 $ 7,914 $ 7,145 $ 7,739 $ 6,580Total assets $ 28,547 $ 30,063 $ 28,478 $ 29,375 $ 27,848Long-term debt $ 3,910 $ 3,227 $ 3,272 $ 3,382 $ 2,364Total Corning Incorporated shareholders’ equity $ 18,788 $ 21,579 $ 21,162 $ 21,486 $ 21,078Selected dataCapital expenditures $ 1,250 $ 1,076 $ 1,019 $ 1,801 $ 2,432Depreciation and amortization $ 1,184 $ 1,200 $ 1,002 $ 997 $ 957Number of employees 35,700 34,600 30,400 28,700 28,800
Reference should be made to the Notes to the Consolidated Financial Statements and Management’s Discussion and Analysis of Financial Condition and Results of Operations.
18 CORNING INCORPORATED - 2015 Annual Report
Management’s Discussion and Analysis of Financial Condition and Results of Operations
Organization of InformationManagement’s Discussion and Analysis provides a historical and prospective narrative on the Company’s financial condition and results of operations. This discussion includes the following sections:
• Overview
• Results of Operations
• Core Performance Measures
• Reportable Segments
• Liquidity and Capital Resources
• Environment
• Critical Accounting Estimates
• New Accounting Standards
• Forward-Looking Statements
Overview
Strategy and Capital Allocation FrameworkIn October 2015, Corning announced a new strategy and capital allocation framework that reflects the company’s financial and operational strengths, as well as its ongoing commitment to increasing shareholder value.
Our probability of success increases as we invest in our world-class capabilities. Over the next four years, Corning will concentrate approximately 80% of its research, development and engineering investment and capital spending on a cohesive set of three core technologies, four manufacturing and engineering platforms, and five market-access platforms. This strategy will allow us to quickly apply our talents and repurpose our assets as needed.
Our financial strength also allows us to increase our return to shareholders. Through 2019, we expect to generate and deploy over $20 billion in cash and to return more than $10 billion to shareholders through share repurchases and dividends. As a result, we expect to increase our dividend per common share by at least 10% annually through 2019.
Investing in our FutureCorning is one of the world’s leading innovators in materials science. For more than 160 years, Corning has applied its unparalleled expertise in specialty glass, ceramics, and optical physics to develop products that have created new industries and transformed people’s lives. Our spending level for research, development and engineering remained consistent at 8% of sales in the year ended December 31, 2015 when compared to the year ended December 31, 2014. We continue to maintain our innovation strategy focusing on growing our existing businesses, developing opportunities adjacent or closely related to our existing technical and manufacturing capabilities, and investing in long-range opportunities in each of our market segments. We continue to work on new products, including glass substrates for high-performance displays and LCD applications, precision glass for advanced displays, emission
control products for cars, trucks, and off-road vehicles, products that accelerate drug discovery and manufacturing and the optical fiber, cable and hardware and equipment that enable fiber-to-the-premises, and next generation data centers. In addition, we are focusing on wireless solutions for diverse venue applications, such as distributed antenna systems. We have also focused our research, development and engineering spending to support the advancement of new product attributes for our Corning Gorilla Glass suite of products, including Gorilla Glass® in automotive and architectural markets. We will continue to focus on adjacent glass opportunities which leverage existing materials or manufacturing processes, including Corning® Willow™ Glass, our ultra-slim flexible glass substrate for use in next-generation consumer electronic and architectural applications.
2015 ResultsThe global economic headwinds, the continued softening in the television and consumer electronic device retail markets and the negative impact of the strengthening of the U.S. dollar negatively impacted Corning in 2015, resulting in lower net sales and net income when compared to results in 2014.
Net sales in the year ended December 31, 2015 were $9,111 million, a decrease of $604 million, or 6%, when compared to the year ended December 31, 2014. Sales in our Optical Communications segment increased by $328 million, or 12%, but were more than offset by declines in our other segments. The increase in sales in the Optical Communications segment was due to an increase in volume in North America in both carrier network and enterprise network products and the impact of several acquisitions completed in 2015. The decrease in sales of $765 million, or 20%, in the Display Technologies segment was the most significant segment decline, and was driven by the depreciation of the Japanese yen versus the U.S. dollar in the amount of $446 million and price declines in the low-teens in percentage terms, partially offset by a mid-single digit increase in volume.

19CORNING INCORPORATED - 2015 Annual Report
Management’s Discussion and Analysis of Financial Condition and Results of Operations
For the year ended December 31, 2015, we generated net income of $1.3 billion, or $1.00 per share, compared to net income of $2.5 billion, or $1.73 per share, for 2014. When compared to last year, the decrease in net income was due to the following items (amounts presented after tax):
• The decrease in the unrealized gains from our foreign currency hedges related to translated earnings in the amount of $1,054 million;
• A decrease in net income of $301 million in the Display Technologies segment, driven by price declines in the low-teens in percentage terms more than offsetting a mid-single digit percentage increase in volume, continued softening in the television and IT retail markets and the impact of the change in the fair value of the contingent consideration resulting from the acquisition of Corning Precision Materials in the amount of $184 million;
• The increase of $81 million in our defined benefit pension plans mark-to-market loss, driven by lower returns on our U.S. pension assets; and
• The absence of a gain of $38 million recorded in 2014 related to the settlement of an intellectual property dispute.
The decrease in net income for the year ended December 31, 2015 was partially offset by the following items:
• The positive change in the amounts recorded related to tax law changes and valuation allowance adjustments of $204 million;
• An increase of $43 million in the Optical Communications segment, due to higher sales volume for both carrier and enterprise network products, the favorable impact of several acquisitions completed this year and manufacturing efficiencies gained through cost reductions; and
• An increase in equity earnings of $33 million, driven by higher earnings at Dow Corning.
The translation impact of fluctuations in foreign currency exchange rates negatively affected Corning’s consolidated net income in the year ended December 31, 2015 in the amount of $294 million when compared to 2014. This impact was partially offset by the increase in the realized gain from our foreign currency translation hedges related to translated earnings of $186 million.
Corporate OutlookIn 2016, Corning expects its Display Technologies segment to experience continued moderate sequential LCD glass price declines and glass volume growth in the mid-single digit percentage year over year, in line with total glass demand growth. We anticipate that a rise in global demand for Corning’s carrier and enterprise network products will drive an increase in sales of a mid-single digit percentage in our Optical Communications segment, and that an increase in Corning Gorilla Glass and advanced optics volume will drive sales growth in the low-teens on a percentage basis in our Specialty Materials segment. We expect sales in our Environmental Technologies segment to be down slightly for the year, driven by lower year-over-year demand for heavy-duty diesel products. And we expect to continue the execution of our strategy and capital allocation framework begun in the fourth quarter of 2015, under which we plan to grow and sustain our leadership position in the markets in which we operate and return more than $10 billion to shareholders through 2019.
Results of Operations
Selected highlights from our continuing operations follow (in millions):
% change2015 2014 2013 15 vs. 14 14 vs. 13
Net sales $ 9,111 $ 9,715 $ 7,819 (6) 24Gross margin $ 3,653 $ 4,052 $ 3,324 (10) 22
(gross margin %) 40% 42% 43%Selling, general and administrative expenses $ 1,523 $ 1,211 $ 1,126 26 8
(as a % of net sales) 17% 12% 14%Research, development and engineering expenses $ 769 $ 815 $ 710 (6) 15
(as a % of net sales) 8% 8% 9%Restructuring, impairment and other charges $ 71 $ 67 * 6
(as a % of net sales) 1% 1%Equity in earnings of affiliated companies $ 299 $ 266 $ 547 12 (51)
(as a % of net sales) 3% 3% 7%Transaction-related gain, net $ 74 * *
(as a % of net sales) 1%Foreign currency hedge gain, net $ 85 $ 1,411 $ 622 (94) 127
(as a % of net sales) 1% 15% 8%Income before income taxes $ 1,486 $ 3,568 $ 2,473 (58) 44
(as a % of net sales) 16% 37% 32%Provision for income taxes $ (147) $ (1,096) $ (512) (87) 114
(as a % of net sales) (2)% (11)% (7)%Net income attributable to Corning Incorporated $ 1,339 $ 2,472 $ 1,961 (46) 26
(as a % of net sales) 15% 25% 25%* Percent change not meaningful.

20 CORNING INCORPORATED - 2015 Annual Report
Management’s Discussion and Analysis of Financial Condition and Results of Operations
Net SalesThe following table presents net sales by reportable segment (in millions):
Year ended December 31,%
Change%
Change2015 2014 2013 15 vs. 14 14 vs. 13
Display Technologies $ 3,086 $ 3,851 $ 2,545 (20)% 51%Optical Communications 2,980 2,652 2,326 12% 14%Environmental Technologies 1,053 1,092 919 (4)% 19%Specialty Materials 1,107 1,205 1,170 (8)% 3%Life Sciences 821 862 851 (5)% 1%All Other 64 53 8 21% 563%
Total net sales $ 9,111 $ 9,715 $ 7,819 (6)% 24%
For the twelve months ended December 31, 2015, net sales decreased by $604 million, or 6%, when compared to the same period in 2014. Driving the decline in net sales are the following items:
• A decrease of $765 million in the Display Technologies segment, driven by the depreciation of the Japanese yen versus the U.S. dollar, which adversely impacted net sales in the amount of $446 million, and price declines in the low-teens on a percentage basis. Although volume increased in the mid-single digits in percentage terms, growth was muted somewhat by weakness in demand for televisions, computer monitors and mobile computing products;
• A decrease in the Environmental Technologies segment of $39 million, driven by the translation impact from movements in foreign currency exchange rates versus the U.S. dollar, primarily the euro, of $57 million and lower sales of light duty diesel products in Europe, partially offset by higher volume for heavy-duty diesel and light-duty substrate products;
• A decrease of $98 million in the Specialty Materials segment, driven primarily by a decline in advanced optics sales; and
• A decrease of $41 million in the Life Sciences segment due to the impact of unfavorable movements in foreign exchange rates of $43 million.
An increase of $328 million in the Optical Communications segment slightly offset the decline in sales. The increase was driven by higher sales of enterprise network products, up $170 million, due to an acquisition completed in the first quarter of 2015 and an increase in data center products sales. Sales of carrier network products also increased by $158 million driven by growth in fiber-to-the-home products in North America and the impact of two small acquisitions completed in the first quarter of 2015.
In the year ended December 31, 2015, the translation impact of fluctuations in foreign currency exchange rates, primarily the Japanese yen and the euro, negatively affected Corning’s consolidated net sales in the amount of $663 million when compared to the same period in 2014.
Corning’s net sales in the year ended December 31, 2014 improved in all of our segments, increasing by $1,896 million to $9,715 million, when compared to the same period in 2013, driven by the following events:
• Display Technologies increased by $1.3 billion, due to the consolidation of Corning Precision Materials, which increased sales by $1.8 billion, and an increase in volume that was slightly more than 10% in percentage terms, partially offset by price declines in the mid-teens on a percentage basis and the negative impact of the Japanese yen versus the U.S. dollar exchange rate in the amount of $373 million;
• Optical Communications increased by $326 million, driven by an increase in sales of carrier network products in the amount of $254 million, largely due to growth in North America and Europe, the impact of a full year of sales from a small acquisition and the consolidation of an investment due to a change in control that occurred at the end of the second quarter of 2013, which added $53 million, and an increase of $72 million in enterprise network products. These increases were offset slightly by a $52 million decrease in optical fiber sales in China;
• An increase of $173 million in the Environmental Technologies segment, due mainly to an increase in demand for our heavy-duty diesel products, driven by new governmental regulations in Europe and China, and increased demand for Class 8 vehicles in North America. Automotive substrate sales were also strong, increasing 9%, due to increased demand in Europe and China;
• Specialty Materials improved by $35 million, driven by an increase in sales of advanced optics products. Corning Gorilla Glass sales remained consistent with the prior year, with volume increases offset by an unfavorable shift in product mix and price declines; and
• Life Sciences increased by $11 million, driven by growth in North America and China, up $12 million and $5 million, respectively.
In the year ended December 31, 2014, the translation impact of fluctuations in foreign currency exchange rates, primarily the Japanese yen, negatively affected Corning’s consolidated net sales in the amount of $347 million when compared to the same period in 2013.
In 2015, 2014 and 2013, sales in international markets accounted for 70%, 77% and 74%, respectively, of total net sales.
Cost of SalesThe types of expenses included in the cost of sales line item are: raw materials consumption, including direct and indirect materials; salaries, wages and benefits; depreciation and amortization; production utilities; production-related purchasing; warehousing (including receiving and inspection); repairs and maintenance; inter-location inventory transfer costs; production and warehousing facility property insurance; rent for production facilities; and other production overhead.
21CORNING INCORPORATED - 2015 Annual Report
Management’s Discussion and Analysis of Financial Condition and Results of Operations
Gross MarginIn the year ended December 31, 2015, gross margin dollars and gross margin as a percentage of net sales both declined when compared to the same period last year, declining $399 million and 2%, respectively. The negative impact of the depreciation of the Japanese yen versus the U.S. dollar in the amount of $368 million and price declines in the Display Technologies segment in the low teens in percentage terms drove the decrease, but were partially offset by cost reductions and the impact of several small acquisitions in the Optical Communications segment, improvements in manufacturing performance in the Display Technologies and Specialty Materials segments and lower acquisition-related and restructuring costs. Additionally, our Emerging Innovation Group and Corning Pharmaceutical Technologies business added $26 million in gross margin dollars in 2015, reflecting the growing significance of new business development.
For 2014, gross margin dollars increased by $728 million when compared to 2013, driven largely by the consolidation of Corning Precision Materials, combined with an increase of $102 million in the Environmental Technologies segment from higher volume and improved manufacturing efficiencies. Gross margin as a percentage of net sales decreased when compared to the same period last year, due primarily to the impact of the depreciation of the Japanese yen versus the U.S. dollar in the amount of $333 million, price declines in the mid-teens in percentage terms in our Display Technologies segment, higher pension expense of approximately $50 million and the impact of inventory builds in 2013 in the Optical Communications and Specialty Materials segments that did not repeat in 2014.
Selling, General and Administrative ExpensesIn the twelve months ended December 31, 2015, selling, general and administrative expenses increased by $312 million when compared to the same period in 2014, driven primarily by an increase of $133 million in our defined benefit pension plans mark-to-market loss, the absence of the positive impact of a contingent consideration fair value adjustment of $249 million recorded in 2014 and an increase in spending in the Optical Communications segment driven by several acquisitions completed in 2015. Offsetting these increases somewhat were a decrease in variable compensation, lower spending in the Display Technologies and Specialty Materials segments and a decline in acquisition-related and post-combination expenses, which were higher last year due to additional costs incurred related to the acquisition of the remaining equity interests of Samsung Corning Precision Materials. When compared to the same period last year, as a percentage of net sales, selling, general and administrative expenses increased driven by lower net sales in 2015.
Selling, general and administrative expenses for the year ended December 31, 2014 increased by $85 million when compared to 2013. The increase was largely driven by the consolidation of Corning Precision Materials, which added $90 million, an increase in pension expense of approximately $27 million, an increase of $38 million in share-based and performance-based compensation expenses and an increase of approximately $90 million in acquisition-related costs, including $72 million of post-combination compensation expense, offset somewhat by the positive impact of a contingent consideration fair value adjustment of $249 million. As a percentage of net sales, selling, general and administrative expenses were 12%, considerably lower than the same period in 2013, largely due to the contingent consideration fair value adjustment more than offsetting the increase in Selling, general and administrative expenses resulting from the acquisition of Samsung Corning Precision Materials.
The types of expenses included in the selling, general and administrative expenses line item are: salaries, wages and benefits; travel; professional fees; and depreciation and amortization, utilities, and rent for administrative facilities.
Research, Development and Engineering ExpensesFor the year ended December 31, 2015, research, development and engineering expenses decreased by $46 million when compared to the same period last year, driven by lower variable compensation and a decrease in the Display Technologies and Specialty Materials segments. As a percentage of net sales, research, development and engineering expenses remained consistent with the same period in 2014.
For the year ended December 31, 2014, research, development and engineering expenses increased by $105 million when compared to the same period last year, driven by the consolidation of Corning Precision Materials, which added $69 million, an increase of approximately $30 million in new business development spending and $20 million of additional pension expense. We continue to focus on new product development in areas such as glass substrates for high performance displays in our Display Technologies segment, wireless solutions for diverse venue applications in the Optical Communications segment and advancement of new product attributes for our Corning Gorilla Glass suite of products in our Specialty Materials segment. As a percentage of net sales, research, development and engineering expenses declined slightly, from 9% in 2013 to 8% in 2014, reflecting cost control measures implemented in 2014.
Restructuring, Impairment, and Other Charges Corning recorded restructuring, impairment, and other charges and credits in 2014 and 2013, which affect the comparability of our results for the periods presented. Additional information on restructuring and asset impairment is found in Note 2 (Restructuring, Impairment and Other Charges) to the Consolidated Financial Statements. A description of those charges and credits follows:
2015 ActivityFor the year ended December 31, 2015, we did not record significant restructuring, impairment and other charges or reversals. Cash expenditures for restructuring activities were $40 million.
2014 ActivityFor the year ended December 31, 2014, we recorded charges of $71 million for workforce reductions, asset disposals and write-offs, and exit costs for restructuring activities with total cash expenditures of approximately $39 million. Annualized savings from these actions are estimated to be approximately $94 million and will be reflected largely in selling, general and administrative expenses.
2013 ActivityTo better align our 2014 cost position in several of our businesses, Corning implemented a global restructuring plan within several of our segments in the fourth quarter of 2013, consisting of workforce reductions, asset disposals and write-offs, and exit costs. We recorded charges of $67 million, before tax, associated with these actions. Cash expenditures were approximately $35 million.

22 CORNING INCORPORATED - 2015 Annual Report
Management’s Discussion and Analysis of Financial Condition and Results of Operations
Equity in Earnings of Affiliated CompaniesThe following provides a summary of equity earnings of affiliated companies (in millions):
Years ended December 31,2015 2014 2013
Samsung Corning Precision Materials $ 320Dow Corning $ 281 $ 252 196All other 18 14 31Total equity earnings $ 299 $ 266 $ 547
Equity earnings of affiliated companies increased by $33 million in the twelve months ended December 31, 2015, when compared to the same period in 2014, reflecting the increase in equity earnings from Dow Corning.
Equity earnings of affiliated companies decreased by $281 million in the twelve months ended December 31, 2014, when compared to the same period in 2013, reflecting the acquisition and consolidation of Samsung Corning Precision Materials, offset somewhat by an increase in equity earnings from Dow Corning.
Dow CorningThe following table provides a summary of equity earnings from Dow Corning, by component (in millions):
Year ended December 31,2015 2014 2013
Silicones $ 160 $ 653 $ 166Polysilicon (Hemlock Semiconductor Group) 121 (401) 30Total Dow Corning $ 281 $ 252 $ 196
In May 1995, Dow Corning filed for bankruptcy protection to address pending and claimed liabilities arising from many thousands of breast implant product lawsuits. On June 1, 2004, Dow Corning emerged from Chapter 11 with a Plan of Reorganization (the “Plan”) which provided for the settlement or other resolution of implant claims. The Plan also includes releases for Corning and Dow Chemical as shareholders in exchange for contributions to the Plan.
Under the terms of the Plan, Dow Corning has established and is funding a Settlement Trust and a Litigation Facility to provide a means for tort claimants to settle or litigate their claims. Inclusive of insurance, Dow Corning has paid approximately $1.8 billion to the Settlement Trust. As of December 31, 2015, Dow Corning had recorded a reserve for breast implant litigation of $291 million. See Note 7 (Investments) to the Consolidated Financial Statements and Part II – Item 3. Legal Proceedings for additional detail.
On December 11, 2015, Corning announced its intention to exchange its 50% equity interest in Dow Corning Corporation for 100% of the stock of a newly formed entity that will become a wholly-owned subsidiary of Corning. The newly formed entity will hold approximately 40% ownership in Hemlock Semiconductor Group and approximately $4.8 billion in cash. Upon completion of this strategic realignment, which is expected to close during the first half of 2016, Dow Chemical, an equal owner of Dow Corning with Corning since 1943, will assume 100% ownership of Dow Corning.
2015 vs. 2014Equity earnings from Dow Corning increased by $29 million in the twelve months ended December 31, 2015, when compared to the same period in 2014, driven by the following items:
• A decrease in equity earnings from the silicones business of $493 million, driven by the following items:
– The absence of the gain resulting from the reduction of the Implant Liability in the amount of $393 million;
– The absence of $46 million of favorable tax adjustments recorded in 2014;
– The negative impact of the change in the mark-to-market of a derivative instrument in the amount of $56 million ($43 million loss in 2015 compared to $13 million gain in 2014); and
– Lower volume and unfavorable movements in foreign exchange rates.
• A significant increase in equity earnings from the polysilicon business in the amount of $522 million, driven by the absence of the $465 million charge for the abandonment of a polycrystalline silicon plant expansion recorded in 2014 and an increase in Corning’s share of settlements of long-term sales agreements in the amount of $40 million ($49 million in the first quarter of 2015 compared to $9 million in the first quarter of 2014), partially offset by lower volume.
2014 vs. 2013Equity earnings from Dow Corning increased by $56 million in the twelve months ended December 31, 2014, when compared to the same period in 2013, driven by the following items:
• An increase in equity earnings of $487 million in the silicones segment, driven by the gain resulting from the reduction of the Implant Liability in the amount of $393 million, favorable tax adjustments in the amount of $46 million and a decrease in tax expense, offset somewhat by a $5 million decrease in the amount of gains recorded on the mark-to-market of a derivative instrument; and
• A decrease in equity earnings of $431 million in the polysilicon segment, driven by Corning’s share of Dow Corning’s charge for the abandonment of a polycrystalline silicon plant expansion in the amount of $465 million, offset slightly by higher volume, the absence of $11 million in restructuring charges incurred in the first half of 2013, a gain in the amount of $6 million related to energy tax credits and the settlement of a long-term sales agreement in the first quarter of 2014 in the amount of $9 million.

23CORNING INCORPORATED - 2015 Annual Report
Management’s Discussion and Analysis of Financial Condition and Results of Operations
Foreign Currency Hedge Gain, Net Included in the line item Foreign currency hedge gain, net, is the impact of foreign currency hedges which hedge our translation exposure arising from movements in the Japanese yen, South Korean won and euro against the U.S. dollar and its impact on our net earnings, as well as other foreign
exchange hedges that limit exposures to foreign functional currency fluctuations. The following tables provide detailed information on the impact of our foreign currency hedge gains and losses:
Year ended December 31, 2015
Year ended December 31, 2014
Change 2015 vs. 2014
(in millions)Income before income taxes
Net income
Income before income taxes
Net income
Income before income taxes
Net income
Hedges related to translated earnings:Realized gains, net $ 653 $ 410 $ 274 $ 224 $ 379 $ 186 Unrealized (losses) gains (573) (362) 1,095 692 (1,668) (1,054)Total translated earnings contract gain 80 48 1,369 916 (1,289) (868)Foreign currency hedges, other 5 3 42 27 (37) (24)Foreign Currency Hedge Gain, Net $ 85 $ 51 $ 1,411 $ 943 $ (1,326) $ (892)
Year ended December 31, 2014
Year ended December 31, 2013
Change 2014 vs. 2013
(in millions)Income before income taxes
Net income
Income before income taxes
Net income
Income before income taxes
Net income
Hedges related to translated earnings:Realized gains, net $ 274 $ 224 $ 67 $ 55 $ 207 $ 169 Unrealized gains 1,095 692 368 232 727 460 Total translated earnings contract gain 1,369 916 435 287 934 629 Foreign currency hedges, other 42 27 187 118 (145) (91)Foreign Currency Hedge Gain, Net $ 1,411 $ 943 $ 622 $ 405 $ 789 $ 538
The gross notional value outstanding for our foreign currency hedges related to translated earnings at December 31, 2015 is $11.9 billion, and is comprised of the following: 1) Japanese yen-denominated hedges -
$8.3 billion; 2) South Korean won-denominated hedges - $3.3 billion; and 3) euro-denominated hedges - $345 million.
Income Before Income TaxesThe translation impact of fluctuations in foreign currency exchange rates negatively affected Corning’s Income before income taxes in the year ended December 31, 2015 in the amount of $388 million when compared
to 2014. This impact was partially offset by the increase in the realized gain from our foreign currency translation hedges related to translated earnings of $379 million.
Provision for Income TaxesOur provision for income taxes and the related effective income tax rates were as follows (dollars in millions):
Years ended December 31,2015 2014 2013
Provision for income taxes $ 147 $ 1,096 $ 512Effective tax rate 9.9% 30.7% 20.7%
The effective income tax rate for 2015 differed from the U.S. statutory rate of 35% primarily due to the following items:
• Rate differences on income (loss) of consolidated foreign companies, including the benefit of excess foreign tax credits resulting from the inclusion of high-taxed foreign earnings in U.S. income;
• The impact of equity in earnings of nonconsolidated affiliates reported in the financials, net of tax;
• $63 million tax expense for unrecognized tax benefit primarily for positions taken related to net transfer pricing adjustments (offset with benefit for competent authority relief); and
• $100 million tax benefit primarily related to change in judgment on the realizability of Germany and Japan deferred tax assets which is partially offset with tax expense from U.S. state and China deferred tax allowances increases.
The effective income tax rate for 2014 differed from the U.S. statutory rate of 35% primarily due to the following items:
• Rate differences on income (loss) of consolidated foreign companies, including the benefit of excess foreign tax credits resulting from the inclusion of high-taxed foreign earnings in U.S. income; and
• The impact of equity in earnings of nonconsolidated affiliates reported in the financials, net of tax.

24 CORNING INCORPORATED - 2015 Annual Report
Management’s Discussion and Analysis of Financial Condition and Results of Operations
Partially offsetting the benefits above is a $177 million charge attributable to a change in judgment on the realizability of certain foreign deferred tax assets in Germany and Japan.
Corning has valuation allowances on certain shorter-lived deferred tax assets such as those represented by capital loss and state tax net operating loss carryforwards, as well as other foreign net operating loss carryforwards, because we cannot conclude that it is more likely than not that we will earn income of the character or amount required to utilize these assets before they expire. The amount of U.S. and foreign deferred tax assets that have remaining valuation allowances at December 31, 2015 and 2014 was $238 million and $298 million, respectively.
Corning continues to indefinitely reinvest substantially all of its foreign earnings, with the exception of an immaterial amount of current earnings that have very low or no tax cost associated with their repatriation. Our current analysis indicates that we have sufficient U.S. liquidity, including borrowing capacity, to fund foreseeable U.S. cash needs without requiring the repatriation of foreign cash. One time or unusual items that may impact our ability or intent to keep our foreign earnings and cash indefinitely reinvested include significant U.S. acquisitions, stock repurchases, shareholder dividends, changes in tax laws, derivative
contract settlements or the development of tax planning ideas that allow us to repatriate earnings at minimal or no tax cost, and/or a change in our circumstances or economic conditions that negatively impact our ability to borrow or otherwise fund U.S. needs from existing U.S. sources. As of December 31, 2015, taxes have not been provided on approximately $11 billion of accumulated foreign unremitted earnings that are expected to remain invested indefinitely. While it remains impracticable to calculate the tax cost of repatriating our total unremitted foreign earnings, such cost could be material to the results of operations of Corning in a particular period.
Our foreign subsidiary in Taiwan operates under various tax holiday arrangements. The nature and extent of such arrangements vary, and the benefits of such arrangements phase out through 2018. The impact of the tax holidays on our effective rate is a reduction in the rate of 0.5, 0.4 and 1.2 percentage points for 2015, 2014 and 2013, respectively.
While we expect the amount of unrecognized tax benefits to change in the next 12 months, we do not expect the change to have a significant impact on the results of operations or our financial position.
Refer to Note 6 (Income Taxes) to the Consolidated Financial Statements for further details regarding income tax matters.
Net Income Attributable to Corning IncorporatedAs a result of the items discussed above, net income and per share data was as follows (in millions, except per share amounts):
Years ended December 31,2015 2014 2013
Net income attributable to Corning Incorporated $ 1,339 $ 2,472 $ 1,961Net income attributable to Corning Incorporated used in basic earnings per common share calculation(1) $ 1,241 $ 2,378 $ 1,961Net income attributable to Corning Incorporated used in diluted earnings per common share calculation(1) $ 1,339 $ 2,472 $ 1,961Basic earnings per common share $ 1.02 $ 1.82 $ 1.35Diluted earnings per common share $ 1.00 $ 1.73 $ 1.34Shares used in computing per share amounts
Basic earnings per common share 1,219 1,305 1,452Diluted earnings per common share 1,343 1,427 1,462
(1) Refer to Note 18 (Earnings per Common Share) to the Consolidated Financial Statements for additional information.
Comprehensive IncomeYears ended December 31,
(In millions) 2015 2014 2013Net income attributable to Corning Incorporated $ 1,339 $ 2,472 $ 1,961
Foreign currency translation adjustments and other (590) (1,073) (682)Net unrealized gains (losses) on investments 1 (1) 2 Unamortized gains (losses) and prior service (costs) credits for postretirement benefit plans 121 (281) 392 Net unrealized (losses) gains on designated hedges (36) 4 (24)
Other comprehensive loss, net of tax (Note 17) (504) (1,351) (312)Comprehensive income attributable to Corning Incorporated $ 835 $ 1,121 $ 1,649
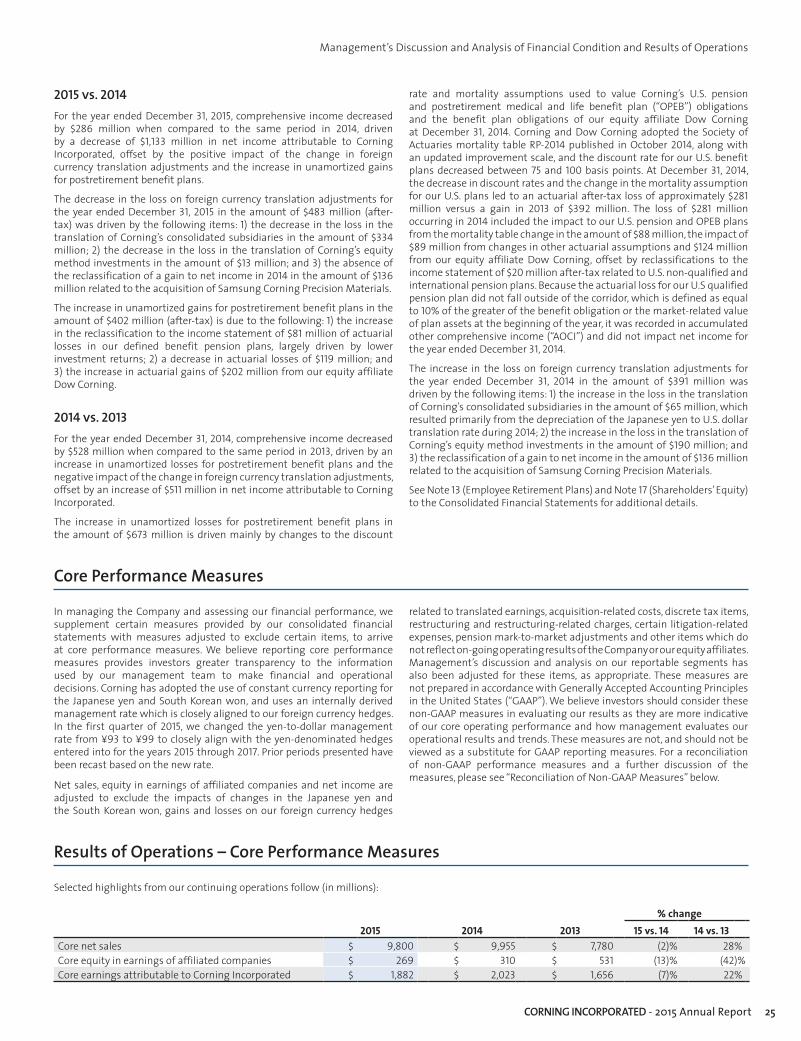
25CORNING INCORPORATED - 2015 Annual Report
Management’s Discussion and Analysis of Financial Condition and Results of Operations
2015 vs. 2014For the year ended December 31, 2015, comprehensive income decreased by $286 million when compared to the same period in 2014, driven by a decrease of $1,133 million in net income attributable to Corning Incorporated, offset by the positive impact of the change in foreign currency translation adjustments and the increase in unamortized gains for postretirement benefit plans.
The decrease in the loss on foreign currency translation adjustments for the year ended December 31, 2015 in the amount of $483 million (after-tax) was driven by the following items: 1) the decrease in the loss in the translation of Corning’s consolidated subsidiaries in the amount of $334 million; 2) the decrease in the loss in the translation of Corning’s equity method investments in the amount of $13 million; and 3) the absence of the reclassification of a gain to net income in 2014 in the amount of $136 million related to the acquisition of Samsung Corning Precision Materials.
The increase in unamortized gains for postretirement benefit plans in the amount of $402 million (after-tax) is due to the following: 1) the increase in the reclassification to the income statement of $81 million of actuarial losses in our defined benefit pension plans, largely driven by lower investment returns; 2) a decrease in actuarial losses of $119 million; and 3) the increase in actuarial gains of $202 million from our equity affiliate Dow Corning.
2014 vs. 2013For the year ended December 31, 2014, comprehensive income decreased by $528 million when compared to the same period in 2013, driven by an increase in unamortized losses for postretirement benefit plans and the negative impact of the change in foreign currency translation adjustments, offset by an increase of $511 million in net income attributable to Corning Incorporated.
The increase in unamortized losses for postretirement benefit plans in the amount of $673 million is driven mainly by changes to the discount
rate and mortality assumptions used to value Corning’s U.S. pension and postretirement medical and life benefit plan (“OPEB”) obligations and the benefit plan obligations of our equity affiliate Dow Corning at December 31, 2014. Corning and Dow Corning adopted the Society of Actuaries mortality table RP-2014 published in October 2014, along with an updated improvement scale, and the discount rate for our U.S. benefit plans decreased between 75 and 100 basis points. At December 31, 2014, the decrease in discount rates and the change in the mortality assumption for our U.S. plans led to an actuarial after-tax loss of approximately $281 million versus a gain in 2013 of $392 million. The loss of $281 million occurring in 2014 included the impact to our U.S. pension and OPEB plans from the mortality table change in the amount of $88 million, the impact of $89 million from changes in other actuarial assumptions and $124 million from our equity affiliate Dow Corning, offset by reclassifications to the income statement of $20 million after-tax related to U.S. non-qualified and international pension plans. Because the actuarial loss for our U.S qualified pension plan did not fall outside of the corridor, which is defined as equal to 10% of the greater of the benefit obligation or the market-related value of plan assets at the beginning of the year, it was recorded in accumulated other comprehensive income (“AOCI”) and did not impact net income for the year ended December 31, 2014.
The increase in the loss on foreign currency translation adjustments for the year ended December 31, 2014 in the amount of $391 million was driven by the following items: 1) the increase in the loss in the translation of Corning’s consolidated subsidiaries in the amount of $65 million, which resulted primarily from the depreciation of the Japanese yen to U.S. dollar translation rate during 2014; 2) the increase in the loss in the translation of Corning’s equity method investments in the amount of $190 million; and 3) the reclassification of a gain to net income in the amount of $136 million related to the acquisition of Samsung Corning Precision Materials.
See Note 13 (Employee Retirement Plans) and Note 17 (Shareholders’ Equity) to the Consolidated Financial Statements for additional details.
Core Performance Measures
In managing the Company and assessing our financial performance, we supplement certain measures provided by our consolidated financial statements with measures adjusted to exclude certain items, to arrive at core performance measures. We believe reporting core performance measures provides investors greater transparency to the information used by our management team to make financial and operational decisions. Corning has adopted the use of constant currency reporting for the Japanese yen and South Korean won, and uses an internally derived management rate which is closely aligned to our foreign currency hedges. In the first quarter of 2015, we changed the yen-to-dollar management rate from ¥93 to ¥99 to closely align with the yen-denominated hedges entered into for the years 2015 through 2017. Prior periods presented have been recast based on the new rate.
Net sales, equity in earnings of affiliated companies and net income are adjusted to exclude the impacts of changes in the Japanese yen and the South Korean won, gains and losses on our foreign currency hedges
related to translated earnings, acquisition-related costs, discrete tax items, restructuring and restructuring-related charges, certain litigation-related expenses, pension mark-to-market adjustments and other items which do not reflect on-going operating results of the Company or our equity affiliates. Management’s discussion and analysis on our reportable segments has also been adjusted for these items, as appropriate. These measures are not prepared in accordance with Generally Accepted Accounting Principles in the United States (“GAAP”). We believe investors should consider these non-GAAP measures in evaluating our results as they are more indicative of our core operating performance and how management evaluates our operational results and trends. These measures are not, and should not be viewed as a substitute for GAAP reporting measures. For a reconciliation of non-GAAP performance measures and a further discussion of the measures, please see “Reconciliation of Non-GAAP Measures” below.
Results of Operations – Core Performance Measures
Selected highlights from our continuing operations follow (in millions):
2015 2014 2013% change
15 vs. 14 14 vs. 13Core net sales $ 9,800 $ 9,955 $ 7,780 (2)% 28%Core equity in earnings of affiliated companies $ 269 $ 310 $ 531 (13)% (42)%Core earnings attributable to Corning Incorporated $ 1,882 $ 2,023 $ 1,656 (7)% 22%

26 CORNING INCORPORATED - 2015 Annual Report
Management’s Discussion and Analysis of Financial Condition and Results of Operations
Core Net SalesThe following table presents core net sales by reportable segment (in millions):
Year ended December 31,%
Change%
Change2015 2014 2013 15 vs. 14 14 vs. 13
Display Technologies $ 3,774 $ 4,092 $ 2,507 (8)% 63%Optical Communications 2,980 2,652 2,326 12% 14%Environmental Technologies 1,053 1,092 919 (4)% 19%Specialty Materials 1,107 1,205 1,170 (8)% 3%Life Sciences 821 862 851 (5)% 1%All Other 65 52 7 25% 643%Total core net sales $ 9,800 $ 9,955 $ 7,780 (2)% 28%
In all segments except Display Technologies, core net sales are consistent with GAAP net sales. Because a significant portion of revenues and manufacturing costs in the Display Technologies segment are denominated in Japanese yen, this segment is adjusted to remove the impact of translating yen into dollars. Presenting results on a constant-yen basis mitigates the translation impact of the Japanese yen, and allows management to evaluate performance period over period, analyze underlying trends in our businesses and establish operational goals and forecasts. As of January 1, 2015, we use an internally derived management rate of ¥99, which is closely aligned to our current yen-denominated hedges related to translated earnings, and have recast all periods presented based on this rate in order to effectively remove the impact of changes in the Japanese yen.
Core net sales decreased by $155 million to $9.8 billion in the year ended December 31, 2015 when compared to the same period in 2014. Driving the decline in core net sales are the following items:
• A decrease of $318 million in the Display Technologies segment, driven by price declines in the low-teens on a percentage basis. Although volume increased in the mid-single digits in percentage terms, growth was muted somewhat by weakness in demand for televisions, computer monitors and mobile computing products;
• A decrease in the Environmental Technologies segment of $39 million, driven by the translation impact from movements in foreign currency exchange rates versus the U.S. dollar, primarily the euro, of $57 million and lower sales of light duty diesel products in Europe, partially offset by higher volume for heavy duty diesel and light duty substrate products;
• A decrease of $98 million in the Specialty Materials segment, driven primarily by a decline in advanced optics sales; and
• A decrease of $41 million in the Life Sciences segment due to the impact of unfavorable movements in foreign exchange rates of $43 million.
An increase of $328 million in the Optical Communications segment slightly offset the decline in sales. The increase was driven by higher sales of enterprise network products, up $170 million, due to an acquisition completed in the first quarter of 2015 and an increase in data center products sales. Sales of carrier network products also increased, up $158 million, driven by growth in fiber-to-the-home products in North America and the impact of two small acquisitions completed in the first quarter of 2015.
Corning’s core net sales in the year ended December 31, 2014 improved in all of our segments, increasing by $2,175 million to $9,955 million, when compared to the same period in 2013. Driving the growth in core net sales are the following items:
• Display Technologies increased by $1,585 million, due to the consolidation of Corning Precision Materials and an increase in volume that was slightly more than 10% in percentage terms, offset somewhat by price declines in the mid-teens;
• Optical Communications increased by $326 million, driven by an increase in sales of carrier network products in the amount of $254 million, largely due to growth in North America and Europe, the impact of a full year of sales from a small acquisition and the consolidation of an investment due to a change in control that occurred at the end of the second quarter of 2013, which added $53 million, and an increase of $72 million in enterprise network products. These increases were offset slightly by a $52 million decrease in optical fiber sales in China;
• An increase of $173 million in the Environmental Technologies segment, due mainly to an increase in demand for our heavy duty diesel products, driven by new governmental regulations in Europe and China, and increased demand for Class 8 vehicles in North America. Automotive substrate sales were also strong, increasing 9%, on increased demand in Europe and China;
• Specialty Materials improved by $35 million, driven by an increase in sales of advanced optics products. Corning Gorilla Glass sales remained consistent with the prior year, with volume increases offset by an unfavorable shift in product mix and price declines; and
• Life Sciences increased by $11 million, driven by growth in North America and China, up $12 million and $5 million, respectively.
The translation impact from movements in foreign currency exchange rates in the years ended December 31, 2015 and 2014, excluding the Japanese yen and South Korean won, negatively affected core net sales in the amount of $215 million and $68 million, respectively, when compared to the prior years.

27CORNING INCORPORATED - 2015 Annual Report
Management’s Discussion and Analysis of Financial Condition and Results of Operations
Core Equity in Earnings of Affiliated CompaniesThe following provides a summary of core equity in earnings of affiliated companies (in millions):
2015 2014 2013% change
15 vs. 14 14 vs. 13Samsung Corning Precision Materials $ 356Dow Corning* $ 245 $ 287 145 (15)% 98%All other 24 23 30 4% (23)%Total core equity earnings $ 269 $ 310 $ 531 (13)% (42)%
* In 2013, we excluded the operating results of Dow Corning’s consolidated subsidiary Hemlock Semiconductor, a producer of polycrystalline silicon, to remove the impact of the severe unpredictability and instability in the polysilicon market.
Core equity earnings of affiliated companies decreased by $41 million in the twelve months ended December 31, 2015, when compared to the same period in 2014, reflecting the decrease in equity earnings from Dow Corning.
Core equity earnings of affiliated companies decreased by $221 million in the twelve months ended December 31, 2014, when compared to the twelve months ended December 31, 2013, reflecting the acquisition and consolidation of Samsung Corning Precision Materials, offset somewhat by an increase in equity earnings from Dow Corning.
Dow CorningThe following table provides a summary of core equity earnings from Dow Corning, by component (in millions):
Year ended December 31,2015 2014 2013
Silicones $ 176 $ 197 $ 145Polysilicon (Hemlock Semiconductor Group) 69 90 31Total Dow Corning $ 245 $ 287 $ 176
The following table reconciles the non-GAAP financial measure of equity earnings from Dow Corning to its most directly comparable GAAP financial measure:
2015 2014 2013As reported $ 281 $ 252 $ 196Hemlock Semiconductor operating results(8) (31)Hemlock Semiconductor non-operating results(8) (1)Equity in earnings of affiliated companies(8) (36) 35 (19)Core Performance measures $ 245 $ 287 $ 145
See Reconciliation of Non-GAAP Measures – Items Excluded from GAAP Measures below for the descriptions of the footnoted reconciling items.
2015 vs. 2014Core equity earnings from Dow Corning decreased by $42 million, or 15%, in the year ended December 31, 2015, when compared to the same period last year, due to lower volume and unfavorable movements in foreign exchange rates and the devaluation of the Chinese yuan.
2014 vs. 2013Core equity earnings from Dow Corning increased in the twelve months ended December 31, 2014, when compared to the same period in 2013, driven by higher earnings in both the silicones and polysilicon segments. Driving the increase was a decrease in tax expense in the silicones segment and higher volume and improved manufacturing performance in the polysilicon segment.
Core Earnings
2015 vs. 2014In the year ended December 31, 2015, we generated core earnings of $1,882 million or $1.40 per share, compared to $2,023 million or $1.42 per share in the year ended December 31, 2014. The decrease was due to lower core earnings in the Display Technologies, Environmental Technologies, Specialty Materials and Life Sciences segments, and the unfavorable translation impact from movements in foreign currency exchange rates, excluding the Japanese yen and South Korean won, of $57 million. Slightly offsetting the decline is higher core earnings in the Optical Communications segment, up $61 million, driven by higher sales volume for both carrier network and enterprise network products, the favorable impact of several acquisitions completed this year and manufacturing efficiencies gained through cost reductions.

28 CORNING INCORPORATED - 2015 Annual Report
Management’s Discussion and Analysis of Financial Condition and Results of Operations
2014 vs. 2013When compared to the same period in the prior year, core earnings increased in the twelve months ended December 31, 2014 by $367 million, or 22%, to $2,023 million, driven by the following items (amounts presented after-tax):
• The impact of the consolidation of Corning Precision Materials and the resulting cost reductions and efficiencies gained through synergies;
• An increase in core equity earnings from Dow Corning, driven by a decrease in tax expense, improved manufacturing efficiency and an increase in volume;
• An increase of $58 million in the Environmental Technologies segment, driven by an increase in demand for our diesel products and improved manufacturing efficiency; and
• An increase of $34 million in the Optical Communications segment, driven by higher sales of carrier network and enterprise network products.
The increase in core earnings for the year ended December 31, 2014 was offset somewhat by price declines in the mid-teens in percentage terms outpacing an increase in volume slightly higher than 10% in our Display Technologies segment.
Included in core earnings for the years ended December 31, 2015, 2014 and 2013 is net periodic pension expense in the amount of $62 million, $74 million and $37 million, respectively, which excludes the annual pension mark-to-market adjustments. In the years ended December 31, 2015, 2014 and 2013, the mark-to-market adjustments were a pre-tax loss of $165 million, a pre-tax loss of $29 million and a pre-tax gain of $30 million, respectively. Refer to Note 13 (Employee Retirement Plans) to the Consolidated Financial Statements for additional information.
Core Earnings per Common ShareThe following table sets forth the computation of core basic and core diluted earnings per common share (in millions, except per share amounts):
2015 2014 2013Core earnings attributable to Corning Incorporated $ 1,882 $ 2,023 $ 1,656Less: Series A convertible preferred stock dividend 98 94Core earnings available to common stockholders - basic 1,784 1,929 1,656Add: Series A convertible preferred stock dividend 98 94Core earnings available to common stockholders - diluted $ 1,882 $ 2,023 $ 1,656Weighted-average common shares outstanding - basic 1,219 1,305 1,452Effect of dilutive securities:
Stock options and other dilutive securities 9 12 10Series A convertible preferred stock 115 110
Weighted-average common shares outstanding - diluted 1,343 1,427 1,462Core basic earnings per common share $ 1.46 $ 1.48 $ 1.14Core diluted earnings per common share $ 1.40 $ 1.42 $ 1.13
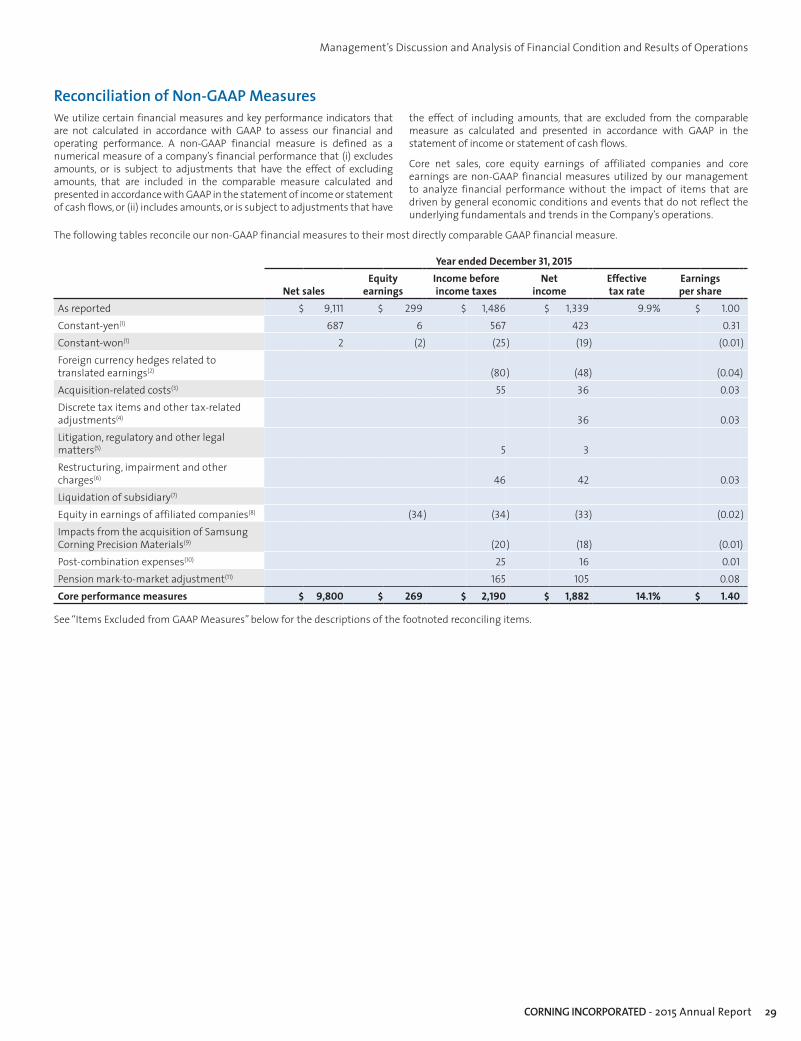
29CORNING INCORPORATED - 2015 Annual Report
Management’s Discussion and Analysis of Financial Condition and Results of Operations
Reconciliation of Non-GAAP MeasuresWe utilize certain financial measures and key performance indicators that are not calculated in accordance with GAAP to assess our financial and operating performance. A non-GAAP financial measure is defined as a numerical measure of a company’s financial performance that (i) excludes amounts, or is subject to adjustments that have the effect of excluding amounts, that are included in the comparable measure calculated and presented in accordance with GAAP in the statement of income or statement of cash flows, or (ii) includes amounts, or is subject to adjustments that have
the effect of including amounts, that are excluded from the comparable measure as calculated and presented in accordance with GAAP in the statement of income or statement of cash flows.
Core net sales, core equity earnings of affiliated companies and core earnings are non-GAAP financial measures utilized by our management to analyze financial performance without the impact of items that are driven by general economic conditions and events that do not reflect the underlying fundamentals and trends in the Company’s operations.
The following tables reconcile our non-GAAP financial measures to their most directly comparable GAAP financial measure.
Year ended December 31, 2015
Net salesEquity
earningsIncome before income taxes
Net income
Effective tax rate
Earnings per share
As reported $ 9,111 $ 299 $ 1,486 $ 1,339 9.9% $ 1.00 Constant-yen(1) 687 6 567 423 0.31 Constant-won(1) 2 (2) (25) (19) (0.01)Foreign currency hedges related to translated earnings(2) (80) (48) (0.04)Acquisition-related costs(3) 55 36 0.03 Discrete tax items and other tax-related adjustments(4) 36 0.03 Litigation, regulatory and other legal matters(5) 5 3 Restructuring, impairment and other charges(6) 46 42 0.03 Liquidation of subsidiary(7)
Equity in earnings of affiliated companies(8) (34) (34) (33) (0.02)Impacts from the acquisition of Samsung Corning Precision Materials(9) (20) (18) (0.01)Post-combination expenses(10) 25 16 0.01 Pension mark-to-market adjustment(11) 165 105 0.08Core performance measures $ 9,800 $ 269 $ 2,190 $ 1,882 14.1% $ 1.40
See “Items Excluded from GAAP Measures” below for the descriptions of the footnoted reconciling items.

30 CORNING INCORPORATED - 2015 Annual Report
Management’s Discussion and Analysis of Financial Condition and Results of Operations
Year ended December 31, 2014
Net salesEquity
earningsIncome before income taxes
Net income
Effective tax rate
Earnings per share
As reported $ 9,715 $ 266 $ 3,568 $ 2,472 30.7% $ 1.73 Constant-yen(1)* 240 1 197 144 0.10 Constant-won(1) 37 26 0.02 Foreign currency hedges related to translated earnings(2) (1,369) (916) (0.64)Acquisition-related costs(3) 74 57 0.04 Discrete tax items and other tax-related adjustments(4) 240 0.17 Litigation, regulatory and other legal matters(5) (1) (2)Restructuring, impairment and other charges(6) 86 66 0.05 Liquidation of subsidiary(7) (3)Equity in earnings of affiliated companies(8) 43 43 38 0.03 Gain on previously held equity investment(9) (394) (292) (0.20)Settlement of pre-existing contract(9) 320 320 0.22 Contingent consideration fair value adjustment(9) (249) (194) (0.14)Post-combination expenses(9) 72 55 0.04 Impacts from the acquisition of Samsung Corning Precision Materials(9) (9) (12) (0.01)Pension mark-to-market adjustment(11) 29 24 0.02 Core performance measures $ 9,955 $ 310 $ 2,404 $ 2,023 15.8% $ 1.42
* In the first quarter of 2015, we changed the yen-to-dollar management rate from ¥93 to ¥99 to closely align with the yen-denominated hedges entered into for the years 2015 through 2017. Prior periods presented have been recast based on the new rate.
See “Items Excluded from GAAP Measures” below for the descriptions of the footnoted reconciling items.

31CORNING INCORPORATED - 2015 Annual Report
Management’s Discussion and Analysis of Financial Condition and Results of Operations
Year ended December 31, 2013
(in millions) Net salesEquity
earningsIncome before income taxes
Net income
Effective tax rate Per share
As reported $ 7,819 $ 547 $ 2,473 $ 1,961 20.7% $ 1.34 Constant-yen(1)* (39) (28) (53) (45) (0.03)Foreign currency hedges related to translated earnings(2) (435) (287) (0.20)Other yen-related transactions(2) (99) (69) (0.05)Acquisition-related costs(3) 54 40 0.03 Discrete tax items and other tax-related adjustments(4) 9 0.01 Litigation, regulatory and other legal matters(5) 19 13 0.01 Restructuring, impairment and other charges(6) 67 46 0.03 Equity in earnings of affiliated companies(8) 42 42 44 0.02 Hemlock Semiconductor operating results(8) (31) (31) (30) (0.02)Hemlock Semiconductor non-operating results(8) 1 1 1 Pension mark-to-market adjustment(11) (30) (17) (0.01)Gain on change in control of equity investment(12) (17) (12) (0.01)Other 4 2 Core performance measures $ 7,780 $ 531 $ 1,995 $ 1,656 17.0% $ 1.13
* In the first quarter of 2015, we changed the yen-to-dollar management rate from ¥93 to ¥99 to closely align with the yen-denominated hedges entered into for the years 2015 through 2017. Prior periods presented have been recast based on the new rate.
See “Items Excluded from GAAP Measures” below for the descriptions of the footnoted reconciling items.
Items which we exclude from GAAP measures to arrive at Core performance measures are as follows:
(1) Constant-currency adjustments:
Constant-yen: Because a significant portion of Display Technologies segment revenues and manufacturing costs are denominated in Japanese yen, management believes it is important to understand the impact on core earnings of translating yen into dollars. Presenting results on a constant-yen basis mitigates the translation impact of the Japanese yen, and allows management to evaluate performance period over period, analyze underlying trends in our businesses, and establish operational goals and forecasts. As of January 1, 2015, we used an internally derived management rate of ¥99, which is closely aligned to our current yen portfolio of foreign currency hedges, and have recast all periods presented based on this rate in order to effectively remove the impact of changes in the Japanese yen.
Constant-won: Following the acquisition of Samsung Corning Precision Materials and because a significant portion of Corning Precision Materials’ costs are denominated in South Korean won, management believes it is important to understand the impact on core earnings from translating won into dollars. Presenting results on a constant-won basis mitigates the translation impact of the South Korean won, and allows management to evaluate performance period over period, analyze underlying trends in our businesses, and establish operational goals and forecasts without the variability caused by the fluctuations caused by changes in the rate of this currency. We use an internally derived management rate of 1,100, which is consistent with historical prior period averages of the won.
(2) Foreign currency hedges related to translated earnings: We have excluded the impact of the gains and losses of our foreign currency hedges related to translated earnings for each period presented.
(3) Acquisition-related costs: These expenses include intangible amortization, inventory valuation adjustments and external acquisition-related deal costs.
(4) Discrete tax items and other tax-related adjustments: This represents the removal of discrete adjustments attributable to changes in tax law and changes in judgment about the realizability of certain deferred tax assets, as well as other non-operational tax-related adjustments, including the tax effect of transfer pricing out-of-period adjustments in 2014 and 2015.
(5) Litigation, regulatory and other legal matters: Includes amounts related to the Pittsburgh Corning Corporation (PCC) asbestos litigation, adjustments to our estimated liability for environmental-related items and other legal matters.
(6) Restructuring, impairment and other charges: This amount includes restructuring, impairment and other charges, including goodwill impairment charges and other expenses and disposal costs not classified as restructuring expense.
32 CORNING INCORPORATED - 2015 Annual Report
Management’s Discussion and Analysis of Financial Condition and Results of Operations
(7) Liquidation of subsidiary: The partial impact of non-restructuring related items due to the decision to liquidate a consolidated subsidiary that is not significant.
(8) Equity in earnings of affiliated companies: These adjustments relate to items which do not reflect expected on-going operating results of our affiliated companies, such as restructuring, impairment and other charges and settlements under “take-or-pay” contracts. In 2013, we excluded the operating results of Dow Corning’s consolidated subsidiary Hemlock Semiconductor, a producer of polycrystalline silicon, to remove the impact of the severe unpredictability and instability in the polysilicon market.
(9) Impacts from the acquisition of Samsung Corning Precision Materials: Pre-acquisition gains and losses on previously held equity investment and other gains and losses related to the acquisition, including post-combination expenses, fair value adjustments to the indemnity asset related to contingent consideration and the impact of the withholding tax on a dividend from Samsung Corning Precision Materials.
(10) Post-combination expenses: Post-combination expenses incurred as a result of an acquisition in the first quarter of 2015.
(11) Pension mark-to-market adjustment: Mark-to-market pension gains and losses, which arise from changes in actuarial assumptions and the difference between actual and expected returns on plan assets and discount rates.
(12) Gain on change in control of equity investment: Gain as a result of certain changes to the shareholder agreement of an equity company, resulting in Corning having a controlling interest that requires consolidation of this investment.
Reportable Segments
Our reportable segments are as follows:
• Display Technologies – manufactures glass substrates for flat panel liquid crystal displays.
• Optical Communications – manufactures carrier network and enterprise network components for the telecommunications industry.
• Environmental Technologies – manufactures ceramic substrates and filters for automotive and diesel applications.
• Specialty Materials – manufactures products that provide more than 150 material formulations for glass, glass ceramics and fluoride crystals to meet demand for unique customer needs.
• Life Sciences – manufactures glass and plastic labware, equipment, media and reagents to provide workflow solutions for scientific applications.
All other segments that do not meet the quantitative threshold for separate reporting have been grouped as “All Other.” This group is primarily comprised of the results of Corning’s Pharmaceutical Technologies business, which consists of a pharmaceutical glass business and a glass tubing business used in the pharmaceutical packaging industry. This segment also includes Corning Precision Materials’ non-LCD business and new product lines and development projects such as laser technologies, advanced flow reactors and adjacency businesses in pursuit of thin, strong glass, as well as certain corporate investments such as Eurokera and Keraglass equity affiliates.
We prepared the financial results for our reportable segments on a basis that is consistent with the manner in which we internally disaggregate financial information to assist in making internal operating decisions. We included the earnings of equity affiliates that are closely associated with our reportable segments in the respective segment’s net income. We have allocated certain common expenses among our reportable segments differently than we would for stand-alone financial information prepared in accordance with U.S. GAAP. The Display Technologies, Optical Communications, Environmental Technologies, Specialty Materials and Life Sciences segments include non-GAAP measures which are not prepared in accordance with GAAP. We believe investors should consider these non-GAAP measures in evaluating our results as they are more indicative of our core operating performance and with how management evaluates our operational results and trends. These measures are not, and should not be viewed as a substitute for GAAP reporting measures. For a reconciliation of non-GAAP performance measures to the most directly comparable GAAP financial measure, please see “Reconciliation of non-GAAP Measures” above. Segment net income may not be consistent with measures used by other companies. The accounting policies of our reportable segments are the same as those applied in the Consolidated Financial Statements.

33CORNING INCORPORATED - 2015 Annual Report
Management’s Discussion and Analysis of Financial Condition and Results of Operations
Display TechnologiesThe following table provides net sales and net income for the Display Technologies segment and reconciles the non-GAAP financial measures for the Display Technologies segment with our financial statements presented in accordance with GAAP (in millions):
Year ended December 31, 2015 Year ended December 31, 2014 Year ended December 31, 2013
(in millions) SalesNet
income SalesNet
income SalesNet
incomeAs reported $ 3,086 $ 1,095 $ 3,851 $ 1,396 $ 2,545 $ 1,293 Constant-yen(1)* 686 419 240 142 (38) (47)Constant-won(1) 2 (17) 27 Foreign currency hedges related to translated earnings(2) (416) (290) (90)Other yen-related transactions(2) (67)Acquisition-related costs(3) 37 8 Discrete tax items and other tax-related adjustments(4) 4 10 Restructuring, impairment and other charges(6) 40 6 Equity in earnings of affiliated companies(8) 6 28 Impacts from the acquisition of Samsung Corning Precision Materials(9) (10) 1 (121)Pension mark-to-market adjustment(11) 4 2 (8)Core performance measures $ 3,774 $ 1,075 $ 4,092 $ 1,243 $ 2,507 $ 1,133
* In the first quarter of 2015, we changed the yen-to-dollar management rate from ¥93 to ¥99 to closely align with the yen-denominated hedges entered into for the years 2015 through 2017. Prior periods presented have been recast based on the new rate.
See “Items Excluded from GAAP Measures” above for the descriptions of the footnoted reconciling items.
As Reported
2015 vs. 2014When compared to the same period in 2014, the decrease in net sales of $765 million, or 20%, in the year ended December 31, 2015 was driven by price declines in the low-teens in percentage terms and the depreciation of the Japanese yen versus the U.S. dollar, which adversely impacted net sales in the amount of $446 million. Sequentially, fourth quarter LCD glass price declines were the lowest sequential decline of 2015. Although volume increased in the mid-single digits in percentage terms, growth was muted somewhat by weakness in demand for televisions, computer monitors and mobile computing products. Additionally, in the third quarter of 2015, we experienced temporary share loss at one of our largest customers due to a contract dispute. We resolved the dispute in the fourth quarter of 2015, and extended our long-term supply agreement with this customer to 2025.
Net income in the Display Technologies segment decreased by $301 million, or 22%, in the year ended December 31, 2015, when compared to the same period last year. This decrease was driven by the following items:
• The impact of price declines in the low-teens in percentage terms that more than offset the mid-single digit percent increase in volume;
• A decrease of $184 million in the gain on the fair value adjustment of the contingent consideration resulting from the acquisition of Corning Precision Materials; and
• The absence of a gain on the settlement of an intellectual property dispute recorded in 2014 in the amount of $38 million.
The decrease in net income was partially offset by the following items:
• Improvements in manufacturing efficiency of $79 million;
• A decline in transaction and acquisition-related costs in the amounts of $73 million and $37 million, respectively;
• A decrease of $40 million in restructuring, impairment and other charges; and
• A decline in operating expenses.
The translation impact of fluctuations in foreign currency exchange rates negatively impacted Display Technologies net income in the year ended December 31, 2015 in the amount of $233 million when compared to the same period in 2014. This impact was partially offset by the increase in the realized gain from our foreign currency hedges related to translated earnings in the amount of $126 million.
2014 vs. 2013When compared to the same period last year, the increase of $1,306 million in net sales in the year ended December 31, 2014, was due to the acquisition of the remaining equity interests of our affiliate Samsung Corning Precision Materials, and the consolidation of this entity, which added $1.8 billion in net sales. This impact was somewhat offset by price declines in the mid-teens in percentage terms, which more than offset an increase in volume that was slightly more than 10% in percentage terms, and the depreciation of the Japanese yen versus the U.S. dollar, which adversely impacted net sales by $373 million.
Net income in the Display Technologies segment increased by $103 million, or 8%, in the year ended December 31, 2014, when compared to the same period last year. This increase was driven by the following items:
• The impact of the acquisition of Corning Precision Materials and the resulting cost reductions gained through synergies;
• The fair value adjustment of the contingent consideration resulting from the acquisition of Corning Precision Materials in the amount of $194 million; and
• Improvements in manufacturing efficiency of $46 million.
The increase in net income was partially offset by the following items:
• The impact of price declines in the mid-teens in percentage terms that more than offset the increase in volume;

34 CORNING INCORPORATED - 2015 Annual Report
Management’s Discussion and Analysis of Financial Condition and Results of Operations
• The absence of the $67 million gain from our yen-denominated cash flow hedging program;
• The increase in transaction and acquisition-related costs related to the acquisition of Corning Precision Materials in the amounts of $73 million and $29 million, respectively; and
• An increase of $34 million in restructuring, impairment and other charges.
Core Performance
2015 vs. 2014When compared to the same period in 2014, core net sales in the Display Technologies segment decreased by $318 million, or 8%, in the year ended December 31, 2015, driven primarily by price declines in the low-teens in percentage terms. Sequentially, LCD glass price declines in the fourth quarter remained moderate. Although volume increased in the mid-single digits in percentage terms, growth was muted somewhat by weakness in demand for televisions, computer monitors and mobile computing products. Additionally, in the third quarter of 2015, we experienced temporary share loss at one of our largest customers due to a contract dispute. We resolved the dispute in the fourth quarter of 2015, and extended our long-term supply agreement with this customer to 2025.
Core earnings in the Display Technologies segment in the year ended December 31, 2015 declined by $168 million, or 14%, when compared to the same period last year. Volume increases in the mid-single digits in percentage terms, lower manufacturing costs and a decline in operating expenses were more than offset by price declines in the low-teens and the absence of a gain on the settlement of an intellectual property dispute recorded in 2014 in the amount of $38 million.
2014 vs. 2013When compared to the same period last year, the increase in core net sales of $1,585 million, or 63%, in the year ended December 31, 2014, was due to the acquisition of the remaining equity interests of our affiliate Samsung Corning Precision Materials, and the consolidation of this entity, which added $1.9 billion in net sales. This impact was somewhat offset by price declines in the mid-teens in percentage terms, which more than offset an increase in volume that was slightly more than 10% in percentage terms. Core earnings in the Display Technologies segment increased by $110 million, or 10%, in the year ended December 31, 2014, when compared to the same period last year. The increase was driven by the positive impact of the acquisition of Corning Precision Materials and the resulting cost reductions gained through synergies, coupled with improvements in manufacturing efficiency of $46 million, partially offset by the impact of price declines in the mid-teens in percentage terms that more than offset the increase in volume.
Other InformationThe Display Technologies segment has a concentrated customer base comprised of LCD panel and color filter makers primarily located in Japan, South Korea, China and Taiwan. In 2015, three customers of the Display Technologies segment, which individually accounted for more than 10% of segment net sales, accounted for a combined 62% of total segment sales. In 2014, three customers of the Display Technologies segment, which individually accounted for more than 10% of segment net sales, accounted for a combined 61% of total segment sales. In 2013, four customers of the Display Technologies segment, which individually accounted for more than 10% of segment net sales, accounted for a combined 94% of total segment sales. Our customers face the same global economic dynamics as we do in this market. Our near-term sales and profitability would be impacted if any of these significant customers were unable to continue to purchase our products.
In addition, prior to consolidation, Samsung Corning Precision Materials’ sales were concentrated across a small number of its customers. In 2013, sales to two LCD panel makers located in South Korea accounted for approximately 93% of Samsung Corning Precision Materials sales.
Corning has invested to expand capacity to meet the projected demand for LCD glass substrates. In 2015, 2014 and 2013, capital spending in this segment was $594 million, $492 million and $350 million, respectively. We expect capital spending for 2016 to be approximately $600 million.
2016 Outlook:In the first quarter of 2016, Corning anticipates that panel maker utilization will continue to decline, which will reduce inventory levels in the supply chain. As a result, the overall glass market and Corning’s LCD glass volume are expected to decline by a mid-to-high single-digit percentage sequentially. Corning’s LCD glass price decline is expected to be moderate, achieving what will be one of the lowest first-quarter declines in five years.
For the full year, Corning expects moderate sequential price declines to continue, and for its glass volume to grow by a mid-single-digit percentage year over year, in line with total glass demand growth. Corning expects global television unit sales will grow by a low single-digit percentage, and the average screen size will increase by at least 1.5 inches. The company expects panel maker utilization to increase as the year progresses, and retail LCD glass area demand to be up by a high single-digit percentage in 2016.

35CORNING INCORPORATED - 2015 Annual Report
Management’s Discussion and Analysis of Financial Condition and Results of Operations
Optical CommunicationsThe following table provides net sales and net income for the Optical Communications segment and reconciles the non-GAAP financial measures for the Optical Communications segment with our financial statements presented in accordance with GAAP (in millions):
Year ended December 31, 2015
Year ended December 31, 2014
Year ended December 31, 2013
(in millions) SalesNet
income SalesNet
income SalesNet
incomeAs reported $ 2,980 $ 237 $ 2,652 $ 194 $ 2,326 $ 189 Acquisition-related costs(3) 16 (2) 9 Litigation, regulatory and other legal matters(5) 13 Restructuring, impairment and other charges(6) (1) 17 8 Liquidation of subsidiary(7) (2)Post-combination expenses(10) 16 Pension mark-to-market adjustment(11) 13 (9)Gain on change in control of equity investment(12) (11)Core performance measures $ 2,980 $ 281 $ 2,652 $ 220 $ 2,326 $ 186
See “Items Excluded from GAAP Measures” above for the descriptions of the footnoted items.
As Reported
2015 vs. 2014In the year ended December 31, 2015, net sales of the Optical Communications segment increased by $328 million, or 12%, when compared to the same period in 2014, driven by an increase in both carrier network and enterprise network products. Carrier networks increased by $158 million, driven by higher sales of fiber-to-the-home and cable products in North America and the impact of recent acquisitions, offset somewhat by lower sales of wireless products and fiber and cable products in Europe. Sales declined in Europe driven by lower volume and the negative impact of movements in the euro exchange rate versus the U.S. dollar. Enterprise network sales grew by $170 million, primarily due to the impact of an acquisition completed in 2015 and an increase in data center product sales. The translation impact from movements in foreign currency exchange rates in 2015 negatively impacted Optical Communications net sales in the amount of $101 million, when compared to the same period in 2014.
The increase in net income of $43 million, or 22%, was primarily driven by higher sales volume for both carrier network and enterprise network products and manufacturing efficiencies gained through cost reductions, offset somewhat by acquisition-related and post-combination expenses associated with three acquisitions completed in the first quarter of 2015. Also somewhat offsetting the increase were price declines and a small legal settlement. The translation impact from movements in foreign currency exchange rates did not significantly impact net income of this segment in the year ended December 31, 2015 when compared to the same period in 2014.
2014 vs. 2013In the twelve months ended December 31, 2014, net sales of the Optical Communications segment increased by $326 million, or 14%, when compared to the same period in 2013, driven by a $254 million increase in sales of our carrier network products. Specifically, the following items impacted sales within the carrier network products group in the year ended December 31, 2014:
• Higher sales of cable and hardware and equipment products primarily used in fiber-to-the-home solutions in North America and Europe, up $113 million and $46 million, respectively;
• The impact of a full year of sales from a small acquisition and the consolidation of an investment due to a change in control which occurred at the end of the second quarter of 2013, which added approximately $53 million; and
• An increase of $11 million in sales of optical fiber, driven by higher sales in North America and Europe, partially offset by a decrease in China.
Sales of enterprise network products also increased in the twelve months ended December 31, 2014, up $72 million, when compared to the same period in 2013, due to strong sales in all regions of the world, led by an increase in sales of data center and LAN products in Europe and North America, up $21 million and $20 million, respectively, and an increase of $16 million in wireless products sales. The translation impact from movements in foreign currency exchange rates in 2014 negatively impacted Optical Communications net sales in the amount of $64 million, when compared to the same period in 2013.
Net income increased by $5 million, or 3%, in 2014, when compared to 2013. The significant increase in volume for carrier network products in North America and Europe and an increase in worldwide enterprise network product volume were somewhat offset by price declines in fiber and cable products, $17 million of additional operating expenses driven by two small acquisitions and the absence of the inventory build we experienced in the first half of 2013. An increase in restructuring charges of $9 million, an increase of $22 million in the amount of the pension mark-to-market adjustment and the absence of the $11 million gain on change in control of an equity company that occurred in the second quarter of 2013 also negatively impacted the results of this segment.
The translation impact from movements in foreign currency exchange rates did not significantly impact net income of this segment in the year ended December 31, 2014 when compared to the same period in 2013.
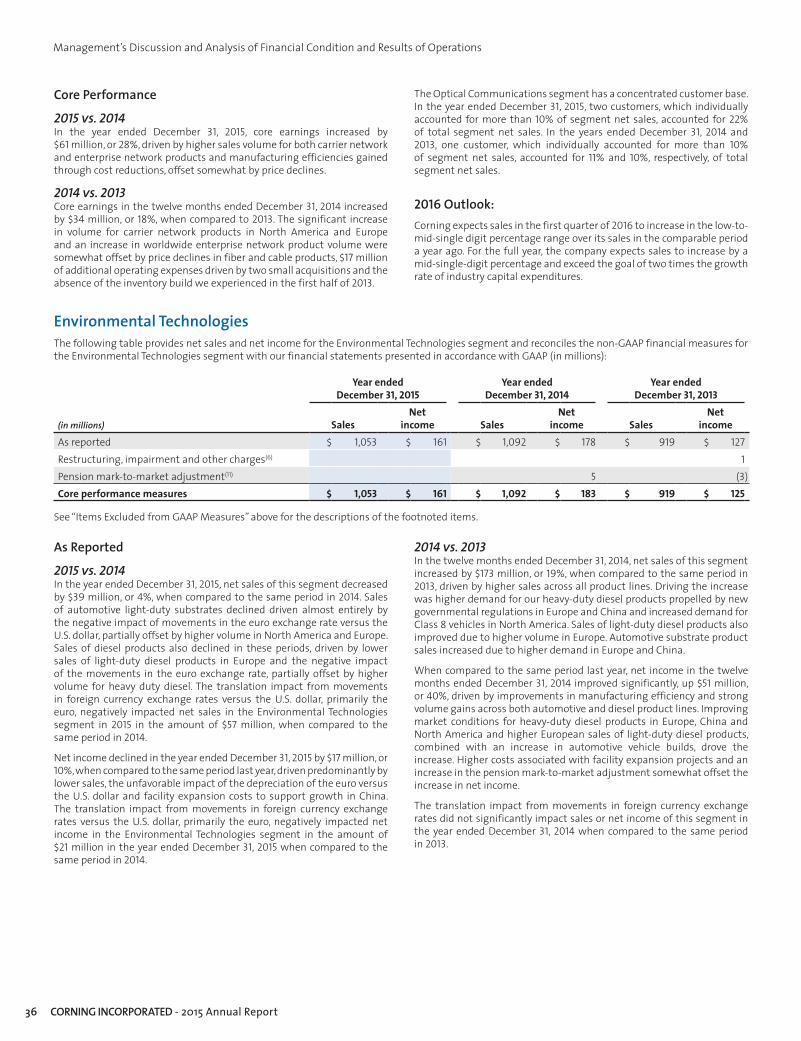
36 CORNING INCORPORATED - 2015 Annual Report
Management’s Discussion and Analysis of Financial Condition and Results of Operations
Core Performance
2015 vs. 2014In the year ended December 31, 2015, core earnings increased by $61 million, or 28%, driven by higher sales volume for both carrier network and enterprise network products and manufacturing efficiencies gained through cost reductions, offset somewhat by price declines.
2014 vs. 2013Core earnings in the twelve months ended December 31, 2014 increased by $34 million, or 18%, when compared to 2013. The significant increase in volume for carrier network products in North America and Europe and an increase in worldwide enterprise network product volume were somewhat offset by price declines in fiber and cable products, $17 million of additional operating expenses driven by two small acquisitions and the absence of the inventory build we experienced in the first half of 2013.
The Optical Communications segment has a concentrated customer base. In the year ended December 31, 2015, two customers, which individually accounted for more than 10% of segment net sales, accounted for 22% of total segment net sales. In the years ended December 31, 2014 and 2013, one customer, which individually accounted for more than 10% of segment net sales, accounted for 11% and 10%, respectively, of total segment net sales.
2016 Outlook: Corning expects sales in the first quarter of 2016 to increase in the low-to-mid-single digit percentage range over its sales in the comparable period a year ago. For the full year, the company expects sales to increase by a mid-single-digit percentage and exceed the goal of two times the growth rate of industry capital expenditures.
Environmental TechnologiesThe following table provides net sales and net income for the Environmental Technologies segment and reconciles the non-GAAP financial measures for the Environmental Technologies segment with our financial statements presented in accordance with GAAP (in millions):
Year ended December 31, 2015
Year ended December 31, 2014
Year ended December 31, 2013
(in millions) SalesNet
income SalesNet
income SalesNet
incomeAs reported $ 1,053 $ 161 $ 1,092 $ 178 $ 919 $ 127 Restructuring, impairment and other charges(6) 1 Pension mark-to-market adjustment(11) 5 (3)Core performance measures $ 1,053 $ 161 $ 1,092 $ 183 $ 919 $ 125
See “Items Excluded from GAAP Measures” above for the descriptions of the footnoted items.
As Reported
2015 vs. 2014In the year ended December 31, 2015, net sales of this segment decreased by $39 million, or 4%, when compared to the same period in 2014. Sales of automotive light-duty substrates declined driven almost entirely by the negative impact of movements in the euro exchange rate versus the U.S. dollar, partially offset by higher volume in North America and Europe. Sales of diesel products also declined in these periods, driven by lower sales of light-duty diesel products in Europe and the negative impact of the movements in the euro exchange rate, partially offset by higher volume for heavy duty diesel. The translation impact from movements in foreign currency exchange rates versus the U.S. dollar, primarily the euro, negatively impacted net sales in the Environmental Technologies segment in 2015 in the amount of $57 million, when compared to the same period in 2014.
Net income declined in the year ended December 31, 2015 by $17 million, or 10%, when compared to the same period last year, driven predominantly by lower sales, the unfavorable impact of the depreciation of the euro versus the U.S. dollar and facility expansion costs to support growth in China. The translation impact from movements in foreign currency exchange rates versus the U.S. dollar, primarily the euro, negatively impacted net income in the Environmental Technologies segment in the amount of $21 million in the year ended December 31, 2015 when compared to the same period in 2014.
2014 vs. 2013In the twelve months ended December 31, 2014, net sales of this segment increased by $173 million, or 19%, when compared to the same period in 2013, driven by higher sales across all product lines. Driving the increase was higher demand for our heavy-duty diesel products propelled by new governmental regulations in Europe and China and increased demand for Class 8 vehicles in North America. Sales of light-duty diesel products also improved due to higher volume in Europe. Automotive substrate product sales increased due to higher demand in Europe and China.
When compared to the same period last year, net income in the twelve months ended December 31, 2014 improved significantly, up $51 million, or 40%, driven by improvements in manufacturing efficiency and strong volume gains across both automotive and diesel product lines. Improving market conditions for heavy-duty diesel products in Europe, China and North America and higher European sales of light-duty diesel products, combined with an increase in automotive vehicle builds, drove the increase. Higher costs associated with facility expansion projects and an increase in the pension mark-to-market adjustment somewhat offset the increase in net income.
The translation impact from movements in foreign currency exchange rates did not significantly impact sales or net income of this segment in the year ended December 31, 2014 when compared to the same period in 2013.

37CORNING INCORPORATED - 2015 Annual Report
Management’s Discussion and Analysis of Financial Condition and Results of Operations
Core Performance
2015 vs. 2014Core earnings declined by $22 million, or 12%, in the year ended December 31, 2015, when compared to the same period last year, driven predominantly by lower sales, the unfavorable impact of the depreciation of the euro versus the U.S. dollar and facility expansion costs to support growth in China. The translation impact from movements in foreign currency exchange rates versus the U.S. dollar, primarily the euro, negatively impacted net income in the Environmental Technologies segment in the amount of $21 million in the year ended December 31, 2015 when compared to the same period in 2014.
2014 vs. 2013When compared to the same period last year, core earnings in the twelve months ended December 31, 2014 increased by $58 million, or 46%, driven by improvements in manufacturing efficiency and strong volume gains across both automotive and diesel product lines. Improving market conditions for heavy-duty diesel products in Europe, China and North America and higher European sales of light-duty diesel products, combined with an increase in automotive vehicle builds, drove the increase. Higher costs associated with facility expansion projects somewhat offset the increase in net income.
The Environmental Technologies segment sells to a concentrated customer base of catalyzer and emission control systems manufacturers, who then sell to automotive and diesel engine manufacturers. Although our sales are to the emission control systems manufacturers, the use of our substrates and filters is generally required by the specifications of the automotive and diesel vehicle or engine manufacturers. For 2015, 2014 and 2013, net sales to three customers, which individually accounted for more than 10% of segment sales, accounted for 86%, 88% and 87%, respectively, of total segment sales. While we are not aware of any significant customer credit issues with our direct customers, our near-term sales and profitability would be impacted if any individual customers were unable to continue to purchase our products.
2016 Outlook: The North American heavy-duty truck market is down after several years of robust growth. As a result, first-quarter sales are expected to decline by approximately 10%, compared with the same period last year. The full-year outlook is for sales to decline by a low single-digit percentage.
Specialty MaterialsThe following table provides net sales and net income for the Specialty Materials segment and reconciles the non-GAAP financial measures for the Specialty Materials segment with our financial statements presented in accordance with GAAP (in millions):
(in millions)
Year ended December 31, 2015
Year ended December 31, 2014
Year ended December 31, 2013
SalesNet
income SalesNet
income SalesNet
incomeAs reported $ 1,107 $ 167 $ 1,205 $ 138 $ 1,170 $ 181 Constant-yen(1)* (6) (3) 2Constant-won(1) (2)Foreign currency hedges related to translated earnings(2) 5 14 Acquisition-related costs(3) (1) 1 Restructuring, impairment and other charges(6) 14 12 12 Pension mark-to-market adjustment(11) (2)Core performance measures $ 1,107 $ 178 $ 1,205 $ 160 $ 1,170 $ 194
* In the first quarter of 2015, we changed the yen-to-dollar management rate from ¥93 to ¥99 to closely align with the yen-denominated hedges entered into for the years 2015 through 2017. Prior periods presented have been recast based on the new rate.
See “Items Excluded from GAAP Measures” above for the descriptions of the footnoted items.
As Reported
2015 vs. 2014Net sales for the year ended December 31, 2015 decreased by $98 million, or 8%, when compared to the same period in 2014, primarily due to lower sales of advanced optics products. This decline was driven by weakness in the semiconductor industry, delays in a large aerospace and defense program and the depreciation of the euro versus the U.S. dollar. The translation impact from movements in foreign currency exchange rates negatively impacted net sales in the Specialty Materials segment in the amount of $12 million in 2015, when compared to the same period in 2014.
When compared to the same period last year, the increase in net income of $29 million, or 21%, in the year ended December 31, 2015 was driven by an increase in Corning Gorilla Glass volume, improvements in manufacturing efficiency and lower operating expenses gained through cost reductions, offset somewhat by a decrease in sales of advanced optics products. The translation impact from movements in foreign currency exchange rates did not significantly impact net income of this segment in 2015 when compared to the same period in 2014.
2014 vs. 2013Net sales for the twelve months ended December 31, 2014 in the Specialty Materials segment increased by $35 million, or 3%, when compared to the same period in 2013, driven by higher sales of our advanced optics and commercial optics products. Although Corning Gorilla Glass volume increased by 23%, net sales remained consistent with the prior year, driven by an unfavorable shift in product mix and price declines. Additionally, although volume increased in 2014 when compared to 2013, the growth did not meet our expectations due to the flat market for tablets.
When compared to the same period last year, the decrease in net income of $43 million, or 24%, for the twelve months ended December 31, 2014 was driven by the absence of the inventory build we experienced in the first half of 2013, the write-off of a trade receivable balance in the amount of $8 million and price declines for Corning Gorilla Glass. Partially offsetting the decrease was an increase in volume for both Corning Gorilla Glass and advanced optics products and the impact of costs reductions as a result of restructuring actions.
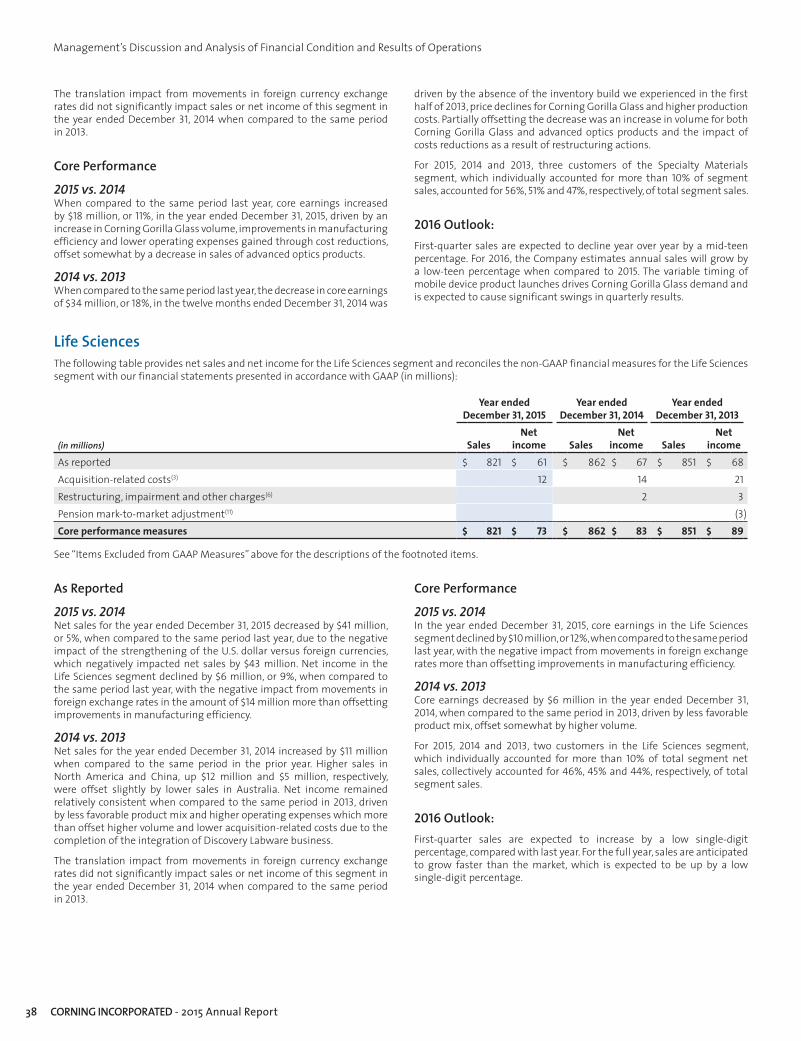
38 CORNING INCORPORATED - 2015 Annual Report
Management’s Discussion and Analysis of Financial Condition and Results of Operations
The translation impact from movements in foreign currency exchange rates did not significantly impact sales or net income of this segment in the year ended December 31, 2014 when compared to the same period in 2013.
Core Performance
2015 vs. 2014When compared to the same period last year, core earnings increased by $18 million, or 11%, in the year ended December 31, 2015, driven by an increase in Corning Gorilla Glass volume, improvements in manufacturing efficiency and lower operating expenses gained through cost reductions, offset somewhat by a decrease in sales of advanced optics products.
2014 vs. 2013When compared to the same period last year, the decrease in core earnings of $34 million, or 18%, in the twelve months ended December 31, 2014 was
driven by the absence of the inventory build we experienced in the first half of 2013, price declines for Corning Gorilla Glass and higher production costs. Partially offsetting the decrease was an increase in volume for both Corning Gorilla Glass and advanced optics products and the impact of costs reductions as a result of restructuring actions.
For 2015, 2014 and 2013, three customers of the Specialty Materials segment, which individually accounted for more than 10% of segment sales, accounted for 56%, 51% and 47%, respectively, of total segment sales.
2016 Outlook: First-quarter sales are expected to decline year over year by a mid-teen percentage. For 2016, the Company estimates annual sales will grow by a low-teen percentage when compared to 2015. The variable timing of mobile device product launches drives Corning Gorilla Glass demand and is expected to cause significant swings in quarterly results.
Life SciencesThe following table provides net sales and net income for the Life Sciences segment and reconciles the non-GAAP financial measures for the Life Sciences segment with our financial statements presented in accordance with GAAP (in millions):
Year ended December 31, 2015
Year ended December 31, 2014
Year ended December 31, 2013
(in millions) SalesNet
income SalesNet
income SalesNet
incomeAs reported $ 821 $ 61 $ 862 $ 67 $ 851 $ 68 Acquisition-related costs(3) 12 14 21 Restructuring, impairment and other charges(6) 2 3 Pension mark-to-market adjustment(11) (3)Core performance measures $ 821 $ 73 $ 862 $ 83 $ 851 $ 89
See “Items Excluded from GAAP Measures” above for the descriptions of the footnoted items.
As Reported
2015 vs. 2014Net sales for the year ended December 31, 2015 decreased by $41 million, or 5%, when compared to the same period last year, due to the negative impact of the strengthening of the U.S. dollar versus foreign currencies, which negatively impacted net sales by $43 million. Net income in the Life Sciences segment declined by $6 million, or 9%, when compared to the same period last year, with the negative impact from movements in foreign exchange rates in the amount of $14 million more than offsetting improvements in manufacturing efficiency.
2014 vs. 2013Net sales for the year ended December 31, 2014 increased by $11 million when compared to the same period in the prior year. Higher sales in North America and China, up $12 million and $5 million, respectively, were offset slightly by lower sales in Australia. Net income remained relatively consistent when compared to the same period in 2013, driven by less favorable product mix and higher operating expenses which more than offset higher volume and lower acquisition-related costs due to the completion of the integration of Discovery Labware business.
The translation impact from movements in foreign currency exchange rates did not significantly impact sales or net income of this segment in the year ended December 31, 2014 when compared to the same period in 2013.
Core Performance
2015 vs. 2014In the year ended December 31, 2015, core earnings in the Life Sciences segment declined by $10 million, or 12%, when compared to the same period last year, with the negative impact from movements in foreign exchange rates more than offsetting improvements in manufacturing efficiency.
2014 vs. 2013Core earnings decreased by $6 million in the year ended December 31, 2014, when compared to the same period in 2013, driven by less favorable product mix, offset somewhat by higher volume.
For 2015, 2014 and 2013, two customers in the Life Sciences segment, which individually accounted for more than 10% of total segment net sales, collectively accounted for 46%, 45% and 44%, respectively, of total segment sales.
2016 Outlook: First-quarter sales are expected to increase by a low single-digit percentage, compared with last year. For the full year, sales are anticipated to grow faster than the market, which is expected to be up by a low single-digit percentage.

39CORNING INCORPORATED - 2015 Annual Report
Management’s Discussion and Analysis of Financial Condition and Results of Operations
All OtherAll other segments that do not meet the quantitative threshold for separate reporting have been grouped as “All Other.” This group is primarily comprised of the results of Corning’s Pharmaceutical Technologies business, which consists of a pharmaceutical glass business and a glass tubing business used in the pharmaceutical packaging industry. This
segment also includes Corning Precision Materials’ non-LCD business and new product lines and development projects such as laser technologies, advanced flow reactors and adjacency businesses in pursuit of thin, strong glass, as well as certain corporate investments such as Eurokera and Keraglass equity affiliates.
The following table provides net sales and other data for All Other (in millions):
% changeAs Reported 2015 2014 2013 15 vs. 14 14 vs. 13Net sales $ 64 $ 53 $ 8 21 563Research, development and engineering expenses $ 186 $ 177 $ 116 5 53Equity earnings of affiliated companies $ 17 $ 18 $ (24) (6) *Net loss $ (202) $ (198) $ (165) (2) 20
* Percent change not meaningful
2015 vs. 2014The increase in net sales of this segment in the year ended December 31, 2015 reflects the impact of an acquisition in the Corning Pharmaceutical Technologies business completed in the fourth quarter of 2015 and an increase in sales in our emerging businesses. The slight increase in the net loss of this segment was driven by a goodwill impairment loss of $29 million, offset by higher net income in the pharmaceutical technologies and Corning Precision Materials’ non-LCD businesses.
2014 vs. 2013The increase in net sales of this segment in the year ended December 31, 2014 reflects the consolidation of the Corning Precision Materials’ non-LCD business as a result of the acquisition. The increase in the net loss of this segment reflects higher spending for development projects which were not part of the segment in the year ended December 31, 2013.
Liquidity and Capital Resources
Financing and Capital StructureThe following items impacted Corning’s financing and capital structure during 2015, 2014 and 2013:
2015• In the second quarter of 2015, we issued $375 million of 1.50% senior
unsecured notes that mature on May 8, 2018 and $375 million of 2.90% senior unsecured notes that mature on May 15, 2022. The net proceeds of $745 million will be used for general corporate purposes. We can redeem these notes at any time, subject to certain customary terms and conditions.
2014• In the third quarter of 2014, we amended and restated our
existing revolving credit facility. The amended facility provides a $2 billion unsecured multi-currency line of credit and expires on September 30, 2019. At December 31, 2015, there were no outstanding amounts under this credit facility. The facility includes affirmative and negative covenants that Corning must comply with, including a leverage (debt to capital ratio) financial covenant. As of December 31, 2015, we were in compliance with all of the covenants.
2013• In the first quarter of 2013, we amended and restated our then-existing
revolving credit facility. The 2013 amended facility provided a $1 billion unsecured multi-currency line of credit that would have expired in March 2018. This facility was amended and restated by the $2 billion facility entered into in the third quarter of 2014.
• In the first quarter of 2013, Corning repaid the aggregate principal amount and accrued interest outstanding on the credit facility entered into in the second quarter of 2011 that allowed Corning to borrow up to Chinese renminbi (RMB) 4 billion. The total amount repaid was approximately $500 million. Upon repayment, this facility was terminated.
• In the second quarter of 2013, the Company established a commercial paper program on a private placement basis, pursuant to which we may issue short-term, unsecured commercial paper notes up to a maximum aggregate principal amount outstanding at any time of $1 billion. Under this program, the Company may issue the notes from time to time and will use the proceeds for general corporate purposes. The maturities of the notes will vary, but may not exceed 390 days from the date of issue. The interest rates will vary based on market conditions and the ratings assigned to the notes by credit rating agencies at the time of issuance. The Company’s revolving credit facility is available to support obligations under the commercial paper program, if needed.
• In the fourth quarter of 2013, we issued $250 million of 3.70% senior unsecured notes that mature on November 15, 2023. The net proceeds of approximately $248 million were used for general corporate purposes.
• In the fourth quarter of 2013, we recorded a financing obligation in the approximate amount of $230 million for a new LCD glass substrate facility in China.

40 CORNING INCORPORATED - 2015 Annual Report
Management’s Discussion and Analysis of Financial Condition and Results of Operations
Common Stock DividendsOn February 3, 2016, Corning’s Board of Directors declared a 12.5% increase in the Company’s quarterly common stock dividend, which increased the quarterly dividend from $0.12 to $0.135 per share of common stock, beginning with the dividend to be paid in the first quarter of 2016. This increase marks the fifth dividend increase since October 2011. The Board previously increased the quarterly dividend 20%, from $0.10 to $0.12, on December 3, 2014. The Company paid four quarterly dividends of $0.12 during the year ended December 31, 2015 and paid four quarterly dividends of $0.10 during the year ended December 31, 2014.
Fixed Rate Cumulative Convertible Preferred Stock, Series AOn January 15, 2014, Corning designated a new series of its preferred stock as Fixed Rate Cumulative Convertible Preferred Stock, Series A, par value $100 per share, and issued 1,900 shares of Preferred Stock at an issue price of $1 million per share, for an aggregate issue price of $1.9 billion, to Samsung Display in connection with the acquisition of its equity interests in Samsung Corning Precision Materials. Corning also issued to Samsung Display an additional 400 shares of Fixed Rate Cumulative Convertible Preferred Stock at closing, for an aggregate issue price of $400 million in cash.
Dividends on the Preferred Stock are cumulative and accrue at the annual rate of 4.25% on the per share issue price of $1 million. The dividends are payable quarterly as and when declared by the Company’s Board of Directors. The Preferred Stock ranks senior to our common stock with respect to payment of dividends and rights upon liquidation. The Preferred Stock is not redeemable except in the case of a certain deemed liquidation event, the occurrence of which is under the control of the Company. The Preferred Stock is convertible at the option of the holder and the Company upon certain events, at a conversion rate of 50,000 shares of Corning’s common stock per one share of Preferred Stock, subject to certain anti-dilution provisions. As of December 31, 2015, the Preferred Stock has not been converted, and none of the anti-dilution provisions have been triggered. Following the seventh anniversary of the closing of the acquisition of Samsung Corning Precision Materials, the Preferred Stock will be convertible, in whole or in part, at the option of the holder. The Company has the right, at its option, to cause some or
all of the shares of Preferred Stock to be converted into Common Stock, if, for 25 trading days (whether or not consecutive) within any period of 40 consecutive trading days, the closing price of Common Stock exceeds $35 per share. If the aforementioned right becomes exercisable before the seventh anniversary of the closing, the Company must first obtain the written approval of the holders of a majority of the Preferred Stock before exercising its conversion right. The Preferred Stock does not have any voting rights except as may be required by law.
Customer DepositsIn December 2015, Corning announced that with the support of the Hefei government it will locate a Gen 10.5 glass manufacturing facility in the Hefei XinZhan General Pilot Zone in Anhui Province, China. Glass substrate production from the new facility is expected to support mass production of LCD panels for large-size televisions by the third quarter of 2018.
As part of this investment, Corning and a Chinese customer have entered into a long-term supply agreement that commits the customer to the purchase of Gen 10.5 glass substrates from the Corning manufacturing facility in Hefei. This agreement stipulates that the customer will provide a non-refundable cash deposit in the amount of approximately $400 million to Corning to secure rights to an amount of glass that is produced by Corning over the next 10 years. Corning received $197 million of this deposit in 2015 and will receive the additional $197 million in 2016. As glass is shipped to the customer, Corning will recognize revenue and issue credit memoranda to reduce the amount of the customer deposit liability, which are applied against customer receivables resulting from the sale of glass. In 2015, there were no credit memoranda issued.
Capital SpendingCapital spending totaled $1.3 billion in 2015, slightly above the amount spent in 2014. Spending in 2015 was driven primarily by the Display Technologies segment, and focused on finishing line optimization and tank rebuilds. We expect our 2016 capital expenditures to be approximately $1.3 billion. Approximately $600 million will be allocated to our Display Technologies segment.
Cash FlowsSummary of cash flow data (in millions):
Years ended December 31,2015 2014 2013
Net cash provided by operating activities $ 2,809 $ 4,709 $ 2,787 Net cash used in investing activities $ (685) $ (962) $ (1,004)Net cash used in financing activities $ (2,603) $ (2,586) $ (2,063)
2015 vs. 2014Net cash provided by operating activities decreased significantly in the year ended December 31, 2015, when compared to the same period last year, due to the absence of a special one-time dividend of $1,574 million received from Samsung Corning Precision Materials in the first quarter of 2014, lower net income and cash outflows from working capital movements, offset somewhat by the receipt of a $197 million customer deposit and the adjustment to net income related to gains on foreign currency hedges and other noncash operating adjustments.
Cash outflows from working capital movements were largely driven by an increase in variable compensation paid in 2015 and an increase in inventory in the Display Technologies segment.
Net cash used in investing activities decreased in the year ended December 31, 2015, when compared to the same period last year, due to net liquidations of short-term investments and an increase in realized gains on our foreign currency hedges related to translated earnings, offset by higher capital spending and several acquisitions that were completed in 2015.

41CORNING INCORPORATED - 2015 Annual Report
Management’s Discussion and Analysis of Financial Condition and Results of Operations
Net cash used in financing activities in the year ended December 31, 2015 increased slightly when compared to the same period last year, driven by an increase in share repurchases and the absence of cash received from the issuance of preferred stock, offset by proceeds received from the issuance of long-term debt and commercial paper.
2014 vs. 2013Net cash provided by operating activities increased significantly in the year ended December 31, 2014, when compared to the same period last year, due to a dividend of approximately $1,574 million received from Samsung Corning Precision Materials, an increase in net income of $511 million and the cash inflows from inventory movements. Although net inventory increased by $52 million due to the acquisition of Samsung Corning Precision Materials, which added $121 million, this inventory was acquired through the issuance of preferred stock. Cash outflows for inventory declined by $120 million in the Display Technologies and Specialty Materials segments in 2014 when compared to 2013, offset somewhat by an increase of approximately $50 million, driven by spending for new business development, and increases in the Optical Communications and Life Sciences segments.
Net cash used in investing activities decreased slightly in the year ended December 31, 2014, when compared to the same period last year, driven by a decrease in investments in unconsolidated entities, the realized gains on our yen-denominated purchased collars and the absence of the premium paid for our yen-denominated purchased collars in 2013, offset by an increase in short-term investments.
Net cash used in financing activities in the year ended December 31, 2014 increased when compared to the same period last year, driven by our share repurchase programs and the absence of the proceeds received in 2013 from the issuance of long-term debt, somewhat offset by cash received from the issuance of preferred stock and the absence of the retirement of long-term debt in the first quarter of 2013.
Defined Benefit Pension PlansWe have defined benefit pension plans covering certain domestic and international employees. Our largest single pension plan is Corning’s U.S. qualified plan. At December 31, 2015, this plan accounted for 77% of our consolidated defined benefit pension plans’ projected benefit obligation and 86% of the related plans’ assets.
We have historically contributed to the U.S. qualified pension plan on an annual basis in excess of the IRS minimum requirements. In 2015, we made voluntary cash contributions of $65 million to our domestic defined benefit pension plan and $35 million to our international pension plans. In 2014, we made voluntary cash contributions of $85 million to our domestic defined benefit pension plan and $45 million to our international pension plans. In 2013, we did not contribute to our domestic defined benefit pension plan and contributed $5 million to our international pension plans. Although we will not be subject to any mandatory contributions in 2016, we anticipate making voluntary cash contributions of up to $62 million to our U.S. pension plan and up to $36 million to our international pension plans in 2016.
Refer to Note 13 (Employee Retirement Plans) to the Consolidated Financial Statements for additional information.
RestructuringFor the year ended December 31, 2015, we did not record significant restructuring, impairment and other charges or reversals. Cash expenditures for restructuring activities were $40 million.
For the year ended December 31, 2014, we recorded charges of $71 million for workforce reductions, asset disposals and write-offs, and exit costs for restructuring activities with total cash expenditures of approximately $39 million.
In the fourth quarter of 2013, Corning implemented a global restructuring plan within several of our segments, consisting of workforce reductions, asset disposals and write-offs, and exit costs. We recorded charges of $67 million associated with these actions, with total cash expenditures of $35 million.
Refer to Note 2 (Restructuring, Impairment and Other Charges) to the Consolidated Financial Statements for additional information.
Key Balance Sheet DataBalance sheet and working capital measures are provided in the following table (in millions):
December 31,2015 2014
Working capital $ 5,455 $ 7,914Current ratio 2.9:1 4.4:1Trade accounts receivable, net of allowances $ 1,372 $ 1,501Days sales outstanding 55 56Inventories $ 1,385 $ 1,322Inventory turns 4.0 4.2Days payable outstanding(1) 42 41Long-term debt $ 3,910 $ 3,227Total debt to total capital 19% 13%
(1) Includes trade payables only.

42 CORNING INCORPORATED - 2015 Annual Report
Management’s Discussion and Analysis of Financial Condition and Results of Operations
Credit RatingsAs of February 12, 2016, our credit ratings were as follows:
Rating Agency Rating long-term debt Outlook last updateFitch BBB+ Stable
October 29, 2015Standard & Poor’s BBB+ Stable
October 27, 2015Moody’s Baa1 Stable
October 28, 2015
Management Assessment of LiquidityWe ended the fourth quarter of 2015 with approximately $4.6 billion of cash, cash equivalents and short-term investments. The Company has adequate sources of liquidity and we are confident in our ability to generate cash to meet reasonably likely future cash requirements. Our cash, cash equivalents and short-term investments are held in various locations throughout the world and are generally unrestricted. Although approximately 71% of the consolidated amount was held outside of the United States at December 31, 2015, we have sufficient U.S. liquidity, including borrowing capacity, to fund foreseeable U.S. cash needs without requiring the repatriation of foreign cash. We utilize a variety of financing strategies to ensure that our worldwide cash is available in the locations in which it is needed.
To manage interest rate exposure, the Company, from time to time, may enter into interest rate swap agreements. In the first quarter of 2015, the interest rate swaps that were entered into in the fourth quarter of 2014 to hedge future interest payments from an anticipated debt issuance were settled prior to the issuance of the anticipated debt. Because the Company continued to anticipate that the debt issuance would occur, it entered into two interest rate swap agreements in the first quarter of 2015 to hedge against the variability in cash flows due to changes in the benchmark interest rate related to an anticipated issuance. The instruments were designated as cash flow hedges, and were settled on May 5, 2015. Concurrent with the settlement of the interest rate swap agreements, Corning issued $375 million of 1.50% senior unsecured notes that mature on May 8, 2018 and $375 million of 2.90% senior unsecured notes that mature on May 15, 2022.
Corning also has a commercial paper program pursuant to which we may issue short-term, unsecured commercial paper notes up to a maximum aggregate principal amount outstanding at any time of $1 billion. Under this program, the Company may issue the notes from time to time and will use the proceeds for general corporate purposes. The maturities of the notes vary, but may not exceed 390 days from the date of issue. The interest rates vary based on market conditions and the ratings assigned to the notes by credit rating agencies at the time of issuance. The Company’s revolving credit facility is available to support obligations under the commercial paper program, if needed. At December 31, 2015, we had a balance of $481 million in outstanding commercial paper under this program.
Share Repurchase Programs
2013 Repurchase ProgramOn October 31, 2013, as part of the share repurchase program announced on April 24, 2013 (the “2013 Repurchase Program”), Corning entered into an accelerated share repurchase (“ASR”) agreement (the “2013 ASR agreement”) with JP Morgan Chase Bank, National Association, London Branch (“JPMC”). Under the 2013 ASR agreement, Corning agreed to
purchase $1 billion of its common stock, in total, with an initial delivery by JPMC of 47.1 million shares based on the current market price, and payment of $1 billion made by Corning to JPMC. The payment to JPMC was recorded as a reduction to shareholders’ equity, consisting of an $800 million increase in treasury stock, which reflects the value of the initial 47.1 million shares received upon execution, and a $200 million decrease in other-paid-in capital, which reflects the value of the stock held back by JPMC pending final settlement. On January 28, 2014, the 2013 ASR agreement was completed. Corning received an additional 10.5 million shares on January 31, 2014 to settle the 2013 ASR agreement. In total, Corning purchased 57.6 million shares based on the average daily volume weighted-average price of Corning’s common stock during the term of the 2013 ASR agreement, less a discount.
In addition to the shares repurchased through the 2013 ASR agreement, we repurchased 61.3 million shares of common stock on the open market for approximately $1 billion, as part of the 2013 Repurchase Program. This program was executed between the second quarter of 2013 and the first quarter of 2014, with a total of 118.9 million shares repurchased for approximately $2 billion.
March 2014 Repurchase ProgramOn March 4, 2014, as part of the $2 billion share repurchase program announced on October 22, 2013 and made effective concurrent with the closing of Corning’s acquisition of Samsung Corning Precision Materials on January 15, 2014 (the “March 2014 Repurchase Program”), Corning entered into an ASR agreement (the “2014 ASR agreement”) with Citibank N.A. (“Citi”). Under the 2014 ASR agreement, Corning agreed to purchase $1.25 billion of its common stock, with an initial delivery by Citi of 52.5 million shares based on the current market price, and payment of $1.25 billion made by Corning to Citi. The 2014 ASR agreement was completed on May 28, 2014, and Corning received an additional 8.7 million shares to settle the 2014 ASR agreement. In total, Corning repurchased 61.2 million shares based on the average daily volume weighted-average price of Corning’s common stock during the term of the 2014 ASR agreement, less a discount.
In addition to the shares repurchased through the 2014 ASR agreement, in the year ended December 31, 2014, we repurchased 36.9 million shares of common stock on the open market for approximately $750 million, as part of the March 2014 Repurchase Program. This program was completed in the fourth quarter of 2014, with a total of 98.2 million shares repurchased for approximately $2 billion.

43CORNING INCORPORATED - 2015 Annual Report
Management’s Discussion and Analysis of Financial Condition and Results of Operations
December 2014 Repurchase ProgramOn December 3, 2014, Corning’s Board of Directors authorized the repurchase of up to $1.5 billion shares of common stock (the “December 2014 Repurchase Program”) between the date of announcement and December 31, 2016. In the year ended December 31, 2015, we repurchased 70.4 million shares of common stock for approximately $1.5 billion as part of the December 2014 Repurchase Program, which was completed in the third quarter of 2015.
2015 Repurchase ProgramsOn July 15, 2015, Corning’s Board of Directors approved a $2 billion share repurchase program (the “July 2015 Repurchase Program”) and on October 26, 2015 the Board of Directors authorized an additional $4 billion share repurchase program (together with the July 2015 Repurchase Program, the “2015 Repurchase Programs”). The 2015 Repurchase Programs permit Corning to effect repurchases from time to time through a combination of open market repurchases, privately negotiated transactions, advance repurchase agreements and/or other arrangements.
On October 28, 2015, Corning entered into an ASR with Morgan Stanley & Co. LLC (“Morgan Stanley”) to repurchase $1.25 billion of Corning’s common stock (the “2015 ASR agreement”). The 2015 ASR agreement was executed under the July 2015 Repurchase Program. Under the 2015 ASR agreement, Corning made a $1.25 billion payment to Morgan Stanley on October 29, 2015 and received an initial delivery of approximately 53.1 million shares of Corning common stock from Morgan Stanley on the same day. The payment to Morgan Stanley was recorded as a reduction to shareholders’ equity, consisting of a $1 billion increase in treasury stock, which reflects the value of the initial 53.1 million shares received upon execution, and a $250 million decrease in other-paid-in capital, which reflects the value of the stock held back by Morgan Stanley pending final settlement. On January 19, 2016, the 2015 ASR agreement was completed. Corning received an additional 15.9 million shares on January 22, 2016 to settle the 2015 ASR agreement. In total, Corning purchased 69 million shares based on the average daily volume weighted-average price of Corning’s common stock during the term of the 2015 ASR agreement, less a discount.
In addition to the shares repurchased through the 2015 ASR agreement, we repurchased 98 million shares of common stock on the open market for approximately $2 billion, as part of the December 2014 Repurchase Program and the July 2015 Repurchase Program, resulting in a total of 151 million shares repurchased during 2015.
OtherWe complete comprehensive reviews of our significant customers and their creditworthiness by analyzing their financial strength at least annually or more frequently for customers where we have identified a measure of increased risk. We closely monitor payments and developments which may signal possible customer credit issues. We currently have not identified any potential material impact on our liquidity resulting from customer credit issues.
Our major source of funding for 2016 and beyond will be our operating cash flow and our existing balances of cash, cash equivalents, short-term investments and proceeds from any issuances of debt. We believe we have sufficient liquidity for the next several years to fund operations, share repurchase programs, acquisitions, the asbestos litigation, research and development, capital expenditures, scheduled debt repayments and dividend payments.
Corning also has access to a $2 billion unsecured committed revolving credit facility. This credit facility includes a leverage ratio financial covenant. The required leverage ratio, which measures debt to total
capital, is a maximum of 50%. At December 31, 2015, our leverage using this measure was 19% and we are in compliance with the financial covenant.
Our debt instruments contain customary event of default provisions, which allow the lenders the option of accelerating all obligations upon the occurrence of certain events. In addition, some of our debt instruments contain a cross default provision, whereby an uncured default in excess of a specified amount on one debt obligation of the Company, also would be considered a default under the terms of another debt instrument. As of December 31, 2015, we were in compliance with all such provisions.
Management is not aware of any known trends or any known demands, commitments, events or uncertainties that will result in or that are reasonably likely to result in a material increase or decrease in our liquidity. In addition, other than items discussed, there are no known material trends, favorable or unfavorable, in our capital resources and no expected material changes in the mix and relative cost of such resources.
Purchased Collars, Zero-Cost Collars and Average Rate ForwardsIn the first quarter of 2013, Corning executed a series of purchased collars that expire quarterly across a two-year period to hedge its translation exposure resulting from movements in the Japanese yen against the U.S. dollar. Beginning in the second quarter of 2013 and continuing throughout 2015, Corning entered into a series of zero cost average rate collars and average rate forwards with no associated premium to hedge the translation impact of Japanese yen on Corning’s projected 2015, 2016 and 2017 net income. Additionally, in January 2016, Corning took advantage of the stronger yen to extend its foreign exchange hedging program to hedge a significant portion of its projected yen exposure for the period 2018 through 2022. In the years ended December 31, 2015, 2014 and 2013, we recorded pre-tax net gains of $113 million, $1,406 million and $435 million, respectively, related to changes in the fair value of these derivative instruments. Included in these amounts are realized gains of $686 million, $280 million and $67 million, respectively. The gross notional value outstanding for purchase collars and average rate forwards which hedge our exposure to the Japanese yen at December 31, 2015, 2014 and 2013 was $8.3 billion, $9.8 billion and $6.8 billion, respectively.
Beginning in the second quarter of 2014, and continuing throughout 2015, we entered into a portfolio of zero-cost collars to hedge our translation exposure resulting from movements in the South Korean won and its impact on our net earnings. In the years ended December 31, 2015 and 2014, we recorded a pre-tax net loss of $36 million and $37 million, respectively, related to changes in the fair value of these zero-cost collars. Included in these amounts are realized losses of $33 million and $6 million, respectively. These zero-cost collars have a gross notional value outstanding at December 31, 2015 and 2014 of $3.3 billion and $2.3 billion, respectively.
In the first quarter of 2015, in response to the significant strengthening of the U.S. dollar versus the euro, we entered into a portfolio of zero-cost collars and average rate forwards with an associated premium to hedge against our euro translation exposure. In the year ended December 31 2015, we recorded a net pre-tax gain of $3 million. These collars have a gross notional amount of $345 million at December 31, 2015.
These purchased collars, zero-cost collars, zero cost average rate collars and average rate forwards are not designated as accounting hedges, and changes in their fair value are recorded in earnings in the foreign currency hedge gain, net line of the Consolidated Statements of Income.

44 CORNING INCORPORATED - 2015 Annual Report
Management’s Discussion and Analysis of Financial Condition and Results of Operations
Off Balance Sheet ArrangementsOff balance sheet arrangements are transactions, agreements, or other contractual arrangements with an unconsolidated entity for which Corning has an obligation to the entity that is not recorded in our consolidated financial statements.
Corning’s off balance sheet arrangements include guarantee contracts. At the time a guarantee is issued, the Company is required to recognize a liability for the fair value or market value of the obligation it assumes. In the normal course of our business, we do not routinely provide significant third-party guarantees. Generally, third-party guarantees provided by Corning are limited to certain financial guarantees, including stand-by letters of credit and performance bonds, and the incurrence of contingent liabilities in the form of purchase price adjustments related to attainment of milestones. These guarantees have various terms, and none of these guarantees are individually significant.
Refer to Note 14 (Commitments, Contingencies and Guarantees) to the Consolidated Financial Statements for additional information.
For variable interest entities, we assess the terms of our interest in each entity to determine if we are the primary beneficiary. The primary beneficiary of a variable interest entity is the party that absorbs a majority of the entity’s expected losses, receives a majority of its expected residual returns, or both, as a result of holding variable interests, which are the ownership, contractual, or other pecuniary interests in an entity that change with changes in the fair value of the entity’s net assets excluding variable interests.
Corning has identified one entity that qualifies as a variable interest entity. This entity is not considered to be significant to Corning’s consolidated statements of position.
Corning does not have retained interests in assets transferred to an unconsolidated entity that serve as credit, liquidity or market risk support to that entity.
Contractual ObligationsThe amounts of our obligations follow (in millions):
Amount of commitment and contingency expiration per period
Total Less than 1 year 1 to 3 years 3 to 5 years5 years and thereafter
Performance bonds and guarantees $ 92 $ 25 $ 6 $ 1 $ 60Stand-by letters of credit(1) 47 44 3Credit Facility to Equity Company 31 27 4Loan guarantees 14 14Subtotal of commitment expirations per period $ 184 $ 96 $ 6 $ 1 $ 81Purchase obligations(6) $ 220 $ 106 $ 77 $ 33 $ 4Capital expenditure obligations(2) 298 298Total debt(3) 4,122 565 625 550 2,382Interest on long-term debt(4) 2,385 165 316 280 1,624Capital leases and financing obligations(3) 355 7 10 7 331Imputed interest on capital leases and financing obligations 240 19 37 36 148Minimum rental commitments 573 49 110 77 337Uncertain tax positions(5) 58Subtotal of contractual obligation payments due by period(5) 8,251 1,209 1,175 983 4,826Total commitments and contingencies(5) $ 8,435 $ 1,305 $ 1,181 $ 984 $ 4,907
(1) At December 31, 2015, $38 million of the $47 million was included in other accrued liabilities on our consolidated balance sheets.(2) Capital expenditure obligations primarily reflect amounts associated with our capital expansion activities.(3) Total debt above is stated at maturity value, and excludes interest rate swap gains and bond discounts.(4) The estimate of interest payments assumes interest is paid through the date of maturity or expiration of the related debt, based upon stated rates in
the respective debt instruments.(5) At December 31, 2015, $58 million was included on our balance sheet related to uncertain tax positions. Of this amount, we are unable to estimate
when any of that amount will become payable.(6) Purchase obligations are enforceable and legally binding obligations which primarily consist of raw material and energy-related take-or-pay contracts.
We are required, at the time a guarantee is issued, to recognize a liability for the fair value or market value of the obligation it assumes. In the normal course of our business, we do not routinely provide significant third-party guarantees. Generally, third-party guarantees provided by Corning are limited to certain financial guarantees, including stand-by letters of credit and performance bonds, and the incurrence of contingent
liabilities in the form of purchase price adjustments related to attainment of milestones. These guarantees have various terms, and none of these guarantees are individually significant.
We believe a significant majority of these guarantees and contingent liabilities will expire without being funded.

45CORNING INCORPORATED - 2015 Annual Report
Management’s Discussion and Analysis of Financial Condition and Results of Operations
Environment
Corning has been named by the Environmental Protection Agency (the Agency) under the Superfund Act, or by state governments under similar state laws, as a potentially responsible party for 17 active hazardous waste sites. Under the Superfund Act, all parties who may have contributed any waste to a hazardous waste site, identified by the Agency, are jointly and severally liable for the cost of cleanup unless the Agency agrees otherwise. It is Corning’s policy to accrue for its estimated liability related to Superfund sites and other environmental liabilities related to property owned by Corning based on expert analysis and continual monitoring
by both internal and external consultants. At December 31, 2015 and 2014, Corning had accrued approximately $37 million (undiscounted) and $43 million (undiscounted), respectively, for its estimated liability for environmental cleanup and related litigation. Based upon the information developed to date, management believes that the accrued reserve is a reasonable estimate of the Company’s liability and that the risk of an additional loss in an amount materially higher than that accrued is remote.
Critical Accounting Estimates
The preparation of financial statements requires us to make estimates and assumptions that affect amounts reported therein. The estimates that required us to make difficult, subjective or complex judgments, including future projections of performance and relevant discount rates, are set forth below.
Impairment of assets held for useWe are required to assess the recoverability of the carrying value of long-lived assets when an indicator of impairment has been identified. We review our long-lived assets in each quarter to assess whether impairment indicators are present. We must exercise judgment in assessing whether an event of impairment has occurred.
Manufacturing equipment includes certain components of production equipment that are constructed of precious metals, primarily platinum and rhodium. These metals are not depreciated because they have very low physical losses and are repeatedly reclaimed and reused in our manufacturing process over a very long useful life. Precious metals are reviewed for impairment as part of our assessment of long-lived assets. This review considers all of the Company’s precious metals that are either in place in the production process; in reclamation, fabrication, or refinement in anticipation of re-use; or awaiting use to support increased capacity. Precious metals are only acquired to support our operations and are not held for trading or other non-manufacturing related purposes.
Examples of events or circumstances that may be indicative of impairments include, but are not limited to:
• A significant decrease in the market price of an asset;
• A significant change in the extent or manner in which a long-lived asset is being used or in its physical condition;
• A significant adverse change in legal factors or in the business climate that could affect the value of the asset, including an adverse action or assessment by a regulator;
• An accumulation of costs significantly in excess of the amount originally expected for the acquisition or construction of an asset;
• A current-period operating or cash flow loss combined with a history of operating or cash flow losses or a projection or forecast that demonstrates continuing losses associated with the use of an asset; and
• A current expectation that, more likely than not, an asset will be sold or otherwise disposed of significantly before the end of its previously estimated useful life.
For purposes of recognition and measurement of an impairment loss, a long-lived asset or assets is grouped with other assets and liabilities at the lowest level for which identifiable cash flows are largely independent of the cash flows of other assets and liabilities. We must exercise judgment in assessing the lowest level for which identifiable cash flows are largely independent of the cash flows of other assets and liabilities. For the majority of our reportable segments, we concluded that locations or businesses which share production along the supply chain must be combined in order to appropriately identify cash flows that are largely independent of the cash flows of other assets and liabilities.
For long-lived assets, when impairment indicators are present, we compare estimated undiscounted future cash flows, including the eventual disposition of the asset group at market value, to the assets’ carrying value to determine if the asset group is recoverable. This assessment requires the exercise of judgment in assessing the future use of and projected value to be derived from the assets to be held and used. Assessments also consider changes in asset utilization, including the temporary idling of capacity and the expected timing for placing this capacity back into production. If there is an impairment, a loss is recorded to reflect the difference between the assets’ fair value and carrying value. This may require judgment in estimating future cash flows and relevant discount rates and residual values in estimating the current fair value of the impaired assets to be held and used.
For an asset group that fails the test of recoverability described above, the estimated fair value of long-lived assets is determined using an “income approach”, “market approach”, “cost approach”, or a combination of one or more of these approaches as appropriate for the particular asset group being reviewed. All of these approaches start with the forecast of expected future net cash flows including the eventual disposition at market value of long-lived assets, and also considers the fair market value of all precious metals if appropriate for the asset group being reviewed. Some of the more significant estimates and assumptions in our analysis include: market size and growth, market share, projected selling prices, manufacturing cost and discount rate. Our estimates are based upon our historical experience, our commercial relationships, and available external information about future trends. We believe fair value assessments are most sensitive to market growth and the corresponding impact on volume and selling prices and that these are also more subjective than manufacturing cost and other assumptions. The Company believes its current assumptions and estimates are reasonable and appropriate.

46 CORNING INCORPORATED - 2015 Annual Report
Management’s Discussion and Analysis of Financial Condition and Results of Operations
In the event the current net book value of an asset group is found to be greater than the net present value of the cash flows derived from the asset group, we determine the actual fair market value of long-lived assets with the assistance from valuation appraisals conducted by third parties. The results of these valuations generally represent the fair market value of the asset group that will remain after any necessary impairment adjustments have been recorded. The impairment charge will be allocated to assets within the asset group on a relative fair value basis.
At December 31, 2015 and December 31, 2014, the carrying value of precious metals was higher than the fair market value by $976 million and $222 million, respectively. These precious metals are utilized by the Display Technologies and Specialty Materials segments. Corning believes these precious metal assets to be recoverable due to the significant positive cash flow in both segments. The potential for impairment exists in the future if negative events significantly decrease the cash flow of these segments. Such events include, but are not limited to, a significant decrease in demand for products or a significant decrease in profitability in our Display Technologies or Specialty Materials segments.
Impairment of GoodwillWe are required to make certain subjective and complex judgments in assessing whether an event of impairment of goodwill has occurred, including assumptions and estimates used to determine the fair value of our reporting units. We test for goodwill impairment at the reporting unit level and our reporting units are the operating segments or the components of operating segments which constitute businesses for which discrete financial information is available and is regularly reviewed by segment management.
Corning has recorded goodwill in the Display Technologies, Optical Communications, Specialty Materials, Life Sciences and All Other operating segments. On a quarterly basis, management performs a qualitative assessment of factors in each reporting unit within these operating segments to determine whether there have been any triggering events. The two-step impairment test is required only if we conclude that it is more likely than not that a reporting unit’s fair value is less than its carrying amount. We perform a detailed, two-step process every three years if no indicators suggest a test should be performed in the interim. We use this calculation as quantitative validation of the step-zero qualitative process that is performed during the intervening periods and does not represent an election to perform the two-step process in place of the step-zero review.
The following summarizes our qualitative process to assess our goodwill balances for impairment:
• We assess qualitative factors in each of our reporting units which carry goodwill to determine whether it is necessary to perform the first step of the two-step quantitative goodwill impairment test.
• The following events and circumstances are considered when evaluating whether it is more likely than not that the fair value of a reporting unit is less than its carrying amount:
– Macroeconomic conditions, such as a deterioration in general economic conditions, fluctuations in foreign exchange rates and/or other developments in equity and credit markets;
– Market capital in relation to book value;
– Industry and market considerations, such as a deterioration in the environment in which an entity operates, material loss in market share and significant declines in product pricing;
– Cost factors, such as an increase in raw materials, labor or other costs;
– Overall financial performance, such as negative or declining cash flows or a decline in actual or forecasted revenue;
– Other relevant entity-specific events, such as material changes in management or key personnel; and
– Events affecting a reporting unit, such as a change in the composition or carrying amount of its net assets including acquisitions and dispositions.
The examples noted above are not all-inclusive, and the Company will consider other relevant events and circumstances that affect the fair value of a reporting unit in determining whether to perform the first step of the goodwill impairment test.
Our two-step goodwill recoverability assessment is based on our annual strategic planning process. This process includes an extensive review of expectations for the long-term growth of our businesses and forecasted future cash flows. Our valuation method is an “income approach” using a discounted cash flow model in which cash flows anticipated over several periods, plus a terminal value at the end of that time horizon, are discounted to their present value using an appropriate rate of return. Our estimates are based upon our historical experience, our current knowledge from our commercial relationships, and available external information about future trends.
Display TechnologiesGoodwill for the Display Technologies segment is tested at the reporting unit level, which is also the operating segment level consisting of two components. For the purposes of the annual goodwill impairment assessment, we have aggregated these two components into one reporting unit based upon their similar economic characteristics. On a quarterly basis in 2015, management performed a qualitative assessment of factors and determined there had not been any triggering events which would indicate that the Display Technologies reporting unit’s fair value is less than its carrying amount.
In addition to assessing qualitative factors each quarter, we performed a quantitative goodwill recoverability test in 2015 for this reporting unit. A discount rate of 5.8% and a growth rate of 1% were used in 2015. The results of our impairment test indicated that the fair value of the reporting unit exceeded its book value by a significant amount, and as such, further goodwill impairment testing was not necessary. We determined a range of discount rates between 3.8% and 7.8% and growth rates between 0% and 3% would not have affected our conclusion.
Optical CommunicationsGoodwill for the Optical Communications segment is tested at the reporting unit level, which is also the operating segment level consisting of two components.. For the purposes of the annual goodwill impairment assessment, we have aggregated these two components into one reporting unit based upon their similar economic characteristics. On a quarterly basis in 2015, management performed a qualitative assessment of factors and determined there had not been any triggering events which would indicate that the Optical Communications reporting unit’s fair value is less than its carrying amount.
In addition to assessing qualitative factors each quarter, we performed a quantitative goodwill recoverability test in 2015 for this reporting unit. A discount rate of 5.6% and a growth rate of 3% were used in 2015. The results of our impairment test indicated that the fair value of the reporting unit exceeded its book value by a significant amount, and as such, further goodwill impairment testing was not necessary. We determined a range of discount rates between 3.6% and 7.6% and growth rates between 0% and 3% would not have affected our conclusion.

47CORNING INCORPORATED - 2015 Annual Report
Management’s Discussion and Analysis of Financial Condition and Results of Operations
Specialty MaterialsGoodwill for the Specialty Materials segment is tested at the reporting unit level, which is one level below an operating segment, as the goodwill is the result of transactions associated with a certain business within this operating segment. On a quarterly basis in 2015, management performed a qualitative assessment of factors and determined there had not been any triggering events which would indicate that the Specialty Materials reporting unit’s fair value is less than its carrying amount.
In addition to assessing qualitative factors each quarter, we performed a quantitative goodwill recoverability test in 2015 for this reporting unit. A discount rate of 5.8% and a growth rate of 3% were used in 2015. The results of our impairment test indicated that the fair value of the reporting unit exceeded its book value by a significant amount, and as such, further goodwill impairment testing was not necessary. We determined a range of discount rates between 3.8% and 7.8% and growth rates between 0% and 3% would not have affected our conclusion.
Life SciencesGoodwill for the Life Sciences segment is tested at the reporting unit level, which is also the operating segment level. On a quarterly basis in 2015, management performed a qualitative assessment of factors and determined there had not been any triggering events which would indicate that the Life Sciences reporting unit’s fair value is less than its carrying amount.
In addition to assessing qualitative factors each quarter, we performed a quantitative goodwill recoverability test in 2015 for this reporting unit. A discount rate of 6% and a growth rate of 3% were used in 2015. The results of our impairment test indicated that the fair value of the reporting unit exceeded its book value by a significant amount, and as such, further goodwill impairment testing was not necessary. We determined a range of discount rates between 4% and 8% and growth rates between 0% and 3% would not have affected our conclusion.
All OtherAll Other segment is comprised of various operating segments and corporate investments that do not meet the quantitative threshold for separate reporting. Goodwill for the All Other segment is tested at the reporting unit level, which is also the operating segment level. For the purposes of the annual goodwill impairment assessment, we have identified two reporting units in this segment that require an assessment of their goodwill. On a quarterly basis in 2015, management performed a qualitative assessment of factors and determined there had not been any triggering events which would indicate that the reporting units’ fair value is less than the carrying amount.
In addition to assessing qualitative factors each quarter, we performed a quantitative goodwill recoverability test in 2015 for this reporting unit. A discount rate of 7.4% and a growth rate of 3% were used in 2015. The results of our impairment test indicated that the book value of one of the reporting units exceeded its fair value by 80%. We determined a range of discount rates between 5.4% and 9.4% and growth rates between 0% and 3% would not have affected our conclusion. Corning concluded that a Step 2 analysis was required to measure the impairment loss for this reporting unit.
Our Step 2 test consisted of identifying the underlying net assets in the reporting unit, allocating the implied purchase price to the asset and liabilities of the reporting unit and the calculation of the implied fair value of goodwill and the resulting impairment loss. In December 2015, we recorded a goodwill impairment loss of $29 million related to this reporting unit.
Restructuring charges and impairments resulting from restructuring actionsWe are required to assess whether and when a restructuring event has occurred and in which periods charges related to such events should be recognized. We must estimate costs of plans to restructure including, for example, employee termination costs. Restructuring charges require us to exercise judgment about the expected future of our businesses, of portions thereof, their profitability, cash flows and in certain instances eventual outcome. The judgment involved can be difficult, subjective and complex in a number of areas, including assumptions and estimates used in estimating the future profitability and cash flows of our businesses.
Restructuring events often give rise to decisions to dispose of or abandon certain assets or asset groups which, as a result, require impairment. We are required to carry assets to be sold or abandoned at the lower of cost or fair value. We must exercise judgment in assessing the fair value of the assets to be sold or abandoned.
Income taxesWe are required to exercise judgment about our future results in assessing the realizability of our deferred tax assets. Inherent in this estimation process is the requirement for us to estimate future book and taxable income and possible tax planning strategies. These estimates require us to exercise judgment about our future results, the prudence and feasibility of possible tax planning strategies, and the economic environments in which we do business. It is possible that actual results will differ from assumptions and require adjustments to allowances.
Corning accounts for uncertain tax positions in accordance with FASB ASC Topic 740, Income Taxes. As required under FASB ASC Topic 740, we only record tax benefits for technical positions that we believe have a greater than 50% likelihood of being sustained on their technical merits and then only to the extent of the amount of tax benefit that is greater than 50% likely of being realized upon settlement. In estimating these amounts, we must exercise judgment around factors such as the weighting of the tax law in our favor, the willingness of a tax authority to aggressively pursue a particular position, or alternatively, consider a negotiated compromise, and our willingness to dispute a tax authorities assertion to the level of appeal we believe is required to sustain our position. As a result, it is possible that our estimate of the benefits we will realize for uncertain tax positions may change when we become aware of new information affecting these judgments and estimates.
Equity method investmentsIn October 2013, Corning announced that it was entering into a series of strategic and financial agreements with Samsung Display which would result in Corning obtaining full ownership of Samsung Corning Precision Materials. As part of this agreement, in the fourth quarter of 2013, Corning acquired the minority interests of three shareholders in Samsung Corning Precision Materials for $506 million, which included payment for the transfer of non-operating assets and the pro-rata portion of cash on Samsung Corning Precision Materials balance sheet at September 30, 2013. The resulting transfer of shares to Corning increased Corning’s ownership percentage of Samsung Corning Precision Materials from 50% to 57.5%. Because this transaction did not result in a change in control based on the governing articles of this entity, Corning did not consolidate this entity as of December 31, 2013. The remaining transactions were completed on January 15, 2014, which increased Corning’s ownership to 100% and resulted in consolidation of the entity beginning in the first quarter of 2014. This organization was integrated into Corning’s Display Technologies segment in 2014. Refer to Note 8 (Acquisitions) to the Consolidated Financial Statements for additional information.

48 CORNING INCORPORATED - 2015 Annual Report
Management’s Discussion and Analysis of Financial Condition and Results of Operations
On December 11, 2015, Corning announced its intention to exchange its 50% equity interest in Dow Corning Corporation for 100% of the stock of a newly formed entity that will become a wholly-owned subsidiary of Corning Incorporated. The newly formed entity will hold approximately 40% ownership in Hemlock Semiconductor Group and approximately $4.8 billion in cash. Upon completion of this strategic realignment, which is expected to close during the first half of 2016, Dow Chemical, an equal owner of Dow Corning with Corning since 1943, will assume 100% ownership of Dow Corning.
At December 31, 2015 and 2014, the carrying value of our equity method investments was $1.9 billion and $1.8 billion, respectively, with our largest equity method investment, Dow Corning, comprising 78% and 74%, respectively, of the balance. We review our equity method investments for indicators of impairment on a periodic basis or if events or circumstances change to indicate the carrying amount may be other-than-temporarily impaired. When such indicators are present, we then perform an in-depth review for impairment. An impairment assessment requires the exercise of judgment related to key assumptions such as forecasted revenue and profitability, forecasted tax rates, foreign currency exchange rate movements, terminal value assumptions, historical experience, our current knowledge from our commercial relationships, and available external information about future trends. As of December 31, 2015 and 2014, we have not identified any instances where the carrying values of our equity method investments were not recoverable.
Fair value measuresAs required, Corning uses two kinds of inputs to determine the fair value of assets and liabilities: observable and unobservable. Observable inputs are based on market data or independent sources, while unobservable inputs are based on the Company’s own market assumptions. Once inputs have been characterized, we prioritize the inputs used to measure fair value into one of three broad levels. Characterization of fair value inputs is required for those accounting pronouncements that prescribe or permit fair value measurement. In addition, observable market data must be used when available and the highest-and-best-use measure should be applied to non-financial assets. Corning’s major categories of financial assets and liabilities required to be measured at fair value are short-term and long-term investments, certain pension asset investments and derivatives. These categories use observable inputs only and are measured using a market approach based on quoted prices in markets considered active or in markets in which there are few transactions.
Derivative assets and liabilities may include interest rate swaps and forward exchange contracts that are measured using observable quoted prices for similar assets and liabilities. Included in our forward exchange contracts are foreign currency hedges that hedge our translation exposure resulting from movements in the Japanese yen, South Korean won and euro. These contracts are not designated as accounting hedges, and changes in their fair value are recorded in earnings in the foreign currency hedge gain, net line of the Consolidated Statements of Income. In arriving at the fair value of Corning’s derivative assets and liabilities, we have considered the appropriate valuation and risk criteria, including such factors as credit risk of the relevant party to the transaction. Amounts related to credit risk are not material.
As a result of the acquisition of Samsung Corning Precision Materials in January 2014, the Company has contingent consideration that was measured using unobservable (Level 3) inputs. This contingent consideration arrangement potentially requires additional consideration to be paid between the parties in 2018: one based on projections of future revenues generated by the business of Corning Precision Materials for the period between the acquisition date and December 31, 2017, which is subject to a cap of $665 million; and another based on the volumes of certain sales during the same period, which is subject to a separate cap
of $100 million. The fair value of the potential receipt of the contingent consideration in 2018 in the amount of $196 million recognized on the acquisition date was estimated by applying an option pricing model using the Company’s projection of future revenues generated by Corning Precision Materials. Changes in the fair value of the contingent consideration in future periods are valued using an option pricing model and are recorded in Corning’s results in the period of the change.
On December 29, 2015, Corning and Samsung Display entered into an agreement pursuant to which Corning exchanged the amount of contingent consideration in excess of $300 million (net present fair value: $246 million), as consideration for the incremental fair value associated with a number of commercial agreements, including the amendment of its long-term supply agreement with Samsung Display. As of December 29, 2015, the net present fair value of the contingent consideration receivable was $458 million. The net present fair value of the commercial benefit associated with the amended long-term supply agreement exceeds the value exchanged by Corning pursuant to this agreement (net present fair value: $212 million). Consequently, Corning reclassified this amount to the Other asset line of the Consolidated Balance Sheet and will amortize the amount over the remaining term of the long-term supply agreement as a reduction in revenue.
Additionally, as a result of the acquisitions of iBwave Solutions Inc. and the fiber-optics business of Samsung Electronics Co., Ltd. in the first quarter of 2015, the Company has contingent consideration that was measured using unobservable (Level 3) inputs. As of December 31, 2015, the fair value of the contingent consideration payable is $10 million.
There were no significant financial assets and liabilities measured on a nonrecurring basis during the twelve months ended December 31, 2015.
Probability of litigation outcomesWe are required to make judgments about future events that are inherently uncertain. In making determinations of likely outcomes of litigation matters, we consider the evaluation of legal counsel knowledgeable about each matter, case law, and other case-specific issues. See Part II – Item 3. Legal Proceedings for a discussion of the material litigation matters we face. The most significant matter involving judgment is the liability for asbestos litigation. There are a number of factors bearing upon our potential liability, including the inherent complexity of a Chapter 11 filing, our history of success in defending asbestos claims, our assessment of the strength of our corporate veil defenses, and our continuing dialogue with our insurance carriers and the claimants’ representatives. The proposed asbestos resolution (Amended PCC Plan) is subject to a number of contingencies. As noted in Part II – Item 3. Legal Proceedings, the District Court’s affirmation of the Amended PCC Plan faces objections by certain parties. For these and other reasons, Corning’s liability for these asbestos matters may be subject to changes in subsequent quarters. The estimate of the cost of resolving the non-PCC asbestos claims may also be subject to change as developments occur. Management continues to believe that the likelihood of the uncertainties surrounding these proceedings causing a material adverse impact to Corning’s financial statements is remote.
Other possible liabilitiesWe are required to make judgments about future events that are inherently uncertain. In making determinations of likely outcomes of certain matters, including certain tax planning and environmental matters, these judgments require us to consider events and actions that are outside our control in determining whether probable or possible liabilities require accrual or disclosure. It is possible that actual results will differ from assumptions and require adjustments to accruals.

49CORNING INCORPORATED - 2015 Annual Report
Management’s Discussion and Analysis of Financial Condition and Results of Operations
Pension and other postretirement employee benefits (OPEB)Corning offers employee retirement plans consisting of defined benefit pension plans covering certain domestic and international employees and postretirement plans that provide health care and life insurance benefits for eligible retirees and dependents. The costs and obligations related to these benefits reflect the Company’s assumptions related to general economic conditions (particularly interest rates), expected return on plan assets, rate of compensation increase for employees and health care trend rates. The cost of providing plan benefits depends on demographic assumptions including retirements, mortality, turnover and plan participation. While management believes that the assumptions used are appropriate, differences in actual experience or changes in assumptions may affect Corning’s employee pension and other postretirement obligations, and current and future expense.
Costs for our defined benefit pension plans consist of two elements: 1) on-going costs recognized quarterly, which are comprised of service and interest costs, expected return on plan assets and amortization of prior service costs; and 2) mark-to-market gains and losses outside of the corridor, where the corridor is equal to 10% of the greater of the benefit obligation or the market-related value of plan assets at the beginning of the year, which are recognized annually in the fourth quarter of each year. These gains and losses result from changes in actuarial assumptions for discount rates and the differences between actual and expected return on plan assets. Any interim remeasurements triggered by a curtailment, settlement or significant plan changes, as well as any true-up to the annual valuation, are recognized as a mark-to-market adjustment in the quarter in which such event occurs.
Costs for our OPEB plans consist of on-going costs recognized quarterly, and are comprised of service and interest costs, amortization of prior service costs and amortization of actuarial gains and losses. We recognize the actuarial gains and losses resulting from changes in actuarial assumptions for discount rates as a component of Stockholders’ Equity on our consolidated balance sheets on an annual basis and amortize them into our operating results over the average remaining service period of employees expected to receive benefits under the plans, to the extent such gains and losses are outside of the corridor.
Prior to the December 31, 2015 valuation of its defined benefit pension and OPEB plans, Corning used the traditional, single weighted-average discount rate approach to develop the obligation, interest cost and service cost components of net periodic benefit cost for its defined benefit pension and OPEB plans. The individual spot rates from the yield curve are used in measuring the pension plan projected benefit obligation (PBO) or OPEB plan accumulated postretirement benefit obligation
(APBO) at the measurement date. The benefit obligation is effectively calculated as the aggregate present value at the measurement date of each future benefit payment related to past service, with each payment discounted using a spot rate from a high-quality corporate bond yield curve that matches the duration of the benefit payment. Under Corning’s traditional, single weighted-average discount rate approach, a single weighted-average rate is developed from the approach described above and rounded to the nearest 25 basis points. Traditionally, the weighted-average discount rate is determined at the plan measurement date, based on the same projected future benefit payments used in developing the benefit obligation. The traditional single weighted-average discount rate represents the constant annual rate that would be required to discount all future benefit payments related to past service from the date of expected future payment to the measurement date such that the aggregate present value equals the benefit obligation.
Beginning with the December 31, 2015 valuation of its defined benefit pension and OPEB plans, Corning is changing its methodology of determining the service and interest cost components of net periodic pension and other postretirement benefit costs to a more granular approach. Under the new approach, the cash flows from each applicable pension and OPEB plan are used to directly calculate the benefit obligation, service cost and interest cost using the spot rates from the applicable yield curve.
Moving to a more granular approach has a limited impact on the determination of the respective benefit obligations. The only impacts will be as a result of the elimination of the rounding of the discount rate that occurred in the traditional approach and the use of specific cash flows for Corning’s non-qualified pension plans, while separately applying the yield curve to each separate OPEB plan instead of aggregating the OPEB plan cash flows. This change will result in a decrease in the interest cost and service cost components of net periodic pension and OPEB costs. For the year ended December 31, 2016, net periodic pension and OPEB costs will be lower by approximately $28 million and $6 million, respectively, due to this change. For Corning’s pension plans, this change will increase the immediate recognition of actuarial losses (or decrease the immediate recognition of actuarial gains), due to Corning’s previous election to immediately recognize actuarial gains and losses outside of the corridor. For Corning’s OPEB plans, this change will increase the accumulated other comprehensive income (AOCI) account balance due to the accumulation of lower actuarial gains or higher actuarial losses. Over time, the amortization of the actuarial losses from AOCI will begin to reduce the savings from the lower interest cost and service cost.
This change is a change in accounting estimate and therefore applied prospectively (beginning with the next measurement date of December 31, 2015). No restatement of prior periods is required.
The following table presents our actual and expected return on assets, as well as the corresponding percentage, for the years ended 2015, 2014 and 2013:
December 31,(In millions) 2015 2014 2013Actual return on plan assets – Domestic plans $ (111) $ 287 $ 65Expected return on plan assets – Domestic plans 166 159 158Actual return on plan assets – International plans 3 68 6Expected return on plan assets – International plans 12 15 11

50 CORNING INCORPORATED - 2015 Annual Report
Management’s Discussion and Analysis of Financial Condition and Results of Operations
December 31,2015 2014 2013
Weighted-average actual and expected return on assets:Actual return on plan assets – Domestic plans (4.23%) 10.82% 2.67%Expected return on plan assets – Domestic plans 6.00% 6.25% 6.00%Actual return on plan assets – International plans 0.59% 17.15% 2.73%Expected return on plan assets – International plans 2.97% 4.12% 3.73%
As of December 31, 2015, the Projected Benefit Obligation (PBO) for U.S. pension plans was $3,161 million.
The following information illustrates the sensitivity to a change in certain assumptions for U.S. pension plans:
Change in assumptionEffect on 2016
pre-tax pension expenseEffect on
December 31, 2015 PBO25 basis point decrease in each spot rate - 2 million + 87 million25 basis point increase in each spot rate + 2 million - 83 million25 basis point decrease in expected return on assets + 6 million25 basis point increase in expected return on assets - 6 million
The above sensitivities reflect the impact of changing one assumption at a time. Note that economic factors and conditions often affect multiple assumptions simultaneously and the effects of changes in key assumptions are not necessarily linear. These changes in assumptions would have no effect on Corning’s funding requirements.
In addition, at December 31, 2015, a 25 basis point decrease in each spot rate would decrease stockholders’ equity by $110 million before tax, and a 25 basis point increase in each spot rate would increase stockholders’ equity by $105 million. In addition, the impact of greater than a 25 basis point decrease in each spot rate would not be proportional to the first 25 basis point decrease in each spot rate.
The following table illustrates the sensitivity to a change in each spot rate assumption related to Corning’s U.S. OPEB plans:
Change in assumptionEffect on 2016
pre-tax OPEB expenseEffect on
December 31, 2015 APBO*25 basis point decrease in each spot rate + 0 million + 23 million25 basis point increase in each spot rate - 0 million - 22 million
* Accumulated Postretirement Benefit Obligation (APBO).
The above sensitivities reflect the impact of changing one assumption at a time. Note that economic factors and conditions often affect multiple assumptions simultaneously and the effects of changes in key assumptions are not necessarily linear.
Revenue recognitionThe Company recognizes revenue when it is realized or realizable and earned. In certain instances, revenue recognition is based on estimates of fair value of deliverables as well as estimates of product returns, allowances, discounts, and other factors. These estimates are supported by historical data. Corning also has contractual arrangements with certain customers in which we recognize revenue on a completed contract basis. Revenues under the completed-contract method are recognized upon substantial completion, defined as acceptance by the customer and compliance with performance specifications as agreed upon in the contract, which in certain instances require estimates and judgments in determining the timing of substantial completion of the contract. While management believes that the estimates used are appropriate, differences in actual experience or changes in estimates may affect Corning’s future results.
Share-Based CompensationShare-based compensation cost is measured at the grant date based on the fair value of the award and is recognized as expense over the requisite service period. Determining the fair value of stock-based awards at the grant date requires judgment, including estimating expected dividends. In addition, judgment is also required in estimating the amount of share-based awards that are expected to be forfeited. If actual results differ significantly from these estimates, share-based compensation expense and our results of operations could be impacted.
New Accounting Standards
Refer to Note 1 (Summary of Significant Accounting Policies) to the Consolidated Financial Statements.

51CORNING INCORPORATED - 2015 Annual Report
Quantitative and Qualitative Disclosures About Market RisksWe operate and conduct business in many foreign countries and as a result are exposed to movements in foreign currency exchange rates. Our exposure to exchange rates has the following effects:
• Exchange rate movements on financial instruments and transactions denominated in foreign currencies that impact earnings; and
• Exchange rate movements upon conversion of net assets and net income of foreign subsidiaries for which the functional currency is not the U.S. dollar, which impact our net equity.
Our most significant foreign currency exposures relate to the Japanese yen, South Korean won, New Taiwan dollar, Chinese renminbi, and the euro. We seek to mitigate the impact of exchange rate movements in our income statement by using over-the-counter (OTC) derivative instruments including foreign exchange forward and option contracts. In general, these hedges expire coincident with the timing of the underlying foreign currency commitments and transactions.
We are exposed to potential losses in the event of non-performance by our counterparties to these derivative contracts. However, we minimize this risk by maintaining a diverse group of highly-rated major international financial institutions with which we have other financial relationships as our counterparties. We do not expect to record any losses as a result of such counterparty default. Neither we nor our counterparties are required to post collateral for these financial instruments.
Our cash flow hedging activities utilize OTC foreign exchange forward contracts to reduce the risk that movements in exchange rates will adversely affect the net cash flows resulting from the sale of products to foreign customers and purchases from foreign suppliers. We also use OTC foreign exchange forward and option contracts that are not designated as hedging instruments for accounting purposes. The undesignated hedges limit exposures to foreign functional currency fluctuations related to certain subsidiaries’ monetary assets, monetary liabilities and net earnings in foreign currencies. A significant portion of the Company’s non-U.S. revenues are denominated in Japanese yen. When these revenues are translated back to U.S. dollars, the Company is exposed to foreign exchange rate movements in the Japanese yen. To protect translated earnings against movements in the Japanese yen, the Company has entered into a series of purchased collars and average rate forwards.
We use a sensitivity analysis to assess the market risk associated with our foreign currency exchange risk. Market risk is defined as the potential change in fair value of assets and liabilities resulting from an adverse movement in foreign currency exchange rates. At December 31, 2015, with respect to open foreign exchange forward and option contracts,
and foreign denominated debt with values exposed to exchange rate movements, a 10% adverse movement in quoted foreign currency exchange rates could result in a loss in fair value of these instruments of $901 million compared to $1,080 million at December 31, 2014. Specific to the Japanese yen, a 10% adverse movement in quoted yen exchange rates could result in a loss in fair value of these instruments of $741 million compared to $959 million at December 31, 2014. Specific to the South Korean won, a 10% adverse movement in quoted South Korean won exchange rates could result in a loss in fair value of these instruments of $99 million compared to $79 million at December 31, 2014.
Because we derive approximately 70% of our net sales from outside the U.S., our sales and net income could be affected if the U.S. dollar significantly strengthens or weakens against foreign currencies, most notably the Japanese yen, South Korean won, and euro. Our forecasts generally assume exchange rates during 2016 will remain constant at January 2016 levels. As an example of the impact that changes in foreign currency exchange rates could have on our financial results, we compare 2015 actual sales in yen, won and euro transaction currencies at an average currency exchange rate during the year to a 10% change in the currency exchange rate. A plus or minus 10% movement in the U.S. dollar – Japanese yen exchange rate would result in a change to 2015 net sales of approximately $309 million. A plus or minus 10% movement in the U.S. dollar – South Korean won and U.S. dollar – euro exchange rates would result in a change to 2015 net sales of approximately $5 million and $92 million, respectively. We estimate that a plus or minus 10% movement in the U.S. dollar – Japanese yen exchange rate would result in a change to 2015 net income attributable to Corning Incorporated of approximately $188 million. A plus or minus 10% movement in the U.S. dollar – South Korean won and U.S. dollar – euro exchange rates would result in a change to 2015 net income attributable to Corning Incorporated of approximately $67 million and $22 million, respectively.
Interest Rate Risk ManagementIt is our policy to conservatively manage our exposure to changes in interest rates. To manage interest rate exposure, the Company, from time to time, enters into interest rate swap agreements. We are currently party to two interest rate swaps that are designated as fair value hedges and economically exchange a notional amount of $550 million of previously issued fixed rate long-term debt to floating rate debt. Under the terms of the swap agreements, we pay the counterparty a floating rate that is indexed to the one-month LIBOR rate.
52 CORNING INCORPORATED - 2015 Annual Report
Management’s Annual Report on Internal Control Over Financial ReportingManagement is responsible for establishing and maintaining adequate disclosure controls and procedures and adequate internal control over financial reporting for Corning. Management is also responsible for the assessment of the effectiveness of disclosure controls and procedures and the effectiveness of internal control over financial reporting.
Disclosure controls and procedures mean controls and other procedures of an issuer that are designed to ensure that information required to be disclosed by the issuer in the reports that it files or submits under the Exchange Act is recorded, processed, summarized, and reported, within the time periods specified in the SEC’s rules and forms. Corning’s disclosure controls and procedures include, without limitation, controls and procedures designed to ensure that information required to be disclosed by Corning in the reports that it files or submits under the Exchange Act is accumulated and communicated to Corning’s management, including Corning’s principal executive and principal financial officers, or other persons performing similar functions, as appropriate to allow timely decisions regarding required disclosure.
Corning’s internal control over financial reporting is a process designed to provide reasonable assurance regarding the reliability of financial reporting and the preparation of financial statements for external purposes in accordance with accounting principles generally accepted in the United States of America. Corning’s internal control over financial reporting includes those policies and procedures that (i) pertain to the maintenance of records that, in reasonable detail, accurately and fairly reflect the transactions and dispositions of Corning’s assets; (ii) provide reasonable assurance that transactions are recorded as necessary to
permit preparation of financial statements in accordance with accounting principles generally accepted in the United States of America, and that Corning’s receipts and expenditures are being made only in accordance with authorizations of Corning’s management and directors; and (iii) provide reasonable assurance regarding prevention or timely detection of unauthorized acquisition, use, or disposition of Corning’s assets that could have a material effect on the financial statements. Because of its inherent limitations, internal control over financial reporting may not prevent or detect misstatements. Also, projections of any evaluation of effectiveness to future periods are subject to the risk that controls may become inadequate because of changes in conditions, or that the degree of compliance with the policies and procedures may deteriorate.
Management conducted an evaluation of the effectiveness of the system of internal control over financial reporting based on the framework in Internal Control – Integrated Framework (2013) issued by the Committee of Sponsoring Organizations of the Treadway Commission. Management’s assessment of internal control over financial reporting includes controls over recognition of equity earnings and equity investments by Corning. Internal control over financial reporting for Dow Corning is the responsibility of Dow Corning management. Based on this evaluation, management concluded that Corning’s internal control over financial reporting was effective as of December 31, 2015. The effectiveness of Corning’s internal control over financial reporting as of December 31, 2015, has been audited by PricewaterhouseCoopers LLP, an independent registered public accounting firm, as stated in their report which is included herein.
Wendell P� Weeks R� Tony TripenyChairman, Chief Executive Officer and President Senior Vice President and Chief Financial Officer

53CORNING INCORPORATED - 2015 Annual Report
Report of Independent Registered Public Accounting Firm
PricewaterhouseCoopers LLPTo the Board of Directors and Shareholders of Corning Incorporated:
In our opinion, the consolidated financial statements listed in the accompanying index present fairly, in all material respects, the financial position of Corning Incorporated and its subsidiaries at December 31, 2015 and 2014, and the results of its operations and its cash flows for each of the three years in the period ended December 31, 2015 in conformity with accounting principles generally accepted in the United States of America. In addition, in our opinion, the financial statement schedule listed in the accompanying index presents fairly, in all material respects, the information set forth therein when read in conjunction with the related consolidated financial statements. Also in our opinion, the Company maintained, in all material respects, effective internal control over financial reporting as of December 31, 2015, based on criteria established in Internal Control - Integrated Framework (2013) issued by the Committee of Sponsoring Organizations of the Treadway Commission (COSO). The Company’s management is responsible for these financial statements and financial statement schedule, for maintaining effective internal control over financial reporting and for its assessment of the effectiveness of internal control over financial reporting, included in “Management’s Annual Report on Internal Control Over Financial Reporting,” appearing under Item 9A. Our responsibility is to express opinions on these financial statements, on the financial statement schedule and on the Company’s internal control over financial reporting based on our integrated audits. We conducted our audits in accordance with the standards of the Public Company Accounting Oversight Board (United States). Those standards require that we plan and perform the audits to obtain reasonable assurance about whether the financial statements are free of material misstatement and whether effective internal control over financial reporting was maintained in all material respects. Our audits of the financial statements included examining, on a test basis, evidence supporting the amounts and disclosures in the financial statements, assessing the accounting principles used and significant estimates made by management, and evaluating the overall financial statement
presentation. Our audit of internal control over financial reporting included obtaining an understanding of internal control over financial reporting, assessing the risk that a material weakness exists, and testing and evaluating the design and operating effectiveness of internal control based on the assessed risk. Our audits also included performing such other procedures as we considered necessary in the circumstances. We believe that our audits provide a reasonable basis for our opinions.
As discussed in Note 1 to the consolidated financial statements, the Company changed the manner in which it presents deferred income taxes in 2015.
A company’s internal control over financial reporting is a process designed to provide reasonable assurance regarding the reliability of financial reporting and the preparation of financial statements for external purposes in accordance with generally accepted accounting principles. A company’s internal control over financial reporting includes those policies and procedures that (i) pertain to the maintenance of records that, in reasonable detail, accurately and fairly reflect the transactions and dispositions of the assets of the company; (ii) provide reasonable assurance that transactions are recorded as necessary to permit preparation of financial statements in accordance with generally accepted accounting principles, and that receipts and expenditures of the company are being made only in accordance with authorizations of management and directors of the company; and (iii) provide reasonable assurance regarding prevention or timely detection of unauthorized acquisition, use, or disposition of the company’s assets that could have a material effect on the financial statements.
Because of its inherent limitations, internal control over financial reporting may not prevent or detect misstatements. Also, projections of any evaluation of effectiveness to future periods are subject to the risk that controls may become inadequate because of changes in conditions, or that the degree of compliance with the policies or procedures may deteriorate.
New York, New YorkFebruary 12, 2016

54 CORNING INCORPORATED - 2015 Annual Report
Consolidated Statements of IncomeCorning Incorporated and Subsidiary Companies
Years ended December 31,(In millions, except per share amounts) 2015 2014 2013Net sales $ 9,111 $ 9,715 $ 7,819 Cost of sales 5,458 5,663 4,495 Gross margin 3,653 4,052 3,324 Operating expenses:
Selling, general and administrative expenses 1,523 1,211 1,126 Research, development and engineering expenses 769 815 710 Amortization of purchased intangibles 54 33 31 Restructuring, impairment and other charges (Note 2) 71 67 Asbestos litigation (credit) charges (Note 7) (15) (9) 19
Operating income 1,322 1,931 1,371 Equity in earnings of affiliated companies (Note 7) 299 266 547 Interest income 21 26 8 Interest expense (140) (123) (120)Transaction-related gain, net (Note 8) 74 Foreign currency hedge gain, net 85 1,411 622 Other (expense) income, net (101) (17) 45 Income before income taxes 1,486 3,568 2,473 Provision for income taxes (Note 6) (147) (1,096) (512)Net income attributable to Corning Incorporated $ 1,339 $ 2,472 $ 1,961 Earnings per common share attributable to Corning Incorporated:Basic (Note 18) $ 1.02 $ 1.82 $ 1.35 Diluted (Note 18) $ 1.00 $ 1.73 $ 1.34 Dividends declared per common share(1) $ 0.36 $ 0.52 $ 0.39
(1) The first quarter 2015 dividend was declared on December 3, 2014.
The accompanying notes are an integral part of these consolidated financial statements.

55CORNING INCORPORATED - 2015 Annual Report
Consolidated Statements of Comprehensive IncomeCorning Incorporated and Subsidiary Companies
Years ended December 31,(In millions) 2015 2014 2013Net income attributable to Corning Incorporated $ 1,339 $ 2,472 $ 1,961
Foreign currency translation adjustments and other (590) (1,073) (682)Net unrealized gains (losses) on investments 1 (1) 2 Unamortized gains (losses) and prior service (costs) credits for postretirement benefit plans 121 (281) 392 Net unrealized (losses) gains on designated hedges (36) 4 (24)
Other comprehensive loss, net of tax (Note 17) (504) (1,351) (312)Comprehensive income attributable to Corning Incorporated $ 835 $ 1,121 $ 1,649
The accompanying notes are an integral part of these consolidated financial statements.

56 CORNING INCORPORATED - 2015 Annual Report
Consolidated Balance SheetsCorning Incorporated and Subsidiary Companies
December 31,(In millions, except share and per share amounts) 2015 2014AssetsCurrent assets:
Cash and cash equivalents $ 4,500 $ 5,309 Short-term investments, at fair value (Note 3) 100 759
Total cash, cash equivalents and short-term investments 4,600 6,068 Trade accounts receivable, net of doubtful accounts and allowances - $48 and $47 1,372 1,501 Inventories, net of inventory reserves - $146 and $127 (Note 5) 1,385 1,322 Deferred income taxes (Note 6) 248 Other current assets (Note 11 and 15) 912 1,099
Total current assets 8,269 10,238 Investments (Note 7) 1,975 1,801 Property, plant and equipment, net of accumulated depreciation - $9,188 and $8,332 (Note 9) 12,648 12,766 Goodwill, net (Note 10) 1,380 1,150 Other intangible assets, net (Note 10) 706 497 Deferred income taxes (Note 6) 2,056 1,889 Other assets (Note 8, 11 and 15) 1,513 1,722 Total Assets $ 28,547 $ 30,063 Liabilities and EquityCurrent liabilities:
Current portion of long-term debt and short-term borrowings (Note 12) $ 572 $ 36 Accounts payable 934 997 Other accrued liabilities (Note 11 and 14) 1,308 1,291
Total current liabilities 2,814 2,324 Long-term debt (Note 12) 3,910 3,227 Postretirement benefits other than pensions (Note 13) 718 814 Other liabilities (Note 11 and 14) 2,242 2,046
Total liabilities 9,684 8,411 Commitments and contingencies (Note 14)Shareholders’ equity (Note 17):
Convertible preferred stock, Series A – Par value $100 per share; Shares authorized 3,100; Shares issued: 2,300 2,300 2,300 Common stock – Par value $0.50 per share; Shares authorized: 3.8 billion; Shares issued: 1,681 million and 1,672 million 840 836 Additional paid-in capital – common stock 13,352 13,456 Retained earnings 13,832 13,021 Treasury stock, at cost; shares held: 551 million and 398 million (9,725) (6,727)Accumulated other comprehensive loss (1,811) (1,307)
Total Corning Incorporated shareholders’ equity 18,788 21,579 Noncontrolling interests 75 73
Total equity 18,863 21,652 Total Liabilities and Equity $ 28,547 $ 30,063
The accompanying notes are an integral part of these consolidated financial statements.

57CORNING INCORPORATED - 2015 Annual Report
Consolidated Statements of Cash FlowsCorning Incorporated and Subsidiary Companies
Years ended December 31,(In millions) 2015 2014 2013Cash Flows from Operating Activities:Net income $ 1,339 $ 2,472 $ 1,961 Adjustments to reconcile net income to net cash provided by operating activities:
Depreciation 1,130 1,167 971 Amortization of purchased intangibles 54 33 31 Restructuring, impairment and other charges 71 67 Stock compensation charges 46 58 54 Equity in earnings of affiliated companies (299) (266) (547)Dividends received from affiliated companies 143 1,704 630 Deferred tax provision 54 612 189 Restructuring payments (40) (39) (35)Customer deposits 197 Employee benefit payments (in excess of) less than expense (52) (52) 52 Gains on foreign currency hedges related to translated earnings (80) (1,369) (435)Unrealized translation losses on transactions 268 431 96 Contingent consideration fair value adjustment (13) (249)Changes in certain working capital items:
Trade accounts receivable 162 (16) (29)Inventories (77) 2 (247)Other current assets (57) (16) 34 Accounts payable and other current liabilities (146) (3) (23)
Other, net 180 169 18 Net cash provided by operating activities 2,809 4,709 2,787 Cash Flows from Investing Activities:
Capital expenditures (1,250) (1,076) (1,019)Acquisitions of businesses, net of cash (paid) received (732) 66 (68)Proceeds from sale of a business 12 Investment in unconsolidated entities (33) (109) (526)Proceeds from loan repayments from unconsolidated entities 6 23 8 Short-term investments – acquisitions (969) (1,398) (1,406)Short-term investments – liquidations 1,629 1,167 2,026 Premium on purchased collars (107)Realized gains on foreign currency hedges related to translated earnings 653 361 87 Other, net (1) 4 1
Net cash used in investing activities (685) (962) (1,004)Cash Flows from Financing Activities:
Retirement of long-term debt, net (498)Net repayments of short-term borrowings and current portion of long-term debt (12) (52) (71)Proceeds from issuance of long-term debt 745 248 Proceeds from issuance of short-term debt, net 3 29 Proceeds from issuance of commercial paper 481 (Payments) proceeds from the settlement of interest rate swap agreements (10) 33 Principal payments under capital lease obligations (6) (6) (7)Proceeds from issuance of preferred stock(1) 400 Proceeds received for asset financing and related incentives, net 1 1 276 Payments to acquire noncontrolling interest (47)Proceeds from the exercise of stock options 102 116 85 Repurchases of common stock for treasury (3,228) (2,483) (1,516)Dividends paid (679) (591) (566)
Net cash used in financing activities (2,603) (2,586) (2,063)Effect of exchange rates on cash (330) (556) (4)Net (decrease) increase in cash and cash equivalents (809) 605 (284)Cash and cash equivalents at beginning of year 5,309 4,704 4,988 Cash and cash equivalents at end of year $ 4,500 $ 5,309 $ 4,704
(1) In the first quarter of 2014, Corning issued 1,900 shares of Preferred Stock to Samsung Display Co., Ltd. in connection with the acquisition of their equity interests in Samsung Corning Precision Materials Co., Ltd. (Note 8). Corning also issued to Samsung Display an additional 400 shares of Preferred Stock at closing, for an issue price of $400 million in cash (Note 17).
The accompanying notes are an integral part of these consolidated financial statements.
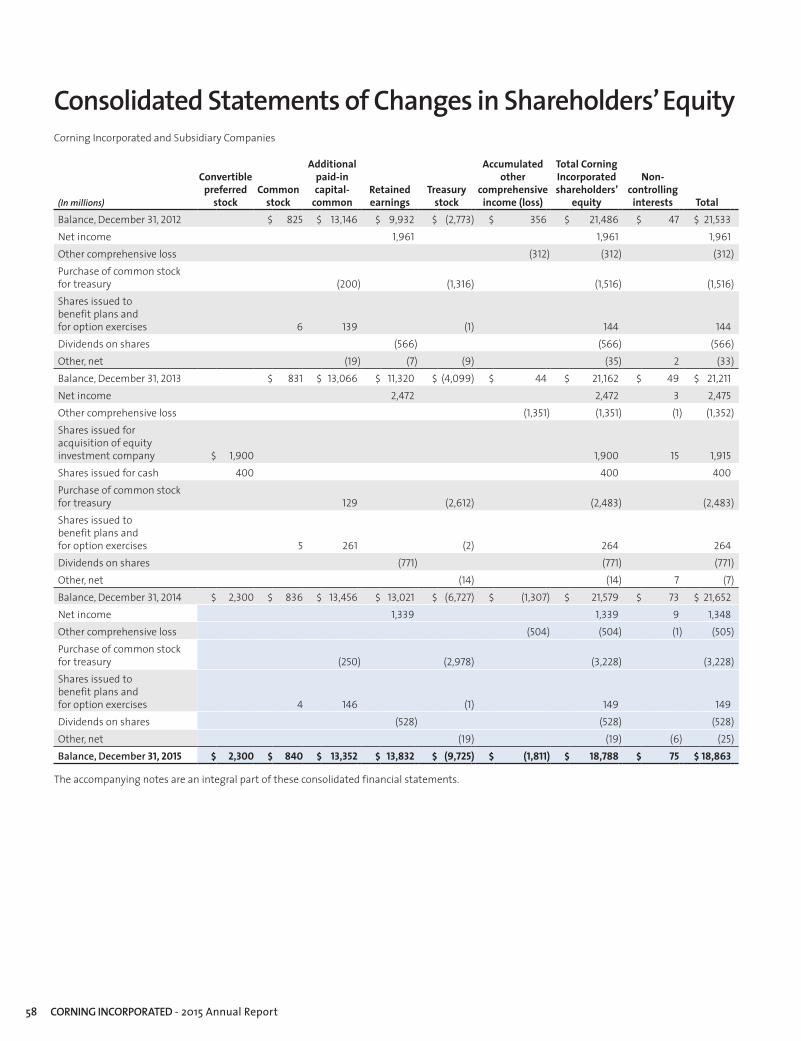
58 CORNING INCORPORATED - 2015 Annual Report
Consolidated Statements of Changes in Shareholders’ EquityCorning Incorporated and Subsidiary Companies
(In millions)
Convertible preferred
stockCommon
stock
Additional paid-in capital-
commonRetained earnings
Treasury stock
Accumulated other
comprehensive income (loss)
Total Corning Incorporated shareholders’
equity
Non- controlling
interests TotalBalance, December 31, 2012 $ 825 $ 13,146 $ 9,932 $ (2,773) $ 356 $ 21,486 $ 47 $ 21,533 Net income 1,961 1,961 1,961 Other comprehensive loss (312) (312) (312)Purchase of common stock for treasury (200) (1,316) (1,516) (1,516)Shares issued to benefit plans and for option exercises 6 139 (1) 144 144 Dividends on shares (566) (566) (566)Other, net (19) (7) (9) (35) 2 (33)Balance, December 31, 2013 $ 831 $ 13,066 $ 11,320 $ (4,099) $ 44 $ 21,162 $ 49 $ 21,211 Net income 2,472 2,472 3 2,475 Other comprehensive loss (1,351) (1,351) (1) (1,352)Shares issued for acquisition of equity investment company $ 1,900 1,900 15 1,915 Shares issued for cash 400 400 400 Purchase of common stock for treasury 129 (2,612) (2,483) (2,483)Shares issued to benefit plans and for option exercises 5 261 (2) 264 264 Dividends on shares (771) (771) (771)Other, net (14) (14) 7 (7)Balance, December 31, 2014 $ 2,300 $ 836 $ 13,456 $ 13,021 $ (6,727) $ (1,307) $ 21,579 $ 73 $ 21,652 Net income 1,339 1,339 9 1,348 Other comprehensive loss (504) (504) (1) (505)Purchase of common stock for treasury (250) (2,978) (3,228) (3,228)Shares issued to benefit plans and for option exercises 4 146 (1) 149 149 Dividends on shares (528) (528) (528)Other, net (19) (19) (6) (25)Balance, December 31, 2015 $ 2,300 $ 840 $ 13,352 $ 13,832 $ (9,725) $ (1,811) $ 18,788 $ 75 $ 18,863
The accompanying notes are an integral part of these consolidated financial statements.

59CORNING INCORPORATED - 2015 Annual Report
Notes to Consolidated Financial StatementsCorning Incorporated and Subsidiary Companies
1. Summary of Significant Accounting Policies
OrganizationCorning Incorporated is a provider of high-performance glass for notebook computers, flat panel desktop monitors, LCD televisions, and other information display applications; carrier network and enterprise network products for the telecommunications industry; ceramic substrates for gasoline and diesel engines in automotive and heavy duty vehicle markets; laboratory products for the scientific community and specialized polymer products for biotechnology applications; advanced optical materials for the semiconductor industry and the scientific community; and other technologies. In these notes, the terms “Corning,” “Company,” “we,” “us,” or “our” mean Corning Incorporated and subsidiary companies.
Basis of Presentation and Principles of ConsolidationOur consolidated financial statements were prepared in conformity with generally accepted accounting principles in the U.S. and include the assets, liabilities, revenues and expenses of all majority-owned subsidiaries over which Corning exercises control.
The equity method of accounting is used for investments in affiliated companies that are not controlled by Corning and in which our interest is generally between 20% and 50% and we have significant influence over the entity. Our share of earnings or losses of affiliated companies, in which at least 20% of the voting securities is owned and we have significant influence but not control over the entity, is included in consolidated operating results. In the fourth quarter of 2013, Corning acquired the minority interests of three shareholders in one of our affiliated companies, Samsung Corning Precision Materials, which increased Corning’s ownership percentage from 50% to 57.5%. Because this transaction did not result in a change in control based on the governing articles of this entity, Corning did not consolidate this entity as of December 31, 2013. Corning acquired the remaining ownership interests of Samsung Corning Precision Materials on January 15, 2014, which increased Corning’s ownership to 100% and resulted in consolidation of the entity beginning in the first quarter of 2014.
We use the cost method to account for our investments in companies that we do not control and for which we do not have the ability to exercise significant influence over operating and financial policies. In accordance with the cost method, these investments are recorded at cost or fair value, as appropriate.
All material intercompany accounts, transactions and profits are eliminated in consolidation.
Certain prior year amounts have been reclassified to conform to the current-year presentation. These reclassifications had no impact on our results of operations, financial position, or changes in shareholders’ equity.
Samsung Corning Precision Materials Co., Ltd. (“Samsung Corning Precision Materials”)As further discussed in Note 8 (Acquisitions) to the Consolidated Financial Statements, on January 15, 2014, Corning completed a series of strategic and financial agreements to acquire the common shares of Samsung Corning Precision Materials previously held by Samsung Display Co., Ltd. (“Samsung Display”). As a result of these transactions, Corning is now the owner of 100% of the common shares of Samsung Corning Precision Materials, which we have consolidated into our results beginning in the first quarter of 2014. Operating under the name of Corning Precision Materials Co., Ltd. (“Corning Precision Materials”), the former Samsung Corning Precision Materials organization and operations were integrated into the Display Technologies segment in the first quarter of 2014.
Use of EstimatesThe preparation of financial statements requires management to make estimates and assumptions that affect amounts reported in the consolidated financial statements and related notes. Significant estimates and assumptions in these consolidated financial statements include estimates of fair value associated with revenue recognition, restructuring charges, goodwill and long-lived asset impairment tests, estimates of acquired assets and liabilities, estimates of fair value of investments, equity interests, environmental and legal liabilities, income taxes and deferred tax valuation allowances, assumptions used in calculating pension and other postretirement employee benefit expenses and the fair value of share-based compensation. Due to the inherent uncertainty involved in making estimates, actual results reported in future periods may be different from these estimates.
Revenue RecognitionRevenue for sales of goods is recognized when a firm sales agreement is in place, delivery has occurred and sales price is fixed or determinable and collection is reasonably assured. If customer acceptance of products is not reasonably assured, sales are recorded only upon formal customer acceptance. Sales of goods typically do not include multiple product and/or service elements.
At the time revenue is recognized, allowances are recorded, with the related reduction to revenue, for estimated product returns, allowances and price discounts based upon historical experience and related terms of customer arrangements. Where we have offered product warranties, we also establish liabilities for estimated warranty costs based upon historical experience and specific warranty provisions. Warranty liabilities are adjusted when experience indicates the expected outcome will differ from initial estimates of the liability.

60 CORNING INCORPORATED - 2015 Annual Report
Notes to Consolidated Financial Statements
In addition, Corning also has contractual arrangements with certain customers in which we recognize revenue on a completed contract basis. Revenues under the completed-contract method are recognized upon substantial completion, defined as acceptance by the customer and compliance with performance specifications as agreed upon in the contract. The Company acts as a principal under the contracts, and recognizes revenues with corresponding cost of revenues on a gross basis for the full amount of the contract.
Research and Development CostsResearch and development costs are charged to expense as incurred. Research and development costs totaled $638 million in 2015, $701 million in 2014 and $613 million in 2013.
Foreign Currency Translation and TransactionsThe determination of the functional currency for Corning’s foreign subsidiaries is made based on the appropriate economic factors. For most foreign operations, the local currencies are generally considered to be the functional currencies. Corning’s most significant exception is our Taiwanese subsidiary, which uses the Japanese yen as its functional currency. For all transactions denominated in a currency other than a subsidiary’s functional currency, exchange rate gains and losses are included in income for the period in which the exchange rates changed. Foreign currency transaction losses for the years ended December 31, 2015, 2014 and 2013 were $22 million, $60 million and $190 million, respectively.
Foreign subsidiary functional currency balance sheet accounts are translated at current exchange rates, and statement of operations accounts are translated at average exchange rates for the year. Translation gains and losses are recorded as a separate component of accumulated other comprehensive income in shareholders’ equity. The effects of remeasuring non-functional currency assets and liabilities into the functional currency are included in current earnings, except for those related to intra-entity foreign currency transactions of a long-term investment nature, which are recorded together with translation gains and losses in accumulated other comprehensive income in shareholders’ equity. Upon sale or substantially complete liquidation of an investment in a foreign entity, the amount of net translation gains or losses that have been accumulated in other comprehensive income attributable to that investment are reported as a gain or loss for the period in which the sale or liquidation occurs.
Share-Based CompensationCorning’s share-based compensation programs include employee stock option grants, time-based restricted stock awards and time-based restricted stock units, as more fully described in Note 19 (Share-based Compensation) to the Consolidated Financial Statements.
The cost of share-based compensation awards is equal to the fair value of the award at the date of grant and compensation expense is recognized for those awards earned over the vesting period. Corning estimates the fair value of share-based awards using a multiple-point Black-Scholes option valuation model, which incorporates assumptions including expected volatility, dividend yield, risk-free rate, expected term and departure rates.
Cash and Cash EquivalentsCash equivalents consist of highly liquid investments that are readily convertible into cash. We consider securities with contractual maturities of three months or less, when purchased, to be cash equivalents. The carrying amount of these securities approximates fair value because of the short-term maturity of these instruments.
Supplemental disclosure of cash flow information follows (in millions):
Years ended December 31,2015 2014 2013
Non-cash transactions:Accruals for capital expenditures $ 298 $ 358 $ 185
Cash paid for interest and income taxes:Interest(1) $ 178 $ 171 $ 182Income taxes, net of refunds received $ 253 $ 577 $ 469
(1) Included in this amount are approximately $35 million, $40 million and $35 million of interest costs that were capitalized as part of property, plant and equipment, net of accumulated depreciation, in 2015, 2014 and 2013, respectively.
Short-Term InvestmentsOur short-term investments consist of available-for-sale securities that are stated at fair value. Consistent with Corning’s cash investment policy, our short-term investments consist primarily of fixed-income securities. Preservation of principal is the primary principle of our cash investment policy that is carried out by limiting interest rate, reinvestment, security, quality and event risk. Our investments are generally liquid and all are investment grade quality. The portfolio is invested predominantly in U.S. government securities and quality money market funds. Unrealized gains and losses, net of tax, are computed on a specific identification basis and are reported as a separate component of accumulated other comprehensive loss in shareholders’ equity until realized. Realized gains and losses are recorded in other (expense) income, net.
Allowance for Doubtful AccountsThe Company’s allowance for doubtful accounts is determined based on a variety of factors that affect the potential collectability of the related receivables, including length of time receivables are past due, customer credit ratings, financial stability of customers, specific one-time events and past customer history. In addition, in circumstances where the Company is made aware of a specific customer’s inability to meet its financial obligations, a specific allowance is established. The majority of accounts are individually evaluated on a regular basis and appropriate reserves are established as deemed appropriate based on the above criteria.

61CORNING INCORPORATED - 2015 Annual Report
Notes to Consolidated Financial Statements
Environmental LiabilitiesThe Company accrues for its environmental investigation, remediation, operating and maintenance costs when it is probable that a liability has been incurred and the amount can be reasonably estimated. For environmental matters, the most likely cost to be incurred is accrued based on an evaluation of currently available facts with respect to each individual site, current laws and regulations and prior remediation experience. For sites with multiple potential responsible parties, the Company considers its likely proportionate share of the anticipated remediation costs and the ability of the other parties to fulfill their obligations in establishing a provision for those costs. Where no amount within a range of estimates is more likely to occur than another, the minimum amount is accrued. When future liabilities are determined to be reimbursable by insurance coverage, an accrual is recorded for the potential liability and a receivable is recorded related to the insurance reimbursement when reimbursement is virtually certain.
The uncertain nature inherent in such remediation and the possibility that initial estimates may not reflect the final outcome could result in additional costs being recognized by the Company in future periods.
InventoriesInventories are stated at the lower of cost (first-in, first-out basis) or market.
Property, Plant and Equipment, Net of Accumulated DepreciationLand, buildings, and equipment, including precious metals, are recorded at cost. Depreciation is based on estimated useful lives of properties using the straight-line method. Except as described in Note 2 (Restructuring, Impairment and Other Charges) to the Consolidated Financial Statements related to accelerated depreciation arising from restructuring programs and Note 9 (Property, Plant and Equipment, Net of Accumulated Depreciation) to the Consolidated Financial Statements related to the depletion of precious metals, the estimated useful lives range from 10 to 40 years for buildings and 2 to 20 years for equipment.
Included in the subcategory of equipment are the following types of assets (excluding precious metals):
Asset type Range of useful lifeComputer hardware and software 3 to 7 yearsManufacturing equipment 2 to 15 yearsFurniture and fixtures 5 to 10 yearsTransportation equipment 3 to 20 years
Manufacturing equipment includes certain components of production equipment that are constructed of precious metals. These assets are not depreciated because they have very low physical losses and are repeatedly reclaimed and reused in our manufacturing process over a very long useful life. We treat the physical loss of precious metals in the manufacturing and reclamation process as depletion and account for these losses as a period expense based on actual units lost. Precious metals are integral to many of our glass production processes. They are only acquired to support our operations and are not held for trading or other purposes.
Goodwill and Other Intangible AssetsGoodwill is the excess of cost of an acquired entity over the amounts assigned to assets acquired and liabilities assumed in a business combination. Goodwill relates to and is assigned directly to a specific reporting unit. Reporting units are either operating segments or one level below the operating segment. Impairment testing for goodwill is done at a reporting unit level. Goodwill is reviewed for indicators of impairment quarterly or if an event occurs or circumstances change that indicate the carrying amount may be impaired. Corning also performs a detailed, two-step process every three years if no indicators suggest a test should be performed in the interim. We use this calculation as quantitative validation of the step-zero qualitative process; this process does not represent an election to perform the two-step process in place of the step-zero review.
The qualitative process includes an extensive review of expectations for the long-term growth of our businesses and forecasting future cash flows. If we are required to perform the two-step impairment analysis, our valuation method is an “income approach” using a discounted cash flow model in which cash flows anticipated over several periods, plus a terminal value at the end of that time horizon, are discounted to their present value using an appropriate rate of return. Our estimates are based upon our historical experience, our current knowledge from our commercial relationships, and available external information about future trends. If the fair value is less than the carrying value, a loss is recorded to reflect the difference between the fair value and carrying value.
Other intangible assets include patents, trademarks, and other intangible assets acquired from an independent party. Such intangible assets have a definite life and are amortized on a straight-line basis over estimated useful lives ranging from 4 to 50 years.
Impairment of Long-Lived Assets We review the recoverability of our long-lived assets, such as plant and equipment and intangible assets, when events or changes in circumstances occur that indicate the carrying value of the asset or asset group may not be recoverable. When impairment indicators are present, we compare estimated undiscounted future cash flows, including the eventual disposition of the asset group at market value, to the assets’ carrying value to determine if the asset group is recoverable. For an asset group that fails the test of recoverability, the estimated fair value of long-lived assets is determined using an “income approach” that starts with the forecast of all the expected future net cash flows including the eventual disposition at market value of long-lived assets, and also considers the fair market value of all precious metals. We assess the recoverability of the carrying value of long-lived assets at the lowest level for which identifiable cash flows are largely independent of the cash flows of other assets and liabilities. If there is an impairment, a loss is recorded to reflect the difference between the assets’ fair value and carrying value. Refer to Note 2 (Restructuring, Impairment and Other Charges) to the Consolidated Financial Statements for more detail.
Employee Retirement PlansCorning offers employee retirement plans consisting of defined benefit pension plans covering certain domestic and international employees and postretirement plans that provide health care and life insurance benefits for eligible retirees and dependents. The costs and obligations related to these benefits reflect the Company’s assumptions related to general economic conditions (particularly interest rates), expected return on plan assets, rate of compensation increase for employees and health care trend rates. The cost of providing plan benefits depends on demographic assumptions including retirements, mortality, turnover and plan participation.

62 CORNING INCORPORATED - 2015 Annual Report
Notes to Consolidated Financial Statements
Costs for our defined benefit pension plans consist of two elements: 1) on-going costs recognized quarterly, which are comprised of service and interest costs, expected return on plan assets and amortization of prior service costs; and 2) mark-to-market gains and losses outside of the corridor, where the corridor is equal to 10% of the greater of the benefit obligation or the market-related value of plan assets at the beginning of the year, which are recognized annually in the fourth quarter of each year. These gains and losses result from changes in actuarial assumptions for discount rates and the differences between actual and expected return on plan assets. Any interim remeasurements triggered by a curtailment, settlement or significant plan changes, as well as any true-up to the annual valuation, are recognized as a mark-to-market adjustment in the quarter in which such event occurs.
Costs for our postretirement benefit plans consist of on-going costs recognized quarterly, and are comprised of service and interest costs, amortization of prior service costs and amortization of actuarial gains and losses. We recognize the actuarial gains and losses resulting from changes in actuarial assumptions for discount rates as a component of Shareholders’ Equity on our consolidated balance sheets on an annual basis and amortize them into our operating results over the average remaining service period of employees expected to receive benefits under the plans, to the extent such gains and losses are outside of the corridor.
Refer to Note 13 (Employee Retirement Plans) to the Consolidated Financial Statements for additional detail.
Treasury StockShares of common stock repurchased by us are recorded at cost as treasury stock and result in a reduction of Shareholders’ Equity in the consolidated balance sheets. From time to time, treasury shares may be reissued as contributions to our employee benefit plans and for the retirement or conversion of certain debt instruments. When shares are reissued, we use an average cost method for determining cost. The difference between the cost of the shares and the reissuance price is added to or deducted from additional paid-in capital.
Income TaxesThe Company accounts for income taxes using the asset and liability method. Under this method, deferred tax assets and liabilities are recognized for the future tax consequences attributable to operating loss and tax credit carryforwards and for differences between the carrying amounts of existing assets and liabilities and their respective tax bases.
The effective income tax rate reflects our assessment of the ultimate outcome of tax audits. In evaluating the tax benefits associated with our various tax filing positions, we record a tax benefit for uncertain tax positions using the highest cumulative tax benefit that is more likely than not to be realized. Adjustments are made to our liability for unrecognized tax benefits in the period in which we determine the issue is effectively settled with the tax authorities, the statute of limitations expires for the return containing the tax position or when new information becomes available. Our liability for unrecognized tax benefits, including accrued penalties and interest, is included in other accrued liabilities and other long-term liabilities on our consolidated balance sheets and in income tax expense in our consolidated statements of income.
Discrete events such as audit settlements or changes in tax laws are recognized in the period in which they occur. Valuation allowances are established when management is unable to conclude that it is more likely than not that some portion, or all, of the deferred tax asset will ultimately be realized.
The Company is subject to income taxes in the United States and in numerous foreign jurisdictions. With minor exceptions, no provision is made for U.S. income taxes on the undistributed earnings of wholly-owned foreign subsidiaries because substantially all such earnings are indefinitely reinvested in those companies. Provision for the tax consequences of distributions, if any, from consolidated foreign subsidiaries is recorded in the year in which the earnings are no longer indefinitely reinvested in those subsidiaries.
Equity Method InvestmentsOur equity method investments are reviewed for impairment on a periodic basis or if an event occurs or circumstances change that indicate the carrying amount may be impaired. This assessment is based on a review of the equity investments’ performance and a review of indicators of impairment to determine if there is evidence of a loss in value of an equity investment. Factors we consider include:
• Absence of our ability to recover the carrying amount;
• Inability of the equity affiliate to sustain an earnings capacity which would justify the carrying amount of the investment; and
• Significant litigation, bankruptcy or other events that could impact recoverability.
For an equity investment with impairment indicators, we measure fair value on the basis of discounted cash flows or other appropriate valuation methods, depending on the nature of the company involved. If it is probable that we will not recover the carrying amount of our investment, the impairment is considered other-than-temporary and recorded in earnings, and the equity investment balance is reduced to its fair value accordingly. We require our material equity method affiliates to provide audited financial statements. Consequently, adjustments for asset recoverability are included in equity earnings. We also utilize these financial statements in our recoverability assessment.
Fair Value of Financial InstrumentsMajor categories of financial assets and liabilities, including short-term investments, other assets and derivatives are measured at fair value on a recurring basis. Certain assets and liabilities including long-lived assets, goodwill, asset retirement obligations, and cost and equity investments are measured at fair value on a nonrecurring basis.
Fair value is the price that would be received from selling an asset or paid to transfer a liability in an orderly transaction between market participants at the measurement date. When determining the fair value measurements for assets and liabilities required to be recorded at fair value, we consider the principal or most advantageous market in which we would transact and consider assumptions that market participants would use when pricing the asset or liability, such as inherent risk, transfer restrictions, and risk of nonperformance.
Derivative InstrumentsWe participate in a variety of foreign exchange forward contracts and foreign exchange option contracts entered into in connection with the management of our exposure to fluctuations in foreign exchange rates. We utilize interest rate swaps to reduce the risk of changes in a benchmark interest rate from the probable forecasted issuance of debt and to swap fixed rate interest payments into floating rate interest payments. These financial exposures are managed in accordance with corporate policies and procedures.

63CORNING INCORPORATED - 2015 Annual Report
Notes to Consolidated Financial Statements
All derivatives are recorded at fair value on the balance sheet. Changes in the fair value of derivatives designated as cash flow hedges and hedges of net investments in foreign operations are not recognized in current operating results but are recorded in accumulated other comprehensive income. Amounts related to cash flow hedges are reclassified from accumulated other comprehensive income when the underlying hedged item impacts earnings. This reclassification is recorded in the same line item of the consolidated statement of income as where the effects of the hedged item are recorded, typically sales, cost of sales or other (expense) income, net. Changes in the fair value of derivatives designated as fair value hedges are recorded currently in earnings offset, to the extent the derivative was effective, by the change in the fair value of the hedged item. Changes in the fair value of derivatives not designated as hedging instruments are recorded currently in earnings in the Foreign currency hedge gain, net line of the consolidated statement of income.
New Accounting Standards In May 2014, the Financial Accounting Standards Board (“FASB”) issued Accounting Standards Update No. (“ASU”) 2014-09, Revenue from Contracts with Customers, as a new Topic, Accounting Standards Codification (“ASC”) Topic 606. The new revenue recognition standard provides a five-step analysis of transactions to determine when and how revenue is recognized. The core principle is that a company should
recognize revenue to depict the transfer of promised goods or services to customers in an amount that reflects the consideration to which the entity expects to be entitled in exchange for those goods or services. This ASU originally was effective for annual periods beginning after December 15, 2016, including interim periods within that reporting period. This ASU shall be applied retrospectively to each period presented or as a cumulative-effect adjustment as of the date of adoption.
In August 2015, the FASB issued ASU 2015-14, Revenue from Contracts with Customers (Topic 606), deferring the effective date of ASU 2014-09 by one year. We can elect to adopt the provisions of ASU 2014-09 for annual periods beginning after December 15, 2017, including interim periods within that reporting period. The FASB also agreed to allow entities to choose to adopt the standard as of the original effective date. We are currently assessing the adoption date and potential impact of adopting ASU 2014-09 on our financial statements and related disclosures.
In November 2015, the FASB issued ASU 2015-17, Income Taxes (Topic 740), requiring deferred tax assets and liabilities to be classified as noncurrent in a classified balance sheet. This ASU is effective for annual periods beginning after December 15, 2016, and interim periods within those annual periods. Early adoption is permitted as of the beginning of an interim or annual reporting period. We have adopted this ASU prospectively for the year ended December 31, 2015. See Note 6 (Income Taxes) to the Consolidated Financial Statements for additional information.
2. Restructuring, Impairment and Other Charges
2015 ActivityFor the year ended December 31, 2015, we did not record significant restructuring, impairment and other charges or reversals. Cash expenditures for restructuring activities were $40 million.
2014 ActivityFor the year ended December 31, 2014, we recorded charges of $71 million for workforce reductions, asset disposals and write-offs, and exit costs for restructuring activities with total cash expenditures of approximately $39 million.
The following table summarizes the restructuring, impairment and other charges as of and for the year ended December 31, 2014 (in millions):
Reserve at January 1, 2014
Net Charges/ Reversals
Non cash adjustments
Cash payments
Reserve at December 31, 2014
Restructuring:Employee related costs $ 36 $ 48 $ (9) $ (31) $ 44Other charges (credits) 8 1 (1) (8)
Total restructuring activity $ 44 $ 49 $ (10) $ (39) $ 44Impairment charges and disposal of long-lived assets: $ 22Total restructuring, impairment and other charges $ 71
Cash payments for employee-related and exit activity related to the 2014 restructuring actions were substantially completed in 2015.
2013 ActivityTo better align our 2014 cost position in several of our businesses, Corning implemented a global restructuring plan within several of our segments in the fourth quarter of 2013, consisting of workforce
reductions, asset disposals and write-offs, and exit costs. We recorded charges of $67 million, before tax, associated with these actions, with cash expenditures of $35 million.

64 CORNING INCORPORATED - 2015 Annual Report
Notes to Consolidated Financial Statements
The following table summarizes the restructuring, impairment and other charges as of and for the year ended December 31, 2013 (in millions):
Reserve at January 1,
2013
Net Charges/ Reversals
Non cash adjustments
Cash payments
Reserve at December 31, 2013
Restructuring:Employee related costs $ 38 $ 34 $ (4) $ (32) $ 36Other charges (credits) 4 7 (3) 8
Total restructuring activity $ 42 $ 41 $ (4) $ (35) $ 44Impairment charges and disposal of long-lived assets: $ 26Total restructuring, impairment and other charges $ 67
Cash payments for employee-related and exit activity related to the 2013 corporate-wide restructuring plan were substantially completed in 2014.
3. Available-for-Sale Investments
The following is a summary of the fair value of available-for-sale securities (in millions):
Amortized cost December 31, Fair value December 31,2015 2014 2015 2014
Bonds, notes and other securities:U.S. government and agencies $ 100 $ 759 $ 100 $ 759
Total short-term investments $ 100 $ 759 $ 100 $ 759Asset-backed securities $ 37 $ 42 $ 33 $ 38
Total long-term investments $ 37 $ 42 $ 33 $ 38
We do not intend to sell, nor do we believe it is more likely than not that we would be required to sell, the long-term investment asset-backed securities (which are collateralized by mortgages) before recovery of their amortized cost basis. It is possible that a significant degradation in the delinquency or foreclosure rates in the underlying assets could cause further temporary or other-than-temporary impairments in the future.
The following table summarizes the contractual maturities of available-for-sale securities at December 31, 2015 (in millions):
Less than one year $ 70Due in 1-5 years 30Due in 5-10 yearsDue after 10 years 33
Total $ 133
Unrealized gains and losses, net of tax, are computed on a specific identification basis and are reported as a separate component of accumulated other comprehensive loss in shareholders’ equity until realized.
The following tables provide the fair value and gross unrealized losses of the Company’s investments and unrealized losses that are not deemed to be other-than-temporarily impaired, aggregated by investment category and length of time that individual securities have been in a continuous unrealized loss position at December 31, 2015 and 2014:
(in millions)
December 31, 2015
Number of securities in
a loss position
12 months or greater Total
Fair valueUnrealized
losses(1) Fair valueUnrealized
lossesAsset-backed securities 21 $ 33 $ (4) $ 33 $ (4)
Total long-term investments 21 $ 33 $ (4) $ 33 $ (4)
(1) Unrealized losses in securities less than 12 months were not significant.

65CORNING INCORPORATED - 2015 Annual Report
Notes to Consolidated Financial Statements
(in millions)
December 31, 2014
Number of securities in
a loss position
12 months or greater Total
Fair valueUnrealized
losses(1) Fair valueUnrealized
lossesAsset-backed securities 21 $ 37 $ (4) $ 37 $ (4)
Total long-term investments 21 $ 37 $ (4) $ 37 $ (4)(1) Unrealized losses in securities less than 12 months were not significant.
Proceeds from sales and maturities of short-term investments totaled $1.6 billion, $1.2 billion and $2.0 billion in 2015, 2014 and 2013, respectively.
4. Significant Customers
For 2015, Corning’s sales to Samsung Display Co. Ltd., a customer of our Display Technologies and Specialty Materials segments, represented 11% of the Company’s consolidated net sales. For 2014, Corning’s sales to Samsung Display Co. Ltd., a customer of our Display Technologies segment, represented 14% of the Company’s consolidated net sales. In 2013, Corning’s sales to AU Optronics Corporation, a customer of our Display Technologies segment, represented 10% of the Company’s consolidated net sales.
5. Inventories, Net of Inventory Reserves
Inventories, net of inventory reserves comprise the following (in millions):
December 31,2015 2014
Finished goods $ 633 $ 586Work in process 264 255Raw materials and accessories 200 202Supplies and packing materials 288 279Total inventories, net of inventory reserves $ 1,385 $ 1,322
6. Income Taxes
Income before income taxes follows (in millions):
Years ended December 31,2015 2014 2013
U.S. companies $ 426 $ 2,384 $ 1,274Non-U.S. companies 1,060 1,184 1,199Income before income taxes $ 1,486 $ 3,568 $ 2,473

66 CORNING INCORPORATED - 2015 Annual Report
Notes to Consolidated Financial Statements
The current and deferred amounts of the provision (benefit) for income taxes follow (in millions):
Years ended December 31,2015 2014 2013
Current:Federal $ 40 $ 38 $ 3State and municipal 20 32 12Foreign 33 414 308
Deferred:Federal 144 411 112State and municipal 30 (9) 50Foreign (120) 210 27
Provision for income taxes $ 147 $ 1,096 $ 512
Amounts are reflected in the preceding tables based on the location of the taxing authorities.
Reconciliation of the U.S. statutory income tax rate to our effective tax rate for continuing operations follows:
Years ended December 31,2015 2014 2013
Statutory U.S. income tax rate 35.0% 35.0% 35.0%State income tax (benefit), net of federal effect 0.1 4.9(9) 0.6Tax holidays(1) (0.5) (0.4) (1.2)Investment and other tax credits(2) (1.7) (0.3) (2.0)Rate difference on foreign earnings (19.8)(11) (8.3) (8.1)(4)
Uncertain tax positions 4.3(10) (0.1) 0.2Equity earnings impact(3) (5.4) (2.0) (6.6)Valuation allowances (4.2)(7) 0.8(6) 3.1(5)
Other items, net 2.1 1.1(8) (0.3)Effective income tax (benefit) rate 9.9% 30.7% 20.7%
(1) Primarily related to a subsidiary in Taiwan operating under tax holiday arrangements. The nature and extent of such arrangements vary, and the benefits of existing arrangements phase out in future years (through 2018). The impact of tax holidays on net income per share on a diluted basis was $0.01 in 2015, $0.01 in 2014 and $0.02 in 2013.
(2) Primarily related to research and development and other credits in the U.S.(3) Equity in earnings of nonconsolidated affiliates reported in the financials net of tax. The difference between 2013-2014 was due to the change of
Samsung Corning Precision Materials from an equity company to a consolidated entity.(4) In 2013, $74 million of tax benefit increase was due to $37 million expense recorded in 2012 that was reversed in the first quarter of 2013 as a result
of the retroactive application of the American Taxpayer Relief Act enacted on January 3, 2013. In 2013, the additional increase in the benefit was attributable to excess foreign tax credits realized in U.S. from a taxable intercompany loan.
(5) Primarily related to change in judgment on the realizability of Australia and certain state deferred tax assets.(6) $177 million tax expense related to change in judgment on the realizability of Germany and Japan deferred tax assets is partially offset with benefit
from state deferred tax asset valuation allowance reductions, including the valuation allowance relating to the New York State attribute reduction discussed in (9) below.
(7) $100 million tax benefit primarily related to change in judgment on the realizability of Germany and Japan deferred tax assets is partially offset with tax expense from U.S. state and China deferred tax allowance increases.
(8) Includes in 2014, $9 million benefit for domestic manufacturing deduction and $46 million of tax expense related to out of period transfer pricing adjustments. The impact of these corrections is not material to any individual period previously presented.
(9) Includes $100 million tax expense related to the write-off of New York State tax attributes for a state law change that were offset with full valuation allowance.
(10) Unrecognized tax benefit reserve was primarily for tax positions taken related to transfer pricing of which $31 million tax expense is related to out of period adjustments. The impact of these corrections is not material to any individual period previously presented. Since the Company operates in a number of countries with income tax treaties, an offsetting benefit was recorded where it believes it is more-likely-than-not to receive competent authority relief.
(11) Tax benefit is primarily for excess foreign tax credits resulting from the inclusion of high-taxed foreign earnings in U.S. income and the income of Taiwan and Korea subsidiaries with lower statutory rates than the U.S. The amount of tax benefit in 2015 is relatively consistent with 2014. The change in the effective tax rate reconciliation percentage is driven by the significant decrease in the gain on our foreign currency translation hedges in 2015 versus 2014.

67CORNING INCORPORATED - 2015 Annual Report
Notes to Consolidated Financial Statements
The tax effects of temporary differences and carryforwards that gave rise to significant portions of the deferred tax assets and liabilities follows (in millions):
December 31,2015 2014
Loss and tax credit carryforwards $ 1,151 $ 1,235Other assets 69 69Asset impairments and restructuring reserves 153 170Postretirement medical and life benefits 276 312Other accrued liabilities 265 246Other employee benefits 505 473
Gross deferred tax assets 2,419 2,505Valuation allowance (238) (298)
Total deferred tax assets 2,181 2,207Intangible and other assets (181) (152)Fixed assets (284) (299)
Total deferred tax liabilities (465) (451)Net deferred tax assets $ 1,716 $ 1,756
The net deferred tax assets are classified in our consolidated balance sheets as follows (in millions):
December 31,2015 2014
Current deferred tax assets $ 248Non-current deferred tax assets $ 2,056 1,889Current deferred tax liabilities (5)Non-current deferred tax liabilities (340) (376)Net deferred tax assets $ 1,716 $ 1,756
Corning adopted ASU 2015-17 prospectively. All deferred taxes are classified as non-current on the balance sheet as of December 31, 2015. Prior periods were not retrospectively adjusted.
Details on deferred tax assets for loss and tax credit carryforwards at December 31, 2015 follow (in millions):
ExpirationAmount 2016-2020 2021-2025 2026-2035 Indefinite
Net operating losses $ 406 $ 127 $ 63 $ 3 $ 213Tax credits 745 414 58 237 36Totals as of December 31, 2015 $ 1,151 $ 541 $ 121 $ 240 $ 249
The recognition of windfall tax benefits from share-based compensation deducted on the tax return is prohibited until realized through a reduction of income tax payable. Cumulative tax benefits totaling $244 million will be recorded in additional paid-in-capital when credit carryforwards are utilized and the windfall tax benefit can be realized.
Deferred tax assets are to be reduced by a valuation allowance if, based on the weight of available positive and negative evidence, it is more likely than not (a likelihood of greater than 50 percent) that some portion or all of the deferred tax assets will not be realized. Corning has valuation allowances on certain shorter-lived deferred tax assets such as those represented by capital loss and state tax net operating loss carryforwards, as well as other foreign net operating loss carryforwards,
because we cannot conclude that it is more likely than not that we will earn income of the character required to utilize these assets before they expire. U.S. profits of approximately $4.7 billion will be required to fully realize the U.S. deferred tax assets as of December 31, 2015, of which $88 million will be required over the next 20 years to realize the deferred tax assets related to general business credits and $1.9 billion of foreign sourced income will be required over the next 10 years to fully realize the deferred tax assets associated with foreign tax credits. The amount of U.S. and foreign deferred tax assets that have remaining valuation allowances at December 31, 2015 and 2014 was $238 million and $298 million, respectively.

68 CORNING INCORPORATED - 2015 Annual Report
Notes to Consolidated Financial Statements
The following is a tabular reconciliation of the total amount of unrecognized tax benefits (in millions):
2015 2014Balance at January 1 $ 10 $ 15Additions based on tax positions related to the current yearAdditions for tax positions of prior years 245 5Reductions for tax positions of prior years (1)Settlements and lapse of statute of limitations (1) (10)Balance at December 31 $ 253 $ 10
The additions for tax positions of prior years include $221 million for unrecognized tax benefits related to gross transfer pricing adjustments. See footnote (10) of the Reconciliation of the U.S. statutory income tax rate to our effective tax rate for continuing operations above for more information. Included in the balance at December 31, 2015 and 2014 are $102 million and $5 million, respectively, of unrecognized tax benefits that would impact our effective tax rate if recognized.
We recognize accrued interest and penalties associated with uncertain tax positions as part of tax expense. For the year ended December 31, 2015 the amount recognized in interest expense is $6 million. In 2014 and 2013, the amounts recognized in interest expense and income were immaterial. The amounts accrued at December 31, 2015 and 2014 for the payment of interest and penalties was $5 million and $1 million, respectively.
While we expect the amount of unrecognized tax benefits to change in the next 12 months, we do not expect the change to have a significant impact on the results of operations or our financial position.
Corning Incorporated, as the common parent company, and all 80%-or-more-owned of its U.S. subsidiaries join in the filing of consolidated U.S. federal income tax returns. All such returns for periods ended through December 31, 2004, have been audited by and settled with the Internal Revenue Service (IRS). The statute of limitations is closed for all returns prior to 2002, but the IRS can make adjustments for the return in which the NOL, U.S. foreign tax and research experimentation credit carryovers are utilized.
Corning Incorporated and its U.S. subsidiaries file income tax returns on a combined, unitary or stand-alone basis in multiple state and local
jurisdictions, which generally have statutes of limitations ranging from 3 to 5 years. Various state income tax returns are currently in the process of examination or administrative appeal.
Our foreign subsidiaries file income tax returns in the countries in which they have operations. Generally, these countries have statutes of limitations ranging from 3 to 7 years. Years still open to examination by foreign tax authorities in major jurisdictions include Japan (2009 onward), Taiwan (2014 onward) and South Korea (2015 onward).
Corning continues to indefinitely reinvest substantially all of its foreign earnings, with the exception of an immaterial amount of current earnings that have very low or no tax cost associated with their repatriation. Our current analysis indicates that we have sufficient U.S. liquidity, including borrowing capacity, to fund foreseeable U.S. cash needs without requiring the repatriation of foreign cash. One time or unusual items that may impact our ability or intent to keep our foreign earnings and cash indefinitely reinvested include significant U.S. acquisitions, stock repurchases, shareholder dividends, changes in tax laws, derivative contract settlements or the development of tax planning ideas that allow us to repatriate earnings at minimal or no tax cost, and/or a change in our circumstances or economic conditions that negatively impact our ability to borrow or otherwise fund U.S. needs from existing U.S. sources. As of December 31, 2015, taxes have not been provided on approximately $11 billion of accumulated foreign unremitted earnings that are expected to remain invested indefinitely. While it remains impracticable to calculate the tax cost of repatriating our total unremitted foreign earnings, such cost could be material to the results of operations of Corning in a particular period.
7. Investments
Investments comprise the following (in millions):
Ownership interest(1)
December 31,2015 2014
Affiliated companies accounted for by the equity methodDow Corning 50% $ 1,483 $ 1,325All other 20% to 50% 422 452
1,905 1,777Other investments 70 24Total $ 1,975 $ 1,801
(1) Amounts reflect Corning’s direct ownership interests in the respective affiliated companies at December 31, 2015. Corning does not control any of such entities.
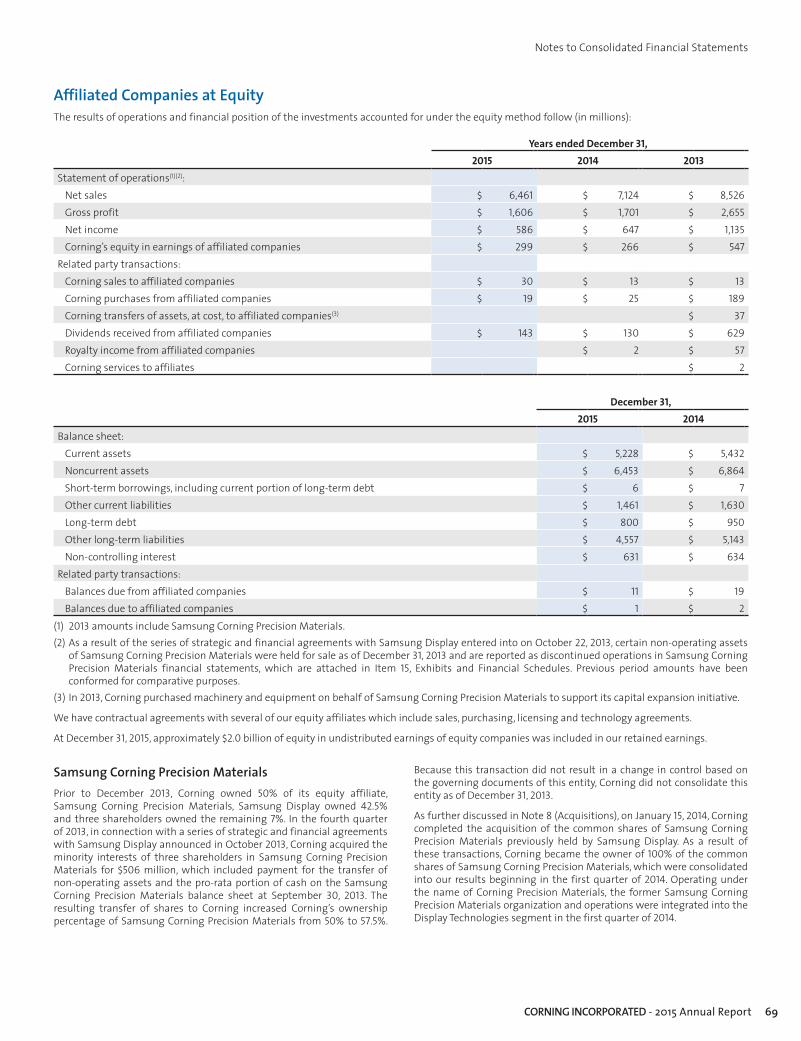
69CORNING INCORPORATED - 2015 Annual Report
Notes to Consolidated Financial Statements
Affiliated Companies at EquityThe results of operations and financial position of the investments accounted for under the equity method follow (in millions):
Years ended December 31,2015 2014 2013
Statement of operations(1)(2):Net sales $ 6,461 $ 7,124 $ 8,526Gross profit $ 1,606 $ 1,701 $ 2,655Net income $ 586 $ 647 $ 1,135Corning’s equity in earnings of affiliated companies $ 299 $ 266 $ 547
Related party transactions:Corning sales to affiliated companies $ 30 $ 13 $ 13Corning purchases from affiliated companies $ 19 $ 25 $ 189Corning transfers of assets, at cost, to affiliated companies(3) $ 37Dividends received from affiliated companies $ 143 $ 130 $ 629Royalty income from affiliated companies $ 2 $ 57Corning services to affiliates $ 2
December 31,2015 2014
Balance sheet:Current assets $ 5,228 $ 5,432Noncurrent assets $ 6,453 $ 6,864Short-term borrowings, including current portion of long-term debt $ 6 $ 7Other current liabilities $ 1,461 $ 1,630Long-term debt $ 800 $ 950Other long-term liabilities $ 4,557 $ 5,143Non-controlling interest $ 631 $ 634
Related party transactions:Balances due from affiliated companies $ 11 $ 19Balances due to affiliated companies $ 1 $ 2
(1) 2013 amounts include Samsung Corning Precision Materials.(2) As a result of the series of strategic and financial agreements with Samsung Display entered into on October 22, 2013, certain non-operating assets
of Samsung Corning Precision Materials were held for sale as of December 31, 2013 and are reported as discontinued operations in Samsung Corning Precision Materials financial statements, which are attached in Item 15, Exhibits and Financial Schedules. Previous period amounts have been conformed for comparative purposes.
(3) In 2013, Corning purchased machinery and equipment on behalf of Samsung Corning Precision Materials to support its capital expansion initiative.
We have contractual agreements with several of our equity affiliates which include sales, purchasing, licensing and technology agreements.
At December 31, 2015, approximately $2.0 billion of equity in undistributed earnings of equity companies was included in our retained earnings.
Samsung Corning Precision MaterialsPrior to December 2013, Corning owned 50% of its equity affiliate, Samsung Corning Precision Materials, Samsung Display owned 42.5% and three shareholders owned the remaining 7%. In the fourth quarter of 2013, in connection with a series of strategic and financial agreements with Samsung Display announced in October 2013, Corning acquired the minority interests of three shareholders in Samsung Corning Precision Materials for $506 million, which included payment for the transfer of non-operating assets and the pro-rata portion of cash on the Samsung Corning Precision Materials balance sheet at September 30, 2013. The resulting transfer of shares to Corning increased Corning’s ownership percentage of Samsung Corning Precision Materials from 50% to 57.5%.
Because this transaction did not result in a change in control based on the governing documents of this entity, Corning did not consolidate this entity as of December 31, 2013.
As further discussed in Note 8 (Acquisitions), on January 15, 2014, Corning completed the acquisition of the common shares of Samsung Corning Precision Materials previously held by Samsung Display. As a result of these transactions, Corning became the owner of 100% of the common shares of Samsung Corning Precision Materials, which were consolidated into our results beginning in the first quarter of 2014. Operating under the name of Corning Precision Materials, the former Samsung Corning Precision Materials organization and operations were integrated into the Display Technologies segment in the first quarter of 2014.
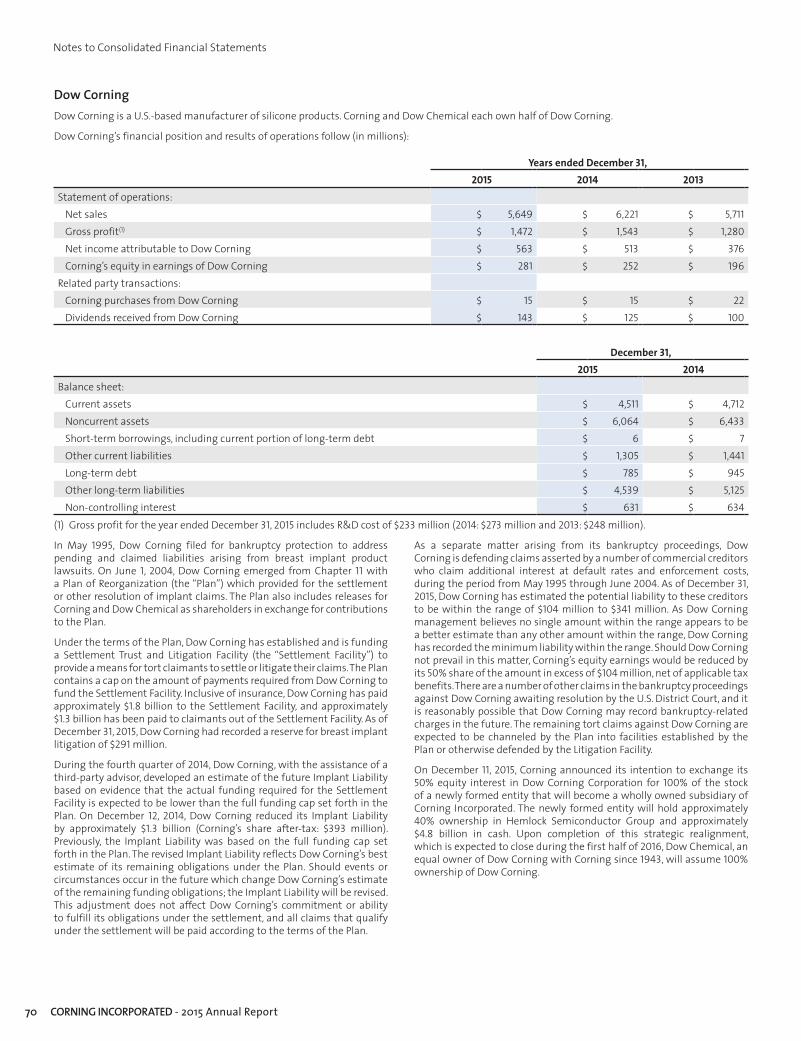
70 CORNING INCORPORATED - 2015 Annual Report
Notes to Consolidated Financial Statements
Dow CorningDow Corning is a U.S.-based manufacturer of silicone products. Corning and Dow Chemical each own half of Dow Corning.
Dow Corning’s financial position and results of operations follow (in millions):
Years ended December 31,2015 2014 2013
Statement of operations:Net sales $ 5,649 $ 6,221 $ 5,711Gross profit(1) $ 1,472 $ 1,543 $ 1,280Net income attributable to Dow Corning $ 563 $ 513 $ 376Corning’s equity in earnings of Dow Corning $ 281 $ 252 $ 196
Related party transactions:Corning purchases from Dow Corning $ 15 $ 15 $ 22Dividends received from Dow Corning $ 143 $ 125 $ 100
December 31,2015 2014
Balance sheet:Current assets $ 4,511 $ 4,712Noncurrent assets $ 6,064 $ 6,433Short-term borrowings, including current portion of long-term debt $ 6 $ 7Other current liabilities $ 1,305 $ 1,441Long-term debt $ 785 $ 945Other long-term liabilities $ 4,539 $ 5,125Non-controlling interest $ 631 $ 634
(1) Gross profit for the year ended December 31, 2015 includes R&D cost of $233 million (2014: $273 million and 2013: $248 million).
In May 1995, Dow Corning filed for bankruptcy protection to address pending and claimed liabilities arising from breast implant product lawsuits. On June 1, 2004, Dow Corning emerged from Chapter 11 with a Plan of Reorganization (the “Plan”) which provided for the settlement or other resolution of implant claims. The Plan also includes releases for Corning and Dow Chemical as shareholders in exchange for contributions to the Plan.
Under the terms of the Plan, Dow Corning has established and is funding a Settlement Trust and Litigation Facility (the “Settlement Facility”) to provide a means for tort claimants to settle or litigate their claims. The Plan contains a cap on the amount of payments required from Dow Corning to fund the Settlement Facility. Inclusive of insurance, Dow Corning has paid approximately $1.8 billion to the Settlement Facility, and approximately $1.3 billion has been paid to claimants out of the Settlement Facility. As of December 31, 2015, Dow Corning had recorded a reserve for breast implant litigation of $291 million.
During the fourth quarter of 2014, Dow Corning, with the assistance of a third-party advisor, developed an estimate of the future Implant Liability based on evidence that the actual funding required for the Settlement Facility is expected to be lower than the full funding cap set forth in the Plan. On December 12, 2014, Dow Corning reduced its Implant Liability by approximately $1.3 billion (Corning’s share after-tax: $393 million). Previously, the Implant Liability was based on the full funding cap set forth in the Plan. The revised Implant Liability reflects Dow Corning’s best estimate of its remaining obligations under the Plan. Should events or circumstances occur in the future which change Dow Corning’s estimate of the remaining funding obligations; the Implant Liability will be revised. This adjustment does not affect Dow Corning’s commitment or ability to fulfill its obligations under the settlement, and all claims that qualify under the settlement will be paid according to the terms of the Plan.
As a separate matter arising from its bankruptcy proceedings, Dow Corning is defending claims asserted by a number of commercial creditors who claim additional interest at default rates and enforcement costs, during the period from May 1995 through June 2004. As of December 31, 2015, Dow Corning has estimated the potential liability to these creditors to be within the range of $104 million to $341 million. As Dow Corning management believes no single amount within the range appears to be a better estimate than any other amount within the range, Dow Corning has recorded the minimum liability within the range. Should Dow Corning not prevail in this matter, Corning’s equity earnings would be reduced by its 50% share of the amount in excess of $104 million, net of applicable tax benefits. There are a number of other claims in the bankruptcy proceedings against Dow Corning awaiting resolution by the U.S. District Court, and it is reasonably possible that Dow Corning may record bankruptcy-related charges in the future. The remaining tort claims against Dow Corning are expected to be channeled by the Plan into facilities established by the Plan or otherwise defended by the Litigation Facility.
On December 11, 2015, Corning announced its intention to exchange its 50% equity interest in Dow Corning Corporation for 100% of the stock of a newly formed entity that will become a wholly owned subsidiary of Corning Incorporated. The newly formed entity will hold approximately 40% ownership in Hemlock Semiconductor Group and approximately $4.8 billion in cash. Upon completion of this strategic realignment, which is expected to close during the first half of 2016, Dow Chemical, an equal owner of Dow Corning with Corning since 1943, will assume 100% ownership of Dow Corning.

71CORNING INCORPORATED - 2015 Annual Report
Notes to Consolidated Financial Statements
Pittsburgh Corning Corporation and Asbestos Litigation.Corning and PPG Industries, Inc. (“PPG”) each own 50% of the capital stock of Pittsburgh Corning Corporation (“PCC”). Over a period of more than two decades, PCC and several other defendants were named in numerous lawsuits involving claims alleging personal injury from exposure to asbestos. On April 16, 2000, PCC filed for Chapter 11 reorganization in the U.S. Bankruptcy Court for the Western District of Pennsylvania. At the time PCC filed for bankruptcy protection, there were approximately 11,800 claims pending against Corning in state court lawsuits alleging various theories of liability based on exposure to PCC’s asbestos products and typically requesting monetary damages in excess of one million dollars per claim. Corning has defended those claims on the basis of the separate corporate status of PCC and the absence of any facts supporting claims of direct liability arising from PCC’s asbestos products.
PCC Plan of Reorganization
Corning, with other relevant parties, has been involved in ongoing efforts to develop a Plan of Reorganization that would resolve the concerns and objections of the relevant courts and parties. On November 12, 2013, the Bankruptcy Court issued a decision finally confirming an Amended PCC Plan of Reorganization (the “Amended PCC Plan” or the “Plan”). On September 30, 2014, the United States District Court for the Western District of Pennsylvania (the “District Court”) affirmed the Bankruptcy Court’s decision confirming the Amended PCC Plan. On October 30, 2014, one of the objectors to the Plan appealed the District Court’s affirmation of the Plan to the United States Court of Appeals for the Third Circuit (the “Third Circuit Court of Appeals”). On January 6, 2016, all pending appeals of the Plan were withdrawn and Corning expects that the Plan will become effective in April 2016.
Under the Plan as affirmed by the Bankruptcy Court and affirmed by the District Court, Corning is required to contribute its equity interests in PCC and Pittsburgh Corning Europe N.V. (“PCE”), a Belgian corporation, and to contribute $290 million in a fixed series of payments, recorded at present value. Corning will contribute its equity interest in PCC and PCE on the Plan’s Funding Effective Date, which is expected to occur in June 2016. Corning has the option to use its common stock rather than cash to make these payments, but the liability is fixed by dollar value and not the number of shares. The Plan requires Corning to make: (1) one payment of $70 million one year from the date the Plan becomes effective and certain conditions are met; and (2) five additional payments of $35 million, $50 million, $35 million, $50 million, and $50 million, respectively, on each of the five subsequent anniversaries of the first payment, the final payment of which is subject to reduction based on the application of credits under certain circumstances.
Non-PCC Asbestos Litigation
In addition to the claims against Corning related to its ownership interest in PCC, Corning is also the defendant in approximately 9,700 other cases (approximately 37,300 claims) alleging injuries from asbestos related to its Corhart business and similar amounts of monetary damages per case (the “non-PCC asbestos claims”). When PCC filed for bankruptcy protection, the Court granted a preliminary injunction to suspend all asbestos cases against PCC, PPG and Corning – including these non-PCC asbestos claims (the “Stay”). The Stay remains in place as of the date of this filing; however,
given that the Amended PCC Plan is now affirmed by the District Court and the Third Circuit Court of Appeals, Corning anticipates the Stay will be lifted in the second half of 2016. These non-PCC asbestos claims have been covered by insurance without material impact to Corning to date. As of December 31, 2015, Corning had received for these claims approximately $19 million in insurance payments. When the Stay is lifted, these non-PCC asbestos claims will be allowed to proceed against Corning. In prior periods, Corning recorded in its estimated asbestos litigation liability an additional $150 million for these and any future non-PCC asbestos claims.
Total Estimated Liability for the Amended PCC Plan and the Non-PCC Asbestos Claims
The liability for the Amended PCC Plan and the non-PCC asbestos claims was estimated to be $678 million at December 31, 2015, compared with an estimate of liability of $681 million at December 31, 2014. The $678 million liability is comprised of $238 million of the fair value of PCE, $290 million for the fixed series of payments, and $150 million for the non-PCC asbestos claims, all referenced in the preceding paragraphs. With respect to the PCE liability, at December 31, 2015 and 2014, the fair value of $238 million and $241 million of our interest in PCE significantly exceeded its carrying value of $154 million and $162 million, respectively. There have been no impairment indicators for our investment in PCE and we continue to recognize equity earnings of this affiliate. At the time Corning recorded this liability, it determined it lacked the ability to recover the carrying amount of its investment in PCC and its investment was other than temporarily impaired. As a result, we reduced our investment in PCC to zero. As the fair value in PCE is significantly higher than book value, management believes that the risk of an additional loss in an amount materially higher than the fair value of the liability is remote. With respect to the liability for other asbestos litigation, the liability for non-PCC asbestos claims was estimated based upon industry data for asbestos claims since Corning does not have recent claim history due to the Stay issued by the Bankruptcy Court. The estimated liability represents the undiscounted projection of claims and related legal fees over the next 20 years. The amount may need to be adjusted in future periods as more data becomes available; however, we cannot estimate any additional losses at this time. For the years ended December 31, 2015 and 2014, Corning recorded asbestos litigation income of $15 million and expense of $9 million, respectively. At December 31, 2015, $440 million of the obligation, consisting of the $290 million for the fixed series of payments and $150 million for the non-PCC asbestos claims, is classified as a non-current liability, as installment payments for the cash portion of the obligation are not planned to commence until more than 12 months after the Amended PCC Plan becomes effective. The amount of the obligation related to the fair value of PCE, $238 million, was reclassified to a current liability in the fourth quarter of 2015, as the contribution of the assets is expected to be made within the next twelve months.
Non-PCC Asbestos Claims Insurance Litigation
Several of Corning’s insurers have commenced litigation in state courts for a declaration of the rights and obligations of the parties under insurance policies, including rights that may be affected by the potential resolutions described above. Corning has resolved these issues with a majority of its relevant insurers, and is vigorously contesting these cases with the remaining relevant insurers. Management is unable to predict the outcome of the litigation with these remaining insurers.

72 CORNING INCORPORATED - 2015 Annual Report
Notes to Consolidated Financial Statements
8. Acquisitions
Year ended December 31, 2015 Corning completed five acquisitions in 2015. There have been minor adjustments during 2015 made to the preliminary allocation of the total purchase consideration related to working capital adjustments and true-up of the fair value of assets acquired for the acquisitions. Corning has completed the purchase accounting for four acquisitions. The purchase accounting related to one acquisition in the fourth quarter of 2015 has not been completed and amounts related to this acquisition are subject to change. A summary of the allocation of the total purchase consideration for the five acquisitions is as follows (in millions):
Cash and cash equivalents $ 2 Trade receivables 63 Inventory 47 Property, plant and equipment 117 Other intangible assets 286 Other current and non-current assets 27 Current and non-current liabilities (117)Total identified net assets 425 Purchase consideration (725)Goodwill(1) $ 300
(1) The goodwill recognized is partially deductible for U.S. income tax purposes. The goodwill was allocated to the Optical Communications and All Other reporting segment in the amount of $213 million and $87 million, respectively.
The total consideration related to the acquisitions primarily consisted of cash and, in two of the acquisitions, contingent consideration. The contingent consideration arrangements may require additional amounts to be paid in 2016 and 2017 based on projections of future revenues. The combined potential additional consideration is capped at $28 million. The total fair value of the contingent consideration for the two acquisitions was valued at $13 million as of the acquisition date and $10 million as of December 31, 2015. The change in fair value of contingent consideration of $3 million was recorded as an adjustment to selling, general and administrative expenses.
The goodwill generated from these acquisitions is primarily related to the value of the product portfolio and customer/distribution networks acquired, combined with Corning’s existing business segments, as well as
market participant synergies and other intangibles that do not qualify for separate recognition.
The acquired amortizable intangible assets have a weighted-average useful life of approximately 10 years.
Acquisition-related costs of $11 million included in selling, general and administrative expense in the Consolidated Statements of Income for the year ended December 31, 2015 included costs for legal, accounting, valuation and other professional services. The Consolidated Financial Statements include the operating results of each business combination from the date of acquisition. Pro forma results of operations have not been presented because the effects of the acquisitions, individually and in the aggregate, were not material to Corning’s financial results.
Year ended December 31, 2014On January 15, 2014, Corning completed a series of strategic and financial agreements pursuant to the Framework Agreement with Samsung Display to acquire the remaining common shares of Samsung Corning Precision Materials. The transaction is expected to strengthen product and technology collaborations between the two companies and allow Corning to extend its leadership in specialty glass and drive earnings growth.
The acquisition of Samsung Corning Precision Materials was accounted for under the purchase method of accounting in accordance with business combination accounting guidance. Accordingly, the purchase price was allocated to the assets acquired and liabilities assumed, based on their fair value on the date of acquisition. The fair value was determined based on the fair value of consideration transferred for the remaining equity interest of Samsung Display’s shares.
In connection with the purchase of Samsung Display’s equity interest in Samsung Corning Precision Materials pursuant to the Framework Agreement, the Company designated a new series of its preferred stock as Fixed Rate Cumulative Convertible Preferred Stock, Series A, par value $100 per share (“Preferred Stock”). As contemplated by the Framework Agreement, Samsung Display became the owner of 2,300 shares of Preferred Stock (with an issue price of $1 million per share), of which 1,900 shares were issued in connection with the acquisition and 400 shares were issued for cash.
Corning issued 1,900 shares of Preferred Stock as consideration in the acquisition of Samsung Corning Precision Materials which had a fair value of $1.9 billion on the acquisition date. The fair value was determined using an option pricing model based on the features of the Preferred Stock. That measure is based on Level 2 inputs observable in the market such as Corning’s common stock price and dividend yield.
As a result of the acquisition of Samsung Corning Precision Materials in January 2014, the Company has contingent consideration that was measured using unobservable (Level 3) inputs. This contingent consideration arrangement potentially requires additional consideration to be paid between the parties in 2018: one based on projections of future revenues generated by the business of Corning Precision Materials for the period between the acquisition date and December 31, 2017, which is subject to a cap of $665 million; and another based on the volumes of certain sales during the same period, which is subject to a separate cap of $100 million. The fair value of the potential receipt of the contingent consideration in 2018 in the amount of $196 million recognized on the acquisition date was estimated by applying an option pricing model using the Company’s projection of future revenues generated by Corning Precision Materials. Changes in the fair value of the contingent consideration in future periods are valued using an option pricing model and are recorded in Corning’s results in the period of the change.

73CORNING INCORPORATED - 2015 Annual Report
Notes to Consolidated Financial Statements
On December 29, 2015, Corning and Samsung Display entered into an agreement pursuant to which Corning exchanged the amount of contingent consideration in excess of $300 million (net present fair value: $246 million), as consideration for the incremental fair value associated with a number of commercial agreements, including the amendment of its long-term supply agreement with Samsung Display. As of December 29, 2015, the net present fair value of the contingent consideration receivable was $458 million. The net present fair value of the commercial benefit associated with the amended long-term supply agreement exceeds the value exchanged by Corning pursuant to this agreement (net present fair value: $212 million). Consequently, Corning reclassified this amount to the other asset line of the Consolidated Balance Sheet and will amortize the amount over the remaining term of the long-term supply agreement as a reduction in revenue.
The following table summarizes the total fair value of Samsung Corning Precision Materials at the acquisition date including the net consideration transferred to acquire the remaining 42.5% of Samsung Corning Precision Materials, the fair value of Corning’s non-controlling interest in Samsung Corning Precision Materials pre- and post-acquisition and the amount of the implied fair value of the total entity for the purpose of allocating the purchase price to the acquired net assets.
Net consideration applied to acquired assetsSamsung Display
Corning Incorporated
Samsung Corning
Precision Materials
Ownership percentage 42.5% 57.5% 100%Fair value based on $1.9 billion consideration transferred $ 1,911 $ 2,588 $ 4,499 Less contingent consideration - receivable (196) (265) (461)Net fair value of consideration @ 100% 1,715 2,323 4,038 Corning’s loss on royalty contract (136) (184) (320)Fair value post-acquisition $ 1,579 $ 2,139 $ 3,718 Corning’s fair value 57.5% post-acquisition 2,139 Total fair value at January 15, 2014 $ 3,718
The $1.9 billion fair value of consideration transferred for the remaining 42.5% interest in Samsung Corning Precision Materials plus the fair value of Corning’s pre-acquisition fair value less the contingent consideration due Corning as of the acquisition date results in a net fair value for the total entity of $4 billion.
As a result of the acquisition of Samsung Corning Precision Materials, Corning reacquired its technology license rights and effectively settled its pre-existing royalty contract with the acquired entity, Samsung Corning Precision Materials. With regard to the reacquired right, Corning engaged a third-party specialist to assist in assessing the fair value of this right and determined that the reacquired right had a value of zero. In addition, the Company assessed whether this royalty contract was favorable or unfavorable to Corning. It was determined that the contractual royalty rate of 3% as compared to the then current market rate of 12% was unfavorable to Corning. The effective settlement of the contract was valued using the Income Approach; specifically, a relief from royalty method. The amount by which the contract was unfavorable to Corning when compared to current market transactions for similar items resulted in a loss of $320 million which was recorded on the acquisition date, representing 100% of the loss on the effective settlement of the contract. There were no stated contractual settlement provisions or previously recorded assets or liabilities to consider when determining the value associated with the settlement.
Because the pre-existing contract was unfavorable to Corning, a portion of the consideration transferred was deemed to be applicable to the effective settlement of the royalty contract between Corning and the acquiree, Samsung Corning Precision Materials. The $320 million loss
attributable to the settlement of the pre-existing arrangement was accounted for as a separate transaction from the business combination as follows:
• At acquisition, since the contract with Samsung Corning Precision Materials was effectively settled, Corning recognized a loss of $320 million. Of the $320 million, $184 million effectively offset the portion of the gain on previously held equity investment attributable to Corning’s interest in the royalty contract. As a result, the pre-acquisition fair value of Corning’s 57.5% share of $2.3 billion decreased to the fair value of $2.1 billion post-acquisition; and
• At acquisition, since the seller, Samsung Display, was a 42.5% shareholder of Samsung Corning Precision Materials, 42.5%, or $136 million, of the $320 million loss to effectively settle the contract reduced the consideration transferred to acquire Samsung Display’s interest in Samsung Corning Precision Materials. Accordingly, $136 million of the consideration transferred was treated separately from the purchase price, resulting in the implied consideration transferred of approximately $1.6 billion.
The net economic effect to Corning following the transaction was a net loss of $136 million, constituting a $320 million loss due to Corning’s unfavorable contract and its share of the favorable contract in Samsung Corning Precision Materials of $184 million.
The gain on the previously held equity investment was calculated based on the fair value of the entity immediately preceding the acquisition of Samsung Corning Precision Materials. As the pre-existing contract was treated as a separate transaction, the pre-existing contract was not taken into consideration when calculating the gain on the previously held equity interest.

74 CORNING INCORPORATED - 2015 Annual Report
Notes to Consolidated Financial Statements
The net gain on previously owned equity was calculated as follows:
December 2013 Investment Balance $ 3,709 Dividend(1) (1,574)Other (18)Net investment book balance at 1/15/2014 $ 2,117 Fair value Samsung Corning Precision Materials $ 4,038 57.5% of Samsung Corning Precision Materials(2) 2,323 Working capital adjustment and other 52 57.5% of the pre-acquisition fair value of assets $ 2,375 Gain on previously held equity investment(2) $ 258 Translation gain 136 Net gain $ 394
(1) In conjunction with the Framework Agreement, the parties agreed to have Samsung Corning Precision Materials distribute all cash and cash equivalents as a dividend to the shareholders of record as of December 31, 2013. The dividend was not part of the purchase price as the agreement was to distribute cash and cash equivalents as a dividend to the shareholders as soon as practicable. As such, at acquisition Corning did not have legal title to the cash to be distributed, although the dividend was distributed subsequent to the acquisition date. Therefore, the portion of Corning’s share of the $1.6 billion dividend received was accounted for in Corning’s consolidated financial statements as if the dividend occurred at or immediately prior to the date of acquisition at which time Samsung Corning Precision Materials was still an equity method investment in Corning’s consolidated financial statements.
(2) As Corning was a 57.5% shareholder at the date of acquisition, immediately preceding the acquisition of Samsung Corning Precision Materials, Corning recognized an asset and respective gain as part of the calculation of its previously held equity investment which included approximately $184 million attributed to its economic interest in the royalty contract.
The following table summarizes the amounts of identified assets acquired and liabilities assumed at acquisition date and recorded measurement period adjustments. Corning has completed its accounting for the acquisition of Samsung Corning Precision Materials and its review of deferred taxes.
Recognized amounts of identified assets acquired and liabilities assumed (in millions):
Cash and cash equivalents(1) $ 133 Trade receivables(3) 357 Inventory(3) 105 Property, plant and equipment(3) 3,595 Other current and non-current assets(3) 71 Debt – current (32)Accounts payable and accrued expenses(3) (357)Other current and non-current liabilities(3) (294)Total identified net assets(3) 3,578 Non-controlling interests 15 Fair value of Samsung Corning Precision Materials on acquisition date (3,718)Goodwill(2)(3) $ 125
(1) Cash and cash equivalents are presented net of the 2014 dividend distributed subsequent to the acquisition of Samsung Corning Precision Materials, in the amount of $2.8 billion.
(2) The goodwill recognized is not deductible for U.S. income tax purposes. The goodwill was allocated to the Display Technologies segment.
(3) During 2014, the Company recorded total measurement period adjustments of $60 million for the acquisition of Corning Precision Materials primarily related to accrual of contingent liabilities and employee benefit obligations.
The goodwill is primarily attributable to the workforce of the acquired business and the synergies expected to result from the integration of Corning Precision Materials. Acquisition-related costs of $93 million in the year ended December 31, 2014 included costs for post-acquisition compensation expense, legal, accounting, valuation and other professional services and were included in selling, general and administrative expenses in the Consolidated Statements of Income. Since the date of acquisition,
the consolidation of Corning Precision Materials added $1,343 million and $1,761 million to net sales for the years ending December 31, 2015 and 2014, respectively. The impact to net income of the consolidation of Corning Precision Materials is impracticable to calculate due to the level of integration within the Display Technologies segment and the significant amount of estimates that would be required.

75CORNING INCORPORATED - 2015 Annual Report
Notes to Consolidated Financial Statements
Unaudited Pro Forma Financial InformationThe unaudited pro forma combined consolidated statement of income for the year ended December 31, 2013, was derived from the financial statements of Corning and Samsung Corning Precision Materials for the year ended December 31, 2013, and is presented to show how Corning might have appeared had the acquisition of Samsung Corning Precision Materials occurred as of January 1, 2013.
The unaudited pro forma combined consolidated financial information was prepared pursuant to the rules and regulations of the SEC. The unaudited pro forma adjustments reflecting the acquisition of Samsung Corning Precision Materials have been prepared in accordance with the business combination accounting guidance and reflect the allocation of the purchase price to the acquired assets and liabilities based upon the fair values, using the assumptions set forth above.
Unaudited Pro Forma Financial Information (in millions, except per share data):
Twelve months ended
December 31, 2013
Net sales $ 9,871Net income attributable to Corning Incorporated – basic earnings per share $ 2,327Net income attributable to Corning Incorporated – diluted earnings per share $ 2,425Earnings per common share attributable to common shareholders
Basic $ 1.60Diluted $ 1.54
Shares used in computing per share amountsBasic 1,452Diluted 1,577
There were no other significant acquisitions for the year ended December 31, 2014 and December 31, 2013.
9. Property, Plant and Equipment, Net of Accumulated Depreciation
Property, plant and equipment, net of accumulated depreciation follow (in millions):
December 31,2015 2014
Land $ 438 $ 458Buildings 5,504 5,470Equipment 14,688 13,848Construction in progress 1,206 1,322
21,836 21,098Accumulated depreciation (9,188) (8,332)Total $ 12,648 $ 12,766
Approximately $35 million, $40 million and $35 million of interest costs were capitalized as part of property, plant and equipment, net of accumulated depreciation, in 2015, 2014 and 2013, respectively.
Manufacturing equipment includes certain components of production equipment that are constructed of precious metals. At December 31, 2015 and 2014, the recorded value of precious metals totaled $3 billion and $3.1 billion, respectively. Depletion expense for precious metals in the years ended December 31, 2015, 2014 and 2013 was $19 million, $21 million and $20 million, respectively.
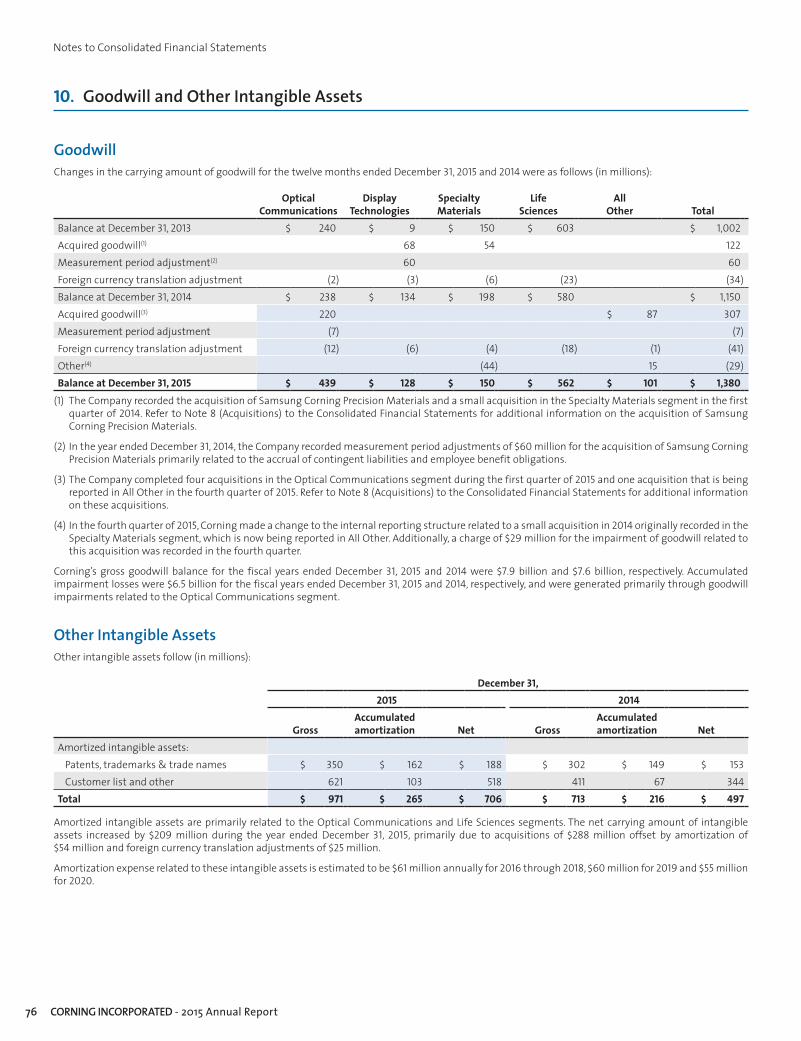
76 CORNING INCORPORATED - 2015 Annual Report
Notes to Consolidated Financial Statements
10. Goodwill and Other Intangible Assets
GoodwillChanges in the carrying amount of goodwill for the twelve months ended December 31, 2015 and 2014 were as follows (in millions):
Optical Communications
Display Technologies
Specialty Materials
Life Sciences
All Other Total
Balance at December 31, 2013 $ 240 $ 9 $ 150 $ 603 $ 1,002 Acquired goodwill(1) 68 54 122 Measurement period adjustment(2) 60 60Foreign currency translation adjustment (2) (3) (6) (23) (34)Balance at December 31, 2014 $ 238 $ 134 $ 198 $ 580 $ 1,150Acquired goodwill(3) 220 $ 87 307Measurement period adjustment (7) (7)Foreign currency translation adjustment (12) (6) (4) (18) (1) (41 )Other(4) (44) 15 (29)Balance at December 31, 2015 $ 439 $ 128 $ 150 $ 562 $ 101 $ 1,380
(1) The Company recorded the acquisition of Samsung Corning Precision Materials and a small acquisition in the Specialty Materials segment in the first quarter of 2014. Refer to Note 8 (Acquisitions) to the Consolidated Financial Statements for additional information on the acquisition of Samsung Corning Precision Materials.
(2) In the year ended December 31, 2014, the Company recorded measurement period adjustments of $60 million for the acquisition of Samsung Corning Precision Materials primarily related to the accrual of contingent liabilities and employee benefit obligations.
(3) The Company completed four acquisitions in the Optical Communications segment during the first quarter of 2015 and one acquisition that is being reported in All Other in the fourth quarter of 2015. Refer to Note 8 (Acquisitions) to the Consolidated Financial Statements for additional information on these acquisitions.
(4) In the fourth quarter of 2015, Corning made a change to the internal reporting structure related to a small acquisition in 2014 originally recorded in the Specialty Materials segment, which is now being reported in All Other. Additionally, a charge of $29 million for the impairment of goodwill related to this acquisition was recorded in the fourth quarter.
Corning’s gross goodwill balance for the fiscal years ended December 31, 2015 and 2014 were $7.9 billion and $7.6 billion, respectively. Accumulated impairment losses were $6.5 billion for the fiscal years ended December 31, 2015 and 2014, respectively, and were generated primarily through goodwill impairments related to the Optical Communications segment.
Other Intangible AssetsOther intangible assets follow (in millions):
December 31,2015 2014
GrossAccumulated amortization Net Gross
Accumulated amortization Net
Amortized intangible assets:Patents, trademarks & trade names $ 350 $ 162 $ 188 $ 302 $ 149 $ 153Customer list and other 621 103 518 411 67 344
Total $ 971 $ 265 $ 706 $ 713 $ 216 $ 497
Amortized intangible assets are primarily related to the Optical Communications and Life Sciences segments. The net carrying amount of intangible assets increased by $209 million during the year ended December 31, 2015, primarily due to acquisitions of $288 million offset by amortization of $54 million and foreign currency translation adjustments of $25 million.
Amortization expense related to these intangible assets is estimated to be $61 million annually for 2016 through 2018, $60 million for 2019 and $55 million for 2020.
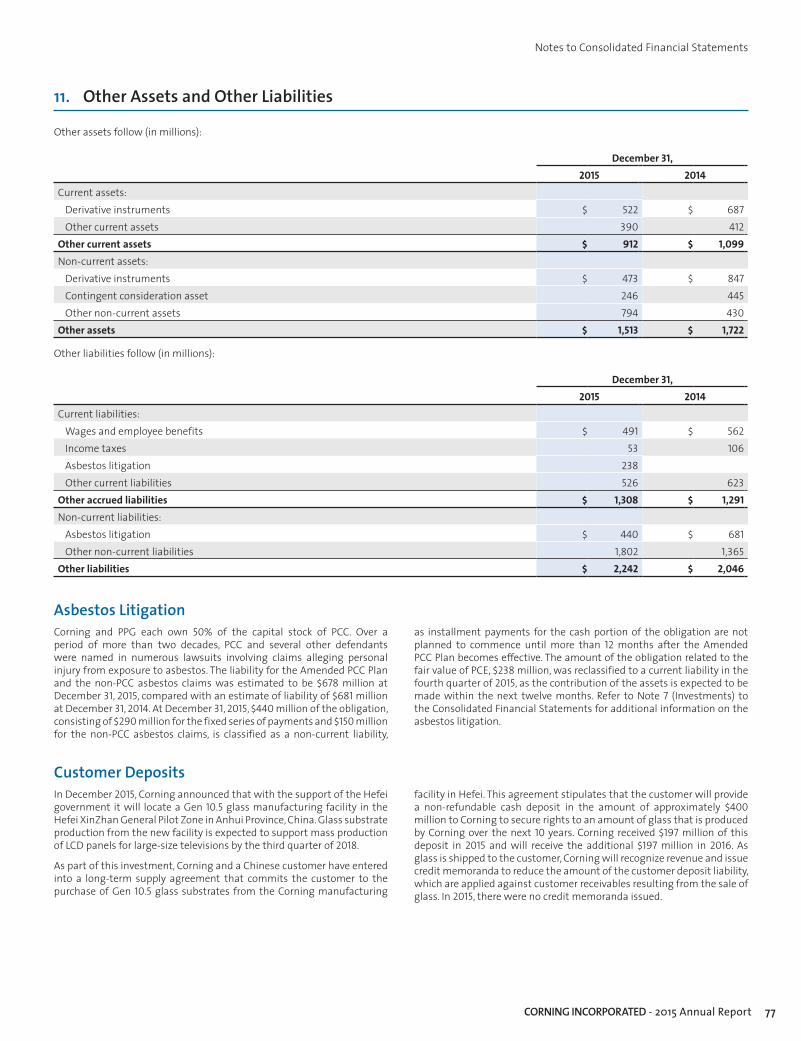
77CORNING INCORPORATED - 2015 Annual Report
Notes to Consolidated Financial Statements
11. Other Assets and Other Liabilities
Other assets follow (in millions):
December 31,2015 2014
Current assets:Derivative instruments $ 522 $ 687Other current assets 390 412
Other current assets $ 912 $ 1,099Non-current assets:
Derivative instruments $ 473 $ 847Contingent consideration asset 246 445Other non-current assets 794 430
Other assets $ 1,513 $ 1,722
Other liabilities follow (in millions):
December 31,2015 2014
Current liabilities:Wages and employee benefits $ 491 $ 562Income taxes 53 106Asbestos litigation 238Other current liabilities 526 623
Other accrued liabilities $ 1,308 $ 1,291Non-current liabilities:
Asbestos litigation $ 440 $ 681Other non-current liabilities 1,802 1,365
Other liabilities $ 2,242 $ 2,046
Asbestos LitigationCorning and PPG each own 50% of the capital stock of PCC. Over a period of more than two decades, PCC and several other defendants were named in numerous lawsuits involving claims alleging personal injury from exposure to asbestos. The liability for the Amended PCC Plan and the non-PCC asbestos claims was estimated to be $678 million at December 31, 2015, compared with an estimate of liability of $681 million at December 31, 2014. At December 31, 2015, $440 million of the obligation, consisting of $290 million for the fixed series of payments and $150 million for the non-PCC asbestos claims, is classified as a non-current liability,
as installment payments for the cash portion of the obligation are not planned to commence until more than 12 months after the Amended PCC Plan becomes effective. The amount of the obligation related to the fair value of PCE, $238 million, was reclassified to a current liability in the fourth quarter of 2015, as the contribution of the assets is expected to be made within the next twelve months. Refer to Note 7 (Investments) to the Consolidated Financial Statements for additional information on the asbestos litigation.
Customer DepositsIn December 2015, Corning announced that with the support of the Hefei government it will locate a Gen 10.5 glass manufacturing facility in the Hefei XinZhan General Pilot Zone in Anhui Province, China. Glass substrate production from the new facility is expected to support mass production of LCD panels for large-size televisions by the third quarter of 2018.
As part of this investment, Corning and a Chinese customer have entered into a long-term supply agreement that commits the customer to the purchase of Gen 10.5 glass substrates from the Corning manufacturing
facility in Hefei. This agreement stipulates that the customer will provide a non-refundable cash deposit in the amount of approximately $400 million to Corning to secure rights to an amount of glass that is produced by Corning over the next 10 years. Corning received $197 million of this deposit in 2015 and will receive the additional $197 million in 2016. As glass is shipped to the customer, Corning will recognize revenue and issue credit memoranda to reduce the amount of the customer deposit liability, which are applied against customer receivables resulting from the sale of glass. In 2015, there were no credit memoranda issued.
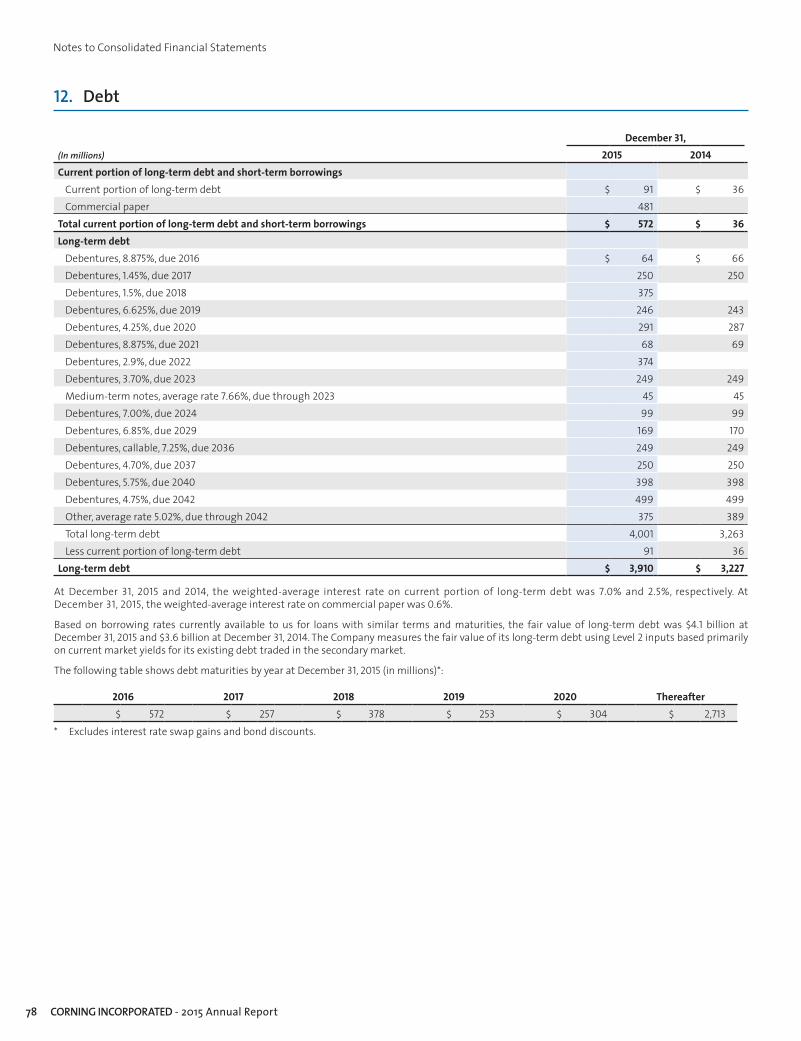
78 CORNING INCORPORATED - 2015 Annual Report
Notes to Consolidated Financial Statements
12. Debt
December 31,(In millions) 2015 2014Current portion of long-term debt and short-term borrowings
Current portion of long-term debt $ 91 $ 36Commercial paper 481
Total current portion of long-term debt and short-term borrowings $ 572 $ 36Long-term debt
Debentures, 8.875%, due 2016 $ 64 $ 66Debentures, 1.45%, due 2017 250 250Debentures, 1.5%, due 2018 375Debentures, 6.625%, due 2019 246 243Debentures, 4.25%, due 2020 291 287Debentures, 8.875%, due 2021 68 69Debentures, 2.9%, due 2022 374Debentures, 3.70%, due 2023 249 249Medium-term notes, average rate 7.66%, due through 2023 45 45Debentures, 7.00%, due 2024 99 99Debentures, 6.85%, due 2029 169 170Debentures, callable, 7.25%, due 2036 249 249Debentures, 4.70%, due 2037 250 250Debentures, 5.75%, due 2040 398 398Debentures, 4.75%, due 2042 499 499Other, average rate 5.02%, due through 2042 375 389Total long-term debt 4,001 3,263Less current portion of long-term debt 91 36
Long-term debt $ 3,910 $ 3,227
At December 31, 2015 and 2014, the weighted-average interest rate on current portion of long-term debt was 7.0% and 2.5%, respectively. At December 31, 2015, the weighted-average interest rate on commercial paper was 0.6%.
Based on borrowing rates currently available to us for loans with similar terms and maturities, the fair value of long-term debt was $4.1 billion at December 31, 2015 and $3.6 billion at December 31, 2014. The Company measures the fair value of its long-term debt using Level 2 inputs based primarily on current market yields for its existing debt traded in the secondary market.
The following table shows debt maturities by year at December 31, 2015 (in millions)*:
2016 2017 2018 2019 2020 Thereafter$ 572 $ 257 $ 378 $ 253 $ 304 $ 2,713
* Excludes interest rate swap gains and bond discounts.

79CORNING INCORPORATED - 2015 Annual Report
Notes to Consolidated Financial Statements
Debt Issuances and Retirements
2015• In the second quarter of 2015, we issued $375 million of 1.50% senior
unsecured notes that mature on May 8, 2018 and $375 million of 2.90% senior unsecured notes that mature on May 15, 2022. The net proceeds of $745 million will be used for general corporate purposes. We can redeem these notes at any time, subject to certain customary terms and conditions.
2014• In the third quarter of 2014, we amended and restated our
existing revolving credit facility. The amended facility provides a $2 billion unsecured multi-currency line of credit and expires on September 30, 2019. At December 31, 2015, there were no outstanding amounts on this credit facility. The facility includes affirmative and negative covenants that Corning must comply with, including a leverage (debt to capital ratio) financial covenant. As of December 31, 2015, we were in compliance with all of the covenants.
2013• In the first quarter of 2013, we amended and restated our then-existing
revolving credit facility. The 2013 amended facility provided a $1 billion unsecured multi-currency line of credit that would have expired in March 2018. This facility was amended and restated by the $2 billion facility entered into in the third quarter of 2014.
• In the first quarter of 2013, Corning repaid the aggregate principal amount and accrued interest outstanding on the credit facility entered into in the second quarter of 2011 that allowed Corning to borrow up to Chinese renminbi (RMB) 4 billion. The total amount repaid was approximately $500 million. Upon repayment, this facility was terminated.
• In the second quarter of 2013, the Company established a commercial paper program on a private placement basis, pursuant to which we may issue short-term, unsecured commercial paper notes up to a maximum aggregate principal amount outstanding at any time of $1 billion. Under this program, the Company may issue the notes from time to time and will use the proceeds for general corporate purposes. The maturities of the notes will vary, but may not exceed 390 days from the date of issue. The interest rates will vary based on market conditions and the ratings assigned to the notes by credit rating agencies at the time of issuance. The Company’s revolving credit facility is available to support obligations under the commercial paper program, if needed.
• In the fourth quarter of 2013, we issued $250 million of 3.70% senior unsecured notes that mature on November 15, 2023. The net proceeds of approximately $248 million were used for general corporate purposes.
• In the fourth quarter of 2013, we recorded a financing obligation in the approximate amount of $230 million for a new LCD glass substrate facility in China.
13. Employee Retirement Plans
Defined Benefit PlansWe have defined benefit pension plans covering certain domestic and international employees. Our funding policy has been to contribute, as necessary, an amount in excess of the minimum requirements in order to achieve the Company’s long-term funding targets. In 2015, we made voluntary cash contributions of $65 million to our domestic defined benefit pension plan and contributed $35 million to our international pension plans. In 2014, we made voluntary cash contributions of $85 million to our domestic defined benefit pension plan and contributed $45 million to our international pension plans. Although we will not be subject to any mandatory contributions in 2016, we anticipate making voluntary cash contributions of up to $62 million to our domestic pension plan and up to $36 million to our international pension plans in 2016.
Corning offers postretirement plans that provide health care and life insurance benefits for retirees and eligible dependents. Certain employees may become eligible for such postretirement benefits upon reaching retirement age and service requirements. For current retirees (including surviving spouses) and active employees eligible for the salaried retiree medical program, we have placed a “cap” on the amount we will contribute toward retiree medical coverage in the future. The cap is equal to 120% of our 2005 contributions toward retiree medical benefits. Once our contributions toward salaried retiree medical costs reach this cap, impacted retirees will have to pay the excess amount in addition to their regular contributions for coverage. This cap was attained for post-65 retirees in 2008 and has impacted their contribution rate in 2009 and going forward. The pre-65 retirees triggered the cap in 2010, which has impacted their contribution rate in 2011 and going forward. Furthermore, employees hired or rehired on or after January 1, 2007 will be eligible for Corning retiree medical benefits upon retirement; however, these employees will pay 100% of the cost.

80 CORNING INCORPORATED - 2015 Annual Report
Notes to Consolidated Financial Statements
Obligations and Funded StatusThe change in benefit obligation and funded status of our employee retirement plans follows (in millions):
Total pension benefits
Domestic pension benefits
International pension benefits
December 31, 2015 2014 2015 2014 2015 2014Change in benefit obligationBenefit obligation at beginning of year $ 3,809 $ 3,300 $ 3,222 $ 2,844 $ 587 $ 456 Service cost 90 82 64 55 26 27 Interest cost 144 160 126 137 18 23 Plan participants’ contributions 1 1 1 1 Acquisitions 103 103 Amendments 25 25 Actuarial (gain) loss (95) 394 (87) 327 (8) 67 Other (8) (3) (8) (3)Benefits paid (188) (207) (165) (167) (23) (40)Foreign currency translation (38) (46) (38) (46)Benefit obligation at end of year $ 3,715 $ 3,809 $ 3,161 $ 3,222 $ 554 $ 587 Change in plan assetsFair value of plan assets at beginning of year $ 3,263 $ 2,896 $ 2,814 $ 2,596 $ 449 $ 300 Actual (loss) gain on plan assets (108) 355 (111) 287 3 68 Employer contributions 116 147 77 97 39 50 Plan participants’ contributions 1 1 1 1 Acquisitions 97 97 Benefits paid (188) (207) (165) (167) (23) (40)Foreign currency translation (26) (26) (26) (26)Fair value of plan assets at end of year $ 3,058 $ 3,263 $ 2,616 $ 2,814 $ 442 $ 449 Funded status at end of yearFair value of plan assets $ 3,058 $ 3,263 $ 2,616 $ 2,814 $ 442 $ 449 Benefit obligations (3,715) (3,809) (3,161) (3,222) (554) (587)Funded status of plans $ (657) $ (546) $ (545) $ (408) $ (112) $ (138)Amounts recognized in the consolidated balance sheets consist of:
Noncurrent asset $ 50 $ 47 $ 50 $ 47 Current liability (35) (41) $ (30) $ (30) (5) (11)Noncurrent liability (672) (552) (515) (378) (157) (174)
Recognized liability $ (657) $ (546) $ (545) $ (408) $ (112) $ (138)Amounts recognized in accumulated other comprehensive income consist of:
Net actuarial loss $ 332 $ 308 $ 305 $ 278 $ 27 $ 30 Prior service cost (credit) 35 41 37 44 (2) (3)
Amount recognized at end of year $ 367 $ 349 $ 342 $ 322 $ 25 $ 27
The accumulated benefit obligation for defined benefit pension plans was $3.5 billion and $3.6 billion at December 31, 2015 and 2014, respectively.

81CORNING INCORPORATED - 2015 Annual Report
Notes to Consolidated Financial Statements
Postretirement benefitsDecember 31, 2015 2014Change in benefit obligationBenefit obligation at beginning of year $ 862 $ 815 Service cost 13 11 Interest cost 33 38 Plan participants’ contributions 7 7 Amendments (5)Actuarial (gain) loss (97) 49 Other 4 Benefits paid (61) (56)Medicare subsidy received 2 3 Foreign currency translationBenefit obligation at end of year $ 763 $ 862 Funded status at end of yearFair value of plan assets $ 0 $ 0 Benefit obligations (763) (862)Funded status of plans $ (763) $ (862)Amounts recognized in the consolidated balance sheets consist of:
Current liability $ (45) $ (48)Noncurrent liability (718) (814)
Recognized liability $ (763) $ (862)Amounts recognized in accumulated other comprehensive income consist of:
Net actuarial loss $ 33 $ 132 Prior service credit (19) (27)
Amount recognized at end of year $ 14 $ 105
The following information is presented for pension plans where the projected benefit obligation as of December 31, 2015 and 2014 exceeded the fair value of plan assets (in millions):
December 31,2015 2014
Projected benefit obligation $ 3,341 $ 3,425Fair value of plan assets $ 2,635 $ 2,831
In 2015, the fair value of plan assets exceeded the projected benefit obligation for the United Kingdom, one of the South Korea and one of the France pension plans.
The following information is presented for pension plans where the accumulated benefit obligation as of December 31, 2015 and 2014 exceeded the fair value of plan assets (in millions):
December 31,2015 2014
Accumulated benefit obligation $ 3,159 $ 479Fair value of plan assets $ 2,634 $ 17
In 2015, the fair value of plan assets exceeded the accumulated benefit obligation for the United Kingdom, the South Korea and one of the France pension plans.

82 CORNING INCORPORATED - 2015 Annual Report
Notes to Consolidated Financial Statements
The components of net periodic benefit expense for our employee retirement plans follow (in millions):
Total pension benefits Domestic pension benefits International pension benefitsDecember 31, 2015 2014 2013 2015 2014 2013 2015 2014 2013Service cost $ 90 $ 82 $ 70 $ 64 $ 55 $ 60 $ 26 $ 27 $ 10Interest cost 144 160 131 126 137 115 18 23 16Expected return on plan assets (178) (174) (169) (166) (159) (158) (12) (15) (11)Amortization of prior service cost (credit) 6 6 5 7 7 6 (1) (1) (1)Recognition of actuarial loss (gain) 165 29 (30) 162 4 (41) 3 25 11Total net periodic benefit expense $ 227 $ 103 $ 7 $ 193 $ 44 $ (18) $ 34 $ 59 $ 25Other changes in plan assets and benefit obligations recognized in other comprehensive income:
Curtailment effects $ (3) $ (3)Settlements $ (1) (2) $ (1) (2)Current year actuarial loss (gain) 191 212 $ (264) $ 189 $ 198 $ (274) 2 14 $ 10Recognition of actuarial (loss) gain (165) (29) 30 (162) (4) 41 (3) (25) (11)Current year prior service cost 25 25Amortization of prior service (cost) credit (6) (6) (5) (7) (7) (6) 1 1 1
Total recognized in other comprehensive (income) loss $ 19 $ 197 $ (239) $ 20 $ 212 $ (239) $ (1) $ (15) $ 0Total recognized in net periodic benefit cost and other comprehensive (income) loss $ 246 $ 300 $ (232) $ 213 $ 256 $ (257) $ 33 $ 44 $ 25
Postretirement benefits2015 2014 2013
Service cost $ 13 $ 11 $ 13 Interest cost 33 38 39 Amortization of net loss 3 15 Amortization of prior service credit (7) (6) (6)Total net periodic benefit expense $ 42 $ 43 $ 61 Other changes in plan assets and benefit obligations recognized in other comprehensive income:
Current year actuarial (gain) loss $ (96) $ 49 $ (178)Amortization of actuarial loss (3) (15)Current year prior service credit (5) (5)Amortization of prior service credit 7 6 6
Total recognized in other comprehensive (income) loss $ (92) $ 50 $ (192)Total recognized in net periodic benefit cost and other comprehensive (income) loss $ (50) $ 93 $ (131)
The Company expects to recognize $6 million of net prior service cost as a component of net periodic pension cost in 2016 for its defined benefit pension plans. The Company expects to recognize $1 million of net actuarial gain and $4 million of net prior service credit as components of net periodic postretirement benefit cost in 2016.
Corning uses a hypothetical yield curve and associated spot rate curve to discount the plan’s projected benefit payments. Once the present value of projected benefit payments is calculated, the suggested discount rate
is equal to the level rate that results in the same present value. The yield curve is based on actual high-quality corporate bonds across the full maturity spectrum, which also includes private placements as well as Eurobonds that are denominated in U.S. currency. The curve is developed from yields on approximately 350-375 bonds from four grading sources, Moody’s, S&P, Fitch and the Dominion Bond Rating Service. A bond will be included if at least half of the grades from these sources are Aa, non-callable bonds. The very highest 10% yields and the lowest 40% yields are excluded from the curve to eliminate outliers in the bond population.

83CORNING INCORPORATED - 2015 Annual Report
Notes to Consolidated Financial Statements
Mortality is one of the key assumptions used in valuing liabilities of retirement plans. It is used to assign a probability of payment for future plan benefits that are contingent upon participants’ survival. To make this assumption, benefit plan sponsors typically use a base mortality table and an improvement scale that adjusts the rates of mortality for future anticipated changes to historical death rates. For the seven years prior to the year ended December 31, 2014, Corning utilized the RP 2000 mortality table with improvement Scale AA in performing valuations of its U.S. pension and OPEB liabilities. On October 27, 2014, the Society of Actuaries (“SOA”) published new mortality tables for benefit plan sponsors to consider when measuring their benefit plan costs and obligations. These tables reflect the fact that life expectancies have improved since the last comprehensive study of mortality data was released in 2000. Therefore, in the fourth quarter of 2014, Corning undertook a review of its mortality assumption for its U.S. benefit plans to determine if an update to our current mortality table was appropriate. Based on the findings of this analysis, Corning believes that the RP-2014 table adjusted for Corning’s experience with future improvements projected using scale BB-2D represents the best estimate of future mortality improvement for Corning’s U.S. benefit plans.
Prior to the December 31, 2015 valuation of its defined benefit pension and OPEB plans, Corning used the traditional, single weighted-average discount rate approach to develop the obligation, interest cost and service cost components of net periodic benefit cost for its defined benefit pension and OPEB plans. The individual spot rates from the yield curve are used in measuring the pension plan projected benefit obligation (PBO) or OPEB plan accumulated postretirement benefit obligation (APBO) at the measurement date. The benefit obligation is effectively calculated as the aggregate present value at the measurement date of each future benefit payment related to past service, with each payment discounted using a spot rate from a high-quality corporate bond yield curve that matches the duration of the benefit payment. Under Corning’s traditional, single weighted-average discount rate approach, a single weighted-average rate is developed from the approach described above and rounded to the nearest 25 basis points. Traditionally, the weighted-average discount rate is determined at the plan measurement date, based on the same projected future benefit payments used in developing the benefit obligation. The traditional single weighted-average discount rate
represents the constant annual rate that would be required to discount all future benefit payments related to past service from the date of expected future payment to the measurement date such that the aggregate present value equals the benefit obligation.
Beginning with the December 31, 2015 valuation of its defined benefit pension and OPEB plans, Corning is changing its methodology of determining the service and interest cost components of net periodic pension and other postretirement benefit costs to a more granular approach. Under the new approach the cash flows from each applicable pension and OPEB plan will be used to directly calculate the benefit obligation, service cost and interest cost using the spot rates from the applicable yield curve.
Moving to a more granular approach has a limited impact on the determination of the respective benefit obligations. The only impacts will be as a result of the elimination of the rounding of the discount rate that occurred in the traditional approach and the use of specific cash flows for Corning’s non-qualified pension plans, while separately applying the yield curve to each separate OPEB plan instead of aggregating the OPEB plan cash flows. This change will result in a decrease in the interest cost and service cost components of net periodic pension and OPEB costs. For Corning’s pension plans, this change will increase the immediate recognition of actuarial losses (or decrease the immediate recognition of actuarial gains), due to Corning’s previous election to immediately recognize actuarial gains and losses outside of the corridor. For Corning’s OPEB plans, this change will increase the accumulated other comprehensive income (AOCI) account balance due to the accumulation of lower actuarial gains or higher actuarial losses. Over time, the amortization of the actuarial losses from AOCI will begin to reduce the savings from the lower interest cost and service cost.
This change is a change in accounting estimate and therefore applied prospectively (beginning with the next measurement date of December 31, 2015). No restatement of prior periods is required.
Measurement of postretirement benefit expense is based on assumptions used to value the postretirement benefit obligation at the beginning of the year.
The weighted-average assumptions used to determine benefit obligations at December 31 follow:
Pension benefitsDomestic International Postretirement benefits
2015 2014 2013 2015 2014 2013 2015 2014 2013Discount rate 4.24% 4.00% 4.75% 3.23% 3.21% 4.08% 4.31% 4.00% 4.75%Rate of compensation increase 3.50% 3.50% 4.00% 3.92% 3.88% 3.85%
The weighted-average assumptions used to determine net periodic benefit cost for years ended December 31 follow:
Pension benefitsDomestic International Postretirement benefits
2015 2014 2013 2015 2014 2013 2015 2014 2013Discount rate 4.00% 4.75% 3.75% 3.21% 4.08% 4.48% 4.00% 4.75% 4.00%Expected return on plan assets 6.00% 6.25% 6.00% 2.97% 4.12% 3.73%Rate of compensation increase 3.50% 4.00% 4.00% 3.88% 3.85% 3.45%
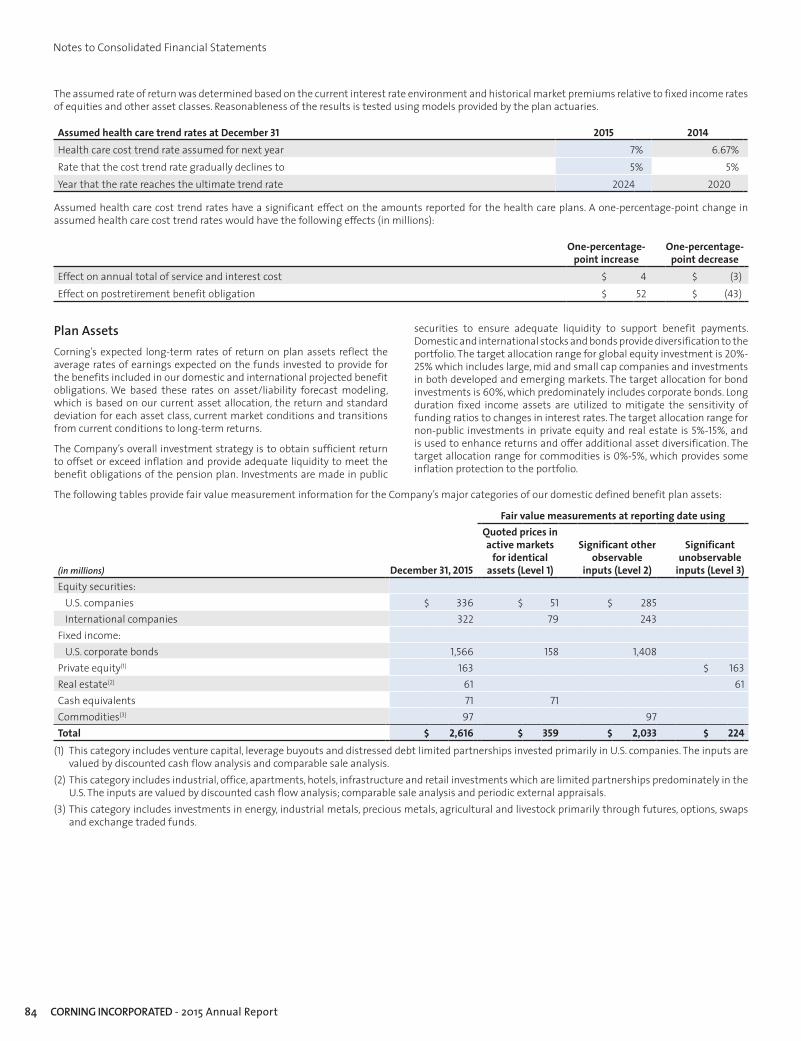
84 CORNING INCORPORATED - 2015 Annual Report
Notes to Consolidated Financial Statements
The assumed rate of return was determined based on the current interest rate environment and historical market premiums relative to fixed income rates of equities and other asset classes. Reasonableness of the results is tested using models provided by the plan actuaries.
Assumed health care trend rates at December 31 2015 2014Health care cost trend rate assumed for next year 7% 6.67%Rate that the cost trend rate gradually declines to 5% 5%Year that the rate reaches the ultimate trend rate 2024 2020
Assumed health care cost trend rates have a significant effect on the amounts reported for the health care plans. A one-percentage-point change in assumed health care cost trend rates would have the following effects (in millions):
One-percentage-point increase
One-percentage-point decrease
Effect on annual total of service and interest cost $ 4 $ (3)Effect on postretirement benefit obligation $ 52 $ (43)
Plan AssetsCorning’s expected long-term rates of return on plan assets reflect the average rates of earnings expected on the funds invested to provide for the benefits included in our domestic and international projected benefit obligations. We based these rates on asset/liability forecast modeling, which is based on our current asset allocation, the return and standard deviation for each asset class, current market conditions and transitions from current conditions to long-term returns.
The Company’s overall investment strategy is to obtain sufficient return to offset or exceed inflation and provide adequate liquidity to meet the benefit obligations of the pension plan. Investments are made in public
securities to ensure adequate liquidity to support benefit payments. Domestic and international stocks and bonds provide diversification to the portfolio. The target allocation range for global equity investment is 20%-25% which includes large, mid and small cap companies and investments in both developed and emerging markets. The target allocation for bond investments is 60%, which predominately includes corporate bonds. Long duration fixed income assets are utilized to mitigate the sensitivity of funding ratios to changes in interest rates. The target allocation range for non-public investments in private equity and real estate is 5%-15%, and is used to enhance returns and offer additional asset diversification. The target allocation range for commodities is 0%-5%, which provides some inflation protection to the portfolio.
The following tables provide fair value measurement information for the Company’s major categories of our domestic defined benefit plan assets:
Fair value measurements at reporting date using
(in millions) December 31, 2015
Quoted prices in active markets
for identical assets (Level 1)
Significant other observable
inputs (Level 2)
Significant unobservable
inputs (Level 3)Equity securities:
U.S. companies $ 336 $ 51 $ 285International companies 322 79 243
Fixed income:U.S. corporate bonds 1,566 158 1,408
Private equity(1) 163 $ 163Real estate(2) 61 61Cash equivalents 71 71Commodities(3) 97 97Total $ 2,616 $ 359 $ 2,033 $ 224
(1) This category includes venture capital, leverage buyouts and distressed debt limited partnerships invested primarily in U.S. companies. The inputs are valued by discounted cash flow analysis and comparable sale analysis.
(2) This category includes industrial, office, apartments, hotels, infrastructure and retail investments which are limited partnerships predominately in the U.S. The inputs are valued by discounted cash flow analysis; comparable sale analysis and periodic external appraisals.
(3) This category includes investments in energy, industrial metals, precious metals, agricultural and livestock primarily through futures, options, swaps and exchange traded funds.

85CORNING INCORPORATED - 2015 Annual Report
Notes to Consolidated Financial Statements
Fair value measurements at reporting date using
(in millions) December 31, 2014
Quoted prices in active markets
for identical assets (Level 1)
Significant other observable
inputs (Level 2)
Significant unobservable
inputs (Level 3)Equity securities:
U.S. companies $ 310 $ 49 $ 261International companies 327 78 249
Fixed income:U.S. corporate bonds 1,720 166 1,554
Private equity(1) 192 $ 192Real estate(2) 84 84Cash equivalents 80 80Commodities(3) 101 101Total $ 2,814 $ 373 $ 2,165 $ 276
(1) This category includes venture capital, leverage buyouts and distressed debt limited partnerships invested primarily in U.S. companies. The inputs are valued by discounted cash flow analysis and comparable sale analysis.
(2) This category includes industrial, office, apartments, hotels, infrastructure and retail investments which are limited partnerships predominately in the U.S. The inputs are valued by discounted cash flow analysis; comparable sale analysis and periodic external appraisals.
(3) This category includes investments in energy, industrial metals, precious metals, agricultural and livestock primarily through futures, options, swaps and exchange traded funds.
The following tables provide fair value measurement information for the Company’s major categories of our international defined benefit plan assets:
Fair value measurements at reporting date using
(in millions) December 31, 2015
Quoted prices in active markets
for identical assets (Level 1)
Significant other observable
inputs (Level 2)
Significant unobservable
inputs (Level 3)Equity securities:
U.S. companies $ 7 $ 7International companies 23 23
Fixed income:International fixed income 347 $ 286 61
Insurance contracts 3 $ 3Mortgages 2 2Cash equivalents 60 60Total $ 442 $ 346 $ 91 $ 5
Fair value measurements at reporting date using
(in millions) December 31, 2014
Quoted prices in active markets
for identical assets (Level 1)
Significant other observable
inputs (Level 2)
Significant unobservable
inputs (Level 3)Equity securities:
U.S. companies $ 6 $ 6International companies 22 22
Fixed income:International fixed income 361 $ 293 68
Insurance contracts 5 $ 5Mortgages 7 7Cash equivalents 48 48Total $ 449 $ 341 $ 96 $ 12

86 CORNING INCORPORATED - 2015 Annual Report
Notes to Consolidated Financial Statements
The tables below set forth a summary of changes in the fair value of the defined benefit plans Level 3 assets for the years ended December 31, 2015 and 2014:
Level 3 assets – Domestic Level 3 assets – International Year ended December 2015 Year ended December 2015
(in millions) Private equity Real estate MortgagesInsurance contracts
Beginning balance at December 31, 2014 $ 192 $ 84 $ 7 $ 5 Actual return on plan assets relating to assets still held at the reporting date 16 12 Transfers in and/or out of level 3 (45) (35) (5) (2)Ending balance at December 31, 2015 $ 163 $ 61 $ 2 $ 3
Level 3 assets – Domestic Level 3 assets – International Year ended December 2014 Year ended December 2014
(in millions) Private equity Real estate MortgagesInsurance contracts
Beginning balance at December 31, 2013 $ 207 $ 93 $ 0 $ 6 Actual return on plan assets relating to assets still held at the reporting date 31 8 1 Transfers in and/or out of level 3 (46) (17) 7 (2)Ending balance at December 31, 2014 $ 192 $ 84 $ 7 $ 5
Credit Risk60% of domestic plan assets are invested in long duration bonds. The average rating for these bonds is A. These bonds are subject to credit risk, such that a decline in credit ratings for the underlying companies, countries or assets (for asset-backed securities) would result in a decline in the value of the bonds. These bonds are also subject to default risk.
Currency Risk12% of domestic assets are valued in non-U.S. dollar denominated investments that are subject to currency fluctuations. The value of these securities will decline if the U.S. dollar increases in value relative to the value of the currencies in which these investments are denominated.
Liquidity Risk9% of the domestic securities are invested in Level 3 securities. These are long-term investments in private equity and private real estate investments that may not mature or be sellable in the near-term without significant loss.
At December 31, 2015 and 2014, the amount of Corning common stock included in equity securities was not significant.
Cash Flow DataIn 2016, we anticipate making voluntary cash contributions of approximately $62 million to our domestic defined benefit plan and approximately $36 million to our international defined benefit plans.
The following reflects the gross benefit payments that are expected to be paid for our domestic and international defined benefit pension plans, the postretirement medical and life plans and the gross amount of annual Medicare Part D federal subsidy expected to be received (in millions):
Expected benefit paymentsExpected federal
subsidy payments postretirement
benefitsDomestic
pension benefitsInternational
pension benefitsPostretirement
benefits2016 $ 192 $ 18 $ 45 $ 22017 $ 178 $ 22 $ 44 $ 32018 $ 186 $ 24 $ 44 $ 32019 $ 192 $ 25 $ 44 $ 32020 $ 198 $ 29 $ 46 $ 32021-2025 $ 1,100 $ 168 $ 230 $ 16

87CORNING INCORPORATED - 2015 Annual Report
Notes to Consolidated Financial Statements
Other Benefit PlansWe offer defined contribution plans covering employees meeting certain eligibility requirements. Total consolidated defined contribution plan expense was $53 million, $62 million and $63 million for the years ended December 31, 2015, 2014 and 2013, respectively.
14. Commitments, Contingencies and Guarantees
The amounts of our obligations follow (in millions):
Amount of commitment and contingency expiration per period
Total Less than 1 year 1 to 3 years 3 to 5 years5 years and thereafter
Performance bonds and guarantees $ 92 $ 25 $ 6 $ 1 $ 60Stand-by letters of credit(1) 47 44 3Credit facility to equity company 31 27 4Loan guarantees 14 14Subtotal of commitment expirations per period $ 184 $ 96 $ 6 $ 1 $ 81Purchase obligations(6) $ 220 $ 106 $ 77 $ 33 $ 4Capital expenditure obligations(2) 298 298Total debt(3) 4,122 565 625 550 2,382Interest on long-term debt(4) 2,385 165 316 280 1,624Capital leases and financing obligations(3) 355 7 10 7 331Imputed interest on capital leases and financing obligations 240 19 37 36 148Minimum rental commitments 573 49 110 77 337Uncertain tax positions(5) 58Subtotal of contractual obligation payments due by period(5) $ 8,251 $ 1,209 $ 1,175 $ 983 $ 4,826Total commitments and contingencies(5) $ 8,435 $ 1,305 $ 1,181 $ 984 $ 4,907
(1) At December 31, 2015, $38 million of the $47 million was included in other accrued liabilities on our consolidated balance sheets.(2) Capital expenditure obligations primarily reflect amounts associated with our capital expansion activities.(3) Total debt above is stated at maturity value, and excludes interest rate swap gains/losses and bond discounts.(4) The estimate of interest payments assumes interest is paid through the date of maturity or expiration of the related debt, based upon stated rates in
the respective debt instruments.(5) At December 31, 2015, $58 million was included on our balance sheet related to uncertain tax positions. Of this amount, we are unable to estimate
when any of that amount will become payable.(6) Purchase obligations are enforceable and legally binding obligations which primarily consist of raw material and energy-related take-or-pay contracts.
We are required, at the time a guarantee is issued, to recognize a liability for the fair value or market value of the obligation it assumes. In the normal course of our business, we do not routinely provide significant third-party guarantees. Generally, third-party guarantees provided by Corning are limited to certain financial guarantees, including stand-by letters of credit and performance bonds, and the incurrence of contingent
liabilities in the form of purchase price adjustments related to attainment of milestones. These guarantees have various terms, and none of these guarantees are individually significant.
We believe a significant majority of these guarantees and contingent liabilities will expire without being funded.
Minimum rental commitments under leases outstanding at December 31, 2015 follow (in millions):
2016 2017 2018 2019 20202021 and
thereafter$ 49 $ 58 $ 52 $ 41 $ 36 $ 337
Total rental expense was $94 million for 2015, $92 million for 2014 and $85 million for 2013.
Product warranty liability accruals at December 31, 2015 and December 31, 2014 are insignificant.
Corning is a defendant in various lawsuits, including environmental, product-related suits, the Dow Corning and PCC matters discussed in Note 7 (Investments) to the Consolidated Financial Statements, and is
subject to various claims that arise in the normal course of business. In the opinion of management, the likelihood that the ultimate disposition of these matters will have a material adverse effect on Corning’s consolidated financial position, liquidity, or results of operations, is remote. Other than certain asbestos related claims, there are no other material loss contingencies related to litigation.

88 CORNING INCORPORATED - 2015 Annual Report
Notes to Consolidated Financial Statements
Corning has been named by the Environmental Protection Agency (the Agency) under the Superfund Act, or by state governments under similar state laws, as a potentially responsible party for 17 active hazardous waste sites. Under the Superfund Act, all parties who may have contributed any waste to a hazardous waste site, identified by the Agency, are jointly and severally liable for the cost of cleanup unless the Agency agrees otherwise. It is Corning’s policy to accrue for its estimated liability related to Superfund sites and other environmental liabilities related to property owned by Corning based on expert analysis and continual monitoring by both internal and external consultants. At December 31, 2015 and December 31, 2014, Corning had accrued approximately $37 million (undiscounted) and $43 million (undiscounted), respectively, for the estimated liability for environmental cleanup and related litigation. Based
upon the information developed to date, management believes that the accrued reserve is a reasonable estimate of the Company’s liability and that the risk of an additional loss in an amount materially higher than that accrued is remote.
The ability of certain subsidiaries and affiliated companies to transfer funds is limited by provisions of foreign government regulations, affiliate agreements and certain loan agreements. At December 31, 2015, the amount of equity subject to such restrictions for consolidated subsidiaries and affiliated companies was not significant. While this amount is legally restricted, it does not result in operational difficulties since we have generally permitted subsidiaries to retain a majority of equity to support their growth programs.
15. Hedging Activities
Corning is exposed to interest rate and foreign currency risks due to the movement of these rates.
The areas in which exchange rate fluctuations affect us include:
• Financial instruments and transactions denominated in foreign currencies, which impact earnings; and
• The translation of net assets in foreign subsidiaries for which the functional currency is not the U.S. dollar, which impacts our net equity.
Our most significant foreign currency exposures relate to the Japanese yen, South Korean won, New Taiwan dollar, Chinese renminbi, and the euro. We seek to mitigate the impact of exchange rate movements in our income statement by using over-the-counter (OTC) derivative instruments including foreign exchange forward and option contracts. In general, these hedges expire coincident with the timing of the underlying foreign currency commitments and transactions.
We are exposed to potential losses in the event of non-performance by our counterparties to these derivative contracts. However, we minimize this risk by maintaining a diverse group of highly-rated major international financial institutions with which we have other financial relationships as our counterparties. We do not expect to record any losses as a result of such counterparty default. Neither we nor our counterparties are required to post collateral for these financial instruments. The Company qualified for and elected the end-user exception to the mandatory swap clearing requirement of the Dodd-Frank Act.
Cash Flow HedgesOur cash flow hedging activities utilize OTC foreign exchange forward contracts to reduce the risk that movements in exchange rates will adversely affect the net cash flows resulting from the sale of products to foreign customers and purchases from foreign suppliers. Our cash flow hedging activity also uses interest rate swaps to reduce the risk of increases in benchmark interest rates on the probable issuance of debt and associated interest payments. In the fourth quarter of 2014, the Company entered into interest rate swap agreements to hedge against the variability in cash flows due to changes in the benchmark interest rate related to an anticipated issuance. The instruments were designated as cash flow hedges.
Corning uses a regression analysis to monitor the effectiveness of its cash flow hedges both prospectively and retrospectively. Through December 31, 2015, the hedge ineffectiveness related to these instruments is not material. Corning defers net gains and losses related to effective portion of cash flow hedges into accumulated other comprehensive (loss) income on the consolidated balance sheet until such time as the hedged item impacts earnings. At December 31, 2015, the amount expected to be reclassified into earnings within the next 12 months is a pre-tax net loss of $4.8 million.
Fair Value HedgesIn October of 2012, we entered into two interest rate swaps that are designated as fair value hedges and economically exchange a notional amount of $550 million of previously issued fixed rate long-term debt to floating rate debt. Under the terms of the swap agreements, we pay the counterparty a floating rate that is indexed to the one-month LIBOR rate.
Corning utilizes the long haul method for effectiveness analysis, both retrospectively and prospectively. The analysis excludes the impact of credit risk from the assessment of hedge effectiveness. The amount recorded in current period earnings in the other (expense) income, net component, relative to ineffectiveness, is nominal for the year ended December 31, 2015.
Net gains and losses from fair value hedges and the effects of the corresponding hedged item are recorded on the same line item of the Consolidated Statement of Income.
Undesignated HedgesCorning also uses OTC foreign exchange forward and option contracts that are not designated as hedging instruments for accounting purposes. The undesignated hedges limit exposures to foreign functional currency fluctuations related to certain subsidiaries’ monetary assets, monetary liabilities and net earnings in foreign currencies.
A significant portion of the Company’s non-U.S. revenues are denominated in Japanese yen, South Korean won and euro. When these revenues are translated back to U.S. dollars, the Company is exposed to foreign exchange rate movements in the Japanese yen, South Korean won and euro. To protect translated earnings against movements in these currencies, the Company has entered into a series of zero-cost collars and average rate forwards.

89CORNING INCORPORATED - 2015 Annual Report
Notes to Consolidated Financial Statements
The Company also uses these types of contracts to reduce the potential for unfavorable changes in foreign exchange rates to decrease the U.S. dollar value of translated earnings. With a zero-cost collar structure, the Company writes a local currency call option and purchases a local currency put option or vice versa. The zero-cost collars offset the impact of translated earnings above the put price and below the call strike price and that offset is reported in foreign currency hedge gain, net. The Company entered into a series of zero-cost collars, settling quarterly, to hedge the effect of translation impact for each respective quarter, and span up to the fourth quarter of 2017. Due to the nature of the instruments, only either the put option or the call option can be exercised at maturity. As of December 31, 2015, the U.S. dollar net notional value of the zero-cost collar is $2.9 billion. The Company entered into a series of average rate forwards with no associated premium, which will partially hedge the impact of Japanese yen and euro translation on the Company’s projected
2015 through 2017 net income. These forwards have a notional value of $6.4 billion and will settle net without obligation to deliver Japanese yen and euro. In January 2016, Corning took advantage of the stronger yen to extend its foreign exchange hedging program to hedge a significant portion of its projected yen exposure for the period 2018 through 2022.
The Company benefits from the increase in the U.S. dollar equivalent value of its foreign currency earnings in translation. The zero-cost collar would cap the benefit at the strike price of the written call or offset the decline from translation above the strike price of the purchased put.
The fair value of these derivative contracts are recorded as either assets (gain position) or liabilities (loss position) on the Consolidated Balance Sheet. Changes in the fair value of the derivative contracts are recorded currently in earnings in the foreign currency hedge gain, net line of the Consolidated Statement of Income.
The following table summarizes the notional amounts and respective fair values of Corning’s derivative financial instruments on a gross basis for December 31, 2015 and December 31, 2014 (in millions):
Asset derivatives Liability derivativesNotional amount Balance sheet
locationFair value Balance sheet
locationFair value
2015 2014 2015 2014 2015 2014Derivatives designated as hedging instruments
Foreign exchange contracts $ 782 $ 487Other current
assets $ 5 $ 22Other accrued
liabilities $ (10) $ (6)
Other assets 1Other
liabilities (23)
Interest rate contracts 550 1,300 Other assets 1Other
liabilities (4) (15)Derivatives not designated as hedging instruments
Foreign exchange contracts, other 1,095 1,285
Other current assets 6 17
Other accrued liabilities (12) (5)
Foreign currency hedges related to translated earnings 11,972 12,126
Other current assets 511 649
Other accrued liabilities (33) (33)
Other assets 472 846Other
liabilities (61)Total derivatives $ 14,399 $ 15,198 $ 995 $ 1,535 $ (143) $ (59)
The following tables summarize the effect on the consolidated financial statements relating to Corning’s derivative financial instruments (in millions):
Derivatives in hedging relationships
Effect of derivative instruments on the consolidated financial statements for the years ended December 31
(Loss)/gain recognized in other comprehensive income (OCI)
Location of gain/ (loss) reclassified from accumulated OCI into
income effective/ ineffective
Gain/(loss) reclassified from accumulated OCI into income
ineffective/effective(1)
2015 2014 2013 2015 2014 2013Cash flow hedges
Net sales $ 20 $ 3Interest rate hedge $ (7) $ (3) $ 33 Cost of sales 6 7 $ 38
Foreign exchange contracts (17) 20 56Other (expense)
income, net 91Total cash flow hedges $ (24) $ 17 $ 89 $ 26 $ 10 $ 129

90 CORNING INCORPORATED - 2015 Annual Report
Notes to Consolidated Financial Statements
Gain (loss) recognized in income
Undesignated derivativesLocation of gain/(loss) recognized in income 2015 2014 2013
Foreign exchange contracts – balance sheet Foreign currency hedge gain (loss), net $ 8 $ 29 $ 100Foreign exchange contracts – loans Foreign currency hedge (loss) gain, net (3) 13 87Foreign currency hedges related to translated earnings Foreign currency hedge gain (loss), net 80 1,369 435Total undesignated $ 85 $ 1,411 $ 622
(1) There were no material amounts of ineffectiveness for 2015 and 2014 and the amount of hedge ineffectiveness for the year ended December 31, 2013 was $24 million related to interest rate swaps settled in the fourth quarter.
16. Fair Value Measurements
Fair value standards under U.S. GAAP define fair value, establish a framework for measuring fair value in applying generally accepted accounting principles, and require disclosures about fair value measurements. The standards also identify two kinds of inputs that are used to determine the fair value of assets and liabilities: observable and unobservable. Observable inputs are based on market data or independent sources while unobservable inputs are based on the Company’s own
market assumptions. Once inputs have been characterized, the inputs are prioritized into one of three broad levels (provided in the table below) used to measure fair value. Fair value standards apply whenever an entity is measuring fair value under other accounting pronouncements that require or permit fair value measurement and require the use of observable market data when available.
The following tables provide fair value measurement information for the Company’s major categories of financial assets and liabilities measured on a recurring basis:
(in millions) December 31, 2015
Fair value measurements at reporting date usingQuoted prices in
active markets for identical assets (Level 1)
Significant other observable inputs (Level 2)
Significant unobservable inputs (Level 3)
Current assets:Short-term investments $ 100 $ 100Other current assets(1) $ 522 $ 522
Non-current assets:Other assets(1)(2) $ 752 $ 506 $ 246
Current liabilities:Other accrued liabilities(1) $ 55 $ 55
Non-current liabilities:Other liabilities(1)(2) $ 98 $ 88 $ 10
(1) Derivative assets and liabilities include foreign exchange contracts which are measured using observable quoted prices for similar assets and liabilities.(2) Other assets include asset-backed securities which are measured using observable quoted prices for similar assets and contingent consideration
assets or liabilities which are measured by applying an option pricing model using projected future revenues.
(in millions) December 31, 2014
Fair value measurements at reporting date usingQuoted prices in
active markets for identical assets (Level 1)
Significant other observable inputs (Level 2)
Significant unobservable inputs (Level 3)
Current assets:Short-term investments $ 759 $ 759Other current assets(1) $ 687 $ 687
Non-current assets:Other assets(1)(2) $ 1,330 $ 885 $ 445
Current liabilities:Other current liabilities(1) $ 44 $ 44
Non-current liabilities:Other liabilities(1) $ 15 $ 15
(1) Derivative assets and liabilities include foreign exchange contracts which are measured using observable quoted prices for similar assets and liabilities.(2) Other assets include asset-backed securities which are measured using observable quoted prices for similar assets and a contingent consideration
asset which was measured by applying an option pricing model using projected future Corning Precision Materials’ revenue.

91CORNING INCORPORATED - 2015 Annual Report
Notes to Consolidated Financial Statements
Level 3 Roll-Forward – Other Assets(in millions) 2015 2014Beginning balance $ 445 $ 196Unrealized gains (loss) 13 249Transfer in (out) of level 3 (212)Ending balance $ 246 $ 445
As a result of the acquisition of Samsung Corning Precision Materials in January 2014, the Company has contingent consideration that was measured using unobservable (Level 3) inputs. This contingent consideration arrangement potentially requires additional consideration to be paid between the parties in 2018: one based on projections of future revenues generated by the business of Corning Precision Materials for the period between the acquisition date and December 31, 2017, which is subject to a cap of $665 million; and another based on the volumes of certain sales during the same period, which is subject to a separate cap of $100 million. The fair value of the potential receipt of the contingent consideration in 2018 in the amount of $196 million recognized on the acquisition date was estimated by applying an option pricing model using the Company’s projection of future revenues generated by Corning Precision Materials. Changes in the fair value of the contingent consideration in future periods are valued using an option pricing model and are recorded in Corning’s results in the period of the change.
On December 29, 2015, Corning and Samsung Display entered into an agreement pursuant to which Corning exchanged the amount of contingent consideration in excess of $300 million (net present fair value:
$246 million), as consideration for the incremental fair value associated with a number of commercial agreements, including the amendment of its long-term supply agreement with Samsung Display. As of December 29, 2015, the net present fair value of the contingent consideration receivable was $458 million. The net present fair value of the commercial benefit associated with the amended long-term supply agreement exceeds the value exchanged by Corning pursuant to this agreement (net present fair value: $212 million). Consequently, Corning reclassified this amount to the other asset line of the Consolidated Balance Sheet and will amortize the amount over the remaining term of the long-term supply agreement as a reduction in revenue.
Additionally, as a result of the acquisitions of iBwave Solutions Inc. and the fiber-optics business of Samsung Electronics Co., Ltd. in the first quarter of 2015, the Company has contingent consideration that was measured using unobservable (Level 3) inputs. As of December 31, 2015, the fair value of the contingent consideration payable is $10 million.
There were no significant financial assets and liabilities measured on a nonrecurring basis during the years ended December 31, 2015 and 2014.
17. Shareholders’ Equity
Fixed Rate Cumulative Convertible Preferred Stock, Series AOn January 15, 2014, Corning designated a new series of its preferred stock as Fixed Rate Cumulative Convertible Preferred Stock, Series A, par value $100 per share, and issued 1,900 shares of Preferred Stock at an issue price of $1 million per share, for an aggregate issue price of $1.9 billion, to Samsung Display in connection with the acquisition of its equity interests in Samsung Corning Precision Materials. Corning also issued to Samsung Display an additional amount of Preferred Stock at closing, for an aggregate issue price of $400 million in cash.
Dividends on the Preferred Stock are cumulative and accrue at the annual rate of 4.25% on the per share issue price of $1 million. The dividends are payable quarterly as and when declared by the Company’s Board of Directors. The Preferred Stock ranks senior to our common stock with respect to payment of dividends and rights upon liquidation. The Preferred Stock is not redeemable except in the case of a certain deemed liquidation event, the occurrence of which is under the control of the Company. The Preferred Stock is convertible at the option of the holder and the Company upon certain events, at a conversion rate of 50,000 shares of Corning’s common stock per one share of Preferred Stock, subject to certain anti-dilution provisions. As of December 31, 2015, the Preferred Stock has not been converted, and none of the anti-dilution provisions have been triggered. Following the seventh anniversary of the closing of the acquisition of Samsung Corning Precision Materials, the Preferred Stock will be convertible, in whole or in part, at the option of the holder. The Company has the right, at its option, to cause some or all of the shares of Preferred Stock to be converted into Common Stock, if, for 25 trading days (whether or not consecutive) within any period of 40 consecutive trading days, the closing price of Common Stock exceeds $35 per share. If the aforementioned right becomes exercisable before the seventh anniversary of the closing, the Company must first obtain
the written approval of the holders of a majority of the Preferred Stock before exercising its conversion right. The Preferred Stock does not have any voting rights except as may be required by law.
Share Repurchases
2013 Repurchase ProgramOn October 31, 2013, as part of the share repurchase program announced on April 24, 2013 (the “2013 Repurchase Program”), Corning entered into an accelerated share repurchase (“ASR”) agreement (the “2013 ASR agreement”) with JP Morgan Chase Bank, National Association, London Branch (“JPMC”). Under the 2013 ASR agreement, Corning agreed to purchase $1 billion of its common stock, in total, with an initial delivery by JPMC of 47.1 million shares based on the current market price, and payment of $1 billion made by Corning to JPMC. The payment to JPMC was recorded as a reduction to shareholders’ equity, consisting of an $800 million increase in treasury stock, which reflects the value of the initial 47.1 million shares received upon execution, and a $200 million decrease in other-paid-in capital, which reflects the value of the stock held back by JPMC pending final settlement. On January 28, 2014, the 2013 ASR agreement was completed. Corning received an additional 10.5 million shares on January 31, 2014 to settle the 2013 ASR agreement. In total, Corning purchased 57.6 million shares based on the average daily volume weighted-average price of Corning’s common stock during the term of the 2013 ASR agreement, less a discount.
In addition to the shares repurchased through the 2013 ASR agreement, we repurchased 61.3 million shares of common stock on the open market for approximately $1 billion, as part of the 2013 Repurchase Program. This program was executed between the second quarter of 2013 and the first quarter of 2014, with a total of 118.9 million shares repurchased for approximately $2 billion.

92 CORNING INCORPORATED - 2015 Annual Report
Notes to Consolidated Financial Statements
March 2014 Repurchase ProgramOn March 4, 2014, as part of the $2 billion share repurchase program announced on October 22, 2013 and made effective concurrent with the closing of Corning’s acquisition of Samsung Corning Precision Materials on January 15, 2014 (the “March 2014 Repurchase Program”), Corning entered into an ASR agreement (the “2014 ASR agreement”) with Citibank N.A. (“Citi”). Under the 2014 ASR agreement, Corning agreed to purchase $1.25 billion of its common stock, with an initial delivery by Citi of 52.5 million shares based on the current market price, and payment of $1.25 billion made by Corning to Citi. The 2014 ASR agreement was completed on May 28, 2014, and Corning received an additional 8.7 million shares to settle the 2014 ASR agreement. In total, Corning repurchased 61.2 million shares based on the average daily volume weighted-average price of Corning’s common stock during the term of the 2014 ASR agreement, less a discount.
In addition to the shares repurchased through the 2014 ASR agreement, in the year ended December 31, 2014, we repurchased 36.9 million shares of common stock on the open market for approximately $750 million, as part of the March 2014 Repurchase Program. This program was completed in the fourth quarter of 2014, with a total of 98.2 million shares repurchased for approximately $2 billion.
December 2014 Repurchase ProgramOn December 3, 2014, Corning’s Board of Directors authorized the repurchase of up to $1.5 billion shares of common stock (the “December 2014 Repurchase Program”) between the date of announcement and December 31, 2016. In the year ended December 31, 2015, we repurchased 70.4 million shares of common stock for approximately $1.5 billion as part of the December 2014 Repurchase Program, which was completed in the third quarter of 2015.
2015 Repurchase ProgramsOn July 15, 2015, Corning’s Board of Directors approved a $2 billion share repurchase program (the “July 2015 Repurchase Program”) and on October 26, 2015 the Board of Directors authorized an additional $4 billion share repurchase program (together with the July 2015 Repurchase Program, the “2015 Repurchase Programs”). The 2015 Repurchase Programs permit Corning to effect repurchases from time to time through a combination of open market repurchases, privately negotiated transactions, advance repurchase agreements and/or other arrangements.
On October 28, 2015, Corning entered into an ASR with Morgan Stanley & Co. LLC (“Morgan Stanley”) to repurchase $1.25 billion of Corning’s common stock (the “2015 ASR agreement”). The 2015 ASR was executed under the July 2015 Repurchase Program. Under the 2015 ASR agreement, Corning made a $1.25 billion payment to Morgan Stanley on October 29, 2015 and received an initial delivery of approximately 53.1 million shares of Corning common stock from Morgan Stanley on the same day. The payment to Morgan Stanley was recorded as a reduction to shareholders’ equity, consisting of $1 billion increase in treasury stock, which reflects the value of the initial 53.1 million shares received upon execution, and a $250 million decrease in other-paid-in capital, which reflects the value of the stock held back by Morgan Stanley pending final settlement. On January 19, 2016, the 2015 ASR agreement was completed. Corning received an additional 15.9 million shares on January 22, 2016 to settle the 2015 ASR agreement. In total, Corning purchased 69 million shares based on the average daily volume weighted-average price of Corning’s common stock during the term of the 2015 ASR agreement, less a discount.
In addition to the shares repurchased through the 2015 ASR agreement, we repurchased 98 million shares of common stock on the open market for approximately $2 billion, as part of the December 2014 Repurchase Program and the July 2015 Repurchase Program, resulting in a total of 151 million shares repurchased during 2015.
The following table presents changes in capital stock for the period from January 1, 2013 to December 31, 2015 (in millions):
Common stock Treasury stockShares Par value Shares Cost
Balance at December 31, 2012 1,649 $ 825 (179) $ (2,773)Shares issued to benefit plans and for option exercises 12 6 (1)Shares purchased for treasury (82) (1,316)Other, net (1) (9)
Balance at December 31, 2013 1,661 $ 831 (262) $ (4,099)Shares issued to benefit plans and for option exercises 11 5 (2)Shares purchased for treasury (135) (2,612)Other, net (1) (14)
Balance at December 31, 2014(1) 1,672 $ 836 (398) $ (6,727)Shares issued to benefit plans and for option exercises 9 4 (1)Shares purchased for treasury (151) (2,978)Other, net (2) (19)
Balance at December 31, 2015 1,681 $ 840 (551) $ (9,725)(1) On January 15, 2014, in conjunction with the acquisition of Corning Precision Materials, Corning issued 2,300 Fixed Rate Cumulative Convertible
Preferred Stock, Series A (“Preferred Stock”), par value $100 per share, at an issue price of $1 million per share, for an aggregate issue price of $2.3 billion. There have been no further issuances or conversions of Preferred Stock since 2014.
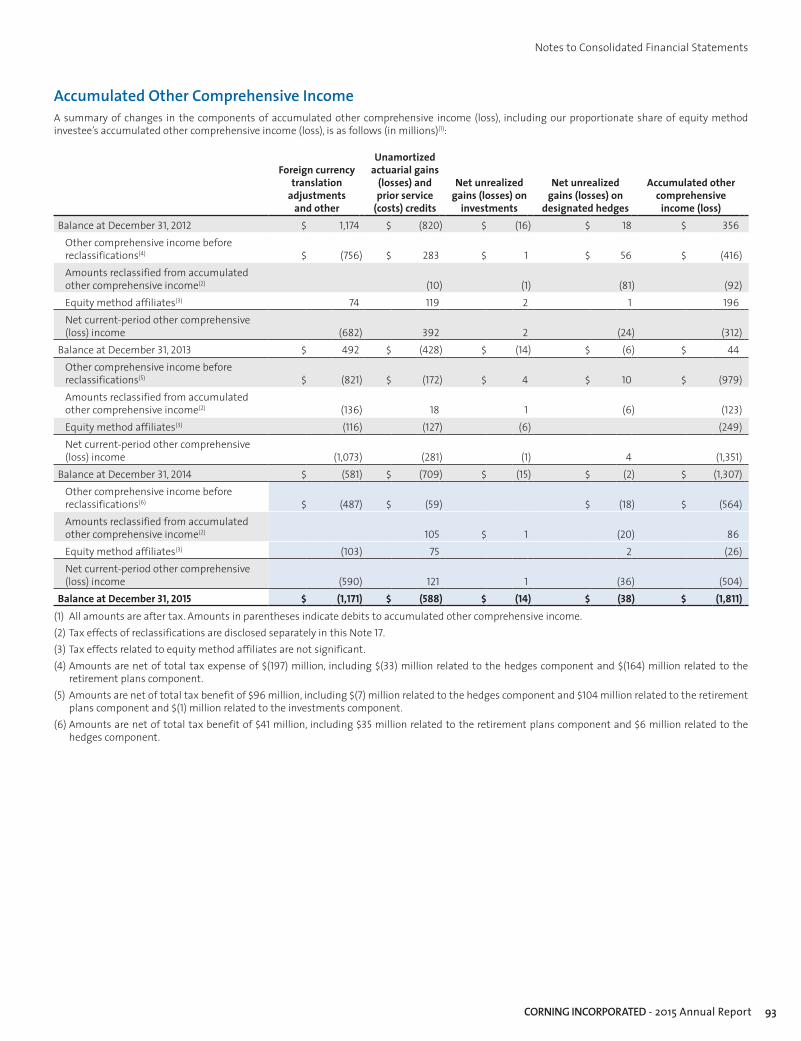
93CORNING INCORPORATED - 2015 Annual Report
Notes to Consolidated Financial Statements
Accumulated Other Comprehensive IncomeA summary of changes in the components of accumulated other comprehensive income (loss), including our proportionate share of equity method investee’s accumulated other comprehensive income (loss), is as follows (in millions)(1):
Foreign currency translation
adjustments and other
Unamortized actuarial gains
(losses) and prior service
(costs) credits
Net unrealized gains (losses) on
investments
Net unrealized gains (losses) on
designated hedges
Accumulated other comprehensive
income (loss)Balance at December 31, 2012 $ 1,174 $ (820) $ (16) $ 18 $ 356
Other comprehensive income before reclassifications(4) $ (756) $ 283 $ 1 $ 56 $ (416)Amounts reclassified from accumulated other comprehensive income(2) (10) (1) (81) (92)Equity method affiliates(3) 74 119 2 1 196Net current-period other comprehensive (loss) income (682) 392 2 (24) (312)
Balance at December 31, 2013 $ 492 $ (428) $ (14) $ (6) $ 44Other comprehensive income before reclassifications(5) $ (821) $ (172) $ 4 $ 10 $ (979)Amounts reclassified from accumulated other comprehensive income(2) (136) 18 1 (6) (123)Equity method affiliates(3) (116) (127) (6) (249)Net current-period other comprehensive (loss) income (1,073) (281) (1) 4 (1,351)
Balance at December 31, 2014 $ (581) $ (709) $ (15) $ (2) $ (1,307)Other comprehensive income before reclassifications(6) $ (487) $ (59) $ (18) $ (564)Amounts reclassified from accumulated other comprehensive income(2) 105 $ 1 (20) 86Equity method affiliates(3) (103) 75 2 (26)Net current-period other comprehensive (loss) income (590) 121 1 (36) (504)
Balance at December 31, 2015 $ (1,171) $ (588) $ (14) $ (38) $ (1,811)(1) All amounts are after tax. Amounts in parentheses indicate debits to accumulated other comprehensive income.(2) Tax effects of reclassifications are disclosed separately in this Note 17.(3) Tax effects related to equity method affiliates are not significant.(4) Amounts are net of total tax expense of $(197) million, including $(33) million related to the hedges component and $(164) million related to the
retirement plans component.(5) Amounts are net of total tax benefit of $96 million, including $(7) million related to the hedges component and $104 million related to the retirement
plans component and $(1) million related to the investments component.(6) Amounts are net of total tax benefit of $41 million, including $35 million related to the retirement plans component and $6 million related to the
hedges component.

94 CORNING INCORPORATED - 2015 Annual Report
Notes to Consolidated Financial Statements
(In millions)
Reclassifications Out of Accumulated Other Comprehensive Income (AOCI) by Component(1)
Details about AOCI Components
Amount reclassified from AOCI Affected line item in the consolidated
statements of incomeYears ended December 31,
2015 2014 2013Foreign currency translation adjustment $ 136 Transaction-related gain, net
136 Net of taxAmortization of net actuarial (loss) gain $ (168) $ (29) $ 15 (2)
Amortization of prior service credit 1 1 (2)
(167) (29) 16 Total before tax62 11 (6) Tax benefit (expense)
$ (105) $ (18) $ 10 Net of taxRealized (losses) gains on investments $ (1) $ (1) $ 1 Other (expense) income, net
Tax expense$ (1) $ (1) $ 1 Net of tax
Realized gains on designated hedges $ 20 $ 3 Sales6 7 $ 38 Cost of sales
91 Other (expense) income, net26 10 129 Total before tax(6) (4) (48) Tax expense
$ 20 $ 6 $ 81 Net of taxTotal reclassifications for the period $ (86) $ 123 $ 92 Net of tax
(1) Amounts in parentheses indicate debits to the statement of income.(2) These accumulated other comprehensive income components are included in net periodic pension cost. See Note 13 (Employee Retirement Plans) to
the Consolidated Financial Statements for additional details.
18. Earnings Per Common Share
Basic earnings per common share are computed by dividing income attributable to common shareholders by the weighted-average number of common shares outstanding for the period. Diluted earnings per common share assumes the issuance of common shares for all potentially dilutive securities outstanding.
The reconciliation of the amounts used to compute basic and diluted earnings per common share from continuing operations follows (in millions, except per share amounts):
Years ended December 31,2015 2014 2013
Net income attributable to Corning Incorporated $ 1,339 $ 2,472 $ 1,961Less: Series A convertible preferred stock dividend 98 94Net income available to common stockholders - basic 1,241 2,378 1,961Plus: Series A convertible preferred stock dividend 98 94Net income available to common stockholders - diluted $ 1,339 $ 2,472 $ 1,961Weighted-average common shares outstanding - basic 1,219 1,305 1,452Effect of dilutive securities:
Stock options and other dilutive securities 9 12 10Series A convertible preferred stock 115 110
Weighted-average common shares outstanding - diluted 1,343 1,427 1,462
Basic earnings per common share $ 1.02 $ 1.82 $ 1.35Diluted earnings per common share $ 1.00 $ 1.73 $ 1.34Anti-dilutive potential shares excluded from diluted earnings per common share:
Employee stock options and awards 22 24 39Accelerated share repurchase forward contract 15 3 3
Total 37 27 42

95CORNING INCORPORATED - 2015 Annual Report
Notes to Consolidated Financial Statements
19. Share-based Compensation
Stock Compensation PlansCorning maintains long-term incentive plans (the Plans) for key employees and non-employee members of our Board of Directors. The Plans allow us to grant equity-based compensation awards, including stock options, stock appreciation rights, performance share units, restricted stock units, restricted stock awards or a combination of awards (collectively, share-based awards). At December 31, 2015, there were approximately 72 million unissued common shares available for future grants under the Plans.
The Company measures and recognizes compensation cost for all share-based payment awards made to employees and directors based on estimated fair values.
The fair value of awards granted subsequent to January 1, 2006 that are expected to ultimately vest is recognized as expense over the requisite service periods. The number of options expected to vest equals the total options granted less an estimation of the number of forfeitures expected to occur prior to vesting. The forfeiture rate is calculated based on 15 years
of historical data and is adjusted if actual forfeitures differ significantly from the original estimates. The effect of any change in estimated forfeitures would be recognized through a cumulative adjustment that would be included in compensation cost in the period of the change in estimate.
Total share-based compensation cost of $46 million, $58 million and $54 million was disclosed in operating activities on the Company’s Consolidated Statements of Cash Flows for the years ended December 31, 2015, 2014 and 2013, respectively.
Stock OptionsCorning’s stock option plans provide non-qualified and incentive stock options to purchase authorized but unissued shares, or treasury shares, at the market price on the grant date and generally become exercisable in installments from one to five years from the grant date. The maximum term of non-qualified and incentive stock options is 10 years from the grant date.
The following table summarizes information concerning stock options outstanding including the related transactions under the stock option plans for the year ended December 31, 2015:
Number of shares (in thousands)
Weighted-average exercise price
Weighted-average remaining
contractual term in years
Aggregate intrinsic value (in thousands)
Options outstanding as of December 31, 2014 48,724 $ 18.94 Granted 1,578 21.48Exercised (6,340) 16.13Forfeited and expired (1,224) 20.78
Options outstanding as of December 31, 2015 42,738 19.40 3.93 $ 83,023 Options expected to vest as of December 31, 2015 42,696 19.40 3.93 82,992Options exercisable as of December 31, 2015 35,245 19.86 3.08 65,817
The aggregate intrinsic value (market value of stock less option exercise price) in the preceding table represents the total pretax intrinsic value, based on the Company’s closing stock price on December 31, 2015, which would have been received by the option holders had all option holders exercised their “in-the-money” options as of that date. The total number of “in-the-money” options exercisable on December 31, 2015, was approximately 13 million.
The weighted-average grant-date fair value for options granted for the years ended December 31, 2015, 2014 and 2013 was $7.99, $8.29 and $5.02, respectively. The total fair value of options that vested during the years ended December 31, 2015, 2014 and 2013 was approximately $36 million, $16 million and $29 million, respectively. Compensation cost related to stock options for the years ended December 31, 2015, 2014 and 2013, was approximately $14 million, $22 million and $25 million, respectively.
As of December 31, 2015, there was approximately $7 million of unrecognized compensation cost related to stock options granted under the Plans. The cost is expected to be recognized over a weighted-average period of 1.7 years.
Proceeds received from the exercise of stock options were $102 million for the year ended December 31, 2015, which were included in financing activities on the Company’s Consolidated Statements of Cash Flows. The total intrinsic value of options exercised for the years ended December 31, 2015, 2014 and 2013 was approximately $48 million, $69 million and $55 million, respectively. The income tax benefit realized from share-based compensation was not significant for the years ended December 31, 2015
and 2014. There were no income tax benefits realized from share-based compensation for the year ended December 31, 2013, due to net operating loss and credit carryforwards available to the Company. Refer to Note 6 (Income Taxes).
An award is considered vested when the employee’s retention of the award is no longer contingent on providing subsequent service (the “non-substantive vesting period approach”). Awards to retirement eligible employees are fully vested at the date of grant, and the related compensation expense is recognized immediately upon grant or over the period from the grant date to the date of retirement eligibility for employees that become age 55 during the vesting period.
Corning uses a multiple-point Black-Scholes valuation model to estimate the fair value of stock option grants. Corning utilizes a blended approach for calculating the volatility assumption used in the multiple-point Black-Scholes valuation model defined as the weighted average of the short-term implied volatility, the most recent volatility for the period equal to the expected term, and the most recent 15-year historical volatility. The expected term assumption is the period of time the options are expected to be outstanding, and is calculated using a combination of historical exercise experience adjusted to reflect the current vesting period of options being valued, and partial life cycles of outstanding options. The risk-free rates used in the multiple-point Black-Scholes valuation model are the implied rates for a zero-coupon U.S. Treasury bond with a term equal to the option’s expected term. The ranges given below reflect results from separate groups of employees exhibiting different exercise behavior.

96 CORNING INCORPORATED - 2015 Annual Report
Notes to Consolidated Financial Statements
The following inputs were used for the valuation of option grants under our Stock Option Plans:
2015 2014 2013Expected volatility 43.6-44.9% 45.4-46.2% 46.5-47.4%Weighted-average volatility 43.6-44.9% 45.4-46.2% 46.6-47.3%Expected dividends 1.92-2.68% 1.90-2.09% 2.35-3.02 %Risk-free rate 1.9-2.1% 2.0-2.2% 0.8-2.2%Average risk-free rate 1.9-2.1% 2.0-2.2% 1.1-2.2%Expected term (in years) 7.2-7.2 7.2-7.2 5.8-7.2Pre-vesting departure rate 0.6-0.6% 0.5-0.5% 0.4-4.1%
Incentive Stock PlansThe Corning Incentive Stock Plan permits restricted stock and restricted stock unit grants, either determined by specific performance goals or issued directly, in most instances, subject to the possibility of forfeiture and without cash consideration. Restricted stock and restricted stock units under the Incentive Stock Plan are granted at the closing market price on the grant date, contingently vest over a period of generally one to ten years, and generally have contractual lives of one to ten years. The fair value of each restricted stock grant or restricted stock unit awarded under the Incentive Stock Plan is based on the grant date closing price of the Company’s stock.
Time-Based Restricted Stock and Restricted Stock Units:Time-based restricted stock and restricted stock units are issued by the Company on a discretionary basis, and are payable in shares of the Company’s common stock upon vesting. The fair value is based on the closing market price of the Company’s stock on the grant date. Compensation cost is recognized over the requisite vesting period and adjusted for actual forfeitures before vesting.
The following table represents a summary of the status of the Company’s non-vested time-based restricted stock and restricted stock units as of December 31, 2014, and changes which occurred during the year ended December 31, 2015:
Shares (000’s)
Weighted-average grant-date fair value
Non-vested shares and share units at December 31, 2014 5,737 $ 15.43Granted 1,815 21.49Vested (2,238) 14.35Forfeited (72) 21.11Non-vested shares and share units at December 31, 2015 5,242 17.91
As of December 31, 2015, there was approximately $27 million of unrecognized compensation cost related to non-vested time-based restricted stock and restricted stock units compensation arrangements granted under the Plan. The cost is expected to be recognized over a weighted-average period of 2.3 years. The total fair value of time-based restricted stock that vested during the years ended December 31, 2015, 2014 and 2013 was approximately $32 million, $32 million and $29 million, respectively. Compensation cost related to time-based restricted stock and restricted stock units was approximately $32 million, $36 million and $29 million for the years ended December 31, 2015, 2014 and 2013, respectively.
20. Reportable Segments
Our reportable segments are as follows:
• Display Technologies – manufactures glass substrates for flat panel liquid crystal displays.
• Optical Communications – manufactures carrier network and enterprise network components for the telecommunications industry.
• Environmental Technologies – manufactures ceramic substrates and filters for automotive and diesel applications.
• Specialty Materials – manufactures products that provide more than 150 material formulations for glass, glass ceramics and fluoride crystals to meet demand for unique customer needs.
• Life Sciences – manufactures glass and plastic labware, equipment, media and reagents to provide workflow solutions for scientific applications.
All other segments that do not meet the quantitative threshold for separate reporting have been grouped as “All Other.” This group is primarily comprised of the results of Corning’s Pharmaceutical Technologies business, which consists of a pharmaceutical glass business
and a glass tubing business used in the pharmaceutical packaging industry. This segment also includes Corning Precision Materials’ non-LCD business and new product lines and development projects such as laser technologies, advanced flow reactors and adjacency businesses in pursuit of thin, strong glass, as well as certain corporate investments such as Eurokera and Keraglass equity affiliates.
We prepared the financial results for our reportable segments on a basis that is consistent with the manner in which we internally disaggregate financial information to assist in making internal operating decisions. We included the earnings of equity affiliates that are closely associated with our reportable segments in the respective segment’s net income. We have allocated certain common expenses among reportable segments differently than we would for stand-alone financial information. Segment net income may not be consistent with measures used by other companies. The accounting policies of our reportable segments are the same as those applied in the Consolidated Financial Statements.

97CORNING INCORPORATED - 2015 Annual Report
Notes to Consolidated Financial Statements
The following provides historical segment information as described above:
SEGMENT INFORMATION
(in millions)Display
TechnologiesOptical
CommunicationsEnvironmental Technologies
Specialty Materials
Life Sciences
All Other Total
For the year ended December 31, 2015
Net sales $ 3,086 $ 2,980 $ 1,053 $ 1,107 $ 821 $ 64 $ 9,111 Depreciation(1) $ 605 $ 163 $ 125 $ 112 $ 60 $ 43 $ 1,108 Amortization of purchased intangibles $ 32 $ 20 $ 1 $ 53 Research, development and engineering expenses(2) $ 105 $ 138 $ 93 $ 113 $ 23 $ 186 $ 658 Restructuring, impairment and other charges $ (1) $ 16 $ 15 Equity in earnings of affiliated companies $ (9) $ 17 $ 8 Income tax (provision) benefit $ (499) $ (115) $ (78) $ (85) $ (30) $ 89 $ (718)Net income (loss)(4) $ 1,095 $ 237 $ 161 $ 167 $ 61 $ (202) $ 1,519 Investment in affiliated companies, at equity $ 43 $ 1 $ 32 $ 261 $ 337 Segment assets(5) $ 8,344 $ 1,783 $ 1,288 $ 1,407 $ 514 $ 738 $ 14,074 Capital expenditures $ 594 $ 171 $ 117 $ 88 $ 32 $ 57 $ 1,059
For the year ended December 31, 2014
Net sales $ 3,851 $ 2,652 $ 1,092 $ 1,205 $ 862 $ 53 $ 9,715 Depreciation(1) $ 676 $ 154 $ 119 $ 113 $ 60 $ 31 $ 1,153 Amortization of purchased intangibles $ 10 $ 22 $ 32 Research, development and engineering expenses(2) $ 138 $ 141 $ 91 $ 140 $ 22 $ 177 $ 709 Restructuring, impairment and other charges $ 45 $ 17 $ (1) $ 1 $ 6 $ 68 Equity in earnings of affiliated companies $ (20) $ 2 $ 18 Income tax (provision) benefit $ (608) $ (111) $ (89) $ (75) $ (33) $ 83 $ (833)Net income (loss)(4) $ 1,396 $ 194 $ 178 $ 138 $ 67 $ (198) $ 1,775 Investment in affiliated companies, at equity $ 63 $ 2 $ 32 $ 214 $ 311 Segment assets(5) $ 8,863 $ 1,737 $ 1,297 $ 1,288 $ 553 $ 518 $ 14,256 Capital expenditures $ 492 $ 145 $ 173 $ 104 $ 30 $ 101 $ 1,045
For the year ended December 31, 2013
Net sales $ 2,545 $ 2,326 $ 919 $ 1,170 $ 851 $ 8 $ 7,819 Depreciation(1) $ 481 $ 147 $ 120 $ 137 $ 57 $ 18 $ 960 Amortization of purchased intangibles $ 10 $ 21 $ 31 Research, development and engineering expenses(2) $ 84 $ 140 $ 89 $ 144 $ 20 $ 116 $ 593 Restructuring, impairment and other charges $ 7 $ 12 $ 1 $ 19 $ 4 $ 8 $ 51 Equity in earnings of affiliated companies(3) $ 357 $ 2 $ 1 $ 4 $ (24) $ 340 Income tax (provision) benefit $ (337) $ (96) $ (63) $ (88) $ (34) $ 59 $ (559)Net income (loss)(4) $ 1,293 $ 189 $ 127 $ 181 $ 68 $ (165) $ 1,693 Investment in affiliated companies, at equity $ 3,666 $ 3 $ 31 $ 10 $ 232 $ 3,942 Segment assets(5) $ 9,501 $ 1,654 $ 1,230 $ 1,333 $ 551 $ 422 $ 14,691 Capital expenditures $ 350 $ 105 $ 196 $ 62 $ 51 $ 55 $ 819
(1) Depreciation expense for Corning’s reportable segments includes an allocation of depreciation of corporate property not specifically identifiable to a segment.
(2) Research, development and engineering expenses include direct project spending that is identifiable to a segment.(3) In 2013, equity in earnings of affiliated companies in the Display Technologies segment included a $28 million restructuring charge for our share of
costs for headcount reductions and asset write-offs.(4) Many of Corning’s administrative and staff functions are performed on a centralized basis. Where practicable, Corning charges these expenses
to segments based upon the extent to which each business uses a centralized function. Other staff functions, such as corporate finance, human resources and legal are allocated to segments, primarily as a percentage of sales.
(5) Segment assets include inventory, accounts receivable, property, plant and equipment, net of accumulated depreciation, and associated equity companies and cost investments.

98 CORNING INCORPORATED - 2015 Annual Report
Notes to Consolidated Financial Statements
For the year ended December 31, 2015, the following number of customers, which individually accounted for 10% or more of each segment’s sales, represented the following concentration of segment sales:
• In the Display Technologies segment, three customers accounted for 62% of total segment sales.
• In the Optical Communications segment, two customers accounted for 22% of total segment sales.
• In the Environmental Technologies segment, three customers accounted for 86% of total segment sales.
• In the Specialty Materials segment, three customers accounted for 56% of total segment sales.
• In the Life Sciences segment, two customers accounted for 46% of total segment sales.
A significant amount of specialized manufacturing capacity for our Display Technologies segment is concentrated in Asia. It is at least reasonably possible that the use of a facility located outside of an entity’s home country could be disrupted. Due to the specialized nature of the assets, it would not be possible to find replacement capacity quickly. Accordingly, loss of these facilities could produce a near-term severe impact to our display business and the Company as a whole.
A reconciliation of reportable segment net income (loss) to consolidated net income follows (in millions):
Years ended December 31,2015 2014 2013
Net income of reportable segments $ 1,721 $ 1,973 $ 1,858 Net loss of All Other (202) (198) (165)Unallocated amounts:
Net financing costs(1) (111) (113) (66)Share-based compensation expense (46) (58) (54)Exploratory research (109) (102) (112)Corporate contributions (52) (43) (42)Equity in earnings of affiliated companies, net of impairments(2) 291 269 207 Unrealized (loss) gain on foreign currency hedges related to translated earnings (573) 1,095 368 Income tax benefit (provision) 568 (267) (1)Other corporate items (148) (84) (32)
Net income $ 1,339 $ 2,472 $ 1,961 (1) Net financing costs include interest income, interest expense, and interest costs and investment gains and losses associated with benefit plans.(2) Primarily represents the equity earnings of Dow Corning.
A reconciliation of reportable segment assets to consolidated total assets follows (in millions):
December 31,2015 2014 2013
Total assets of reportable segments $ 13,336 $ 13,738 $ 14,269Non-reportable segments 738 518 422Unallocated amounts:
Current assets(1) 5,488 7,402 6,349Investments(2) 1,638 1,490 1,595Property, plant and equipment, net(3) 1,692 1,657 1,594Other non-current assets(4) 5,655 5,258 4,249
Total assets $ 28,547 $ 30,063 $ 28,478(1) Includes current corporate assets, primarily cash, short-term investments, current portion of long-term derivative assets and deferred taxes.(2) Represents corporate investments in affiliated companies, at both cost and equity (primarily Dow Corning).(3) Represents corporate property not specifically identifiable to an operating segment.(4) Includes non-current corporate assets, pension assets, long-term derivative assets and deferred taxes.

99CORNING INCORPORATED - 2015 Annual Report
Notes to Consolidated Financial Statements
Selected financial information concerning the Company’s product lines and reportable segments follow (in millions):
Years Ended December 31,Revenues from External Customers 2015 2014 2013Display Technologies $ 3,086 $ 3,851 $ 2,545Optical Communications
Carrier network 2,194 2,036 1,782Enterprise network 786 616 544
Total Optical Communications 2,980 2,652 2,326Environmental Technologies
Automotive and other 528 528 485Diesel 525 564 434
Total Environmental Technologies 1,053 1,092 919Specialty Materials
Corning Gorilla Glass 810 846 848Advanced optics and other specialty glass 297 359 322
Total Specialty Materials 1,107 1,205 1,170Life Sciences
Labware 512 536 529Cell culture products 309 326 322
Total Life Science 821 862 851All Other 64 53 8
$ 9,111 $ 9,715 $ 7,819

100 CORNING INCORPORATED - 2015 Annual Report
Notes to Consolidated Financial Statements
Information concerning principal geographic areas was as follows (in millions):
2015 2014 2013
Net sales(2)Long-lived
assets(1) Net sales(2)Long-lived
assets(1) Net sales(2)Long-lived
assets(1)
North AmericaUnited States $ 2,719 $ 8,241 $ 2,275 $ 7,998 $ 2,061 $ 7,170Canada 244 144 311 308Mexico 37 135 35 50 23 36
Total North America 3,000 8,520 2,621 8,048 2,392 7,206Asia Pacific
Japan 440 1,160 608 1,311 621 1,548Taiwan 841 2,301 1,092 2,005 1,376 2,277China 1,869 1,036 1,893 1,115 1,916 1,218Korea 1,501 3,552 1,882 3,595 96 3,234Other 331 98 308 109 278 127
Total Asia Pacific 4,982 8,147 5,783 8,135 4,287 8,404Europe
Germany 326 189 397 217 337 171France 90 263 81 277 79 287United Kingdom 164 47 187 47 165 6Other 311 987 369 1,109 280 1,147
Total Europe 891 1,486 1,034 1,650 861 1,611Latin America
Brazil 55 36 67 36 77 66Other 34 35 37 6
Total Latin America 89 36 102 36 114 72All Other 149 175 19 165 25Total $ 9,111 $ 18,189 $ 9,715 $ 17,888 $ 7,819 $ 17,318
(1) Long-lived assets primarily include investments, plant and equipment, goodwill and other intangible assets. In 2014 and 2015, assets in the U.S. include the investment in Dow Corning. In 2013, assets in the U.S. and South Korea include investments in Dow Corning and Samsung Corning Precision Materials.
(2) Net sales are attributed to countries based on location of customer.

101CORNING INCORPORATED - 2015 Annual Report
Valuation Accounts and Reserves(in millions)
Year ended December 31, 2015Balance at
beginning of period AdditionsNet deductions
and otherBalance at end
of periodDoubtful accounts and allowances $ 47 $ 1 $ 48Deferred tax valuation allowance $ 298 $ 30 $ 90 $ 238Accumulated amortization of purchased intangible assets $ 216 $ 49 $ 265Reserves for accrued costs of business restructuring $ 44 $ 41 $ 3
Year ended December 31, 2014Balance at
beginning of period AdditionsNet deductions
and otherBalance at end
of periodDoubtful accounts and allowances $ 28 $ 19 $ 47Deferred tax valuation allowance $ 286 $ 186 $ 174 $ 298Accumulated amortization of purchased intangible assets $ 185 $ 31 $ 216Reserves for accrued costs of business restructuring $ 44 $ 49 $ 49 $ 44
Year ended December 31, 2013Balance at
beginning of period AdditionsNet deductions
and otherBalance at end
of periodDoubtful accounts and allowances $ 26 $ 2 $ 28Deferred tax valuation allowance $ 210 $ 80 $ 4 $ 286Accumulated amortization of purchased intangible assets $ 154 $ 31 $ 185Reserves for accrued costs of business restructuring $ 42 $ 41 $ 39 $ 44

102 CORNING INCORPORATED - 2015 Annual Report
Quarterly Operating Results(unaudited) (In millions, except per share amounts)
2015 First quarter Second quarter Third quarter Fourth quarter Total yearNet sales $ 2,265 $ 2,343 $ 2,272 $ 2,231 $ 9,111 Gross margin $ 929 $ 975 $ 892 $ 857 $ 3,653 Equity in earnings of affiliated companies $ 94 $ 62 $ 39 $ 104 $ 299 (Provision) benefit for income taxes $ (86) $ (110) $ (6) $ 55 $ (147)Net income attributable to Corning Incorporated $ 407 $ 496 $ 212 $ 224 $ 1,339 Basic earnings per common share $ 0.30 $ 0.38 $ 0.16 $ 0.17 $ 1.02 Diluted earnings per common share $ 0.29 $ 0.36 $ 0.15 $ 0.17 $ 1.00
2014 First quarter Second quarter Third quarter Fourth quarter Total yearNet sales $ 2,289 $ 2,482 $ 2,540 $ 2,404 $ 9,715Gross margin $ 935 $ 1,032 $ 1,089 $ 996 $ 4,052Restructuring, impairment and other charges $ 17 $ 34 $ 20 $ 71Equity in earnings of affiliated companies $ 86 $ 62 $ 95 $ 23 $ 266Provision for income taxes $ (180) $ (172) $ (395) $ (349) $ (1,096)Net income attributable to Corning Incorporated $ 301 $ 169 $ 1,014 $ 988 $ 2,472Basic earnings per common share $ 0.21 $ 0.11 $ 0.77 $ 0.76 $ 1.82Diluted earnings per common share $ 0.20 $ 0.11 $ 0.72 $ 0.70 $ 1.73

This page intentionally left blank.

This page intentionally left blank.

This page intentionally left blank.

Annual Meeting
The annual meeting of shareholders will be held on Thursday, April 28, 2016, in Corning, New York. A formal notice of the meeting and a proxy statement will be mailed to shareholders on or about March 15, 2016. The proxy statement can also be accessed electronically through the Investor Relations page of the Corning website at www.corning.com and at www.corning.com/2016-proxy. A summary report of the proceedings at the annual meeting will be available without charge upon written request to Corporate Secretary, Corning Incorporated, One Riverfront Plaza, Corning, NY 14831.
Additional Information
A copy of Corning’s 2015 Annual Report on Form 10-K filed with the Securities and Exchange Commission (SEC) is available without charge to shareholders upon written request to Corporate Secretary, Corning Incorporated, One Riverfront Plaza, Corning, NY 14831. The annual report, proxy statement, Form 10-K, and other information can also be accessed electronically through the Investor Relations page of the Corning website at www.corning.com.
Investor Information
Investment analysts and investors who need additional information may contact Investor Relations, Corning Incorporated, One Riverfront Plaza, Corning, NY 14831. Telephone: 607.974.9000.
Common Stock
Corning Incorporated common stock is listed on the New York Stock Exchange (NYSE). In addition, it is traded on the Boston, Midwest, Pacific, and Philadelphia stock exchanges. Common stock options are traded on the Chicago Board Options Exchange. The ticker symbol for Corning Incorporated is “GLW.”
Transfer Agent & Registrar
Computershare Trust Company P.O. Box 30170, College Station, TX 77842-3170 Telephone: 800.255.0461 Website: www.computershare.com/contactus
Independent Auditors
PricewaterhouseCoopers LLP 300 Madison Ave., New York, NY 10017
Executive Certifications
Corning submitted its 2015 Annual CEO Certification to the NYSE in compliance with NYSE corporate governance listing standards, and filed with the SEC its Sarbanes Oxley Act 302 Certifications as exhibits to its most recent Form 10-K.
Trademarks
A number of Corning trademarks appear throughout this annual report. For a complete listing of Corning’s registered trademarks, visit: www.corning.com/worldwide/en/legal-notices.html
Corning is an equal opportunity employer.
Printed in the USA
“Safe Harbor” Statement Under the Private Securities Litigation Reform Act of 1995
The statements in this Annual Report that are not historical facts or information are forward-looking statements. These forward-looking statements involve risks and uncertainties that may cause the outcome to be materially different. Such risks and uncertainties include, but are not limited to:
- global business, financial, economic and political conditions;- tariffs and import duties;- currency fluctuations between the U.S. dollar and other currencies, primarily the Japanese yen, New Taiwan dollar, euro, Chinese renminbi and Korean won;- product demand and industry capacity;- competitive products and pricing;- availability and costs of critical components and materials;- new product development and commercialization;- order activity and demand from major customers;- fluctuations in capital spending by customers;- possible disruption in commercial activities due to terrorist activity, cyber-attack, armed conflict, political or financial instability, natural disasters, or major health concerns;- unanticipated disruption to equipment, facilities, or operations;- facility expansions and new plant start-up costs;- effect of regulatory and legal developments;- ability to pace capital spending to anticipated levels of customer demand;- credit rating and ability to obtain financing and capital on commercially reasonable terms;- adequacy and availability of insurance;- financial risk management;- acquisition and divestiture activities;- rate of technology change;- level of excess or obsolete inventory;- ability to enforce patents and protect intellectual property and trade secrets;- adverse litigation;- product and components performance issues;- retention of key personnel;- stock price fluctuations;- trends for the continued growth of the Company’s businesses;- the ability of research and development projects to produce
revenues in future periods;- a downturn in demand or decline in growth rates for LCD glass substrates;- customer ability, most notably in the Display Technologies segment, to maintain profitable operations and obtain financing to fund their ongoing operations and manufacturing expansions and pay their receivables when due;- loss of significant customers;- fluctuations in supply chain inventory levels;- equity company activities, principally at Dow Corning;- changes in tax laws and regulations;- changes in accounting rules and standards;- the potential impact of legislation, government regulations,
and other government action and investigations;- temporary idling of capacity or delaying expansion;- the ability to implement productivity, consolidation and cost reduction efforts, and to realize anticipated benefits;- restructuring actions and charges; and- other risks detailed in Corning’s SEC filings.
Neither this report nor any statement contained herein isfurnished in connection with any offering of securities or for the purpose of promoting or influencing the sale of securities.

Board of Directors
Donald W. Blair Retired Executive Vice President & Chief Financial Officer NIKE, Inc. Beaverton, OR(1) (4)Stephanie A. BurnsRetired Chairman& Chief Executive OfficerDow Corning CorporationSunset, SC(3)John A. Canning, Jr.Co-Founder & Chairman Madison Dearborn Partners, LLC Chicago, IL(4) (5) (6)Richard T. ClarkRetired Chairman, President& Chief Executive OfficerMerck & Co., Inc.Whitehouse Station, NJ(2) (5) (6)Robert F. Cummings, Jr.Retired Vice Chairmanof Investment BankingJPMorgan Chase & Co.New York, NY(4) (5) (6)Deborah A. HenrettaRetired Group President E-Business Procter & Gamble Cincinnati, OH(1) (3)Daniel P. HuttenlocherDean and Vice ProvostCornell University New York City Tech CampusNew York, NY(1) (4)Kurt M. LandgrafRetired President& Chief Executive OfficerEducational Testing ServicePrinceton, NJ(1) (2) (6)Kevin J. MartinVice PresidentFacebook, Inc.Washington, DC(3) (5)Deborah D. Rieman Executive Chairman MetaMarkets Group Woodside, CA(1) (2)Hansel E. Tookes IIRetired Chairman& Chief Executive OfficerRaytheon Aircraft CompanyPalm Beach Gardens, FL(2) (5) (6)
Wendell P. Weeks Chairman of the Board, Chief Executive Officer& PresidentCorning IncorporatedCorning, NY(6)Mark S. WrightonChancellor& Professor of ChemistryWashington University in St. LouisSt. Louis, MO(1) (4)
OfficersManagement Committee
James P. ClappinPresident —Corning Glass TechnologiesMartin J. CurranExecutive Vice President& Innovation OfficerJeffrey W. EvensonSenior Vice President& Chief Strategy OfficerLisa FerreroSenior Vice President& Chief Administrative OfficerClark S. KinlinExecutive Vice President —Corning Optical CommunicationsLawrence D. McRae Vice Chairman & Corporate Development OfficerDavid L. MorseExecutive Vice President & Chief Technology OfficerEric S. MusserExecutive Vice President — Corning Technologies & InternationalChristine M. Pambianchi Senior Vice President — Human ResourcesLewis A. SteversonSenior Vice President& General CounselR. Tony TripenySenior Vice President& Chief Financial OfficerWendell P. WeeksChairman of the Board,Chief Executive Officer& President
Other Officers
Thomas AppeltPresident — Corning International Emerging Markets
John R. IgelVice President& General Manager — Corning Optical Communications Linda E. JollyVice President & Corporate SecretaryWilfred M. Kenan, Jr.Vice President& Manufacturing Manager —Environmental TechnologiesJudith A. Lemke Vice President — TaxJohn P. MacMahon Senior Vice President — Global Compensation & BenefitsStephen P. MillerVice President — StrategyCorning Optical Communications & Corporate DevelopmentAvery H. Nelson IIIVice President & General Manager — Environmental TechnologiesTimothy J. ReganSenior Vice President — Worldwide Government AffairsMark S. RogusSenior Vice President& Treasurer Edward A. SchlesingerVice President& Corporate ControllerJohn M. SharkeyVice President& Chief of Staff to the CEOJames R. SteinerSenior Vice President& General Manager —Specialty MaterialsRonald L. VerkleerenVice President& General Manager —Corning Pharmaceutical TechnologiesLydia Kenton WalshVice President — Commercial Operations Life Sciences Curt WeinsteinVice President& General Manager —Advanced OpticsMariam O. Wright Senior Vice President — Global Manufacturing & QualityJohn Z. Zhang General Manager — Corning Display Technologies
Madapusi K. BadrinarayanVice President& Technology Executive —Science & TechnologyJohn P. Bayne, Jr.Vice President& General Manager —High Performance DisplaysThomas R. BeallVice President & Chief Intellectual Property Counsel Stefan Becker Vice President & Operations ControllerMichael A. BellSenior Vice President& General Manager,Optical Connectivity —Corning Optical CommunicationsGary S. Calabrese Senior Vice President — Global ResearchThomas G. CapekVice President& Chief Engineer Cheryl C. CappsVice President —Global Supply ManagementMark S. ClarkVice President& Chief Information OfficerJack H. ClelandSenior Vice President& Deputy General CounselCharles R. CraigSenior Vice President — Science & TechnologyMichael W. Donnelly Vice President — Business ServicesRichard M. EglenVice President& General Manager —Life SciencesLi FangPresident& General Manager —Corning Greater ChinaKimberly S. HartwellSenior Vice President& Chief Commercial Officer —Corning Optical CommunicationsClifford L. HundGeneral Manager & President — Corning East AsiaTimothy L. HuntVice President & Director — Corporate Product & Process Development
Board Committees
(1) Audit; (2) Compensation; (3) Corporate Relations; (4) Finance; (5) Nominating & Corporate Governance; (6) Executive © Corning Incorporated 2016. All Rights Reserved.
Corning is one of the world’s leading innovators in materials science. For more than 160 years, Corning has applied its unparalleled expertise in specialty glass, ceramics, and optical physics to develop products that have created new industries and transformed people’s lives.
296423_Corning_CVR.indd 2 2/22/16 9:25 PM

Corning IncorporatedOne Riverfront PlazaCorning, NY 14831-0001
U.S.A.
www.corning.com
02AR40015EN
© 2016 Corning Incorporated. All Rights Reserved.