Millward Brown Optimor - BRANDZ Top 100 Brand Ranking Report
Upload
saralavaqueraCategory
view
219download
0
8/6/2019 Corebrand Brand Power Ranking
http://slidepdf.com/reader/full/corebrand-brand-power-ranking 1/8
Measuring
the size
and qualityof corporate
brands
8/6/2019 Corebrand Brand Power Ranking
http://slidepdf.com/reader/full/corebrand-brand-power-ranking 2/8
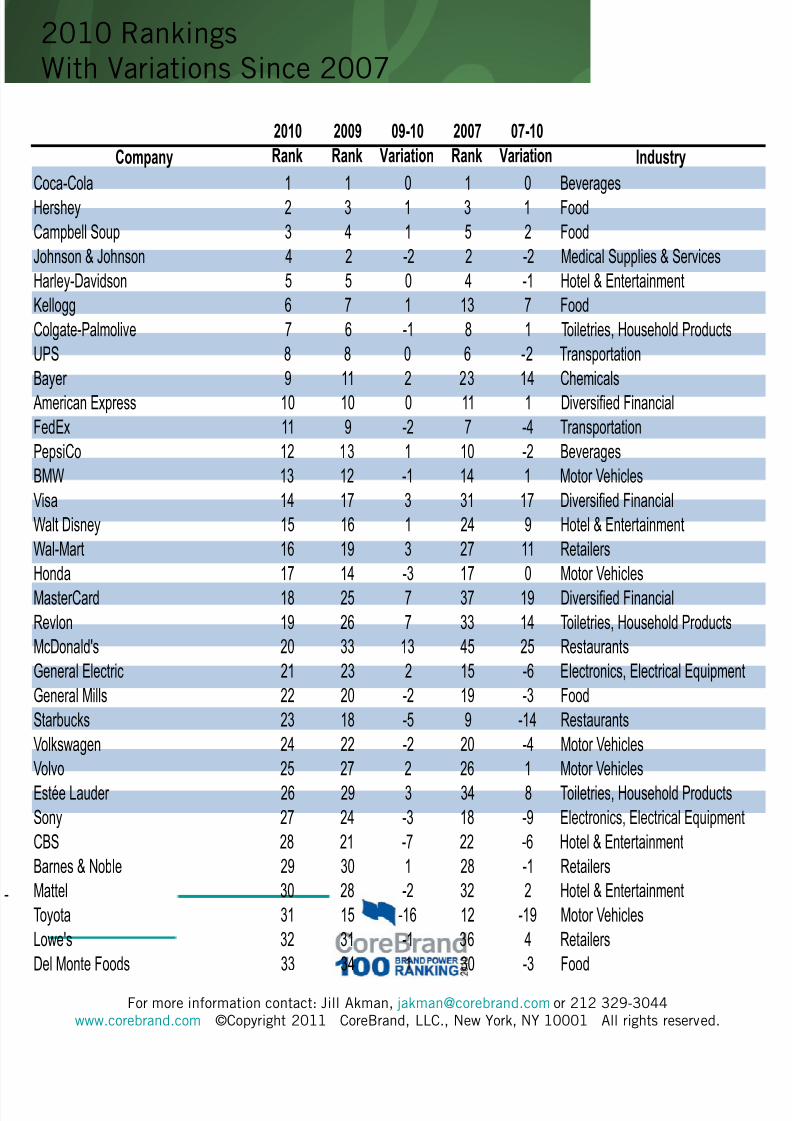
2010 RankingsWith Variations Since 2007
Company
2010
Rank
2009
Rank
09-10
Variation
2007
Rank
07-10
Variation Industry
Coca-Cola 1 1 0 1 0 Beverages
Hershey 2 3 1 3 1 Food
Campbell Soup 3 4 1 5 2 Food
Johnson & Johnson 4 2 -2 2 -2 Medical Supplies & Services
Harley-Davidson 5 5 0 4 -1 Hotel & Entertainment
Kellogg 6 7 1 13 7 Food
Colgate-Palmolive 7 6 -1 8 1 Toiletries, Household Products
UPS 8 8 0 6 -2 Transportation
Bayer 9 11 2 23 14 Chemicals
American Express 10 10 0 11 1 Diversified Financial
FedEx 11 9 -2 7 -4 Transportation
PepsiCo 12 13 1 10 -2 Beverages
BMW 13 12 -1 14 1 Motor Vehicles
Visa 14 17 3 31 17 Diversified Financial
Walt Disney 15 16 1 24 9 Hotel & Entertainment
Wal-Mart 16 19 3 27 11 Retailers
Honda 17 14 -3 17 0 Motor Vehicles
MasterCard 18 25 7 37 19 Diversified Financial
Revlon 19 26 7 33 14 Toiletries, Household Products
McDonald's 20 33 13 45 25 Restaurants
General Electric 21 23 2 15 -6 Electronics, Electrical Equipment
General Mills 22 20 -2 19 -3 Food
Starbucks 23 18 -5 9 -14 Restaurants
Volkswagen 24 22 -2 20 -4 Motor Vehicles
Volvo 25 27 2 26 1 Motor Vehicles
Estée Lauder 26 29 3 34 8 Toiletries, Household Products
Sony 27 24 -3 18 -9 Electronics, Electrical Equipment
CBS 28 21 -7 22 -6 Hotel & Entertainment
Barnes & Noble 29 30 1 28 -1 Retailers
Mattel 30 28 -2 32 2 Hotel & Entertainment
Toyota 31 15 -16 12 -19 Motor Vehicles
Lowe's 32 31 -1 36 4 Retailers
Del Monte Foods 33 34 1 30 -3 Food
For more information contact: Jill Akman, [email protected] or 212 329-3044www.corebrand.com ©Copyright 2011 CoreBrand, LLC., New York, NY 10001 All rights reserved.

8/6/2019 Corebrand Brand Power Ranking
http://slidepdf.com/reader/full/corebrand-brand-power-ranking 3/8

8/6/2019 Corebrand Brand Power Ranking
http://slidepdf.com/reader/full/corebrand-brand-power-ranking 4/8
2010 RankingsWith Variations Since 2007
For more information contact: Jill Akman, [email protected] or 212 329-3044www.corebrand.com ©Copyright 2011 CoreBrand, LLC., New York, NY 10001 All rights reserved.
Company
2010
Rank
2009
Rank
09-10
Variation
2007
Rank
07-10
Variation Industry
Liz Claiborne 67 72 5 85 18 Apparel, Shoes
ChevronTexaco 68 70 2 89 21 Petroleum Refining
Royal Dutch Shell 69 74 5 91 22 Petroleum Refining
Fuji Photo Film 70 78 8 82 12 Electronics, Electrical Equipment
Sharp 71 75 4 100 29 Electronics, Electrical Equipment
Goodyear Tire & Rubber 72 68 -4 73 1 Rubber & Plastics
Google 73 96 23 135 62 Internet
Walgreen 74 82 8 83 9 Pharmacy Serv.
J.C. Penney 75 84 9 92 17 Retailers
Sherwin-Williams 76 83 7 80 4 ChemicalsXerox 77 53 -24 39 -38 Office Equipment
General Motors 78 64 -14 21 -57 Motor Vehicles
Kohl's 79 86 7 95 16 Retailers
DuPont 80 79 -1 79 -1 Chemicals
Michelin 81 73 -8 47 -34 Rubber & Plastics
Saab 82 76 -6 66 -16 Aerospace
Charles Schwab 83 71 -12 44 -39 Brokerage
Allstate 84 89 5 105 21 InsuranceLa-Z-Boy 85 85 0 90 5 Furniture
CVS 86 81 -5 88 2 Pharmacy Serv.
H.J. Heinz 87 77 -10 58 -29 Food
eBay 88 105 17 125 37 Internet
Motorola 89 90 1 72 -17 Semiconductors
Hormel Foods 90 93 3 98 8 Food
Canon 91 80 -11 61 -30 Electronics, Electrical Equipment
Hewlett-Packard 92 98 6 96 4 Computers & Peripherals
Bristol-Myers Squibb 93 91 -2 74 -19 Pharmaceuticals
Bank of America 94 100 6 107 13 Commercial Banks
Loews 95 88 -7 75 -20 Diversified Financial
Morgan Stanley 96 92 -4 59 -37 Brokerage
Rite Aid 97 103 6 117 20 Pharmacy Serv.
Tiffany & Company 98 99 1 94 -4 Retailers
Staples 99 101 2 104 5 Office Equipment
Clorox 100 113 13 122 22 Toiletries, Household Products

8/6/2019 Corebrand Brand Power Ranking
http://slidepdf.com/reader/full/corebrand-brand-power-ranking 5/8
CoreBrand tracks the corporate brands of 800 companies across 49 industries
Corporate Branding Index®
• Each year we conduct 8,000 telephone interviews among business leaders to measure
their perceptions of some of the world’s best corporate brands.
• Respondents are business decision-makers from the top 20% of U.S. businesses.
• This senior business audience (VP level and above) represents the investment
community, potential business partners and business customers across 49 key
industries.
• 400 respondents rate each company per year; 800 companies are measured.
• We collect financial performance data and communications investment information tounderstand the support behind and impact of these brands.
The Brand Power Measurement
• Respondents are first asked to rate their Familiarity with a series of companies.
• Scores are a weighted average of the top three responses.
• Respondents who have a qualified level of Familiarity are then asked to rate their
Favorability of those companies across 3 dimensions.
• Overall Reputation, Perception of Management and Investment Potential attributes
provide insight to the source of favorable/unfavorable impressions.
• Scores are a weighted average of the top three responses to create a measure of
Favorability.
• Familiarity and Favorability data are combined to create Brand Power, a single measure of
the size and quality of a corporate brand.
• This number provides a single measure of the size of a company’s audience and its
disposition towards the company.
The Brand Power Rankings
• The Brand Power rankings are based on the 2010 top-scoring brands.
• The 2009 and 2007 rankings are included for comparison purposes.
For more information contact: Jill Akman, [email protected] or 212 329-3044www.corebrand.com ©Copyright 2011 CoreBrand, LLC., New York, NY 10001 All rights reserved.
Brand PowerRankings Methodology

8/6/2019 Corebrand Brand Power Ranking
http://slidepdf.com/reader/full/corebrand-brand-power-ranking 6/8
6.47.3 7.4 7.1 6.9
6.2 6.0 6.0
5.3
15.0 15.215.8 15.9 16.1 16.4 16.7 16.7
15.9
0
2
4
6
8
10
12
14
16
18
20
2002 2003 2004 2005 2006 2007 2008 2009 2010
CoreBrand 500 (Avg.) CoreBrand 100 (Avg.)
CoreBrand Equity
Percentage of Market Cap
* Highlighted area = historic average
CoreBrand Equity is the % of market capitalization impacted by the corporate brand. This all
important percentage is highly valuable for understanding the health and vitality of your
company’s corporate brand as a dashboard measure. It is also helpful to compare the market
cap of your company to your industry. What is presented in these pages is:
1. Brand equity as a % of market cap for the top companies known as the CoreBrand 100
2. Brand equity as a % of market cap for 500 companies known as the CoreBrand 500
Observations:
The impact of the corporate brand on market cap is at a low point of 5.3% for the average
company in the CoreBrand 500. This means the trend focusing on financial fundamentals
continues to grow in importance. In 2010, the corporate image continues to lessen in
importance.
The CoreBrand 100 saw a decline in Brand Equity marking the largest drop in average brand
equity for this group since the inception of tracking. The CoreBrand 500 is also at its lowest
point since inception of tracking. It’s also the largest drop for the 500, since 2007.
For more information contact: Jill Akman, [email protected] or 212 329-3044www.corebrand.com ©Copyright 2011 CoreBrand, LLC., New York, NY 10001 All rights reserved.

8/6/2019 Corebrand Brand Power Ranking
http://slidepdf.com/reader/full/corebrand-brand-power-ranking 7/8
CoreBrand Equity
$ Values
$ Values are in the billions ex: $1.00 = $1 Billion
$1.5 $2.1
$2.4 $2.4 $2.7 $2.4
$1.6 $2.0$2.2
$7.2
$8.6
$9.6 $9.9
$11.1$10.5
$7.3
$9.0$10.1
$0.0
$2.0
$4.0
$6.0
$8.0
$10.0
$12.0
$14.0
2002 2003 2004 2005 2006 2007 2008 2009 2010
CoreBrand 500 (Avg.) CoreBrand 100 (Avg.)
Conversely, both the CoreBrand 500 and the CoreBrand 100 have seen two years of steady
growth of CoreBrand Equity Value.
This growth of value is significant. The average company in the CoreBrand 100 grew brand
equity value by $1 billion between 2009 to 2010 with the corporate brand in this group is
worth over $10 billion! The average CoreBrand 500 company is worth $2.2 billion. Is it
worth paying attention to your corporate brand?
The best news is that this represents two years of significant growth following two years of
decline. This reflects the the rebound of the economic recovery but also the importance of
financial fundaments to corporate brand value.
For more information contact: Jill Akman, [email protected] or 212 329-3044www.corebrand.com ©Copyright 2011 CoreBrand, LLC., New York, NY 10001 All rights reserved.

8/6/2019 Corebrand Brand Power Ranking
http://slidepdf.com/reader/full/corebrand-brand-power-ranking 8/8
Total Brand Equity
$ Value of All Companies
$837
$1,053
$1,181 $1,197
$1,334
$1,215
$790
$994
$1,105
$653
$825
$931$966
$1,106$1,048
$732
$899
$1,014
$0
$250
$500
$750
$1,000
$1,250
$1,500
2002 2003 2004 2005 2006 2007 2008 2009 2010
CoreBrand 500 (Avg.) CoreBrand 100 (Avg.)
For the past three years, 90% of the 500’s Brand Equity $ value has been comprised of the
top 100 companies. This consolidation of brand equity value at the top is not particularly
healthy.
2010 had 91% of the total dollar value contained within the CoreBrand 100. The other 400
companies shared the remaining $91 billion between themselves.
This also marks the second year of growth, which is replenishing most of the value lost in
2008. It will still take at least two more years of solid growth to reach the peak values we’ve
seen back in 2006.
$ Values are in the billions ex: $1.00 = $1 Billion
For more information contact: Jill Akman, [email protected] or 212 329-3044www.corebrand.com ©Copyright 2011 CoreBrand, LLC., New York, NY 10001 All rights reserved.