core.ac.uk fileThis project is divided into two main sections, that is to produce solid polymer...
69
Transcript of core.ac.uk fileThis project is divided into two main sections, that is to produce solid polymer...


•••
. . .
' ..•.••.••. ,1~'jU~. . " l[Ii1'1
Laporan Akhir Projek PenyelidikanJangka Pendek
Development of Zn-Mn02 Battery usingChitosan-ZnCI2. Gel Polymer Electrolytes
byDr. Ahmad AZ'min MohamadAssoc. Prof. Dr. Azizan A~ziz

ilIlHMIUNIVERSITI SAINS MALAYSIA
LAPO~NAKHIR PROJEK PENYELIDIKAN JANGKA PENDEKFINAL REPORT OF SHORT TERM RESEARCH PROJECTSila kemukakan laporan akhir ini melalui Jawatankuasa Penyelidikan di PusatPengajian dan DekanIPengarah/Ketua Jabatan kepada Pejabat Pelantar Penyelidika
1. Nama Ketua Penyelidik:Name ofResearch Leader
AHMAD AZMIN B.lN MOHAMAD
0 Profesor Madya ~ Dr. o EneikIPuan/CikAssoc. Prof Dr. Mr/Mrs/Ms.
2. Pusat Tanggungjawab (PTJ):School/Department/Unit
School of Materials and Mineral Resources Engineering, Universiti Sains Malaysia, 14300 Nibong Tebal, Penang.
3. Nama Penyelidik Bersama:Name ofCo-Researcher
Prof. Madya Dr. Azizan Aziz "
4. Tajuk Projek: .Title ofProject
Development of Zn-MnOz Battery Using Chitosan-ZnCIz Gel Polymer Electrolytes
5. Ringkasan Peniiaian/Summary ofAssessment: Tidak Boleh Sangat BaikMeneukupi Diterima Very GoodInadequate Acceptable
. 1 2 3 4 5
Ii) Peneapaian objektif projek: D D D D 0Achievement ofproject objectives
.~
ii) Kualiti output: D D D D 0Quality ofoutputs
iii) Kualiti impak: D D D D 0Quality ofimpacts
iv) Pemindahan teknologi/potensi pengkomersialan:\ D D 0' D D
Technology transfer/commercialization potential ,
v) Kualiti dan usahasama : D D D 0' DQuality and intensity ofcollaboration
vi) Penilaian kepentingan seeara keseluruhan: D D D D 0Overall assessment ofbenefits

Laporan Akhir Projek Penyelidikan Jangka PendekFinal Report OJShort Term Research Project
6. Abstrak Penyelidikan(Perlu disediakan di antara 100 - 200 perkataan di dalam Bahasa Malaysia dan juga Bahasa Inggeris.Abstrak ini akan dimuatkan dalam Laporan Tahunan Bahagian Penyelidikan & Inovasi sebagai satu carauntuk menyampaikan dapatan projek tuanlpuan kepada pihak Universiti & masyarakat luar).
Abstract ofResearch(An abstract ofbetween 100 and 200 words must be prepared in Bahasa Malaysia and in English).This abstract will be included in the Annual Report ofthe Research and Innovation Section at a later date as a meansofpresenting the projectfindings ofthe researcherls to the University and the community at large)
ABSTRACTThis project is divided into two main sections, that is to produce solid polymer electrolyte (SPE) as a proton conductor(H+) and to fabricate polymeric solid-state protonic battery with configuration of zinc (Zn)/SPE/manganese (IV) oxide(Mn02)' 1.0 g of chitosan was dissolved in 100 ml of 1 % acetic acid solution. The ammonium nitrate salt (NH4N03)
and plasticizer, ethylene carbonate (EC), were added accordingly. After casting the solution was left to dry at roomtemperature to form the films of pure chitosan acetate (CA), CA-NH4N03, and CA-NH4N03-EC. The temperaturedependence of chitosan-based SPE system was found to obey Arrhenius relationship. The highest conducting sample(3.48 x 10.3 Scm-I), 18 wt. % CA-12 wt. % NH4N03-70 wt. % EC (CA40N70E), possesses the lowest activationenergy (Ea) of 0.10988 eV. The electrochemical stability window for the cells was around 1.6 V - 1.8 V, that was thechitosan films breakdown voltage and become lower as temperatures increases. The cells were fabricated using SPE,which showed the highest value of conductivity, and characterized according to their electrochemical testing at 298,313, 333, and 353 K. The cells performance was excellent at 333 K, with achievement of discharge capacity of 42.7mAh, internal resistance (r) of 16.8 n, maximum power density (Pmax) of 14.6 mW cm-2 and a short-circuit currentdensity (J,c) of 31.0 mA cm-2. The highest open cifeuit voltage (OCV) was 1.479 V at 298 K. On the other hand, theelectrochemical properties of the cells at 353 K were decreased compared to the cells at 333 K. The decrease in theelectrochemical properties was correlated to the failure of the cells. Thus, the best electrochemical properties of thecells from this system were observed at temperature 333 K.
ABSTRAKProjek ini dibahagikan kepada dua bahagian utama iaitu penghasilan elektrolit polimer pepejal (SPE) sebagaikonduktor proton (H+) dan fabrikasi bateri proton keadaan pepejalpolimer dengan konfigurasi zink (Zn)/SPE/mangandioksida (Mn02)' 1.0 g kitosan dilarutkan dalam 100 mllarutan asid asetik 1 %. Garam ammonium nitrat (NH4N03)
dan bahan pemplastik etilena karbonat (EC) ditarnbahkan ke dalam larutan kitosan tersebut. Selepas penuanganlarutan, ia dibiarkan kering pada subu 'bilik untuk membentuk filem kitosan asetat (CA) tulen, CA-NH4N03 dan CANH4N03-EC. Kajian konduktiv,i-suhu bagi sistem SPE berasaskan kitosan didapati mematuhi persamaan 'Arrhenius'.Sampel dengan konduktiviti tertinggi (3.48 x to-3 S em-I), 18 wt. % CA-12 wt. % NH4N03-70 wt. % Ee (CA40N70E),mempunyai tenaga pengaktifan (E.J yang terendah, 0.to988 eV. Kestabilan elektrokimia untuk bateri proton adalahkira-kira 1.6 V - 1.8 V, sebagai voltan peeah tebat filem kitosan dan berkurangan apabila 'suhu meningkat. Seldifabrikasi dengan SPE yang mempunyai nilai konduktiviti tertinggi dan peeirian sel berdasarkan kajian elektrokimiapada subu 298, 313, 333 dan 353 K dijalankan. Prestasi sel yang terbaik adalah pada suhu 333 K, dengan kapastidiseas, rintangan dalaman (r), ketumpatan kuasa tertinggi (Pmax) dan ketumpatan arus litar pintas (J,c) masing-rnasingsebanyak 42.7 mAh, 16.8 n, 14.6 rnW ern-2dan 31.0 rnA em-2. Voltan litar terbuka (OCV) tertinggi adalah 1.479 Vpada suhu 298 K. Selain itu, perlakuan elektrokimia bagi sel pada suhu 353 K menurun berbanding dengan sel padasuhu 333 K. lni adalah berhubung kait dengan kegagalan sel tersebut. Justeru itu, perlakuan elektrokimia terbaik bagisel-sel daripada sistem ini adalah diperhatikan padltsuhu 333 K.
2

Laporan Akhir Projek Penyelidikan Jangka PendekFinal Report OfShort Term Research Project
7. Sila sediakan laporan teknikallengkap yang menerangkan keseluruhan projek ini.[Sila gunakan kertas berasingan)
Applicant are required to prepare a Comprehensive Technical Report explaning the project.(This report must be appended separately)
Senaraikan kata kunci yang mencerminkan penyelidikan anda:List the key words that reflects your research:
- Please see attachment
8.
Bahasa Malaysia
Kitosan, Ammonia Nitrat, Etilina Karbonat, elektrolitpolimer, bateri proton
Output dan Faedah ProjekOutput and Benefits ofProject
Ballasa Inggeris
Chitosan; ammonium nitrate; ethylen~ carbonate; polymerelectrolyte; protonic battery.
(a)
*Penerbitan JurnalPublication ofJournals
(Sila nyatakan jenis, tajuk, pengarang/editor, tahun terbitan dan di mana telah diterbitldiserahkan)(State type, title, author/editor, publication year and where it has been published/submitted)
i. L.S. Ng and A.A. Mohamad, Proton Battery b.ased on Plasticized Chitosan-NH4N03
Solid Polymer Electrolyte,Journal ofPower Sources 163 (2006) 382-385. (IF = 3.521).*
ii. L.s. Ng and A.A. Mohamad, Proton battery based on plasticized chitosan-NH4N03
solid polymer electrolyte atelevated temperatures, submitted to Journal ofPower Sources, 2007.
*Awarded Sanggar Sanjung Award (Publication Category) 2006 by USM.
(b) Faedah-faedah lain seperti perkembangan produk, pengkomersialan produklpendaftaran patenatau impak kepada dasar dan masyarakat.
State other benefits such as product development, product commercialisation/patent registration or impact on source an
i. Alternative to the expensive lithium-based battery.ii. Expand the uses ofour own J;:ountry chitosan sources.
iii. Contribution to knowledge.lt is envisage that the results spur from this research will be beneficial to othersresearching in this emerging field ofadvanced materials.
• Sila berikan salinan/Kindry provide copies
(c) Latihan Sumber ManusiaTraining in Human Resources
i) Pelajar Sarjana:Graduates Students(Perincikan nama, ijazah dan status)(Provide names, degrees and status)
I,
Mater o(Science, M. Sc,
I. Ng Li Sian, "Proton battery based on plasticized chitosan-NH-tN03 solid polymer electrolyte at highertemperatures", 2006/07 (Supervisors: Dr. Ahmad Azmin Mohamad)
3

Laporan Akhir Projek Penyelidikan Jangka PendekFinal Report OfShort Term Research Project
ii) Lain-lain:Others
Undergraduate Final Year Project. B. Eng. (Hons!
i. Fatiah Noor Tahiran, "Plasticizedpolyethylene oxide polymer electrolyte/or Zn-Mn02 Battery", 2005/06.ii. Lee Yee Wah, "Zinc-carbon based on hydroponics gel polymer electrolyte", 2005/06.iii. NgLi Sian, "Proton battery based onplasticizedchit()san-NH~OJsolidpolymer electrolyte", 2005/06.iv. Nurfaezah Khamis, "Zn-air battery based on hydroponics gelpolymer electrolyte", 2005/06.v. Sahlina Mat Nor, "Zinc-air battery based on polyacrylamide polymer electrolyte", 2005/06.vi. Yap Soo Chin, "Proton battery based on hydroponics gelpolymer electrolyte", 2005/06
9. Peralatan yang Telah Dibeli:Equipment that has been purchased
-None-
!eP- r -°1--Tarikh
Date
i,
4

Laporan Akhir Projek Penyelidikan Jangka PendekFinal Report a/Short Term Research Project
Komen Jawatankuasa Penyelidikan Pusat PengajianfPusatComments by the Research Committees ofSchools/Centres
ProJ~~ (;.;., ./J~ .lr~"'-' ~ WIN~ 'oer<AIw d..'~~ <l~CJ<~ -fvw11>~ R ~'+e~~\
~ ~ {u-v-"- ..\-ttNv ~<Yi1. J.'~~-l-~ ~~~
.k'..\4.-I;.L~ ~ttr~ CO POLJ.tH So..wug
.
I
~
II'""' n~
,
l~-;l°-q..·,
TA~ Irt'ANGAN PENGERUSIJAWA NKUASA PENYELIDlKAN Tarikh
PUSAT PENGAJIANfPUSAT DateSignature ofChairman
[Research Committee ofSchool/Centre]
5

FINACIAL:
Please see Penyata Kumpulan Wang
Balance RM 887.72 already used to buy research materials. Please see the latest quotationIPO(RM885.00)
b •• ,
DEVELOPM.ENT OF Zn·Mn02 BATTERY USING CHITOSAN-ZnCI2 GEl. POLYMER 8.6...'lROlYTES..
OB.A/:IMAD AZMINMQtW~
304.PBAHAN.6035149
JUM.AH GERAN :-
NO PROJEK :.
PANEL .~ JIPENDEIS
PENAJA.~ JAliGKA PENDEK
. JABATAN BEN~,RIUNIT KUMPUlAN V\lIl.NG AMANAH
UNIVERSITI SAINS MALAYSIAKMIPUS KEJl,JRUTERMN
SERf AMPANGANPEWAT" 1aJMJ>\.A..AN WANG
TEMPOH BERAKHm 3f/0512007 Tempoh Pn~elc:01KJ6I2oo5- 3Ml512OCo7
:::J~~: GAJI KAKn'AllGAN AWAY
::::21000: PERB.Et.A1WIAlI PERJPJ.ANAN DAN SARAHI
::::~: PERHUBUHGAN DAN UTJUTI
::::~: BAHAN MENTAH & BAHAN UNlUK PENYElE
::::~!:~: BEKAlAN DAN AlAT PAkAl HABIS
:::;~: PERKHIDIMTAlIIKTISAS & HOSPfTAlm
Jumlah Besar
PerbeJanjaan Tanggungan Perbelanjaan Jum/ah JumJah Bal<i PeruntukanPerun/ukan sehingga semasa Semasa Perbefanjaan Perbelanja.3n Semasa31/12/2006 2007 2007 2007 Terkumpul 2007(a) (b) (e) (d) (e+d) (b+r:td) (a-(b+e+d)
2,140.05 0.00 0.00 0.00 0.00 0.00 2,140.052,000.00 15.'5.00 0.00 0.00 0.00 155.00 1,845.00300.00 2'-3.30 0.00 0.00 0.00 2'-3.30 270.709,073.95 0.00 0.00 0.00 0.00 0.00 9,073.952,140.00 1;!.452.72 1:40.22 1,300.54 1,940.76 15,393.48 (13,253.48)2,000.00 1,093.00 0.00 95.50 95.50 1,188.50 811.5017,6f04.oA 14,730.02 640.22 1,396.04 2,036.26 __1~ 887.7217,654.00 14,730.02 640.22 1,396.04 2,036.26 16,7E16.28 887.72
I~
•,

• IUb9MI ~~8~;~~1~~ ~~I:n~,~a~:S~a~'=UN='V-'-R:"'S'T--'-=S""AI-NS--"':-:-:AU,-:-:-YS='A Tel; 6533888 KawaI "UNISAINS"
BORANG PESANAN/PURCHASE ORDER
KepedalTo
·.t~~j. ~.~I...¥r) ~: ..1'10: '15, 4.~ ,".1)1"'0; ' .
·..r:f'~ ':' ~.. t<)~rfl·.1 .·.. ·~t)00i ..D.!.!":,, .
·...'.~~~ ·~·11:0'·0'·~~ ~. ': .~\~.~ .r 0~~:o .
USM
TARIKH I DATE
N~ 190662/0
Si18 bek.lk.n ber....·bar.ne/I.sa......n kerj. Y."9 te...but di baw.h k.p-.l. k.mi del\98n harp leperti terc.tit.
Pl.... supply goods/carry out works as st.ted below to us at th'e price stated,
Prof. MadyCl Dr..hairun ...zlzll.lt. MoI'od. I,zi/JiC,eka',f'. P. Kejuruteraan Bahan & SumbEr I'i!neralK;,mpus Kejuruteraan .Unl"ersiti Sains Malaysia ... ,
BAHAf. 81 SUHBER MINERALTo: KAMPUS ·KEJIW,un;RMN .
UNIVERSm SAINS MALAYSIA.... - ·SERI· AHPANGAN· ·.. ·· .
14300 NIBONG TEBAlCode: &iBilt4NG.PERAlSELATAN .
P.O. USM ~u PI11J'b 662 / 0GEORGETOWN/PENANGMALAYSIA
INSTRUCTIONS TO SUPPLIER
1. Please return Qriginal Ibluel/copy of order with the invoice of the goods supplied.2. All ,nvoices and corresponcl8nce relating to this order should be addressed 10 the Head of
Department/Sc:hool concerned.3. The Order No. must be quoted in all correspondence and invoice.4. All shipping documents/bill of lading should be sent in -.lvance by air mail to facilitiate cunoms clearance.5. The following shipping marks should appear on every p.rcel:-
8il. K.t.r.I\98n 8.ra"9·8.ra"9Ma.. H.rp/Pric.
Pe"9hantara. BenyakSa~:r rJ~nit/ J~~~~~/hem Description Delivery Quantity
DMe R ; R ;
t'f\etn~ J~n \VI"n& 'A h, k-t.1>. p~.k.~. llx~flh 1:::. "bt;1Y)b.ev I\1tn.e-v..,JJ :) lJ
\J f
\. T("w' VJr-->te \VI P\..I Xh 1'1> 4-01- /1;)£5 m\ \x\P4d Ig.~ CJD ,aa- an
l.\;ket<.- ~ 3-". I J I f J
.p, ~tJ.J t, ~~.ev O:l-~~\C
J
~. -j\)~I £.,..\t. ()..2.g So ~\.~~ \\ii .\v\~ \ole \ x. \ 'P'-' :;)..5::' DV ~.s.:l- l!O
-;j~~ (0.0\ - \o~M) J JlJ I
~- I<tLj-\an ~ (?If'£; ) ~ 3·!;" ,~~ +sc 6V 'f...5c~~ J I I I
I
<~
Ak."n dikanakan \J C ~~ - k ", c.e3S14-1 ~e~ nJ..~A. Jumlah ~%S 00Account ch.rgeable ........ ,................ ,..................................... ,..............................~ .. ,.... ,... .. Total~
. ARAHAN KEPADA PEMBEKAl
1. Sila kembalikan salinan .lal lbirul borang polanan ini bersama dengan imbois barang-barang yang dibekal.2. Semu. imbois dan surat menyurat berkaitan dengan pesenan ini hendllklah dialamatken kepada
Ketua Jabetan/Pusat Pengajian berken.an.3. Numbor pesanan ini hendaklah dicatitkan di dalam semua surat manyurat dan imbois.4. Semu. dokumen porkapalan/bill of lading hendaklah dikiri"\kan lebih .a~wa~1.:.:ma~la~lu~i...:u~d~a~r~.~u~n~tu~k~ --,
mamudahkan polepasan Kastam. ,-5. Tanda perkapalan berikul mastilah ditulis disetiap bungkusan:· THE INVOICE I\'1 U ST BE
ACCOMPANIED BY THIS· COPY
ELSEVIER
Available online at www.sciencedirect.com
ScienceDirect
Journal of Power Sources 163 (2006) 382-385
Short communication
JeUMAlOI
POWERIOURelS
www.elsevier.com/locate/jpowsour
Abstract
Protonic battery based on a plasticized chitosan-NH4N03solid polymer electrolyte
L.S. Ng, A.A. Mohamad *School oIMaterials and Mineml Resources Engineering. Universiti Sains Malaysia. 14300 Nibong Tebal. PelUlIlg. Malaysia
Received 9 June 2006; received in revised form 3 August 2006; accepted 14 September 2006Available online 7 November 2006
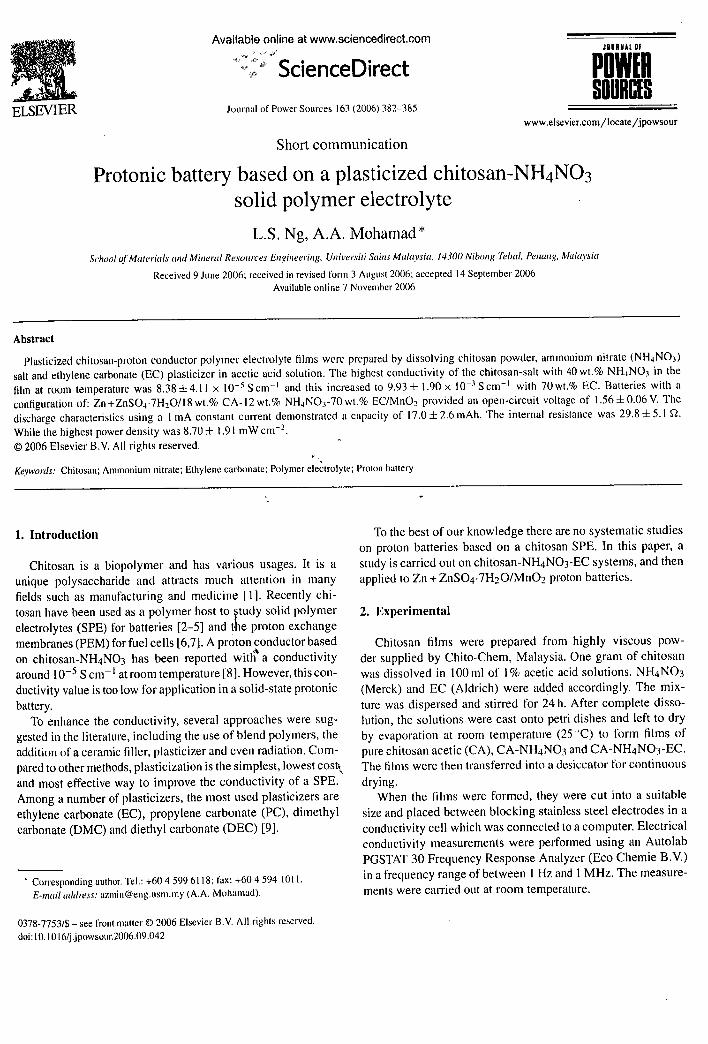
Plasticized chitosan-proton conductor polymer electrolyte films were prepared by dissolving chitosan powder. ammonium nitrate (NH 4 NOJ)salt and ethylene carbonate (EC) plasticizer in acetic acid solution. The highest conductivity of the chitosan-salt with 40 wI. % NH4NOJ in thefilm at room temperature was 8.38±4.11 x 10-' Scm-I and this increased to 9.93± 1.90 x IO-JScm-1 with 70wt.% EC. Baueries with aconfiguration of: Zn +ZnS04·7H20/18 wt.% CA-12 wt.% NH4 NOJ -70 wt.% EC/Mn02 provided an open-circuit voltage of 1.56 ± 0.06 V. Thedischarge characteristics using a I mA constant cunent demonstrated a capacity of 17.0 ± 2.6 mAh. The internal resistance was 29.8 ± 5.1 Q.
While the highest power density was 8.70 ± 1.91 mW cm-2.© 2006 Elsevier B.Y. All rights reserved,
Keywords: Chitosan; Ammonium nitrate; Ethylene carbonate; Polymer ele~trolyte; Proton battery
1. Introduction
Chitosan is a biopolymer and has various usages. It is aunique polysaccharide and attracts much attention in manyfields such as manufacturing and medicine [I]. Recently chitosan have been used as a polymer host to study solid polymerelectrolytes (SPE) for batteries [2-5] and t.he proton exchangemembranes (PEM) for fuel cells [6,7]. A proton conductor basedon chitosan-NH4N03 has been reported witB\ a conductivityaround 10-5 Scm-I at room temperature [8]. However, this conductivity value is too low for application in a solid-state protonicbattery.
To enhance the conductivity, several approaches were suggested in the literature, including the use of blend polymers, theaddition of a ceramic filler, plasticizer and even radiation. Compared to other methods, plasticization is the simplest, lowest cost\and most effective way to improve the conductivity of a SPE.Among a number of plasticizers, the most used plasticizers areethylene carbonate (EC), propylene carbonate (PC), dimethylcarbonate (DMC) and diethyl carbonate (DEC) [9].
• COITesponding author. Tel.: +6045996118; fax: +604594 1011.E-mail address:[email protected] (A.A. Mohamad).
0378-7753/$ - see front matter © 2006 Elsevier B, V. All rights reserved.
doi: 10.10 16fi.jpowsour,2006.09.042
To the best of our knowledge there are no systematic studieson proton batteries based on a chitosan SPE. In this paper, astudy is carried out on chitosan-NH4N03-EC systems, and thenapplied to Zn + ZnS04·7HzO/MnOz proton batteries.
2. Experimental
Chitosan films were prepared from highly viscous powder supplied by Chito-Chem, Malaysia. One gram of chitosanwas dissolved in 100 ml of I% acetic acid solutions. NH4N03(Merck) and EC (Aldrich) were added accordingly. The mixture was dispersed and stirred for 24 h. After complete dissolution, the solutions were cast onto petri dishes and left to dryby evaporation at room temperature (25 "C) to form films ofpure chitosan acetic (CA), CA-NH4N03 and CA-NH4N03-EC.The films were then transferred into a desiccator for continuous
drying.When the films were formed, they were cut into a suitable
size and placed between blocking stainless steel electrodes in aconductivity cell which was connected to a computer. Electricalconductivity measurements were performed using an AutolabPGSTAT 30 Frequency Response Analyzer (Eco Chemie B.Y.)in a frequency range of between I Hz and I MHz. The measurements were carried out at room temperature.

LS. Nil. A.A. Mohamad I JOl/mal of Power Sources 163 (2006) 382-385
10.0 -"/E
80 u
i6.0 ~
II)cCIl
40 0
J20 ....
--.-I·V-o-J.pL
Current Density (rnA cm·2)
20 4.0 60 8.0 100 12.0 14.0 160 18.0t--~-~--'---~-'---'--~-~----t120
0020
1.8
16
14
~CIlell 10II)...."'5 08>
06
04
0.2
0.00.0
2 4 6 8 10 12 14 16 18 20 22 24 26
Time (h)
Fig. 3. Protonic battery open-circuit voltage during 24 h of storage.
384
201.91817161514
~131.2
CIl 1.1ell 1.0~ 090 0.8::- 07
06050.4030.20100
0
3.3. Battery characterizationFig. 5. The plot of I-V and I-P for proton batteries.
• Cell # 1
• Cell # 2
• Cell # 3
The OCY characteristic of the proton batteries at room temperature is shown in Fig. 3. There seems to be a voltage delay atthe time of assembly when the voltage was observed higher inthe lirst 2 h and later stabilized at ~ 1.56 V. The OCY remain~d
constant at 1.56 ± 0.06 Y until the 24th hour of storage.Fig. 4 shows the discharge characteristic of three batteries at .
a constant current of I mAo It can be observed that the voltageof the batteries drop immediately before reaching a flat discharge plateau at 1.30 ± 0.04 v. This phenomenoll may be dueto the activation polarization. The activation polarization was.present when the rate of an electrochemical reaction at an electrode surface was controlled by sluggish electrode kinetics [12].It also shows that the discharge was sustained for 17.0 ± 2.6 huntil the cut-off voltage of 1.00 V. The discharge capacity was17.0 ± 2.6 mAh, which was greater compared to reports elsewhere [13].
Fig. 5 shows the J-V and J-P characteristics for the protonic batteries at room temperature. The J- V curve had asimple linear form, which indicates that the <~olarization onthe electrode was primarily dominated by ohmic contributions. The plot of the operating J-P suggests that the contact between electrolyte/electrod~s was good. The voltage
2.0,---------------------,191.8171.61.514
~ 1.31.2
~ 11.5 10'0 09:> 0.8
070.60.50.40.3020.10.0 -l--....-.,---.--.---.-~-...,._~-.....__~-...,..___r__
o 100 200 300 400 500 600 700 800 900 1000110012001300
Time (min)
Fig. 4. Discharge curves using a constant currenl at I rnA.
of the battery dropped to a short circuit current density of16.0 mA cm-2 and the maximum power density was determinedto be 8.70 ± 1.91 mW cm-2 . The internal resistance of the battery was obtained from the gradient of the I-V graph, which was29.8 ± 5.1 n, which was lower than other chitosan-based SPEbatterie~ [4,5].
4. Conclusion
The conductivity ofCA-NH4N03 was successfully increasedfrom 10-5 to 10-3Scm-I employing a plasticization methodusing EC. This proton conductor was evaluated for protonic batteries at room temperature with the achievement of an OCYof 1.56 ± 0.06 Y, the discharge capacity of 17.0 ± 2.6 mAh anda maximum power density of 8.70 ± 1.91 mW cm-2 . Theseresults imply that CA-NH4N03-EC is a promising proton conductor for proton batteries.
Acknowledgements
L.S.N. is a Final Year Project student and would like to thanktechnicians of SMMRE for their experimental helps. A.A.M.also wishes to thank USM for the Short Term Grant 2005/2007given.
References
[I] S. Aiba. Advances in Chitin and Chitosan, Elsevier Applied Science, Bark
ing. UK, 1992.[2] N.S. Mohamed. R.H. Y. Subban, A.K. Arof. J. Power Sources 56 (1995)
153.l3] N.M. Morni, A.K. Arof. J. Power Sources 77 {I 999) 42.[4] N.M. Morni, N.S. Mohamed. A.K. Arof. Mater. Sci. Eng. B 45 (1997)
140.[5] R.H.Y. Subban. A.K. Arof. S. Radhakrishna, Mater. Sci. Eng. B 38 (1996)
156.l6] P. Mukoma. B.R. Jooste, H.C.M. Vosloo, J. Power Sources 136 (2004) 16.[7] B. Smitha, S. Sridhar, A.A. Khan, Macromolecules 37 (2004) 2233.[8j S.R. Majid, A.K. Arof, Physica B 355 (2005) 78.
Protonic Battery based on a Plasticized Chitosan-NH4N03 Solid Polymer Electrolyte
at Elevated Temperatures
L.S. Ng and A.A. Mohamad*
School of Materials and Mineral Resources Engineering,
Universiti Sains Malaysia, 14300 Nibong Tebal, Penang, Malaysia.
*E-mail address:[email protected]
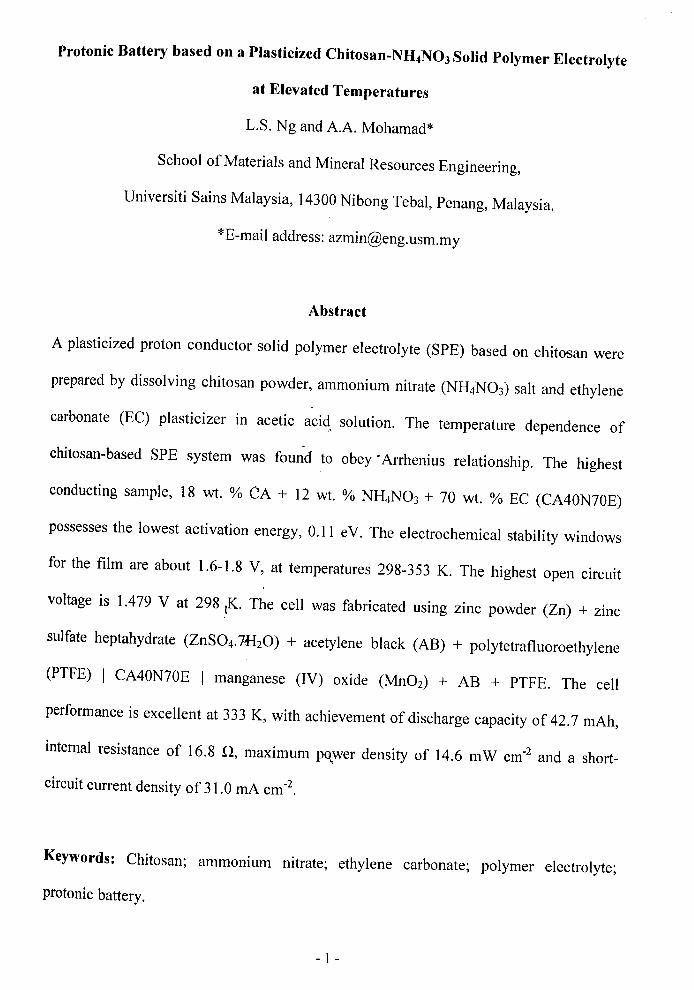
Abstract
A plasticized proton conductor solid polymer electrolyte (SPE) based on chitosan were
prepared by dissolving chitosan powder, ammonium nitrate (NH4N03) salt and ethylene
carbonate (EC) plasticizer in acetic acid, solution. The temperature dependence of
.chitosan-based SPE system was found to obey'Arrhenius relationship. The highest
conducting sample, 18 wt. % CA + 12 wt. % NH4N03 + 70 wt. % EC (CA40N70E)
possesses the lowest activation energy, 0.11 eV. The electrochemical stability windows
for the film are about 1.6-1.8 V, at temperatures 298-353 K. The highest open circuit
voltage is 1.479 V at 298 tK. The cell was fabricated using zinc powder (Zn) + zinc
sulfate heptahydrate (ZnS04.7.f-hO) + acetylene black (AB) + polytetrafluoroethylene
(PTFE) I CA40N70E I manganese (IV) oxide (MnOz) + AB + PTFE. The cell
performance is excellent at 333 K, with achievement of discharge capacity of 42.7 mAh,
internal resistance of 16.8 .0, maximum pO,wer density of 14.6 mW cm-z and a short
circuit current density of 31.0 rnA cm-z.
Keywords: Chitosan; ammonium nitrate; ethylene carbonate; polymer electrolyte;
protonic battery.
- 1 -

2. Experimental
The polymer electrolyte films were prepared from chitosan (Chito-Chem,
Malaysia), NH4N03 (Merck) and EC (Merck). The details of this procedure were
reported in previous study [7]. The composition of the samples were coded as CA,
60 wt. % CA + 40 wt. % NH4N03 (CA40N), 48 wt. % CA + 32 wt. % NH4N03 +
20 wt. % EC (CA40N20E) and 18 wt. % CA + 12 wt. % NH4N03 + 70 wt. % EC
(CA40N70E).
Zn powder (Merck) and ZnS04.7H20 (Univar) were mixed with acetylene
black (AB, Gunbai) and polytetrafluoroethylene (PTFE, Fluka) using composition
of 72.6:24.2:2.4:0.8 (weight ratios) to form an anode pellet of the cell. A cathode
pellet was prepared with procedures similar to the anode. A mixture of Mn02, AB
and PTFE with the composition of 90.9:8.1: 1.0 (weight ratios) were used to form
the cathode pellet.
The ionic !conductivity was measured with an Autolab PGSTAT 30
Frequency ResponseCAnalyzer (Eco Chemie B.V.) using frequency range of 1 Hz
to 1 MHz and in the temperature range of 298-393 K. The measurement was
carried out by sandwiching the chitosan-based SPE between two stainless steel
(SS) electrodes. A linear sweep "voltammetry (LSV) was conducted with a
scanning rate of 1.0 mVIs. The sample was mounted inside the SS electrodes and
placed into an oven coupled with a temperature controller which was carried out
at different temperatures, 298-353 K.
- 3 -

Fig. 2 shows the relationship of variation of activation energy (Ea
) and (j at
room temperature. The highest conducting film (CA40N70E), gave the lowest Ea
at 0.11 eV. It indicates that when conductivity increases, the Ea
for transferring H+
ions will be reduced.
3.2 Linear sweep voltammetry analysis
Fig. 3 shows the LSV curves of the polymer electrolyte system of sample
CA40N70E. The current onsets of the sample are detected about 1.80, 1.75, 1.70,
and 1.60 V at temperatures of 298, 313, 333, and 353 K, respectively. The current
onset is assumed to be the films breakdown voltage. It can be observed that the
breakdown voltage reduces when temperature increases from 298 to 353 K. Thus,
this voltages are high enough' to allow safe use of chitosan-based SPE in
fabrication of protonic batteries, since the electrochemical window standard of
protonic battery is about ~ 1 V [8].
3.3 Open circuit voltaie analysis
The OCV char'Wteri~tic of protonic batteries at 298-353 K is shown in Fig.
4. It can be observed that as the temperatures increase, the OCV become lower
which is of the same trend as for the results obtained by LSV. The highest OCV is
1.479 V at room temperature (29~ K). This phenomenon suggests that the,
electrode materials possess considerable catalytic properties at low temperatures.
From the results obtained, it can be concluded that the fabricated cells at 298, 313,
and 333 K are reasonably stable in open cell condition. However, at the highest
temperature (353 K), continuously heating the cell for a longer duration causes
- 5 -

inferred that deterioration of the SPE has occurred at 353 K. When reaching an
optimum condition, which is after 333 K, the cell performance was obviously
degraded.
3.5 Current-voltage analysis
Fig. 6 (a) and 6 (b) show the plot of 1- V and J-P curves for protonic
batteries at elevated temperatures. From the 1- V curves obtained, each curve
shows a simple linear form, which indicates that the polarization on the electrode
is primarily dominated by ohmic contribution [11]. The resistance of the protonic
batteries can be calculated from the slope of 1- V curves. The curves show that as
temperature increases, the internal~esistance (r) of the cells decreases. The lowest
r is 16.8 Q at 333 K. At 353 K, the deterioration of the cell's materials occurs
which implies that the interfacial contact between the chitosan-based SPE and
electrodes may be deteriorating. The deterioration can be demonstrated by the
enhancement of r value of 23.0 Q. The r of the cells is considered high, whereas
the resistance of ,'the SPE is less than - 3.0 Q in the temperature range
investigated. The high r is attributable to the interfacial resistance between
SPE/electrodes. However, compared to the reports elsewhere [8, 12], the r from
present work is considered low.
•,
The plot of the operating J-P curves (Fig. 6 (b)) suggests that the contact
between electrolyte/electrodes was good. The maximum power density (Pmax)
increases with enhancement of temperatures. The highest Pmax is achieved by the
cell at 333 K, with Pmax of 14.6 mW cm-2 and a short-circuit current density (Jsc)
- 7 -

Q, 14.6 mW cm-2 and 31.0 rnA cm-2, respectively. The failures of the cells mainly
contributed to the degradation of the chitosan film SPE.
Acknowledgements
LSN (M.Sc. student) and AAM wish to thank USM for the Short Term Grant
(304.PBahan.60335149) 2005/07 given.
References
[1]. lH. Kim, J.Y. Kim, Y.M. Lee, K.Y. Kim, J Appl. Polym. Sci. 45 (1992) 1711.
[2]. N.M. Morni, A.K. Arof, J Power Sources 77 (1999) 42.
[3]. N.M. Morni, N.S. Mohamed, A.K. t-rof, Mater. Sci. Eng. B 45 (1997) 140..
[4]. M.Z.A Yahya, AX. Arof, Eur. Polym. J 39 (2003) 897.
[5]. AS.A Khiar, R. Puteh, A.K. Arof,Physica B 373 (2006) 23.
[6]. T. Winie, A.K. Arof, Ionics 12 (2006) 149.
[7]. L.S. Ng, A.A. Mohamad, J Power Sources 163 (2006) 382.
[8]. R. Pratap, B. Singh, S. Chandra, J Power Sources 161 (2006) 702.
[9]. 1 Broadhead, RC. Kuo, Electrochemical Principles and Reactions. 3rd ed.
Handbook of Batteries, D. Linden, T.B. Reddy (Eds). 2001, McGraw-Hill: New
York, Chapter 2.
[10]. R.RY. Subban, A.K. Arof, J Powe.,r Sources 134 (2004) 211.
[11]. S.C. Yap, A.A. Mohamad, Electrochem. Solid-State Lett. 10 (2007) A139.
[12]. N.S. Mohamed, R.RY. Subban, AK. Arof, J Power Sources 56 (1995) 153.
- 9 -
Figure Captions
Fig. 1: The temperature dependence of conductivity for chitosan-based SPE systems.
Fig. 2: Variation of Ea and cr at room temperature.
Fig. 3: LSV curves of sample CA40N70E at 298,313,333, and 353 K.
Fig. 4: OCV curves of protonic batteries at 298, 313, 333, and 353 K.
Fig. 5: Discharge curves at a constant current profile of 1.0 rnA at 298,313,333, and
353 K.
Fig. 6: The plot of (a) J-Vand (b) J-P curves of protonic batteries at 298,313,333,
and 353 K.
•,
- 11 -

Fig. 2:
5.0E-04
3.0E-03 :;EC.l
2.5E-03 eIi:
b2.0E-03 i
's;:;:;
1.5E-03 ~"Cr:::
1.0E-03 <3
3.5E-03
\----O--==--"-----.:==:A-------1 6.0E-08
r-------------------, 4.0E-031.10
1.00
0.90
>.!. 0.80w..>. 0.70·e'CII 0.60r:::wr:::
0.500:;:;ell
.C: 0.40....C.l
<I:0.30
0.20
0.10
CA CA40NCA40N20E CA40N70E
Sample Name
i,
- 13 -

5 10 15 20 25 30 35 40 45 50 55 60 65
Time (hours)
Fig. 4:
1.8
1.6
~1.4
Ql 1.2Cl111....~ 1.0;t:::l 0.8l:!
<3c 0.6QlQ,
0 0.4
0.2
0.00
• 298 K
o 313 K
• 333 K
o 353 K
Cbooooooooo
i,
- 15 -

Fig. 6:
1.8(a)
1.6
14
1.2
~ 1.0CIIClco 0.8~
0.6
04
0.2
0.00.0 20.0 40.0 60.0
Current (rnA)
-298K
-0-313 K
-11-333 K
-0--353 K
800 100.0
16.0(b)
14.0;;-E 12.0CJ
3: 10.0E
~ 8.0UIr:::CII 6.00~
CII~ 4.00
Q.
2.0
0.00.0 5.0
-298K
-0-313 K
-11-333 K
-0-- 353 K
10.0 15.0 20.0 25.0 30.0 35.0 40.0
Current Density (rnA crn'Z)
,,
- 17 -

UNIVERSITI SAINS MALAYSIA
FINAL REPORT SHORT TERM GRANT USM 2005 -2006
Development of Zn-Mn02 Battery Using ChitosanZnCh Gel Polymer Electrolytes
No Akaun Geran: 304/PBAHAN/6035149
Prepared by:
Ng Li Sian
Dr. Ahmad Azmin B. Mohamad,
Pusat Pengajian Kejuruteraan Bahan & S. MineralKampus Kejuruteraan
Universiti Sains Malaysia
Tempoh Penyelidikan: 15 June 2005 -14 June 2007

NOTE:
Based on proposed title we want to use Chitosan-ZnCh, however due to complexation
problems between polymer (chitosan) and salt (ZnClz) we changed the salt (ZnClz) to
NH4N03• The Chitosan-NH4N03 systems have shown very promising results when
applied in Zn-Mn02 (proton) Battery.
•,
-ii-
LIST OF CONTENTS
NOTE
LIST OF CONTENTS
ABSTRACT
ABSTRAK
ii
111
v
vi
CHAPTER 1 INTRODUCTION
1.1 Polymer Electrolytes 1
1.2 Chitosan 2
1.2.1 Chitosan as a Polymer Electrolyte 3
1.3 Components of Cells and Batteries 4
1.4 Protonic Batteries 5
1.5 Problems Statement 7
1.6 The Objective 8
1.7 Approach of Study 8
CHAPTER 2 METHODOLOGY
2.1 Introduction
2.2 Sample Preparation: Chitosan-based Polymer Electrolyte Films
2.3 Sample Preparation: Electrode Anod~
2.4 Sample Preparation: Electrode Cathode
2.5 Configuration of Protonic Battery
2.6 Conductivity-Temperature Study
2.7 Linear Sweep Voltammetry
- iii -
10
10
11
12
13
14
17

2.8 Protonic Battery Characterization
2.8.1 Open Circuit Voltage
2.8.2 Discharge Characteristic
2.8.3 Current-Voltage Characteristic
CHAPTER 3 RESULTS AND DISCUSSIONS
18
18
19
20
3.1 Introduction 23
3.2 Conductivity-Temperature Study 23
3.2.1 Solid Polymer Electrolytes Characterization:CA-NH4N03
System 24
3.2.2 Solid Polymer Electrolytes Characterization:CA-NH4N03-EC
System25
3.2.3 Temperature Dependence27
3.3 Linear Sweep Voltammetry29
3.4 Open Circuit Voltage31
3.5 Discharge Characteristic32
3.6 Current-Voltage Characteristic36
CHAPTER 4 CONCLUSlON AND SUGGESTIONS
REFERENCES
•,
- IV-
40
41

ABSTRACT
This project is divided into two main sections that are to produce solid polymer
electrolyte (SPE) as a proton conductor (H+) and to fabricate polymeric solid-state
protonic battery with configuration of zinc (Zn)/SPE/manganese (IV) 0 xide (MnOz).
1.0 g of chitosan was dissolved in 100 ml of 1 % acetic acid solution. The ammonium
nitrate salt (NH4N03) and plasticizer, ethylene carbonate (EC), were added accordingly.
After casting the solution was left to dry at room temperature to form the films of pure
chitosan acetate (CA), C A-NH4N03, and C A-NH4N03-EC. T he highest conductivity
for chitosan + 40 % NH4N03 film at room temperature is (8.38 ± 4.11) x 10'5 S cm'l
and increases to (9.93 ± 1.90) x 10'3 S cm'l after added with 70 % EC. The temperature
dependence of chitosan-based SPE system was found to obey Arrhenius relationship.
The highest conducting sample (- 10'3 S cm'I), 18 wt. % CA-12 wt. % NH4N03-70 wt.
% EC (CA40N70E), possesses the lowest activation energy (Ea) of 0.10988 eV. The
electrochemical stability window for the cells was around 1.6 V - 1.8 V. The cells were
fabricated using SPE, which showed the highest value of conductivity, and
Icharacterized according to their electrochemical testing at 298, 313, 333 and 353 K.
The cells performance was excellent at 333 K, with achievement of discharge capacity
of 42.7 mAh, internal resistance (r) of 16.8 n, maximum power density (Pmax) of
14.6 mW cm'z and a short-circuit current density (Jsc) of 31.0 mA cm·z. The highest
open circuit voltage (OCV) was 1.4'19 V at 298 K. On the other hand, the
electrochemical properties of the cells at 353 K were decreased compared to the cells at
333 K. The decrease in the electrochemical properties was correlated to the failure of
the cells. Thus, the best electrochemical properties of the cells from this system were
observed at temperature 333 K.
-v-

BATER! PROTON BERASASKAN PEMPLASTIKKAN ELEKTROLITPOLIMER KEADAAN PEPEJAL KITOSAN-NH4N03 PADA SUHU TINGGI
ABSTRAK
Projek ini dibahagikan kepada dua bahagian utama iaitu penghasilan elektrolit polimer
pepejal (SPE) sebagai konduktor proton (H+) dan fabrikasi bateri proton keadaan
pepejal polimer dengan konfigurasi zink (Zn)/SPE/mangan dioksida (Mn02). 1.0 g
kitosan dilarutkan dalam 100 ml larutan asid asetik I %. Garam ammonium nitrat
(NH4N03) dan bahan pemplastik etilena karbonat (EC) ditambahkan ke dalam larutan
kitosan tersebut. Selepas penuangan larutan, ia dibiarkan kering pada suhu bilik untuk
membentuk filem kitosan asetat (CA) tulen, CA-NH4N03 dan CA-NH4N0
3-EC.
Konduktiviti yang tertinggi bagi filem kitosan + 40 % NH4N03 pada suhu bilik adalah
(8.38 ± 4.11) x 10-5
S em-I dan meningkat kepada (9.93 ± 1.90) x 10-3 S em-1 setelah
ditambahkan dengan 70 % EC. Kajian konduktiviti-suhu bagi sistem SPE berasaskan
kitosan didapati mematuhi persamaan 'Arrhenius'. Sampel dengan konduktiviti
tertinggi (- 10-3
S em-I), 18 wt. % CA-12 wt. % NH4N03-70 wt. % EC (CA40N70E),
mempunyai tenaga pengaktifan (Ea) yang terendah, 0.10988 eV. Kestabilan
elektrokimia untuk batc:rri proton adalah kira-kira 1.6 V - 1.8 V. Sel difabrikasi dengan
SPE yang mempunyai nil~i konduktiviti tertinggi dan pecirian sel berdasarkan. kajian
elektrokimia pada suhu 298, 313, 333 dan 353 K dijalankan. Prestasi sel yang terbaik
adalah pada suhu 333 K, dengan kapasti diseas, rintangan dalaman (r), ketumpatan
kuasa tertinggi (Pmax) dan ketumpatan arus litar pintas (Jsc) masing-masing sebanyak•,
42.7 mAh, 16.8 n, 14.6 mW em-2 dan 31.0 rnA em-2. Voltan litar terbuka (OCV)
tertinggi adalah 1.479 V pada suhu 298 K. Selain itu, perlakuan elektrokimia bagi sel
pada suhu 353 K menurun berbanding dengan sel pada suhu 333 K. Ini adalah
berhubung kait dengan kegagalan sel tersebut. Justeru itu, perlakuan elektrokimia
terbaik bagi sel-sel daripada sistem ini adalah diperhatikan pada suhu 333 K.
- vi-

CHAPTERl
INTRODUCTION
1.1 Polymer Electrolytes
Polymer-based electrolytes are receiving considerable attention as solid polymer
materials in advanced applications such as rechargeable lithium ion batteries because
their use allows the fabrication of safe batteries and pennits the development of thin
batteries and electrochemical devices with design flexibility (Yahya and Arof, 2003).
Polymer-based electrolyte materials have been reported as promising materials for use
in batteries due tot heir unique properties such as high ionic conductivity, ability to
provide good electrode/electrolyte 'contact, physical flexibility, show good mechanical
properties and film fonns ability (Winie and Arof, 2006). Besides, such electrolyte has
potentially promising applications in other electrochemical devices such as fuel cells,
supercapacitors, electrochromic windows and sensors (Song et al., 1999). The use of
solid polymer electrolytes (SPE) can avoid problems associated with liquid electrolytesI
such as leakage and gas fonnation that arises from solvent decomposition. This leads to~
improvement in battery design. Solid polymer batteries constructed with only thin-film
electrodes and electrolytes can be made to be very compact, 1ightweight and highly
reliable (Mohamed and Arof, 2004).
•,
Polymers that have been used in making of proton-conducting films are includes
polyethylene oxide (PEO) (Ali et al., 1998; Majid and Arof, 2005; Maurya et al., 1992),
polyacrylic acid (PAA) (Bozkurt et al., 2003) and polyvinyl alcohol (PVA) (Vargas et
al., 2000). These polymers have been complexed with various salts, which provide the
- 1 -
ions for conduction. Several ammonium salts such as NH4I (Maurya et aI., 1992),
(NRt)2S04 (Ali et al., 1998) and (NH4)SCN (Majid and Arof, 2005) were used as
doping salts. Various combinations of salts and polymers forming polymer-salt
complexes have been investigated with particular attention to chitosan-based
complexes (Majid and Arof, 2005; Khiar et al., 2006; Mohamed et al., 1995).
1.2 Chitosan
The chitin that has a high degree of N-deacetylation is known as chitosan. Chitosan is
more useful for biomedical/manufacturing applications and dehydrations of aqueous
solutions than chitin, since it has both hydroxyl and amino groups that can be easily
modified (Majid et aI., 2005).
Chitosan is a virtually non-toxic polymer with a wide safety margin. Moreover,
chitosan is a biodegradable, biocompatible, positively charged polymer, which shows
many interesting properties, such as biodegradable edible coating or film in food
packaging, a dietary fibre, a ~iomaterial in medicine.
Previous studies have prbven that chitosan can be used as a polymer matrix for ionic
conduction (Yahya and Arof, 2003). Each of the nitrogen and oxygen atoms in chitosan
has a lone pair electron where complexation can occur. Thus chitosan satisfies one of
the criteria to act as a polymer host for ~he solvation of salts. In addition, it is stable in
neutral conditions. Amine and hydroxyl groups on the glucosamine unit can form
strong inter- and intra- molecular hydrogen bond to crystallize. Figure 1.1 shows the
molecular structure of segments of chitosan (Majid and Arof, 2005).
- 2 -

o
OH :NH~
Figure 1.1: Chitosan (Majid and Arof, 2005).
1.2.1 Chitosan as a Polymer Electrolyte
Chitosan is a polymer which has been shown to be a promising solid electrolyte for
solid state cells (Momi and Arof, 1999). Chitosan is soluble in various acidic solvents
such as in acetic, citric, formic, glycolic, lactic and malic acids because chitosan is a
weak polybase (Yahya and Arof, 2003). It has been used as the base polymer for the
studies on proton-conducting films.. .In its actual state, a chitosan film has a very low
electrical conductivity. Although the structure of chitosan monomer has three
hydrogens, they are strongly bonded to the structure and cannot be mobilized under the
action of an electric field to make it a proton conductor (Mohamed et al., 1995).
Some OpInIOnS stated ,'that if chitosan is dissolved in acetic acid and the resulting
solution is cast into a thin film, then the H+ or H30+ and CH3COO· ions in the
'acetylated chitosan' film will be dispersed in the immobilized chitosan solvent and
these ions can be mobilized under the influence of an electric field. If H+ or H30+ ions
are more mobile than the CH3COO· ions\the film becomes a proton conductor. Further,
it should be possible to produce a more ionically conducting film by dissolving
chitosan in acetic acid solutions of increasing concentration since more H+ (or H30+)
will be contributed by the acetic acid (Mohamed et al., 1995).
- 3 -

1.3 Components of Cells and Batteries
A battery is a device that converts the chemical energy contained in its active materials
directly into electric energy by means of an electrochemical oxidation-reduction (redox)
reaction. In the case of a rechargeable system, the battery is recharged by a reversal of
the process. Oxidation-reduction reaction involves the transfer of electrons from one
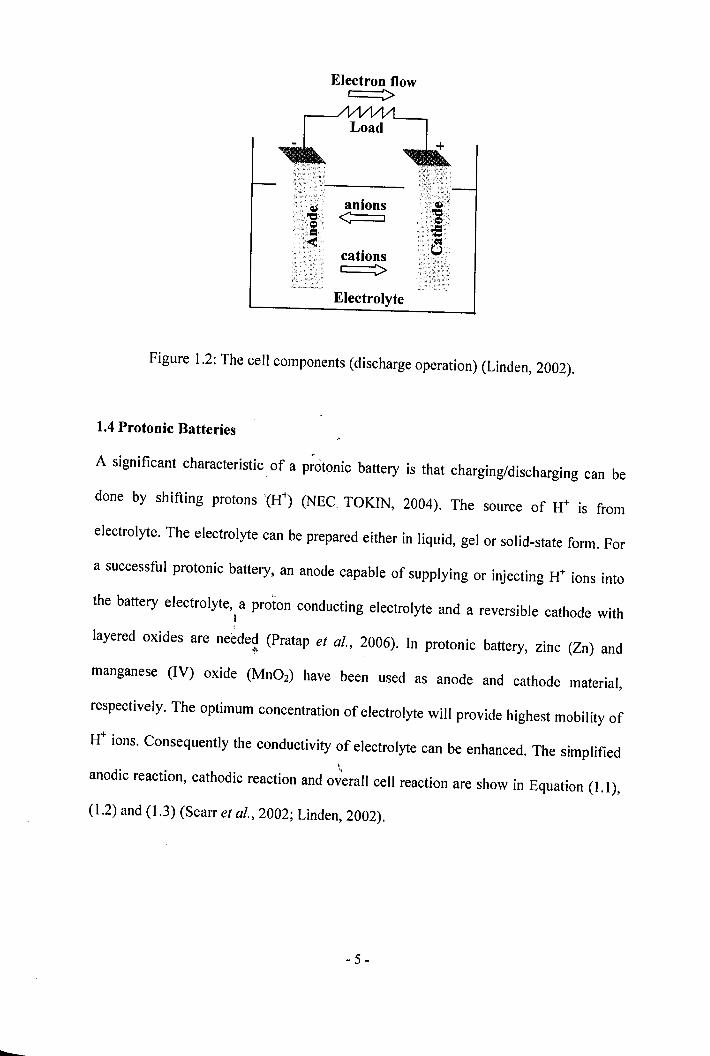
material to another through an electric circuit (Linden, 2002).
While the term "battery" is often used, the basic electrochemical unit being referred to
is the "cell". A cell provides a source of electric energy by direct conversion of
chemical energy. The cell consists of an assembly of electrodes, separator, electrolyte,
container and terminals. A battery consists of one or more of these cells, connected in
series or parallel, or both, depending orr the desired output voltage and capacity. Figure
1.2 shows an example of the cell components. The cell consists of three major
components (Linden, 2002):-
1. The anode or negative electrode - the reducing or fuel electrode, which gives up
electrons to the external circuit and is oxidized during the electrochemical
reaction.
n. The cathode or positive electrode - the oxidizing electrode, which accepts
electrons from the external circuit and is reduced during the electrochemical
reaction.
lll. The electrolyte or the ionic conductor - which provide the medium for transfer•,
of charge, as ions, inside the cell between the anode and cathode. The
electrolyte is typically a liquid (water or alcohols solvents), with dissolved salts,
acids or alkalis to impart ionic conductivity. Nowadays, some batteries use solid
electrolytes.
- 4-
anions<===:J
cationsc==:>
Electron flowc==:>
Electrolyte
Figure 1.2: The cell components (discharge operation) (Linden, 2002).
1.4 Protonic Batteries
.A significant characteristic of a protonic battery is that charging/discharging can be
done by shifting protons '(H+) (NEe TOKIN, 2004). The source of H+ is from
electrolyte. The electrolyte can be prepared either in liquid, gel or solid-state form. For
a successful protonic battery, an anode capable of supplying or injecting H+ ions into
the battery electrolyte, a proton conducting electrolyte and a reversible cathode withI
layered oxides are needed (Pratap et al., 2006). In protonic battery, zinc (Zn) and..manganese (IV) oxide (Mn02) have been used as anode and cathode material,
respectively. The optimum concentration of electrolyte will provide highest mobility of
H+ ions. Consequently the conductivity of electrolyte can be enhanced. The simplified
•,anodic reaction, cathodic reaction and overall cell reaction are show in Equation (1.1),
(1.2) and (1.3) (Scarr et al., 2002; Linden, 2002).
- 5 -

At the anode, Zn is oxidized with the release of two electrons, and zinc sulfate
heptahydrate (ZnS04.7H20) provides the sources ofH+ ions,
Zn -. Zn2++ 2e'0.7618 V
-0.8277 V ...(1. 1)
At the cathode, Mn02 is reduced with the acceptance of electrons,
1.2240 V
2H+ + Mn022- -. H2Mn02... (1.2)
The overall cell reaction is the combination of Zn, ZnS04.7H20 and Mn02. with
Zn(OHh, H20, ZnS04 and H2Mn02 as the reaction products.
Zn + ZnS04.7H20 + Mn02
-. Zn(OHh + 5H20 + ZnS04 + H2Mn02 1.2899 V ...(1.3)
The standard potential of a cell can be calculated from the standard electrode potentials
as follows (the oxidation potential is the negative value of the reduction potential)
(Linden, 2002):-
Anode (oxidation potenlial) + cathode (reduction potential) = standard cell
potential ... (1.4)
Thus, the standard protonic batteries potential is:-
-(0.7618-0.8277) + 1.2240 = 1.2899 V;,
- 6-
....(1.5)

1.5 Problems Statement
In most common batteries the electrolyte is a liquid. However, liquid electrolyte might
lead to problems such as leakage, corrosion and contamination of electrode and
electrolyte which will degrade the battery efficiency (Chandra, 1981). Batteries with
liquid electrolytes involve complicated and higher cost processes and equipment. The
availability of solids capable of being fabricated into electronically insulating elements
with fairly low overall ionic resistance has stimulated the development of solid
electrolytes batteries.
As in polymer-salt complexes, a major drawback of these complexes is the low ionic
conductivity at ambient temperature which cannot be applied as an electrolyte in a
battery (Winie and Arof, 2006). FUT!hermore, the difficulty is, to find a material with
suitable electrochemical properties that are available at elevated temperatures. At
higher temperature, the efficiency of polymer electrolyte/electrode might be
deteriorated.
To the best of our knbwledge, there were no systematic studies on protonic battery
~
based on chitosan acetate (CA)-ammonium nitrate (NH4N03)-ethylene carbonate (EC)
SPE at higher temperatures. A study to the behavior of electrolyte/electrode at different
temperatures is necessary because utilization of this knowledge will be an advantage
for designing of a protonic battery at dif~rent environments.
-7 -
1.6 The Objective
In this work, chitosan biopolymer has been used as the medium for the transport of H+
ions. A convenient solvent for chitosan is dilute acetic acid. The main purpose of this
work is:-
1. To apply chitosan as a polymer host and NH4N03as a doping salt.
11. To enhance conductivity behavior of CA-NH4N03system with plasticizer EC at
room temperature.
Ill. To study conductivity-temperature behavior of the CA-NH4N03-EC system.
IV. To fabricate and study the electrochemical properties of protonic batteries with
configuration of Zn + ZnS04.7H20 /18 wt. % CA-12 wt. % NH4N03-70 wt. %
EC / Mn02 at high temperatures.
1.7 Approach of Study
The chitosan films were prepared from chitosan, NH4N03, and EC by the solution cast
technique and left to dry at room temperature (25°C) to form films of CA, CA-
NH4N03 and CA-NH4N03-EC. The films were characterized by conductivity-
temperature study (2~8-393 K) and linear sweep voltammetry (LSY) (298-353 K).
When t he films were fodned, t hey were cut into a suitable size a nd placed between
blocking stainless steel electrodes in a cell which was connected to a computer. The
cell was then put into an oven coupled with a temperature controller. At room
temperature, optimum concentration of. polymer electrolytes of CA-NH4N03 and CA-,
NH4N03-EC system were determined.
- 8 -

For protonic battery, it was fabricated by the highest conducting film, 18 wt. % CA-12
wt. % NH4N03-70 wt. % EC (CA40N70E). The cells were assembled by sandwiched
the sample CA40N70E between a pellet anode and a pellet cathode. The cell
measurements include open circuit voltage (OCV), discharge, current-voltage (1- V), and
current density-power density (J-P) characteristics were carried out at various
temperatures, 298-353 K.
i,
- 9 -
CHAPTER 2
METHODOLOGY
2.1 Introduction
In this work, chitosan has been used as a host polymer electrolyte for fabrication of
protonic batteries. Conductivity-temperature studies and linear sweep voltammetry
(LSV) have been used to characterize the chitosan films. On the other hand, open
circuit voltage (OCV), discharge, current-voltage (1- V) and current density-power
density (J-P) characteristics were used to characterize protonic batteries at high
temperatures.
2.2 Sample Preparation: Chitosan-based Polymer Electrolyte Films
Chitosan films were prepared from chitosan powder by the solution cast technique.
1.0 g of chitosan (Chito-Chem, Malaysia) was dissolved in 100 ml of 1% acetic acid
(Merck) solutions. NH4N03 (Merck) and ethylene carbonate (EC, Merck) were added
accordingly. The mixture was dispersed and stirred continuously in a sealed conical
flask with am agnetic f tirrer for 24 hours until homogeneous solution was 0 btained.
After complete dissolutio~ the solutions were cast onto plastic petri dishes and left to
dry by evaporation at room temperature (25°C) to form films of pure chitosan acetate
(CA), CA-NH4N03 and CA-NH4N03-EC. The films were then transferred into a
desiccator (with silica gel desiccant) for continuous drying. A free standing and plastic-•,
like film was obtained for all systems.
- 10 -
Concentration of NH4N03 was varied from 10 wt. % to 60 wt. %. For sake of
simplicity, the films will be simply coded as CA, 60 wt. % CA-40 wt. % NH4N03
(CA40N), 48 wt. % CA-32 wt. % NH4N03-20 wt. % EC (CA40N20E) and 18 wt. %
CA-12 wt. % NH4N03-70 wt. % EC (CA40N70E), respectively for the conductivity-
temperature study. Figure 2.1 shows an example of film formed after drying process.
Chitosan film Plastic petri dish
Figure 2.1: Appearance of chitosan film after drying process.
2.3 Sample Preparation: Electrode Anode
To prepare an anode pellet (active area 2.5447 cm2, weight 2.3 g and thickness - 0.2
cm), Zn powder (Merck) and ZnS04.7H20 (Univar) were mixed with acetylene blackI
(AB, Gunbai) and polytetratluoroethylene (PTFE, Fluka). The anode contains a mixture<\
of Zn and ZnS04.7H20 in the ratio of 3: 1. The mixture was subsequently put in a die
and gently pressed. The anode pellet was formed by hydraulic press (Carver) to
sandwich the stainless steel mesh into the powder mixture. A few drops of ethanol as a
wetting agent was added into the mixtu}e in order to make the pressing process easier.
Stainless steel mesh was used as a current collector in the middle of the pellet. The
function of PTFE and AB were as binding agent and to introduce the electronic
conductivity, respectively (Pratap et al., 2006). Figure 2.2 shows an example of anode
pellet pressed by pressing machine.
- 11 -

Anode pellet ~Plastic petri dish
Figure 2.2: Appearance ofanode pellet pressed by hydraulic press.
2.4 Sample Preparation: Electrode Cathode
The cathode pellet (active area,2.5447 cm2, weight 2.1 g and thickness _ 0.2 cm) was
prepared with similar"procedures to the anode. A mixture of Mn02 (Battery grade,
Aldrich) with AB and PTFE were used to form the cathode pellet. This mixture was
poured in a die and lightly pressed. Figure 2.3 shows an example of cathode pellet
formed by pressing maohine.
I
•,
- 12 -

~Plastic petri dish
}
i
Figure 2.3: Appearance of cathode pellet formed by hydraulic press.
2.5 Configuration of Protonic Battery
In this work, the cells were fabricated by using chitosan films which showed the
highest value of conductivity, sample CA40N70E. Chitosan film was sandwiched
between a pellet anode and a pellet cathode as illustrated in Figure 2.4. The entire
assembly was finally compacted to get a button shape polymeric solid-state protonic
battery. The Teflon container is able to endure condition at higher temperatures with
melting point, tensiltt strength and dielectric strength up to 312 °c, 23.5 MPa and
39.4 x 10⁶ VIm. It is water-resistant and highly chemical-resistant (Brady et aI., 2002) .
.,
- 13 -

Stainless steel electrode-------....
14---Teflon
Cathod~
CA40N70E ~
~--Teflon
Anode~-------"T--,
Stainless steel electrQd------..
<4
Figure 2.4: Schematic diagram of a protonic battery.
2.6 Conductivity-Temperature Study
In this work, when the films (CA, CA-NH4N03, and CA-NH4N03-EC) were formed,
they were cut into a suitable size and placed between blocking stainless steel electrodes
in a cell which was connected to a computer. Electrical conductivity measurements
were performed using an Autolab POSTAT 30 Frequency Response Analyzer (Eco
Chemie B.V.) with frequency range of I Hz to 1 MHz and an amplitude of 10 mV in
- 14 -

the temperature range of 298 K (25 DC)-393 K (120 DC). The effective area for
measurement was 2.5447 cm2
• Three samples were used in order to get an average and
standard deviation values at each temperature. The electrical conductivity (cr) is given
by (Callister, 2000):-
t0"= --
RbA ... (2.1)
where t is the thickness of the film, Rb the bulk impedance obtained from the
impedance plot, and A the area of the film.
To determine the cr, the technique of impedance spectroscopy was employed. In
impedance spectroscopy, a time varying voltage is applied to the cell under
investigation and the sinusoidal current passing through the cell is detennined. It
involves measuring the impedance as a function of frequency of the applied signal over
a wide frequency range.
Figure 2.5 illustrates complex impedance p lots for a combination of a capacitor andI
resistor. For the capacitor and resistor in series, the plot defines a vertical spike
displaced to distance R along the real axis as frequency is increased and the impedance
of the capacitor is reduced. Whereas if consider the parallel combination, this defines a
semicircle in the complex impedance plane with a diameter 'r' extending along the real
axis from the origin. At the maximum of the semicircle, O)max the product of the
magnitude of the resistor and capacitor is equal to II O)max, i.e. RC = II O)max or O)max RC
= I (Arof et al., 1999).
- 15 -
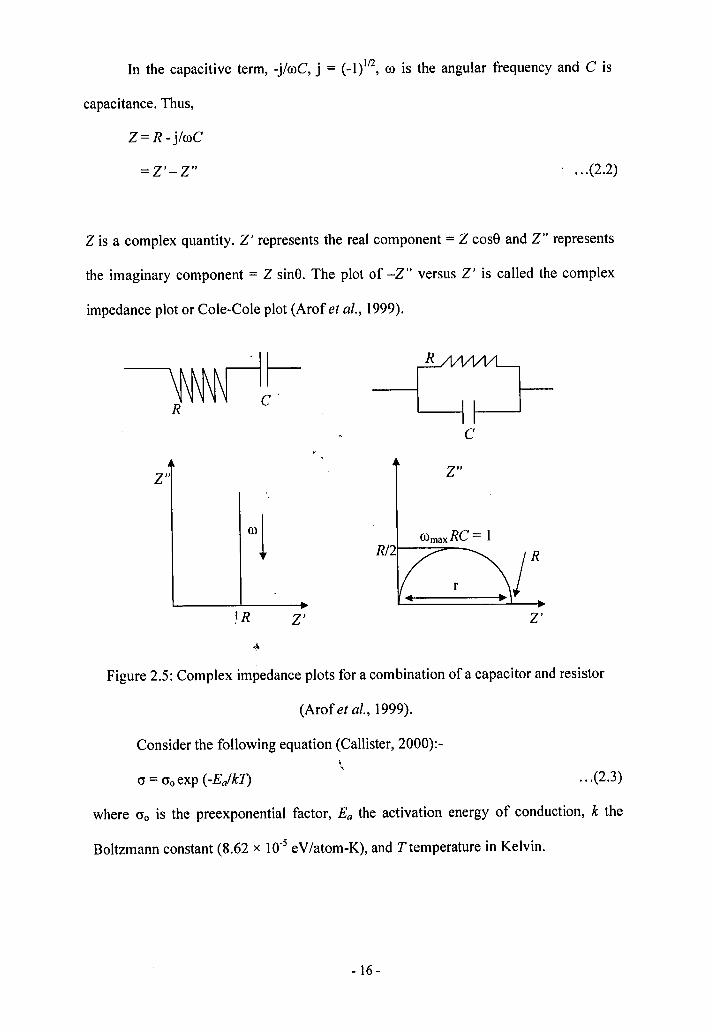
In the capacitive term, -jlroC, j = (_1)1/2, ro is the angular frequency and C is
capacitance. Thus,
Z= R - jlroC
=Z'-Z" , ...(2.2)
Z is a complex quantity. Z' represents the real component = Z cose and Z" represents
the imaginary component = Z sine. The plot of -Z" versus Z' is called the complex
impedance plot or Cole-Cole plot (Arof et al., 1999).
Z"
C
Z"
,IR Z'
romaxRC = 1
r
Z'
Figure 2.5: Complex impedance plots for a combination of a capacitor and resistor
(Aref et al., 1999).
Consider the following equation (Callister, 2000):-;,
...(2.3)
where ao is the preexponential factor, Ea the activation energy of conduction, k the
Boltzmann constant (8.62 x 10⁻⁵ eV/atom-K), and Ttemperature in Kelvin.
- 16 -

a Ea- = exp (--)ao kT
a Ea2.303 log - =--
ao kT
Ealog a = - + log ao
2.303 kT ... (2.4)
By plotting the graph oflog a (S em-I) versus IOOOIT (K"I) (Arrhenius plot), gradient of
the graph is - Ea , where Eacan be determined from the gradient of graph.2.303 k
2.7 Linear Sweep Voltammetry
In this work, LSV was performed using the Potentiostat/Galvanostat of Autolab
PGSTAT 30 GPES (Eco Chemie B.Y.). The highest conducting sample ofCA40N70E
was mounted inside a cell which was sandwiched between two stainless steel self-
designed blocking electrodes at a scanning rate of 1.0 mVis. The initial potential and
end of potential were -2.0 V and 2.0 V, respectively. The cell was then placed into an
oven coupled with a temperature controller which was carried out at different
Itemperatures, 298 K (25 0q, 313 K (40 0q, 333 K (60 0q and 353 K (80 0q.
Figure 2.6 shows an example ideal curve of LSV. From the curve obtained, the
breakdown voltage of the polymer electrolyte can be determined as shown in Figure
2.10. •,
- 17 -

Current Density (rnA cm-2)
Breakdownvoltage
Voltage (V)
Figure 2.6: Example of sweep voltammetry curve.
2.8 Protonic Battery Characterization
In this work, all the cell characteristics were measured by using the
Potentiostat/Oalvanostat of Autolab POSTAT 30 OPES (Eco Chemie B.V.). The
measurements were done at elevated temperatures, 298 K (25°C), 313 K (40°C),
333 K (60°C) and 353 K (80°C). The characterization techniques include OCV,
discharge characteristic, 1- V, and J-P test.
2.8.1 Open Circuit Voltage
The OCV was measured for the cells stored at an open circuit condition for 60 hours.
The duration of running an OCV test was refers to the results of discharge characteristic.I,
Thereby, longer duration was carried out for OCV. Figure 2.7 shows an example result
of ideal OCV curve. A good battery should be displays constant voltage during storage.
- 18 -

Voltage (V)
Time (hours)
Figure 2.7: Example of an ideal OCV curve.
2.8.2 Discharge Characteristic
The cells were discharged at a constant current (Id) of 1.0, 5.0 and 10.0 rnA at room
temperature (298 K). Temperature·:dependence studies were also conducted on the cell
and were recorded at temperatures of 313, 333 and 353 K. Based on discharge curve
obtained, various secondary results can be determined which includes discharge
capacity, nominal voltage and specific energy.
IFigure 2.8 shows an example of ideal discharge curve. It shows that the discharge was
4
sustained for td hours until the cut-off voltage. The initial voltage (Va) drop is higher
before reaching a flat discharge plateau at Vp •
;,
- 19 -

Voltage (V)
~I
Time (hours)
Figure 2.8: Example ofan ideal discharge curve.
The following were the important results that can be determined from discharge
characteristic (Linden, 2002):-
I. Discharge Capacity (mAh) = Discharge Current (Id) x Discharge Time
... (2.5)
ii. Discharge Capacity (C) =Discharge Current (Id) x Discharge Time (td) ~ 3600 s
...(2.6)
iii. Nominal Voltage (Vp ) =Generally accepted as typical of the operating voltageI
of the battery (voltage at half condition from discharge
time).
iv. Specific Energy (mJ) = Discharge Capacity (C) x Nominal Voltage (Vp
) ...(2.7)
i,where Vo, Vp, and td can be obtained from a discharge curve as shows in Figure 2.8.
2.8.3 Current-Voltage Characteristic
Current drains ranging from 2.0 ~ to 100.0 rnA were used to plot the I-V and J-P
curves as show in Figure 2.9 and Figure 2.110. Each cell's voltage was monitored for
- 20-
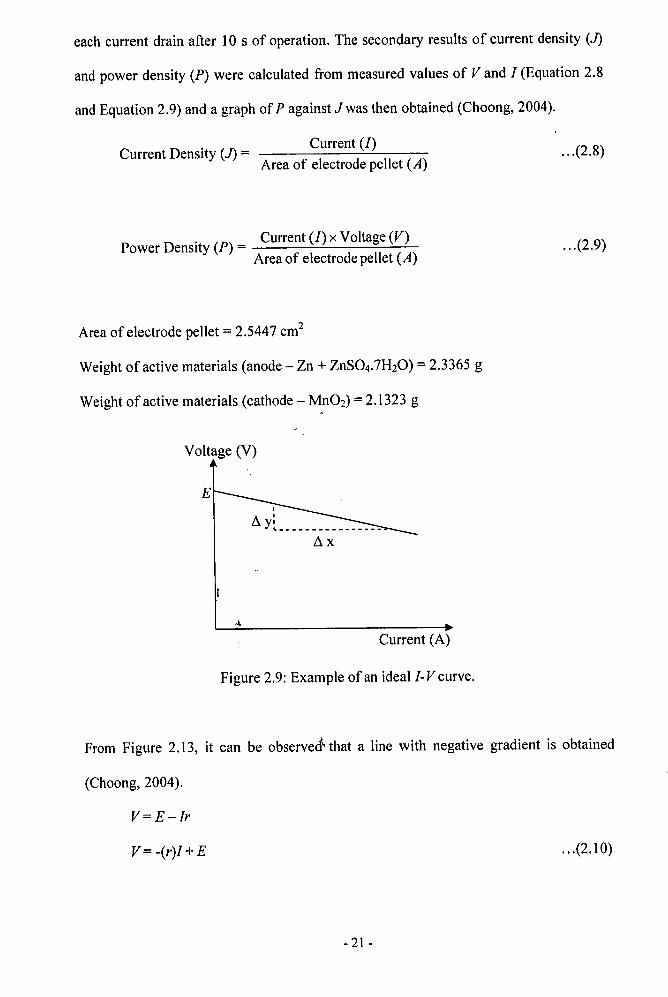
each current drain after lOs of operation. The secondary results of current density (J)
and power density (P) were calculated from measured values of V and / (Equation 2.8
and Equation 2.9) and a graph ofP against J was then obtained (Choong, 2004).
. Current (l)Current Density (J) = ---------.:....:...---
Area of electrode pellet (A)
P D't (P) Current (1) x Voltage (V)
ower ensI y =Area of electrode pellet (A)
Area of electrode pellet = 2.5447 cm2
Weight of active materials (anode - Zn + ZnS04.7H20) = 2.3365 g
Weight of active materials (cathode - Mn02) =2.1323 g
Voltage (V)
EI
~y:L _
~x
Current (A)
Figure 2.9: Example of an ideal /- V curve.
... (2.8)
... (2.9)
From Figure 2.13, it can be observe&- that a line with negative gradient is obtained
(Choong, 2004).
V=E-/r
V= -(r)/ + E
- 21 -
...(2.10)
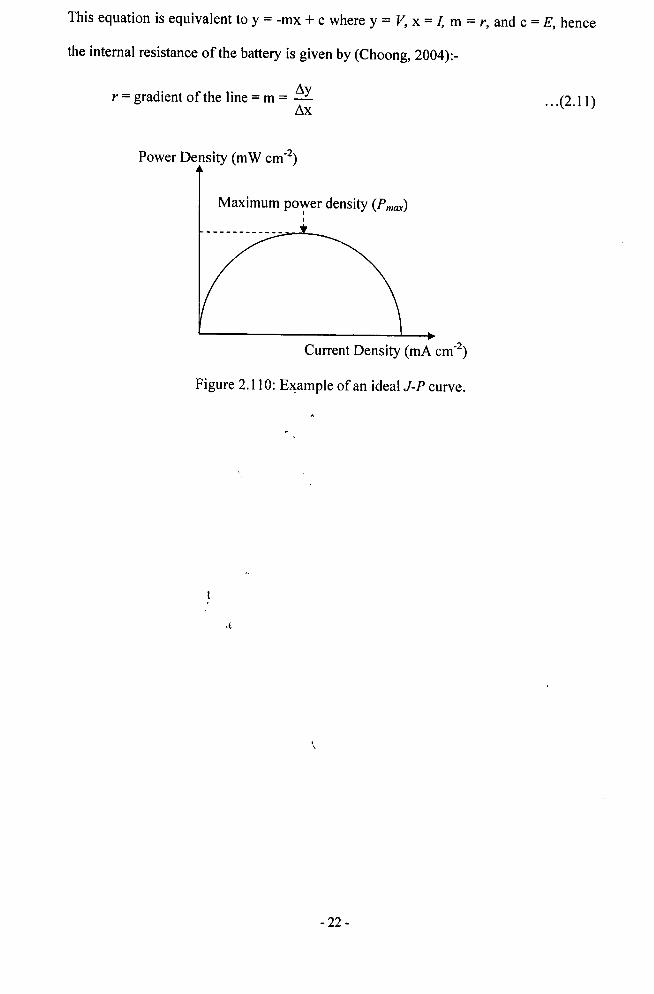
This equation is equivalent to y = -mx + c where y = V, x = I, m = r, and c = E, hence
the internal resistance of the battery is given by (Choong, 2004):-
r = gradient of the line = m = IlyIlx
Power Density (mW cmo2)
Maximum power density (Pmax)II
----------~--~-----
... (2.11)
Current Density (rnA cmo2)
Figure 2.11 0: E~ample of an ideal J-P curve.
.,
- 22-

CHAPTER 3
RESULTS AND DISCUSSIONS
3.1 Introduction
As mentioned in Chapter 2, the films of pure CA, CA-NH4N03' and CA-NH4N03-EC
were characterized by conductivity-temperature studies and linear sweep voltammetry
(LSV). A systematic study on films and protonic batteries based on the highest
conductivity of chitosan-based solid polymer electrolyte (SPE) was carried out at room
temperature and elevated temperatures. Various characterization techniques, such as
open circuit voltage (OCV), discharge characteristic, current-voltage (I-V) and current
density-power density (J-P) characteristics, were conducted on the cells. In this chapter,
the fluctuation results of chitosan filrps and protonic batteries due to the influence of
heat treatment will be exhibited.
3.2 Conductivity-Temperature Study
In order to understand the conductivity mechanism of the chitosan-based systems, the
conductivity of the sam~les were measured at different temperatures. In its natural form
'"chitosan can exist in a a-helical or spiral coil form. Thus the neighbouring NHz group
could be closer to one another than if the chitosan occurs in a linear chain. At room
temperature, the C-N functional group in the samples is expected to vibrate accordingly
(Yahya and Arof, 2003). The C-N vibration could occur in such a way that the proton
ion (H+) which is datively bonded to the nitrogen atom may come in closer proximity
with another NHz group and get transferred to it. Therefore, the ease of the H+ ion to be
transferred along the NHz sites may depends on the activation energy (Ea) of the ionic
- 23 -
II
I.1!I.~

species. Hence, it is necessary to understand the conductivity-temperature relationship
at various temperatures.
3.2.1 Solid Polymer Electrolytes Characterization:CA-NH4N03
System
The films with a composition of CA-40 wt% NH4N03 has the lowest bulk resistance
(Rb) was achieved at the average of 55.0 n and the calculated surface contact was
around 20.1 n. From the Rb the specific conductivity of the polymer electrolyte was
calculated to be (8.38 ± 4.11) x 10-5 S em-I at the room temperature. The value was
almost similar to the previous research by Majid and Arof (2005) which gave an
electrical conductivity 2.53 x 10⁻⁵ S cm-l with 45 wt. % NH4N0
3.
Other electrical conductivity values, with the different amount of NH4N0
3were given
in Figure 3.1. It can be observed that the electrical conductivity increases sharply with
an addition of 10 wt. % of NH4N03 and it increases by an order of magnitude when a
10 wt. % to 40 wt. % of NH4N03 was added to the CA. In the preparation of the films,
100 ml of acetic acid solution was used to dissolve 1.0 g of chitosan. Different amounts
of NH4N03 were added to each solution. Hence, the volume of the host matrix (the
volume of acetylated chif6san) was the same for all the films. As more and more
NH4N03 were added, the host matrix becomes m ore crowded with the dopant ions.
Such overcrowding reduces the number of charge carriers due to the limitation of ionic
mobility (Mohamed et at., 1995). Thl1s, the conductivity decreases after 40 wt%,
- 24-

1.0E+00 --.-----------------------------,
1.0E-01 -
1.0E-02 -
1.0E-03 -
'"eu 1.0E-04-!!b
i 1.0E-05-
~::l
"CoU
1.0E-08
1.0E-09
70605040'3020101.0E-10 -I-----r------r-----r----....-----r------,..---~
o
Figure 3.1: Electrical condu9tivity versus NH4N03 concentrations in CA at room
temperature.
3.2.2 Solid Polymer Electrolytes Characterization:CA-NH4N03-EC SystemI
Figure 3.2 shows the variation of conductivity as a function of plasticizer content in a
CA-40 wt% NH4N03 system at room temperature. It can be observed that the highest
conductivity at room temperature was (9.93 ± 1.90) x 10-3 Scm-I, and achieved for the
film with 70 wt. % EC (CA40N70E). The value of Rb decreases at about 54.5 n and the
surface resistance was at 19.7 n when compared to the highest unplasticized film. An
addition of concentration of EC beyond 70 wt. % causes the poor mechanical strength.
Therefore, the amount of EC was maintained below 70 wt. % to ensure the acceptable
mechanical properties.
- 25 -

On addition of salt, the conductivity continues to increase by increasing the ion content
up to a certain amount. It can be inferred that the salt was responsible for the
conductance of the chitosan-based films. However the EC did not increased the ion
number, but the role of EC was to dissociate the salt thereby increasing the numbers of
mobile ions, which lead to conductivity enhancement (Osman et al., 200 I; Yahya and
Arof, 2003).
1.0E+00 ,------ _
1.0E-01
-'eI,) 1.0E-02-!!lb
~>..I,):::I~ 1.0E-03oo
8070605040
%EC
3010 20
1.0E-05 +----.....-..:.::"'---,-__-..,.. .--__....,.--__--.. .,--__-1
o
Figure 3.2: Electrical conductivity versus EC concentrations in CA-40 wt. % NH4N03
at room temperature.I,
- 26-

3.2.3 Temperature Dependence
The temperature dependence of conductivity for the chitosan-based SPE systems is
shown in Figure 3.3. T he plot shows that as temperature increases, the conductivity
increases. The conductivity-temperature relationship of chitosan-based SPE was
characterized as Arrhenius behavior, suggesting that the conductivity was thermally
assisted. The results also implies that the diffusion of H+ ions especially in the CA film
was liquid like and remains unchanged in the temperature range of298-393 K. The
conductivity of CA film was attributed to the conduction of H+ ions from acetic acid.
The H+ ions were able to detach themselves from the matrix and thus can hop from
complexation site to another during thermal agitation (Morni and Arof, 1999).
3.43.33.23.1
t···.'"
f
2.9 3.0
10001T (K·1)
•,
2.82.7
o CA40N
2.6
& CA40N20E
o CA40N70E
• CA
i::;;~ ;,;: :~:::: :~:::::~:::: ~!::.::: 1::::: i:::::: i::::::1::~...........~.. n T
·.. ··~····· .. f ..~1 .. I:.... !
···· ..1······.i
······1'.
-1
-2
J-3
-4
-...E -5ueb
-601.g
-7
-8
-9
-10
2.5
Figure 3.3: The temperature dependence of conductivity for chitosan-based polymer
electrolytes.
- 27-

Figure 3.4 shows the relationship of variation of Ea and cr at room temperature. The
highest conducting film (CA40N70E), gave the lowest Ea at 0.11 eV. It indicates that
when conductivity increases, the Ea for transferring H+ ions will be reduced. Table 3.1
shows the summarized results ofEa and cr for different samples at room temperature.
1.10 -,------------------------,.4.0&03
3.5&03
5.0&04
1.0&03
-...2.5&03 5
~Ii:
b2.0&03 ;5
'S;
~::I
1.5&03 'goo
·3.0&03 .
Sanple Name:1- CA2- CA40N3 - CA40N20E4· CA40N70E
0.20·
0.30·
1.00
0.90·
0.10 ·1-----()ooO:::::::::::::=-----r---_...--_-=====*- l 6.0&08
o 2 3 4 5
:> 0.80·
.!.w· 0.70~e'~ 0.60·wco~ 0.50.~1:$c( 0.40
Sample Name
I
Figure 3.4: Variation ofEaand cr at room temperature.
.,
- 28 -

Table 3.1: Variation ofEa and cr for sample CA, CA40N, CA40N20E and CA40N70E
at room temperature.
Activation Energy, Ea Conductivity,O'RT
Sample Sample Name (eV) (S em-I)
CA 0.98459 6.15E-08
2 CA40N 0.31801 2.00E-04
3 CA40N20E 0.14841 8.30E-04
4 CA40N70E 0.10988 3.48E-03
3.3 Linear Sweep Voltammetry
Figure 3.5 shows the LSV curves of the polymer electrolyte system of sample
CA40N70E. The current onsets of the sample were detected about 1.80, 1.75, 1.70, and
1.60 V at temperatures of 298, 313, 333, and 353 K, respectively. The current onset
was assumed to be the films breakdown voltage (Table 3.2). It can be observed that the
breakdown voltage red1uces when temperature increases from 298 to 353 K. Thus, this
voltages were high enoug1:l to allow safe use of chitosan-based SPE in fabrication of
protonic batteries, since the electrochemical window standard of protonic battery is
about - 1 V (Pratap et al., 2006).
.,
- 29-

1.2...-------- -,
1.0
-+-298K
-0-313 K
-.-333K--0-353 K
2.502.001.00 1.50
Voltage (V)
0.50
0.0 .. ......
0.00
0.2
_ 0.8·"IEI.l
1~ 0.6·cGICC~=u 0.4
Figure 3.5: LSV curves of sample CA40N70E at 298,313,333 and 353 K.
Table 3.2: Breakdown voltage of sample CA40N70E at various temperatures.
Temperafture (K)
298
313
Breakdown Voltage (V)
1.80
1.75
333 1.70
353 1.60
- 30-

Table 3.3: OCV of protonic batteries at high temperatures.
1.479
1.434
1.402
1.378
OCV (V)
- 31 -
298·
313
333
353
Temperature (K).
3.4 Open Circuit Voltage
The OCV characteristic of protonic batteries at 298-353 K is shown in Figure 3.6. It
can be observed that as the temperatures increase, the OCV become lower which was
of the same trend as for the results obtained by LSV. The highest OCV was 1.479 V at
room temperature (298 K). This phenomenon suggests that the electrode materials
possess considerable catalytic properties at low temperatures. The OCV of other
temperatures are shown in Table 3.3. From the results obtained, it can be concluded
that t he fabricated cells at 2 98, 313, and 3 33 K were reasonably stable in open cell
condition. However, at the highest temperature (353 K), continuously heating the cell
for a longer duration causes the deterioration of the cell especially SPE. The SPE was
obviously burned and destroyed after the OCV characterization. The significant voltage
drop can be seen after 33 hours, which was due to SPE unable to endure condition at
353 K.

1.8 -,----------------------------,
1.4
~ 1.2
1.6 ¢¢¢¢
1iII••iiQQQ•• ~~~a~~~22000000000000000oooooo0o00oooooooo
•............~illillli~~~···············.·.···· ..•• <><><><><><><><><><><><><><><><><><><><><><><>•• <>
••••••••••••••
GIDl
~ 1.0~~::3l:! 0.8Uc8.o 0.6
0.4 0 298 K
• 313 K
0.2 ¢ 333 K
• 353 K
0.00 5 10 15 20 25 30 35 40 45 50 55 60 65
'Time (hours)
Figure 3.6: OCV curves of protonic batteries at 298,313,333 and 353 K.
3.5 Discharge Characteristic
From Figure 3.7, the discharge time increases as the discharge current decreases.
Meanwhile the voltag~ drop during the initial discharge was higher when the discharge
current was increased. If depicted that the discharge capacity was lower at higher
discharge rates which was 21.0, 6.0 and 2.5 mAh at discharge current of 1.0~ 5.0 and
10.0 rnA, respectively. The summarized results are shown in Table 3.4. The reason for
the low discharge time at high current qischarge rate could be attributed to the ability of,
the cell to delivery its electrical energy. It showed that the cell in this work was more
suitable when a constant discharge current of 1.0 rnA was used. Due to low diffusion
rate ofH+ ions inside the SPE, the cells discharged at 5.0 and 10.0 rnA lasted only for a
few minutes.
- 32-

1.8.----------------------------,
14001200
_1.0 rnA
-0-5.0 rnA
-.-10.0 rnA
10008006004002000.0t=-----,----..----":'""""'"----.------..-----,-------l
o
0.6
0.4 -
0.2
1.6 -
~ 1.0QlCl
~~ 0.8
Time (minutes)
Figure 3.7: Discharge curves of protonic batteries using constant currents of 1.0,5.0
and 10.0 rnA at room temperature.
Table 3.4: Discharge properties ofprotonic batteries at different discharge current
! profiles at room temperature (298 K).
... .............._.............~ ...
Discharge Discharge' Discharge Discharge Nominal Specific
Current Time Capacity Capacity Voltage Energy
(rnA) (hours) (mAh) (C) (V) (mJ)
1 21.00 21.0 .,
5 1.20 6.0
10 0.25 2.5
- 33 -

Temperature dependence studies at 298,313,333, alld 353 K of the cells are presented
in Figure 3.8. At 298 K, it can be observed that the voltage of the cell drop immediately
before reaching a flat discharge plateau at 1.181 V. This phenomenon may be due to
the activation polarization. The activation polarization occurred because the rate of an
electrochemical reaction at an electrode surface was controlled by sluggish electrode
kinetics (Broadhead and Kuo, 2002). Whereas at temperatures 313 and 333 K, the drop
in voltage was smaller as temperature increased. At 333 K, the discharge time was
much longer which implies that the discharge capacity (42.7 mAh) was optimum. It can
be observed that the discharge capacity of the cell increases with temperature increase
until 333 K. This demonstrated that the cell performance was improved when the
temperature was increased. This was consistent with the results obtained from the
conductivity-temperature characteristics -of sample CA40N70E. Since the ionic
conductivity of the polymer electrolyte increases with temperature, more energetic ions
were available for conduction between two electrodes. Thus, the cell gives a higher
discharge capacity at elevated temperatures. Ani ncrease in the d iffusivity of t he H +
ions through the cell when temperature was increased would also contribute to this
improvement (Subban apd Arof, 2004). At 353 K, although the drop in voltage was
smaller at a flat discharge plateau at 1.368 V, the discharge was sustained only for 20.0
hours. It inferred that deterioration of the SPE has occurred at 353 K. When reaching an
optimum condition, which was after 333 K, the cell performance was obviously
degraded. Table 3.5 shows the calculated values of discharge capacity, nominal voltagei,
and specific energy.
- 34-
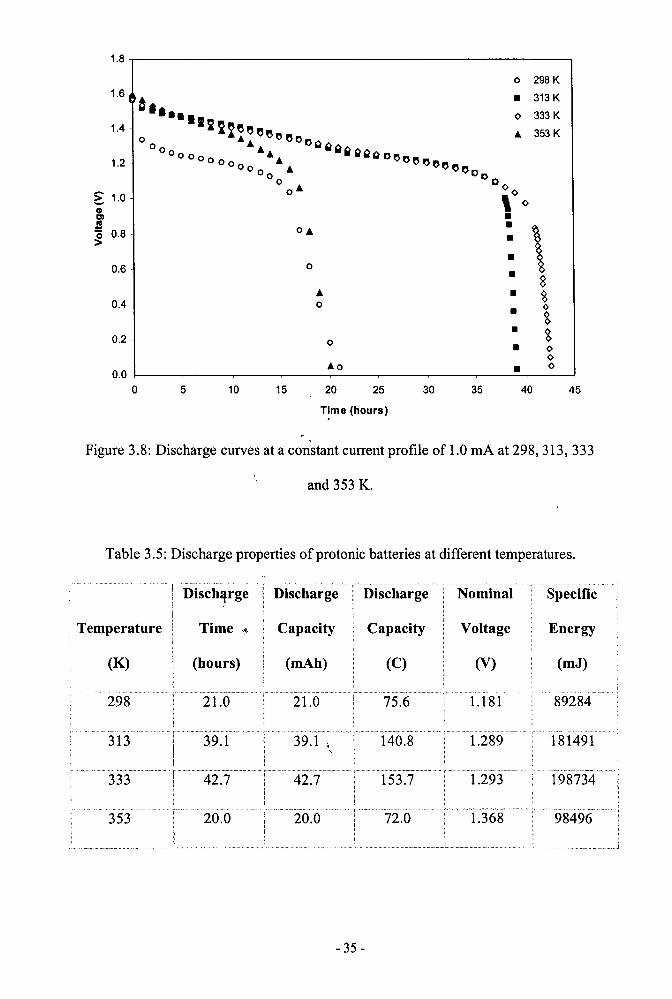
Figure 3.8: Discharge curves at a constant current profile of 1.0 rnA at 298,313,333
4540
o 298 K
• 313 Ko 333 K
.. 353 K
•••
••
35302520
"0o
Time (hours)
..o
o
15105
1.8
1.6
1.4
1.2
~ 1.0GlCl.fl"0 0.8>
0.6
0.4
0.2
0.00
and 353 K.
Table 3.5: Discharge properties ofprotonic batteries at different temperatures.
Disch~rge Discharge Discharge Nominal Specific
Temperature Time .,. Capacity Capacity Voltage Energy
(K) (hours) (mAh) (C) (V) (mJ)
298 21.0 75.6 1.181 89284
313 39.1 • 140.8 1.289 181491,
333 42.7 153.7 1.293 198734
353 20.0 72.0 1.368 98496
- 35 -

3.6 Current-Voltage Characteristic
Figure 3.9 and 3.10 show the plot of I-V an~ J-P curves for protonic batteries at
elevated temperatures. From the 1-V curves obtained, each curve shows a simple linear
form, which indicates that the polarization on the electrode was primarily dominated by
ohmic contribution (Li et a!., 2006). The resistance of the protonic batteries can be
calculated from the slope of1-V curves. The curves show that as temperature increases,
the internal resistance (r) of the cells decreases. The lowest r was 16.8 n at 333 K. At
353 K, the deterioration of the cell's materials occurs which implies that the interfacial
contact between the chitosan-based SPE and electrodes may be deteriorating. The
deterioration can be demonstrated by the enhancement of r value of 23.0 n. The r of
the cells was considered high, whereas the resistance of the SPE was less than - 3.0 n
in the temperature range investiga!ed.'The high r was attributable to the interfacial
resistance between SPE/electrodes. However, compared to the reports elsewhere
(Mohamed et al., 1995; Pratap et a!., 2006), the r from present work was considered
low. The summarized results are shown in Table 3.6.
The plot of the operat.lng J-P curves (Figure 3.10) suggests that the contact between
electrolyte/electrodes wat good. The maximum power density (Pmax) increases with
enhancement of temperatures. The summarized results are shown in Table 3.7. The
highest Pmax was achieved by the cell at 333 K, with Pmax of 14.6 mW cm-2 and a short-
circuit current density (Jsc) of 31.0 rnA pm-2• This demonstrates that heat treatment has
,
an adequate effect on cell performance which was in agreement with the results
obtained by conductivity-temperature and discharge characteristic. The effect c an be
explained by considering the interface resistance, or the adhesiveness of the polymer
electrolyte/electrode. At room temperature, the interfacial adhesion could be low thus
- 36-
Ii

giving rise to a high interfacial resistance and lower cell performance. The
adhesiveness of the electrolyte was improved by heat treatment as proved by the
conductivity-temperature studies. This leads to a decrease in interfacial resistance, an
enhancement in values of conductivity and consequently, raises the cell performances.
However, further increase in temperature, i.e. 353 K during long measurement
destroyed the natural properties chitosan-based SPE.
1.8 ....--- --.
1.6
1.4
1.2 .
~ 1.0IIICl
~~ 0.8·
0.6
0.4
0.2
-o-298K_313K
-+-333 K
-tr-353 K
90.080.070.060.040.0 50.0
Current (rnA)
30.0~20.010.00.0 +----.-........--.-----.-----..-----.---..----....----.----l
0.0
Figure 3.9: 1- V curves ofprotonic batteries at 298, 313, 333 and 353 K..
•,
- 37-
•

Table 3.6: Values r of protonic batteries at elevated temperatures.
Temperature (K) Internal Resistance, r (!l)
298 30.3
313 26.4.............. - - _ - - .- - .
333 16.8
353 23.0
16.0 .r-------- --,
35.0
-o-298K
_313K
-+-333K---lr-353 K
30.025.020.015.010.05.00.0 ...---..-------.-----.-----.-----.----....-----l
0.0
2.0
4.0
~
'Eu 10.0
~~ 8.0l!!GlC
~ 6.0·11.
12.0 .
14.0·
Current Density (rnA cm·2)
i,
Figure 3.10: J-P curves of protonic batteries at 298,313,333 and 353 K.
- 38 -
:
Jb
_

Table 3.7: A short-circuit current density, and the maximum power density ofprotonic
batteries at various temperatures.
Temperature (K) A Short-Circuit Current Maximum Power Density, Pmax
,i
~
298 K
313 K
333 K
353 K
Density, Jsc (rnA cm-z)
16.0
16.0
31.0
24.0
i,
- 39-
6.4
8.6
14.6
10.4
·1
j

CHAPTER 4 CONCLUSION AND SUGGESTIONS
The conductivity ofCA-NH4N03 was successfully increased from 10-5 Scm-I to 10-3 S
cm-Iemploying plasticization method using EC. In conductivity-temperature study, the
films of pure CA, CA-NH4N03 and CA-NH4N03-EC systems shows Arrhenius
behavior. The highest conducting sample (CA40N70E) possesses the lowest Ea
, 0.11
eV and the electrochemical stability window about 1.6 - 1.8 V. The OCV values
measured were in good agreement with those voltages obtained by the LSV technique.
The electrochemical characteristics of the cell have been studied at different
temperatures. During the heat treatment up to 333 K, the cells show good properties
such as enhancement of discharge capacities, Jse> and Pmax' At the same time the r of the
cells also decrease with the increase~n the heat treatment temperatures. At 333 K, the
discharge capacity, r, Pmax andJsc ~ere 42.7 mAh, 16.8 n, 14.6 mW cm-2 and 31.0 rnA
cm-2
, respectively. The failures of the cells mainly contributed to the degradation of the
chitosan film SPE.
;,
-40 -

REFERENCES
Ali, A.M.M., Mohamed, N.S., and Arof, A.K. (1998). Polyethylene oxide' (PEO)ammonium sulfate ((NH4)2S04) complexes and electrochemical cellperformance, Journal of Power Sources 74, pp 135-141.
Arof, A.K., Basirun, W.J., Kamarulzaman, N., and Osman, Z. (1999). ExperimentalTechniques in the Synthesis and Characterization of Materials for BatteryApplications, Publication of University Malaya, Kuala Lumpur.
Bozkurt, A., Meyer, W.H., and Wegner, G. (2003). PAA/imidazol-based protonconducting polymer electrolytes, Journal of Power Sources 123, pp 126-131.
Brady, G.S., Clauser, H.R., and Vaccari, J.A. (2002). Materials Handbook, 15 Edition,McGraw-Hill Companies, Inc., New York.
Broadhead, J., and Kuo, H.C. (2<:)02). Electrochemical Principles and Reactions, In:Handbook of Batteries, 3rd edition, Chapter 2, D. Linden and T.B. Reddy[editors], McGraw-Hill, New York.
Callister, W.D. (2000). Materials Science and Engineering: An Introduction, 5th edition,John Wiley & Sons, Inc, United States.
Chandra, S. (1981). ~uperionic Solids - Principles and Applications, North-HollandPublishing Company, Amsterdam, New York, Oxford.
Khiar, A .s.S., P uteh, R., a nd A rof, A.K. (2006). Conductivity studies 0 f a c hitosanbased polymer electrolyte, Physica B 373, pp 23-27.
Li, S., Sun, J., Sun, X., and Zhu, B. (2006). A High Functional Cathode Materials LaNio.4Feo.603 for Low-Temperature Solid Oxide Fuel Cells, Electrochemicaland Solid State Letters 9, pp A 86-A 87.
Linden, D. (2002). Basic Concepts, In: Handbook ofBatteries, 3rd edition, Chapter 1, D.Linden and T.B. Reddy [editors], McGraw-Hill, New York.
- 41 -

Majid, S.R, and Arof, AK. (2005). Proton-conducting polymer electrolyte films basedon chitosan-acetate complexed with NH4N03 salt, Physica B355, pp 78-82.
Majid, S.R., Idris, N.H., Hassan, M.F., Winie, T., Khiar, AS.A, and Arof, AX. (2005).Transport Studies on Filler-doped Chitosan Based Polymer Electrolytes, Ionic11, pp 451-455.
Maurya, K.K., Srivastava, N., Hashmi, S.A., and Chandra, S. (1992). Protonconducting polymer electrolyte: II polyethylene oxide + NH4I system.
Mohamed, N.S., and Arof, AK. (2004). Investigation of electrical and electrochemicalproperties of PVDF-based polymer electrolytes, Journal of Power Sources 132,pp 229-234.
Mohamed, N.S., Subban, R.H.Y., and Arof, AK. (1995). Polymer batteries fabricatedfrom lithium complexed acetylated chitosan, Journal of Power Sources 56, pp153-156.
Morni, N.M., and Arof, A.K. (1999).' Chitoson-lithium triflate electrolyte in secondarylithium cells, Journal ofPower Sources 77, pp 42-48.
NEC TOKIN Corporation. (2004). Proton polymer battery: The advantages of both abattery and a capacitor, http://www.nec-tokin.com/englishlproduct/protonpolymer/feature.html, 29 May 2007.
Osman, Z., Ibrahim, Z.~., and Arof, A.K. (2001). Conductivity enhancement due to iondissociation in plalticized chitosan based polymer electrolytes, CarbohydratePolymers 44, pp167-173.
Pratap, R, Singh, B., and Chandra, S. (2006). Polymeric rechargeable solid-state protonbattery, Journal of Power Sources 161, pp 702-706.
i,Scarr, RF., Hunter, lC., and Slezak, PJ. (2002). Alkaline-Manganese Dioxide
Batteries, In: Handbook ofBatteries, 3rd edition, Chapter 10, D. Linden and T.B.Reddy [editors], McGraw-Hill, New York.
Song, lY., Wang, Y.Y., and Wan, C.C. (1999). Review of gel-type polymerelectrolytes for lithium-ion batteries, Journal of Power Sources 77, pp 183-197.
- 42-

Subban, R.H.Y., and Arof, A.K. (2004). Charge-discharge characteristics ofLiCo02/mesocarbon microbeads battery with poly(vinyl chloride)-basedcomposite polymer electrolyte, Journal of Power Sources 134, pp 211-221.
Vargas, M.A., Vargas, R.A., and Mellander, B.E. (2000). More studies on thePVA1+H3P02+H20 proton conductor gels, Electrochimica Acta 45, pp 1399-1403.
Winie, T., and Arof, A.K. (2006). Transport properties of hexanoyl chitosan-based gelelectrolyte, Ionies 12, pp 149-152.
Yahya, M.Z.A., and Arof, A.K. (2003). Effect of oleic acid plasticizer on chitosanlithium acetate solid polymer electrolytes, European Polymer Journal· 39, pp897-902.
i,
- 43 -