Copyright © NASSCOM 2008 HOW IS THE INDIAN IT-BPO INDUSTRY FACING THE CURRENT GLOBAL UNCERTAINTIES...
28
Copyright © NASSCOM 2008 HOW IS THE INDIAN IT-BPO INDUSTRY FACING THE CURRENT GLOBAL UNCERTAINTIES ? Ameet Nivsarkar, Vice President, NASSCOM October, 2008
-
Upload
marylou-dawson -
Category
Documents
-
view
216 -
download
1
Transcript of Copyright © NASSCOM 2008 HOW IS THE INDIAN IT-BPO INDUSTRY FACING THE CURRENT GLOBAL UNCERTAINTIES...

Copyright © NASSCOM 2008
HOW IS THE INDIAN IT-BPO INDUSTRY FACING THE CURRENT GLOBAL UNCERTAINTIES ?
Ameet Nivsarkar, Vice President, NASSCOMOctober, 2008

Copyright © NASSCOM 2008
About NASSCOM
2
NASSCOM is the apex body for the IT-BPO sector in India and plays a leading role in the areas of trade development, policy
advocacy and research
Over 1200 members including 250 global companies
Membership accounts for over 90% of exports and a majority of the 2 million professionals employed in the sector
Trade Development
Assisting members explore new markets and business opportunities
Facilitating effective trade development at national and international forums
Nurturing the growth of the small and medium enterprises
Policy Advocacy
Active proponent of global free trade, proactively engaging with policy makers, government and other influencers to
provide guidance and informational support
Committed to encouraging its members to adopt world class management practices, build and uphold highest standards
in quality, security and innovation
Research and Thought-leadership
Acknowledged as the primary source of information about Indian IT-BPO
Prominent role in voicing developmental challenges and devising their solutions – not just for the sector but the country at
large
NASSCOM’s Charter: To build India as the 21st century’s technology powerhouse and establish India as the global sourcing hub for IT-BPO services and software

Copyright © NASSCOM 2008
Current Global Uncertainties
Signs of US Slowdown post sub-prime and wall street
crisis; impact on other economies
Economic instability
Oil crisis, food prices, inflation, unstable currencies,
volatility in stock markets etc.
Concerns over US election; forthcoming Indian
elections
Constraints within India on talent, infrastructure etc.
3

Copyright © NASSCOM 2008
Positive growth in FY08 under clouds of uncertainty
4
FY04 FY05 FY06 FY07 FY08
21.6
28.5
37.4
48.1
64.03.6%4.1%
4.7%5.2% 5.5%
32%
31%
29%
28%*
US$ billion, percentage
Indian IT-BPO SectorRevenue Aggregate and Share of GDP
Exports
Domestic
Percentage of GDP
• Sustained export growth – revalidates strong fundamentals
• Revenue aggregate as a percentage of GDP continues to rise
Source: NASSCOM
* Domestic Revenue Adjusted for Currency

Copyright © NASSCOM 2008
0.5
4.9
8.4
18.0
0.5
6.4
10.9
23.1
Hardware
Product Dev and Engg Services
BPO
IT Services
FY2008
FY2007
All segments grew well in FY 08
5
100% = US$ 64 billion
DomesticMarket
Exports 62-66%
34-38%
*Includes product development and engineering ** Negligible
12%
18%
70%
40%
27.5%
32%
28%
Sourcing model
BPO
IT*
Global CaptivesGlobal Providers
Indian Providers
**
29%
30%
28%
Source: NASSCOM Source: NASSCOM
YOY growth

Copyright © NASSCOM 2008
Growth continued in Q1
6
June 07 Sep 07 Dec 07 Mar 08 Jun 08400
600
800
1000
1200
1400
1600
Revenues
TCSInfosysWiproSatyam
Reve
nues
Diversification driving revenue momentum• Europe, Middle east, APAC• Manufacturing, retail, healthcare• BPO, testing
USD Mn.

Copyright © NASSCOM 2008
61%
18%
12%
6%
2%
Geographical spread diversified
7
US
UK
Continental Europe1
APAC2
ROW
100% = US$ 31.4 billion*
30%
US
UKContinental
Europe
APAC
43%
>55%
36%
Percentage
FY2007
CAGR FY2004-07FY2007FY2004
Indian IT-BPO Exports grew at a CAGR of 35% over FY2004-07
• Excludes hardware exports1 Top 3 countries include Germany (~2.5%), Netherlands (~2%), Switzerland (~1%) 2 Top 3 countries include Australia (~1.5%), Japan (~1.5%), and Singapore (~1.3%)
Europe, APAC and Middle East markets growing rapidly
Source: NASSCOM

Copyright © NASSCOM 2008
• Banking, Financial Services, Insurance and Hi-tech / Telecom account for nearly 60% of Indian IT-BPO exports
• Manufacturing and retail are other large sectors
• Airlines, media, healthcare and utilities are some emerging high-growth sectors
New verticals reduce dependency
8
FY2007
* Excludes hardware exports
Vertical market exposure for industry exports is well balanced across several mature and emerging sectors
BFSI40%
Hi-tech / Telecom19%
Manufacturing15%
Retail8%
Media, Publishing and Entertainment
3%
Construction and Utilities4%
Healthcare3%
Airlines and Transportation
3%Other
5%
Source: NASSCOM
Copyright © NASSCOM 2008
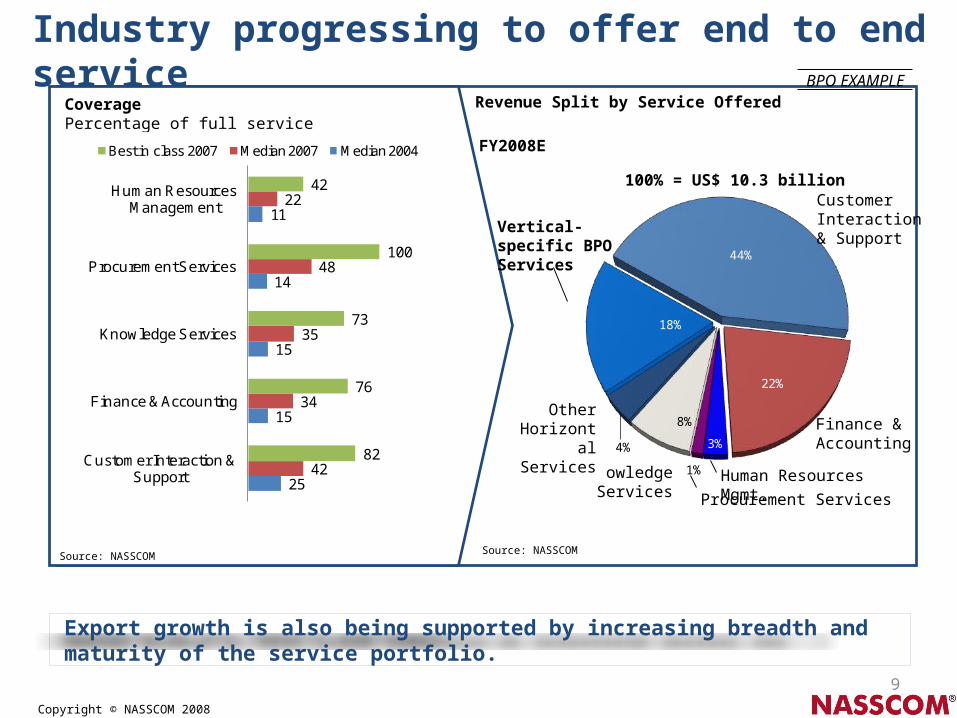
Industry progressing to offer end to end service
9
CoveragePercentage of full service
Revenue Split by Service Offered
FY2008E
Export growth is also being supported by increasing breadth and maturity of the service portfolio.
44%
22%
3%
1%
8%
4%
18%
Customer Interaction & Support
Finance & Accounting
Human Resources Mgmt.
Procurement Services
Knowledge Services
Other Horizontal
Services
Vertical-specific BPO Services
100% = US$ 10.3 billion
BPO EXAMPLE
25
15
15
14
11
42
34
35
48
22
82
76
73
100
42
Customer Interaction & Support
Finance & Accounting
Knowledge Services
Procurement Services
Human Resources Management
Best in class 2007 Median 2007 Median 2004
Source: NASSCOMSource: NASSCOM

FY09 outlook: Software and services revenue to grow by 21-24%; exports to reach $50bn
• FY09 software and services growth forecast 21-24% (USD)
• Recent reversal in INR appreciation trends provides an extra cushion, if sustained it will contribute to higher INR growth
• Increased focus on cost and productivity in the recessionary environment is likely to fuel demand for offshore services
• Domestic story remains strong, though sustained inflation may be a medium-term risk
10
$39.6
Source: NASSCOM
$62-64
$52.0
Figures may vary slightly due to rounding off
USD Billion
INR/USD 44.9 40.2 43
Growth of 21-24%(Currency Adjusted)

Copyright © NASSCOM 2008
Key drivers of growth in FY 09
11
The Indian IT-BPO industry is actively building on its leadership position to deliver beyond cost benefits to global buyers
0
20
40
60
80
100
2004 2007
Key benefits driving companies to offshore
Pe
rce
nta
ge
of
resp
on
ses
Cost Savings
Process redesign
Speed to market
Access to Skills
Source: Duke Offshoring Research Network (ORN)
Global delivery model
Innovation
Process maturity
• Expansion of delivery network to include nearshore and onshore centres
• Provision of 24x7 services
• End-to-end process delivery capabilities
• Active service-level improvement
• Process reengineering expertise
• Service innovation e.g., customization for new markets
• Active IP creation – increased filing of patents
Key value-add initiatives

Copyright © NASSCOM 2008
1.1
1.6
5.5
8.0
1.6
2.2
7.9
11.5
BPO
Software
IT Services
Hardware
FY2008EFY2007
Domestic Market continues to show traction
12
DomesticMarket
Exports 62-66%
34-38%
Domestic market is gaining momentum, driven by overall economic growth, increased adoption of technology and outsourcing
100% = US$ 64 billion
• Rapid economic growth
• Increased consumption of goods and services
• Growth in tech-related spends by enterprises
• Internet connectivity
Source: NASSCOM
44%
38%
43%
44% 29%
23%
29%
30%
USD INR
Growth in*
* Difference between growth in USD and INR due to impact of forex changes (INR appreciation)

Copyright © NASSCOM 2008
Tightening the belt
Wake up call 10 months ago when USD touched Rs. 39
Focus on productivity, efficiency, resource utilization
Wage moderation, reduced lateral hiring, reduced attrition
More efficient asset utilization – real estate, IT etc
Expansion into tier 2/3 cities
Domestic market and new markets
These improvements will have lasting impact over
years!
13
Copyright © NASSCOM 2008
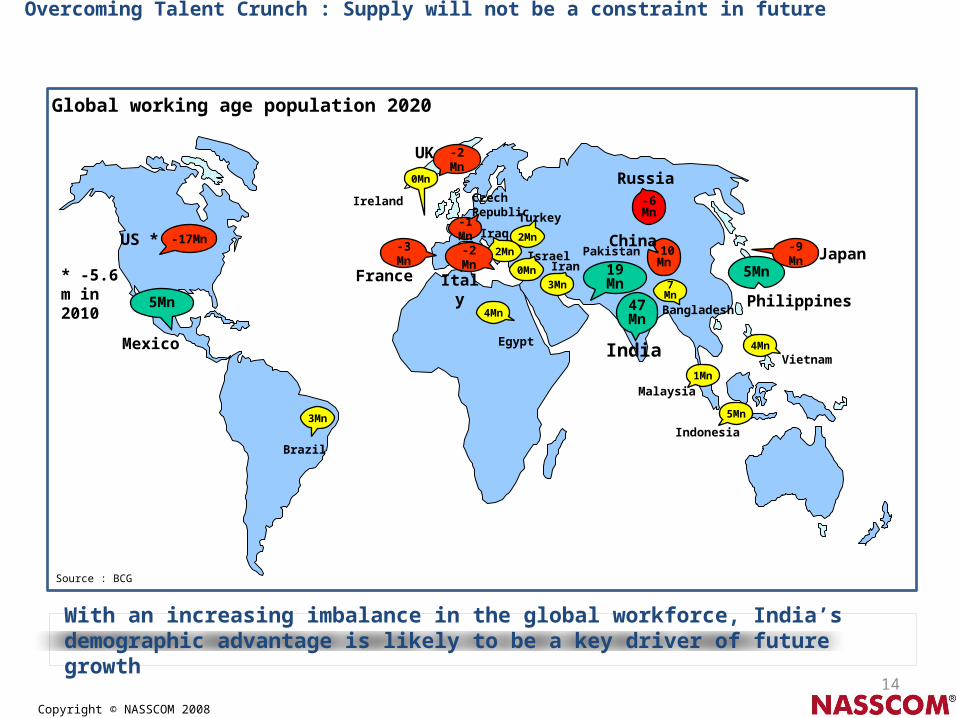
Overcoming Talent Crunch : Supply will not be a constraint in future
14
Source : BCG
47Mn
19Mn 7
Mn
3Mn
5Mn3Mn
India
Bangladesh
PakistanIran
Brazil
Mexico
Philippines
5Mn
4MnVietnam
2Mn
Turkey
-10Mn
China
-6Mn
Russia
5Mn
Indonesia
1Mn
Malaysia
0Mn
Ireland
Israel0Mn
Iraq
2Mn
-1Mn
CzechRepublic
4Mn
Egypt
-17MnUS *
-2 MnUK
-2 Mn
Italy
-3 Mn
France
-9 Mn Japan* -5.6 m in 2010
Global working age population 2020
With an increasing imbalance in the global workforce, India’s demographic advantage is likely to be a key driver of future growth

Copyright © NASSCOM 2008
Cost Competitiveness is sustainable
15
Despite cost increases, India continues to leverage its cost structure to deliver a compelling cost advantage. Additionally, India’s long-term cost advantage is likely to remain robust.
Loaded Costs per IT FTE p.a.2007, US$ ‘000s
Source: Everest, NASSCOM
2007 2008 2009 2010 2011 2012 2013 2014 2015
India @ 28K
US @ 100K
~67
%
~60
%
~53
%
~72
%
Cost Saving
Projected cost comparison, 2007-2015 US$
CAGR increases
@ 3%
Wage @ 15% Other @ 5%
Wage @ 10% Other @ 5%
Wage @ 5% Other @ 5%
Source: NASSCOM estimates

Copyright © NASSCOM 2008
Comprehensive Plan for making India’s large talent base “employable”
16
Recognizing this imperative, the industry is proactively working on several initiatives to strengthen India’s long-term cost advantage
Short Term
Medium Term
Long Term
• Enhance overall yield• Improve employability• Expand to tier 2
locations• Lower skill dependence
Objectives Initiatives
• Industry to enhance investments in training • Entry-level assessment for BPO and IT,
finishing schools : Through NAC, NAC-Tech• New locations identified; govt’s engaged
• Lower training investment
• Enhance specialist and project management expertise
• Add education capacity• Promote education
reform
• Faculty Development Program: to increase the suitability of teachers
• Facilitating industry access to specialist programs offered by independent agencies
• Expansion of higher-education infrastructure: government to set-up 20 new IIITs
• Program to increase PhDs in technology• NASSCOM VC fund focused on technology
innovation

Copyright © NASSCOM 2008
Information Security & Risk Management
Standards
Physical security
Personnel security
• Compliance with global standards e.g., ISO 27001, CoBIT
• Contractual safeguards, robust BCP/DR planning
Network security
Laws
• Secure design, documentation & implementation of network e.g., firewall, antivirus encryption
• Isolation of sensitive areas• Access control systems e.g., CCTV
surveillance, security guards
• Background checks• Non-disclosure agreements
• Compliance with international laws• Strengthening of Indian legal system
• Maximum ISO 27001 certifications obtained globally
• Data Security Council of India formed
• Documented security policies covering use of information, mobile computing, user access
• Robust and uniform best practices
• National Skills registry (NSR) to facilitate personnel background checks
• Cyber security training and awareness
• Amendments to strengthen the IT Act 2000 and Indian Penal Code being enacted
Objectives Initiatives/Impact
The NASSCOM 4 E model for trusted sourcing – Engagement, Education, Enactment and Enforcement is being proliferated.
17

Copyright © NASSCOM 2008
43 tier 2/3 Delivery locations identified
18
Bangalore 36%
Mumbai, Pune
15%
Chennai 15%
New Delhi, Noida, Gurgaon
17%
Hyderabad 14%
The industry is well spread across multiple locations. Tier 2/3 cities emerging
Others 3%
Source: NASSCOM
Leader Cities
New Emerging Cities
• 7 centers account for over 95% of exports• 43 tier 2/3 cities emerging; will reduce
pressure on these centers• On an average, costs in tier 2/3 cities is
28% less than leader cities• By 2018, it is forecasted that 40% of IT-
BPO exports will originate from non-leader locations
Employment Distribution Amongst Location Categories (‘000s)
1,996
8,0742
Non-Leader
Leader1
CAGR
40%
60%
34%
10%
>18X
>2.5X
Note: 1. Leader locations are Bangalore, Chennai, Hyderabad, Kolkata, Mumbai, NCR (Delhi, Noida, Gurgaon, Faridabad), Pune 2. Assuming a conservative growth in employment at 15% CAGR over next decade

Copyright © NASSCOM 2008
Key Messages
Nuclear deal has improved US and Global confidence about
India and has helped remove some uncertainty
However, WTO stance has not helped global perception
Security instances also cause for concern
Diversification is working well for Indian IT-BPO companies India’s value proposition is sustainable Operational efficiencies will have a lasting effect
The next 2-3 Quarters may be challenging, but the long term growth path is intact
19
Copyright © NASSCOM 2008
Trade development activities

Copyright © NASSCOM 2008
Intensity Map
Outreach Community Catalyst •US
• H-1 B • Anti outsourcing • Totalization • Image management • Messaging • Think tanks • Analysts • PR • Security
•UK• Immigration • Trade • Security
•EU • Blue card • Think tanks • Security
•Various agencies worldwide
•Increased relations with Embassies & trade missions
•Indian embassies overseas
•Associations
•Inward delegations •Outward delegations
•Overseas councils / chapters / forums
•Country desk •Website
•Customer and analyst meets
•Global competition
•New market development
•WTO •FTAs
•Government support • MEA • MOIA • Commerce

Copyright © NASSCOM 2008
Country Focus
Market Focus Partner Focus Competition Watch•US •UK •EU
• France • Germany • Netherlands • Spain • Italy
•Scandinavia• Finland • Norway • Sweden
•Ireland •Switzerland •APAC
• Australia • Japan • Korea
•South Africa
•APAC• Malaysia • Philippines • Vietnam
•Eastern Europe• Hungary • Romania • Poland • Czech Republic
•Latin America• Brazil • Mexico
•Egypt
•China

Copyright © NASSCOM 2008
Key observations - US• H-1 B issue
– Strong emotions– Resolution unlikely in the medium term– White paper completed and widely circulated
• Permanent visas– Good support across the board– 3 key bills on table– Will reduce H-1 B pressure
• Totalisation– Progress being seen
• WTO and Trade – India’s role
• Image– Very strong perception across board that Indian companies are misusing the system
• Providing cheap labour • Not taking enough efforts to recruit locally
– Lack of understanding on the role Indian companies play, “job shop” image exists.– Perception that Indian companies are gaming the system, law being followed but not in
spirit and original intent – Rapid improvement required
Copyright © NASSCOM 2008
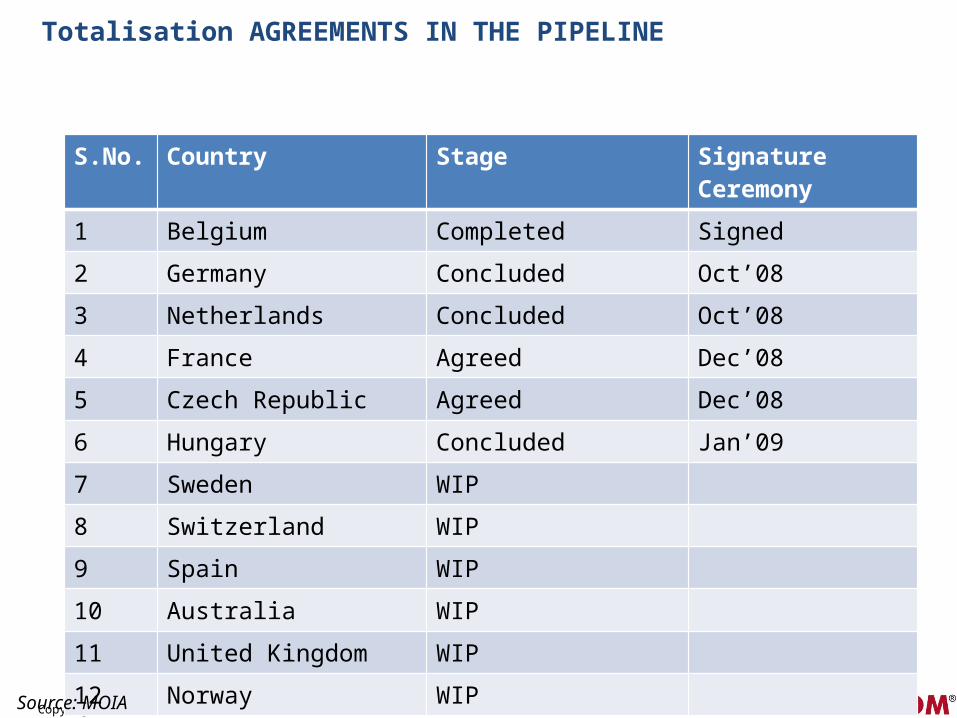
Totalisation AGREEMENTS IN THE PIPELINE
S.No. Country Stage Signature Ceremony
1 Belgium Completed Signed
2 Germany Concluded Oct’08
3 Netherlands Concluded Oct’08
4 France Agreed Dec’08
5 Czech Republic Agreed Dec’08
6 Hungary Concluded Jan’09
7 Sweden WIP
8 Switzerland WIP
9 Spain WIP
10 Australia WIP
11 United Kingdom WIP
12 Norway WIP
Source: MOIA

Copyright © NASSCOM 2008
Key observations - UK
• India is seen as a partner, second largest investor in the UK
• In excess of 50% of ICTs and Work Permits are Indian companies
• NASSCOM, considered an ally by the Govt• New PBS system goes live from Nov 24, 2008• Onus and thus responsibility lies on the
employer

Introduction of PBS• Comprehensive paper circulated• New system goes live on 24th Nov’08 • Onus of registration and issue of work permit is on employers
Employer files application for license with home office,UKBA
Submits all necessary documents to home office
Home office inspects & processes application (5-6
weeks) and assigns rank as A or B
Employer Obtains Licence to Sponsor
Employer does necessary background checks for employee
Qualifies/Allots him rating per PBS. (min 60 points needed for
qualification)
Logs on to online sponsorship management system &
generates certificate numberSends reference number (valid for 3 months) to the employee
Employer obtaining license to sponsor migrants in UK
Employer obtaining license to sponsor migrants in UK
Qualifying employee on PBS & generating sponsorship certificate
Qualifying employee on PBS & generating sponsorship certificate
Work permit issued to the employee with permission to enter
Work permit issued to the employee with permission to enter
1
2
3

Copyright © NASSCOM 2008
New Markets
• Focusing on markets other than the US and UK for industry growth– Combination of Research, outreach and policy level interaction with key markets
• Countries identified– Japan– Nordic - Scandinavian countries (Denmark, Sweden, Finland, Norway) – Benelux (Belgium, Netherlands, Luxemburg)– German speaking countries in the EU – France– Middle East (Oman, Saudi Arabia, UAE, Bahrain, Kuwait)
• The first activity initiated is on Japan – Visit completed, meeting concerned stakeholders– Action items identified– Research report along with PWC being released titled – “How to crack the Japanese
maze”, covering –
• Current state of Japanese marketplace • Opportunities that Japan offers for Indian IT industry• Obstacles which make it a difficult market for industry• Key winning strategies • Competitive overview

Copyright © NASSCOM 2008
Thank You !
28