Copyright © Cem
47
Copyright © Cem Kaner Cem Kaner, J.D., Ph.D. Florida Institute of Technology STAR East May 2011 1
Transcript of Copyright © Cem
Copyright © Cem Kaner
Cem Kaner, J.D., Ph.D. Florida Institute of Technology
STAR East May 2011
1
Copyright © Cem Kaner
Over the past couple of years, the airwaves have been flooded with commercials for investment-support software. Do your research with us, they promise, and you can make lots and lots of money in the stock market. How should we test such a product? These products provide several capabilities: For example, they probably evaluate (estimate the value or direction of change of value) of the market as a whole or of individual stocks, and they provide trading strategies that tell you whether to buy, hold or sell a stock. Most stock purchases and sales are fully automated—the trading programs buy and sell stocks based on their strategies. Every valuation rule and every strategy is a feature. We can test the implementation of these, but the greater risks lie in the accuracy of the models. If you execute the wrong trades perfectly, you reliably lose money. That’s not a happy-making feature. Cem Kaner reports on work he’s been doing in this area for the last three years, presenting this as a case study of exploratory, high-volume test automation, done for the purpose of validation rather than verification.
2
Copyright © Cem Kaner
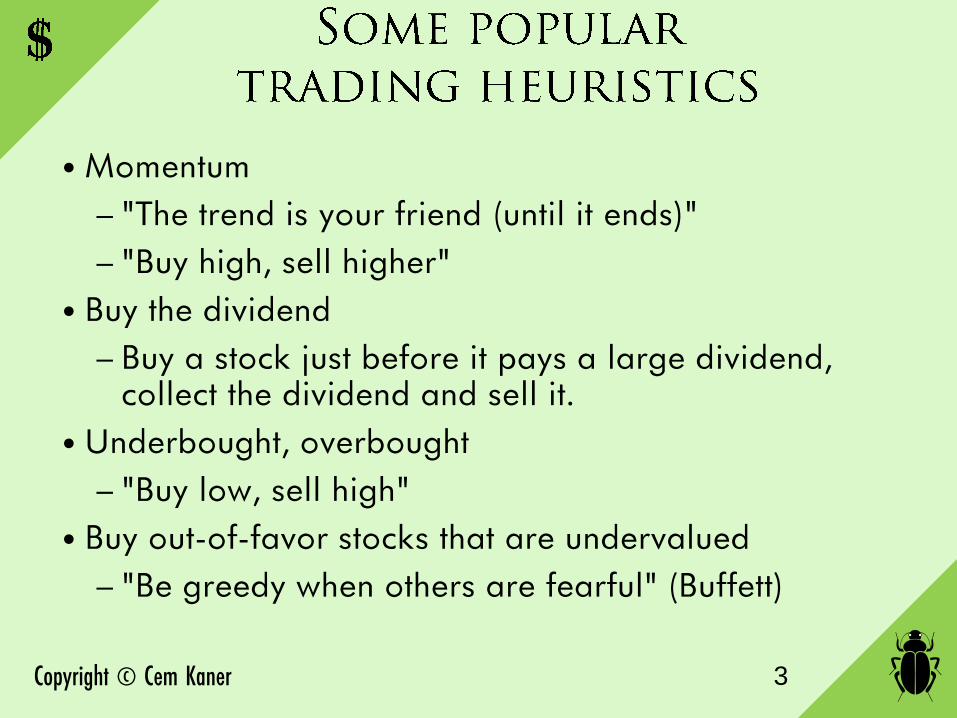
• Momentum – "The trend is your friend (until it ends)" – "Buy high, sell higher"
• Buy the dividend – Buy a stock just before it pays a large dividend,
collect the dividend and sell it. • Underbought, overbought
– "Buy low, sell high" • Buy out-of-favor stocks that are undervalued
– "Be greedy when others are fearful" (Buffett)
3

Copyright © Cem Kaner
A heuristic … turns into a strategy
when people start relying on it for investing … turns into a feature
when it is incorporated into a program that people use to decide whether to buy or sell stocks
Once it becomes a feature, testers should test it.
… but how?
4

Copyright © Cem Kaner
• I took control of my retirement savings in November 2008
• VectorVest was the first research service to attract my attention
• Today's comments are critical, but I enjoyed my interactions with VectorVest's staff, they have a good record with the Better Business Bureau (http://www.bbb.org/akron/business-reviews/investment-advisory-service/vector-vest-in-akron-oh-38000968) and I believe their product offers significant benefits, especially in the accessibility of its highly detailed historical fundamentals data.
5
Their product tour http://www.vectorvest.com/freemovies/demo/vectorvestproducttour/vectorvestproducttour.html
Copyright © Cem Kaner
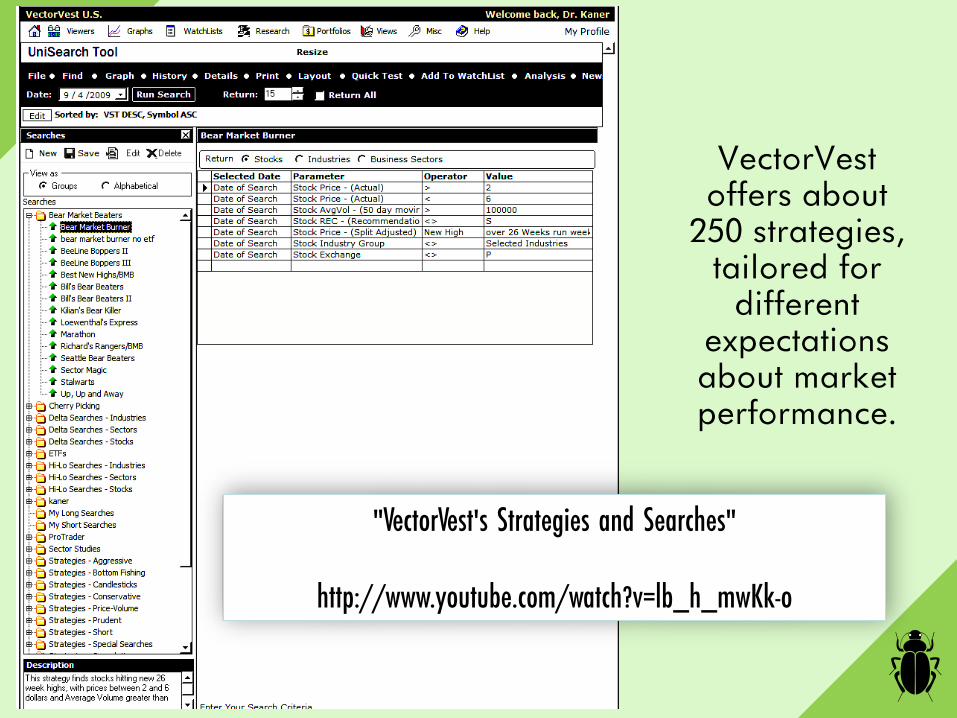
VectorVest offers about
250 strategies, tailored for
different expectations about market performance.
"VectorVest's Strategies and Searches"
http://www.youtube.com/watch?v=lb_h_mwKk-o
Copyright © Cem Kaner
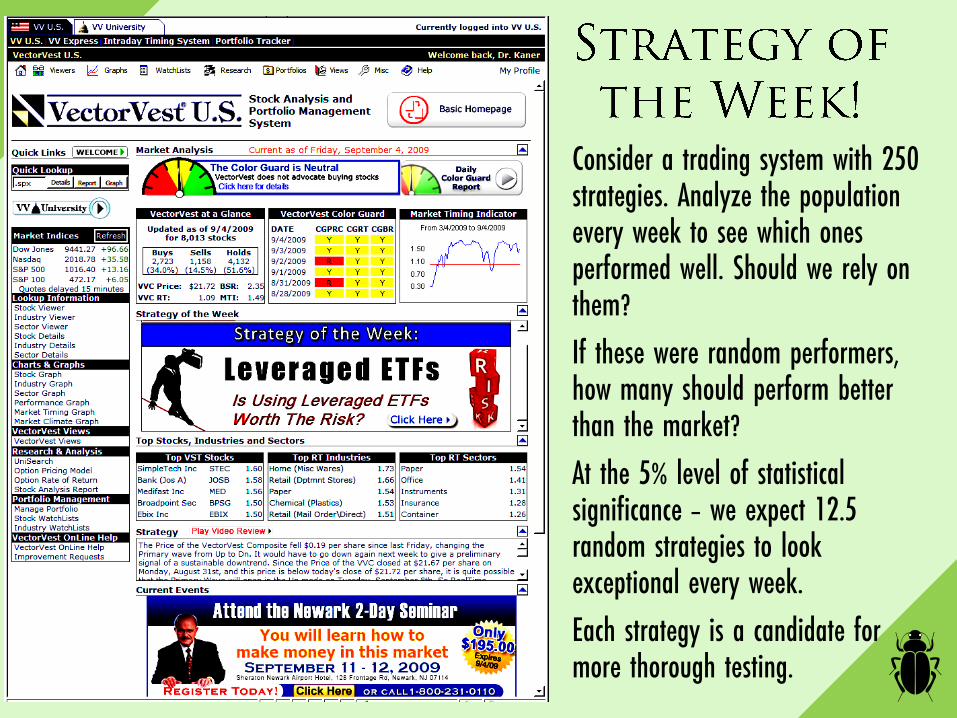
Consider a trading system with 250 strategies. Analyze the population every week to see which ones performed well. Should we rely on them?
If these were random performers, how many should perform better than the market?
At the 5% level of statistical significance – we expect 12.5 random strategies to look exceptional every week.
Each strategy is a candidate for more thorough testing.
Copyright © Cem Kaner
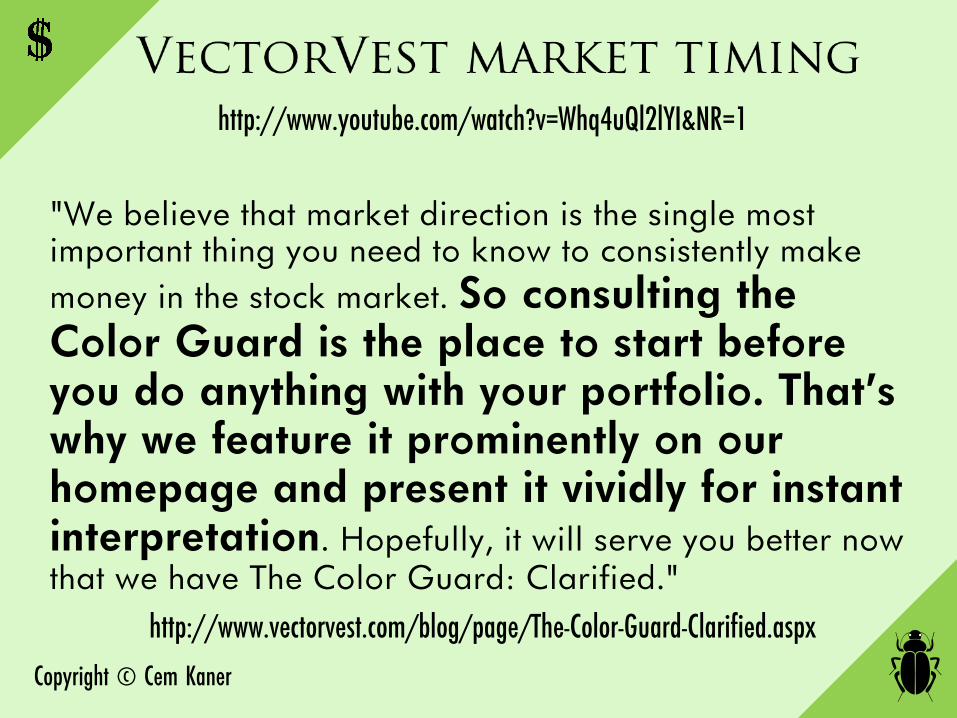
http://www.youtube.com/watch?v=Whq4uQl2lYI&NR=1
"We believe that market direction is the single most important thing you need to know to consistently make money in the stock market. So consulting the Color Guard is the place to start before you do anything with your portfolio. That's why we feature it prominently on our homepage and present it vividly for instant interpretation. Hopefully, it will serve you better now that we have The Color Guard: Clarified."
http://www.vectorvest.com/blog/page/The-Color-Guard-Clarified.aspx
Copyright © Cem Kaner
Copyright © Cem Kaner
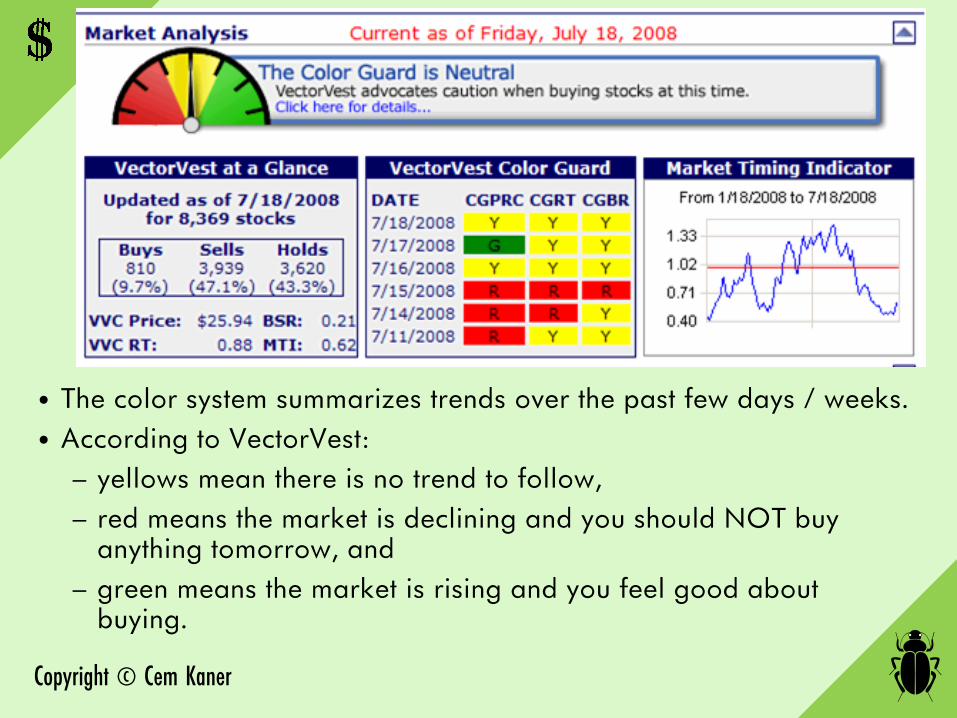
• The color system summarizes trends over the past few days / weeks. • According to VectorVest:
– yellows mean there is no trend to follow, – red means the market is declining and you should NOT buy
anything tomorrow, and – green means the market is rising and you feel good about
buying.
Copyright © Cem Kaner
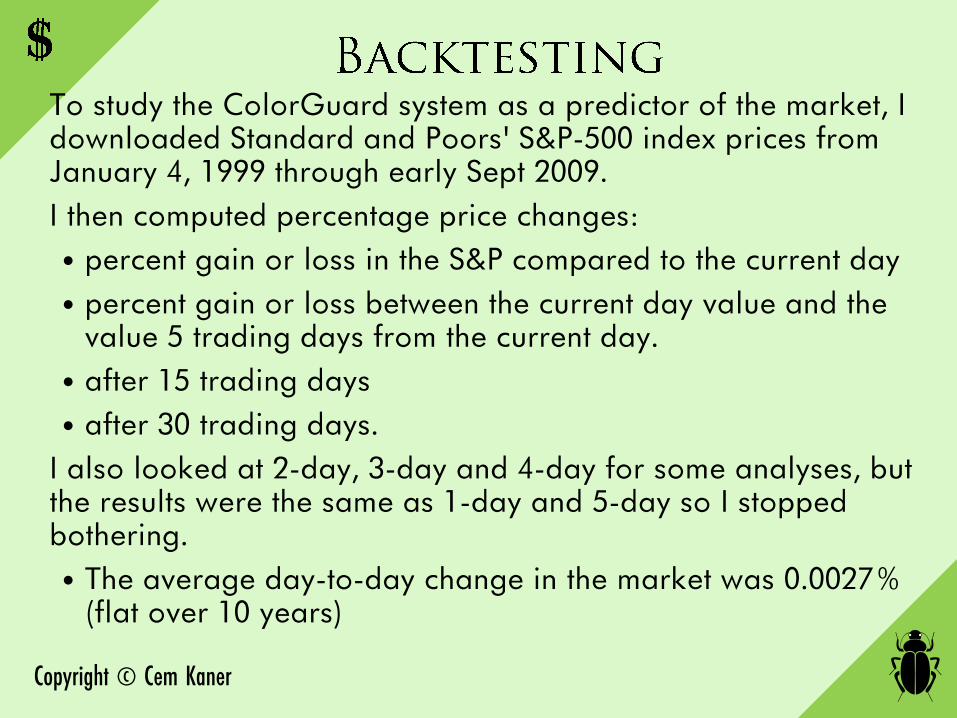
To study the ColorGuard system as a predictor of the market, I downloaded Standard and Poors' S&P-500 index prices from January 4, 1999 through early Sept 2009. I then computed percentage price changes: • percent gain or loss in the S&P compared to the current day • percent gain or loss between the current day value and the
value 5 trading days from the current day. • after 15 trading days • after 30 trading days.
I also looked at 2-day, 3-day and 4-day for some analyses, but the results were the same as 1-day and 5-day so I stopped bothering. • The average day-to-day change in the market was 0.0027%
(flat over 10 years)
Copyright © Cem Kaner
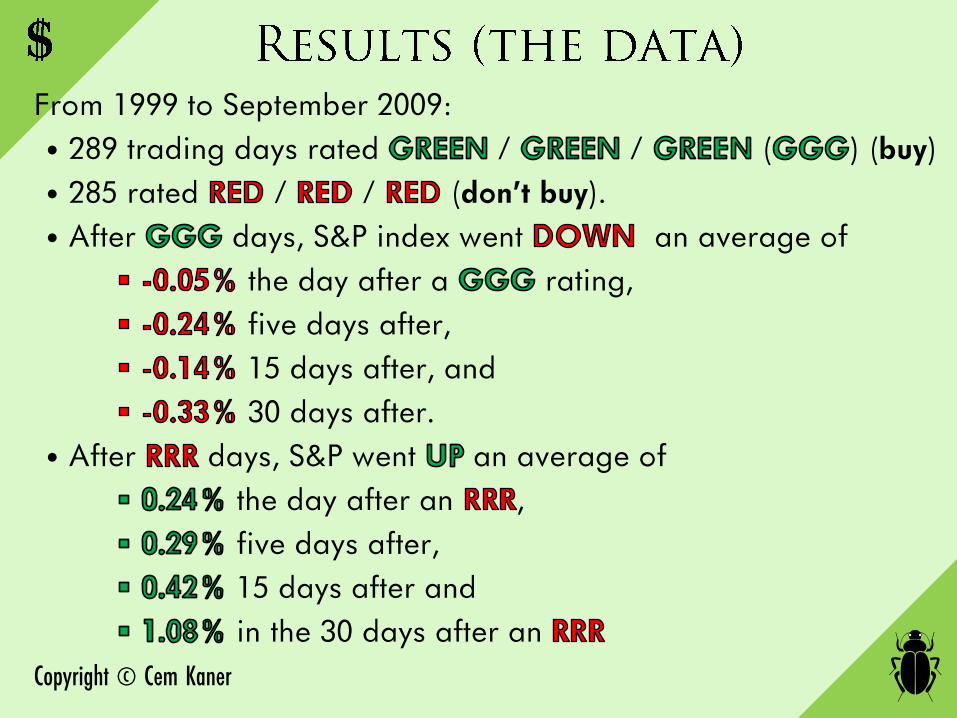
From 1999 to September 2009: • 289 trading days rated / / ( ) (buy) • 285 rated / / (don't buy). • After days, S&P index went an average of
the day after a rating, five days after, 15 days after, and 30 days after.
• After days, S&P went an average of the day after an , five days after, 15 days after and in the 30 days after an

Copyright © Cem Kaner
-0.4
-0.2
0
0.2
0.4
0.6
0.8
1
1.2
15
1530A
vera
ge p
rofi
t p
er
trad
e (
in %
)
Sell N days after purchase
Buy on GREEN day Buy on RED day
Copyright © Cem Kaner
Buy a stock when it hits its 52-week high
14

Copyright © Cem Kaner
There is some evidence that stocks bought at a 52-week high are likely to be higher 6 months later. • The 52-Week High and Momentum Investing
Thomas. J. George & Chuan-Yang Hwang http://www.bauer.uh.edu/TGeorge/papers/gh4-paper.pdf
• Is the 52-week high momentum strategy profitable outside the US? Ben R. Marshall & Rachael M. Cahan http://www.ingentaconnect.com/content/routledg/rafe/2005/00000015/00000018/art00002
• 52 Week High and Momentum Investing: A Partial Replication of George and Hwang's Results Bill Jannen & Vincent Pham http://kanecap.com/doc/williams/econ18/2009/Jannen_Pham_Econ18_2009.pdf
15
Copyright © Cem Kaner
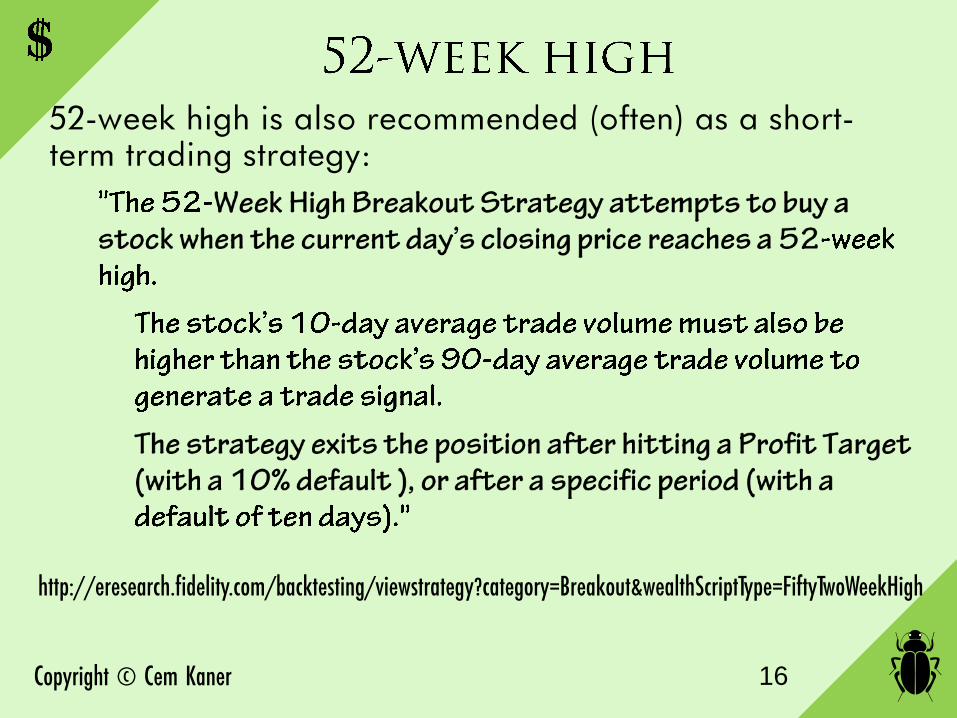
52-week high is also recommended (often) as a short-term trading strategy:
16
http://eresearch.fidelity.com/backtesting/viewstrategy?category=Breakout&wealthScriptType=FiftyTwoWeekHigh

Copyright © Cem Kaner
I found similar ideas on VectorVest, Zachs, TD Ameritrade, and several other investment sites. How can we test this? • A strategy tells us
– When to buy, – How much to buy, – When to sell.
• In backtesting, we apply the strategy to historical data
17
Copyright © Cem Kaner
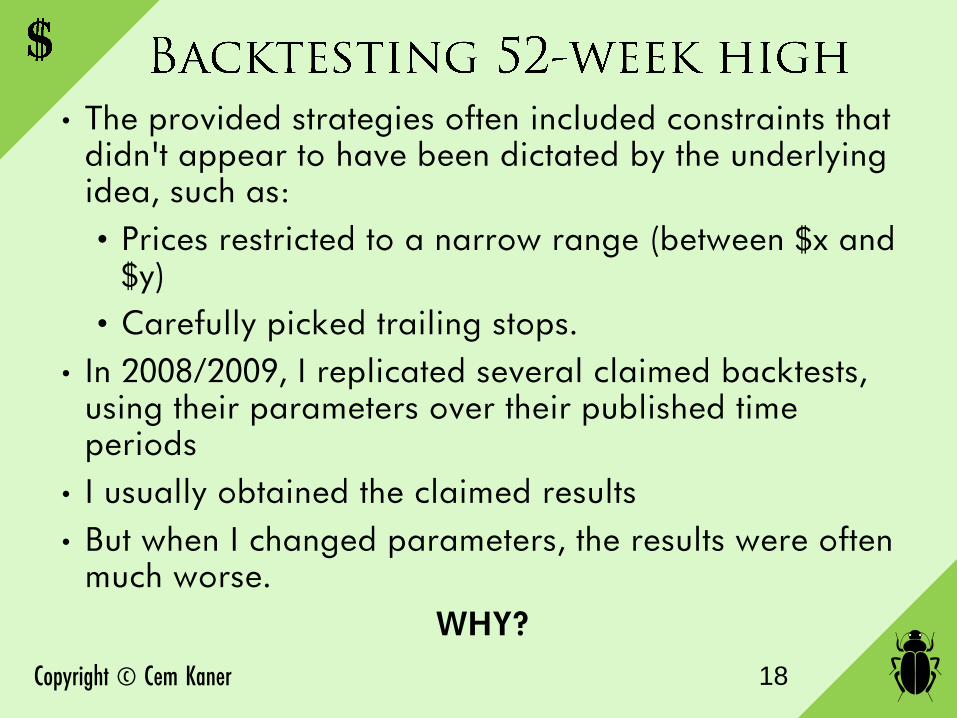
• The provided strategies often included constraints that didn't appear to have been dictated by the underlying idea, such as: • Prices restricted to a narrow range (between $x and
$y) • Carefully picked trailing stops.
• In 2008/2009, I replicated several claimed backtests, using their parameters over their published time periods
• I usually obtained the claimed results • But when I changed parameters, the results were often
much worse. WHY?
18

Copyright © Cem Kaner
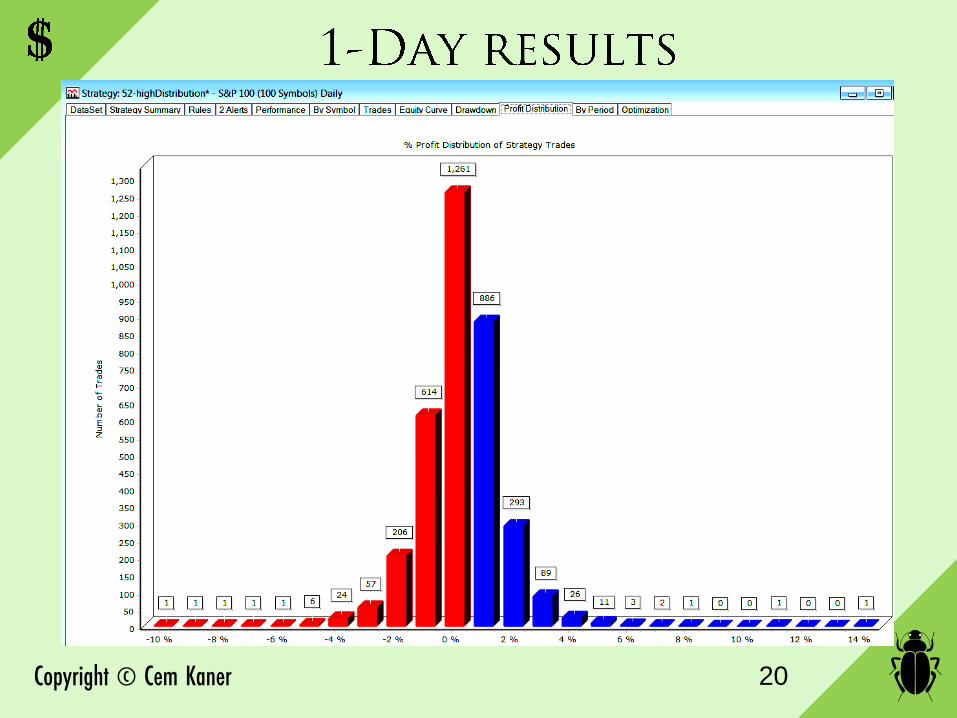
Using Fidelity's Wealth-Lab Pro • Buy the morning after the 52-week high • Buy stocks ≥ $1.00 • Sell at the end of the day • (If the stock is still rising, we should see an increasing
trend.) The following data: • 5 years (4/2006 to 3/2011) • S&P 100 stocks (NASDAQ 100, same results)
For a free trial of Wealth-Lab Pro, go to http://personal.fidelity.com/products/trading/Trading_Platforms_Tools/Wealth_Lab_Pro_Overview-Tools.shtml.cvsr
19
Copyright © Cem Kaner 20
Copyright © Cem Kaner 21

Copyright © Cem Kaner
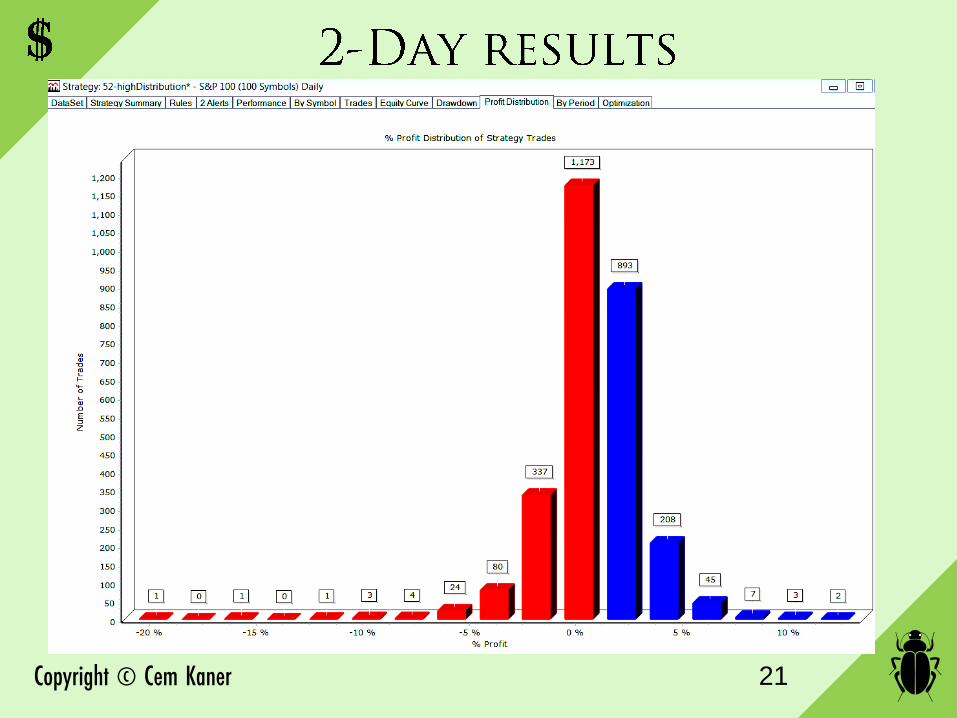
• The basic results are not promising • But when 1158 of 2782 trades are profitable, we might
look for ways to separate the 1158 winners from the 1624 losers. – For example, if we restrict our attention to
companies that are debt-free, over the 5 years, we would make 36 winning trades and only 29 losers.
• OPTIMIZATION is the process of adding or changing parameters to our backtests to:
Gain more per trade or Increase the percentage of profitable trades
22
Copyright © Cem Kaner
• OPTIMIZATION – Adding or changing parameters to our backtests to:
Gain more per trade or Increase the percentage of profitable trades
• OVERFITTING – It's easy to over-optimize, obtaining results that are
limited to the specific data set that was tested. – Good results from backtesting are encouraging, but
need further testing to control the risk of overfitting (and other risks).
23
Copyright © Cem Kaner
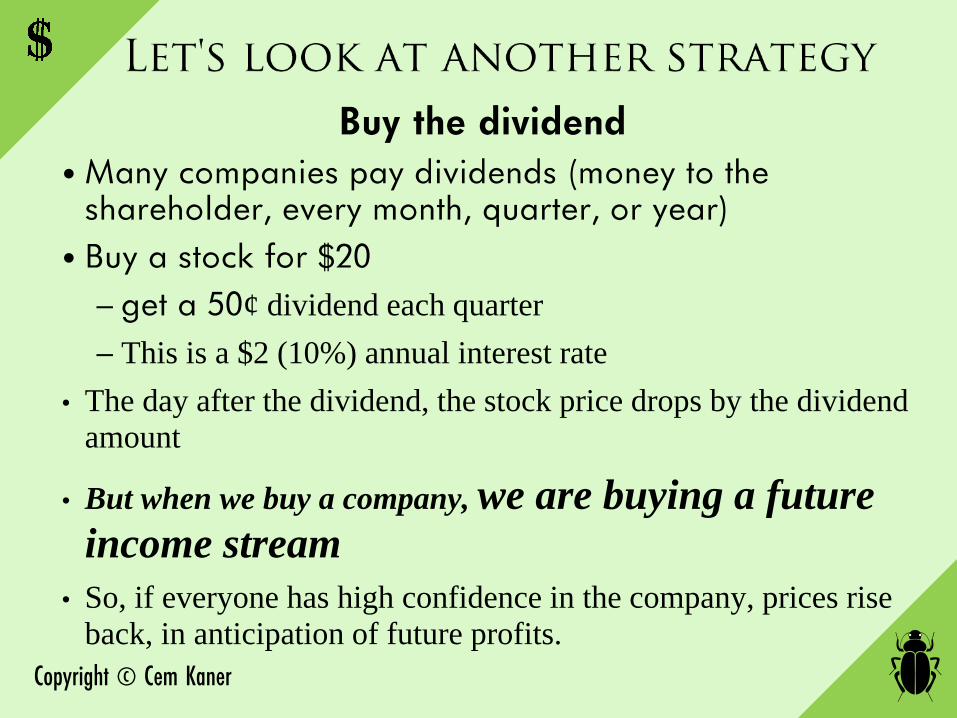
Buy the dividend • Many companies pay dividends (money to the
shareholder, every month, quarter, or year) • Buy a stock for $20
– get a 50¢ dividend each quarter
– This is a $2 (10%) annual interest rate
• The day after the dividend, the stock price drops by the dividend
amount
• But when we buy a company, we are buying a future
income stream
• So, if everyone has high confidence in the company, prices rise
back, in anticipation of future profits.
Copyright © Cem Kaner
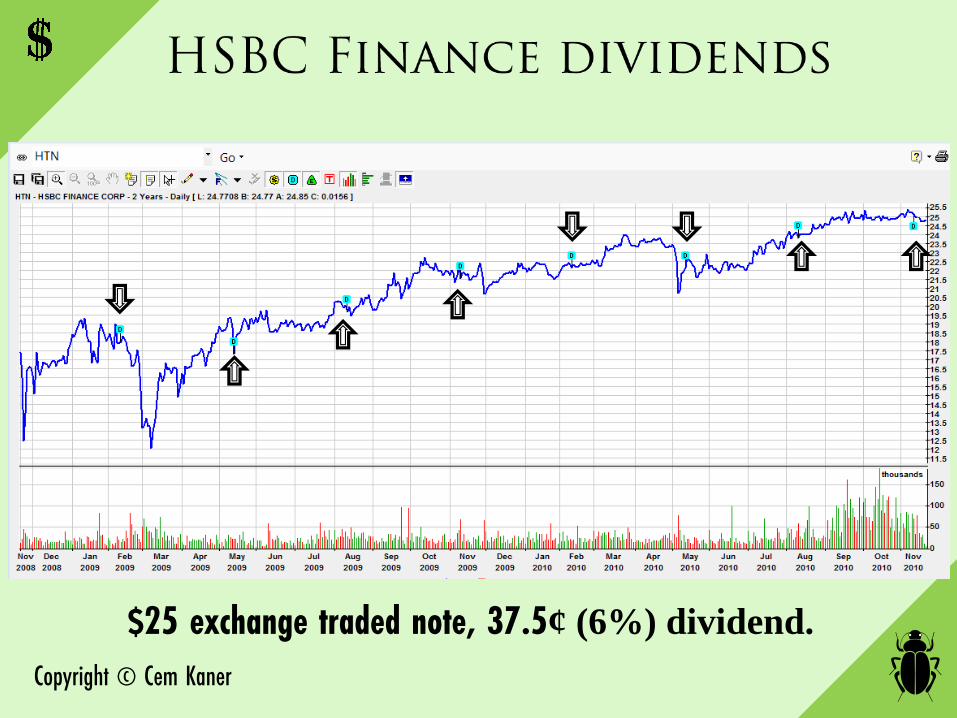
$25 exchange traded note, 37.5¢ (6%) dividend.

Copyright © Cem Kaner
BCSPRA $25 stock, 44.37¢ (7.1%) dividend.
Copyright © Cem Kaner
• This is such an obvious way to make money… • It is such a cool strategy that several ETF's specialize in
it. • Obviously, everyone should use it.
• So … we study it in the investment modeling class' first
assignment
Copyright © Cem Kaner
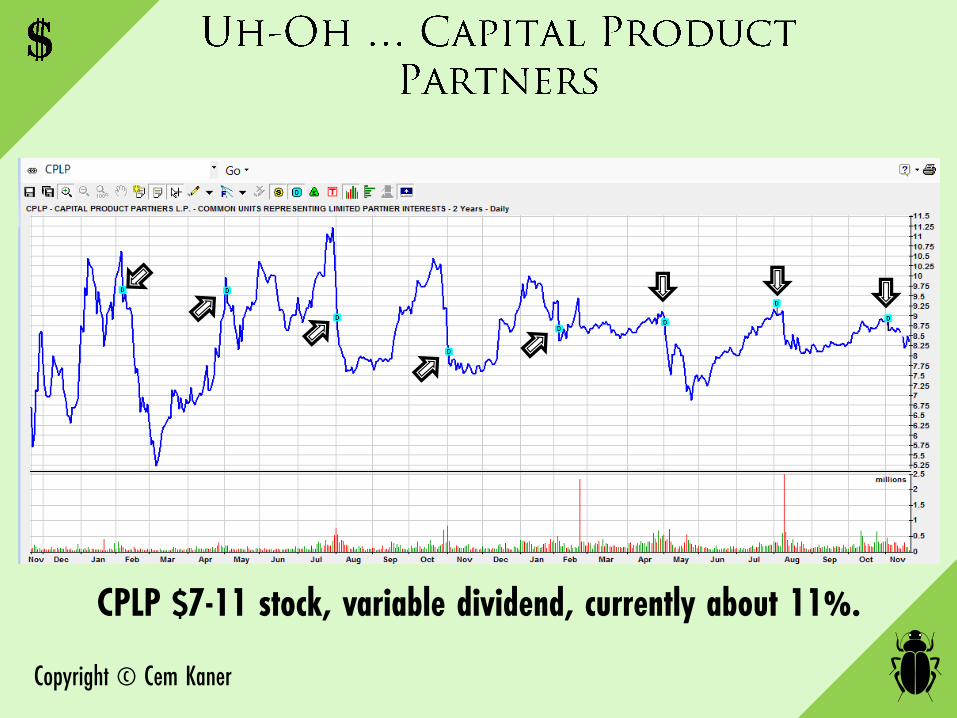
CPLP $7-11 stock, variable dividend, currently about 11%.

Copyright © Cem Kaner
• The basic buy-the-dividend (just before the dividend date) strategy fails badly
• Prices drop by the amount of the dividend when the dividend is paid and may take weeks (or longer) to recover
• Some identifiable stocks (e.g. CPLP and other high-dividend energy stocks) are better for sell-the-dividend
• Buy-the-dividend appears profitable (but not amazingly profitable) if you buy a month ahead of the large dividend instead of a few days ahead
• Buy-the-dividend might be profitable a few days ahead on modest dividends (e.g. 4% rather than 8%), but brokers' commissions can play a big role
29
Copyright © Cem Kaner
Intense backtesting on: • NASDAQ, • Dow Jones and • S&P 500
up to 2004
30
Copyright © Cem Kaner 31
Copyright © Cem Kaner 32
Copyright © Cem Kaner
• Replicated Connors' & Alvarez's results(High Probability ETF Trading)
• Extended the study to more ETF's • Extended the method to add an extra aggressive variant • "For my implementation of an 'extra aggressive' version
of each strategy, when a 'second unit' is mentioned in the aggressive version, I simply considered 'another unit.' By doing this it means that every time the condition of the aggressive version is met another unit is bought, rather that capping out at two units. This results in more capital invested but, as will be shown, also results in significantly higher win percentage as well as a higher average percent profit."
33
Copyright © Cem Kaner
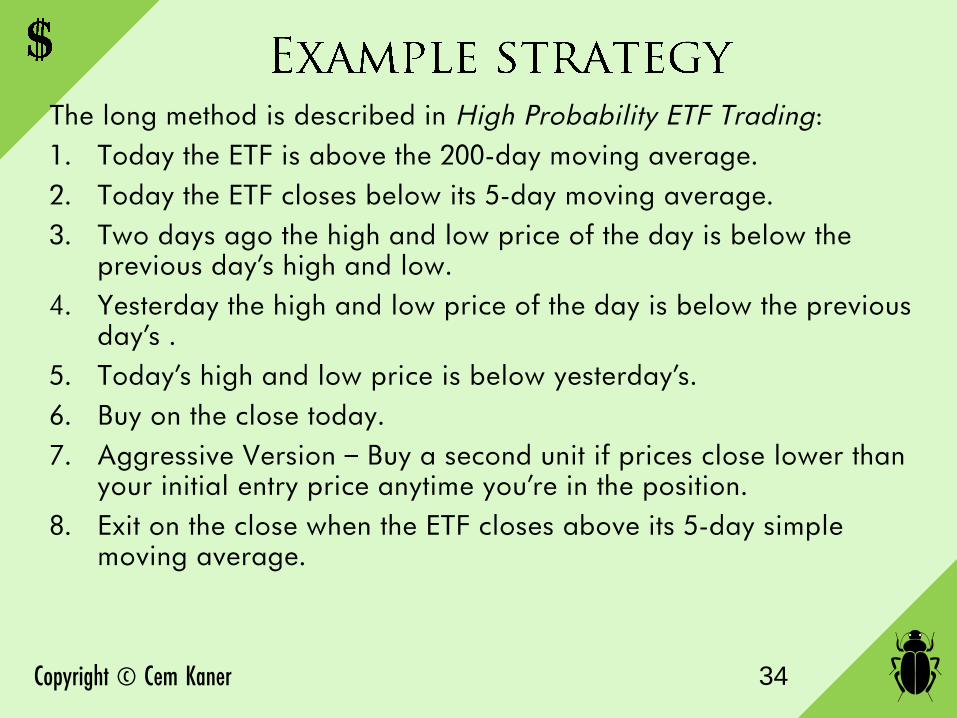
The long method is described in High Probability ETF Trading: 1. Today the ETF is above the 200-day moving average. 2. Today the ETF closes below its 5-day moving average. 3. Two days ago the high and low price of the day is below the
previous day’s high and low. 4. Yesterday the high and low price of the day is below the previous
day’s . 5. Today’s high and low price is below yesterday’s. 6. Buy on the close today. 7. Aggressive Version – Buy a second unit if prices close lower than
your initial entry price anytime you’re in the position. 8. Exit on the close when the ETF closes above its 5-day simple
moving average.
34

Copyright © Cem Kaner 35

Copyright © Cem Kaner
• Each buy/sell rule reflects an underlying model of the market’s historical behavior
• But in an ―investment program‖, each implemented strategy is implemented as a feature of the program
• So if we are testing an investment program (financial services are now a huge part of our economy), we are testing each strategy
Copyright © Cem Kaner
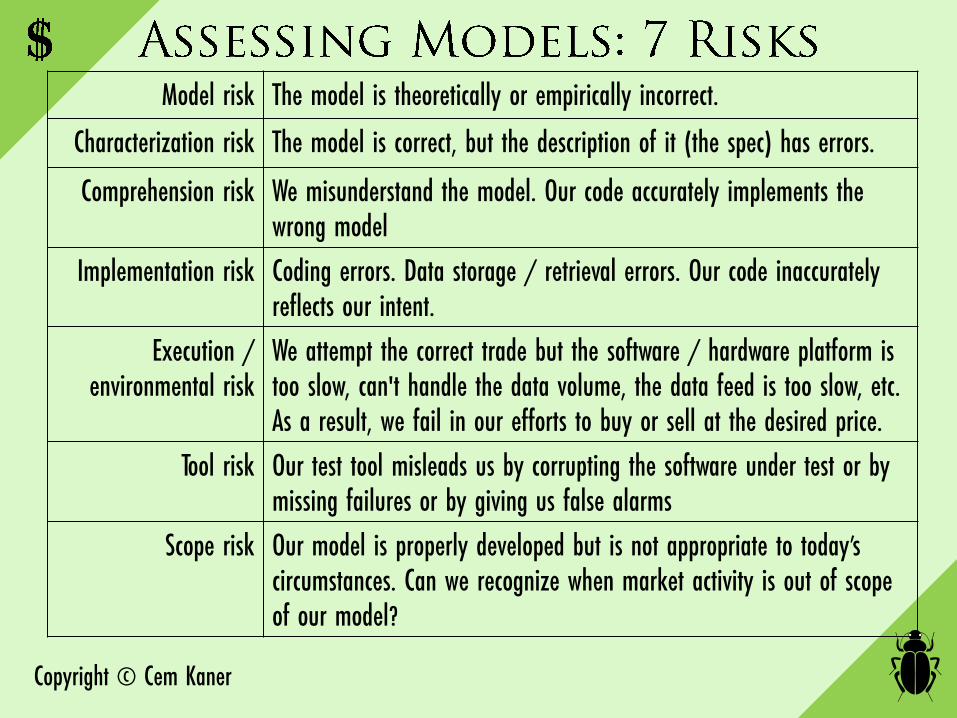
Model risk The model is theoretically or empirically incorrect.
Characterization risk The model is correct, but the description of it (the spec) has errors.
Comprehension risk We misunderstand the model. Our code accurately implements the wrong model
Implementation risk Coding errors. Data storage / retrieval errors. Our code inaccurately reflects our intent.
Execution / environmental risk
We attempt the correct trade but the software / hardware platform is too slow, can't handle the data volume, the data feed is too slow, etc. As a result, we fail in our efforts to buy or sell at the desired price.
Tool risk Our test tool misleads us by corrupting the software under test or by missing failures or by giving us false alarms
Scope risk Our model is properly developed but is not appropriate to today’s circumstances. Can we recognize when market activity is out of scope of our model?

Copyright © Cem Kaner
Model risk The model is theoretically or empirically incorrect.
Characterization risk The model is correct, but the description of it (the spec) has errors.
Comprehension risk We misunderstand the model. Our code accurately implements the wrong model
Implementation risk Coding errors. Data storage / retrieval errors. Our code inaccurately reflects our intent.
Execution / environmental risk
We attempt the correct trade but the software / hardware platform is too slow, can't handle the data volume, the data feed is too slow, etc. As a result, we fail in our efforts to buy or sell at the desired price.
Tool risk Our test tool misleads us by corrupting the software under test or by missing failures or by giving us false alarms
Scope risk Our model is properly developed but is not appropriate to today’s circumstances. Can we recognize when market activity is out of scope of our model?
Copyright © Cem Kaner
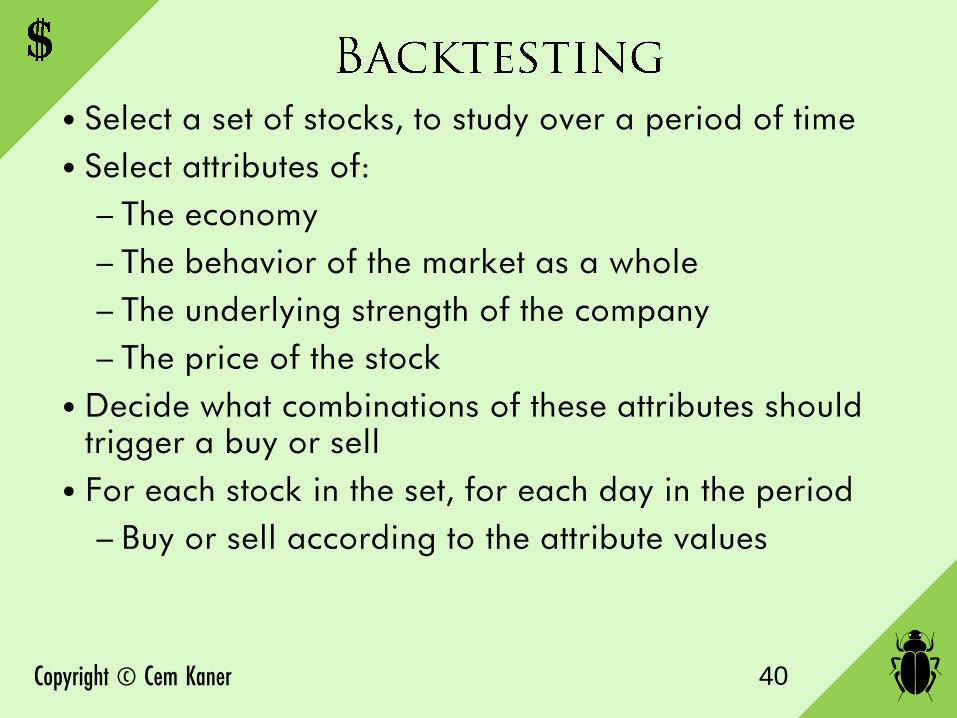
• Select a set of stocks, to study over a period of time • Select attributes of:
– The economy – The behavior of the market as a whole – The underlying strength of the company – The price of the stock
• Decide what combinations of these attributes should trigger a buy or sell
• For each stock in the set, for each day in the period – Buy or sell according to the attribute values
40
Copyright © Cem Kaner 41
Copyright © Cem Kaner 42

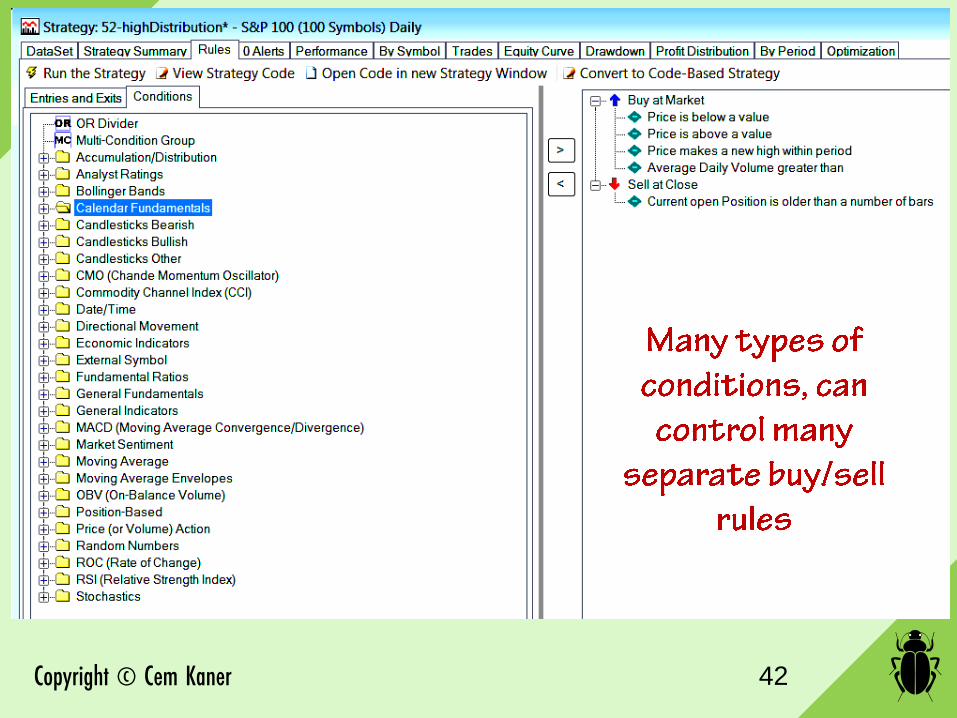
Copyright © Cem Kaner
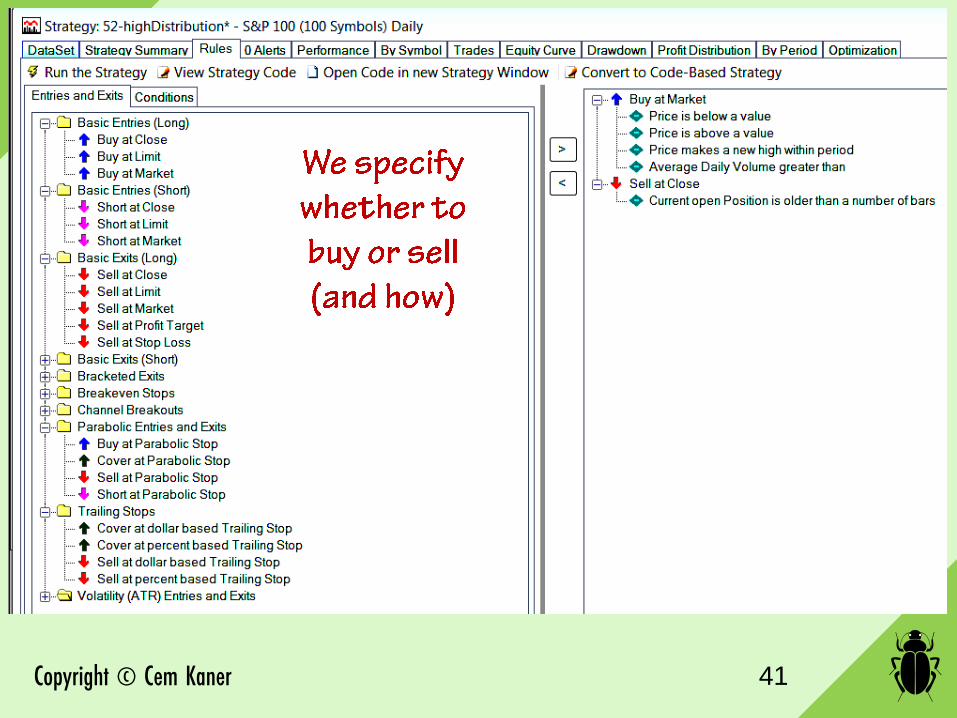
Wealth-Lab builds complex rules by given you a very complex wizard. But if you want to add your own attributes: • View the underlying strategy
implementation • Write code to add new attributes
All of this testing is: • Intensely automated, but • Non-repetitive
43
Copyright © Cem Kaner
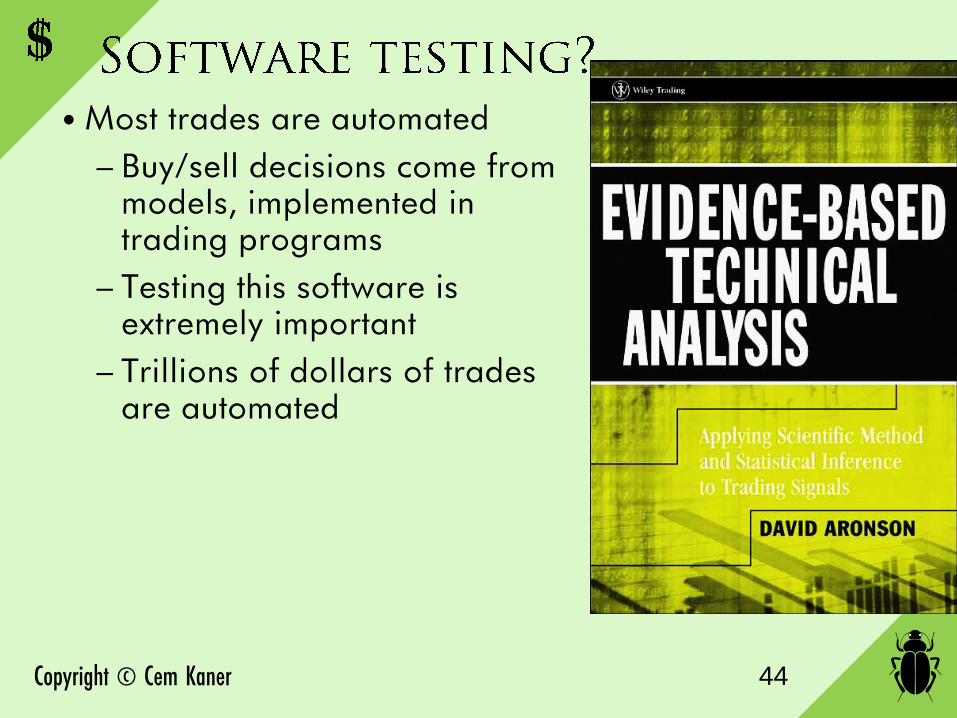
• Most trades are automated – Buy/sell decisions come from
models, implemented in trading programs
– Testing this software is extremely important
– Trillions of dollars of trades are automated
44
Copyright © Cem Kaner
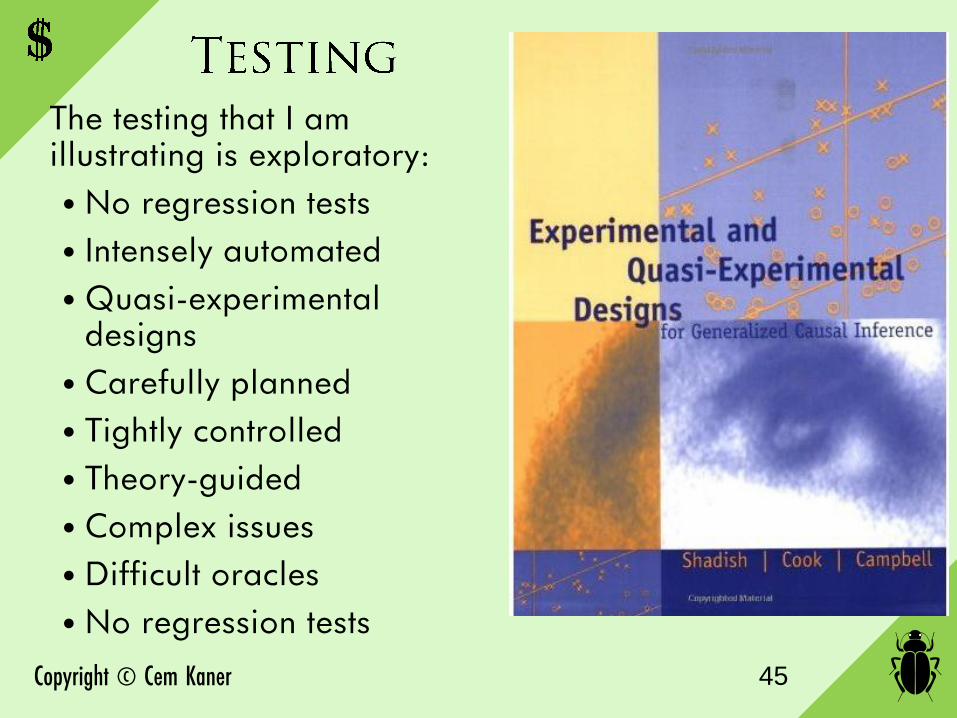
The testing that I am illustrating is exploratory: • No regression tests • Intensely automated • Quasi-experimental
designs • Carefully planned • Tightly controlled • Theory-guided • Complex issues • Difficult oracles • No regression tests
45

Copyright © Cem Kaner
Skilled black-box testers have done exploratory validation at every company I have worked for or consulted to. Exploratory testing blends: • Knowledge and skill in many
generic test techniques • Knowledge of the application
under test and its quality-related risks. Many of these are not related to coding errors.
• Knowledge of the test techniques / technology of the application's field.
46

Copyright © Cem Kaner
Cem Kaner has pursued a multidisciplinary career centered on the theme of the satisfaction and safety of software customers and software-related workers. With a law degree, a doctorate in Experimental Psychology, and seventeen years in Silicon Valley, Cem joined Florida Institute of Technology in 2000 as Professor of Software Engineering. His research focuses on the question, How can we foster the next generation of leaders in software testing? Cem is the senior author of Testing Computer Software (with Jack Falk and Hung Quoc Nguyen), Bad Software (with David Pels), and Lessons Learned in Software Testing (with James Bach and Bret Pettichord). The Association for Computing Machinery recently honored Cem with its Making a Difference Award http://www.sigcas.org/awards-1/awards-winners/sigcas-making-a-difference-award-2009
47