Copyright By Stephen Albert Yarger
173
Copyright By Stephen Albert Yarger 2010
Transcript of Copyright By Stephen Albert Yarger

Copyright
By
Stephen Albert Yarger
2010

The Dissertation Committee for Stephen A. Yarger certifies that this is the approved
version of the following dissertation:
The Information Content of Options Data Applied to the Prediction of
Clinical Trial Results
Committee:
Kenneth Lawson, Supervisor
Karen Rascati
Scott Strassels
Lorenzo Garlappi
Ryan Leslie

The Information Content of Options Data Applied to
the Prediction of Clinical Trial Results
by
Stephen A. Yarger, B.B.A; M.A.
Dissertation
Presented to the Faculty of the Graduate School of
The University of Texas at Austin
in Partial Fulfillment
of the Requirements
for the Degree of
Doctor of Philosophy
The University of Texas at Austin
December 2010

iv
The Information Content of Options Data Applied to the Prediction of Clinical Trial Results
Stephen Albert Yarger, PhD
The University of Texas at Austin, 2010
Supervisor: Kenneth A. Lawson
FDA decisions and late‐stage clinical trial results regarding new pharmaceutical
approvals can cause extreme moves in the share price of small biopharmaceutical companies.
Throughout the clinical trial process, many potential investors are exposed to market‐moving
information before such information is made available to the investing public. An investor who
wished to profit from advance knowledge about clinical trial results may use the publicly traded
options markets in order to increase leverage and maximize profits.
This research examined options data surrounding the public release of information
pertaining to the efficacy of clinical trials and approval decisions made by the FDA. Events were
identified for small pharmaceutical companies with fewer than three currently approved drugs
in an attempt to isolate the effect of individual clinical trial and FDA‐related events on the share
price of the underlying company. Option data were analyzed using logistic regression models in
an attempt to predict phase II and III clinical trial outcome results and FDA new drug approval
decisions. Implied volatility, open interest, and option contract delta values were the primary
independent variables used to predict positive or negative event outcomes.
The dichotomized version of a predictor variable designed to estimate total investment
exposure incorporating open interest, option contract delta values, and the underlying stock
price was a significant predictor of negative pharmaceutical related events. However, none of

v
the variables examined in this research were significant predictors of positive drug research
related events.
The estimated total investment exposure variable used in this research can be applied
to the prediction of future clinical trial and FDA decision related events when this predictor
variable shows a negative signal. Additional research would help confirm this finding by
increasing the sample size of events that potentially follow the same pattern as those examined
in this research.

vi
Contents Chapter 1: Introduction and Literature Review .............................................................................. 1
Background Information .............................................................................................................. 2
Public, Exchange‐Traded Equity Options ................................................................................. 2
Option Contract Basics ............................................................................................................ 4
Option Trading Strategies ...................................................................................................... 17
Market Neutral or Non‐Directional Strategies ...................................................................... 24
Greeks .................................................................................................................................... 28
Option Valuation Models ...................................................................................................... 33
Literature Review ....................................................................................................................... 36
Incorporation of Information in Asset Prices ........................................................................ 36
Option Use by Informed Traders ........................................................................................... 38
Lead‐Lag Relationship of Stock and Options ......................................................................... 41
Insider Trading ....................................................................................................................... 48
Options Used in Insider Trading ............................................................................................ 54
The Effect of New Product Approval ..................................................................................... 56
Event Studies ......................................................................................................................... 59
Statement of Purpose ................................................................................................................ 59
Objectives .................................................................................................................................. 60
Hypotheses ................................................................................................................................ 60
Chapter 2: Methodology ............................................................................................................... 62
Introduction ............................................................................................................................... 62
Regression Model Overview ...................................................................................................... 62
Positive and Negative Predictive Power .................................................................................... 68
Event Outcomes – Dependent Variables ................................................................................... 69
Event Timing .......................................................................................................................... 70
Independent Variables ............................................................................................................... 71
Data Source ................................................................................................................................ 74

vii
Company Selection ................................................................................................................ 76
Inclusion and Exclusion Criteria ............................................................................................. 77
Event Selection .......................................................................................................................... 81
Previous Release of Information ........................................................................................... 82
Multiple Events and Event Timing ......................................................................................... 83
Availability of Options Data ................................................................................................... 84
Generics ................................................................................................................................. 84
FDA Decisions ........................................................................................................................ 85
Other Exclusions .................................................................................................................... 85
Chapter 3: Results ....................................................................................................................... 104
Descriptive Statistics and Variable Differences ....................................................................... 104
Binary Logistic Regression with Continuous Independent Variables ....................................... 106
Binary Logistic Regression with Dichotomous Independent Variables ................................... 106
Multinomial Logistic Regression with Dichotomous Independent Variables .......................... 108
Secondary and Non‐significant Regression Results ................................................................. 111
Positive Predictive Value and Negative Predictive Value ........................................................ 111
Chapter 4: Discussion and Conclusion ........................................................................................ 123
Findings Related to Study Objectives ...................................................................................... 123
Hypothesis Test Results ........................................................................................................... 125
Model Creation Influences ....................................................................................................... 127
Regression Results ............................................................................................................... 130
Negative Predictive Power .................................................................................................. 131
Investor Sentiment Indicators ............................................................................................. 132
Put/Call Ratio ....................................................................................................................... 133
Data Trends ......................................................................................................................... 133
Interpreting Negative Predictive Value ............................................................................... 134
Dichotomization .................................................................................................................. 135
Prospective Investment Model ........................................................................................... 136
Insider Trading ..................................................................................................................... 137
Implications of Study Findings for Future Research ................................................................ 138
Limitations ............................................................................................................................... 139

viii
Conclusion ................................................................................................................................ 143
Appendix A Companies Considered for Inclusion ....................................................................... 144
Appendix B Secondary and Non‐significant Regression Results ................................................. 156
Bibliography ................................................................................................................................. 161
Vita .............................................................................................................................................. 165

1
Chapter 1: Introduction and Literature Review
The primary objective of this study was to evaluate the information content and
predictive ability of publicly traded equity options preceding major scientific announcements
made by small pharmaceutical companies. Option data were analyzed using logistic regression
models in an attempt to predict phase II and III clinical trial outcome results and FDA new drug
approvals. In a related analysis, the options data was used to show evidence for or against the
probability of leaked insider information. Finally, the options data was analyzed in an attempt
to identify investment recommendations based on event prediction probabilities.
For most publicly traded companies, single events that create large moves in share price
are difficult to identify pre‐event. For small pharmaceutical companies, the timing of an event
(phase II or III results or an FDA approval decision) is often known in advance. Although the
results of clinical trials and FDA approval decisions are theoretically kept secret by the
company/companies or the FDA until an official announcement is made, due to the large
number of patients and investigators typically involved in late‐stage drug trials1, positive or
negative news can be leaked to investors or acted on by those involved in the trial. Option
prices may be more representative than stock prices of early investor knowledge about trial
results because options often create the largest potential gain for investors2, the direction of a
1 Lipsky MS, Sharp LK. From idea to market: the drug approval process. Journal of the American Board of
Family Medicine. 2001;14(5):362‐367.
2 Jayaraman N, Frye MB, Sabherwal S. Informed trading around merger announcements: an empirical test
using transaction volume and open interest in options market. The Financial Review. 2001;37:45‐74.

2
trade or investment can be unclear when options are utilized3, and options are easier to profit
from when a negative announcement is anticipated.4,5 Therefore, an analysis of the relative
option prices and other option related data points for call and put options prior to phase II or III
results or an FDA decision could potentially predict the outcome of the trial or FDA decision and
potentially show evidence of leaked insider information.
Background Information
Public, ExchangeTraded Equity Options
For the purpose of this research, the term “option” or “options” will always refer to
publicly available exchange‐traded equity options. Non‐liquid company insider stock options,
other non‐public equity derivatives, and other derivatives such as credit default swaps are not
included in this analysis.
An option is a derivative security directly tied to an underlying asset, in this case an
underlying common stock equity asset. This research attempted to use data about the trading
of options to predict the outcome of future pharmaceutical related events. Due to the relatively
3 An informed investor may use a complicated options strategy in order to hide the investment
expectation of a trade. With a complex options strategy an informed investor could argue that the trade
was made without advance knowledge of pending events if the SEC investigated the trade.
4 “Shorting” or “short‐selling” a stock means that an investor has borrowed a stock from a broker and sold
the stock with an agreement that said stock will be “bought back” at a later date. When an investor
“shorts” a stock, the investor will benefit from a downward move in the stock’s trading price. Stocks can
be shorted to benefit from a pending negative drug trial announcement. However, shares available to
short are limited and shorting stock involves more risk than buying put options.
5 Chen R, Zhao X. The Information Content of Insider Call Options Trading. Financial Management.
2007;34(2):153‐172.

3
small size of the companies included in this research, the assumption was made that a “positive”
event could be identified when there was a corresponding positive move in the underlying stock
due to the public announcement of an event. Therefore, this research indirectly attempts to use
options to predict the future movement of the underlying stock. This concept might appear
counterintuitive because, in theory, the price of an option should be unilaterally correlated to
the price of the underlying security since these options are derivatives of the underlying
security. In other words, the price of the option should always move in the same direction and
relative magnitude as the price of the underlying equity. However, due to the increased
leverage available through option trading and the potential for decreased risk, evidence in the
literature suggests that informed traders6 may opt to trade in options prior to trading in the
underlying equity.7 Therefore, new information about a stock could be incorporated into option
pricing prior to equity pricing. Additional information about the literature surrounding the
potential use of options data as a predictor of future stock movements is presented in the
literature review section of this document. The following is an introduction to options, options
trading, options trading strategies, and option valuation models. This introduction to options
will help explain why variables chosen in the regression analysis can potentially help predict
future movements in stock prices. Additionally, the information about option trading strategies
provides the background information necessary to understand why informed investors may
6 See “Option Use by Informed Traders” in the literature review section of this document for more
information about informed traders.
7 Easley D, O'Hara M, Srinivas P. Option volume and stock prices: evidence on where informed traders
trade. Journal of Finance. 1998;53(2):431‐465.

4
trade options instead of stock when presented with advance information about a pending
clinical trial result.
Option Contract Basics
An option is a contract that gives the buyer the right to purchase or sell the underlying
company stock at a specified price (strike price) for a given period of time until the expiration of
the contract (expiration date). A “call” option gives the buyer of the option the right to buy the
underlying stock. A “put” option gives the buyer the right to sell the underlying stock. The
buyer of a call option has the right to buy the underlying stock, but is not obligated to do so.
Similarly, the buyer of a put option contract has the right to sell the stock, but is not obligated to
do so. The strike price is the price at which the purchaser of a call option can buy the underlying
stock or the price at which the purchaser of a put option can sell the underlying stock. Option
contracts are valid for a given period of time. The last date that an option contract can be
exercised is called the expiration date. Exercising an option means that the owner of the option
has elected to buy or sell the underlying stock at the strike price.8
For this study, only American options will be examined. In an American option contract,
the owner of the option can exercise said option at any time until the expiration date. The other
style of commonly used option contracts are European options which can only be exercised on
8 McMillian LG. Options as a Strategic investment. New York: Prentice Hall Press, 4th Sub Edition; 2002.

5
the expiration date. European option contracts trade at a slightly reduced price compared to
American options because the buyer of the option has a more restricted right to exercise.9,10
Intrinsic Value and Time Value
The price paid for an option contract is a combination of the intrinsic value and the time
value of the option contract. The intrinsic value is equal to the spread between the current
price of the underlying stock and the strike price of the option for in‐the‐money options.11 For
example, if the underlying stock is trading at $15 and a call option contract is written with a
strike price of $12.50, then this call option contract has an intrinsic value of $2.50. However, it
is likely that the call option in this example will be sold for more than $2.50. The buyer of the
option contract is willing to pay a premium if there is additional time value in the contract.
Using the same example, if the call option contract has a strike price of $12.50, the underlying
stock is currently trading at $15, and the call option contract expires in 60 days, then the call
option contract might sell for $3. In this case, the call option contract has $2.50 of intrinsic
value and $0.50 of time value. The purchaser of the call option is willing to pay $0.50 more than
the intrinsic value of the call option because the buyer has 60 days worth of time value.
Therefore, the buyer of the call option will benefit from an upward movement of the underlying
stock for 60 days. If the time period before expiration was longer, then presumably the buyer of
9 McMillian LG. Options as a Strategic investment. New York: Prentice Hall Press, 4th Sub Edition; 2002.
10 DeMark T. New Market Timing Techniques. New York: John Wiley & Sons; 1997.
11 For call options the intrinsic value equals the spread between the current price and the strike price if
the current price is above the strike price. For put options the intrinsic value equals the spread between
the current price and the strike price if the current price is below the strike price.

6
the call option would be willing to pay more for the option. The buyer of the call option in this
example can gain exposure to the underlying stock by purchasing the call option. As a result of
purchasing a call option instead of buying the underlying stock, the investor can increase
leverage or decrease risk and limit potential losses.
IntheMoney versus OutoftheMoney Options
An option is considered “in‐the‐money” if the option has an intrinsic value. In other
words, a call option is in‐the‐money if the strike price for the call option is less than the current
trading price of the underlying equity. A put option is in‐the‐money if the strike price is higher
than the current trading price of the underlying equity.
An option is considered “out‐of‐the‐money” if there is zero intrinsic value in the option
contract. A call option is out‐of‐the‐money if the strike price is higher than the current trading
price for the underlying equity. A put option is out‐of‐the‐money if the strike price is less than
the current price of the underlying equity. The distinction between in‐the‐money and out‐of‐
the‐money options is important because these groups of options are often used for different
types of investment strategies. Although it is impossible to discern which type of trading
strategy is being executed based on option data alone, a large increase in volume and price for
an option that is significantly out‐of‐the money, without a corresponding move in the underlying
equity, could provide more information about the future price of the underlying equity than a
large increase in volume or price for an in‐the‐money option.12 Since out‐of‐the‐money options
12 Easley D, O’Hara M, Srinivas P. Option volume and stock prices: evidence on where informed traders
trade. Journal of Finance. 1998;53(2):431‐465.

7
are more likely to expire worthless, these option contracts have increased risk compared to in‐
the‐money options. Therefore, a large increase in volume and relative price of an out‐of‐the
money option potentially shows that buyers of the option contract have strong beliefs that the
underlying stock will pass the strike price of the option before expiration. Such an investment is
risky because the investment will result in a 100% loss if the underlying stock does not cross the
given strike price before expiration of the contract. Assuming that investors always attempt to
minimize risk and maximize profit, an increase in the relative price and volume for out‐of‐the
money options may be a stronger indicator of informed investor advance knowledge than an
increase in relative price and volume for in‐the‐money options.13,14
Option Leverage
Option contracts are typically priced with 1/100 leverage. For example, if an investor
bought one call option for $1 with a strike price of $10 for a stock that trades at $8 the investor
has the right buy 100 shares of the underlying stock at $10 anytime before the option
expiration. However, the investor has no incentive to exercise this option unless the underlying
stock trades above $10 before option expiration.
13 The implications about the information contained in option volume and relative prices assume that said
options are naked option purchases. When option buys and sells are part of a larger, more complex
option strategy, volume and relative price changes may not accurately reflect investor sentiment about
the direction of future stock moves. For more information about the influence of complex investment
strategies refer to the “Option Trading Strategies” section of this document.
14 Pan J, Poteshman AM. The information in option volume for future stock prices. The Review of Financial
Studies. 2006;19(3):871‐906.

8
Option Quotes and Trading Dynamics
Publicly traded equity options trade in a market with similar trading dynamics as the
markets used to trade equities. Investors can use limit orders, market orders, or a wide range of
more sophisticated option orders typically focusing on the spread between the prices of two or
more option contracts.15 As with common stocks, the inside bid and ask prices are an aggregate
of the limit order buy and sell prices offered by all parties with active buy and sell offers for a
given option contract on a given exchange by the given market maker or market participant.16
When an investor enters a market order to buy an option, the order is executed at the inside
“ask” price. The inside ask price is the lowest price at which any participant is willing to sell a
given option contract. Inside bid and ask prices are created by market participants and market
makers having open limit orders to buy or sell a given option. When an investor enters a market
order to sell an option, the order is executed at the inside “bid” price. As with the inside ask
price, the inside bid price is the highest currently active limit order offer to buy the given option
contract. The bid/ask spread is the dollar amount between the inside bid price and inside ask
price. Bid/ask spreads and the volume of trades executed at the bid or at the ask, can be a
useful measure of point‐in‐time investor sentiment about the underlying equity.
Most options are priced in $0.05 increments for options trading below $3.00 and $0.10
increments for options trading above $3.00, these pricing increments in addition to low relative
volumes compared to stocks create bid/ask spreads that are larger on a relative dollar basis than
15 See the “Option Trading Strategies” section of this document for more information on option spreads.
16 Option orders can be routed to specific exchanges in which case the order could be executed at a
different price than the current inside bid or ask. For the purpose of this research, it is assumed that all
option orders are “smart” orders which seek out the best bid or ask price across all available exchanges.

9
the typical spreads seen in stock trading. As a result, option contracts are typically less liquid
than stocks. If an investor wants to immediately enter or exit an option trade, said investor will
likely have to pay the spread between the bid and the ask. In other words, if an investor
immediately wanted to reverse a newly opened position and buy or sell the option to liquidate
the position, the investor would lose the amount of the spread between the bid and the ask plus
transaction costs.
Option prices are typically shown in an option “chain” which shows data for a range of
option contracts for a given underlying stock. Figure 1.1 is an example of an option chain for
Cubist Pharmaceuticals (CBST) on June 15, 2009. This chain represents the end‐of‐day near‐the‐
money and out‐of‐money option contracts for the underlying stock of Cubist Pharmaceuticals.
The underlying stock for this example had a closing price of $17.11 and the options in this chain
expire on June 19, 2009.
Figure 1.0 Cubist Pharmaceuticals (CBST) option chain June 15th, 2009

10
As seen in Figure 1.0, option quotes are typically visually represented as an option
“chain” which shows a variety of option contract data for a given expiration date for a range of
option strike prices near the current trading price of the underlying stock. In this example, the
option chain shows the option prices for option contracts expiring on June 19, 2009. Therefore,
only four days of time value remain in these option contracts so the time value of these option
contracts is small. Figure 1.0 shows the option symbol, the last traded price of the option, the
change from the previous day’s trading price of the option, the current inside bid, the current
inside ask, the daily volume, and the open interest for each individual call and put option. In this
case, the calls are shown on the left half of the option chain and the puts are shown on the right
half of the chain. Figure 1.0 highlights in‐the‐money options with a yellow background while
out‐of‐the‐money options have a white background. In this example, the underlying stock
closed at $17.11, down from $17.30 on the previous trading day. As would be expected, the
decline in the underlying stock led to a decline in the near‐the‐money call option symbol
UTUFW.X and an increase in the in‐the‐money puts symbol UTURW.X.
Option Volume and Open Interest
The volume of an option contract represents the total number of option contracts that
have traded in a given period of time. When an investor enters a new position or closes an old
position, this transaction increases option volume. Open interest refers to the total number of
active option contracts or the total number of option contracts that have current exposure to
the underlying stock. When an investor closes an option contract, the net effect on open

11
interest could be negative or neutral.17 When an investor opens a new option contract position,
the net effect on open interest can be positive or neutral. Assuming that knowledge of an
upcoming event for a biopharmaceutical company is more likely to lead to new option positions
instead of the closure of previous option positions, open interest and change in open interest
may be a better predictor of future stock movements than volume and change in volume.
BreakEven Prices
The “break‐even” stock price for an option is the sum of the strike price and the option
price. For example, if a stock is trading for $10 and a call option expiring one year later with a
$15 strike price sells for $1 then the break‐even stock price is $16. In this example, if the
underlying stock closes at exactly $16 on the day of the expiration of the call option, then the
investor who bought the call option would break‐even. An analysis of break‐even prices can be
useful because it gives evidence about the expected value of the underlying equity at the option
contract expiration. 18
17 If the investor on the opposite side of the trade (investor B) is opening a new contract while investor A
is closing an existing contract, the net effect on open interest is zero. However, if investor B was also
closing an open option contract then the net effect on open interest is negative.
18 DeMark T. New Market Timing Techniques. New York: John Wiley & Sons; 1997.

12
Directional Expectations of Options Trading
An investor who believes that the underlying stock price will increase could buy a call
option. When an investor buys a call option, said investor is “long” the call option. The party
who sells the call option is “short” the call option. The party that is long the call option will
benefit from the underlying stock appreciating, while the party that is short the call option will
benefit from the underlying stock declining. An investor who is long a call option has an infinite
potential for profit. Since there is no upper limit to how high a stock price can trade, an investor
who has purchased or is long a call option will earn a profit equal to the stock price at
expiration, minus the strike price of the call option, minus the price paid for the call option
(stock price – strike price – option price).19 Conversely, the party that sells or is short a call
option has a maximum profit equal to the price the option contract was sold for. This investor
maximizes profit if the underlying stock price is lower than the strike price for the call option at
option expiration. When this happens, the investor who sold the call option keeps the premium
for selling the call option and has no further obligation concerning the underlying stock.
The same dynamic of profit potential and long and short positions applies to put
options, but the terminology can be confusing. The party who sells the put option is said to be
short the put option while the party who buys the put option is said to long the put option.
When an investor sells a put option or is short a put option, said investor is obliged to buy the
19 This equation only works for in‐the‐money options. All out‐of‐the‐money options have a loss at
expiration equal to the purchase price of the option.

13
underlying stock at the strike price if the option is exercised. Therefore, this investor benefits
from an appreciation or potentially a lack of decline in the underlying stock. The maximum
profit for this investor is equal to the price the put option was sold for. In this case, the investor
who sold the put option maximizes profit if the stock closes above the put option strike price at
option expiration. The investor who bought the put option is long the put and has the right to
exercise the put at the given strike price. At expiration, the investor who is long a put option
can either use the put to sell an existing long position at the put strike price or the investor can
open a new short position in the underlying stock at the put option’s strike price.20 For the
investor who is long a put option, profit is maximized if the underlying stock trades at $0 at
option expiration. Profit for a buyer of a put option equals the strike price of the put, minus the
closing price of the stock at option expiration, minus the price paid for the put option (strike
price – stock price – minus initial option price).
In general, the party that is short a put option benefits from the underlying stock
appreciating while the party that is long a put option benefits from the underlying stock
declining.21 These relationships are easily remembered by applying positive (+) or negative (‐)
identifying values to calls (+), puts (‐), long (+), and short (‐) indicators. By using standard
multiplication rules and multiplying the two identifiers, the direction or the investment
expectation of the underlying stock can be obtained. For example, an investor who is long a call
20 At expiration if an investor exercises a naked put, the investor enters a short position in the underlying
stock. However, this short position must follow short stock regulations. Therefore, if there are no shares
available to short from the investor’s broker, the investor may be forced to buy back the short shares to
close the position.
21 An investor who is short a put option can also benefit if the underlying stock stays flat or the underlying
stock depreciates, but it depreciates less than the amount the put option was sold for.

14
option (+×+) has two positive indicators resulting in a positive product. Therefore, the investor
benefits from the underlying stock appreciating. An investor who is short a call option (‐×+) has
one negative indicator and one positive indicator resulting in a negative product. Therefore, the
investor benefits from the underlying stock declining. An investor who is long a put option (+×‐)
has one positive and one negative indicator resulting in a negative product. Therefore, the
investor benefits from the underlying stock declining. Finally, an investor who is short a put
option (‐×‐) has two negative indicators resulting in a positive product. Therefore, the investor
benefits from the underlying stock appreciating.
Time Decay and Option Valuation
An option contract consists of both the intrinsic value of the option and the time value
of the option. If the option contract is out‐of‐the‐money, then the entire value of the contract
consists of time value. In this situation, if the underlying stock price stays constant, then the
value of an option consisting entirely of time value will decline or “decay.” This concept of a
declining value for options over time given a constant underlying stock price represents the time
decay of option values. Time decay benefits an investor who is short or has sold options.
Conversely, time decay has a negative effect on an investor who is long option contracts. When
everything else remains constant (underlying stock price, overall market volatility, general
expectations for the underlying company, general expectations for the overall stock market and
the economy) the time value portion of both call and put options will decay in a linear fashion.
However, it is rare that all other variables will remain the same. Therefore, the time value

15
portion of an option contract’s value will have a negative trend22, but will not follow a steady
straight line decline. For example, if a put option contract with a strike price of $12.50 and six
months of time value is written for $1 for a stock with an underlying price of $15 (zero intrinsic
value), the value of the put option will likely vary as any of the variables affecting the option
price varies. If the underlying stock price increases with everything else remaining constant,
then the put option contract value would likely decline in value. If the value of the Chicago
Board of Options Exchange (CBOE) Volatility Index (VIX) increases when all other variables
remain constant, then the value of the put option would likely increase.23 If a drug in a clinical
trial had superior efficacy compared to the current gold standard of treatment and this
information became known by some investors before public release, the value of a call option
could increase while all the typical variables involved in option pricing remained the same. 24
However, in “real–world” situations there are many variables than can affect the price of an
option contract and these variables are sometimes difficult to measure and can change rapidly.
Therefore, models which calculate an expected value for an option contract can be useful in
identifying variables which are related to the option contract’s value. For this research, the
22 The “time‐value” portion of an option contract will always have a negative trend. However, this trend
only pertains to the time‐value portion of the options value. If the intrinsic value of an option contract
increases over time, the total value of the option contract can have an increasing trend at the same time
as the decreasing trend for the time‐value portion of the option’s value.
23 The Chicago Board of Options Exchange Volatility Index (VIX) is a measure of implied volatility that is
often referred to as the “fear” index. When the VIX increases in value, the market is more “fearful” and
the price paid for put options increases.
24 This hypothetical scenario assumes that an informed investor chose to invest with options instead of
buying the underlying equity. See the “Informed Traders” and “Option Use by Informed Traders” sections
of this document for more information.

16
widely used Black‐Scholes option pricing model will be used to set an expected value for a given
option contract.25
Naked Options
The previous examples about the investment direction of option trades all assumed that
each side of the trade was executing a “naked” option. An option is considered naked if the
investor does not own an offsetting position in the underlying stock or an offsetting position in a
different option contract. An offsetting position could either be a long or short stock position or
a long or short option position. For example, if an investor sells a call, but also owns the
underlying stock, the investor has entered a position that is called a covered call. In this case,
the investor benefits from the stock appreciating despite having sold or entered a short position
in a call option. An investor could also have an offsetting option position that would change the
net direction of the investor’s holdings. For example if an investor sells a call, but buys a call
with a lower strike price, the investor has entered a bull call spread and the investor would
benefit from the underlying stock value appreciating. Therefore, it is difficult to determine an
investor’s expectations about an underlying stock by seeing only one leg of an option trade. In
actual trading situations, investment expectations about the underlying stock are difficult to
measure through option contract information because directional expectations about the
underlying stock may vary by the option strategy chosen. Therefore, an analysis of commonly
25 DeMark T. New Market Timing Techniques. New York: John Wiley & Sons; 1997.

17
used option strategies will help illustrate the effect of a given option strategy on the volume of
the option contracts and the directional expectations of the underlying stock.26
Option Trading Strategies
Although it is often difficult or impossible to ascertain the investor expectations of a
given underlying stock based on aggregate options data, an examination of commonly used
option trading strategies is useful when examining the information content of option data. The
use of one of these strategies may provide an alternative explanation to increased call or put
volume instead of the often assumed implication of positive or negative expectations about the
underlying stock. Many of these strategies are either bull strategies (the underlying stock is
expected to increase) or bear strategies (the underlying stock is expected to decrease).
However, some option strategies are neutral and perform well when the underlying stock does
not change in value. The following section explains some of the most common option trading
strategies followed by the effect of the given strategy on the relative call and put option volume
and bullish or bearish implication of the option volume.
Covered Call
A covered call is a commonly used option strategy where the investor reduces risk and
generates extra income by selling calls for a stock that is owned (long position). This strategy
26 McMillian LG. Options as a Strategic investment. New York: Prentice Hall Press, 4th Sub Edition; 2002.

18
ranges from bullish to neutral. The degree of bullishness in this strategy is correlated to the
magnitude of the spread between the current stock price and the strike price of the sold call
option. The larger the spread, the more bullish the options strategy becomes. For example, if a
stock trades at $10 the investor could potentially sell a call with a strike price of $12.50 and
expiration 6 months out for $1.27 In this scenario, if the underlying stock closes at $12.50 or
higher at the expiration of the call option contract, then the investor will sell the underlying
stock at the strike price of $12.50. The investor has then realized a profit of $2.50 in stock
appreciation and $1 in premiums for selling the call option contract, for a total profit of $3.50. If
the underlying stock closes below the strike price of $12.50 at option expiration, then the
investor keeps the underlying stock and gets to keep the $1 in premiums collected by selling the
call options contract. Alternatively, the covered call investor could chose a more bullish covered
call strategy and sell a call option with a $15 strike price that expires in six months for $0.50.28
Using this strategy the investor profits more if the stock appreciates all the way to $15, but
profits less if the stock appreciates to $12.50 or less. If the underlying stock closes at $15 at the
expiration date, then the investor has made a profit of $5 plus the option premium of $0.50 for
a total profit of $5.50. Therefore, selling the $15 strike option was a more bullish strategy than
selling the $12.50 call option because profit is maximized when the underlying stock appreciates
to a price higher than $12.50. Assuming an investor holds the stock and the short option
contract until the option expiration date, a covered call investor always profits from the option
premium for selling the call option contract. Therefore, if the underlying stock declines from
27 Estimated price for a six month 25% out‐of‐the‐money call option. The actual price would depend on
many variables included the volatility of the underlying stock and forward looking investor expectations.
28 Estimated price for a six month 50% out‐of‐the‐money call option. The actual price would depend on
many variables included the volatility of the underlying stock and forward looking investor expectations.

19
$10 to $9 at the time of the option expiration, the investor who sold a covered call contract with
a $12.50 strike price for a $1 premium would break even on the total investment because the
underlying stock has declined $1, but the option premium received off‐set the $1 decline in
stock price. This process shows how the covered call strategy is a bullish strategy that still
provides some downside protection. However, a covered call strategy is always less bullish than
naked ownership of the underlying stock. When an investor sells calls against an underlying
stock the maximum profit equals the strike price of the sold calls minus the stock price at the
start of the option contract, plus the initial price of the option contract (strike price – stock price
+ initial option price). Covered calls also provide the investor with some downside protection. If
the underlying stock price is less than the call strike price at option expiration, then the option
expires worthless and the investor keeps the option premium and the underlying stock.29
The use of a covered call strategy can skew the expected implication of an increase in
out‐of‐the‐money call volume. For example, if an investor did not want to sell a stock, but also
did not think that the stock would appreciate in the next 6 months, said investor might sell a call
on the underlying stock and collect the call option premium. If many investors used this
strategy, the volume of the call options might increase, but the actual investor sentiment for the
underlying stock may have declined if the reason for selling the call option is an expectation of
no appreciation in stock price for a given time period. Therefore, an increase in call volume or
an increase in put volume alone is not sufficient to understand the expectations of the
underlying stock.
29 McMillian LG. Options as a Strategic investment. New York: Prentice Hall Press, 4th Sub Edition; 2002.

20
Bull Call Spread
A bull call spread is another commonly used bullish option strategy. A bull call spread is
created by buying a call option and selling a call option with a higher strike price. For example, if
the underlying stock is currently trading at $10, a bull call spread could be entered by buying a
call option with a $10 strike expiring in one month for $1 and selling a call option with a $12.50
strike expiring in one month for $0.50. The price difference between the purchased option and
sold option becomes the maximum loss for this investment which is $0.50 in this example. This
loss would be incurred if the underlying stock was priced at $10 or lower at the expiration date.
If the underlying stock closed at $10.50 at expiration, this options strategy would break even.
The investor would make a profit equal to the spread between the strike prices minus the
spread between the buy and sell prices of the option contracts if the stock appreciates to the
price of the sold option with a higher strike price, in this case the strike price of $12.50.
Therefore, if the underlying stock closed at $12.50 at the expiration date, the investor made a
profit of $2.00 (strike price of sold call option – strike price of bought call option – spread
between buying price and selling price of both options) or ($12.50‐$10‐$0.50).30,31,32
A bull call spread is always a bullish investment. Therefore, the corresponding increase
in call volume and/or open interest resulting from a bull call spread should reflect an overall
bullish expectation for the underlying stock.
30 McMillian LG. Options as a Strategic investment. New York: Prentice Hall Press, 4th Sub Edition; 2002.
31 DeMark T. New Market Timing Techniques. New York: John Wiley & Sons; 1997.
32 DeMark T, DeMark TJ. Demark on Day Trading Options. New York: McGraw‐Hill; 1999.

21
Bull Put Spread
A bull put spread is similar to a bull call spread using put options. A bull put spread is
constructed by selling a put option and buying an equal number of put options with a lower
strike and the same expiration date. By selling a put with a higher strike and buying a put with a
lower strike, the investor hopes that the underlying equity closes above the higher priced put
strike price at option expiration and both puts expire worthless. The maximum profit for this
trade equals the initial price of the higher priced option minus the cost of buying the lower
priced option. Maximum profit is realized if the underlying stock closes above the price of
higher strike put option at option expiration. For example, if the underlying stock was trading at
$10, an investor might sell the $10 put that expires in 6 months for $2 and then buy the $7.50
put with the same expiration date for $1. If the stock closes at $10 or higher at the option
expiration date the investor has made $1 which is the maximum gain for this trade. The
maximum loss for this investment equals the difference between the two strike prices, minus
the initial price of the lower priced option, plus the initial price of the higher priced option ($10‐
$7.5‐$1+$2=$1.50). The maximum loss is realized if the underlying stock closes below the price
of lower strike put option at option expiration. 33,34
A bull put spread is always a bullish strategy. However, the use of bull put spreads
increases the total volume of put options. Therefore, if investors use bull put spreads, put
option volume could increase despite an overall bullish investment sentiment about the
underlying stock.
33 McMillian LG. Options as a Strategic investment. New York: Prentice Hall Press, 4th Sub Edition; 2002.
34 DeMark T, DeMark TJ. Demark on Day Trading Options. New York: McGraw‐Hill; 1999.

22
Bear Call Spreads
Similar to bull call spreads and bull put spreads, bear call spreads and bear put spreads
are used when the investor has a bearish directional bias about the underlying stock. A bear call
spread is initiated by buying call options and then selling the same number of call options at a
lower strike price. For example, if the underlying stock is currently trading at $10, a bear call
spread could be entered by buying a call option with a $10 strike expiring in one month for $1
and selling a call option with a $7.50 strike expiring in one month for $3. The price difference
between the purchased option and sold option becomes the maximum profit for this
investment which is $2 in this example. This profit would be realized if the underlying stock was
priced at $7.50 or lower at the expiration date. If the underlying stock closed at $9 at
expiration, this options strategy would break even. The investor would make a profit equal to
the spread between the strike prices, minus the spread between the buy and sell prices if the
stock depreciates to the price of the sold option with a lower strike price, in this case the strike
price of $7.50. Therefore, if the underlying stock closed at $7.50 at the expiration date, both
options would expire worthless and the investor made a profit of $2.00 (spread between buying
price and selling price of both options) or ($3 ‐ $1). The maximum loss for this investment is also
equal to the spread between the long option and the short option. This maximum loss is
realized if the underlying stock closes at $10 or higher at option expiration.35
35 DeMark T, DeMark TJ. Demark on Day Trading Options. New York: McGraw‐Hill; 1999.

23
Bear call spreads are always a bearish investment strategy. However, bear call spreads
are not typically used for call options that are significantly out‐of‐the‐money because the risk
reward profile would be unfavorable. Therefore, the use of bear call spreads may increase total
call option volume when the actual investor sentiment for the underlying stock is bearish, but
bear call spreads are unlikely to increase the volume of heavily out‐of‐the‐money call options.
Bear Put Spread
Bear put spreads are initiated by buying a put option and selling an equal number of put
options with a lower strike. Profits are maximized when the underlying stock closes below the
strike price of the lower strike put. When this happens, the investor makes a profit equal to the
difference between the strike prices minus the spread between the premiums collected by
selling the higher strike put and the cost of buying the lower priced put.36,37
Bear put spreads are always a bearish strategy and the volume increase in put options
due to bear put spreads is representative of bearish investor sentiment as would be expected by
an increase in put volume.
36 DeMark T, DeMark TJ. Demark on Day Trading Options. New York: McGraw‐Hill;1999.
37 McMillian LG. Options as a Strategic investment. New York: Prentice Hall Press, 4th Sub Edition; 2002.

24
Market Neutral or NonDirectional Strategies
Market neutral strategies or non‐directional strategies are often used when investing
with options. Unlike like stand‐alone stock investing, certain options strategies can be profitable
without the use of a predefined directional bias to the trade.38 Some neutral strategies are
profitable when the underlying stock moves sharply in either direction while others are
profitable when the underlying stock does not move at all. When using common stock alone,
market neutral strategies are typically not possible because a net long position is always a
bullish investment while a net short position is always a bearish investment.39 Stocks with high
dividend yields can be profitable investments without an increase in the stock price. However,
an investor who is long a high‐yield stock still gets an increased benefit if the stock price
increases so the investment is a bull investment instead of a non‐directional investment. If an
investor had an equal long and short position in a stock, the net position would be neutral, but
the investor would have zero potential for profit so such a neutral position would be an
ineffective strategy. Therefore, when an investor does not have a directional bias about a stock,
but said investor thinks the stock will be volatile or when an investor thinks a stock will stay flat
38 Stock investing can be profitable when a stock is flat due to dividend payments. However, outside of
dividend payments, stock investing strategies cannot be market neutral without adding options.
39 The term “market neutral” is also used to describe an investment with a long position in one stock and
an equal short position in a company that is a direct competitor to the long position. In this case, the
investment will return a profit as long as company A outperforms company B. For this research, we are
using the term market neutral referring to a neutral position in one publicly traded company through the
use of options strategies.

25
for a given period of time, option based investing has many advantages over equity only
strategies.
Long Straddle
A straddle is an option investment strategy that profits from large moves in the
underlying stock in either direction. A long option straddle is entered by buying a call and a put
at the same strike price that expire at the same time. If the underlying stock price moves in a
dollar amount above or below the strike price that is larger than the sum of the prices paid for
both the put option and call option, then the investment is profitable. The maximum loss for a
long option straddle is the sum of the prices paid for the options. For example, if an investor
wants to enter a long straddle for an underlying stock that trades at $50, the investor could buy
a $50 call and a $50 put with the same expiration date. If the call and the put both cost $3, the
maximum loss would equal $6. The maximum loss is realized if the stock closes at $50 and both
the call option and the put option expire worthless. The maximum gain is unlimited if the
underlying stock appreciates, but if the underlying stock declines, the maximum gain is equal to
the strike price minus the initial prices paid to enter the option position.40 The profit for this
position is equal to the absolute value of the difference between the closing price of the
underlying stock at expiration and the strike price of the options minus the sum of the prices
paid to enter the trade (initial option prices). For example, if the underlying stock closed at $70
40 The underlying stock could in theory increase indefinitely, but it can only decrease to zero. Therefore,
the potential profit of a long options straddle is higher is the underlying stock increases than if the
underlying stock decreases.

26
on the option expiration date, the gain would equal $14 ($70‐$50‐$6=$14). If the underlying
stock closed at $20 on the option expiration date, the profit would equal $24 ($50‐$20‐
$6=$24).41,42
A long option straddle increases both the call volume and put volume in equal
quantities. Therefore, the implementation of a long option straddle does not have an effect on
the relative volume of calls and puts, but it will increase the volume of both calls and puts
compared to historical volumes.
Short Straddle
A short option straddle is a non‐directional strategy initiated by selling a call and a put at
the same strike price with the same expiration date. This strategy is typically entered at a strike
price that is close to the current price of the underlying security. With a short options straddle,
profits are maximized when the underlying stock stays flat and both options expire worthless or
expire at a lower value than the price the option was originally sold for. The maximum profit for
a short option straddle equals the premiums collected for selling both of the options. The
maximum loss is unlimited if the underlying stock appreciates and it is equal to the strike price
minus the option premiums collected if the underlying security declines in value.43,44
41 McMillian LG. Options as a Strategic investment. New York: Prentice Hall Press, 4th Sub Edition; 2002.
42 DeMark T, DeMark TJ. Demark on Day Trading Options. New York: McGraw‐Hill; 1999.
43 McMillian LG. Options as a Strategic investment. New York: Prentice Hall Press, 4th Sub Edition; 2002.
44 DeMark T, DeMark TJ. Demark on Day Trading Options. New York: McGraw‐Hill; 1999.

27
A short option straddle increases both the call volume and put volume in equal
quantities. Therefore, the implementation of a short option straddle does not have an effect on
the relative volume of calls and puts, but it will increase the volume of both calls and puts
compared to historical volumes.
Strangle
An option strangle is a strategy that is similar to the straddle, but the investor buys or
sells both put options and call options at the same expiration date with different strike prices. A
long strangle parallels a long straddle. If the underlying stock increases, the maximum profit of
a long strangle equals the price of the underlying stock at expiration, minus the strike price of
the call option, minus the initial price paid for both the call and put option. If the underlying
stock decreases, the maximum profit equals the strike price of the put option minus the price of
the underlying stock at expiration, minus the initial price paid for both the call and put option.
A short strangle parallels a short straddle. The investor sells put and call options with the same
expiration date and different strike prices. As with the short straddle, profits are maximized
when the underlying stock stays relatively flat and both options expire worthless. The maximum
loss is unlimited if the underlying stock increases and it is equal to the strike price minus
premiums received if the stock decreases.
Both long and short strangles increase the call volume and put volume in equal
quantities. Therefore, the implementation of long and short strangles does not have an effect
on the relative volume of calls and puts, but it will increase the volume of both calls and puts
compared to historical volumes. Unlike straddles, strangles can be used for significantly out‐of‐

28
the‐money options so they may affect both near‐the‐money and out‐of‐the‐money option
volumes.
Many additional more complicated option strategies can be used with bullish, bearish,
or non‐directional expectations. The implementation of any option strategy that is more
involved than simply buying or selling naked puts and calls can have an inverse relationship to
the expected implications of put and call volume.45 The explanation of these strategies helps
underscore the need for additional variables above and beyond option volume to be included
when research attempts to ascertain the information content in options data. Therefore, it is
useful to obtain a baseline or expected price for any options contract and compare the expected
price to the actual price in combination with option volume and other variables related to
options trading data.
Greeks
The term “Greeks,” when used in conjunction with option‐based investment strategies,
refers to a set of mathematical measures that show the sensitivity of an option price to a given
variable. Greeks are typically used to help quantify risk for a given option investment strategy.
Three of the most commonly used Greeks in option trading that were considered for this
research include Delta, Gamma, and Theta.
45 The general assumption is that increased put volume relative to call volume is a negative indicator for
the underlying stock price and vice versa.

29
Delta
Delta is probably the most commonly used Greek. Delta measures the sensitivity of an
option’s value to a change in the underlying stock price. Delta values range from 0 to 1 for call
options and from 0 to ‐1 for put options. A Delta of 1 for a call option means that with a $1
change in the underlying stock, the value of the call option will also change by $1. A Delta value
of 1 or a Delta value approaching 1 will typically only be seen for heavily in‐the‐money call
options. 46 For example, if the underlying stock is trading at $50 and an investor buys a call
option with a strike price of $2.50, the Delta for this call option would be close to 1 because the
option is so far in‐the‐money that a $1 move in the underlying stock will create a change close to
$1 in the price of the call option with a $2.50 strike price. The same relationship is true for put
options that are heavily in‐the‐money. If the underlying stock is trading at $2.50 and an investor
buys a put option with a strike price of $50, the Delta of this put option will approach ‐1 because
a $1 move in the underlying stock is likely to create a $1 move in the put option with a $50 strike
price.47
Option investors often use Delta to help measure the net exposure of a complicated
option‐based strategy. This is accomplished by multiplying the Delta value for each option
contract by 100 and summing the total Delta for all open option positions for a given underlying
stock. The resulting number can be used as a proxy for the underlying stock share equivalent of
46 For most real world purposes, Delta values only approach 1, but do not actually equal 1. Even for
heavily in‐the‐money options, the price paid for a given option minus the time value of the option will
almost always be lower than the price of the underlying stock. Therefore, Delta can approach 1, but will
typically never reach 1 unless the price paid for the option actually equals the price paid for the
underlying stock.
47 McMillian LG. Options as a Strategic investment. New York: Prentice Hall Press, 4th Sub Edition; 2002.

30
an option position. For example, if an investor initiated a bull call spread for a stock with
underlying price of $10, the investor might buy the call option with a strike price of $12.50 and
sell the call option with a strike price of $15, with both contracts expiring in 6 months. The
investor is hoping that the underlying stock will close over $15 at the option expiration in six
months. If the call option with a $12.50 strike price was purchased for $1 and the call option
with a $15 strike price was sold for $0.50, the investor can easily calculate the maximum profit
and loss for this position48, but it would also be useful to estimate the underlying stock share
equivalent. In this case, if the $12.50 strike price call option had a Delta of .37 and the $15
strike price call option had a Delta of .23, the net Delta for this position would be .14.
Therefore, if the investor was long one contract of the $12.50 strike price call option and short
one contract of the $15 strike price call option, the net exposure of the option position would
equal 15 shares (net Delta of 0.15x100). From an investment perspective, the option investor
can treat this position as similar to a holding 15 shares of the underlying stock. In this case, in
order to obtain a net exposure of 15 shares of the underlying stock, the investor only had to pay
$50 (difference between the purchased call option and the sold call option) while it would have
cost $150 to buy 15 shares of the underlying stock. This example helps illustrate how option
strategies can provide higher leverage than stock‐based investment strategies. However, this
leverage comes at a price, the option position will expire in six months and the Delta value will
decay over time thus lowering the net exposure of the option position if the underlying stock
does not increase.
48 See example of maximum profits and losses in the Bull Call Spread section of Option Strategies.
31
In addition to being used as a proxy for the net quantity of underlying shares an option
position represents, the absolute value of Delta is also often used as a proxy for likelihood of an
option expiring with value or expiring in‐the‐money. For example, if a given call option has a
Delta value of 0.50, the investor may use this as an approximation that there is a 50% chance
that the given option will expire in‐the‐money. This estimation is often made because options
with strike prices very close to the current underlying stock price typically have Delta values
near 0.50 while options that are heavily in‐the‐money typically have high Delta values
approaching one and heavily out‐of‐the‐money options have low values approaching zero.
Although such measures are often used to hedge the exposure of a position or portfolio using a
“delta‐hedge,” the Delta calculation is not designed to be used as probability of out‐of‐the‐
money versus in‐the‐money option expiration. 49,50
For this research, the absolute value of the Delta for a given set of option contract will
be used as an independent variable in the regression analysis. These Delta values will help
explain the magnitude of the in‐the‐money and out‐of‐the‐money options and allow a
comparison of the predictive value of options data with respect to the degree of variance from
the current underlying stock price. The net Delta of the intraday volume for calls and puts and
the net Delta of the daily open interest will be calculated as proxy measures for the dollar
amount of exposure option investors have in the underlying stock at a given point in time.
49 McMillian LG. Options as a Strategic investment. New York: Prentice Hall Press, 4th Sub Edition; 2002.
50 DeMark T, DeMark TJ. Demark on Day Trading Options. New York: McGraw‐Hill; 1999.

32
Gamma
Gamma is another commonly used option Greek which is a derivative of Delta. Since
Delta is used to estimate exposure to the underlying stock and to estimate the probability of an
option expiring in‐the‐money, investors are also interested in how Delta moves relative to other
variables. Gamma is used to measure the change in the Delta for each one dollar move in the
underlying stock. Since the Delta value of an option position can change with time decay and
with movements in the underlying equity, Gamma can be a useful tool to measure exposure
levels to the underlying equity given an expected range of changes in the underlying stock.
Gamma will not be used in this research. It was not available from the data provider
used for this research as a calculated field from our data source and if it was available, there
would be a large interaction effect with Delta.
Theta
The time value portion of an option’s total value will always decay over time. This
happens because with each passing day, the probability of the option gaining in intrinsic value
declines. Theta is a mathematical measure used to estimate the sensitivity of an option’s value
due to the passage of time. Time decay always works for investors who are short options and
against investors who are long options. Therefore, the value of Theta is always positive for
options held short and it is always negative for long options. Investors can use Theta to
estimate the amount of money that a given option will lose each day due to time decay. If an
investor has a portfolio with many different option contracts, the total time decay of the
portfolio can be estimated by summing the Theta values for the entire portfolio. If the investor

33
has a net positive Theta for the portfolio, then time decay will work in the investor’s favor. If
the investor has a net negative Theta portfolio, then time decay will work against said investor.51
For this research, Theta will be not be used as an independent variable in the regression
analysis. The data source available for this research did not include reliable theta values.
However, future research could benefit from this inclusion of a theta variable. Since informed
investors would typically be long option contracts, time decay would typically work against such
investors.52 Therefore, the Theta associated with an option prior to an announcement about
clinical trial results could provide information about when the announcement of the results will
be made public.
Option Valuation Models
Many different option valuation models exist, but for this research we will focus on the
Black‐Scholes model. The Black‐Scholes model is commonly used to value publicly traded stock
options.53 The Black‐Scholes model estimates for the value of an option are a function of the
current value of the underlying stock, the variance in the underlying stock’s price, the intrinsic
value of the option, the time value of the option, the option expiration date and exercise price,
51 Net theta values are not “weighted” by dollar values invested; therefore, theta is often more useful as a
net measure of time decay for the sum of all positions in one equity or for the sum of option positions
with similar dollar values.
52 Although an informed investor could also have short positions in options by taking a position which is
opposite the expected move in the underlying stock, such a position would not have the same leverage
effect that a long option position would and thus, it would not maximize profit for an informed investor
who is confident about the future movement of the underlying stock.
53 Black F. Fact and fantasy in the use of options. Financial Analysts Journal. 1975;31:36‐41.

34
and the risk‐free rate of interest while assuming that shares are always available to be shorted,
that there are no transaction costs, that it is possible to borrow and lend cash at a constant risk‐
free interest rate, that the price follows a geometric Brownian motion, and that stocks do not
pay dividends.54 The assumptions used in the Black‐Scholes model will have an important effect
on variables examined in this research. The Black‐Scholes model assumptions most relevant to
this research include: no transaction costs, shares are always available to short, and stocks do
not pay dividends.55
In recent years, transaction costs for both stocks and options have dropped rapidly so
the assumption of “no transaction costs” may not have a large effect on this research. However,
trading costs for options are more relevant for low‐priced options that are significantly out‐of‐
the‐money. For this type of option, a large number of contracts can be bought for a small
amount of money. Since option trading is typically priced based on the number of contracts,
heavily out‐of‐the‐money, low‐priced options are more likely to be affected by transaction costs
than in‐the‐money or slightly out‐of‐the‐money options. Therefore, the Black‐Scholes model
calculated values will be somewhat overestimated for low‐priced significantly out‐of‐the‐money
options due to the Black‐Scholes assumption that there are no transaction costs.
The Black‐Scholes assumption that shares are always available to short presents a
limitation to this research project. This study will focus on small biopharmaceutical companies.
Although these companies are the most likely to experience large stock price valuation swings
54 Black F, Scholes M. The pricing of options and corporate liabilities. Journal of Political Economy.
1973;81(3):637–654.
55 Black F, Scholes M. The pricing of options and corporate liabilities. Journal of Political Economy
1973;81(3):637–654.

35
and are, therefore, appropriate for this study, many of these companies are relative thinly
traded and often shares are not available to short. Additionally, some of these companies have
share prices less than $5 which makes them more difficult to short.56 This violation of the Black‐
Scholes model assumption that shares are always available to short could increase the value of
the put options examined in this study compared to the Black‐Scholes expected values. An
investor always has the choice of buying stock or buying call options in order to take a long
position in a security. However, if shares are not available to short, the investor can only use
options to take a short position in the underlying security. The lack of shares available to short
could create increased demand for put options and an increased price for put options compared
to the expected Black‐Scholes prices.
The Black‐Scholes assumption that stocks do not pay dividends should not have a
significant effect on this research because few if any of the small biopharma companies
examined in this study pay dividends. In the absence of dividend payments, it is assumed that
demand for options at expiration that do not contain any portion of time value should be equal
to demand for the underlying equity.
This study will use implied volatility measurements based on the Black‐Scholes model.
Although a few of the basic assumptions used in the Black‐Scholes model will likely be violated
based on the stocks included in this research, implied volatility values can still be compared for
different time periods for each underlying equity in an attempt to see if information about the
56 Some brokerage firms do not allow short selling for stocks with prices under $5. Although most
institutional and professional investors are still able to find shares to short for stock trading under $5,
short selling these stocks often incurs additional interest payments. The increased difficulty and cost
associated with shorting stocks below $5 and the lack of availability for some investors could violate the
no transaction cost and the available to short assumptions of the Black‐Scholes model.

36
upcoming FDA decisions is present in the options data. If any errors occur in the implied
volatility calculations due to violation of Black‐Scholes assumptions, these errors will be equally
distributed between option time periods and between underlying equities. Therefore, abnormal
implied volatility values could still provide valuation information about future movements in the
underlying equity.
Literature Review
Incorporation of Information in Asset Prices
Many different models have been created in an attempt to show how information is
incorporated into stock prices. Many of these models separate informed and uninformed
traders. Typically, an informed trader is simply a market participant who has a real or perceived
information advantage compared to the investing public.57 Such an information advantage
could be illegal insider information, legal insider information, or non‐insider information. For
the purpose of this research, an informed trader is defined as a market participant who has a
real or perceived information advantage about pending clinical trial results or an FDA decision.
The efficient‐market hypothesis assumes that all publicly available information is
already reflected in current asset or stock prices. Under this theory, current stock prices reflect
accurate probabilities of a companies’ future profitability potential.58 More recent academic
57 Easley D, O'Hara M, Srinivas P. Option volume and stock prices: evidence on where informed traders
trade. Journal of Finance. 1998;53(2):431‐465.
58 Fama E. Efficient capital markets: a review of theory and empirical work. Journal of Finance. 1970;25:
383–417.

37
evidence has shown a number of deficiencies in the efficient‐market hypothesis. One of the
commonly addressed problems of the efficient‐market hypothesis stems from the consistent
outperformance of low price‐to‐earnings ratio stocks.59 Other researchers have pointed out
that the efficient market hypothesis does not always hold true because investing decisions are
sometimes made irrationally and a significant amount of human error and cognitive bias can
enter any investment decision.60 Therefore, investors tend to over‐react or under‐react to any
given information about a publicly traded company.61
Although the efficient‐market hypothesis does not necessarily hold true for all publicly
traded equities, it is reasonable to assume that the prices of most common equities are
influenced by a compilation of the known information about said companies’ future business
prospects. However, informed traders are investing based on information that is not necessarily
known to the market. Therefore, the actions of informed traders may affect stock prices prior
to the release of the relevant information. In this situation, the market would not have
accurately reflected the knowledge of the informed traders because this knowledge was not
publicly available. For this research, it is impossible to separate informed traders from non‐
informed traders at the point of the trade. However, a retrospective analysis of trading patterns
focusing on option trades may be able to indentify informed traders retrospectively.
59 Rosenberg B, Reid K, Lanstein R. Persuasive evidence of market inefficiency. Journal of Portfolio
Management. 1985;13:9‐17.
60 Fox J. Is the market rational? No, say the experts. But neither are you‐‐so don't go thinking you can
outsmart it. Fortune. December, 2002.
61 Dreman David N. & Berry Michael A. Overreaction, underreaction, and the low‐P/E effect. Financial
Analysts Journal. 1992;51(4):21–30.

38
Option Use by Informed Traders
The idea that informed traders or investors might use derivatives or options instead of
or in addition to equities is logical based on the increased leverage available through such
investment instruments. This concept had been examined in the literature starting with Black in
1973 and 1975.62,63 Black concluded that an investor “may choose to deal in options when he
feels he has an especially important piece of information.”64
An additional reason to trade in options instead of stock presents itself when an
investor has non‐public information about volatility. In this situation, the investor could benefit
from trading in options while said investor would probably not be able to benefit from trading in
the underlying equity. Back (1993) and Chatterjea (1993) both showed evidence that investors
could benefit from option trading based non‐public volatility information, but these investors
would not necessarily be able to benefit from stock trading.65,66 Such a scenario is highly
relevant to this research. For example, if an investor in a small biopharma company obtained
non‐public information that the FDA was planning on making a decision about a product
approval six months earlier than expected, that investor could buy equal quantities of puts and
calls (equal absolute cumulative delta value) expiring shortly after the new FDA decision
62 Black F, Scholes M. The pricing of options and corporate liabilities. Journal of Political Economy.
1973;81(3):637–654.
63 Black F. Fact and fantasy in the use of options. Financial Analysts Journal. 1975;31:36‐41.
64 Black F. Fact and fantasy in the use of options. Financial Analysts Journal. 1975;31:36‐41.
65 Back K. Asymmetric information and options. Review of Financial Studies. 1993;6(3):435‐472.
66 Chatterjea A, Cherian J, Jarrow R. Market manipulation and corporate finance: a new perspective.
Financial Management. 1993;22(2):200‐209.

39
deadline. In this case, with no decision imminent in the minds of most investors, the implied
volatility of the options would be related to the volatility of the underlying stock without
increased implied volatility due to a pending event. Therefore, when the investing public is
made aware of the pending event, the implied volatility for both the call options and the put
options would increase thereby increasing the value of the both of these option contracts in the
absence of a movement in the underlying stock.
Easley (1998) showed evidence of the conditions which lead to informed traders using
options instead of equities. Easley concluded that when option trades are categorized into
positive news event trades and negative news event trades, option volume data can contain
information about future stock prices. Easley also found that the market that informed traders
choose to trade in (stock or option market) contains information about security price
movements and the related option prices. 67
For an informed trader, the decision to trade in stocks or options is a combination of the
greatest expected return, the ability to profit from advanced volatility information, and the
desire to remain undetected or anonymous. Obviously, informed investors who are utilizing
illegal insider information would value anonymity, but other informed investors may also wish
to hide their trades in an effort to avoid moving the underlying asset before taking a full position
in the investment. If an informed investor is making a large purchase of stock or options, the
purchase itself may move the underlying stock. In general, stock trading is more liquid than
67 Easley D, O'Hara M, Srinivas P. Option volume and stock prices: evidence on where informed traders
trade. Journal of Finance. 1998;53(2):431‐465.

40
option trading so trading in stocks may offer informed investors a better avenue to hide their
trades. However, if the average volume of a given stock is low, trading in options may offer the
informed investor a better opportunity to gain exposure to a large position without immediately
affecting the supply and demand for the underlying stock. A large volume increase in options
trading may move the underlying stock as well, but it is less likely to than a large transaction in
the underlying stock itself. Options are less likely to move the underlying stock because there is
no direct supply and demand relationship between an option contract and the underlying stock.
Therefore, for different stocks the incentive to trade in stocks versus options may change on a
per stock basis.
Transaction costs also contribute to the expected investment return for an informed
investor. Although transaction costs have declined significantly in recent years, out‐of‐the‐
money options can have high transaction costs due to per contract pricing and larger bid‐ask
spreads. Out‐of‐the‐money options are priced lower than in‐the‐money options and lower than
the underlying stock price. Therefore, if the informed investor wants to invest x dollars, then
the number of contracts needed would be higher than the same dollar amount invested in in‐
the‐money option contracts and transaction costs would likely be higher if utilizing out‐of‐the‐
money option contracts. For certain option contracts, the bid‐ask spread could be large enough
to sway the informed investor to investing in the underlying stock instead of the option. When
an option contract has low volume and low open interest, it is more likely that the bid‐ask
spread will be large from a percentage of invested dollars point of view.68 For this research,
many of the option contracts for small biomedical companies are thinly traded, hence the bid‐
68 DeMark T. New Market Timing Techniques. New York: John Wiley & Sons; 1997.

41
ask spreads are often large and the leverage typically gained by using options instead of stocks
could be mitigated.
Although the level of incentive for an informed trader to utilize options instead of or in
addition to stocks changes for each investment decision, evidence suggests that the increased
leverage available in options may lead informed investors to trade options prior to stocks.69
Therefore, an analysis of the information obtained in options trading data may provide evidence
about the future movement of the underlying stock.70
LeadLag Relationship of Stock and Options
Since investors are free to choose to invest in stocks or options to gain exposure to a
given company’s stock performance, the temporal relationship between stock and option prices
should be examined. The general concept that option data can be used as a predictor of future
stock prices assumes that there is some evidence that option prices are a leading indicator for
stock prices. The literature is mixed concerning the lead‐lag relationship of stocks and options.
However, in cases where insider information may have been leaked and in cases where
investors are extremely confident about the future movement of a stock (i.e. advance positive
or negative knowledge about the results of a clinical trial for a small pharmaceutical company),
it is possible and logical that option data will be a leading indicator of future stock price
69 Easley D, O'Hara M, Srinivas P. Option volume and stock prices: evidence on where informed traders
trade. Journal of Finance. 1998;53(2):431‐465.
70 Pan J, Poteshman AM. The information in option volume for future stock prices. The Review of Financial
Studies. 2006;19(3):871‐906.

42
movements even if option prices are not a leading indicator of future stock price movements for
the market as a whole.
Early literature on the lead‐lag relationship of stocks and options focused on price by
comparing actual stock prices to the prices expected using the inverse of option pricing model
results to obtain implied stock prices based on current option prices. More recent research has
attempted to isolate the individual option data variables other than price which may provide
information about future stock prices.
Manaster and Rendleman (1982) found option price data contains information about
equilibrium stock prices that are not fully reflected in current observed stock prices.71 Using the
Black‐Scholes model adjusted for dividend yields, Manaster and Rendleman compared the stock
prices implied by option contract values with observed stock prices. Assuming that some
investors prefer to trade in options due to potential advantages in trading costs, lack of short
sale restrictions, and margin requirements, Manaster and Rendleman concluded that implied
stock prices based on option prices (comparing the underlying stock actual value to the value
implied by Black‐Scholes) can provide information about the future movement of stock prices. 72
Bhattacharya (1987) also found that option prices contain information about future
stock prices.73 Similar to the methodology used by Manaster and Rendleman, Bhattacharya
71 Manaster S, Rendleman R. Option prices as predictors of equilibrium stock prices. Journal of Finance.
1982;37(4):1043‐1057.
72 Manaster S, Rendleman R. Option prices as predictors of equilibrium stock prices. Journal of Finance.
1982;37(4):1043‐1057.
73 Bhattacharya M. Price changes of related securities: the case of call options and stocks. Journal of
Financial and Quantitative Analysis. 1987;22(1):1‐15.

43
used the inverse of the Black‐Scholes model to obtain implied stock values then examined the
absolute difference between actual and implied stock prices. Although Bhattacharya found
evidence that option prices are a leading indicator of stock prices, the final conclusion indicated
that the magnitude of information provided by option prices was insufficient to overcome
transaction costs. However, it is worth pointing out that option transaction costs have declined
dramatically since the publication of Bhattacharya’s research.
Stephan and Whaley (1990) found evidence that stock prices lead option prices. This
study used similar methodology to the Bhattacharya study and the Manaster and Rendleman
study by comparing option pricing model implied stock prices to actual stock prices, but Stephan
and Whaley appear to reach the opposite conclusion.74 Stephan and Whaley differed from the
previous studies that found option prices were a leading indicator of stock prices by using the
American call option pricing model instead of the Black‐Scholes model to estimate implied stock
prices and by using intraday option prices.75 Stephan and Whaley found that stock prices can
lead option prices by as much as fifteen minutes.76,77 Bid‐ask spreads can also explain some of
74 Stephan J, Whaley R. Intraday price change and trading volume relations in the stock and stock option
markets. Journal of Finance. 1990;45(1):191‐220.
75 Logically, an intraday analysis is likely to show that stock prices lead option prices. Aggregate volume
numbers are typically much larger for stock trading than for option trading and relative bid‐ask spreads
are smaller. Therefore, on an intraday basis more stock will be traded more than derivatives on the stock.
This imbalance in baseline intraday volume may lead to option prices being reactive to stock prices simply
because the option would not have traded at all without a movement in the underlying equity.
76 It is unlikely that an intraday time lag of fifteen minutes would still be present in modern stock and
option trading. Computerized option trading programs take advantage of any potential arbitrage
situation between stock and option prices in seconds rather minutes. Therefore, this “lag” is more likely a
lack of trading, but the bid and ask are moving in correlation to the underlying stock.
77 Stephan J, Whaley R. Intraday price change and trading volume relations in the stock and stock option
markets. Journal of Finance. 1990;45(1):191‐220.

44
the lag between stock and option prices. Since the bid‐ask spread for stocks is often smaller
than the relative bid‐ask spread for options (after considering the 100/1 leverage ratios in
option contracts), option prices may not move based on a move in the underlying stock until the
magnitude in the move of the underlying stock offsets the difference between bid‐ask spreads.
Chan, Chung, and Johnson (1993) confirmed the findings of Stephan and Whaley that
stock prices lead option prices. However, Chan, Chung, and Johnson also showed that the
leading relationship between stock and option prices disappears when the average price
between the bid and the ask is used instead of the most recent transaction price for option
pricing. Options are often infrequently traded, therefore, the real option value as represented
by the spread between the bid and the ask could have a direct real‐time temporal match to
trading in the underlying equity even if the most recent transaction shows a significant delay. 78
Boluch and Chamberlain (1997) used intraday option trading data to show that option
volume could lead to stock price changes and that stock volume could lead to option price
changes. However, these relationships exist for short periods of time and the authors thought
there was little or no opportunity for market participants to take advantage of these lead‐lag
relationships.79
Option Volume Used as Leading Indicator
78 Chan K, Chung Y, Johnson H. Why option prices lag stock prices: a trading‐based explanation. Journal of
Finance. 1993;48(5):1957‐1967.
79 Boluch MJ, Chamberlain TW. Option volume and stock price behavior: some evidence from the Chicago
Board of Options Exchange. American Economic Journal. 1997;25(4):358‐370.

45
After making the assumption that option trading data may provide some evidence about
the future movement of an underlying stock, further analysis is needed to show which option
data variables have the most influence on future stock prices. The logical place to start looking
is the option volume variable because an abnormal increase in option volume could be a sign of
informed investors utilizing the options market.
Anthony (1988) found that call option volume was a leading indicator of volume in the
underlying stock.80 Although this is an interesting finding, anticipation of a known event
deadline could explain this finding. If the date or the approximate date of an event that is likely
to have a large impact on the underlying stock price of a given company is known in advance, it
is logical that investors may trade in options leading up to the event in order to both limit risk
and gain maximum leverage. Anthony also points out that individual stock subcategories may
be appropriate due the trading dynamics of a given industry.81 The pharmaceutical industry
could be one such sub‐industry that may be more likely to show option volume as a leading
indicator of stock volume due to increased volatility and advanced temporal knowledge
surrounding clinical trial results.
Easley, Ohara, and Srinivas (1998) found that “negative and positive option volumes
contain information about future stock prices.” Using intraday option data, this study also found
that negative option effects were stronger than positive effects. In other words, a net negative
80 Anthony J. The interrelation of stock and options market trading‐volume data. Journal of Finance.
1988;43(4):949‐964.
81 Anthony J. The interrelation of stock and options market trading‐volume data. Journal of Finance.
1988;43(4):949‐964.

46
change in option volume was more likely to lead to a future decline in stock price than would a
net positive change in option volume be likely to lead to an increase in stock price. 82
Chan, Chung, and Fong (2002) found evidence that informed investors initiated trades in
stocks and that stock prices contained information about future option prices, but option prices
did not predict future stock prices. However, option price quote revisions did provide
information about future stock prices. 83 This result implies that options may contain
information about future stock prices, but informed option traders may prefer not to use
market orders in an attempt to avoid paying the bid‐ask spread.84 This study showed that
intraday increases in net‐trade volume for stocks contained information about future stock
movements, but net‐trade volume increases in option contracts did not appear to be related to
future stock movements. Chan, Chung, and Fong also found that option returns were affected
by stock volume, but not by option volume. 85
Cao, Chen, and Griffin (2005) examined option volume prior to corporate takeovers.
This study had option data that allowed the researchers to categorize option volume as buyer
82 Easley D, O'Hara M, Srinivas P. Option volume and stock prices: evidence on where informed traders
trade. Journal of Finance. 1998;53(2):431‐465.
83 Chan K, Chung Y, Fong W. The informational role of stock and option volume. Review of Financial
Studies. 2002;15(4):1049‐1075.
84 Quote revisions occur when a new limit order enters the market. When a large bid‐ask spread exists it
is logical for the buyer to try to decrease the amount of spread paid by offering a new limit order closer to
execution than the previous limit order instead of paying the entire spread via a market order.
85 Chan K, Chung Y, Fong W. The informational role of stock and option volume. Review of Financial
Studies. 2002;15(4):1049‐1075.

47
initiated or seller initiated.86 They found that prior to takeover announcements, abnormally
high call option volume was related to the next‐day returns of the underlying stock.
Additionally, Cao et al. found that the largest call volume imbalances led to higher takeover
premiums.87
PutCall Ratios Used as Leading Indicators
Billingsley and Chance (1990) found evidence that the ratio between put and call
volume is a leading indicator of stock returns. This research also found evidence that the put‐
call ratio for the S&P 500 can and be used to predict future stock returns. However, after
transaction costs are considered, it would be difficult to create a profitable trading strategy
based on put‐call ratios for the S&P 500. It is noteworthy that transaction costs have declined
significantly since the Billingsley and Chance publication in 1990.88
Pan and Poteshman (2006) showed that stocks with high put‐call ratios underperformed
stocks with low put‐call ratios on the next trading day.89 However, Pan and Poteshman used a
unique data set which allowed them to indentify and use option volume initiated by buyers
86 This study does not have option data which allows categorization by buyer or seller initiation. Such
information would be useful for subsequent research.
87 Cao C, Chen Z, Griffin J. Informational content of option volume prior to takeovers. Journal of Business.
2005;78(3):1073‐1109.
88 Billingsley R, Chance D. Put‐call ratios and market timing effectiveness. Journal of Portfolio
Management. 1988;15(1):25‐28.
89 Pan J, Poteshman AM. The information in option volume for future stock prices. The Review of Financial
Studies. 2006;19(3):871‐906.

48
opening new positions. For most studies involving options data, the identification of buyers
opening new positions is not available. Pan and Poteshman also found that deep out‐of‐the‐
money options show the greatest level of predictability of future stock returns when abnormal
put‐call ratios are present.90
Insider Trading
The rules and regulations pertaining to insider trading were first established by the
Securities and Exchange Commission (SEC) Rule 10b‐5 under the Securities and Exchange Act of
1934.91 SEC Rule 10b‐5 was updated by Rules 10b5‐1 and 10b5‐2 in 2000. These SEC rules and
case law rulings set the current standard for what is considered legal or illegal insider trading.
This combination of rulings and case law is broken down into the classical theory and the
misappropriation theory. The classical theory states that a company insider cannot use
“material non‐public information” about the company for which he is an insider to profit from
securities transactions.92 It is noteworthy that the definition of a company “insider” covers
company employees, but also extends to “temporary insiders.” The temporary insider
classification includes situations “where corporate information is revealed legitimately to an
underwriter, accountant, lawyer, or consultant working for the corporation, these outsiders may
become fiduciaries of the shareholder.”93
90 Pan J, Poteshman AM. The information in option volume for future stock prices. The Review of Financial
Studies. 2006;19(3):871‐906.
91 Securities and Exchange Commission. Securities Exchange Act of 1934.
http://www.sec.gov/about/laws/sea34.pdf (accessed September 23, 2008)
92 Chiarella v. United States, 445 U.S. 222, 228 (1980).
93 Dirks v. SEC, 463 U.S. 646, 655 n.14 (1985)

49
The misappropriation theory of insider trading applies to situations where nonpublic
information is used to trade securities and there is an implied duty to keep said information
private. Under the classical theory of insider trading, some insiders could argue that no fiduciary
duty existed due to non‐official employment or a lack of contractual obligations, but with the
misappropriation theory the implied confidentiality duty extends to insider’s who are not under
contractual obligations. Although these cases would typically be considered temporary insiders
under the classical view of insider trading, in the 1997 Supreme Court case United States v.
O’Hagan, the Court specified the rationale for treating temporary insiders with a fiduciary duty
under the misappropriation theory. In this case, the Court stated that confidential information
about a company is akin to property owned by the company. Therefore, any misuse or
misappropriation of said property can be considered fraud akin to embezzlement.94 Although
United States v. O’Hagan was controversial, the ruling implied that the duty owed to sources of
information extends beyond the scope of temporary insiders.
Clinical Trials and Insider Trading
According to the code of ethics for the American Medical Association (AMA), “once a
clinical investigator becomes involved in a research project for a company or knows that he or
she might become involved, she or he, as an individual, cannot ethically buy or sell the
company’s stock until the involvement ends and the results of the research are published or
94 United States v. O’Hagan 521 U.S. 642, 655 (1997).

50
otherwise disseminated to the public.”95 Clearly, employees and clinical investigators have an
ethical duty of confidentiality when involved in a clinical trial. From a legal perspective, it is also
clear that investigators and employees are classified as temporary insiders under the classical
definition of insider trading and these individuals are barred from securities trading based on
non‐public information. During a clinical trial, the research company or institution conducting
the trial will typically sign a confidentiality agreement with the pharmaceutical company. Such
an agreement further solidifies the insider status of all employees and temporary employees
involved the in clinical trial process.96 Although it is clear that physicians and scientists
employed by a company performing a clinical trial are classified as insiders or temporary
insiders, such a classification does not necessarily apply to clinical trial participants. 97,98 The
definition and case law related to temporary insiders is important to this research because said
definition is somewhat unclear when applied to participants in clinical trial research. Horwich
found that clinical trial participants should not be considered temporary insiders under the
application of the classical theory of insider trading. According to Horwich, clinical trial
participants are not considered “temporary insiders” because there is no “temporary fiduciary
95 American Medical Association Code of Ethics E‐8.031 (1999) http://www0.ama‐
assn.org/apps/pf_new/pf_online?f_n=browse&p_p=T&&s_t=&st_p=&nth=1&prev_pol=policyfiles/HnE/E‐
8.031.HTM&nxt_pol=policyfiles/HnE/E‐8.032.HTM& (Accessed Sept. 28, 2008)
96 Steinbrook R. Gag clauses in clinical‐trial agreements. New England Journal of Medicine
2005;352(21):2160‐2162.
97 Prentice RA, Clinical trial results, physicians, and insider trading. The Journal of Legal Medicine
1999;20:195‐222.
98 Horwich A: The clinical trial research participant as an inside trader: a legal and policy analysis. Journal
of Health Law 2006 Winter;39(1):77‐116.

51
relationship between the trader and issuer of securities.”99 In the case of the research
participant, there is no reasonable expectation of trust and confidence bestowed upon the
research participant which would lead to temporary insider status. Therefore, under the
classical theory of insider trading, research participants are not considered insiders.
The misappropriation theory covers insider trading cases where non‐public information
is used to trade securities “in breach of a duty owed to the source of the information.”100 Such
breaches cover both implied and contractual assumptions of trust and confidence between the
party disseminating insider information and the party acting on the insider information. Under
the misappropriation theory, research employees and temporary employees have a clear duty
owed to the research firm even when an overt confidentiality agreement is absent. Therefore,
under the misappropriation theory, employees and temporary employees would always be
considered insiders with respect to insider trading laws.101 However, insider status is less clear
when applied to research participants. As with the classical theory, research participants still do
not necessarily owe a duty of trust and confidence to the pharmaceutical company. Therefore,
Horwich argues that, “absent an express agreement to the contrary, the clinical trial participant
is generally able to trade based on any material nonpublic information gained during the course
of the trial without running afoul of rule 10b‐5.”102
99 Horwich A: The clinical trial research participant as an inside trader: a legal and policy analysis. Journal
of Health Law. Winter 2006;39(1):77‐116
100 Chiarella v. United States, 445 U.S. 222, 228 (1980).
101 United States v. O’Hagan 521 U.S. 642, 655 (1997).
102 Horwich A. The clinical trial research participant as an inside trader: a legal and policy analysis. Journal
of Health Law Winter 2006;39(1):77‐116.

52
Although research subjects are not barred from trading in securities based on insider
information garnered through the clinical trial process, such transactions are ethically
questionable.103 Horwich argues that clinical trial participants are putting themselves at risk for
the benefit of society and the medical community; consequently, it is reasonable for these
participants to make financial gains in these situations.104 However, Horwich fails to consider
the problems that would be created if trial participants started enrolling in the trials for the sole
purpose of trading securities based on information obtained through the clinical trial process.105
Although a complete analysis of the legal and ethical considerations related to insider
trading is beyond the scope of this research, the authors of this research are assuming that
insider trading based on non‐public information is illegal for employees and temporary
employees. However, insider trading may or may not be illegal for clinical trial research
participants.
103 Helft PR, Ratain MJ, Epstein RA, Siegler M. Inside information: financial conflicts of interest for
research subjects in early phase clinical trials. Journal of the National Cancer Institute. 2004;96(9):656‐
660.
104 Horwich A. The clinical trial research participant as an inside trader: a legal and policy analysis. Journal
of Health Law. Winter 2006;39(1):77‐116.
105 Anand G, Smith R. Biotech analysts strive to peek inside clinical tests of drugs. The Wall Street Journal.
August 8, 2002

53
Biomedical Insider Trading
In 1997, the Securities and Exchange Commission (SEC) charged a biomedical researcher
with insider trading for the first time.106 In 2002, the National Association of Securities Dealers
(NASD) investigated an analyst at Sterling Financial Group who attempted to enroll himself in a
clinical trial with the apparent motive to gain information about the trial’s progress.107 By 2005,
the Seattle Times reported that there have been at least 26 documented cases of doctors
leaking confidential drug research to Wall Street firms.108
Although it is unclear whether or not secrecy during the clinical trial process is beneficial
to the medical community, there is increasing evidence that insider information is often
leaked.109,110 Some researchers argue that clinical trial information should be openly
disseminated throughout the trial process in order to provide the best possible clinical
106 SEC cites drug researchers in insider trading lawsuits. New York Times. April 11, 1997:D4.
107 Anand G, Smith R. Biotech analysts strive to peek inside clinical tests of drugs. The Wall Street Journal.
August 8, 2002
108 Timmerman L, Heath D. Drug researchers leak secrets to Wall St. Seattle Times. August 7, 2005.
109 Wells RJ. Secrecy and integrity in clinical trials. Journal of Clinical Oncology. 2008;26(4):680‐682.
110 Topol EJ, Blumenthal D. Physicians and the investment industry. Journal of the American Medical
Association. 2005;293:2654‐2657.

54
outcomes.111 Others argue that whenever possible the results of clinical trial studies should be
published in medical journals prior to publication or dissemination to the media.112
Options Used in Insider Trading
A large proportion of the literature on insider trading focuses on stock transactions.113
Event study methodology is often used for these studies despite the sometimes long‐term
holding period for equities. An analysis of short‐term options could be a better indication of
abnormal returns because of the finite investment period represented by equity options. A
stock can be held indefinitely which makes the predicted holding period of insider transactions
difficult to estimate. Therefore, an insider purchasing stock could be purchasing the stock in
anticipation of long‐term appreciation. Such a purchase may not obtain information about the
near‐term movement of the stock. However, an insider purchase of a stock option that expires
at a set near‐term date may be a better predictor of abnormal returns because the catalyst of
the movement of the underlying stock must occur before option expiration.114,115
111 Wells RJ. Secrecy and integrity in clinical trials. Journal of Clinical Oncology. 2008;26(4):680‐682.
112 Freestone DS, Mitchell H. Inappropriate publication of trial results and potential for allegations of
illegal share dealing. British Medical Journal. 1993;306:1112‐4.
113 MacKinlay CA. Event studies in economics and finance. Journal of Economic Literature. 1997;35:13‐
39.
114 Lakonishok J, Lee I. Are insider trades informative?. Review of Financial Studies. 2001;14:79‐111.
115 Chen R, Zhao X The information content of insider call options trading. Financial Management.
2007;34(2):153‐172.

55
Chen and Zhao (2007) found evidence that supports the theory that some company
insiders use complicated options and stock trading strategies to manipulate the market.116 This
research found that when company insiders sold calls in covered call117 transactions, the
underlying stock produced an abnormally negative return. Chen and Zhao concluded that these
returns were logical because the only reason to sell a covered call was knowledge of a pending
negative event.118 However, there are many other reasons to participate in a covered call
investment strategy including, but not limited to: receiving a better total return than an outright
sale of the equity, expectations of non‐company specific economic problems, and future
expectation of small positive equity returns.119 Additionally Chen and Zhao did not consider the
magnitude of the spread between the strike price of the sold call option and the current value of
the underlying equity. If an underlying equity is selling for $10 and a company insider sells a call
option for $20 using a covered call strategy, there is no logical reason to conclude that that
company insider expects a negative company event. However, if a company insider sold a $7.50
call option when the underlying stock was trading at $10, a logical conclusion could be reached
that the insider expects a negative company event.
Cao, Chen, and Griffin (2005) found evidence that if information about a pending
takeover is leaked, options markets are likely to reveal this information prior to stock markets.
116 Chen R, Zhao X The information content of insider call options trading. Financial Management.
2007;34(2):153‐172.
117 A “covered call” is an investment strategy where the holder of an equity sells a call option on that
equity holding and collects a premium for selling said call. The buyer of the call option then has the right
to exercise this option and buy the equity at a specified price for the duration of the call option.
118 Chen R, Zhao X The information content of insider call options trading. Financial Management.
2007;34(2):153‐172.
119 McMillian LG. Options as a Strategic investment. New York: Prentice Hall Press, 4th Sub Edition; 2002.

56
Although Cao, Chen, and Griffin’s research is not designed to specifically examine illegal insider
trading, the authors suggest that their research provides evidence that regulators should expend
more efforts monitoring options markets which implies that options are being illegally used by
insiders.120
The Effect of New Product Approval
This study will attempt to use publicly traded stock option data to predict clinical trial
results. The prediction of such results assumes that some knowledge about clinical trial results
is leaked before the official trial results are made public and that when trial results are made
public, the underlying company’s stock will experience an abnormal return. Therefore, an
analysis of the literature focused on the stock market effect of new product approvals is
necessary in order to validate this assumption.
Outside the realm of pharmaceutical products, Eddy and Saunders found that new
product approvals did not have any substantive effect on the underlying stocks.121 Although
Eddy and Saunders found no abnormal returns surrounding the announcement of new products,
the study methodology used in their research would not work well when applied to
pharmaceutical companies. Eddy and Saunders examined market returns for 20 months before
and 20 months after new product announcement dates. However, Eddy and Saunders looked at
120 Cao C, Chen Z, Griffin J. Informational content of option volume prior to takeovers. Journal of Business.
2005;78(3):1073‐1109.
121 Albert ER, Saunders GB. New product announcements and stock prices. Decision sciences. 1980;11(1):90–97.

57
the end‐of‐month values exclusively and did not examine the day‐to‐day fluctuations in stock
price. For research examining abnormal returns, daily price data may be more useful than
monthly “snapshot” prices. Additionally, in the pharmaceutical industry, the drug development
process can take up to 15 years from conception of a new compound to market approval.122
Therefore, abnormal returns for pharmaceutical companies may occur outside the time period
studied by Eddy and Saunders. Additionally, the biomedical industry is rather uniquely situated
to create abnormal returns near market approval events due to the difficulty, expense, and time
required to create new products and the large effect a new product approval can have on future
revenue and profit. This phenomenon is amplified further when focusing solely on small
companies because the effect of a new product has a larger effect on the total business
prospects of smaller companies.
Previous event‐based studies that have examined stock prices for publicly traded
pharmaceutical companies before and after product approvals have returned mixed
results.123,124 Sharma and Lacey examined abnormal returns specifically related to new product
introductions for pharmaceutical companies. In this study, 344 new drug approvals and 41
rejections were examined. Sharma and Lacey found significant abnormal returns for
pharmaceutical stocks in the time period surrounding the FDA approval of a new drug.
However, Sharma and Lacey did not sufficiently explain why their study was heavily focused on
122 DiMasi JA. New drug development in the United States, 1963‐1999. Clinical Pharmacology and
Therapeutics. 2001;69(5):69‐78.
123 Ahmed, I. The market return to pharmaceutical product approval. University of Texas at Arlington.
Master’s degree thesis. May 2007.
124 Sharma A, Lacey N. Linking product development outcomes to market valuation of the firm: the case
of the US pharmaceutical industry. Journal of Product Innovation Management. 2004;21:297‐308.

58
new drug approvals (n=344) and examined a much smaller proportion of new drug rejections
(n=41).125
Ahmed found statistically significant positive abnormal returns for pharmaceutical
companies the day after a new drug approval and no evidence of leakage ahead of event
publication.126 Ahmed also found no abnormal return for the ten‐day period surrounding
approval. Ahmed concluded that the abnormal market return the day after product approval
may occur because new pharmaceutical product approval announcements tend to occur
towards the end of the trading day. Ahmed’s study did not differentiate new drug approvals
based on the market potential of the new products or based on the size of underlying company.
It is logical to assume that there would not be an abnormal return for a large company such as
Pfizer for the time period surrounding a new drug approval for a relatively low profit margin
drug such as an orphan drug. For some large companies, a new drug approval for a drug with a
limited potential market would not be expected to change the investment outlook of the entire
company. Ahmed’s study may have reached different conclusions if company size and/or the
expected market potential of the new drug approval in question were included in the regression
analysis.
125 Sharma A, Lacey N. Linking product development outcomes to market valuation of the firm: the case
of the US pharmaceutical industry. Journal of Product Innovation Management. 2004;21:297‐308.
126 Ahmed, I. The market return to pharmaceutical product approval. University of Texas at Arlington.
Master’s degree thesis. May 2007.

59
Event Studies
Financial market based event studies are typically used to measure the effect of a
specific event on the equity returns for a company or a group of companies.127 Based on the
efficient market hypothesis, the effects of an event are presumed to be immediately reflected in
the equity prices of the underlying company.128 This theory is based on the assumption that a
publicly traded equity is accurately priced as a reflection of the expected future value of cash
flows and profits for a given company. Therefore, event studies can be used to quickly measure
the total economic value of an event by comparing the change in market capitalization pre‐to‐
post event for the company experiencing the event. The event study as applied to financial
markets was popularized by Fama et al. in 1969.129 The methods used by Fama et al. in 1969 set
the standard methodology for financial market based event studies and many of the methods
used by Fama et al. are still used in modern event studies.130
Statement of Purpose
The purpose of this study was to create models which examine the ability of options
data to predict phase II or III clinical trial results. The results of these models were used to show
evidence or lack of evidence related to leaked insider trading information. Finally, information
127 Henderson, V. Problems and solutions in conducting event studies. The Journal of Risk and Insurance.
1990;57(2):282‐306.
128 MacKinlay CA. Event studies in economics and finance. Journal of Economic Literature. 1997;35(1):13‐
39.
129 Fama EF, Lawrence F, Jensen MC, Roll, R. The adjustment of stock prices to new information.
International Economic Review. 1969;10(1):1‐21.
130 MacKinlay CA. Event studies in economics and finance. Journal of Economic Literature. 1997;35(1):13‐39.

60
and probabilities found in the model were used to create investment strategy recommendations
for small pharmaceutical companies with pending company events.
Objectives
The study objectives were to:
1. Create a model, based on the characteristics of historical option data, to predict
phase II or III clinical trial results and/or FDA panel recommendations and approval
decisions.
2. Determine whether evidence of leaked insider trading information exists through an
analysis looking for successful investment trends in options data prior to the release
of phase II or III trial results and FDA approval decisions.
3. Create an investment strategy model based on historical options data that can
identify investment opportunities based on the results of the event prediction
model.
Hypotheses
1. For small biotech companies131 with three or fewer currently approved drugs, a
significant discrepancy between the relative prices (implied volatility) for calls and
puts shortly before trial results or FDA decisions will be a predictor of the trial or
FDA decision outcome.
131 Less than $5 billion in market cap

61
2. For companies with positive announcements, there will be a statistically significant
difference between the implied volatility of call options and the implied volatility of
put options in the day prior to the announcement.
3. For companies with negative announcements, there will be a statistically significant
difference between the implied volatility of call options and the implied volatility of
put options in the day prior to the announcement.
4. After positive and negative dichotomization, the difference between the estimated
invested dollars (EID) for calls and puts will be a significant predictor of event
outcomes.
5. When short‐biased arbitrage situations exist for small biotech companies with
pending phase II or III results or a pending FDA decision, the trial results will be
unfavorable for the drug or biomedical device or the FDA will not approve the drug
or biomedical device.132
132 Example: On April 10, 2007 it was possible to short sell Neurochem (NRMX), sell the May $15 puts, and
buy the May $15 calls for an arbitrage gain of about 7%. The existence of such an arbitrage situation
illustrates high demand for shares available to short leading to increased put option prices.

62
Chapter 2: Methodology
Introduction
This study was designed to use options data to predict outcomes of clinical trials and
FDA decisions. After clinical trial and FDA decision events were identified, both binary logistic
and multinomial logistic regression models were used to find significant predictor variables in
the options data.
Regression Model Overview
For the event outcome model, three iterations of a binary logistic regression model
were used to examine the relationships between the independent variables and the
dichotomous outcomes of positive or negative post‐event movement in the underlying stock.
The first iteration used the dichotomous difference variables for EID, OI, and IV. The
dichotomization was performed by grouping all negative values together and grouping all
positive values together. This model best matches the hypotheses and objectives of this
research because it uses variables that represent the difference between option values for calls
and puts. Additionally, by dichotomizing based on positive and negative values, the differences
variables capture a signal that either calls (positive values) or puts (negative values) are favored
by investors. This research was designed to see if the differences between calls and puts
provide information about future event outcomes and the positive/negative dichotomous
transformation was assumed to be the most likely dichotomous grouping technique that would
provide information about future event outcomes. For comparison purposes, two alternative
dichotomization grouping techniques were also conducted. These dichotomous transformations

63
used the mean and the median values (EID difference mean = $27,652,405, median =
$2,290,985; open interest difference mean = 13,895, median = 4767; implied volatility
difference mean = ‐0.0201, median = ‐0.0366) as cut points respectively for the dichotomization.
Therefore, the first iteration of the binary logistic regression model produced three different
sets of results based on three different dichotomization methods.
The second iteration of the binary logistic regression model used the same variables as
the first iteration, but with continuous values. The second iteration is designed to show the
differences in the data between the raw continuous values and dichotomized values. The third
iteration of the binary logistic model used the raw variable values for calls and puts separately
instead of using variables that represent the difference between calls and puts. The third
iteration of the binary logistic regression model was designed to examine the raw values
associated with each data point for calls and puts to see if there is a relationship between the
raw data values and the event outcome.
The binary logistic regression used for this research took the form:
ln ln Ŷ /1 Ŷ) = a +bX
where Ŷ = the predicted probability of the event
or expressed in probability terms:
P=
Separately, two iterations of a multinomial logistic regression model with trichotomous
outcomes were used to examine the relationships between the independent variables and the

64
trichotomous outcomes of positive, negative, or neutral post‐event movement in the underlying
stock. The independent variables were the same for the three iterations of the multinomial
logistic regression as they were for the three iterations of the binary logistic regression models.
Independent variables for the first iteration of the binary logistic regression model and
the multinomial trichotomous logistic regression model included:
OI Difference Dichotomized—the difference between the sum of all open
interest in calls and the sum of all open interest in puts dichotomized into
groups of positive and negative values;
EID Difference Dichotomized—the difference in “estimated invested dollars”
(EID) between calls and puts calculated using the aggregate delta value x 100 x
open interest x price of the underlying shares, dichotomized into groups of
positive and negative values; and
IV Difference Dichotomized—the difference between the average implied
volatility of calls and the average implied volatility of puts, dichotomized into
groups of positive and negative values.
The non‐adjusted difference variables included in the first iterations of both the binary
and multinomial logistic regression models are the primary predictor variables for this research.
Using non‐adjusted dichotomized difference variables as the primary independent variables
allows a relatively simple real‐time calculation of EID, OI, and IV for use as a prospective
investment tool. The second iteration of the model uses continuous values for the difference
variables to see if there is a relationship between continuous values and event outcomes.

65
However, this research did not hypothesize that there would be any relationship between the
raw call and put values and event outcomes.
Independent variables for the second iteration of the binary logistic regression model
included:
OI Difference—the difference between the summary of all open interest in calls
and the summary of all open interest in puts represented as an open interest
calibrated put/call ratio;
EID Difference—the difference in “estimated invested dollars” (EID) between
calls and puts calculated using the aggregate delta value x 100 x open interest x
price of underlying shares; and
IV Difference—the difference between the average implied volatility of calls and
the average implied volatility of puts.
Independent variables for the third iteration of the binary logistic regression model
included:
Call OI—sum of open interest for calls;
Put OI—sum of open interest for puts;
Call EID—sum of EID for calls;
Put EID—sum of EID for puts;
Call IV—average implied volatility for calls; and
Put IV—average implied volatility for puts.
Independent variables for the second iteration of the multinomial logistic
regression model included:

66
OI Difference Categorical—the difference between the summary of all open
interest in calls and the summary of all open interest in puts represented as a
categorical variable with four evenly dispersed cut points;
EID Difference Categorical—the difference in “estimated invested dollars” (EID)
between calls and puts calculated using the aggregate delta value x 100 x open
interest x price of underlying shares, represented as a categorical variable with
four evenly dispersed cut points; and
IV Difference Categorical—the difference between the average implied volatility
of calls and the average implied volatility of puts, represented as a categorical
variable with four evenly dispersed cut points.
All summary variables represented the sum of the available option information for the
trading day prior to the announcement of the event in question. Examination of temporal
changes in the summary values of the option metrics were considered, but in order to truly
examine the effect of the event being measured, baseline or previous time periods were not
included in the regression equations. All publicly traded companies have many different
influences on share price and option contracts. As time from the event being measured
increases, the likelihood that any change in the value of the underlying stock or change in the
derivative products of the underlying stock is actually related to the event being measured
decreases. This study is designed to see if options data can provide information about the
success or failure of a future event. Information related to the first trading day before the event
being measured would be most likely to truly measure the event being tested. The difference
variables of EID, open interest, and implied volatility are likely to include all available

67
information about the future event on the day before the event. Open interest was used
instead of volume data because open interest represents the current exposure to a given
option. On the day prior to an event, the current exposure logically should be a better predictor
of the event being measured than volume would be because volume is not cumulative over any
period of time. If volume was included as an independent variable, a baseline period would
have to be established in order to examine any abnormal trends. Any such baseline time period
would be susceptible to many other influences on the option data. Any prior time period would
likely include the information about the event and information about other events or other
market‐moving publicly disseminated information or non‐qualifying events. Therefore, this
study focused on option data from the first trading day before the event being measured in
order to avoid confounding from other influences. Additionally, the three primary independent
variables all represent data points that potentially can provide information about investor
expectations without requiring any baseline information. Table 2.0 summarizes the regression
models used in this study.
Table 2.0 Summary of regression models
Type of Regression Iteration Independent Variables Dependent Variable
Binary logistic 1 Dichotomized EID, OI, and IV difference variables
Dichotomous event outcome, positive or negative
Binary logistic 2 Continuous values of EID, OI, and IV difference variables
Dichotomous event outcome, positive or negative
Binary logistic 3 Raw variable values for EID, OI, and IV for calls and puts separately
Dichotomous event outcome, positive or negative

68
Type of Regression Iteration Independent Variables Dependent Variable Multinomial logistic 1 Dichotomized EID, OI,
and IV difference variables
Positive, negative, or neutral outcomes, ‐10%, and +10% cut points
Multinomial logistic 2 Categorical EID, OI, and IV difference variables
Positive, negative, or neutral outcomes, ‐10%, and +10% cut points
Positive and Negative Predictive Power
Paired t‐tests were used to measure significant differences for raw value variables and
difference variables. Difference variables were then recoded into dichotomous variables in
order to examine the positive predictive value (PPV) and negative predictive value (NPV) of the
difference variables. For the dichotomous form of the OI difference, EID difference, and IV
difference variables, it is assumed that a positive value indicates investors favor calls, for
negative values it is assumed that investors favor puts. Therefore, positive values are assumed
to provide an indication that the event being measured will have a positive outcome while
negative values for the dichotomous transformation of the difference variables are assumed to
provide an indication of a negative outcome.
PPV and NPV calculations were then repeated with different subgroups of the study
population based on type of event. Clinical trial results were grouped separately from FDA
decisions in order to see if the predictive ability of the option information changed based on the
type of event being measured.

69
Event Outcomes – Dependent Variables
Although most event‐based studies in the literature use various calculations for abnormal
returns to define whether or not the event in question produced a positive or negative reaction
in the underlying stock, this study will use a simple positive or negative indicator for the binary
logistic regression models.133 The event outcome variable for the binary logistic regression
models included two values:
negative (≥ 0%); coded as 1, and
positive (< 0%); coded as zero
For the multinomial logistic regression models, this study attempted to identify situations of
extreme price movement that would be enticing for insider trading. Therefore, the multinomial
logistic regression models used negative 10%, and positive 10% as outcome variable categorical
cut points to yield three levels for the outcome variables:
negative (< ‐ 10%), coded as zero;
neutral (≥ ‐ 10% and ≤ + 10%), coded as 1, and;
positive (> + 10%) coded as 2.
In these models, measurement of whether or not a return is abnormal is insufficient to
identify events that result in extreme price movements. The presence or absence of abnormal
returns are often calculated using the index model which assumes each firm has the same
133 MacKinlay CA. Event Studies in Economics and Finance. Journal of Economic Literature.
1997;35(1):13‐39.

70
average return as the market.134 For this study, an index‐based abnormal return calculation
would have been of questionable value because the companies in question were on average
significantly more volatile than the market as a whole. Other studies have used a reference
portfolio which selects a portfolio of companies that are of similar size and in the same industry
to set the baseline for abnormal returns. However, such a reference portfolio is not possible for
this study because, based on the inclusion criteria, this study examines all companies that could
have possibly been used in a reference portfolio. If the study population is decreased in order
to create a reference population, power would be decreased and the total study population
could be too small.
Event Timing
Outcomes were stratified based on the post‐event movement of the underlying stock
price. End‐of‐day stock prices for the last closing date prior to the announcement were used for
baseline prices. For announcements that occurred prior to 3:50pm EST on the event day, the
prior trading day closing values were used as the baseline values and the closing values on the
event day were used as the post‐event values. This research assumed that the efficient market
hypothesis applies, but that it does not manifest in real time. Therefore, a ten‐minute delay in
the assimilation of all current information into the underlying stock price was assumed to be a
sufficient time lag (one event fell in this 10‐minute time period). For any company event that
took place at a time equal to or later than 10 minutes before the close of trading, the baseline
134 Khotari SP, Warner JB. Econometrics of event studies. Handbook of Corporate Finance: Empirical
Corporate Finance. Elsevier/North‐Holland; 2006.

71
options data was calibrated using the day of the event and the post‐event data was obtained
from the end‐of‐day prices for the stock and options for the first trading day after the event.
For the purpose of this study, a “positive” event is defined as the announcement of
phase II or III trial results or an FDA decision that causes a positive move in the stock price of the
underlying company. A “negative” event is defined as the announcement of phase II or III trial
result or an FDA decision that causes a negative move in the stock price of the underlying
company. For the multinomial logistic regression models, a “neutral” event is defined as an
announcement of phase II or III trial results or an FDA decision that causes less than a 10%
positive or negative move in the stock price of the underlying company and positive and
negative events are defined using the +10% and ‐10% thresholds, respectively. The 10% event
threshold will be considered met if the stock price closes with a change > 10% from baseline at
the end of the event day for events released before 3:50pm EST on the day of the event and at
the end of the next trading day following the event day for event press releases occurring after
3:50pm EST on the event day. Although this definition of “positive,”“negative,” and “neutral”
events will not necessarily match the wording of the press release or company announcement
associated with the event, movement of the underlying equity should be a better indicator of
whether or not an event is truly positive or negative than a subjective interpretation of the
results or the subjective reliance on the wording of the company press release.
Independent Variables
The relative expense of call and put options will be measured by calculating the
difference between the average implied volatilities for all of the call options that have remaining
time value and the average implied volatilities for all of the put options that have remaining

72
time value. Due to the higher risk involved with shorting stock compared to buying stock and
the lack of shares available to short, this study expected that the average of the implied
volatility values for puts would be slightly higher than the implied volatility values for calls.135
Comparisons of the relative expense of call and put options between different companies at
different points in time need to be adjusted for current overall market volatility measures. For
models using implied volatility differences between calls and puts, implied volatility measures
were not adjusted for the current value of the VIX because the focus was on the difference
between implied volatilities of call and puts, not on the raw values. 136 The assumption was
made that changes in the current value of the VIX would affect the implied volatilities of both
the calls and the puts.
In theory, an investor should be willing to pay more for an option if said investor has
advance knowledge of a pending event. The difference between the implied volatility of calls
and puts was included as an independent variable in order to provide some information about
the price premium or discount investors are willing to pay for calls versus puts. The examination
of the implied volatility difference variable assumes that if investors are willing to pay a relative
price that is higher for one group of options than another, the investors paying more have a
strong bias towards the directional expectation expected by calls (positive) or puts (negative).
135 The Black‐Scholes model assumes that the stock can be shorted. In actual trading, often stocks cannot
be shorted or a fee must be paid in order to obtain shares to short. Both of these situations create more
demand for put options than for call options.
136 The “VIX” is the Chicago Board Options Exchange volatility index for the S&P 500. The Black‐Scholes
model incorporates the volatility of the underlying stock, but it does not calculate the volatility of the
entire stock market. When market wide volatility is high, investors will be willing to pay more for put
options even if the company in question is a stable company with a low beta. Therefore, comparisons of
option prices between different companies at different times will be adjusted based on the current value
of the VIX.

73
Open interest was included as an independent variable in order to capture the demand for a
given option. In theory, if there is more demand or a higher open interest for put options
compared to call options, investors may have advance knowledge about a pending negative
event. Open interest is potentially a more appropriate predictor variable than volume because
it helps capture total investment exposure.137 Volume data can capture the total investment
exposure of a given option contract, but the volume would have to be measured for a long
period of time which would allow non‐event related influences to affect investment exposure.
The call/put open interest ratio was used as an independent variable in order to account for a
bias towards calls or puts for a given security. The EID was used as an independent variable in
order to create a proxy for total investor exposure to a move in the underlying stock. Since the
EID value represents a proxy for the aggregate potential investment gain of all open option
contracts, the EID should represent investor sentiment if investors are buying naked option
contracts. Since an unlimited number of option contracts can be created, the EID helps measure
investor interest with a method that weights the open interest based on the value and expected
movement of the option contracts.
Short‐biased arbitrage situations are defined as any situation where it is possible to lock
in an investment gain with zero risk due to inflated values for put options. This scenario
typically arises when there are few shares available to short, but the underlying equity has a
negative bias from the investment community as a whole. In these situations, it is possible to
short the underlying stock, sell puts and buy calls at the same strike price and lock in an
137 See “Volume and Open Interest” section of the Option Contracts Basics portion of this manuscript.

74
arbitrage profit. The options data for all of the companies in this study were examined for the
presence of short‐biased arbitrage situations.
Data Source
This study used historical options data provided by DeltaNeutral.com, LLC. Data fields
supplied by DeltaNeutral.com that were used for this study included: underlying symbol,
underlying price, option root, option extension, end‐of‐day price, option expiration date, type of
option, data date, option strike price, open interest, volume, implied volatility, delta, gamma,
theta, and vega. Table 2.1 shows some sample data and Table 2.2 further describes each data
field.
Table 2.1 Sample data fields for one day covering 3 strike prices
Table 2.2 Description of data elements included in the study
Data Field Description of Data Field
Underlying Symbol The equity symbol for the underlying company
Underlying Price The end‐of‐day equity price for the underlying company
Option Root The first 1‐3 letters of the options symbol

75
Data Field Description of Data Field
Option Extension The final 2 letters of the option symbol
Put/Call Specifies whether the option is a put or a call
Expiration The expiration date for the option
Data Date The date the data was recorded
Strike The price at which the option can be exercised
Price The last trade price for the specified date
Volume Option trading volume for the specific option symbol and date
Open Interest Total number of options that remain open on the specified date
Implied Volatility Derivative of the Black‐Scholes model, used to show the option
premium
Delta Ratio of change in price of underlying asset to change in price of
option
Gamma The rate of change of delta with respect to the underlying price
Theta The rate of decline of the value of the option due to time decay
Vega The amount the price of the option changes compared to a 1%
change in volatility
Although the financial event study literature does not appear to include any published
studies using data from DeltaNeutral.com, financial constraints eliminated the possibility of
obtaining all of the data from sources typically used for research on historical options values. In
order to validate the accuracy of the DeltaNeutral.com data, spot checks were performed using
data from Bloomberg, Think or Swim, and Yahoo Finance. Bloomberg and Think or Swim data
were used to check the accuracy of the option open interest, option volume, option implied
volatility, and all of the option Greek values. Yahoo Finance and Think or Swim data were used

76
to validate end‐of‐day stock prices. A random sample of the data was selected and cross
referenced with the appropriate data source and at least one option value was checked for each
event being studied.
Company Selection
This study examined option prices of small pharmaceutical companies prior to major
company announcements including Phase II and III trial results, FDA panel recommendations,
and FDA approval decisions. All companies included in this study were publicly traded on the
New York Stock Exchange, the American Stock Exchange, or the Nasdaq Stock Exchange.
Foreign companies were included in this study as long as the company’s shares were listed as an
American Depository Receipt (ADR) on one of the aforementioned US stock exchanges. All
included companies also had equity options traded on the Chicago Board of Exchange.
This study focused on the relative prices of call and put options prior to major company
events. Therefore, each included company had a least one significant company event between
April 1, 2006 and April 1, 2010. For this study, “significant company events” are defined as
Phase II or III trial results, FDA panel recommendations, and FDA approval decisions. Included
companies were required to have at least 3 months of stock and option data available prior to
the significant company event. Therefore, companies with recent initial public offerings (IPOs)
or companies that recently began trading in equity options were eliminated from the study.
Stocks of small pharmaceutical companies tend to have large price swings due to
positive or negative clinical trial results and FDA decisions. Although the stocks of large
pharmaceutical companies can be volatile, the magnitude of price swings following major

77
company announcements is typically less than the price moves experienced by small
pharmaceutical companies. Often, late‐stage trial results can make or break a small publicly
traded pharmaceutical company. As a result, the high volatility in equity prices for small
pharmaceutical companies creates incentive and opportunity for insiders to profit from pre‐
event, non‐public information.
Inclusion and Exclusion Criteria
In order to capture a higher percentage of companies with expected high volatility,
companies with a market capitalization greater than $5 billion at the close of the last trading day
prior to the event in question were excluded from the study.138 Additionally, companies with
three or more previously approved drugs were excluded. Press releases related to diagnostic‐
based products were not included as “events” in this study. Although diagnostic‐based products
can be profitable, announcements and approvals of these products typically do not have a large
effect on the underlying stock price for companies primarily focused on drug discovery.
Although there are exceptions, many companies with three or more previously approved drugs
with a market capitalization under $5 billion are companies that focus on niche products.
Company announcements regarding small niche products are less likely to have a major effect
on stock volatility if the market value of the product would not be a significant portion of the
companies’ total revenue. Additionally, the clinical trials for these products involve significantly
fewer patients and researchers. Therefore, companies focused on small niche products are
unlikely to exhibit the same option price trends as those companies focused on larger more
138 The assumption was made that companies with smaller market captilalizations would be more likely to
see a move in the underlying stock that is directly related to a single event concerning released
information about a drug trial.

78
profitable drugs. The ≥ 3 currently approved drugs exclusion criterion will help mitigate the
problems created by small niche products, but these products still create a limitation for this
study. Alternatively, an estimated market value of each drug or product in phase III could have
been created for each company to exclude small niche drugs and products. However, the
market value would have been difficult to estimate and could potentially lead to a significant
inclusion bias. Therefore, this study did not include a qualitative “expected market value” of the
investigational drug exclusion criterion in order to keep the analysis as objective as possible.
Total open interest in options contracts was also used as an exclusion criterion. If the
option contracts of a given company show a significant deviation from average values, but the
open interest is small, the total amount of money risked would likely be small. The likelihood of
leaked insider information is also small when the total amount of money risked is small.
Therefore, companies with fewer than 500 total open option contracts (as measured by the
open interest statistic) in the month prior to the company event, were excluded from this study.
Table 2.3 lists the company related inclusion and exclusion criteria and Table 2.4 lists all of the
companies that were included in the study after the inclusion and exclusion criteria were
applied.
Table 2.3 Target company inclusion and exclusion criteria
Inclusion Criteria Exclusion Criteria Stock traded on NYSE, Nasdaq or Amex Market cap > $5 billion
Equity option traded on the CBOE Currently approved drugs ≥3
3+ months of option and stock history Non‐pharmaceutical company focus
1+ qualifying event in prior 48 months
Company involved in pharmaceutical clinical trials

79
The full list of candidate companies for this study was taken from Reuters Finance list of
biotechnology/medical‐research publicly traded companies139, Reuters Finance list of
pharmaceuticals/diversified companies140, Yahoo Finance list of biotechnology publicly traded
companies141, and Yahoo Finance list of drug manufacturers publicly traded companies142.
These lists were then filtered by the company related exclusion criteria previously explained.
Appendix A provides a complete list of the companies that were considered for inclusion in this
study and the applicable exclusion criteria for those companies that were excluded. The
complete list of companies included in the study after the exclusion criteria were applied is
shown in Table 2.4.
Table 2.4 Companies included in the study
Company SymbolMarket Cap Options
Major US Exchange
Drug Co
# drugs <= 3 Event
ACADIA Pharmaceuticals, Inc. ACAD 48.69M yes yes yes yes yes
Acorda Therapeutics, Inc. ACOR 1.28B yes yes yes yes yes
Adolor Corp. ADLR 69.07M yes yes yes yes yes
Alexion Pharmaceuticals, Inc. ALXN 4.74B yes yes yes yes yes
Alkermes ALKS 1.2B yes yes yes yes yes
Allos Therapeutics, Inc. ALTH 738.71M yes yes yes yes yes
Alnylam Pharmaceuticals, Inc. ALNY 662.14M yes yes yes yes yes
Amylin Pharmaceuticals, Inc. AMLN 2.56B yes yes yes yes yes
139 Reuters US Edition Industries. Available at:
http://www.reuters.com/sectors/industries/overview?industryCode=159. Accessed 3/12/2010.
140 Reuters US Edition Industries. Available at:
http://www.reuters.com/sectors/industries/overview?industryCode=158. Accessed 3/12/2010.
141 Yahoo Finance Industry Browser‐Healthcare‐Biotechnology‐Company List. Available at:
http://biz.yahoo.com/p/515conameu.html. Accessed 3/12/2010.
142 Yahoo Finance Industry Browser‐Healthcare‐Drug Manufacturers‐Company List. Available at:
http://biz.yahoo.com/p/510conameu.html. Accessed 3/12/2010.

80
Company SymbolMarket Cap Options
Major US Exchange
Drug Co
# drugs <= 3 Event
Anadys Pharmaceuticals Inc. ANDS 91.88M yes yes yes yes yes
Arena Pharmaceuticals, Inc. ARNA 295.58M yes yes yes yes yes
Ariad Pharmaceuticals Inc. ARIA 377.42M yes yes yes yes yes
Auxilium Pharmaceuticals AUXL 1.2B yes yes yes yes yes
Avanir Pharmaceuticals AVNR 234.42M yes yes yes yes yes
BioCryst Pharmaceuticals, Inc. BCRX 282.30M yes yes yes yes yes
BioMarin Pharmaceutical Inc. BMRN 2.02B yes yes yes yes yes
Cadence Pharmaceuticals Inc. CADX 354.66M yes yes yes yes yes
Cardiome Pharma Corp. CRME 507.53M yes yes yes yes yes
Cell Therapeutics, Inc. CTIC 328.15M yes yes yes yes yes
Celldex Therapeutics CLDX 156.99m yes yes yes yes yes
Clinical Data, Inc. CLDA 398.50M yes yes yes yes yes
Columbia Laboratories CBRX 70.85m yes yes yes yes yes
Cubist Pharmaceuticals Inc. CBST 1.20B yes yes yes yes yes
Cypress Bioscience, Inc. CYPB 164.63M yes yes yes yes yes
Dendreon Corp. DNDN 4.98B yes yes yes yes yes
DepoMed Inc. DEPO 156.59M yes yes yes yes yes
Durect Corp. DRRX 232.58M yes yes yes yes yes
Dyax Corp. DYAX 255.94M yes yes yes yes yes
Exelixis, Inc. EXEL 511.39M yes yes yes yes yes
GTX Inc. GTXI 111.81M yes yes yes yes yes
Halozyme Therapeutics, Inc. HALO 644.15M yes yes yes yes yes
Human Genome Sciences Inc. HGSI 4.91B yes yes yes yes yes
Idenix Pharmaceuticals Inc. IDIX 359.91M yes yes yes yes yes
Immunogen Inc. IMGN 486.70M yes yes yes yes yes
Immunomedics IMMU 251.39M yes yes yes yes yes
Incyte Corporation INCY 1.58B yes yes yes yes yes
Inspire Pharmaceuticals, Inc. ISPH 443.56M yes yes yes yes yes
InterMune Inc. ITMN 533.14M yes yes yes yes yes
Isis Pharmaceuticals, Inc. ISIS 935.39M yes yes yes yes yes
Jazz Pharmaceuticals, Inc. JAZZ 254.21M yes yes yes yes yes
Keryx Biopharmaceuticals Inc. KERX 248.99M yes yes yes yes yes
Ligand Pharmaceuticals Inc. LGND 190.48M yes yes yes yes yes
Medicines Co. MDCO 407.29M yes yes yes yes yes
Medivation, Inc. MDVN 365.93M yes yes yes yes yes
Micromet, Inc. MITI 542.38M yes yes yes yes yes
Momenta Pharmaceuticals Inc. MNTA 624.81M yes yes yes yes yes
Myriad Pharmaceuticals, Inc. MYGN 95.87M yes yes yes yes yes

81
Company SymbolMarket Cap Options
Major US Exchange
Drug Co
# drugs <= 3 Event
Nabi Biopharmaceuticals NABI 250.67M yes yes yes yes yes
Neurocrine Biosciences Inc. NBIX 247.29M yes yes yes yes yes
NPS Pharmaceuticals, Inc. NPSP 411.76M yes yes yes yes yes
Oncothyreon Inc ONTY 95.29M yes yes yes yes yes
Onyx Pharmaceuticals Inc. ONXX 1.45B yes yes yes yes yes
Orexigen Therapeutics, Inc. OREX 215.78M yes yes yes yes yes
Osiris Therapeutics, Inc. OSIR 185.84M yes yes yes yes yes
Pain Therapeutics Inc. PTIE 231.83M yes yes yes yes yes
PDL BioPharma, Inc. PDLI 642.65M yes yes yes yes yes
Pharmacyclics Inc. PCYC 324.18M yes yes yes yes yes
Poniard Pharmaceuticals, Inc. PARD 39.55M yes yes yes yes yes
POZEN, Inc. POZN 221.12M yes yes yes yes yes
Progenics Pharmaceuticals Inc. PGNX 205.74M yes yes yes yes yes
Protalix BioTherapeutics, Inc. PLX 522.43M yes yes yes yes yes
Regeneron Pharmaceuticals, Inc REGN 2.18B yes yes yes yes yes
Repros Therapeutics Inc. RPRX 16.50M yes yes yes yes yes
Rigel Pharmaceuticals, Inc. RIGL 399.65M yes yes yes yes yes
Sangamo Biosciences Inc. SGMO 188.08M yes yes yes yes yes
Savient Pharmaceuticals, Inc. SVNT 820.88M yes yes yes yes yes
SciClone Pharmaceuticals, Inc. SCLN 158.60M yes yes yes yes yes
Seattle Genetics Inc. SGEN 1.30B yes yes yes yes yes
Spectrum Pharmaceuticals, Inc. SPPI 202.45M yes yes yes yes yes
Theravance Inc. THRX 1.14B yes yes yes yes yes
United Therapeutics Corp. UTHR 3.01B yes yes yes yes yes
Vanda Pharmaceuticals, Inc. VNDA 190.70M yes yes yes yes yes
ViroPharma Inc. VPHM 898.03M yes yes yes yes yes
VIVUS Inc. VVUS 965.41M yes yes yes yes yes
Xenoport, Inc. XNPT 304.71M yes yes yes yes yes
ZymoGenetics, Inc. ZGEN 418.40M yes yes yes yes yes
Event Selection
After the company‐related exclusion criteria were applied, press releases during a four‐
year period were examined for each of the 76 companies which met the company‐based

82
inclusion/exclusion criteria. The event‐related inclusion and exclusion criteria were then applied
to find the final events that were included in the study. This study defined “events” as the
public release of information pertaining to: phase II clinical trial results; phase III clinical trial
results; suspension of a phase II or phase III clinical trial due to lack of efficacy or unethical
superiority to the comparator; FDA panel recommendations; FDA approval decisions; FDA non‐
approval decisions; FDA approvable letters; FDA complete response letters; and FDA safety
warnings. After applying these event inclusion criteria to the 76 companies included in the
study, 363 events were identified. These 363 events were then examined to see if they met any
of the event exclusion criteria.
Previous Release of Information
Any “event” where results had been previously released in the form of a press release,
was not included as an event for this study. In these cases, only the first public release of trial
information was included as an event even if the first press release only revealed preliminary
study results. All subsequent press releases pertaining to the results of the same trial, at the
same level, did not qualify as events. Although sometimes the more relevant market‐moving
information is presented when final trial results are released, other times the market moves
when the partial results are released if investors think the partial results are indicative of a
success or failure. By eliminating events that had previously released information, this study is
able to better focus on events that should have a market‐moving potential.
Clinical trial results are sometimes released at scientific conferences prior to general
release in the form of a press release. Since such a release of clinical trial information is not
available to the general investing public, but is presumably available to some market

83
participants, this study assumes that some of the information obtained in the clinical trial results
will have already manifested itself in the stock price of the underlying company and the options
traded on the underlying company. Therefore, when identifiable, events that had been
previously released at a scientific conference were excluded from this study.
Multiple Events and Event Timing
If one company had two or more events occur within 14 days of each other, the higher
magnitude event was included and the lower magnitude event was excluded. For the purpose
of this research, the order of magnitude of the events is as follows: phase II trial results, phase III
trial results, FDA panel recommendation, phase II trial suspension, phase III trial suspension,
FDA approvable letter, FDA complete response letter, FDA safety warning, FDA approval or non‐
approval. When two events were released on the exact same day, both events were excluded
from the study.
Pharmaceuticals can sometimes be approved before the final results of the clinical trial
are released. In these situations, the final trial results are still released at a later date.
However, these post‐approval trial results are less likely to move the price of the underlying
stock when the drug in question has already been approved. Therefore, post‐approval events
were not included in this study.
If one company had more than five total “qualifying events” within the event time
period, the most recent five qualifying events were included in the study. The maximum
number of events for one given company was implemented to avoid one company having too
large of an effect on the regression models.

84
Sometimes companies choose to release clinical trial results or partial results during
company earnings announcements or conference calls. In these situations, it is difficult to tell
whether a subsequent movement in the underlying stock was a result of company earnings or a
result of clinical trial results. In order to remove the subjective nature of trying to evaluate
which factor actually caused the underlying stock to move, these events were eliminated from
this study.
Availability of Options Data
All of the companies that met the company inclusion criteria had options trading on the
underlying security as of April 1, 2010. However, not all of these companies had options trading
for the entire time period of the study. Therefore, in order for an event to qualify for the study,
options must have been trading on the underlying security at the time of the event and for at
least three option expiration dates prior to the event being measured.
Generics
Clinical trial results and FDA decisions made on generic formulations of already‐
approved drugs were not included as events in this study. This study is focused on
pharmaceutical‐related events that have market moving potential. Although the approval of a
generic drug could in some circumstances have a large effect on the underlying stock, more
typically, the approval of a generic is assumed to happen and the value of the generic approval
is often already incorporated in the underlying stock because the same chemical compound has
previously been approved.

85
FDA Decisions
FDA approval decisions that expand the indication for an already‐approved drug were
not included in this study. Although in some cases a secondary indication approval can be a
market‐moving event, such events are less likely to have a large effect on the underlying stock
than the first indication approval of a new drug.
Company announcements related to FDA special protocol assessments and expedited
review status can sometimes move the underlying stock, but typically such announcements
have little effect on the underlying stock because they are not necessarily correlated to an
actual approval or non‐approval. Therefore, press releases related to the FDA review status
were not included as events for this study.
Other Exclusions
Small pharmaceutical companies are often the target of mergers and acquisitions.
Typically, in a merger or acquisition situation, if the merger or acquisition is already announced,
the terms of the merger or acquisition set a fixed value for the underlying stock. Therefore, an
event that occurred after the announcement of a merger or acquisition is less likely to move the
underlying stock because the set price of the merger or acquisition has not changed. Therefore,
events occurring after a merger or acquisition has been announced, but before the underlying
stock and options stop trading, were eliminated from this study.
Clinical trial results for medical devices and drug delivery systems were not included in
this study. Although such results could have market‐moving potential, this study only included

86
pharmaceutical trial results of new drug entities in order to maintain event similarity across all
identified events.
Clinical trial results related to orphan drugs may have less of an effect on the underlying
stock of the company in question. However, some small pharmaceutical companies focus only
on orphan drugs. For these companies, the results of the orphan drug trial could have a large
effect on the underlying stock. Therefore, trial results and FDA decisions related to orphan
drugs were included if the company in question did not have any currently approved non‐
orphan drugs at the time of the event. If the company had previously approved non‐orphan
drugs, it was assumed that new information about an orphan drug trial would not have a large
effect on the underlying stock, resulting in the exclusion of these events.
A summary list of the event‐related inclusion and exclusion criteria is presented in Table
2.5. After all of the event‐related inclusion and exclusion criteria were applied to the events and
companies previously identified, the final study event population consisted of 190 events from
75 different companies. A complete list of all qualifying events can be seen in Table 2.6.
Table 2.5 Event inclusion and exclusion criteria
Qualifying Events Non‐Qualifying Events
Phase II clinical trial results Phase II or III clinical trial results that were already partially released
Phase III clinical trial results Events of the same magnitude for the same company occurring within 10 days of each other
Phase II or III clinical trial suspension More than 5 total events for a given company
FDA panel recommendations Events occurring at a time when the underlying company did not have options trading
FDA decision (approval) Events that had delayed press releases due to earlier conference presentation
FDA decision (non‐approval) Post‐approval trial results

87
Qualifying Events Non‐Qualifying Events
FDA decision (approvable letter) FDA approval of a generic formulation of an already‐approved drug
FDA decision (complete response letter) FDA approval of a minor secondary indication of an already‐approved drug
FDA safety warning FDA granting special protocol assessment
FDA granting expedited review
Partial trial results given during earnings announcements
Events announced for a company that has a pending purchase or merger
Trial results for drug delivery systems
Orphan drug results if company in question had at least one non‐orphan drug approval
Event that is at a lower stage than another event occurring within a 30‐day time period
Less than 500 total open interest in option contract on the baseline event day
Table 2.6 Events included in the study listed in chronological order
Company Symbol Event Day Event Cat Time
% change post event Description of Event
Amylin Pharmaceuticals, Inc. AMLN 2/9/2006
trial results
4:05:00 PM EST ‐2%
Phase II Pramlintide results for treatment of obesity
ViroPharma Inc. VPHM 3/29/2006 trial
results 08:17pm
EST 9%
Phase II results of Maribavir an oral anti‐viral drug
Alkermes ALKS 4/13/2006 FDA
decision 03:50pm EDT 4% FDA approval of VIVITROL
Neurocrine Biosciences Inc. NBIX 4/27/2006
trial results
04:01pm EDT ‐2%
Phase II results GnRH in endometriosis
VIVUS Inc. VVUS 5/5/2006 trial
results 08:01am EDT 8%
Phase III results of Evamist for the treatment of hot flashes in menopausal women
Neurocrine Biosciences Inc. NBIX 5/16/2006
FDA decision
07:30am EDT ‐62%
Neurocrine Biosciences, Inc. Receives Approvable Letter for indiplon Capsules and Non‐Approvable for

88
Company Symbol Event Day Event Cat Time
% change post event Description of Event
indiplon Tablets for the Treatment of Insomnia
GTX Inc. GTXI 6/22/2006 trial
results 08:01am EDT ‐4%
Phase III results evaluating Acapodene for the treatment of MS side effects
Cypress Bioscience, Inc. CYPB 6/27/2006
trial results
02:57pm EDT 3%
Phase II results of mirtazpine for sleep apnea, results warrant an end to the investigation
Dendreon Corp. DNDN 6/29/2006 trial
results 06:00pm EDT 12%
Phase III results for Provenge treatment of prostate cancer
Nabi Biopharmaceuticals NABI 7/13/2006
FDA panel
03:17pm EDT 2%
FDA advisory panel recommends approval of Nabi‐HB treatment for hepatitis B after liver transplant
Cardiome Pharma Corp. CRME 7/24/2006
trial results
07:45am EDT 36%
Interim phase II results of oral ISD1235 for the treatment of recurrent atrial fibrillation
Spectrum Pharmaceuticals, Inc. SPPI 8/2/2006
trial results
07:31am EDT 6%
Phase II trial results for Ozarelix in treatment of hormone‐dependent prostate cancer
PDL BioPharma, Inc. PDLI 8/3/2006
trial results
04:30pm EDT 1%
Phase III results of terlipressin in treatment of hepatorenal syndrome
ZymoGenetics, Inc. ZGEN 9/5/2006 trial
results 04:10pm EDT ‐4%
Phase III results of rhThrombin for the treatment of surgical bleeding
VIVUS Inc. VVUS 9/29/2006 trial
results 09:30am EDT ‐6%
Phase II results of ALISTA (topical alprostadil), for the treatment of female sexual arousal disorder (FSAD)
Regeneron Pharmaceuticals, Inc REGN 10/30/2006
trial results
04:53pm EST 3%
Phase III results for IL‐1 for treatment of CAPS
Avanir Pharmaceuticals AVNR 10/31/2006
FDA decision
08:31am EST ‐46%
FDA approvable letter for Zenvia

89
Company Symbol Event Day Event Cat Time
% change post event Description of Event
Adolor Corp. ADLR 11/6/2006 FDA
decision 07:00am
EST ‐45% FDA issues approvable letter for Entereg
DepoMed Inc. DEPO 12/12/2006 trial
results 07:30am
EST ‐5%
Phase II results for Gabapentin GR treatment for diabetic peripheral neuropathy
Repros Therapeutics Inc. RPRX 12/16/2006
trial results
06:00am EST 12%
Phase III results of Androxal for treatment of testicular function
Amylin Pharmaceuticals, Inc. AMLN 12/22/2006
FDA decision
04:05pm EST ‐1% FDA approval for Byetta
Myriad Pharmaceuticals, Inc. MYGN 1/8/2007
trial results
06:30am EST 0%
Phase II results of MPC‐7869 for treatment of prostate cancer
Neurocrine Biosciences Inc. NBIX 1/8/2007
trial results
07:00am EST ‐3%
Phase II results of second phase II trial of GnRH in endometriosis
Columbia Laboratories CBRX 2/4/2007
trial results unknown ‐68%
Phase III trial of Progesterone fails to meet endpoints
Onyx Pharmaceuticals Inc. ONXX 2/12/2007
trial results
04:11am EST 97%
Phase III results for Nexavar treatment for advanced liver cancer
Auxilium Pharmaceuticals AUXL 2/20/2007
trial results
07:00am EST ‐1%
Phase III AA4500 results (Dupuytren's contracture)
Human Genome Sciences Inc. HGSI 2/27/2007
trial results
04:05pm EST 0%
Phase II results of Albuferon as treatment for hepatitis
Alexion Pharmaceuticals, Inc. ALXN 3/16/2007
FDA decision
02:05pm EDT 7% FDA approval for Soliris
ACADIA Pharmaceuticals, Inc. ACAD 3/19/2007
trial results
08:01am EDT 103%
"Positive" results from phase II ACP‐103

90
Company Symbol Event Day Event Cat Time
% change post event Description of Event
Regeneron Pharmaceuticals, Inc REGN 3/27/2007
trial results
01:30am EDT 15%
Phase II results reported for VEGF Trap‐Eye for treatment of macular degeneration
Dendreon Corp. DNDN 3/29/2007 FDA panel
05:54pm EDT 148%
FDA panel recommends approval of Provenge treatment for prostate cancer
Theravance Inc. THRX 4/2/2007 trial
results 04:06pm EDT ‐3%
Phase II results of the beyond Advair program for treatment of asthma
Adolor Corp. ADLR 4/9/2007 trial
results 06:02pm EDT ‐59% Entereg linked to heart risk
Dyax Corp. DYAX 4/12/2007 trial
results 04:01pm EDT 49%
Phase III results for Dx‐88 plasma kellikrein inhibitor for HAE (rare disease)
Avanir Pharmaceuticals AVNR 4/18/2007
trial results
08:30am EDT 309%
Phase III results on Zenvia in diabetic pain
Xenoport, Inc. XNPT 4/25/2007 trial
results 03:01am EDT 44%
Phase III results of XP13512 for the treatment of symptoms of primary restless legs syndrome
Nabi Biopharmaceuticals NABI 5/2/2007
trial results
09:16am EDT 11%
Phase II results of NicVAX for treatment of nicotine addiction
Inspire Pharmaceuticals, Inc. ISPH 5/8/2007
trial results
07:30am EDT ‐10%
Phase II results of epinastine nasal spray
Dendreon Corp. DNDN 5/9/2007 FDA
decision 05:30am EDT ‐64%
Dendreom receives complete response letter from FDA regarding Provenge
Medivation, Inc. MDVN 5/11/2007 trial
results 01:30am EDT 6%
Phase II results of Dimebon for treatment of Alzheimer’s disease
Cypress Bioscience, Inc. CYPB 5/22/2007
trial results
04:56pm EDT 94%
Phase III study results for milnacipran as treatment for fibromyalgia

91
Company Symbol Event Day Event Cat Time
% change post event Description of Event
Pharmacyclics Inc. PCYC 6/1/2007 trial
results 02:00pm EDT 0%
Phase II results of Xcytrin for treatment of non‐small cell lung cancer
Regeneron Pharmaceuticals, Inc REGN 6/2/2007
trial results
12:00pm EDT ‐12%
Phase III results for VEGF Trap for treatment of ovarian cancer and lung cancer
Ariad Pharmaceuticals Inc. ARIA 6/3/2007
trial results
04:00pm EDT 8%
Phase II AP23573 cancer drug trial results
Immunomedics IMMU 6/4/2007 trial
results 08:00am EDT ‐4%
Phase II preliminary results of labetuzumab for treatment of colorectal cancer
Idenix Pharmaceuticals Inc. IDIX 6/12/2007
trial results
07:00am EDT ‐7%
Phase II results of valopicitabine (NM283), for the treatment of hepatitis C
Theravance Inc. THRX 7/9/2007 trial
results 04:11pm EDT ‐2%
Phase II results of TD‐1792 antibiotic treatment of skin structure infections
DepoMed Inc. DEPO 7/10/2007 trial
results 07:00am EDT ‐59%
Phase III results for Gabapentin GR in postherpetic neuralgia
Durect Corp. DRRX 7/17/2007 trial
results 08:30am EDT 18%
Phase II results for Posidur hernia trial
Auxilium Pharmaceuticals AUXL 7/24/2007
trial results
10:00am EDT ‐3% Phase III results on Xiaflex
Spectrum Pharmaceuticals, Inc. SPPI 7/24/2007
FDA panel unknown ‐9%
FDA panel says that FDA should wait for survival analysis of Satraplatin before approval
VIVUS Inc. VVUS 7/30/2007 FDA
decision 08:01am EDT ‐3%
FDA approves Evamist or the treatment of moderate to severe vasomotor symptoms due to menopause.
POZEN, Inc. POZN 8/2/2007 FDA
decision 09:10am EDT ‐43%
FDA issues second approvable letter of Trexima for treatment of migraines

92
Company Symbol Event Day Event Cat Time
% change post event Description of Event
BioMarin Pharmaceutical Inc. BMRN 8/13/2007
trial results
09:00am EDT 1% Phase III results for Kuvan
Exelixis, Inc. EXEL 9/4/2007 trial
results 08:30pm EDT 3%
Phase II results of XL647 for treatment of non‐small cell lung cancer
Medicines Co. MDCO 9/14/2007 FDA
decision 08:00am EDT 4%
The Medicines Company Receives FDA Acceptance For Cleviprex
BioCryst Pharmaceuticals, Inc. BCRX 9/19/2007
trial results
04:04pm EDT ‐32%
Phase II results for Permivir, influenza treatment
Arena Pharmaceuticals, Inc. ARNA 9/25/2007
trial results
07:30am EDT ‐2% Phase II results of APD125
Isis Pharmaceuticals, Inc. ISIS 10/4/2007
trial results
08:00am EDT ‐2%
Phase II results of 30102 in heterozygous FH patients
NPS Pharmaceuticals, Inc. NPSP 10/11/2007
trial results
08:02am EDT ‐26%
Phase III results of GATTEX for treatment of short bowel syndrome
PDL BioPharma, Inc. PDLI 10/11/2007
trial results
04:26pm EDT 0%
Phase II results of daclizumab for treatment of MS
Amylin Pharmaceuticals, Inc. AMLN 10/17/2007
FDA warning 08:00pmEDT 0%
Warning about cases of pancreatitis
Theravance Inc. THRX 10/22/2007 trial
results 07:02am EDT ‐3%
FDA issues approvable letter for telavancin for the treatment of complicated skin and skin structure
Spectrum Pharmaceuticals, Inc. SPPI 10/30/2007
trial results
11:35pm EDT ‐8%
Phase III trial of Satraplatin did not meet primary endpoint for the treatment of prostate cancer
Vanda Pharmaceuticals, Inc. VNDA 10/31/2007
trial results
05:15pm EDT ‐26%
Phase II results of VSF‐173 for the treatment of chronic insomnia

93
Company Symbol Event Day Event Cat Time
% change post event Description of Event
United Therapeutics Corp. UTHR 11/1/2007
trial results
04:30am EDT 38%
Phase III results of treprostinil for treatment of pulmonary arterial hypertension. Study meets primary endpoint
Momenta Pharmaceuticals Inc. MNTA 11/6/2007
FDA decision
10:03am EST ‐58%
FDA Rejects Novartis AG Drugs Division Sandoz And Momenta Pharmaceuticals, Inc.'s M‐Enoxaparin
Onyx Pharmaceuticals Inc. ONXX 11/19/2007
trial results
08:02am EST ‐5%
FDA approves Nexavar for treatment of liver cancer
United Therapeutics Corp. UTHR 12/5/2007
trial results
04:30am EST ‐2%
Phase III results of OvaRex Mab for treatment of ovarian cancer. Study failed to meet primary endpoint.
Durect Corp. DRRX 12/6/2007 trial
results 07:45am
EST 10%
Phase III Remoxy results show Remoxy met its primary endpoint
Pain Therapeutics Inc. PTIE 12/6/2007
trial results
07:45am EST 6%
Phase III trial for Remoxy met its primary endpoint
BioMarin Pharmaceutical Inc. BMRN 12/13/2007
FDA decision
01:02pm EST 6% FDA approval of Kuvan
Neurocrine Biosciences Inc. NBIX 12/13/2007
FDA decision
03:00am EST ‐49%
FDA approvable letter for Indiplon for treatment of insomnia
Rigel Pharmaceuticals, Inc. RIGL 12/13/2007
trial results
07:30am EST 224%
Phase II results of R788 for treatment of Rheumatoid Arthritis
Savient Pharmaceuticals, Inc. SVNT 12/13/2007
trial results
06:00am EST 18%
Phase III results for Puricase for treatment failure gout patients
Pharmacyclics Inc. PCYC 12/21/2007 FDA
decision 07:00pm
EST ‐26%
Non‐approvable letter issued by FDA for Xcytrin for treatment of NSCLC
Cell Therapeutics, Inc. CTIC 1/17/2008
trial results
01:30am EST 1%
Phase II results radioimmunotherapy

94
Company Symbol Event Day Event Cat Time
% change post event Description of Event
Alnylam Pharmaceuticals, Inc. ALNY 1/23/2008
trial results
07:45am EST 5%
ALN‐RSV01 Phase II prelim results
Medicines Co. MDCO 2/5/2008 trial
results 08:00am
EST ‐3%
Phase III trial results for Cleviprex (VELOCITY trial) for blood pressure control for patients with renal dysfunction and heart failure
Onyx Pharmaceuticals Inc. ONXX 2/18/2008
trial results
10:16am EST ‐26%
Phase III trial stopped early, Nexavar for treatment of non‐small cell lung cancer. Study did not meet primary endpoints
Regeneron Pharmaceuticals, Inc REGN 2/27/2008
FDA decision
06:00pm EST 6%
FDA approves Arcalyst for treatment of CAPS
Keryx Biopharmaceuticals Inc. KERX 3/7/2008
trial results
09:00pm EST ‐2%
Phase III results of Sulonex for treatment of diabetic nephropathy, trial failed to meet objectives
Medivation, Inc. MDVN 4/7/2008 trial
results 04:02pm EDT 2%
Phase II results for Dimebon for treatment of Huntington's disease
POZEN, Inc. POZN 4/15/2008 FDA
decision 08:58pm EDT 6%
FDA approves Treximet for treatment of migraine attacks.
Inspire Pharmaceuticals, Inc. ISPH 4/23/2008
trial results
07:00am EDT ‐1%
Phase III results epinastine nasal spray for the treatment of seasonal allergic rhinitis (SAR) did not meet its primary endpoint
Progenics Pharmaceuticals Inc. PGNX 4/24/2008
FDA decision
06:56pm EDT 33%
FDA approves Relistor for the treatment of opioid‐induced constipation
Osiris Therapeutics, Inc. OSIR 5/8/2008
FDA decision
06:00am EDT 2%
FDA approves Prochymal for treatment of children with GvHD
Adolor Corp. ADLR 5/20/2008 FDA
decision unknown 3% Entereg linked to heart risk

95
Company Symbol Event Day Event Cat Time
% change post event Description of Event
Poniard Pharmaceuticals, Inc. PARD 5/31/2008
trial results
09:00am EDT 2%
Phase II results of Picoplatin for treatment of hormone‐refractory prostate cancer
Acorda Therapeutics, Inc. ACOR 6/2/2008
trial results
06:00am EDT 31%
Positive data from 2nd phase 3 study of fampridine
Rigel Pharmaceuticals, Inc. RIGL 6/3/2008
trial results
06:00am EDT ‐4%
Phase II results of R788 for treatment of lymphomas
Inspire Pharmaceuticals, Inc. ISPH 6/6/2008
trial results
07:54am EDT 36%
Phase III results of denufosol met goal of improved breathing
ACADIA Pharmaceuticals, Inc. ACAD 6/16/2008
trial results Pre‐market ‐43% Results of ACP‐1042b
Vanda Pharmaceuticals, Inc. VNDA 6/26/2008
trial results
06:30am EDT ‐3%
Phase III results of tasimelteon for treatment of chronic insomnia
Myriad Pharmaceuticals, Inc. MYGN 6/30/2008
trial results
02:31am EDT ‐5%
Phase III results of Flurizan for treatment of Alzheimer's disease. The study did not meet primary endpoints.
Repros Therapeutics Inc. RPRX 7/11/2008
trial results
06:00am EDT 2%
Phase II results of Proellex for treatment of endometriosis
Cardiome Pharma Corp. CRME 7/14/2008
trial results
08:25am EDT 24%
Phase 2 results for oral vernakalant (atrial fibrillation)
Vanda Pharmaceuticals, Inc. VNDA 7/28/2008
FDA decision
06:30am EDT ‐73%
FDA issues non‐approvable letter for iloperidone for treatment of schizophrenia. Additional trial required.
Elan ELN 8/1/2008 trial
results 03:46am EDT ‐50%
Elan confirms two cases PML for patients treated with Tysabri for MS
Amylin Pharmaceuticals, Inc. AMLN 8/18/2008
FDA warning
04:29pm EDT ‐4%
Second warning and ongoing review about cases of pancreatitis

96
Company Symbol Event Day Event Cat Time
% change post event Description of Event
Dyax Corp. DYAX 8/18/2008 trial
results 07:30am EDT 15%
Phase results for DX‐88, primary and secondary endpoints met
Cardiome Pharma Corp. CRME 9/11/2008
FDA decision
09:18am EDT ‐1%
FDA approvable letter for KYNAPID (atrial fibrillation)
NPS Pharmaceuticals, Inc. NPSP 9/15/2008
trial results
08:00am EDT ‐2%
Phase II results of NPSP558 for hypoparathyroidism
Sangamo Biosciences Inc. SGMO 9/15/2008
trial results
10:00am EDT ‐6%
Phase II results of ZFP for treatment of severe diabetic neuropathy
Acorda Therapeutics, Inc. ACOR 9/20/2008
trial results
08:30am EDT ‐5%
Data on second phase 3 study of fampridine
Columbia Laboratories CBRX 9/29/2008
trial results
07:00am EDT ‐28%
Phase II results of Lidocane for dysmenorrhea
GTX Inc. GTXI 10/13/2008 trial
results 06:00am
EST 9%
Phase II Ostarine trial met primary endpoints for patients with cancer induced muscle loss
ZymoGenetics, Inc. ZGEN 10/22/2008 trial
results 06:00am EDT 1%
Phase II results of Interleukin 21 (IL‐21) in combination with Nexavar (sorafenib) tablets in patients with metastatic renal cell cancer
Incyte Corporation INCY 10/26/2008 trial
results 07:45pm EDT ‐19%
Phase II results INCB18424 orally available janus kinase (JAK) inhibitor, in patients with rheumatoid arthritis
Progenics Pharmaceuticals Inc. PGNX 10/26/2008
trial results
12:15pm EDT ‐9%
Phase II results of PRO 140 HIV treatment
Pain Therapeutics Inc. PTIE 11/10/2008
FDA decision
10:11am EST ‐7%
FDA questions results of data Remoxy
United Therapeutics Corp. UTHR 11/17/2008
trial results
06:55am EST ‐35%
Phase III results of treprostinil for treatment of pulmonary arterial hypertension. Study failed

97
Company Symbol Event Day Event Cat Time
% change post event Description of Event
to meet primary endpoints.
Ligand Pharmaceuticals Inc. LGND 11/20/2008
FDA decision
07:03pm EST 50%
FDA granted accelerated approval of GlaxoSmithKline’s (GSK) PROMACTA (eltrombopag) for the treatment of thrombocytopenia
Xenoport, Inc. XNPT 12/2/2008 trial
results 07:30am
EST ‐35%
Phase II results of XP19986 (arbaclofen placarbil) extended release tablets to reduce symptoms experienced by subjects with gastroesophageal reflux disease, or GERD
Allos Therapeutics, Inc. ALTH 12/7/2008
trial results
08:00am EDT ‐21%
Phase 2 data released for Pralatexate
Human Genome Sciences Inc. HGSI 12/8/2008
trial results
07:00am EST 8%
Phase III results of Albuferon for treatment of chronic hepatitis
Pain Therapeutics Inc. PTIE 12/11/2008
FDA decision
08:53am EST ‐21%
Complete response letter from FDA for Remoxy abuse‐resistant oxycodone
VIVUS Inc. VVUS 12/11/2008 trial
results 07:00am
EST ‐6% Phase III results of Qnexa for weight loss
Orexigen Therapeutics, Inc. OREX 1/8/2009
trial results
04:58pm EST ‐16%
First of four phase III results of Contrave showing statistically significant reduction in body weight
Cypress Bioscience, Inc. CYPB 1/14/2009
FDA decision
07:24pm EST 33%
FDA approval of Savella (milnacipran) for treatment of fibromyalgia
Ligand Pharmaceuticals Inc. LGND 2/2/2009
trial results
09:05am EST 12%
Phase IIb study for PS433540, the first in class Dual Acting Receptor Agonist (DARA) that targets the angiotensin and endothelin receptors

98
Company Symbol Event Day Event Cat Time
% change post event Description of Event
BioMarin Pharmaceutical Inc. BMRN 2/3/2009
trial results
09:02am EST ‐2%
Phase 2 results of 6R‐BH4, not statistically significant
Dyax Corp. DYAX 2/4/2009 FDA panel
04:20pm EST ‐11%
FDA advisory panel favors approval of DX‐88 for acute HAE attacks
ViroPharma Inc. VPHM 2/9/2009 trial
results 09:05am
EST ‐53%
Phase III results of Maribavir used for bone marrow transplant patients. Study did not meet primary endpoint
Durect Corp. DRRX 3/16/2009 trial
results 09:00am EDT ‐11%
Phase IIb results for Transdur‐sufentanil patch
Dyax Corp. DYAX 3/26/2009 FDA
decision 04:00pm EDT ‐6%
FDA issues complete response letter to Dyax for DX‐88
Arena Pharmaceuticals, Inc. ARNA 3/30/2009
trial results
07:30am EDT ‐28%
Phase III lorcaserin obesity results
Dendreon Corp. DNDN 4/14/2009 trial
results Pre‐market 133% Phase III trial of Provenge met its primary endpoint
Onyx Pharmaceuticals Inc. ONXX 4/27/2009
trial results
02:00am EDT ‐5%
Phase III results of Nexavar for treatment of stage III or IV melanoma. Trial stopped early, did not meet primary endpoints.
Xenoport, Inc. XNPT 4/27/2009 trial
results 12:51pm EDT ‐15%
Phase II trial of XP13512 for the treatment of painful diabetic neuropathy (PDN)
Vanda Pharmaceuticals, Inc. VNDA 5/6/2009
FDA decision
06:37pm EDT 626%
FDA approves Fanapt (iloperidone) for treatment of schizophrenia
Alkermes ALKS 5/7/2009 trial
results 09:15am EDT 2%
Results from DURATION‐1 study
Micromet, Inc. MITI 5/8/2009 trial
results 07:01am EDT 0%
Phase II results of blinatumomab for treatment of acute lymphoblastic leukemia

99
Company Symbol Event Day Event Cat Time
% change post event Description of Event
Medicines Co. MDCO 5/13/2009 trial
results 07:02am EDT ‐37%
The Medicines Company Discontinues Phase 3 CHAMPION Clinical Trial Program Of Cangrelor
United Therapeutics Corp. UTHR 5/26/2009
FDA decision
05:22am EDT 12%
FDA approves Adcirca (tadalafil) for the treatment of pulmonary arterial hypertension
Celldex Therapeutics CLDX 5/30/2009
trial results
09:06am EDT (Sat) 24%
Phase II update on CDX‐110 brain cancer vaccine
Immunogen Inc. IMGN 5/30/2009 trial
results 08:02am EDT ‐3%
Phase II results of trastuzumab for treatment of breast cancer
Keryx Biopharmaceuticals Inc. KERX 5/31/2009
trial results
08:30am EDT 74%
Phase II results of Perifosine as a treatment for colon cancer
Clinical Data, Inc. CLDA 6/2/2009 trial
results 06:00am EDT 1%
Second Phase III trial results of vilazodone for depression
ViroPharma Inc. VPHM 6/4/2009 FDA
decision 07:30am EDT ‐8%
FDA issues complete response letter for Cinryze for treatment of hereditary angioedema
Incyte Corporation INCY 6/6/2009 trial
results 11:00am EDT ‐11%
Phase II study INCB13739 significantly improved glycemic control
Alnylam Pharmaceuticals, Inc. ALNY 6/8/2009
trial results
07:00am EDT ‐8%
Phase II results of ALN‐RSV01 in lung transplant patients
Cubist Pharmaceuticals Inc. CBST 6/8/2009
trial results
07:00am EDT ‐3%
Phase II results of ALN‐RSV01 in lung transplant patients
Keryx Biopharmaceuticals Inc. KERX 6/8/2009
trial results
08:32am EDT 25%
Phase II results of Zerenex for treatment of elevated serum phosphorous
Savient Pharmaceuticals, Inc. SVNT 6/16/2009
FDA panel
04:47pm EDT 7%
FDA panel recommended approval of Krystexxa for treatment of gout

100
Company Symbol Event Day Event Cat Time
% change post event Description of Event
Osiris Therapeutics, Inc. OSIR 6/23/2009
trial results
05:09pm EDT ‐7%
Phase II preliminary results of Prochymal for treatment of COPD
Repros Therapeutics Inc. RPRX 7/1/2009
trial results
06:00am EDT ‐31%
Update on Proellex trials, some doses are discontinued due to safety issues
Spectrum Pharmaceuticals, Inc. SPPI 7/5/2009
FDA decision
01:37pm EDT ‐17%
FDA issues complete response letter for Zevalin for the treatment of non‐Hodgkin's Lymphoma
BioCryst Pharmaceuticals, Inc. BCRX 7/17/2009
trial results
07:00am EDT 41%
Phase III results for Permivir, influenza treatment
Human Genome Sciences Inc. HGSI 7/20/2009
trial results
12:01am EDT 174%
Phase III results for Benlysta in systemic lupus
Orexigen Therapeutics, Inc. OREX 7/20/2009
trial results
06:59am EDT 27%
3 Phase III trials of Contrave met their primary endpoints in treatment of obesity
Onyx Pharmaceuticals Inc. ONXX 7/22/2009
trial results
08:01am EDT 21%
Phase II results Nexavar for treatment of advanced breast cancer. Study met primary endpoints.
Rigel Pharmaceuticals, Inc. RIGL 7/23/2009
trial results
06:00pm EDT ‐10%
Phase II results of R788 for treatment of Rheumatoid Arthritis. Trial did not meet endpoints.
United Therapeutics Corp. UTHR 7/30/2009
FDA decision
01:07pm EDT 12%
FDA approves treprostinil for treatment of pulmonary arterial hypertension
Savient Pharmaceuticals, Inc. SVNT 8/2/2009
FDA decision
06:00pm EDT ‐18%
FDA issues complete response letter for Krystexxa as a treatment for gout
Immunomedics IMMU 8/27/2009 trial
results 01:01am EDT 61%
phase IIb clinical study comparing epratuzumab to placebo in patients with systemic lupus erythematosus
ACADIA Pharmaceuticals, Inc. ACAD 9/1/2009
trial results
06:00am EDT ‐66%
Phase 3 trial results for Pimavanserin

101
Company Symbol Event Day Event Cat Time
% change post event Description of Event
Allos Therapeutics, Inc. ALTH 9/2/2009
FDA panel
06:09pm EDT ‐4%
FDA panel recommends approval of pralatrexate
Auxilium Pharmaceuticals AUXL 9/2/2009
trial results
05:05pm EDT ‐1% Xiaflex CORD I results
Regeneron Pharmaceuticals, Inc REGN 9/11/2009
trial results
04:05pm EDT ‐2%
Phase III trial of aflibercept is discontinued for treatment of metastatic pancreatic cancer
Theravance Inc. THRX 9/11/2009 FDA
decision 11:28pm EDT ‐1%
FDA approves telavancin for treatment of complicated skin and skin structure infections
Incyte Corporation INCY 9/21/2009 trial
results 08:02am EDT 9%
Phase II results of INCB18424 for treatment of Psoriasis
Allos Therapeutics, Inc. ALTH 9/25/2009
FDA decision
07:00am EDT ‐3%
FDA approval for FOLOTYNTM
Halozyme Therapeutics, Inc. HALO 10/1/2009
trial results
08:20am EDT ‐2%
Phase II results for regular insulin‐PH20 confirm faster insulin absorption
SciClone Pharmaceuticals, Inc. SCLN 10/2/2009
trial results
04:11pm EDT ‐10%
Phase II trial of RP101 for treatment of pancreatic cancer is discontinued
DepoMed Inc. DEPO 10/5/2009 trial
results 07:00am EDT 27%
Phase III results for DM‐1796 showed significant reduction in pain
Seattle Genetics Inc. SGEN 10/5/2009
trial results
07:00am EDT ‐15%
Phase II study of dacetuzumab as a treatment for lymphoma was discontinued due to lack of efficacy
Spectrum Pharmaceuticals, Inc. SPPI 10/9/2009
FDA decision
07:00am EDT ‐18%
FDA issues complete response letter for Fusilev for treatment of metastatic colorectal c cancer
DepoMed Inc. DEPO 10/12/2009 trial
results 07:00am EDT ‐38%
Two phase III trials for Serada for treatment of hot flashes

102
Company Symbol Event Day Event Cat Time
% change post event Description of Event
Acorda Therapeutics, Inc. ACOR 10/14/2009
FDA panel
03:37pm EDT 47%
FDA panel recommends approval
Protalix BioTherapeutics PLX 10/15/2009
trial results
06:00am EDT 6%
Phase III results of UPLYSO for treatment of Gaucher disease
Isis Pharmaceuticals, Inc. ISIS 10/21/2009
trial results
04:00pm EDT 4%
Phase II results of 113715 in patients with type 2 diabetes
GTX Inc. GTXI 11/2/2009 FDA
decision 08:00am
EST ‐49%
FDA issues complete response letter for toremifene to reduce fractures for men with prostate cancer
Human Genome Sciences Inc. HGSI 11/16/2009
FDA decision
07:00am EST 4%
FDA issues complete response letter for raxibacumab for treatment of inhaled anthrax
Poniard Pharmaceuticals, Inc. PARD 11/16/2009
trial results
07:01am EST ‐76%
Phase III results of Picoplatin for treatment of NSCLC. Study did not meet primary endpoint.
Theravance Inc. THRX 11/27/2009 FDA
decision 01:30pm
EST 0%
FDA issues complete response letter on telavancin for the treatment of nococomial pneumonia
Dyax Corp. DYAX 12/1/2009 FDA
decision 05:54pm
EST 21%
FDA approval of Kalbitor (DX‐88) for treatment of HAE
Celldex Therapeutics CLDX 12/13/2009
trial results
08:00am EST (Sun) 4%
Phase II results for CDX‐011 breast cancer drug
Alkermes ALKS 12/15/2009 trial
results 08:00am
EST ‐1% Exenatide trial results
Anadys Pharmaceuticals Inc. ANDS 12/17/2009
trial results
07:30am EST ‐12%
Prelim results of phase II study
Inspire Pharmaceuticals, Inc. ISPH 1/21/2010
trial results
07:20am EST ‐16%
Phase III results of Proclaria primary and secondary endpoints not met

103
Company Symbol Event Day Event Cat Time
% change post event Description of Event
Acorda Therapeutics, Inc. ACOR 1/22/2010
FDA decision
03:53am EST 10% FDA approval of Ampyra
Auxilium Pharmaceuticals AUXL 2/2/2010
FDA decision
07:10pm EST 17% Xiaflex approval
Cadence Pharmaceuticals Inc. CADX 2/11/2010
FDA decision
07:30am EST ‐8%
Complete response letter from FDA for OFIRMEV
Xenoport, Inc. XNPT 2/17/2010 FDA
decision 09:06pm
EST ‐66%
FDA issues complete response letter regarding the New Drug Application (NDA) for Horizant (gabapentin enacarbil) Extended‐Release Tablets, treatment for moderate‐to‐severe primary Restless Leg Syndrome (RLS)
Jazz Pharmaceuticals, Inc. JAZZ 2/18/2010
FDA decision
05:00pm EST ‐2%
FDA Acceptance Of Its New Drug Application For JZP‐6 (sodium oxybate) For Treatment Of Fibromyalgia
Medivation, Inc. MDVN 3/3/2010 trial
results 07:30am
EST ‐67%
Results From Two Phase 3 Studies In Dimebon (latrepirdine) Alzheimer's Disease Clinical Development Program. Studies did not meet primary or secondary endpoints
InterMune Inc. ITMN 3/9/2010 FDA panel
04:21pm EST 65%
FDA Pulmonary Allergy Drugs Advisory Committee (PADAC) voted 9‐3 to recommend approval of Esbriet (pirfenidone) for the treatment of patients with idiopathic pulmonary fibrosis (IPF) to reduce decline in lung function.
Human Genome Sciences Inc. HGSI 3/17/2010
trial results
07:00am EDT ‐1%
Phase II results of mapatumumab for treatment of non‐small cell lung cancer
Oncothyreon Inc ONTY 3/23/2010 trial
results 08:01am EDT ‐27%
Stimuvax clinical trial temporarily suspended

104
Chapter 3: Results
This chapter presents the results of the regression models used in this research.
Descriptive statistics and the difference between call/put variables pairs using T‐tests are
presented first. Next the binary logistic regression results using continuous variables are shown,
followed by binary logistic regression results using dichotomized variables. Finally, the
multinomial logistic regression results are presented followed by a summary of the various non‐
significant regression models.
Descriptive Statistics and Variable Differences
After the events were identified and the independent variable summary data was
collected, each of the six independent variables were compared to the specific put/call variable
counterpart for each variable pair using paired t‐tests to determine if there were significant
differences in variable means. Significant differences were found when comparing the means of
the call/put OI pairs (t=4.483, p<0.001) and the call/put EID pairs (t=3.510, p=0.001); in both
cases, the call means were significantly higher than the put means. However, the call/put IV
pair did not show a statistically significant difference (t=‐0.444, p=0.658). Table 3.0 shows the
complete results of the paired samples t‐tests.

105
Table 3.0 Paired samples t‐tests measuring differences in paired variable means
Paired Samples T-Test
Paired Differences
t df
Sig.
(2-
tailed)Mean Std. Deviation
Std. Error
Mean
95% Confidence Interval of
the Difference
Lower Upper
Pair
1
Call_OI -
Put_OI
1.3625774E4 4.2331367E4 3.0392150E3 7.6314334E3 1.9620114E4 4.483 193 .000
Pair
2
Call_EID-
Put_EID
$2.742E7 $1.088E8 $7.810E6 $1.201E7 $4.282E7 3.510 193 .001
Pair
3
Call_IV -
Put_IV
.01979444108 .62108410607 .04459124011 .10774315642 .06815427426 -.444 193 .658
Call OI = summary of all open interest for call options prior to the event being measured, Put OI = summary of all open interest for put options, Call EID = aggregate delta value x 100 x open interest x price of underlying shares for call options, Put EID = delta value x 100 x open interest x price of underlying shares for put options, Call IV = average implied volatility for all call options, Put IV = average implied volatility for all put options
The difference variables used in the final regression equations were calculated using the
difference between the call/put pairs for the EID, OI, and IV measurements. Table 3.1 shows the
descriptive statistics for the EID difference, OI difference, and IV difference variables.
Table 3.1 Descriptive statistics for the EID, OI, and IV difference variables
Descriptive Statistics
N Minimum Maximum Mean Std. Deviation
Statistic Statistic Statistic Statistic Std. Error Statistic
EID difference 190 $-322,166,755 $825,475,047 $27,652,405.02 $7,973,856.306 $109,912,024.062
OI difference 190 -113004.0000 291937.0000 13895.273684 3100.8150068 42741.7852244 IV difference 190 -3.28045000 4.87696825 -.0201336595 .04549843232 .62715260921
EID Diff (difference in EID between calls and puts, OI Diff (difference in open interest between calls and puts), IV Diff (difference between calls and puts for implied volatility)

106
Binary Logistic Regression with Continuous Independent Variables
The binary logistic regression analysis using the difference between the EID, OI, and IV
for calls and puts did not yield any significant independent variables. Additionally, all of the
odds ratios were close to 1 indicating that the odds of a negative event (the outcome variable
was reverse coded to obtain the odds of a negative event) when a given difference variable was
negative (coded as a 1) were similar to random chance. Table 3.2 shows the Wald statistic
significance levels for all of the independent variables in the model.
Table 3.2 Binary logistic regression variable significance using continuous EID, OI, and IV difference variables
Variables in the Equation
B S.E. Wald df Sig. Exp(B)
95% C.I.for EXP(B)
Lower Upper
Step 1a OI_Diff .000 .000 1.469 1 .225 1.000 1.000 1.000
EID_Diff .000 .000 .513 1 .474 1.000 1.000 1.000
IV_Diff -.052 .236 .049 1 .825 .949 .598 1.507
Constant .353 .159 4.959 1 .026 1.424
a. Variable(s) entered on step 1: OI_Diff (difference in open interest between calls and puts), EID_Diff
(difference in EID between calls and puts, IV_Diff (difference between calls and puts for implied volatility)
Binary Logistic Regression with Dichotomous Independent Variables
The same binary logistic regression model was then performed with a dichotomous
transformation on the three independent variables. The dichotomization assigned a 1 for all

107
negative values and a zero for all positive values. This transformation resulted in 32 negative
events and 158 positive events for the EID difference variable, 51 negative and 139 positive
events for the OI difference variable, and 130 negative and 60 positive events for the IV
difference variable.
After dichotomizing the independent variables, the EID difference variable was
significantly related to a negative event outcome (Wald 4.382, p=0.036, OR 2.506, 95% C.I.
1.060‐5.924). EID difference values less than zero were associated with a 2.5 times greater
likelihood of a negative event. A complete report of the independent variable significance is
shown in Table 3.3.
Table 3.3 Binary logistic regression variable significance using dichotomous independent variables
Variables in the Equation
B S.E. Wald df Sig. Exp(B)
95% C.I.for EXP(B)
Lower Upper
Step 1a EID .919 .439 4.382 1 .036 2.506 1.060 5.924
OI -.035 .339 .010 1 .919 .966 .497 1.877
IV .078 .323 .058 1 .809 1.081 .574 2.037
Constant .134 .277 .234 1 .629 1.143
a. Variable(s) entered on step 1: EID (EID difference variable transformed into dichotomous variable), OI
(open interest difference variable transformed into dichotomous variable, IV (implied volatility difference
variable transformed into dichotomous variable
The Hosmer and Lemeshow goodness‐of‐fit test resulted in a chi‐squared of 2.379,
p=0.666. Therefore, based on the Hosmer and Lemeshow results there is no evidence of a lack
of fit for this model. OI difference and IV difference were not significant predictors of event
outcomes and the odds ratios for each of these independent variables was close to 1 indicating
no relationship between OI difference, IV difference and event outcome.

108
Multinomial Logistic Regression with Dichotomous Independent Variables
A multinomial logistic regression was performed using the EID difference dichotomized
variables. The dependent variable for the multinomial logistic regression model had three
categories defining the post event stock move percentage: < ‐ 10%, ≥ ‐ 10% and ≤ + 10%, and > +
10%. The ≥ ‐ 10% and ≤ + 10% category was set as the reference category because the goal of
this study is to predict events which are related to a large move in the underlying stock. Table
3.4 shows the case categorization summary for the three independent variables and the
trichotomous outcome variable.
Table 3.4 Case Distribution of the Event Outcome Variable
Case Processing Summary
N
Marginal
Percentage
Stock Change Category .00 48 25.3%
1.00 101 53.2%
2.00 41 21.6%
EID binary 0 158 83.2%
1 32 16.8%
OI binary 0 139 73.2%
1 51 26.8%
IV binary 0 60 31.6%
1 130 68.4%
Valid 190 100.0%
Missing 0
Total 190
Subpopulation 7 EID (EID difference variable transformed into dichotomous variable), OI (open interest difference variable transformed into dichotomous variable, IV (implied volatility difference variable transformed into dichotomous variable

109
As seen in Table 3.4, the reference category (neutral event category) had the most
events. For the independent variables, EID and OI had more positive indicators than negative
indicators, but IV had move negative indicators than positive indicators. Table 3.5 shows the
variable significance for the multinomial logistic regression model with dichotomous
independent variables.
Table 3.5 Multinomial logistic regression variable significance using dichotomous independent variables
Likelihood Ratio Tests
Effect Model Fitting Criteria Likelihood Ratio Tests
-2 Log Likelihood of Reduced Model Chi-Square df Sig.
Intercept 49.712 .000 0 .
EID difference 56.793 7.080 2 .029
OI difference 52.656 2.944 2 .229
IV difference 50.158 .445 2 .800
The chi-square statistic is the difference in -2 log-likelihoods between the final model and a reduced model. The reduced
model is formed by omitting an effect from the final model. The null hypothesis is that all parameters of that effect are 0.
As seen in Table 3.5, EID difference was the only significant independent variable in the
multinomial logistic regression model using dichotomous independent variables. Table 3.6
shows the variable significance for each of the trichotomous outcome categories.

110
Table 3.6 Multinomial logistic regression variable significance with trichotomous outcomes
Parameter Estimates
Stock Change Categorya
B Std. Error Wald df Sig. Exp(B)
95% Confidence Interval for Exp(B)
Lower Bound Upper Bound
dimension0
.00 Intercept -1.243 .357 12.133 1 .000
[EID_P=0] .989 .434 5.179 1 .023 2.687 1.147 6.296
[EID_P=1] 0b . . 0 . . . .
[OI_P=0] .618 .403 2.349 1 .125 1.855 .842 4.087
[OI_P=1] 0b . . 0 . . . .
[IV_P=0] .177 .400 .196 1 .658 1.194 .545 2.617
[IV_P=1] 0b . . 0 . . . .
2.00 Intercept -.905 .338 7.177 1 .007
[EID_P=0] -.358 .602 .353 1 .552 .699 .215 2.276
[EID_P=1] 0b . . 0 . . . .
[OI_P=0] .517 .419 1.524 1 .217 1.677 .738 3.813
[OI_P=1] 0b . . 0 . . . .
[IV_P=0] -.138 .398 .121 1 .728 .871 .399 1.900
[IV_P=1] 0b . . 0 . . . .
EID (EID difference variable transformed into dichotomous variable), OI (open interest difference variable transformed into dichotomous variable, IV (implied volatility difference variable transformed into dichotomous variable. Events ≤-10% were coded as zero, <-10% to ≥10% were coded as 1 (reference category), and >10% were coded as 2. For EID, OI and IV, 0 = negative event, 1 = positive event.
As seen in Table 3.6, the EID difference variable for the ≤‐10% event outcome group was
the only significant independent variable (p<0.023, OR 2.687, 95% CI 1.147 to 6.296). EID
difference values less than zero were associated with a 2.7 times greater likelihood of a negative
event. For the multinomial logistic regression, the EID, OI, and IV difference variables were
coded with a zero representing a negative value and a 1 representing a positive value.143
143 The dependent variable in the binary logistic regression was coded with a zero representing a positive
event and a one representing a negative event. The dependent variable in the multinomial logistic
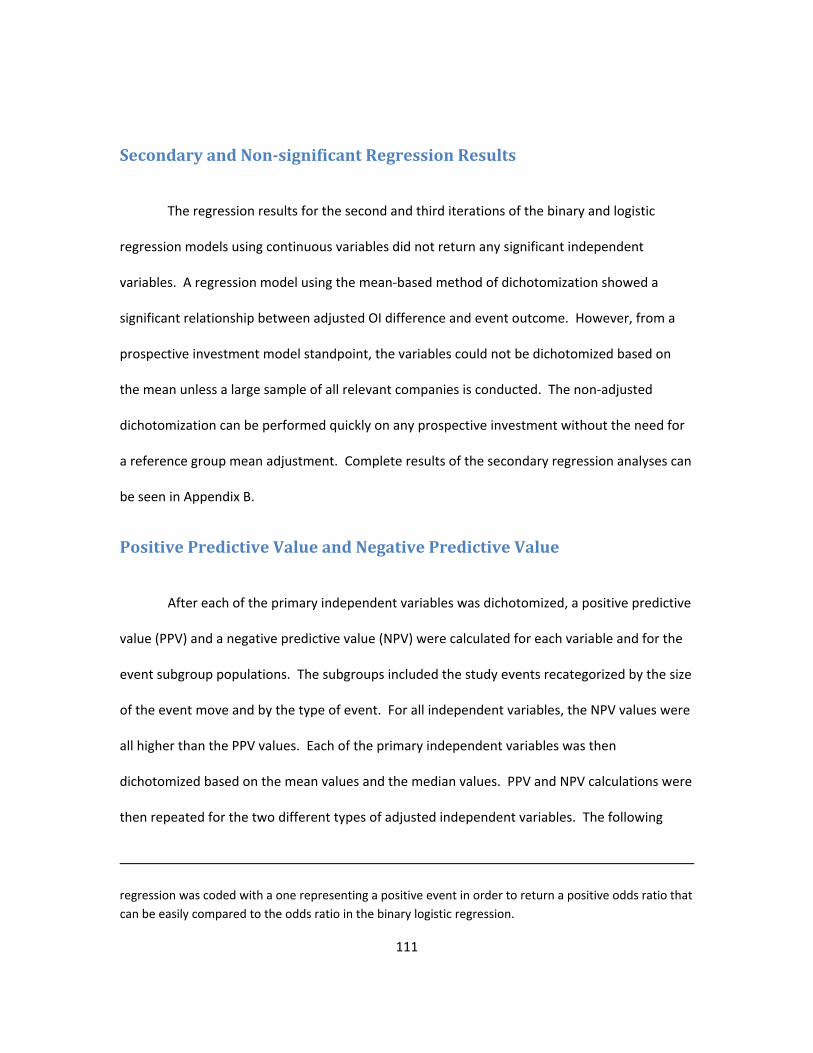
111
Secondary and Nonsignificant Regression Results
The regression results for the second and third iterations of the binary and logistic
regression models using continuous variables did not return any significant independent
variables. A regression model using the mean‐based method of dichotomization showed a
significant relationship between adjusted OI difference and event outcome. However, from a
prospective investment model standpoint, the variables could not be dichotomized based on
the mean unless a large sample of all relevant companies is conducted. The non‐adjusted
dichotomization can be performed quickly on any prospective investment without the need for
a reference group mean adjustment. Complete results of the secondary regression analyses can
be seen in Appendix B.
Positive Predictive Value and Negative Predictive Value
After each of the primary independent variables was dichotomized, a positive predictive
value (PPV) and a negative predictive value (NPV) were calculated for each variable and for the
event subgroup populations. The subgroups included the study events recategorized by the size
of the event move and by the type of event. For all independent variables, the NPV values were
all higher than the PPV values. Each of the primary independent variables was then
dichotomized based on the mean values and the median values. PPV and NPV calculations were
then repeated for the two different types of adjusted independent variables. The following
regression was coded with a one representing a positive event in order to return a positive odds ratio that
can be easily compared to the odds ratio in the binary logistic regression.

112
tables (Tables 3.7‐3.26) show the PPV and NPV results for the dichotomized independent
variables.
Table 3.7 PPV and NPV of EID as a dichotomous independent variable
Predictive Values of EID
Events with positive outcome (as confirmed by post‐event stock price)
Positive Negative
EID as dichotomous predictor
Positive 72 86 PPV = 45.6%
Negative 8 24 NPV = 75.0%
Sensitivity = 90.0% Specificity = 21.8%
Positive LR = 1.15 Negative LR = 0.46
EID, estimated invested dollars ; PPV, positive predictive value; NPV, negative predictive value; LR, likelihood ratio.
Table 3.8 PPV and NPV of EID as a dichotomous independent variable for the subpopulation
of events that experienced a post‐event underlying stock move greater than 10%
Predictive Values of EID for stock moves over 10%
Events with positive outcome (as confirmed by post‐event stock price)
Positive Negative
EID as dichotomous predictor
Positive 37 34 PPV = 52.1%
Negative 4 14 NPV = 77.7%
Sensitivity = 90.2% Specificity = 29.1%
Positive LR = 1.27 Negative LR = 0.33
EID, estimated invested dollars ; PPV, positive predictive value; NPV, negative predictive value; LR, likelihood ratio.

113
Table 3.9 PPV and NPV of EID as a dichotomous independent variable for the subpopulation of
events that experienced a post‐event underlying stock move greater than 25%
Predictive Values of EID for stock moves over 25%
Events with positive outcome (as confirmed by post‐event stock price)
Positive Negative
EID as dichotomous predictor
Positive 21 22 PPV = 48.8%
Negative 4 10 NPV = 71.4%
Sensitivity = 84.0% Specificity = 31.2%
Positive LR = 1.22 Negative LR = 0.51
EID, estimated invested dollars ; PPV, positive predictive value; NPV, negative predictive value; LR, likelihood ratio.
Table 3.10 PPV and NPV of mean‐adjusted EID as a dichotomous independent variable
Predictive Values of Mean‐Adjusted EID
Events with positive outcome (as confirmed by post‐event stock price)
Positive Negative
Adjusted EID as dichotomous predictor
Positive 20 27 PPV = 42.5%
Negative 60 83 NPV = 58.0%
Sensitivity = 25.0% Specificity = 75.5%
Positive LR = 1.02 Negative LR = 0.99
EID, estimated invested dollars ; PPV, positive predictive value; NPV, negative predictive value; LR, likelihood ratio.

114
Table 3.11 PPV and NPV of median‐adjusted EID as a dichotomous independent variable
Predictive Values of Median‐Adjusted EID
Events with positive outcome (as confirmed by post‐event stock price)
Positive Negative
MAEID as dichotomous predictor
Positive 46 50 PPV = 47.9%
Negative 34 60 NPV = 63.8%
Sensitivity = 57.5% Specificity = 54.5%
Positive LR = 1.27 Negative LR = 0.78
EID, estimated invested dollars ; PPV, positive predictive value; NPV, negative predictive value; LR, likelihood ratio.
Table 3.12 PPV and NPV of median‐adjusted EID as a dichotomous independent variable for
the subpopulation of events that experienced a post‐event underlying stock move greater
than 10%
Predictive Values of Median‐Adjusted EID for stock moves over 10%
Events with positive outcome (as confirmed by post‐event stock price)
Positive Negative
MAEID as dichotomous predictor
Positive 24 22 PPV = 52.1%
Negative 17 26 NPV = 60.4%
Sensitivity = 58.5% Specificity = 54.1%
Positive LR = 1.28 Negative LR = 0.77
EID, estimated invested dollars ; PPV, positive predictive value; NPV, negative predictive value; LR, likelihood ratio.

115
Table 3.13 PPV and NPV of open interest as a dichotomous independent variable
Predictive Values of Open Interest (OI)
Events with positive outcome (as confirmed by post‐event stock price)
Positive Negative
OI as dichotomous predictor
Positive 67 85 PPV = 44.1%
Negative 13 25 NPV = 65.8%
Sensitivity = 83.8% Specificity = 22.7%
Positive LR = 1.08 Negative LR = 0.72
OI, open interest; PPV, positive predictive value; NPV, negative predictive value; LR, likelihood ratio.
Table 3.14 PPV and NPV of open interest as a dichotomous independent variable for the
subpopulation of events that experienced a post event underlying stock move greater than
10%
Predictive Values of Open Interest for Stock Moves Over 10%
Events with positive outcome (as confirmed by post‐event stock price)
Positive Negative
OI as dichotomous predictor
Positive 33 36 PPV = 47.8%
Negative 8 12 NPV = 60.0%
Sensitivity = 80.5% Specificity = 25.0%
Positive LR = 1.07 Negative LR = 0.78
OI, open interest; PPV, positive predictive value; NPV, negative predictive value; LR, likelihood ratio.

116
Table 3.15 PPV and NPV of open interest as a dichotomous independent variable for the
subpopulation of events that experienced a post‐event underlying stock move greater than
25%
Predictive Values of Open Interest for Stock Moves Over 25%
Events with positive outcome (as confirmed by post‐event stock price)
Positive Negative
OI as dichotomous predictor
Positive 18 24 PPV = 42.9%
Negative 7 8 NPV = 53.3%
Sensitivity = 72.0% Specificity = 25.0%
Positive LR = 0.96 Negative LR = 1.12
OI, open interest; PPV, positive predictive value; NPV, negative predictive value; LR, likelihood ratio.
Table 3.16 PPV and NPV of mean‐adjusted open interest as a dichotomous independent
variable
Predictive Values of Mean‐Adjusted Open Interest (AOI)
Events with positive outcome (as confirmed by post‐event stock price)
Positive Negative
AOI as dichotomous predictor
Positive 24 18 PPV = 57.1%
Negative 56 92 NPV = 62.2%
Sensitivity = 30.0% Specificity = 83.6%
Positive LR = 1.83 Negative LR = 0.84
OI, open interest; PPV, positive predictive value; NPV, negative predictive value; LR, likelihood ratio.

117
Table 3.17 PPV and NPV of median‐adjusted open interest as a dichotomous independent
variable
Predictive Values of Median‐Adjusted Open Interest (AOI)
Events with positive outcome (as confirmed by post‐event stock price)
Positive Negative
MAOI as dichotomous predictor
Positive 46 51 PPV = 47.4%
Negative 34 59 NPV = 63.4%
Sensitivity = 57.5% Specificity = 53.6%
Positive LR = 1.24 Negative LR = 0.79
OI, open interest; PPV, positive predictive value; NPV, negative predictive value; LR, likelihood ratio.
Table 3.18 PPV and NPV of median‐adjusted open interest as a dichotomous independent
variable for the subpopulation of events that experienced a post‐event underlying stock move
greater than 10%
Predictive Values of Median‐Adjusted Open Interest for Stock Moves Over 10%
Events with positive outcome (as confirmed by post‐event stock price)
Positive Negative
MAOI as dichotomous predictor
Positive 22 23 PPV = 48.9%
Negative 19 25 NPV = 56.8%
Sensitivity = 53.7% Specificity = 52.1%
Positive LR = 1.12 Negative LR = 0.89
OI, open interest; PPV, positive predictive value; NPV, negative predictive value; LR, likelihood ratio.

118
Table 3.19 PPV and NPV of implied volatility as a dichotomous independent variable
Predictive Values of Implied Volatility (IV)
Events with positive outcome (as confirmed by post‐event stock price)
Positive Negative
IV as dichotomous predictor
Positive 30 37 PPV = 44.8%
Negative 50 73 NPV = 59.4%
Sensitivity = 37.5% Specificity = 66.3%
Positive LR = 1.11 Negative LR = 0.94
IV, implied volatility; PPV, positive predictive value; NPV, negative predictive value; LR, likelihood ratio.
Table 3.20 PPV and NPV of implied volatility as a dichotomous independent variable for the
subpopulation of events that experienced a post‐event underlying stock move greater than
10%
Predictive Values of Implied Volatility for Stock Moves Over 10%
Events with positive outcome (as confirmed by post‐event stock price)
Positive Negative
IV as dichotomous predictor
Positive 13 16 PPV = 44.8%
Negative 28 32 NPV = 53.3%
Sensitivity = 31.7% Specificity = 66.7%
Positive LR = 0.95 Negative LR = 1.02
IV, implied volatility; PPV, positive predictive value; NPV, negative predictive value; LR, likelihood ratio.

119
Table 3.21 PPV and NPV of implied volatility as a dichotomous independent variable for the
subpopulation of events that experienced a post‐event underlying stock move greater than
25%
Predictive Values of Implied Volatility for Stock Moves Over 25%
Events with positive outcome (as confirmed by post‐event stock price)
Positive Negative
IV as dichotomous predictor
Positive 7 10 PPV = 41.2%
Negative 18 22 NPV = 55.0%
Sensitivity = 28.0% Specificity = 68.8%
Positive LR = 0.9 Negative LR = 1.05
IV, implied volatility; PPV, positive predictive value; NPV, negative predictive value; LR, likelihood ratio.
Table 3.22 PPV and NPV of mean‐adjusted implied volatility as a dichotomous independent
variable
Predictive Values of Mean‐Adjusted Implied Volatility (AIV)
Events with positive outcome (as confirmed by post‐event stock price)
Positive Negative
AIV as dichotomous predictor
Positive 34 38 PPV = 47.2%
Negative 46 72 NPV = 61.0%
Sensitivity = 42.5% Specificity = 65.5%
Positive LR = 1.23 Negative LR = 0.88
IV, implied volatility; PPV, positive predictive value; NPV, negative predictive value; LR, likelihood ratio.
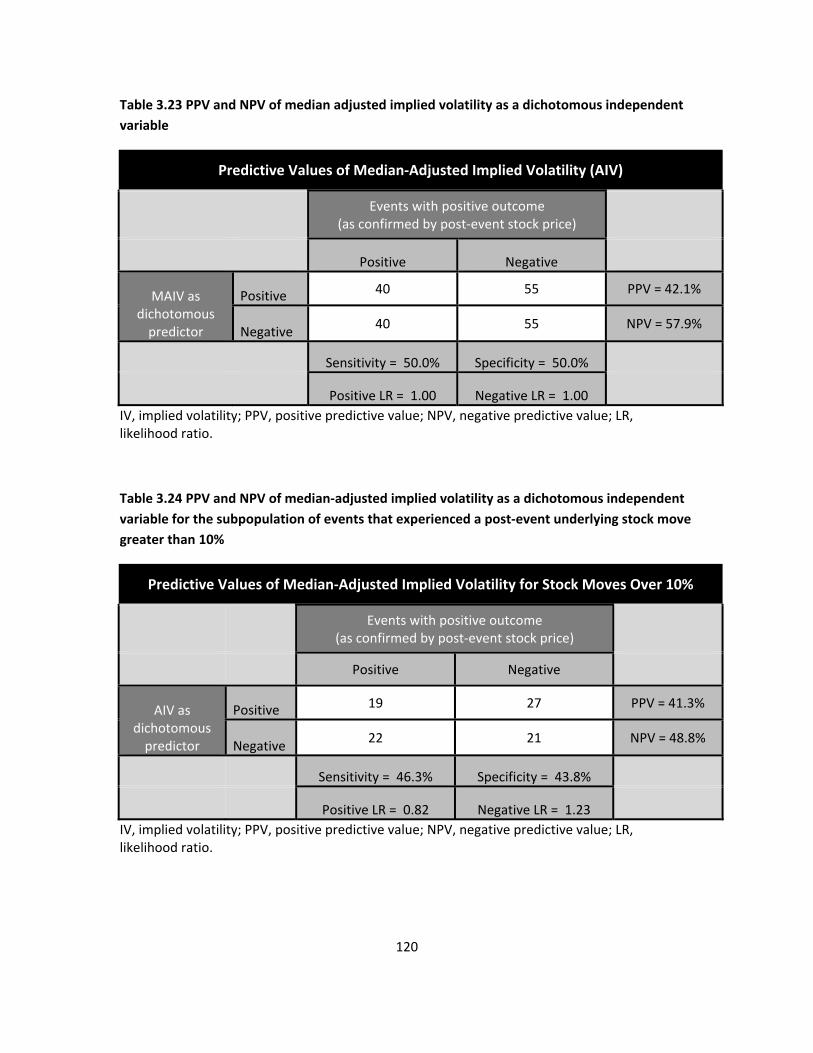
120
Table 3.23 PPV and NPV of median adjusted implied volatility as a dichotomous independent
variable
Predictive Values of Median‐Adjusted Implied Volatility (AIV)
Events with positive outcome (as confirmed by post‐event stock price)
Positive Negative
MAIV as dichotomous predictor
Positive 40 55 PPV = 42.1%
Negative 40 55 NPV = 57.9%
Sensitivity = 50.0% Specificity = 50.0%
Positive LR = 1.00 Negative LR = 1.00
IV, implied volatility; PPV, positive predictive value; NPV, negative predictive value; LR, likelihood ratio.
Table 3.24 PPV and NPV of median‐adjusted implied volatility as a dichotomous independent
variable for the subpopulation of events that experienced a post‐event underlying stock move
greater than 10%
Predictive Values of Median‐Adjusted Implied Volatility for Stock Moves Over 10%
Events with positive outcome (as confirmed by post‐event stock price)
Positive Negative
AIV as dichotomous predictor
Positive 19 27 PPV = 41.3%
Negative 22 21 NPV = 48.8%
Sensitivity = 46.3% Specificity = 43.8%
Positive LR = 0.82 Negative LR = 1.23
IV, implied volatility; PPV, positive predictive value; NPV, negative predictive value; LR, likelihood ratio.

121
Table 3.25 PPV and NPV of median‐adjusted EID, open interest, and implied volatility
dichotomous independent variables for the subpopulation of events related to FDA decisions
Predictive Values of Median‐Adjusted EID, OI, and IV for FDA Events Only
Events with positive outcome (as confirmed by post‐event stock price)
Positive Negative
MAEID, MAOI, and MAIV as dichotomous predictor
Positive 3 3 PPV = 50.0%
Negative 1 10 NPV = 90.9%
Sensitivity = 75.0% Specificity = 76.9%
Positive LR = 3.25 Negative LR = 0.33
IV, implied volatility; PPV, positive predictive value; NPV, negative predictive value; LR, likelihood ratio.
Table 3.26 PPV and NPV of EID and mean‐adjusted open interest as dichotomous independent
variables
Predictive Values of EID and Mean‐Adjusted OI
Events with positive outcome (as confirmed by post‐event stock price)
Positive Negative
EID and AOI as dichotomous predictor
Positive 24 18 PPV = 57.1%
Negative 8 24 NPV = 75.0%
Sensitivity = 75.0% Specificity = 57.1%
Positive LR = 1.75 Negative LR = 0.44
IV, implied volatility; PPV, positive predictive value; NPV, negative predictive value; LR, likelihood ratio.

122
The various iterations of the NPV for the EID difference variable and the combination of
the EID difference variable with other potential predictor variables consistently yielded the
highest NPV values. The non‐adjusted EID NPV value (75%) is the most important NPV value
because the non‐adjusted EID variable can easily be replicated as a prospective indicator of
future event outcomes. None of the PPV values for the various combinations of predictor
variables and subgroups represented high predictive power. Therefore, the prediction of
positive events cannot be incorporated in the prospective investment model.

123
Chapter 4: Discussion and Conclusion
This section examines the results and conclusions reached in this research after using
various regression models in an attempt to predict event outcomes. This chapter will first
examine the study results and hypothesis tests with respect to the study objectives. Next, the
study findings and the driving factors leading to these findings will be discussed within the
context of previous findings in related research. The implications that these finding have for
future research are then discussed, followed by the limitations of this study. Finally, this chapter
will state the conclusions related to the predictive ability of a negative EID indicator and the
practical value of such predictions.
Findings Related to Study Objectives
This research resulted in mixed findings regarding the study objectives and hypotheses.
The event outcomes model can be used to predict negative events, but is not a useful
prospective tool for the prediction of positive events. Similarly, the application of these
predictions to an investment strategy can only be applied to events which present a negative
investment signal. Although this research shows the possibility that some insiders are investing
based on insider information, the lack of positive event predictive ability leads to inconclusive
evidence about insider trading. The hypotheses were largely focused on the difference between
the implied volatility measures for calls and puts prior to company events. These hypotheses
were rejected because this research found little difference between the implied volatilities of
calls and puts surrounding the events of interest. Additionally, implied volatility measures did

124
not provide any useful information regarding the prediction of event outcomes. However, the
estimated invested dollars (EID) variable proved to be significantly related to event outcomes.
Similar hypotheses stated in terms of EID instead of implied volatility may not have been
rejected. The study objectives and related results, and the hypotheses along with their
accept/reject status are listed below.
1. Create a model, based on the characteristics of historical option data, to predict
phase II or III clinical trial results and/or FDA panel recommendations and approval
decisions.
a. A model was created that is useful for predicting negative events. However,
this model is not a good predictor of positive events.
2. Determine whether evidence of leaked insider trading information exists through an
analysis looking for successful investment trends in options data prior to the release
of phase II or III trial results and FDA approval decisions.
a. The trends present in the options data were not strong enough to provide
evidence of leaked insider information.
3. Create an investment strategy model based on historical options data that can
identify investment opportunities based on the results of the event prediction
model.
a. The investment strategy model can be used to identify negative events and
invest accordingly. However, the model is not a useful investment tool
when the predictor variable indicators are positive.

125
Hypothesis Test Results
1. For small biotech companies144 with three or fewer currently approved drugs, a
significant discrepancy between the relative prices (implied volatility) for calls and
puts shortly before trial results or FDA decisions will be a predictor of the trial or
FDA decision outcome.
a. Rejected‐‐There was no statistically significant difference between the
implied volatility for call and the implied volatility for puts for the events
identified in this study. Additionally, when the IV differences were
categorized in the logistic regression equation, differences in IV between
calls and puts were not related to the event outcome.
2. For companies with positive announcements, there will be a statistically significant
difference between the implied volatility of call options and the implied volatility of
put options in the day prior to the announcement.
a. Rejected‐‐When examining positive events, the difference in IV between
calls and puts was not related to the event outcome.
3. For companies with negative announcements, there will be a statistically significant
difference between the implied volatility of put options and the implied volatility of
call options in the day prior to the announcement.
144 Less than $5 billion in market cap

126
a. Rejected‐‐However, there were statistically significant differences between
the EID of calls versus puts when negative events occurred. Also, a negative
EID difference between calls and puts represented a 75% probability of a
negative event.
4. After positive and negative dichotomization, the difference between the EID for
calls and puts will be a significant predictor of event outcomes.
a. Mixed‐‐The EID difference variable was a significant predictor of negative
events and the EID difference variable had relatively high NPV values (65%‐
76%) depending on the subgroup analyzed. However, there was no
relationship between EID and the prediction of positive events and EID
difference had low PPV values (averaged less than 50%).
5. When short‐biased arbitrage situations exist for small biotech companies with
pending phase II or III results or a pending FDA decision, the trial results will be
unfavorable for the drug or biomedical device or the FDA will not approve the drug
or biomedical device.145
a. Not rejected—However, only two arbitrage situations were identified and
they were both for the same company.
The hypotheses in this study all assumed that option prices for the companies in this
study would not follow put‐call parity prior to significant company events. In a preliminary
analysis of a limited sample of a few of the companies that were included in this study, the
145 Example: On April 10, 2007 it was possible to short sell Neurochem (NRMX), sell the May $15 puts, and
buy the May $15 calls for an arbitrage gain of about 7%. The existence of such an arbitrage situation
illustrates high demand for shares available to short leading to increased put option prices.

127
implied volatility was significantly different for puts and calls prior to the company event.
However, a paired samples t‐test showed no significant difference between the aggregate
implied volatility for calls versus puts prior to company events. The theory of put‐call parity
proved to be largely true for this study; therefore, the related hypotheses were rejected and the
predictive model was limited to analysis of EID and open interest.146
Model Creation Influences
The attempt to create a model that can be used to predict future event outcomes may
seem to contradict the efficient market hypothesis. If markets are efficient and outcomes are
measured based on movements of the underlying stock, then any model that can predict future
movement of the underlying stock based on options data would provide evidence that the
efficient market hypothesis can be rejected. Such a finding could potentially add to recent
research that has highlighted many deficiencies in the efficient market hypothesis.147 However,
due to the proprietary nature of the information disseminated prior to company events for
small pharmaceutical companies, it is possible that the efficient market hypothesis is still intact
in the weak‐form efficiency, and semi‐strong‐form efficiency constructs.148 The model used in
this research assumes that information available prior to an event is insider information that has
not been publicly disseminated. Therefore, such a predictive model would only provide
146 If the implied volatility is equal for puts and calls, the implied volatility difference will not be a
significant predictor of a positive or a negative outcome.
147 Fama E. Efficient capital markets: a review of theory and empirical work. Journal of Finance. 1970;25:
383–417.
148 Weak‐form and semi‐strong‐form efficient market hypotheses do not assume that non‐public insider
information is reflected in current share prices. Only public information is reflected in current share
prices.

128
evidence against the strong‐form efficient market hypothesis which assumes that efficient
markets account for all information in current share prices including private insider information.
Considerable evidence exists against the strong‐form efficient market hypothesis;149 however,
the prediction model proposed in this research could successfully predict event outcomes
without contradicting weak‐form or semi‐strong form efficient market hypothesis constructs.
This model assumes that market inefficiencies exist between options and underlying
stocks. Although these inefficiencies may not violate the efficient market hypothesis, this
research does assume that some information is contained in the options data prior to being fully
incorporated into the underlying stock price. In order for this model to predict future stock
movements, the options traded prior to the events being studied need to function as a leading
indicator for the underlying stock. Evidence in the financial literature is mixed on the issue of
lead/lag relationship between options and stocks. For this research, the insiders with access to
trial information may trade in options prior to stocks in order to gain maximum leverage and
potentially avoid insider trader scrutiny. These issues regarding informed traders’ preference to
trade in options are more thoroughly discussed in the literature review section and the
background information sections of this document.
Although findings are mixed, previous research has shown some evidence that options
data can be a leading indicator of future stock market returns.150,151 This research assumed that
149 Rosenberg B, Reid K, Lanstein R. Persuasive Evidence of Market Inefficiency. Journal of Portfolio
Management. 1985;13:9‐17.
150 Manaster S, Rendleman R. Option prices as predictors of equilibrium stock prices. Journal of Finance.
1982;37(4):1043‐1057.
151 Bhattacharya M. Price changes of related securities: the case of call options and stocks. Journal of
Financial and Quantitative Analysis. 1987;22(1):1‐15.

129
some informed investors will choose to invest in the options market instead of the directly in
the stock market which, in turn, creates a situation where option market data can potentially
predict future stock market returns for an individual stock. The idea for this research came from
observational patterns which were seen in options data for certain high profile pharmaceutical‐
related events. When such events are examined in a non‐systematic format, it appears that
option purchasers, and not option sellers, have an information advantage. However, when the
events in question are systematically identified, it appears that the events which seem to show a
directional bias in the expected return of the underlying stocks are interspersed with events
which have little or no predictive information available in the options data. After identifying
events and dichotomizing the primary predictor variables, some of the events showed signs of
strong signals in the opposite direction of the actual event outcome.
When examining the options data of small pharmaceutical companies prior to major
events, researchers or investors may be tempted to draw conclusions about the predictive
ability of the options data because the relationship sometimes seems obvious. In isolation, an
event that turns out positive that had ten times the open interest in call contracts compared to
put contracts, ten times the estimated investment exposure in call contracts compared to puts,
and a higher implied volatility for calls compared to puts appears to provide evidence that some
investors had advance knowledge of the outcome. Although this may have been the case for
that individual event, the only way to provide some evidence of advance knowledge of event
outcomes from a retrospective database study would be to find regular predictive patterns in
the data. After a systematic identification of events, the evidence of advance knowledge
immediately becomes less convincing when the options data for some events seem to predict
the event outcome in the direction opposite the true event outcome.

130
Regression Results
The regression model with continuous independent variables used in this study did not
show any significant relationships between predictor variables and the event outcome variable.
However, the dichotomized EID difference independent variable was significantly related to the
event outcomes. Therefore, PPV and NPV calculations using the dichotomous independent
variable for EID difference were reported to show the probability of the event outcome based
on the EID difference signal. The regression models also showed that the independent variables
were poor predictors of positive events. Similarly, the NPVs were all higher than PPVs for all
independent variables and subgroups analyzed. When EID is negative, the NPV for negative
event outcomes was 75%. When combined with the other significant variable of adjusted OI,
NPV remains at 75% because both of these metrics were classified identically for negative
events after dichotomization. More events in the sample were negative than positive.
Therefore, the NPV of a model that assumes all events are negative would be 57.89%.
Therefore, in order for an independent variable to predict a negative event outcome at a rate
higher than random chance, the NPV value needs to be higher than 57.89%. Mean‐ and median‐
adjusted EIDs did not predict event outcomes as well as EID. However, it is worth noting that
when analyzing the subgroup of FDA‐related events, when the median‐adjusted EID, OI, and IV
all signaled a negative event, the NPV was 90.1%. Since non‐adjusted EID values are better
predictors of event outcomes, it is logical that when EID, OI, and IV all signal a negative
outcome, the NPV would be as high as or higher than the same NPV using median‐adjusted
predictor variables. However, due to the more restrictive negative signal produced by the non‐
adjusted metrics (non‐adjusted independent variables were skewed towards positive events),
only three events were signaled negative by all three non‐adjusted predictor variables.

131
The results of the various regression analyses showed that the non‐categorized option
metrics data in this study were not significant predictors of study outcomes. However, when
the variables were dichotomized, the EID difference variable was significantly related to the
binary event outcome. When using dichotomized adjusted independent variables, adjusted
open interest was significantly related to the event outcome, but adjusted EID was not
significant. From a practical usage point of view, non‐adjusted indicators are much easier to
calculate as they do not require a reference group of data points for adjustments. Therefore,
the prospective investment model only uses EID as an indicator of future negative events.
Negative Predictive Power
The results of the negative predictive power (NPV) analyses show that options data
provides some information about future negative events, but PPV was a poor predictor of future
positive events. When applied across the entire study population, no predictor variable could
be classified as a consistent predictor of positive and negative events. However, the EID
difference variable consistently predicted negative events better than random chance.
In general, the PPV results of the three main predictor variables used in this study were
poor; these variables did not predict event outcomes better than random chance. However, the
NPV results showed there is a relationship between EID and negative event outcomes. In every
measured subgroup analyzed, the NPV was higher than the PPV.

132
Investor Sentiment Indicators
Chen and Zhao found that when insiders sold covered calls, the underlying stock was
more likely to under‐perform the market.152 The options data used for this research was not
able to differentiate between calls sold as covered calls by insiders and naked call volume.
Therefore, if company insiders chose to use the options market to invest based on negative
information and these insiders chose to sell covered calls instead of buying naked puts, the
associated increase in call open interest would be accounted for in this study by an increase in
EID value. Since a positive EID value signals a positive event, the influence of covered call
writing by insiders with knowledge of a negative event would move the EID towards a positive
signal instead of a negative signal. If the prevalence of covered call writing by insiders with
knowledge of a negative event is higher than the prevalence of short put positions taken out by
insiders with knowledge of positive events, this could explain why this research found a
significant relationship between negative EID values and negative events, but did not find a
relationship between positive EID values and positive events.
The predictive ability of negative indicators (an investor preference for puts) and the
lack of predictive ability found with positive indicators (investor preference for calls) adds to the
evidence found by Easley, O'Hara, and Srinivas which showed a stronger relationship between
152 Chen R, Zhao X The information content of insider call options trading. Financial Management.
2007;34(2):153‐172.

133
an increase in put volume and a negative stock move than the relationship between an increase
in call volume and a positive stock move.153
Put/Call Ratio
The EID variable used in this research is essentially a modified version of a put/call ratio.
The EID examines the same underlying discrepancy in investor interest in calls versus puts, but it
adjusts this interest by the delta value in order to negate the effects of high call or put open
interest represented by options with a low probability of expiring in‐the‐money. Pan and
Poteshman found that high put/call ratios were significantly related to future stock
underperformance.154 The relationship found in this research between negative EID values and
negative events measured by declines in underlying stock price, provides further evidence that
elevated put/call ratios are related to future underperformance of the underlying stock.
Data Trends
The summary measures for EID and OI had higher raw values for calls compared to puts.
This may provide evidence that investors in small pharmaceutical companies are inherently
optimistic or have a positive bias. From a psychological perspective, this trend makes sense.
Most of these small pharmaceutical companies have the potential to experience extreme price
appreciation if the drugs they are investigating make it to market. Additionally, many of the
drugs being investigated are designed to help patients with severe diseases. Therefore, the
153 Easley D, O'Hara M, Srinivas P. Option volume and stock prices: evidence on where informed traders
trade. Journal of Finance. 1998;53(2):431‐465.
154 Pan J, Poteshman AM. The information in option volume for future stock prices. The Review of
Financial Studies. 2006;19(3):871‐906.

134
typical investor may be influenced by the big potential for gains and he or she will idealistically
hope the drug has positive clinical trial results to potentially provide improved life expectancy
and quality of life for patients. However, as seen in the events identified in this study, inherent
investor optimism is probably misplaced for this subclass of stocks. In this study, 110 out of 190
events led to a decrease in the underlying share price. The net result of the supposed investor
optimism155 makes it more likely for the EID and OI variables to favor calls even though the
number of negative events was higher than the number of positive events. As a result of this
misplaced investor optimism, the predictive ability of a negative event is stronger than the
predictive ability of a positive event. This same trend is seen in the higher NPV values compared
to PPV values. When net investor sentiment is negative (as measured by EID and OI variables),
the negative influence first had to overcome the inherent optimistic bias before the EID and OI
variables can signal negative investor sentiment. Therefore, fewer negative events are signaled
by EID and OI, but a higher percentage of these signals actually result in negative events
compared to the positive event signals that actually result in positive events.
Interpreting Negative Predictive Value
The initial event population included 110 negative events and 80 positive events. A
prediction model that simply predicts that the outcome will always be equal to the most
common event outcome would yield a NPV of 110/190 or 57.9%. The NPV values reported for
the EID difference variables in this study ranged from 61% to 76% for the adjusted and non‐
adjusted versions of the EID examined and the different sub‐group analyses selected, indicating
155 “Investor optimism” assumes investor chose naked options or an option strategy that increases the
open interest in calls when a positive event is expected; see “option strategies” section for more
information.

135
stronger predictions than a model using the most common event. On the other hand, all NPVs
below 57.9% should be considered poor predictors of the event outcome considering the
negative event bias of the underlying data. Therefore, NPV values for the open interest and
implied volatility variables were, on average, poor predictors of negative event outcomes.
These NPV results are consistent with the regression findings of non‐significance for the open
interest and implied volatility variables in both the binary and multinomial regression models.
The NPV values for the EID variable were all above 57.9% signifying that EID is a relatively good
predictor of future negative events.
Dichotomization
In this research, the EID difference variable became significant after dichotomization
although the same variable was non‐significant when the regression was performed on a
continuous version of this variable. Typically, when a continuous variable is transformed into a
dichotomous variable, information is lost. Therefore, the transformation of a continuous
variable into a dichotomous variable probably will not result in a change from non‐significance
to significance. In this study, the dichotomization was performed in three different ways. The
first method coded any EID difference with a negative value as a one and any EID difference
with a positive value with a zero. This dichotomization method yielded 34 EID differences coded
as a one and 156 EID differences coded as a zero. This was the most logical dichotomization
method because a negative EID difference value represents more investor interest in puts than
in calls. Assuming that investor interest in puts is a signal for a negative event, this method of
dichotomization is congruent with the negative and positive event signal assumptions and
hypotheses presented in this study. This method of dichotomization which resulted in non‐

136
equal groups also facilitated the possibility of moving from non‐significance to significance by
eliminating the effect of outliers.
The dichotomization was also performed using the mean EID difference value as the cut
point for group membership and then by using the median EID difference value as the cut point
for group membership. Both of these dichotomization methods yielded groups that were closer
to equal size. The median adjustment method yielded two equal groups (95 coded as one or
negative and 95 coded as zero or positive) while the mean adjustment method resulted in more
EIDs signaling a positive event than a negative event (123 coded as zero or positive and 67
coded as one or negative). Both the mean and median dichotomous transformations resulted
in non‐significant independent variables in the regression model.
Prospective Investment Model
From a prospective investment perspective, the presence of a negative EID signals a
probability better than random chance that the future event will be negative. However, the low
PPV values for EID and the failure of the regression models to significantly predict positive
events show that EID is unlikely to predict positive events better than random chance. Negative
EID‐signaled events are relatively rare (32/190), but when EID signals a negative event this could
represent an investable opportunity. Additionally, negative EID signals are associated with large
negative moves in the underlying stock as seen by the results of the multinomial logistic
regression. This finding is important from a practical investment perspective because large
negative events (a post‐event stock move <‐10%) represent a better investment opportunity
than small negative events (post event stock moves >‐10%). Although implied volatility was not
a significant predictor of event outcomes in this study, implied volatility values are typically

137
related to the magnitude of the future movement of the underlying stock. Therefore, from a
practical perspective, investors should look for situations where the EID signals a negative event
and the average implied volatility for calls and puts is high. Since implied volatility is correlated
with the future movement of stock prices, although not significantly related to the event
outcome, using implied volatility will help isolate events that have both a higher than random
probability of a negative outcome and a high probability of a large post‐event move in stock
price.
Insider Trading
Anomalies sometimes appear in options data that are suggestive of market participants
using advance knowledge of future event outcomes to create profitable options trades. The
results of the regression analyses in this research do not provide solid evidence that these
anomalies are actually the result of insider trading or prior knowledge trading. However, from a
practical investment perspective, the NPV values associated with negative EID difference
variables could provide a profitable investment strategy. Although the results of this research
have some practical investment strategy implications, the lack of positive predictive ability
shown in the regression models and the PPV results suggest that no consistent information
about the behavior of company insiders was found. In order to show evidence of systematic
event outcome prior knowledge, the models used in this study would have had to show
significant predictions for both positive and negative events. Therefore, the results of this
research cannot draw any conclusion about the presence or absence of legal or illegal insider
trading.

138
Implications of Study Findings for Future Research
Although this study only found a significant relationship between negative indicators
and negative events, these finding were consistent with some of the other published literature
related to the led/lag relationship between stock and option prices.156,157 Future research with
access to options data capable of separating buyer‐ and seller‐initiated transactions would
provide a more accurate presentation of the predictive ability of options data when applied to
pharmaceutical events. Such a data set could further separate out investor sentiment by
showing which set of investors is willing to pay the spread between the bid and ask prices for
each given option contract.
This research found a significant relationship between negative EID signals and negative
events. However, due to the relatively rare nature of the events studied in this research,
continued analysis of the EID variable is warranted. Additional data obtained by the analysis of
future events could provide additional evidence regarding the association between EID and
negative event outcomes. However, changes in SEC enforcement or rules regarding insider
trading could change the ability or likelihood of investors to act upon insider information thus
negating the predictive ability of EID variable.
156 Easley D, O'Hara M, Srinivas P. Option volume and stock prices: evidence on where informed traders
trade. Journal of Finance. 1998;53(2):431‐465.
157 Billingsley R, Chance D. Put‐call ratios and market timing effectiveness. Journal of Portfolio
Management. 1988;15(1):25‐28.

139
Limitations
Although the issues surrounding the legality of trading activities undertaken by
participants in clinical trials are unclear, some researchers argue that the legality of clinical trial
participant insider trading is irrelevant because participants would rarely obtain actionable
investment information.158 Chow and Liu pointed out that phase II and phase III trials are
typically performed at multiple sites. As a result, participants at a single trial site cannot obtain
a broad overview of the effectiveness of a given treatment. When also considering the placebo
effect and the effect of confounding variables, the likelihood of an individual trial participant
obtaining and correctly interpreting the trial results before publication is insignificant. Based on
this premise, an analysis of the legality of insider trading performed by clinical trial participants
would be largely irrelevant.159 Therefore, if clinical trial participants are unlikely to obtain
valuable insider information, the effect of clinical trial participant insider trading would have no
relationship to the actual outcome of the trials.
Although a finding of statistically significant abnormal trading in options could be used
as evidence of insider trading, such evidence does not identify the source of the insider
information. Many individuals are privy to pre‐publication clinical trial results. Although the
large number of potential insider traders lends credence to the concept of pre‐publication
leaked information, the large number of potential insiders also creates difficulty in identifying
the actual culprits of insider trading. Additionally, a finding of an abnormal indication within the
158 Horwich A. The clinical trial research participant as an inside trader: a legal and policy analysis. Journal
of Health Law. Winter 2006;39(1):77‐116.
159 Chow, SC, Liu JP, Design and Analysis of Clinical Trials, Concepts and Methodologies, 240‐45. 2nd
Edition, Wiley‐Interscience; 2004.

140
options data that correlates to a positive or negative clinical trial outcome could be the result of
legitimate options trading strategies that were not created on the basis of non‐public
information.
Traditionally, money is made through selling options, not buying them. In theory, if
insider information was leaked to an investment bank, the bank could sell options at
inexpensive prices in the opposite direction of the potential leaked news. For example, if news
was leaked that a clinical trial for a cancer drug showed positive results, an investment bank
could choose to sell a large number of puts instead of buying calls. Typically, one would expect
the call volume to be higher than the put volume if positive insider information was leaked.
However, an investment bank could just as easily profit from the positive leaked insider
information by selling puts instead of buying calls. Such a strategy would likely be profitable for
the investment bank because the put contracts would likely expire worthless or go down in
value when the positive news was released due to a corresponding increase in the underlying
stock price. If leaked information about clinical trial results was common, yet said information
was sometimes leaked to individual investors (who we assume are more likely to buy options in
the same direction as the news leak) and the information was sometimes leaked to investment
banks who could decide to sell options in the opposite direction of the leaked information, a
regression analysis using options data could potentially find no significant independent variables
and no evidence of leaked information. In other words, these contrasting money‐making
strategies could offset each other and the net effect would show up as no relationship between
predictor variables and outcome variables in a regression analysis.
This study was designed to use options data to analyze small biomedical companies with
market capitalizations below $5 billion. Although every company has a different number of

141
shares outstanding and each company can essentially set its own stock trading price based on
the number of shares outstanding, companies with lower market caps tend to have lower stock
trading prices. Options are typically created in $2.50 denominations with strike prices in $2.50
multiples. Therefore, as a stock trading price decreases, the number of out‐of‐the‐money put
options available to trade decreases. If a stock trades at $5, the only out‐of‐the‐money put
option available to trade would typically be the $2.50 put option. Additionally, as the number of
put options available to trade decreases, the number of strategies for potential investor profit
decreases correspondingly. If two companies both have a market cap of $500 million, but one
company trades at $5 a share and the other company trades at $50 a share, an investor has
more choices and more potential for profit if they have negative insider information when
trading the stock that trades for $50. If each company released negative results that created a
50% drop in market cap and stock price, the investor who bought the $2.50 put (the only out‐of‐
the‐money put available) would not profit from the transaction if the option was held to
maturity. However, the investor involved in the $50–per‐share company could have purchased
put options at the $47.50, $45, $42.50, $40, or other out‐of‐the‐money strike prices and made
significant profits. Although the authors were aware of the put option‐related problems created
by the inclusion of companies with per share stock prices approaching $5, this is the situation
for many small pharmaceutical companies and the exclusion of these companies would have
drastically decreased the total study sample. However, it is possible that the inclusion of these
companies created a call option bias or created data anomalies which helped contribute to the
non‐significant findings of the independent variables in the regression analysis.
External influences that have nothing to do with leaked insider information could affect
the independent variables in this study. For example, if a prominent analyst or TV

142
commentator commented positively or negatively on the chances of a new drug approval prior
to the public announcement, investors may have followed this advice and inflated the volume
and price of options related to the company with the pending event. Such a public statement
could have influenced the implied volatility, EID, and open interest measures without any
leakage of insider information. Such external option data influences could have changed the
option data enough to contribute to the non‐significant influences some of the independent
variables had in the regression analyses.
A few data errors were found in the data provided by DeltaNeutral. The delta values for
a 5‐day period in May of 2009 were listed as zero when they should not have been based on the
underlying time value remaining in the option contracts. Therefore, one event that would have
been included in the study was excluded due to a lack of data. No additional data integrity
issues were identified and at least one option contract was spot checked for every event time
period and no additional data problems were encountered.
This study used the closing stock price the day prior to the release of event‐based
information as the baseline value of the underlying stock. This approach was taken instead of
an average stock price over time in order to isolate the influence of the event in question on the
underlying stock price. However, the date of the release of event information is not always
known in advance. Therefore, the relationship between negative EID signals and negative
events may not hold true for time periods prior to the day before the event. From a practical
investment perspective, FDA decision event dates are often announced prior to the event thus
allowing the investment decision to be made based on EID values the day prior to the event.
However, clinical trial event dates are less likely to be announced prior to the release of the
information. Therefore, application of these study findings are more likely to apply to FDA

143
decisions than to trial results unless the date of the result findings is announced before the
actual release of the results.
Conclusion
Based on results of the regression models and an analysis of the PPV and NPV values
associated with the EID difference variable, there is evidence that options data provide some
information about future negative events for small pharmaceutical companies, but the options
data in this study was a poor predictor of future positive events.
When event dates are known prior to event‐based information release, negative biased
investment strategies can be implemented when negative EID values are present. If the NPV
values and odds ratios found in this research stay relatively constant for future events, an
investment strategy which evenly distributes risk to every upcoming event with a negative EID
value will significantly outperform the market.

144
Appendix A Companies Considered for Inclusion Appendix A Complete list of companies considered for inclusion in the study.
Company Market Cap OptionsMajor US Exchange
Drug Discovery
# drugs <= 3 Event
3SBio Inc. 279.96M yes yes yes no
Aastrom Biosciences, Inc. 41.54M yes yes yes yes yes
Abbott Laboratories 73.06B
Abcam Plc 445.78M no no
ABL Bio Technologies Ltd 151.7M no no
Abraxis BioScience, Inc. 2.45B no
ACADIA Pharmaceuticals, Inc. 48.69M yes yes yes yes yes
Access Pharmaceuticals Inc. 38.02M no
Aceto Corp. 167.21M yes yes no
Achillion Pharmaceuticals, Inc 95.53M no
Acorda Therapeutics, Inc. 1.28B yes yes yes yes yes
Adeona Pharmaceuticals, Inc. 22.84M no
Adolor Corp. 69.07M yes yes yes yes yes
Advanced Life Sciences Holding 8.03M no
Advaxis Inc. 22.90M no
Adventrx Pharmaceuticals, Inc. 20.07M no
Aeolus Pharmaceuticals Inc. 19.29M no no
Æterna Zentaris Inc. 102.41M no
Affymax, Inc. 547.34M yes yes yes
Ajanta Pharma Ltd 2,26616M no no
Albany Molecular 180.03M yes yes no
Alexion Pharmaceuticals, Inc. 4.74B yes yes yes yes yes
Alexza Pharmaceuticals Inc. 164.46M yes yes no
Alkermes 1.2B yes yes yes yes yes
Alimera Sciences, Inc. 14.81M no
Allergan Inc. 18.26B
Allergy Therapeutics Plc 36.51m no no
Alliance Pharma Plc 342.56m no no
Allos Therapeutics, Inc. 738.71M yes yes yes yes yes
Alnylam Pharmaceuticals, Inc. 662.14M yes yes yes yes yes
Alpharma 1.5B yes yes yes no
Alseres Pharmaceuticals, Inc. 8.12M no
AlumiFuel Power Corp. 6.12M no
Amarillo Biosciences Inc. 4.86M no
Amarin Corporation plc 239.72M no
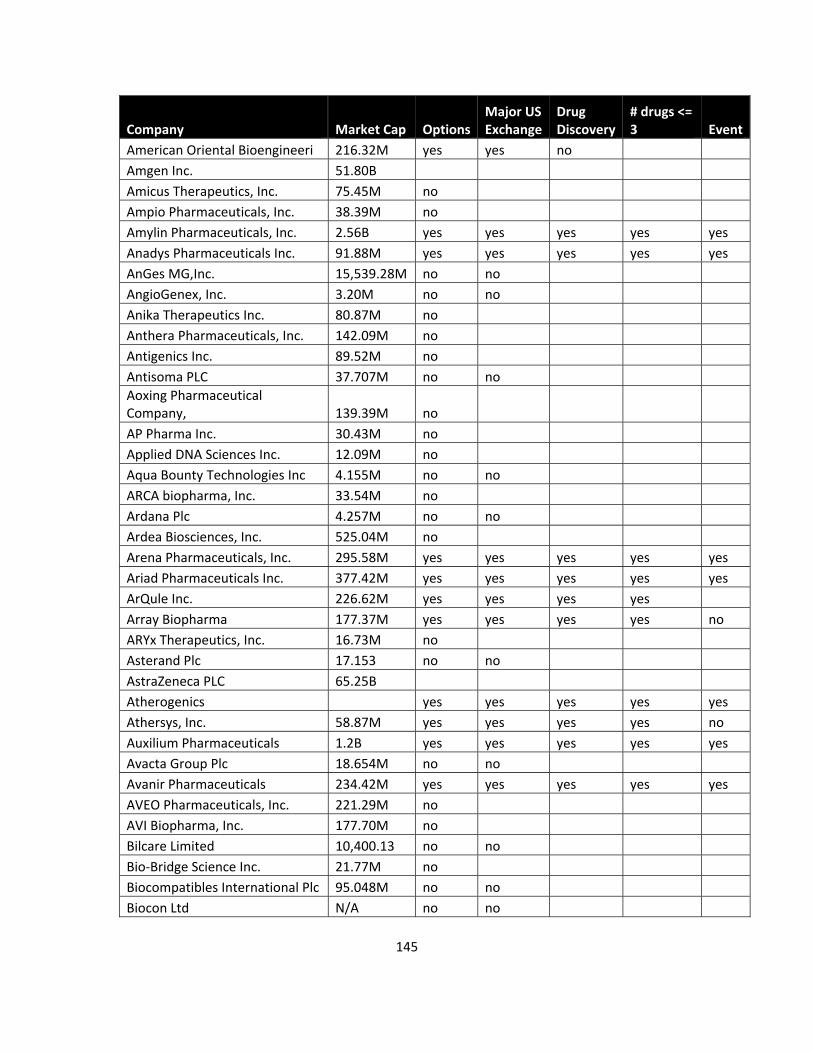
145
Company Market Cap OptionsMajor US Exchange
Drug Discovery
# drugs <= 3 Event
American Oriental Bioengineeri 216.32M yes yes no
Amgen Inc. 51.80B
Amicus Therapeutics, Inc. 75.45M no
Ampio Pharmaceuticals, Inc. 38.39M no
Amylin Pharmaceuticals, Inc. 2.56B yes yes yes yes yes
Anadys Pharmaceuticals Inc. 91.88M yes yes yes yes yes
AnGes MG,Inc. 15,539.28M no no
AngioGenex, Inc. 3.20M no no
Anika Therapeutics Inc. 80.87M no
Anthera Pharmaceuticals, Inc. 142.09M no
Antigenics Inc. 89.52M no
Antisoma PLC 37.707M no no
Aoxing Pharmaceutical Company, 139.39M no
AP Pharma Inc. 30.43M no
Applied DNA Sciences Inc. 12.09M no
Aqua Bounty Technologies Inc 4.155M no no
ARCA biopharma, Inc. 33.54M no
Ardana Plc 4.257M no no
Ardea Biosciences, Inc. 525.04M no
Arena Pharmaceuticals, Inc. 295.58M yes yes yes yes yes
Ariad Pharmaceuticals Inc. 377.42M yes yes yes yes yes
ArQule Inc. 226.62M yes yes yes yes
Array Biopharma 177.37M yes yes yes yes no
ARYx Therapeutics, Inc. 16.73M no
Asterand Plc 17.153 no no
AstraZeneca PLC 65.25B
Atherogenics yes yes yes yes yes
Athersys, Inc. 58.87M yes yes yes yes no
Auxilium Pharmaceuticals 1.2B yes yes yes yes yes
Avacta Group Plc 18.654M no no
Avanir Pharmaceuticals 234.42M yes yes yes yes yes
AVEO Pharmaceuticals, Inc. 221.29M no
AVI Biopharma, Inc. 177.70M no
Bilcare Limited 10,400.13 no no
Bio‐Bridge Science Inc. 21.77M no
Biocompatibles International Plc 95.048M no no
Biocon Ltd N/A no no

146
Company Market Cap OptionsMajor US Exchange
Drug Discovery
# drugs <= 3 Event
BioCryst Pharmaceuticals, Inc. 282.30M yes yes yes yes yes
Biodel Inc. 102.49M yes yes yes yes yes
BioDelivery Sciences Internati 66.78M yes yes no
Biogen Idec Inc. 12.49B
Bioheart, Inc. 12.98M no
BioMarin Pharmaceutical Inc. 2.02B yes yes yes yes yes
Bio‐Matrix Scientific Group, I 2.83M no
Bionovo, Inc. 47.35M no
BioSante Pharmaceuticals, Inc. 127.48M yes yes yes yes yes
BioSpecifics Technologies Corp 135.26M no
Biostar Pharmaceuticals, Inc. 83.66M no
BioTime, Inc. 227.43M yes yes no
Biovail 2.64B yes yes yes no
Bliss GVS Pharma Ltd 3,996.93M no no
Bridgetech Holdings Internatio NA no
Bristol‐Myers Squibb Company 43.49B
BTG Plc 484.101M no
Byotrol Plc 11.987M no
Cadence Pharmaceuticals Inc. 354.66M yes yes yes yes yes
Cadus Corp. 19.32M no
Caleco Pharma Corp. 11.47M no
Callisto Pharmaceuticals, Inc. 16.87M no
Cambrex Corp. 108.83M no
CanBas Co., Ltd. 2,348.77M no
Capstone Therapeutics Corp. 1.22M no
Cardiome Pharma Corp. 507.53M yes yes yes yes yes
Cardiovascular Systems Inc. 67.06M no
Cardium Therapeutics Inc. 36.59M no
Cell Genesys N/A yes yes yes yes yes
Celgene Corporation 24.42B
Cell Therapeutics, Inc. 328.15M yes yes yes yes yes
Cellceutix Corporation 41.34M no
Cellcyte Genetics Corporation 2.17M no
Celldex Therapeutics 156.99M yes yes yes yes yes
CEL‐SCI Corp. 104.38M no
Cephalon Inc. 4.33B yes yes yes no
Ceragenix Pharmaceuticals, Inc 2.38M no
Cerus Corporation 123.70M yes yes no

147
Company Market Cap OptionsMajor US Exchange
Drug Discovery
# drugs <= 3 Event
Champions Biotechnology, Inc. 32.73M no
Charles River Laboratories Int 2.37B yes yes no
Chelsea Therapeutics Internati 120.20M yes yes yes yes yes
China Biologic Products, Inc. 276.37M no
China Medical System Holdings Limited 296.76M no
China Pharma Holdings, Inc. 110.39M no
CHUGAI PHARMACEUTICAL CO.,LTD.
N/A no no
Clinical Data, Inc. 398.50M yes yes yes yes yes
Codexis, Inc. 341.86M no
Columbia Laboratories 70.85M yes yes yes yes yes
CombiMatrix Corporation 17.11M no
CombinatoRx, Incorporated 122.78M no
Compugen Ltd. 133.69M yes yes yes yes no
Corcept Therapeutics Inc. 230.59M no
CorMedix, Inc. 26.81M no
Cornerstone Therapeutics Inc. 153.87M no
Cortex Pharmaceuticals Inc. 12.31M no
Covance Inc 3.54B yes yes no
CPEX Pharmaceuticals, Inc. 71.80M no
Cryo‐Save Group N.V. 39.019M no no
Cubist Pharmaceuticals Inc. 1.20B yes yes yes yes yes
Cumberland Pharmaceuticals, In 143.06M no
Curis Inc. 235.17M no
Cyclacel Pharmaceuticals, Inc. 67.48M no
Cypress Bioscience, Inc. 164.63M yes yes yes yes yes
Cytokinetics Inc. 177.07M yes yes yes yes yes
Cytomedix, Inc. 20.612M no
Cytori Therapeutics, Inc. 205.09M yes yes no
CytRx Corporation 91.67M no
DAIICHI SANKYO COMPANY, LIMITED N/A no no
DARA BioSciences, Inc 12.98M no
Dendreon Corp. 4.98B yes yes yes yes yes
DepoMed Inc. 156.59M yes yes yes yes yes
Discovery Laboratories Inc. 55.32M no
Dishman Pharmaceuticals and Chemicals Ltd 16,446.08M no no

148
Company Market Cap OptionsMajor US Exchange
Drug Discovery
# drugs <= 3 Event
DNA Chip Research Inc. 1,274.64M no no
Dr. Reddy's Laboratories Ltd. 5.14B no no
Durect Corp. 232.58M yes yes yes yes yes
DUSA Pharmaceuticals Inc. 52.46M no
Dyax Corp. 255.94M yes yes yes yes yes
Dynavax Technologies Corporati 163.62M no
Elan 2.79B yes yes yes yes yes
Eli Lilly & Co. 37.37B
Elite Pharmaceuticals Inc. 6.70M no
Emergent BioSolutions, Inc. 488.89M yes yes yes yes yes
Endo Pharmaceuticals Holdings 2.46B yes yes yes no
EntreMed Inc. 48.72M no
Enzon Pharmaceuticals Inc. 667.04M yes yes yes yes no
Epistem Holdings Plc 31.736M no no
EPS Co.,Ltd. 41,535.24M no no
e‐Therapeutics Plc 23.719M no no
Eurand N.V. 433.32M no
Exact Sciences Corporation 180.45M yes yes no
Exelixis, Inc. 511.39M yes yes yes yes yes
FDC Ltd 18,245.98M no no
Forest Laboratories Inc. 7.88B
Fulcrum Pharma PLC 10.009M no no
Fulford (India) Ltd 3,896.10M no no
Furiex Pharmaceuticals, Inc. N/A no
Futura Medical PLC 25.306M no no
Genetic Technologies Ltd. 13.32M no
Genta Incorporated 30.17M no
Gentium S.p.A 65.36M no no
Genus PLC 450.523M no
GenVec, Inc. 65.74M no
Genzyme Corp. 13.21B
Geovax Labs, Inc. N/A no
Geron Corporation 502.69M yes yes yes yes no
Gilead Sciences Inc. 30.83B
GlaxoSmithKline plc 89.47B
Glenmark Pharmaceuticals Limited 70,360.14M no no
GNI Ltd. 2,433.94M no no

149
Company Market Cap OptionsMajor US Exchange
Drug Discovery
# drugs <= 3 Event
GTC Biotherapeutics, Inc. 12.78M no
GTX Inc. 111.81M yes yes yes yes yes
GW Pharmaceuticals Plc 159.475 no no
Halozyme Therapeutics, Inc. 644.15M yes yes yes yes yes
Hana Biosciences, Inc. 14.36M no
Harbor BioSciences, Inc 9.14M no
Health Discovery Corp. 29.50M no
HealthSport, Inc. N/A no
Hemispherx Biopharma, Inc. 77.07M no
Henderson Morley PLC 2.523M no
Heska Corp. 33.38M no
HISAMITSU PHARMACEUTICAL CO.,INC. N/A no
HST Global, Inc. N/A no
Human Genome Sciences Inc. 4.91B yes yes yes yes yes
iBio, Inc. 31.10M no
Idenix Pharmaceuticals Inc. 359.91M yes yes yes yes yes
Idera Pharmaceuticals, Inc. 90.67M yes yes yes yes no
IGI, Laboratories, Inc. 17.71M no
Illumina Inc. 5.41B yes yes no
ImmunoBiotics, Inc. N/A no
Immunogen Inc. 486.70M yes yes yes yes yes
Immunomedics 251.39m yes yes yes yes yes
Immunosyn Corporation 347.82M no
Immupharma Plc 60.819M no no
Impax Laboratories Inc. 1.31B yes yes yes no
Incyte Corporation 1.58B yes yes yes yes yes
Inergetics, Inc. 4.00M no
Inhibitex Inc. 153.68M no
Inovio Pharmaceuticals, Inc. 108.97M no
Insmed Incorporated 97.66M no
Inspire Pharmaceuticals, Inc. 443.56M yes yes yes yes yes
Institute of Applied Medicine,Inc. 2,673.00M no no
Intellect Neurosciences, Inc. N/A no
InterMune Inc. 533.14M yes yes yes yes yes
International Biotechnology Trust PLC 118.402M no no
International Stem Cell Corpor 92.06M no

150
Company Market Cap OptionsMajor US Exchange
Drug Discovery
# drugs <= 3 Event
Isis Pharmaceuticals, Inc. 935.39M yes yes yes yes yes
ISTA Pharmaceuticals Inc. 87.51M yes yes yes no
Jagsonpal Pharmaceuticals Ltd 529.2M no no
Javelin Pharmaceuticals, Inc. 94.58M no
Jazz Pharmaceuticals, Inc. 254.21M yes yes yes yes yes
Jiangbo Pharmaceuticals, Inc 111.96M no
Johnson & Johnson 161.13B
Jubilant Organosys Ltd N/A no no
KDL Biotech Ltd 306.689M no no
Kendle International Inc. 187.27M yes yes no
Keryx Biopharmaceuticals Inc. 248.99M yes yes yes yes yes
King Pharmaceuticals Inc. 2.01B yes yes yes no
Kopran Ltd. 1,272.62M no no
Lannett Co. Inc. 119.00M no
Lescarden Inc. 0.93M no
Lexicon Pharmaceuticals, Inc. 462.24M no
Life Technologies Corporation 9.13B
Ligand Pharmaceuticals Inc. 190.48M yes yes yes yes yes
Linical Co.,Ltd. 6,110.78M no no
Lipoxen Plc 13.317M no no
Lpath Inc. 31.76M no
LTT Bio‐Pharma Co.,Ltd. 4,938.53M no no
Manhattan Pharmaceuticals Inc. 6.05M no
MannKind Corp. 729.51M yes yes yes yes no
MAP Pharmaceuticals, Inc. 339.33M no no
Marshall Edwards Inc. 10.80M no
Martek Biosciences Corp. 743.79M yes yes no
Matrix Laboratories Limited N/A no no
Mavens Biotech Limited 5,182.73M no no
MDRNA, Inc. 52.31M yes yes yes yes no
Medarex N/A yes yes yes yes yes
Medgenics Inc. 13.165M no no
MediBIC Group 1,799.41M no no
Medicines Co. 407.29M yes yes yes yes yes
MediciNova Inc. 63.03M no
Medicis Pharmaceutical Corp. 1.34B yes yes no
MEDINET Co.,Ltd. N/A no no
Medivation, Inc. 365.93M yes yes yes yes yes

151
Company Market Cap OptionsMajor US Exchange
Drug Discovery
# drugs <= 3 Event
Medizone International Inc. NA no
Merck & Co. Inc. 109.20B
Microchannel Technologies Corp 1.08M no
Micromet, Inc. 542.38M yes yes yes yes yes
Millenium Pharmaceuticals N/A yes yes yes yes yes
Millipore Corporation N/A yes yes no
Molecular Insight Pharmaceutic 33.10M no
Momenta Pharmaceuticals Inc. 624.81M yes yes yes yes yes
Morepen Laboratories Ltd 3,432.17 no no
Myriad Pharmaceuticals, Inc. 95.87M yes yes yes yes yes
Nabi Biopharmaceuticals 250.67M yes yes yes yes yes
NanoCarrier Co., Ltd. N/A no no
NeoPharm, Inc. 10.83M no
NeoStem, Inc. 125.16M no
Neuland Laboratories Ltd 493.236M no no
Neuralstem Inc. 138.16M no
Neurocrine Biosciences Inc. 247.29M yes yes yes yes yes
NeurogesX, Inc. 146.32M no no
Neurologix Inc. 17.00M no no
New Energy Technologies, Inc. 35.16M no no
NexMed, Inc. 38.33M no
Nile Therapeutics, Inc 15.21M no
Northwest Biotherapeutics Inc. 55.01m no
NovaBay Pharmaceuticals, Inc. 52.91M no
Novartis AG 110.41B yes yes
Novavax, Inc. 233.13M yes yes yes yes no
Novelos Therapeutics, Inc. 11.77M no
Novo Nordisk A/S 47.58B
Novogen Limited 15.16M no
NPS Pharmaceuticals, Inc. 411.76M yes yes yes yes yes
Neurochem N/A yes yes yes yes yes
Nutra Pharma Corporation 68.92M no
Obagi Medical Products, Inc. 280.33M no
Omeros Corporation 125.59M yes yes no
Omni Bio Pharmaceutical, Inc. 272.43M no
OncoTherapy Science,Inc. N/A no no
Oncothyreon Inc 95.29M yes yes yes yes yes

152
Company Market Cap OptionsMajor US Exchange
Drug Discovery
# drugs <= 3 Event
Onyx Pharmaceuticals Inc. 1.45B yes yes yes yes yes
Opexa Therapeutics, Inc. 25.30M no
Opko Health, Inc. 528.33M no
Optimer Pharmaceuticals, Inc. 362.53M yes yes yes yes yes
Oragenics Inc. 45.39M no
Orexigen Therapeutics, Inc. 215.78M yes yes yes yes yes
Oscar Investments Ltd N/A no
Osiris Therapeutics, Inc. 185.84M yes yes yes yes yes
Osteologix, Inc. 17.31M no
Oxford Biomedica PLC 52.949 no no
Oxigene Inc. 40.35M no
OXIS International Inc. 12.60M no
Pain Therapeutics Inc. 231.83M yes yes yes yes yes
Palatin Technologie Inc 27.827M no
Par Pharmaceutical Companies, Inc. 920.027M yes yes yes no
PDL BioPharma, Inc. 642.65M yes yes yes yes yes
Penwest Pharmaceuticals 106.69M yes yes no
Peregrine Pharmaceuticals Inc. 157.43M no
Pfizer Inc. 123.65B
Pharmacyclics Inc. 324.18M yes yes yes yes yes
Pharmasset, Inc. 960.51M no
PharmAthene, Inc. 46.33M no
Physiomics Plc 2.247M no
Phytopharm PLC N/A no no
Piramal Life Sciences Limited N/A no no
Plethora Solutions Holding Plc 5.652M no no
Pluristem Therapeutics, Inc. 24.05M no
PolyMedix, Inc. 87.48M no
Poniard Pharmaceuticals, Inc. 39.55M yes yes yes yes yes
POZEN, Inc. 221.12M yes yes yes yes yes
Progenics Pharmaceuticals Inc. 205.74M yes yes yes yes yes
PROLOR Biotech, Inc. 366.7M no
Protalex Inc. 25.23M no
Protalix BioTherapeutics, Inc. 522.43M yes yes yes yes yes
Proteo Inc. 12.66M no no
Provectus Pharmaceuticals, Inc 92.05M no
Proximagen Group PLC 46.701M no no

153
Company Market Cap OptionsMajor US Exchange
Drug Discovery
# drugs <= 3 Event
Pulmo BioTech Inc. N/A no no
Puramed Bioscience Inc 9.30M no
PuriCore Plc 20.185M no no
Qiagen NV 4.84B yes yes no
QLT Inc. 335.90M yes yes yes yes no
Questcor Pharmaceuticals, Inc. 621.07M yes yes yes yes yes
Quick‐Med Technologies Inc. 34.81M no
Regen Therapeutics PLC 1.54M no no
Regeneron Pharmaceuticals, Inc 2.18B yes yes yes yes yes
Regenerx Biopharmaceuticals In 21.57M no
Reliance GeneMedix PLC 8.096M no no
Reliv International, Inc. 29.09M no
Renovo Group Plc 50.472M no no
Repligen Corporation 102.44M no
Repros Therapeutics Inc. 16.50M yes yes yes yes yes
Rexahn Pharmaceuticals, Inc. 87.95M no
Rigel Pharmaceuticals, Inc. 399.65M yes yes yes yes yes
RXi Pharmaceuticals Corporatio 53.83M yes yes yes yes no
Saamya Biotech (India) Limited 200.905M no no
Sangamo Biosciences Inc. 188.08M yes yes yes yes yes
Sanofi‐Aventis 80.62B
Santarus Inc. 160.59M yes yes yes yes no
Sareum Holdings Plc 2.773M no no
Savient Pharmaceuticals, Inc. 820.88M yes yes yes yes yes
SciClone Pharmaceuticals, Inc. 158.60M yes yes yes yes yes
SCOLR Pharma, Inc 23.349M no
Seattle Genetics Inc. 1.30B yes yes yes yes yes
Senesco Technologies Inc. 17.13M no
Senetek plc 8.33M no no
Sequenom Inc. 392.33M yes yes no
SHIN NIPPON BIOMEDICAL LABORATORIES,LTD. N/A no no
Shire Plc 8,027.08M yes yes yes no
SIGA Technologies, Inc. 289.42M yes yes yes yes no
Silence Therapeutics Plc 19.173M no no
Simcere Pharmaceutical Group. 441.78M no
Sinovac Biotech Ltd. 227.21M yes yes yes no
Skystar Bio Pharmaceutical Com 49.04M no

154
Company Market Cap OptionsMajor US Exchange
Drug Discovery
# drugs <= 3 Event
Soiken Holdings Inc. 5,027.93M no no
Soligenix, Inc. 48.61M no no
Solvay Pharma India Ltd N/A no no
Somaxon Pharmaceuticals, Inc. 169.20M yes yes yes yes yes
Sosei Group Corporation N/A no no
Spectrum Pharmaceuticals, Inc. 202.45M yes yes yes yes yes
StemCells Inc. 118.48M no
Sucampo Pharmaceuticals, Inc. 154.00M no
Summit Corporation Plc 7.481M no no
Sun Pharma Advanced Research Company (SPARC) Ltd N/A no no
Sunesis Pharmaceuticals Inc. 31.31M no
SuperGen Inc. 135.62M yes yes yes yes no
Suven Life Sciences Limited 3,302.42 no no
Synairgen Plc 14.04M no no
Synergy Pharmaceuticals, Inc. 885.12M no no
Syntopix Group Plc 7.393M no
TAKARA BIO INC. N/A no no
Talecris Biotherapeutics Holdi 2.69B yes yes yes yes no
Targacept, Inc. 620.43M yes yes yes yes yes
Techne Corp. 2.22B yes yes no
Telik Inc. 40.14M no
Tetragenex Pharmaceuticals, In 0.16M no
Teva Pharmaceutical Industries 47.58B
Theravance Inc. 1.14B yes yes yes yes yes
Threshold Pharmaceuticals Inc. 41.04M no
Thrive World Wide, Inc. 1.67M no
Tianyin Pharmaceutical Co., In 82.14M yes yes no
Tiens Biotech Group (USA), Inc. 128.4M no
Tongjitang Chinese Medicines C 424.61M no
Tongli Pharmaceuticals (USA), 5.28M no no
TRANS GENIC INC. N/A no no
Transcept Pharmaceuticals, Inc 132.39M no
Transdel Pharmaceuticals, Inc. 15.65M no
Transgene Biotek Ltd 1,064.92M no no
Transition Therapeutics Inc. 85.91M no
Trimeris Inc. 48.95M yes yes yes yes no
Trubion Pharmaceuticals Inc. 74.74M no

155
Company Market Cap OptionsMajor US Exchange
Drug Discovery
# drugs <= 3 Event
ULURU Inc. 7.375M no
Unigene Laboratories Inc. 71.86M no no
United Therapeutics Corp. 3.01B yes yes yes yes yes
Urigen Pharmaceuticals, Inc. 9.49M no
Valeant Pharmaceuticals Intern 3.55B yes yes yes no
ValiRx Plc 0.537M no
Vanda Pharmaceuticals, Inc. 190.70M yes yes yes yes yes
VaxGen Inc. 10.26M no
Vernalis PLC 35.846M no no
Verona Pharma Plc 20.592M no no
Vertex Pharmaceuticals Incorpo 7.01B
Vertical Health Solutions Inc. 0.89M no
Vical Inc. 189.91M yes yes yes yes no
Vimta Labs Ltd N/A no
ViroPharma Inc. 898.03M yes yes yes yes yes
Vitro Diagnostics, Inc. 3.56M no
VIVUS Inc. 965.41M yes yes yes yes yes
Warner Chilcott plc 6.24B
WuXi PharmaTech (Cayman) Inc. 1.18B yes yes no
Xenacare Holdings Inc. 10.32M no
Xenoport, Inc. 304.71M yes yes yes yes yes
XOMA Ltd. 117.56M no
YM BioSciences Inc. 95.09M no
ZIOPHARM Oncology, Inc. 200.06M yes yes yes yes yes
Znomics, Inc. 1.05M no
Zyden Gentec Ltd 106.922M no
ZymoGenetics, Inc. 418.40M yes yes yes yes yes

156
Appendix B Secondary and Nonsignificant Regression Results
Table B1.0 shows the independent variable significance for the mean‐adjusted
dichotomization method of the binary logistic regression model.
Table B1.0 Binary logistic regression with mean‐adjusted dichotomous difference variables
Variables in the Equation
B S.E. Wald df Sig. Exp(B)
95% C.I.for EXP(B)
Lower Upper
Step 1a AEID_P -.435 .392 1.230 1 .267 .647 .300 1.396
AOI_P 1.020 .403 6.411 1 .011 2.773 1.259 6.105
AIV_P .456 .313 2.121 1 .145 1.578 .854 2.917
Constant -.423 .404 1.097 1 .295 .655
a. Variable(s) entered on step 1: AEID_P, AOI_P, AIV_P.
As shown in Table B1.0, the adjusted OI dichotomous variable was a significant predictor
of event outcome (p=0.011, OR 2.773, 95% CI 1.259‐6.105). Although the OI difference was
significant after mean‐adjusted dichotomization, mean‐adjusted dichotomization changes with
different study populations. Therefore, using a mean‐adjusted independent variable would be
problematic when attempting to apply to an investment prediction model in real time. Table
B1.1 uses the same variables as Table B1.0, but the dichotomization method used the median as
the cut point instead of the mean.
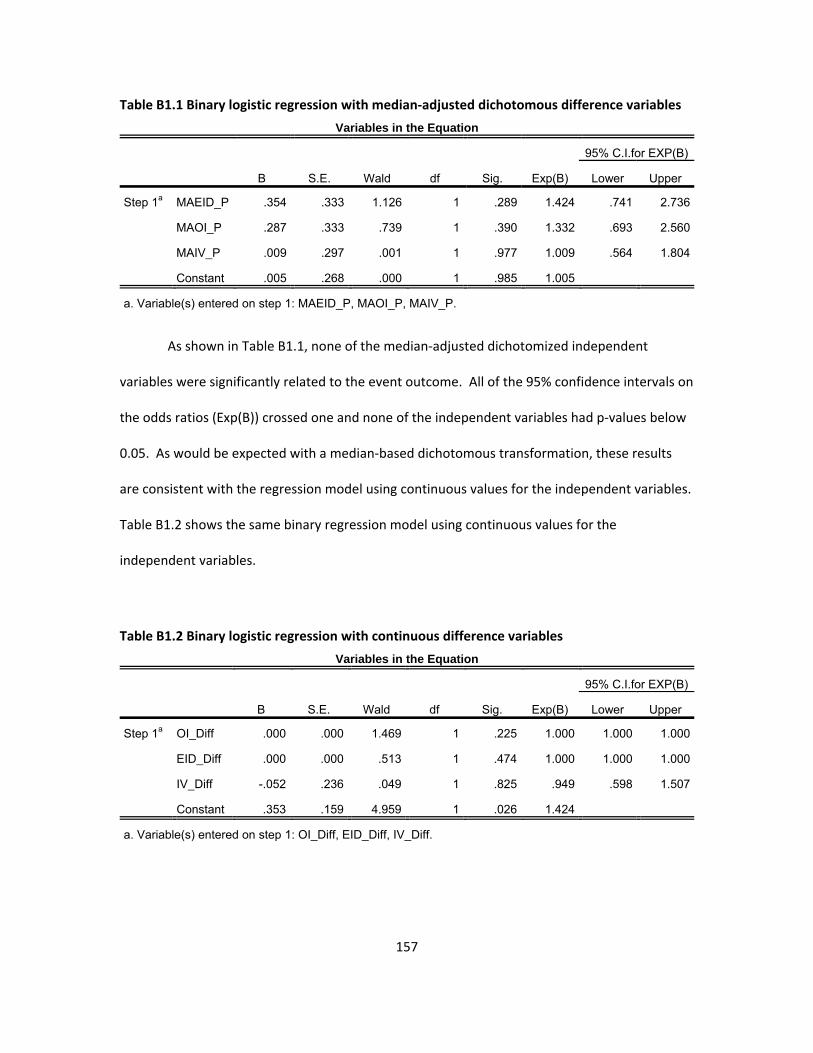
157
Table B1.1 Binary logistic regression with median‐adjusted dichotomous difference variables
Variables in the Equation
B S.E. Wald df Sig. Exp(B)
95% C.I.for EXP(B)
Lower Upper
Step 1a MAEID_P .354 .333 1.126 1 .289 1.424 .741 2.736
MAOI_P .287 .333 .739 1 .390 1.332 .693 2.560
MAIV_P .009 .297 .001 1 .977 1.009 .564 1.804
Constant .005 .268 .000 1 .985 1.005
a. Variable(s) entered on step 1: MAEID_P, MAOI_P, MAIV_P.
As shown in Table B1.1, none of the median‐adjusted dichotomized independent
variables were significantly related to the event outcome. All of the 95% confidence intervals on
the odds ratios (Exp(B)) crossed one and none of the independent variables had p‐values below
0.05. As would be expected with a median‐based dichotomous transformation, these results
are consistent with the regression model using continuous values for the independent variables.
Table B1.2 shows the same binary regression model using continuous values for the
independent variables.
Table B1.2 Binary logistic regression with continuous difference variables
Variables in the Equation
B S.E. Wald df Sig. Exp(B)
95% C.I.for EXP(B)
Lower Upper
Step 1a OI_Diff .000 .000 1.469 1 .225 1.000 1.000 1.000
EID_Diff .000 .000 .513 1 .474 1.000 1.000 1.000
IV_Diff -.052 .236 .049 1 .825 .949 .598 1.507
Constant .353 .159 4.959 1 .026 1.424
a. Variable(s) entered on step 1: OI_Diff, EID_Diff, IV_Diff.

158
Tables B1.0, B1.1, B1.2 and the primary results listed in the results section of this
document all used EID, OI, and IV difference variables. Table B1.3 uses the values for calls and
puts without directly examining the difference between these values.
Table B1.3 Binary logistic regression with raw value variables for calls and puts
Variables in the Equation
B S.E. Wald df Sig. Exp(B)
95% C.I.for EXP(B)
Lower Upper
Step 1a Call_OI .000 .000 1.571 1 .210 1.000 1.000 1.000
Call_EID .000 .000 .069 1 .793 1.000 1.000 1.000
Call_IV -.187 .276 .460 1 .498 .829 .483 1.424
Put_OI .000 .000 1.755 1 .185 1.000 1.000 1.000
Put_EID .000 .000 .009 1 .925 1.000 1.000 1.000
Put_IV -.223 .294 .574 1 .449 .800 .449 1.424
Constant .918 .311 8.696 1 .003 2.504
a. Variable(s) entered on step 1: Call_OI, Call_EID, Call_IV, Put_OI, Put_EID, Put_IV.
As shown in Table B1.3 when using the raw values for calls and puts for the EID, OI, and
IV variables, none of these variables was a significant predictor of event outcome. Table B1.4
shows the second iteration of the multinomial logistic regression model using categorical
variables for the EID, OI, and IV difference variables.

159
Table B1.4 Multinomial logistic regression with categorical independent difference variables
Parameter Estimates
Stock Change Categorya
B
Std.
Error Wald df Sig. Exp(B)
95% Confidence Interval
for Exp(B)
Lower
Bound
Upper
Bound
.00 Intercept -.638 .602 1.122 1 .289
[EID_Diff_Cat=.00] .857 .632 1.834 1 .176 2.355 .682 8.135
[EID_Diff_Cat=1.00] .691 .724 .912 1 .340 1.996 .483 8.244
[EID_Diff_Cat=2.00] -.900 .755 1.423 1 .233 .406 .093 1.784
[EID_Diff_Cat=3.00] .062 .630 .010 1 .922 1.064 .309 3.659
[EID_Diff_Cat=4.00] 0b . . 0 . . . .
[OI_Diff_Cat=.00] -.458 .627 .535 1 .465 .632 .185 2.160
[OI_Diff_Cat=1.00] -.782 .699 1.252 1 .263 .457 .116 1.800
[OI_Diff_Cat=2.00] -.870 .688 1.600 1 .206 .419 .109 1.613
[OI_Diff_Cat=3.00] -.040 .631 .004 1 .949 .961 .279 3.307
[OI_Diff_Cat=4.00] 0b . . 0 . . . .
[IV_Diff_Cat=.00] .015 .611 .001 1 .980 1.015 .307 3.361
[IV_Diff_Cat=1.00] .154 .561 .075 1 .784 1.167 .389 3.503
[IV_Diff_Cat=2.00] .415 .580 .511 1 .475 1.514 .485 4.722
[IV_Diff_Cat=3.00] -.110 .603 .033 1 .855 .896 .275 2.921
[IV_Diff_Cat=4.00] 0b . . 0 . . . .
2.00 Intercept -1.050 .653 2.591 1 .107
[EID_Diff_Cat=.00] -.330 .744 .197 1 .657 .719 .167 3.090
[EID_Diff_Cat=1.00] 1.133 .728 2.424 1 .119 3.105 .746 12.931
[EID_Diff_Cat=2.00] .125 .685 .033 1 .855 1.134 .296 4.343
[EID_Diff_Cat=3.00] -.590 .728 .656 1 .418 .555 .133 2.311
[EID_Diff_Cat=4.00] 0b . . 0 . . . .
[OI_Diff_Cat=.00] .008 .689 .000 1 .990 1.008 .261 3.891
[OI_Diff_Cat=1.00] -.830 .779 1.135 1 .287 .436 .095 2.006
[OI_Diff_Cat=2.00] -.819 .762 1.155 1 .283 .441 .099 1.963
[OI_Diff_Cat=3.00] .336 .699 .231 1 .630 1.400 .356 5.507
[OI_Diff_Cat=4.00] 0b . . 0 . . . .
[IV_Diff_Cat=.00] .981 .588 2.784 1 .095 2.667 .843 8.442

160
[IV_Diff_Cat=1.00] -1.397 .878 2.529 1 .112 .247 .044 1.384
[IV_Diff_Cat=2.00] .328 .657 .249 1 .618 1.388 .383 5.033
[IV_Diff_Cat=3.00] .472 .617 .585 1 .444 1.604 .478 5.379
[IV_Diff_Cat=4.00] 0b . . 0 . . . .
a. The reference category is: 1.00.
b. This parameter is set to zero because it is redundant.

161
Bibliography
Ahmed, I. The market return to pharmaceutical product approval. University of Texas at
Arlington. Master’s degree thesis. May 2007.
Albert ER, Saunders GB. New product announcements and stock prices. Decision sciences. 1980;11(1):90–97.
American Medical Association Code of Ethics E‐8.031 (1999) http://www0.ama‐
assn.org/apps/pf_new/pf_online?f_n=browse&p_p=T&&s_t=&st_p=&nth=1&prev_pol=policyfil
es/HnE/E‐8.031.HTM&nxt_pol=policyfiles/HnE/E‐8.032.HTM& (Accessed Sept. 28, 2008)
Anand G, Smith R. Biotech analysts strive to peek inside clinical tests of drugs. The Wall Street
Journal. August 8, 2002
Anthony J. The interrelation of stock and options market trading‐volume data. Journal of
Finance. 1988;43(4):949‐964.
Back K. Asymmetric information and options. Review of Financial Studies. 1993;6(3):435‐472.
Bhattacharya M. Price changes of related securities: the case of call options and stocks. Journal
of Financial and Quantitative Analysis. 1987;22(1):1‐15.
Black F, Scholes M. The pricing of options and corporate liabilities. Journal of Political Economy.
1973;81(3):637–654.
Black F. Fact and fantasy in the use of options. Financial Analysts Journal. 1975;31:36‐41.
Billingsley R, Chance D. Put‐call ratios and market timing effectiveness. Journal of Portfolio
Management. 1988;15(1):25‐28.
Boluch MJ, Chamberlain TW. Option volume and stock price behavior: some evidence from the
Chicago Board of Options Exchange. American Economic Journal. 1997;25(4):358‐370.
Cao C, Chen Z, Griffin J. Informational content of option volume prior to takeovers. Journal of
Business. 2005;78(3):1073‐1109.
Chatterjea A, Cherian J, Jarrow R. Market manipulation and corporate finance: a new
perspective. Financial Management. 1993;22(2):200‐209.
Chiarella v. United States, 445 U.S. 222, 228 (1980).
Chow, SC, Liu JP, Design and Analysis of Clinical Trials, Concepts and Methodologies, 240‐45. 2nd
Edition, Wiley‐Interscience; 2004.

162
Chan K, Chung Y, Fong W. The informational role of stock and option volume. Review of
Financial Studies. 2002;15(4):1049‐1075.
Chan K, Chung Y, Johnson H. Why option prices lag stock prices: a trading‐based explanation.
Journal of Finance. 1993;48(5):1957‐1967.
Chance D. Option volume and stock market performance. Journal of Portfolio Management.
1990;17,42‐51.
Chen R, Zhao X. The information content of insider call options trading. Financial Management.
2007;34(2):153‐172.
DeMark T. New Market Timing Techniques. New York: John Wiley & Sons; 1997.
DeMark T, DeMark TJ. Demark on Day Trading Options. New York: McGraw‐Hill;1999.
DiMasi JA. New drug development in the United States, 1963‐1999. Clinical Pharmacology and
Therapeutics. 2001;69(5):69‐78.
Dirks v. SEC, 463 U.S. 646, 655 n.14 (1985)
Dreman David N. & Berry Michael A. (1992). Overreaction, underreaction, and the low‐P/E
effect. Financial Analysts Journal. 51(4):21–30.
Easley D, O'Hara M, Srinivas P. Option volume and stock prices: evidence on where informed
traders Trade. Journal of Finance. 1998;53(2):431‐465.
Fama, EF. Efficient capital markets: a review of theory and empirical work. Journal of Finance
1970;25: 383–417.
Fama EF, Lawrence F, Jensen MC, Roll, R. The adjustment of stock prices to new information.
International Economic Review. 1969;10(1):1‐21.
Fox J. Is The Market Rational? No, say the experts. But neither are you‐‐so don't go thinking you
can outsmart it. Fortune. December, 2002.
Freestone DS, Mitchell H. Inappropriate publication of trial results and potential for allegations
of illegal share dealing. British Medical Journal. 1993;306:1112‐4.
Helft PR, Ratain MJ, Epstein RA, Siegler M. Inside information: financial conflicts of interest for
research subjects in early phase clinical trials. Journal of the National Cancer Institute.
2004;96(9):656‐660.
Henderson, V. Problems and solutions in conducting event studies. The Journal of Risk and
Insurance. 1990;57(2):282‐306.

163
Horwich A: The clinical trial research participant as an inside trader: a legal and policy analysis.
Journal of Health Law 2006;39(1):77‐116.
Jayaraman N, Frye MB, Sabherwal S. Informed trading around merger announcements: an
empirical test using transaction volume and open interest in options market. The Financial
Review 2001;37:45‐74.
Khotari SP, Warner JB. Econometrics of event studies. Handbook of Corporate Finance:
Empirical Corporate Finance. Elsevier/North‐Holland; 2006.
Lakonishok J, Lee I. Are insider trades informative?. Review of Financial studies. 2001;14:79‐
111.
Lipsky MS, Sharp LK. From idea to market: the drug approval process. Journal of the American
Board of Family Medicine 2001;14(5):362‐367
MacKinlay CA. Event studies in economics and finance. Journal of Economic Literature.
1997;35:13‐39.
Manaster S, Rendleman R. Option prices as predictors of equilibrium stock prices. Journal of
Finance. 1982;37(4):1043‐1057.
McMillian LG. Options as a Strategic investment. New York: Prentice Hall Press, 4th Sub Edition;
2002.
Pan J, Poteshman AM. The information in option volume for future stock prices. The Review of Financial
Studies. 2006;19(3):871‐906.
Prentice RA, Clinical trial results, physicians, and insider trading. The Journal of Legal Medicine
1999;20:195‐222.
Rosenberg B, Reid K, Lanstein R. Persuasive evidence of market inefficiency. Journal of Portfolio
Management. 1985;13:9‐17.
Reuters US Edition Industries. Available at:
http://www.reuters.com/sectors/industries/overview?industryCode=159. Accessed 3/12/2010.
Securities and Exchange Commission. Securities Exchange Act of 1934.
http://www.sec.gov/about/laws/sea34.pdf (accessed September 23, 2008)
Sharma A, Lacey N. Linking product development outcomes to market valuation of the firm: the
case of the US pharmaceutical industry. Journal of Product Innovation Manangement.
2004:21:297‐308.
Steinbrook R. Gag clauses in clinical‐trial agreements. New England Journal of Medicine
2005;352(21):2160‐2162.

164
Stephan J, Whaley R. Intraday price change and trading volume relations in the stock and stock
option markets. Journal of Finance. March 1990;45(1):191‐220.
Stern JM. The Revolution in Corporate Finance. Wiley‐Blackwell; 2002.
Timmerman L, Heath D. Drug researchers leak secrets to Wall St. Seattle Times. August 7, 2005.
Topol EJ, Blumenthal D. Physicians and the investment industry. Journal of the American
Medical Association. 2005;293:2654‐2657.
United States v. O’Hagan 521 U.S. 642, 655 (1997).
Wells RJ. Secrecy and integrity in clinical trials. Journal of Clinical Oncology. 2008;26(4):680‐
682.
Yahoo Finance Industry Browser‐Healthcare‐Biotechnology‐Company List. Available at:
http://biz.yahoo.com/p/515conameu.html. Accessed 3/12/2010.
Yahoo Finance Industry Browser‐Healthcare‐Drug Manufacturers‐Company List. Available at:
http://biz.yahoo.com/p/510conameu.html. Accessed 3/12/2010.

165
Vita
Stephen A. Yarger was born in Lawrence, Kansas. After attending high school at Strake Jesuit
College Preparatory in Houston, Texas, he attended the McCombs School of Business at the
University of Texas. After completing an undergraduate degree in Business Honors/MIS, he
researched investing and traded stocks for a living for ten years. In 2004, Stephen entered the
Graduate School at the University of Texas at Austin.
Contact Address: 228 Abiso Ave, San Antonio, Texas 78209
This manuscript was typed by the author.