Copyright by Dmitri A. Kraptchetov 2008
221
Copyright by Dmitri A. Kraptchetov 2008
Transcript of Copyright by Dmitri A. Kraptchetov 2008

Copyright
by
Dmitri A. Kraptchetov
2008
The Dissertation Committee for Dmitri A. Kraptchetov Certifies that
this is the approved version of the following dissertation:
CONJUGATED DITHIOLS AS MODEL SYSTEMS FOR
MOLECULAR ELECTRONICS: ASSEMBLY, STRUCTURE, AND
ELECTRICAL RESPONSE
Committee:
Yueh-Lin Loo, Supervisor
Isaac Sanchez, Supervisor
Ananth Dodabalapur
Gyeong Hwang
Chris Mack
Charles Mullins
CONJUGATED DITHIOLS AS MODEL SYSTEMS FOR
MOLECULAR ELECTRONICS: ASSEMBLY, STRUCTURE, AND
ELECTRICAL RESPONSE
by
Dmitri A. Kraptchetov, B.S.
Dissertation
Presented to the Faculty of the Graduate School of
The University of Texas at Austin
in Partial Fulfillment
of the Requirements
for the Degree of
Doctor of Philosophy
The University of Texas at Austin
May, 2008

Dedication
To my family.
v
Acknowledgements
I am grateful to the many people that helped me during the course of my Ph.D.
program. First, I would like to thank my advisor, Professor Yueh-Lin Loo, for her support
and advice throughout the course of my studies. Her continuous guidance was invaluable
in helping me navigate through the multiple challenges of graduate research. I would like
to thank the members (former and current) of the Loo group: Drs. Kimberly Dickey and
Kwang Seok Lee for thoughtful scientific discussions, their help and advice with
equipment training and the many details of experimentation; Tracy Bucholz and Kyle
Guice for insightful discussions of the many aspects of my work and the editorial
feedback during my dissertation writing process; Reken Patel for his help and advice with
microscopy; Joung Eun Yoo and Jacob Tarver for being inspiring colleagues.
I would like to acknowledge our many collaborators: Drs. Hong Ma and Alex K.
Y. Jen for providing the dithiols used in my studies, Dr. Daniel A. Fischer for his help
and advice with NEXAFS spectroscopy studies, Dr. Yangming Sun for his help and
guidance with XPS studies. I am also grateful to late Prof. Michael White who donated
the FTIR spectrometer used for my IR studies. I thank Dr. Ken Shih and Alexander
Khajetoorians for their willingness to explore and help with preliminary STM attempts,
Drs. Brian Korgel and Grant Willson for allowing me to use their facilities for my
experiments, Alec Nepomnyashchii for his help with mercury probe preparation. Special

vi
thanks to Dr. Victor Pryamitsyn for being an insightful mentor and a constant source of
scientific advice.
I thank Drs. Ananth Dodabalapur, Charles Mullins, Chris Mack, and Gyeong
Hwang for providing feedback for my research as my doctorate committee members.
I am forever grateful to my family in Russia whose unconditional love and
support have always helped me persevere through my studies in the United States.
Finally, I acknowledge the following funding agencies: the Camille and Henry
Dreyfus New Faculty Award, the National Science Foundation (DMR – 0314707), Ricoh
Innovations, and the Keck Foundation.

vii
CONJUGATED DITHIOLS AS MODEL SYSTEMS FOR
MOLECULAR ELECTRONICS: ASSEMBLY, STRUCTURE, AND
ELECTRICAL RESPONSE
Publication No._____________
Dmitri A. Kraptchetov, Ph.D.
The University of Texas at Austin, 2008
Supervisors: Yueh-Lin Loo and Isaac C. Sanchez
Molecular assemblies are promising candidates for nano-scale electronics due to
their chemical and structural versatility. The successful fabrication of assembly-based
nano-scale electronics, where molecular assemblies comprise the electrically-active
components, requires the ability to reliably form molecular assemblies and the ability to
‘wire’ them into electrical junctions. This dissertation focuses on the processing-structure
relationships of model conjugated dithiols, the formation of electrical junctions with these
molecular assemblies, and the characterization of these junctions.
Biphenyldithiol (BPDT), terphenyldithiol (TPDT), and quaterphenyldithiol
(QPDT) are assembled in solution from their thioacetyl precursors which are converted
in-situ to thiolates using NH4OH. We elucidated how the type of substrate, the solvent
quality, and the concentrations of NH4OH and the thioacetyl precursors affect the final
structures of these assemblies. BPDT molecular assemblies are disordered on both gold
(Au) and gallium arsenide (GaAs) at all conditions explored. TPDT and QPDT adopt the
viii
most upright molecular orientations on both Au and GaAs when the assembly is carried
out from EtOH-rich solutions at low NH4OH and high precursor concentrations. At these
conditions, the assembly formation process is dominated by the adsorption of thioacetyl-
terminated molecules. When the assembly is carried with high NH4OH and low precursor
concentrations, adsorption is dominated by thiolates; TPDT and QPDT are disordered on
Au and GaAs. None of the molecules adsorb significantly on GaAs from THF.
The presence of S-Au bonds at the molecular assembly – top Au contact interface
was directly probed by x-ray photoelectron spectroscopy. Depositing Au electrodes on
QPDT assemblies by nTP in dichloroethane results in the reproducible formation of S-Au
bonds at the molecule-Au interface.
Finally, we measured the electrical response of the model conjugated molecular
assemblies on GaAs through direct contact with galinstan. The current densities scale
inversely with the tunneling distance, which is determined by factors including the length
of the conjugated molecule and the molecular orientation of the assembly. We also
examined the electrical response of GaAs—QPDT—Au junctions in which the Au
electrodes were transferred using an elastomeric stamps. The electrical characteristics of
these junctions were independent of orientation of the molecules and the presence of S-
Au bonds at the charge transfer interface. Hydrocarbon contamination on the Au
electrodes left by the elastomeric stamp during transfer masked any electrical response
from QPDT. It is therefore crucial to ensure the pristine quality of the electrical contact in
order to reliably measure the electrical response of the molecular assembly.
The fabrication and testing of assembly-based electrical junctions is challenging
in terms of both controlling the assembly structures and measuring their electrical
response. Careful attention must therefore be paid to each aspect of molecular assembly-
based junction formation and characterization.

ix
Table of Contents
List of Tables ......................................................................................................... xi
List of Figures ....................................................................................................... xii
List of Illustrations.............................................................................................. xxv
Chapter 1: Introduction ............................................................................................1
Motivation.......................................................................................................1
Background.....................................................................................................5
Thesis Overview .............................................................................................9
Figures...........................................................................................................11
References.....................................................................................................17
Chapter 2: Experimental Techniques.....................................................................22
Synthesis of Dithiols .....................................................................................22
Molecular Assembly Formation ...................................................................25
Nano-Transfer Printing (nTP).......................................................................29
Near-Edge X-ray Absorption Fine Structure (NEXAFS) Spectroscopy ......31
Fourier Transform Infrared (FTIR) Spectroscopy ........................................37
UV-Vis-NIR..................................................................................................43
Ellipsometry..................................................................................................44
X-ray Photoelectron Spectroscopy (XPS) ....................................................44
Scanning Electron Microscopy (SEM) .........................................................45
Atomic Force Microscopy (AFM) ................................................................46
Current-Voltage (I-V) Characterization........................................................46
Optical Microscopy.......................................................................................47
Figures...........................................................................................................48
References.....................................................................................................61

x
Chapter 3: The Effect of Solvent Quality on the Structure of BPDT, TPDT, and QPDT Assemblies on Au and GaAs.............................................................65
Figures...........................................................................................................79
References.....................................................................................................87
Chapter 4: The Effect of NH4OH Concentration and Precursor Concentration on the Structure of TPDT and QPDT Assemblies...................................................90
Figures.........................................................................................................112
References...................................................................................................123
Chapter 5: Deposition of Top Metal Electrode and Characterization of the Molecule-Electrode Interface in Model Conjugated Assemblies on GaAs ................125
Figures.........................................................................................................136
References...................................................................................................140
Chapter 6: The Effects of Assembly Structure on Charge Transport Across BPDT, TPDT, and QPDT Assemblies on GaAs.....................................................143
Figures.........................................................................................................159
References...................................................................................................167
Chapter 7: Conclusions and Future Work............................................................171
Conclusions.................................................................................................171
Future Work ................................................................................................178
Figures.........................................................................................................182
References...................................................................................................183
References............................................................................................................185
Vita…………………...........................................................................................196

xi
List of Tables
Table 3.1: Calculated dichroic ratios and ensemble-average backbone tilt angles of
BPDT, TPDT and QPDT assemblies on Au at varying solvent
compositions .....................................................................................90
Table 3.2: Calculated dichroic ratios and ensemble-average backbone tilt angles of
BPDT, TPDT and QPDT assemblies on GaAs at varying solvent
compositions .....................................................................................91
xii
List of Figures
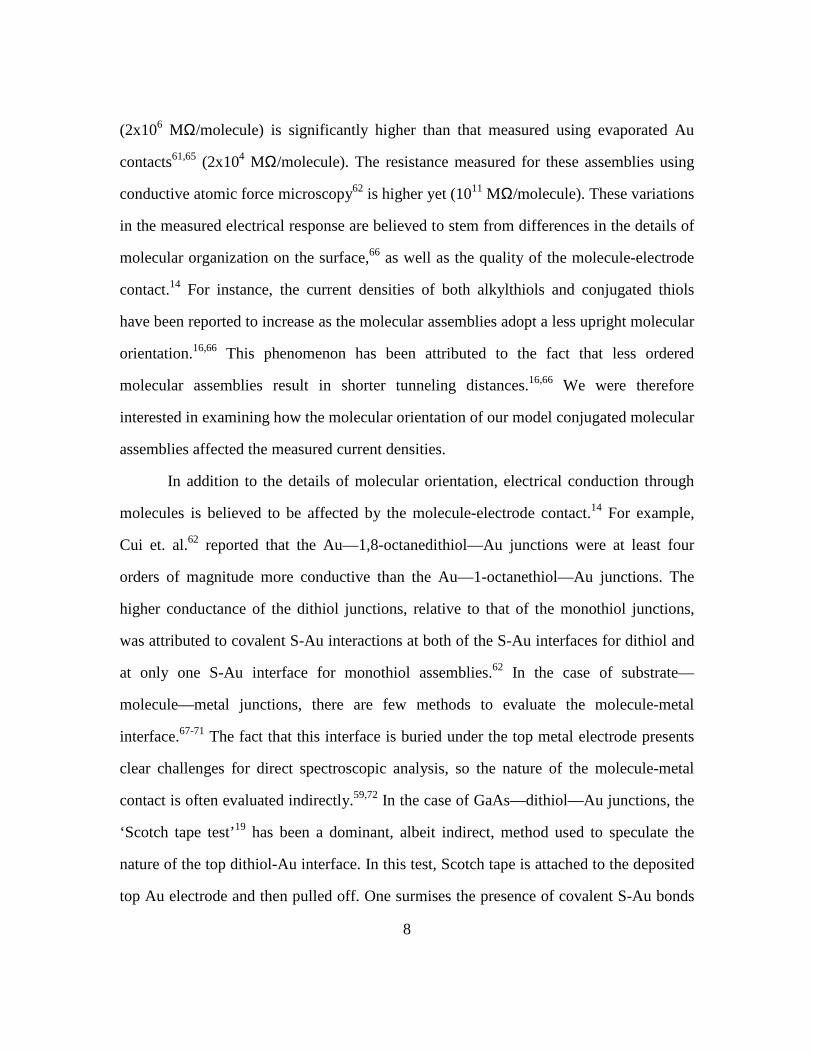
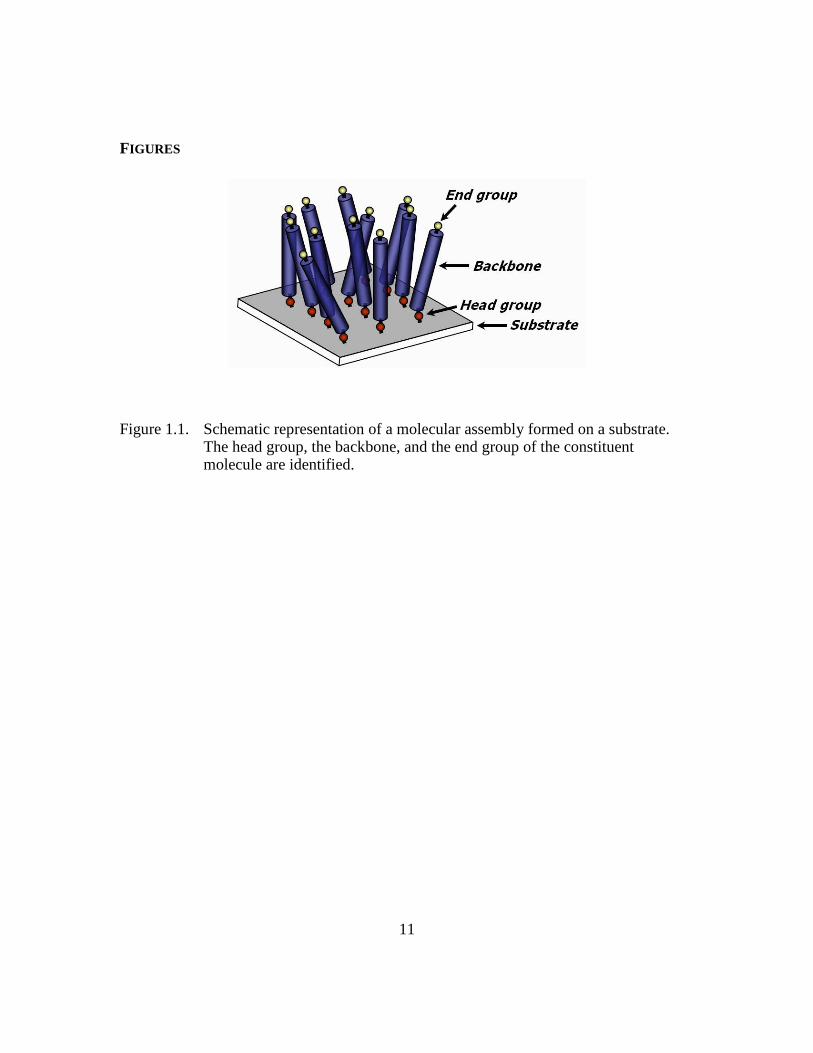
Figure 1.1: Schematic representation of a molecular assembly formed on a substrate.
The head group, the backbone, and the end group of the constituent
molecule are identified......................................................................11
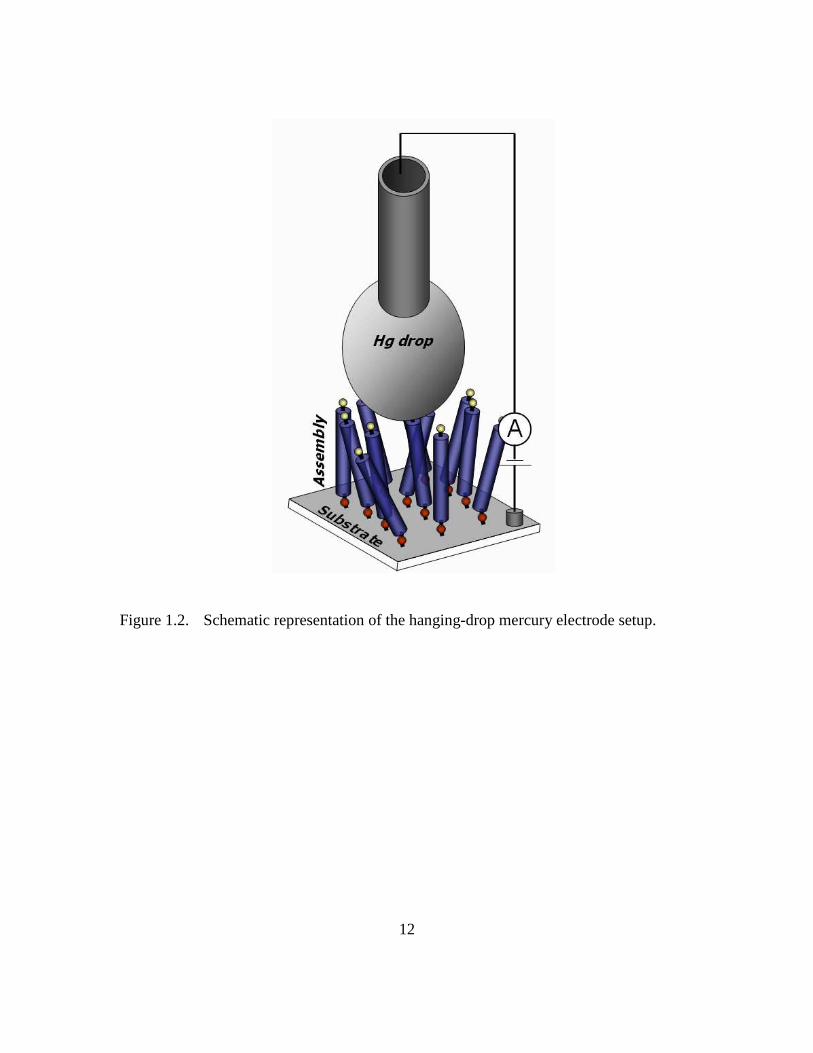
Figure 1.2: Schematic representation of the hanging-drop mercury electrode setup
...........................................................................................................12
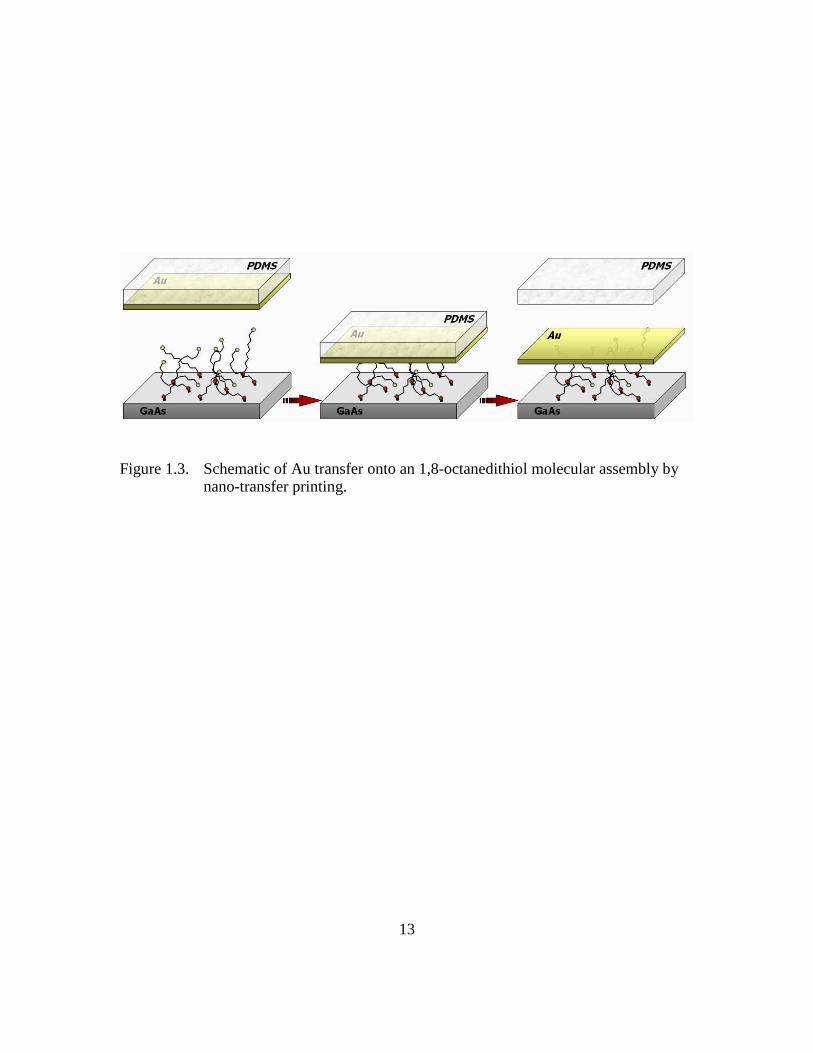
Figure 1.3: Schematic of Au transfer onto an 1,8-octanedithiol molecular assembly
by nano-transfer printing...................................................................13
Figure 1.4: Chemical structures of biphenyldithiol (BPDT), terphenyldithiol
(TPDT), and quaterphenyldithiol (QPDT) used in this work ...........14
Figure 1.5: Atomic force microscopy topographical images of (a) etched GaAs
substrate (rms roughness of ≈ 0.3 nm) and (b) a Si substrate with 100 nm
thick Au (rms roughness of ≈ 1.3 nm) ..............................................15
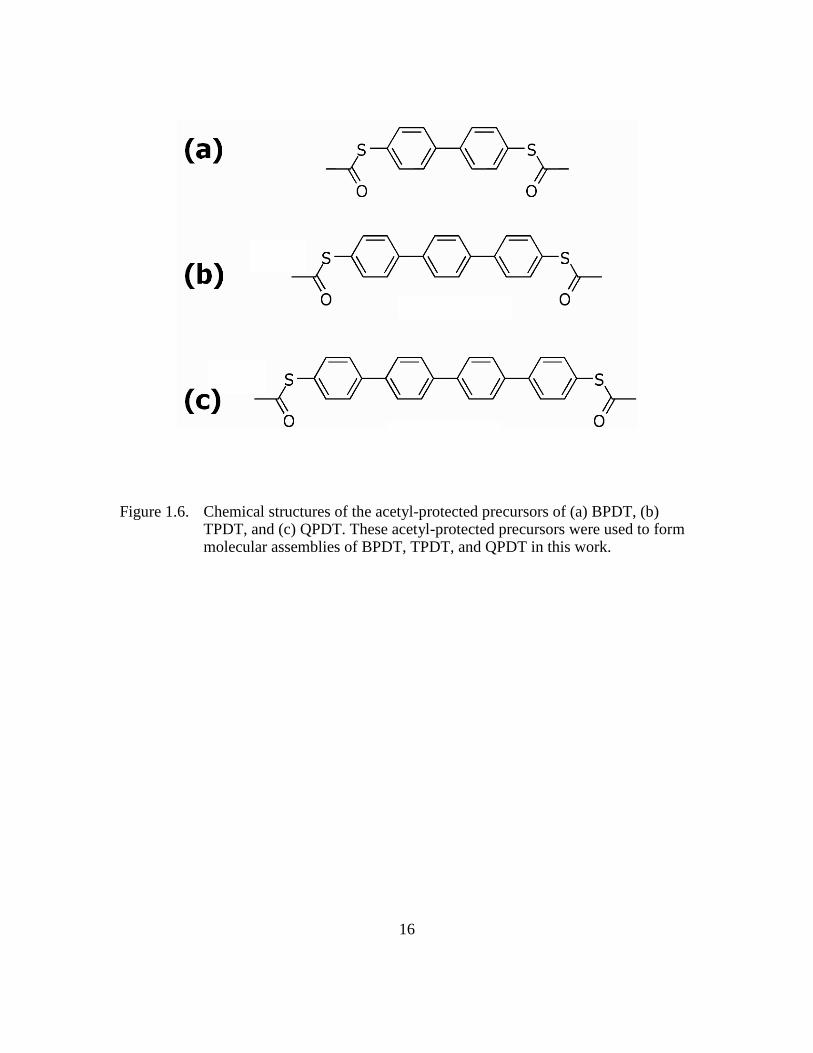
Figure 1.6: Chemical structures of the acetyl-protected precursors of (a) BPDT, (b)
TPDT, and (c) QPDT. These acetyl-protected precursors were used to
form molecular assemblies of BPDT, TPDT, and QPDT in this work
...........................................................................................................16
Figure 2.1: Schematic of the assembly procedure with the major steps consecutively
numbered...........................................................................................50
Figure 2.2: A sample pre-edge normalized C 1s NEXAFS spectrum of TPDT
assembled on Au. The major spectral features are identified ...........51
xiii
Figure 2.3: A sample set of angle-dependent, pre- and post-edge normalized C 1s
NEXAFS spectra of TPDT assembled on Au acquired at the specified x-
ray incident angles. The difference spectra (bottom portion of the plot)
emphasize the angle-dependent spectral features, and are offset along the
y-axis from the NEXAFS data for clarity .........................................52
Figure 2.4: Schematic of a TPDT molecule adsorbed on a substrate. The angles used
in our NEXAFS orientation analysis based on the BB model are
identified ...........................................................................................53
Figure 2.5: The π* integrated intensities derived from the spectra in Figure 2.4 as a
function of x-ray incident angle and the corresponding theoretical fits
(dotted lines) to Equation (2.2). The best fit (solid line) and the resulting
backbone tilt angle are highlighted ...................................................54
Figure 2.6: (a) RAIRS spectrum of QPDT on Au; (b) transmission IR spectrum of
the acetyl-protected QPDT precursor powder dispersed in KBr. The
major in-plane (ip), out-of-plane (op), and acetyl (ac) vibrations are
labeled. The directions of phenyl backbone vibrations are illustrated in
the cartoon on the right. The dips visible in (a) at 1383 and 1468 cm-1
are due to background correction with the spectrum of 1-
hexadecanethiol molecular assembly on Au.....................................55
Figure 2.7: Background-corrected transmission IR spectra of a QPDT assembly on
GaAs acquired at θ = 30° with s- polarized light (a) before and (b) after
smoothing. (c) Transmission IR spectrum of the acetyl-protected QPDT
precursor dispersed in KBr. The major in-plane (ip), out-of-plane (op),
and acetyl (ac) vibrations are labeled. The directions of phenyl backbone
vibrations are illustrated in the cartoon on the right .........................56
xiv
Figure 2.8: (a) Schematic of the transmission IR setup with the substrate twisted θ
relative to the incident irradiation. The orientation cone of a molecule
tilted ρ away from the substrate normal and the corresponding dipole
coordinate system are included; (b) the experimental setup when θ = 0°;
(c) the experimental setup as θ 90° ..............................................57
Figure 2.9: Transmission IR spectra of a QPDT assembly on GaAs acquired at
varying incident angles, θ, using s-polarized light ...........................58
Figure 2.10: Transmission IR spectra of a QPDT assembly on GaAs acquired at
varying incident angles, θ, using p-polarized light...........................59
Figure 2.11: Schematic of the hanging-drop galinstan probe making electrical contact
to (a) GaAs—molecule—Au and (b) the molecular assembly directly.
Representative photographs of the galinstan drop in contact with the
surface of interest are included .........................................................60
Figure 3.1: C 1s polarization-independent, pre-edge normalized NEXAFS spectra of
(a) BPDT on Au, (b) TPDT on Au, (c) QPDT on Au, (d) BPDT on
GaAs, (e) TPDT on GaAs, and (f) QPDT on GaAs acquired at an x-ray
incident angle of 55°. BPDT and TPDT assemblies were formed from
EtOH (dashed lines) or from THF (solid lines) solutions. QPDT
assemblies were formed from a solution at EF = 0.9 (dashed lines) or
from THF (solid lines) solutions. Relevant spectral features are
identified in (a)..................................................................................79
xv
Figure 3.2: π*/jump ratios extracted from the NEXAFS spectra obtained at an x-ray
incident angle of 55° of BPDT, TPDT and QPDT assembled on (a) Au
and (b) GaAs as a function of ethanol fraction (EF) in the assembly
solution. The π*/jumps reflect the relative surface coverages of the
assemblies. At high EFs, the surface coverages of assemblies on GaAs
approach those of the assemblies on Au...........................................80
Figure 3.3: C 1s angle-dependent, pre- and post-edge normalized NEXAFS spectra
of BPDT assembled on Au from (a) EtOH and (b) THF acquired at
varying x-ray incident angles. Dichroic ratios derived from each set of
spectra are included...........................................................................81
Figure 3.4: C 1s angle-dependent, pre- and post-edge normalized NEXAFS spectra
of TPDT assembled on Au from (a) EtOH and (b) THF acquired at
varying x-ray incident angles. The difference spectra (bottom portions of
plots) emphasize angle-dependent spectral features, and are offset from
the angle-dependent NEXAFS data sets along the y-axis for clarity. The
dichroic ratios derived from each set of spectra are included. The π*
integrated intensities extracted from the NEXAFS spectra in (a) and (b)
as a function of x-ray incident angle and the corresponding theoretical
fits to Equation (2.2) are presented in (c) and (d), respectively. Best fits
(solid lines) and the calculated backbone tilt angles are highlighted. The
dashed lines are graphical representations of Equation (2.2) at other
specified backbone tilt angles ...........................................................82
xvi
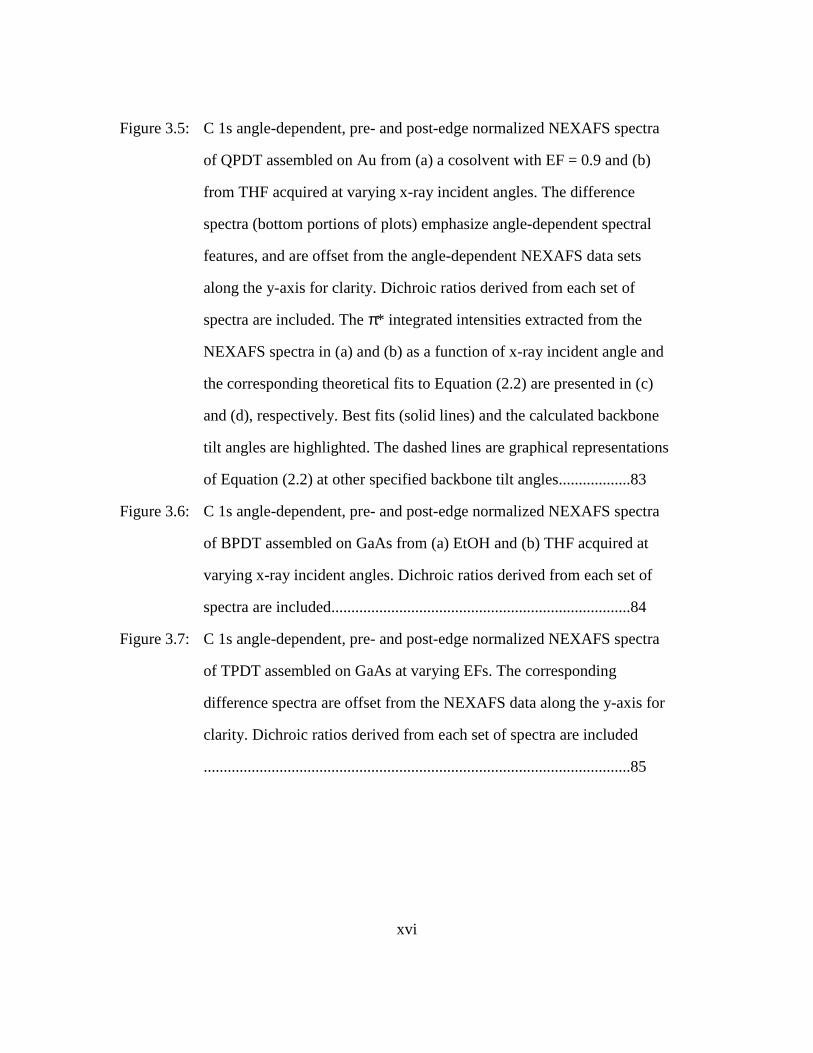
Figure 3.5: C 1s angle-dependent, pre- and post-edge normalized NEXAFS spectra
of QPDT assembled on Au from (a) a cosolvent with EF = 0.9 and (b)
from THF acquired at varying x-ray incident angles. The difference
spectra (bottom portions of plots) emphasize angle-dependent spectral
features, and are offset from the angle-dependent NEXAFS data sets
along the y-axis for clarity. Dichroic ratios derived from each set of
spectra are included. The π* integrated intensities extracted from the
NEXAFS spectra in (a) and (b) as a function of x-ray incident angle and
the corresponding theoretical fits to Equation (2.2) are presented in (c)
and (d), respectively. Best fits (solid lines) and the calculated backbone
tilt angles are highlighted. The dashed lines are graphical representations
of Equation (2.2) at other specified backbone tilt angles..................83
Figure 3.6: C 1s angle-dependent, pre- and post-edge normalized NEXAFS spectra
of BPDT assembled on GaAs from (a) EtOH and (b) THF acquired at
varying x-ray incident angles. Dichroic ratios derived from each set of
spectra are included...........................................................................84
Figure 3.7: C 1s angle-dependent, pre- and post-edge normalized NEXAFS spectra
of TPDT assembled on GaAs at varying EFs. The corresponding
difference spectra are offset from the NEXAFS data along the y-axis for
clarity. Dichroic ratios derived from each set of spectra are included
...........................................................................................................85
xvii
Figure 3.8: C 1s angle-dependent, pre- and post-edge normalized NEXAFS spectra
of QPDT assembled on GaAs at varying EFs. The corresponding
difference spectra are offset from the NEXAFS data along the y-axis for
clarity. Dichroic ratios derived from each set of spectra are included
...........................................................................................................86
Figure 4.1: UV-Vis-NIR spectra of TPDT dissolved in (a) EtOH and (b) THF with
the addition of NH4OH at varying concentrations 1h after injection.
Spectra of acetyl-protected TPDT precursor dissolved in EtOH and THF
are included as solid lines in (a) and (b) for reference. Panel (c) contains
UV-Vis-NIR spectra of acetyl-protected TPDT precursor (solid line) and
TPDT dissolved in THF after 25 hours of NH4OH injection at 160 mM
(dashed line). The latter spectrum was scaled for clarity................112
Figure 4.2: RAIRS spectra of TPDT assembled on Au from (a) EtOH and (b) THF
with (i) no NH4OH added, and with the addition of (ii) 1, (iii) 10, (iv)
30, and (v) 160 mM of NH4OH. ORr extracted from each of the spectra
are included. Major vibrations are identified in (a) ........................113
Figure 4.3: C 1s angle-dependent, pre- and post-edge normalized NEXAFS spectra
of TPDT assembled on Au from (a) EtOH and (b) THF with (i) no
NH4OH added, and with the addition of (ii) 1, (iii) 10, (iv) 30, and (v)
160 mM NH4OH. The dichroic ratios derived from each set of spectra
are included.....................................................................................114
Figure 4.4: Orientation parameters and dichroic ratios derived from (a) RAIRS and
(b) NEXAFS spectra, respectively, for TPDT assembled on Au from
EtOH and THF as a function of NH4OH concentration .................115
xviii
Figure 4.5: Transmission IR spectra of TPDT assembled on GaAs from (a) EtOH
and (b) THF with (i) no NH4OH added, and with the addition of (ii) 1,
(iii) 10, (iv) 30, and (v) 160 mM NH4OH. ORt extracted from each of
the spectra are included. Major vibrations are identified in (a) ......116
Figure 4.6: C 1s angle-dependent, pre- and post-edge normalized NEXAFS spectra
of TPDT assembled on GaAs from (a) EtOH and (b) THF with (i) no
NH4OH added, and with the addition of (ii) 1, (iii) 10, (iv) 30, and (v)
160 mM NH4OH. The dichroic ratios derived from each set of spectra
are included.....................................................................................117
Figure 4.7: Orientation parameters and dichroic ratios derived from (a) transmission
IR and (b) NEXAFS spectra, respectively, for TPDT assembled on
GaAs from EtOH and THF as a function of NH4OH concentration
.........................................................................................................118
Figure 4.8: Transmission IR spectra of QPDT assembled on GaAs from a cosolvent
with EF = 0.75 with the addition of (a) 10 and (b) 160 mM of NH4OH.
ORt extracted from each of the spectra are included. Major vibrations are
identified in (a)................................................................................119
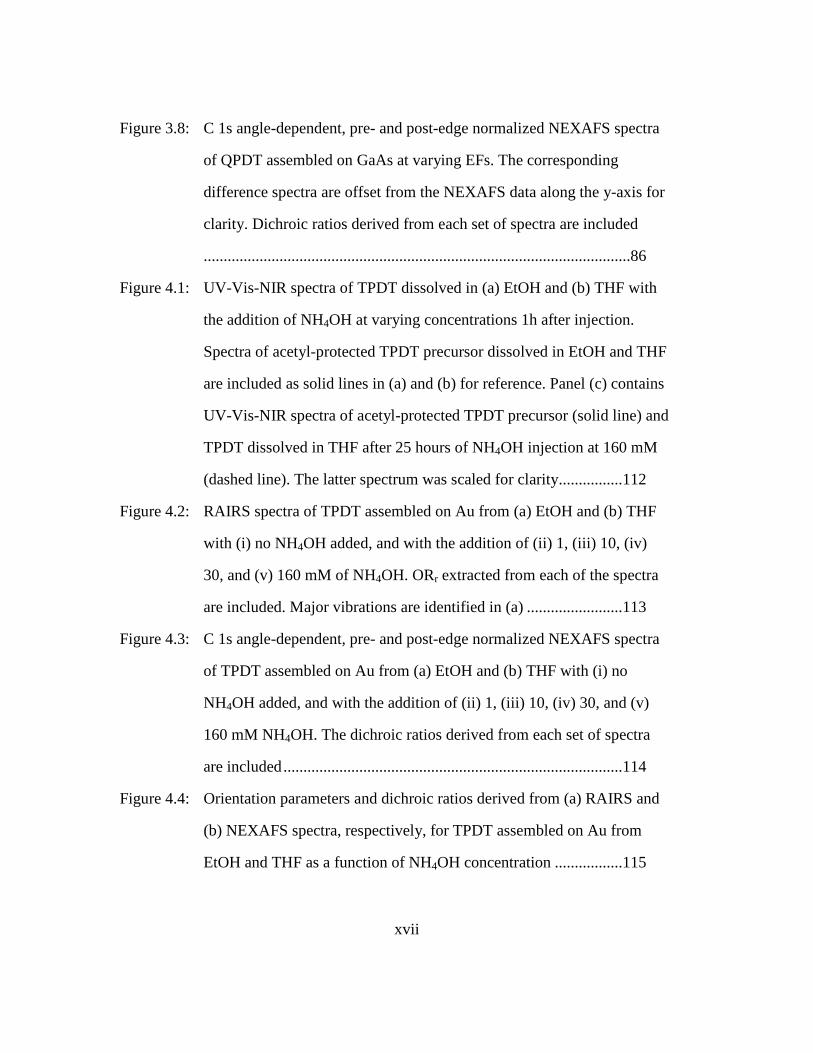
Figure 4.9: C 1s angle-dependent, pre- and post-edge normalized NEXAFS spectra
of QPDT assembled on GaAs from a cosolvent with EF = 0.75 with (a)
no NH4OH added, and with the addition of (b) 1, (c) 10, (d) 30, and (e)
160 mM NH4OH. The dichroic ratios derived from each set of spectra
are included.....................................................................................120

xix
Figure 4.10: Transmission IR spectra of TPDT assembled on GaAs from (a) EtOH
with the addition of 1 mM NH4OH and (b) THF with the addition of 160
mM NH4OH. The TPDT precursor concentration varied from (i) 50, (ii)
80, (iii) 125, (iv) 250, to (v) 375 µM for the assemblies from EtOH and
from (i) 80, (ii) 200, to (iii) 500 µM for the assemblies from THF. ORt
extracted from each of the spectra are included. Major vibrations are
identified in (a)................................................................................121
Figure 4.11: Transmission IR spectra of QPDT assembled on GaAs from THF with
the addition of 160 mM NH4OH and QPDT precursor concentration of
(a) 50, (b) 100, (c) 150, and (d) 200 µM. ORt extracted from each of the
spectra are included. Major vibrations are identified in (a) ............122
Figure 5.1: XPS spectra of the S 2p region of 1,8-octanedithiol molecular
assemblies on (a) GaAs and (b) on Au; (c) contains the S 2p spectrum of
1,8-octanedithiol assembled on GaAs after the deposition of ≈15Å Au
using nTP at ambient conditions. Inset in (c) contains the Au 4f
spectrum of the corresponding sample. The S 2p spectra are fitted with
individual S 2p doublets: light gray, unbound thiol groups at the
assembly surface; dark gray, S-GaAs bonds at the dithiol-GaAs
interface; yellow, S-Au bonds formed at the dithiol-Au interface..136
xx
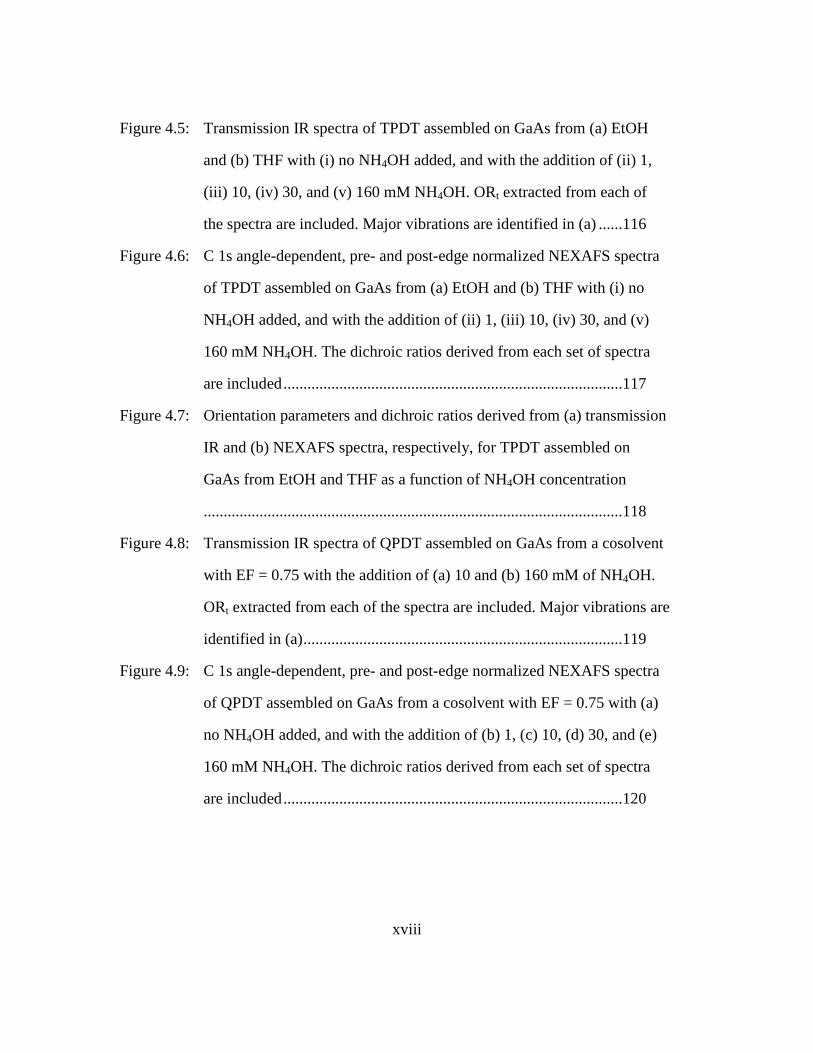
Figure 5.2: XPS spectra of the S 2p region of QPDT molecular assembly on GaAs
(a) before and (b) after the deposition of ≈15Å Au using ‘wet’ nTP in
DCE. Inset in (b) contains the Au 4f spectrum of the corresponding
sample. The S 2p spectra are fitted with individual S 2p doublets: light
gray, unbound thiolate/thioacetyl groups at the assembly surface; dark
gray, S-GaAs bonds at the dithiol-GaAs interface; yellow, S-Au bonds
formed at the dithiol-Au interface...................................................137
Figure 5.3: XPS spectra of (a) the S 2p region of QPDT molecular assembly on
GaAs after immersion in DCE; (b) C 1s and (c) Ga 2p regions before
and after immersion in DCE. Inset in (c) contains Cl 2p spectra of the
QPDT assembly before and after immersion in DCE. Spectra in (b) and
(c) are vertically offset for clarity. The S 2p spectrum is fitted with
individual S 2p doublets: light gray, unbound thiolate/thioacetyl groups
at the assembly surface; dark gray, S-GaAs bonds at the dithiol-GaAs
interface...........................................................................................138
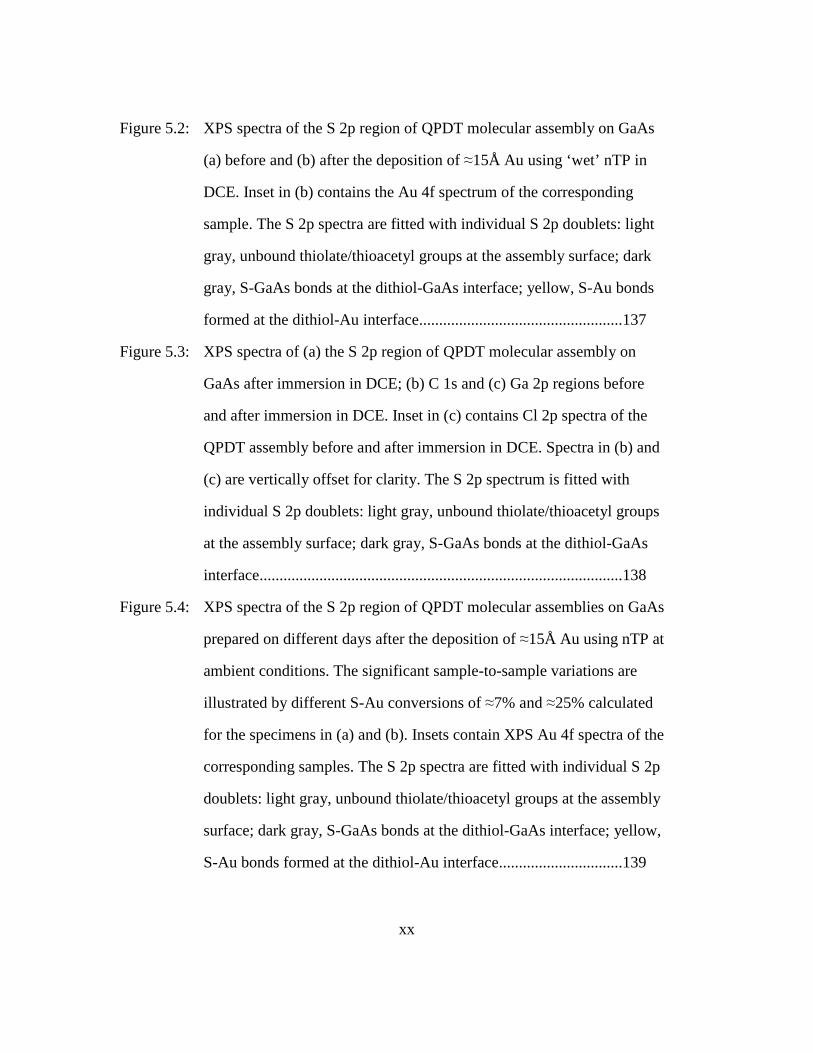
Figure 5.4: XPS spectra of the S 2p region of QPDT molecular assemblies on GaAs
prepared on different days after the deposition of ≈15Å Au using nTP at
ambient conditions. The significant sample-to-sample variations are
illustrated by different S-Au conversions of ≈7% and ≈25% calculated
for the specimens in (a) and (b). Insets contain XPS Au 4f spectra of the
corresponding samples. The S 2p spectra are fitted with individual S 2p
doublets: light gray, unbound thiolate/thioacetyl groups at the assembly
surface; dark gray, S-GaAs bonds at the dithiol-GaAs interface; yellow,
S-Au bonds formed at the dithiol-Au interface...............................139
xxi
Figure 6.1: Schematic representations of the (a) STM setup and (b) CAFM setup for
making electrical contact directly to molecular assembly surfaces
.........................................................................................................159
Figure 6.2: Schematic representations of (a) CAFM and (b) tungsten probe setups
for making electrical contact to the top Au electrodes that had been pre-
deposited on the molecular assembly surfaces ...............................160
Figure 6.3: Absolute current density as a function of applied bias to the galinstan
drop in contact with 1-hexadecanethiol molecular assembly on GaAs.
Error bars reflect standard deviations based on 23 separate
measurements on junctions of varying contact areas......................161
Figure 6.4: Absolute current density as a function of applied bias to the galinstan
drop when galinstan is in contact with QPDT, TPDT, and BPDT
assemblies on GaAs. The QPDT assemblies on GaAs were formed from
solutions with EF = 0.75 using no NH4OH (QPDT-0) and 10 mM
NH4OH (QPDT-10). The TPDT (TPDT-1) and BPDT (BPDT-1)
assemblies on GaAs were formed from EtOH solutions using 1 mM
NH4OH. Error bars reflect standard deviations based on 20-25 separate
measurements for BPDT-1 and TPDT-1 and on 40-50 separate
measurements for QPDT-0 and QPDT-10 on junctions of varying
contact areas....................................................................................162
xxii
Figure 6.5: Current as a function of applied bias to the galinstan drop in contact with
a freshly-evaporated Au substrate. The current was swept forwards and
backwards and no hysteresis was observed. The linear I-V response
indicates the formation of an ohmic contact between galinstan and the
freshly-evaporated Au. We estimated the resistivity of galinstan to be
≈100 nΩ m ......................................................................................163
Figure 6.6: Absolute current densities of GaAs—QPDT-10—Au junctions where
Au was transferred via nTP at ambient conditions as a function of
applied bias to the galinstan drop. The J-V curves were obtained by
normalizing the currents measured for the junctions (a) by Au electrode
contact area and (b) by the contact area of the galinstan drop. The
junctions were formed with Au electrode pads A, B, and C with areas of
3.1x10⁻², 2.0x10⁻³, 2.5x10⁻¹ cm2, respectively. The areas of the contacts
between the galinstan drop and the Au electrode pads A, B, and C were
6.2x10⁻⁴, 6.9x10⁻⁴, 1.9x10⁻³ cm2, respectively ................................164

xxiii
Figure 6.7: Absolute current density of GaAs—QPDT—Au junctions as a function
applied bias to the galinstan drop. The QPDT assemblies on GaAs were
formed from solutions with EF = 0.75 using no NH4OH added (blue
circles), and with 10 mM NH4OH (red squares and green circles). Top
Au electrodes were deposited by nTP at ambient conditions (QPDT-0
and QPDT-10 ambient) and in DCE (QPDT-10 DCE). To obtain the
current densities, the currents were normalized by Au electrode areas for
junctions prepared using nTP in DCE and by galinstan-Au contact areas
for junctions prepared using nTP at ambient conditions. Error bars
reflect standard deviations based on 50, 21, and 35 separate
measurements for QPDT-10, QPDT-0, and QPDT-10 DCE, respectively,
on junctions of varying contact areas. The inset shows a micrograph of
Au electrodes deposited on a QPDT assembly surface using nTP at
ambient conditions..........................................................................165
Figure 6.8: Absolute current density as a function of applied bias to the galinstan
drop brought in contact with GaAs—1,8-octanedithiol—Au junctions.
The top Au electrodes were deposited on the 1,8-octanedithiol molecular
assemblies on GaAs by nTP using unleached (blue circles) and leached
(red squares) elastomeric stamps at ambient conditions. Error bars
reflect standard deviations based on 30 and 20 separate measurements
for leached and unleached, respectively, on junctions of varying contact
areas ................................................................................................166

xxiv
Figure 7.1: C 1s pre- and post-edge normalized FY NEXAFS spectra of QPDT
assembled on GaAs before (bottom) and after (top) depositing 5 nm
thick Au by nTP. The spectra were acquired near the magic angle, at an
x-ray incident angle of 50°..............................................................182

xxv
List of Illustrations
Scheme 2.1: Synthesis schemes for the acetyl-protected precursors of
biphenyldithiol (BPDT), terphenyldithiol (TPDT) and
quaterphenyldithiol (QPDT) .......................................................48
Scheme 2.2: The conversion of thioacetyl end groups to thiolates with the
addition of NH4OH .....................................................................49
1
Chapter 1: Introduction
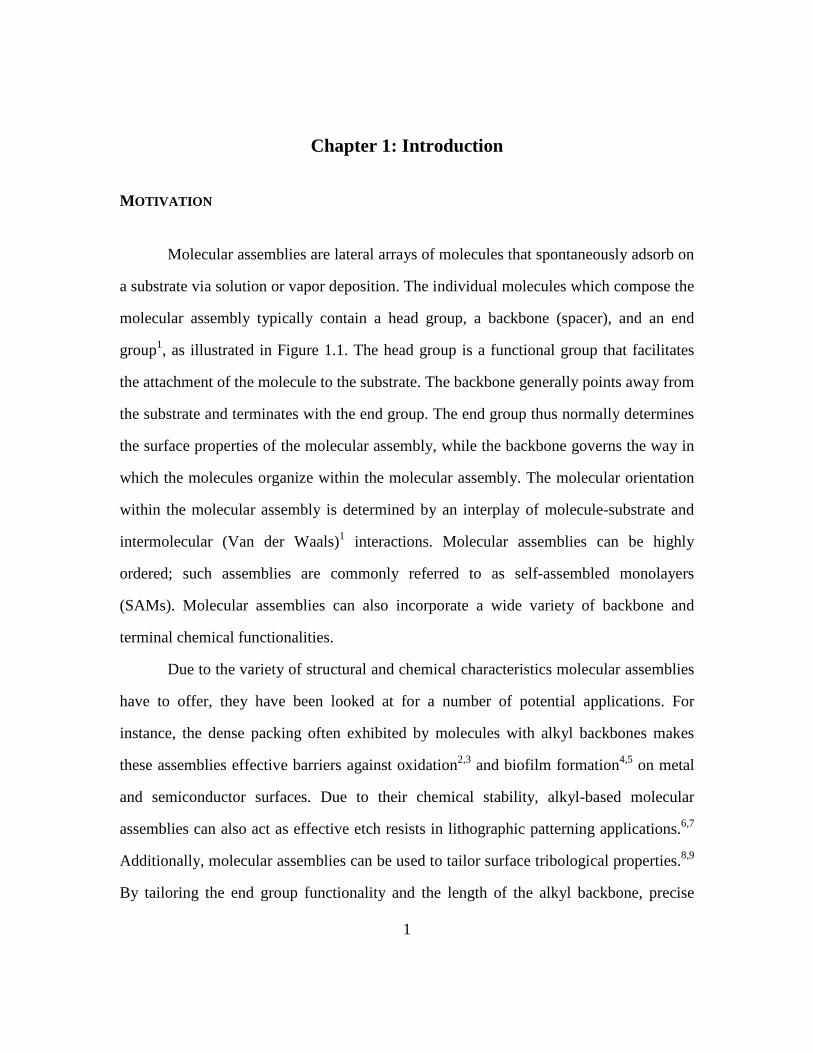
MOTIVATION
Molecular assemblies are lateral arrays of molecules that spontaneously adsorb on
a substrate via solution or vapor deposition. The individual molecules which compose the
molecular assembly typically contain a head group, a backbone (spacer), and an end
group1, as illustrated in Figure 1.1. The head group is a functional group that facilitates
the attachment of the molecule to the substrate. The backbone generally points away from
the substrate and terminates with the end group. The end group thus normally determines
the surface properties of the molecular assembly, while the backbone governs the way in
which the molecules organize within the molecular assembly. The molecular orientation
within the molecular assembly is determined by an interplay of molecule-substrate and
intermolecular (Van der Waals)1 interactions. Molecular assemblies can be highly
ordered; such assemblies are commonly referred to as self-assembled monolayers
(SAMs). Molecular assemblies can also incorporate a wide variety of backbone and
terminal chemical functionalities.
Due to the variety of structural and chemical characteristics molecular assemblies
have to offer, they have been looked at for a number of potential applications. For
instance, the dense packing often exhibited by molecules with alkyl backbones makes
these assemblies effective barriers against oxidation2,3 and biofilm formation4,5 on metal
and semiconductor surfaces. Due to their chemical stability, alkyl-based molecular
assemblies can also act as effective etch resists in lithographic patterning applications.6,7
Additionally, molecular assemblies can be used to tailor surface tribological properties.8,9
By tailoring the end group functionality and the length of the alkyl backbone, precise
2
control over frictional properties can be achieved in micro-electronic mechanical systems
(MEMS)10,11 applications. Further, molecular assemblies can be used as model surfaces
for understanding interfacial phenomena, such as adhesion and surface properties of
polymer films1 and of assembly-passivated nanowires.12
The recent interest in molecular assemblies has been also instigated by the
promise of nano-scale electronics,13 where individual molecules or molecular assemblies
comprise the electrically-active components. To explore the electrical characteristics of
individual molecules and to enable the fabrication of functional molecular-scale devices,
the molecules must be in intimate electrical contact with at least two electrodes.14 By
exploiting the proper head group functionality, molecules can be covalently attached to
an electrode, frequently the substrate. A separate technique, however, is necessary to
place the second, or top, electrode in contact with the molecules. Generally, there are two
approaches to ‘wiring’ the molecules to the second electrode. One involves making
electrical contact to the molecules directly with the metal of interest (so no top electrode).
An example of this approach is the hanging-drop mercury (Hg) electrode. The hanging-
drop Hg electrode15,16 setup involves making direct macroscopic contact to a molecular
assembly surface using a drop of Hg, as schematically illustrated in Figure 1.2. The
second approach to ‘wire’ the molecules involves first depositing a top electrode (usually
gold, Au) and then making electrical contact to the Au electrode. The Au electrode can be
first defined on a sacrificial substrate and then transferred onto the molecular assembly.
Nano-transfer printing (nTP) is one such example.17 Originally developed by Loo and co-
workers using 1,8-octanedithiol assemblies on gallium arsenide (GaAs),17 nTP is
schematically illustrated in Figure 1.3. This procedure involves a molecular assembly of
dithiols adsorbed on a substrate, resulting in the chemical attachment of molecules to the
substrate via one of the thiol groups. Separately, an elastomeric poly(dimethylsiloxane)
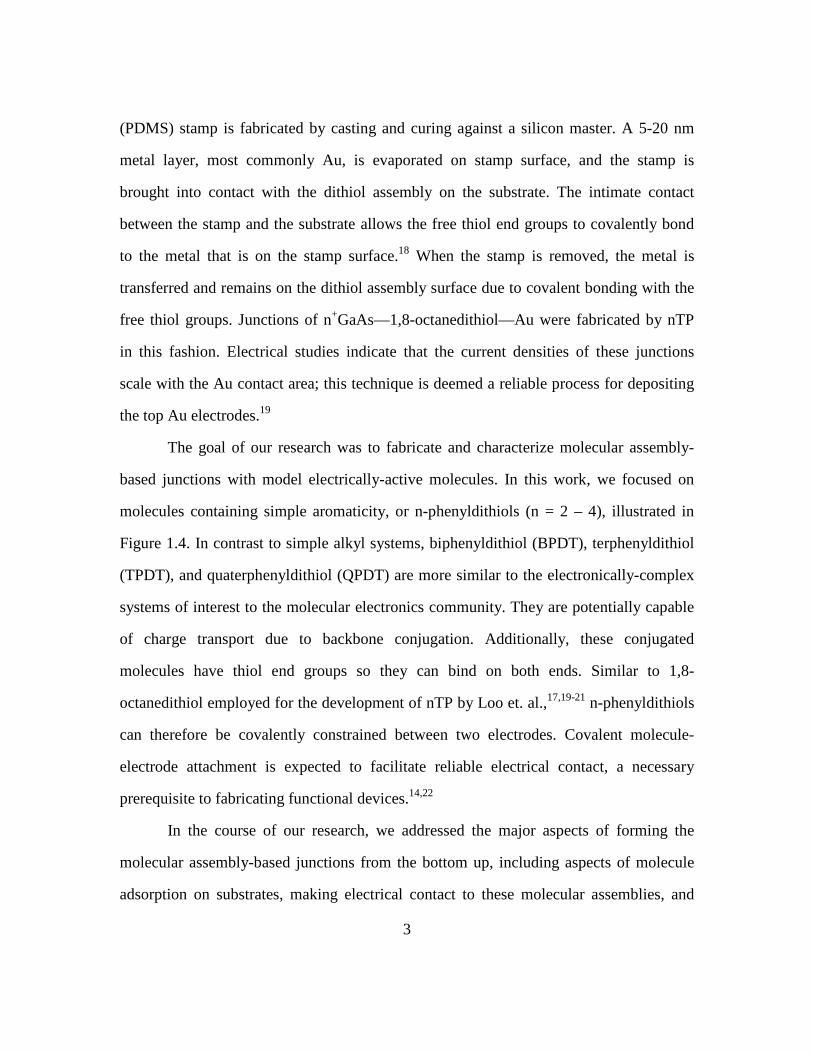
3
(PDMS) stamp is fabricated by casting and curing against a silicon master. A 5-20 nm
metal layer, most commonly Au, is evaporated on stamp surface, and the stamp is
brought into contact with the dithiol assembly on the substrate. The intimate contact
between the stamp and the substrate allows the free thiol end groups to covalently bond
to the metal that is on the stamp surface.18 When the stamp is removed, the metal is
transferred and remains on the dithiol assembly surface due to covalent bonding with the
free thiol groups. Junctions of n+GaAs—1,8-octanedithiol—Au were fabricated by nTP
in this fashion. Electrical studies indicate that the current densities of these junctions
scale with the Au contact area; this technique is deemed a reliable process for depositing
the top Au electrodes.19
The goal of our research was to fabricate and characterize molecular assembly-
based junctions with model electrically-active molecules. In this work, we focused on
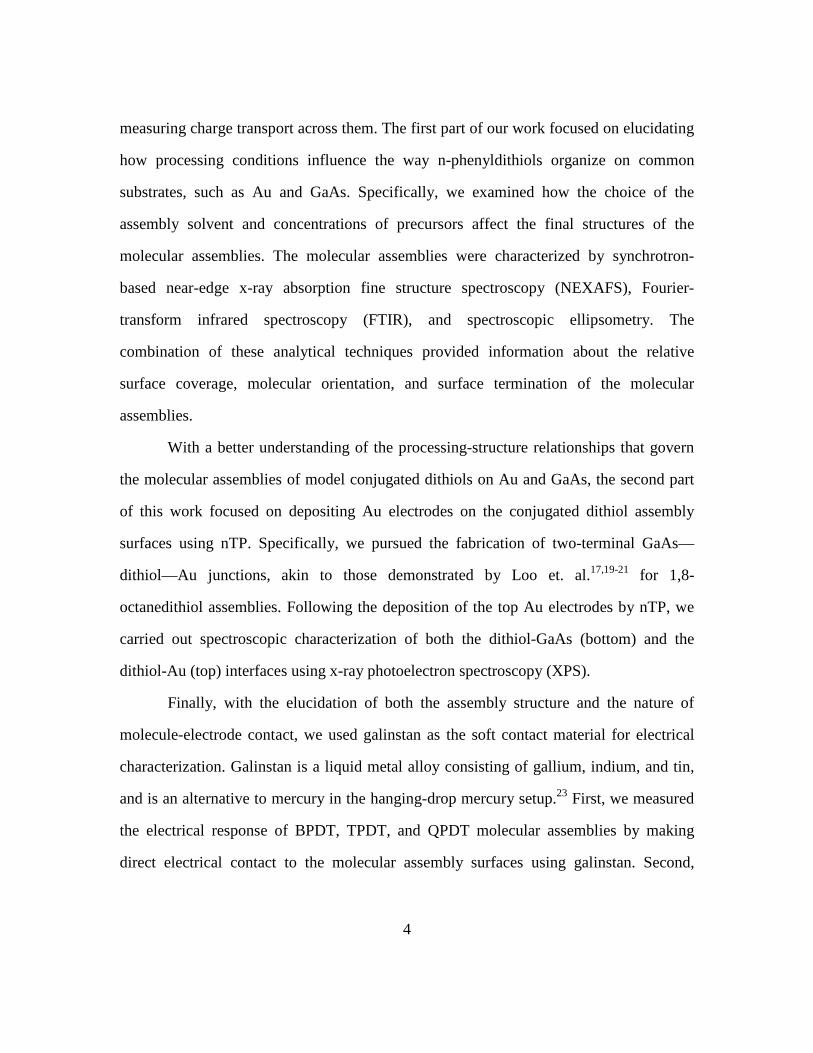
molecules containing simple aromaticity, or n-phenyldithiols (n = 2 – 4), illustrated in
Figure 1.4. In contrast to simple alkyl systems, biphenyldithiol (BPDT), terphenyldithiol
(TPDT), and quaterphenyldithiol (QPDT) are more similar to the electronically-complex
systems of interest to the molecular electronics community. They are potentially capable
of charge transport due to backbone conjugation. Additionally, these conjugated
molecules have thiol end groups so they can bind on both ends. Similar to 1,8-
octanedithiol employed for the development of nTP by Loo et. al.,17,19-21 n-phenyldithiols
can therefore be covalently constrained between two electrodes. Covalent molecule-
electrode attachment is expected to facilitate reliable electrical contact, a necessary
prerequisite to fabricating functional devices.14,22
In the course of our research, we addressed the major aspects of forming the
molecular assembly-based junctions from the bottom up, including aspects of molecule
adsorption on substrates, making electrical contact to these molecular assemblies, and
4
measuring charge transport across them. The first part of our work focused on elucidating
how processing conditions influence the way n-phenyldithiols organize on common
substrates, such as Au and GaAs. Specifically, we examined how the choice of the
assembly solvent and concentrations of precursors affect the final structures of the
molecular assemblies. The molecular assemblies were characterized by synchrotron-
based near-edge x-ray absorption fine structure spectroscopy (NEXAFS), Fourier-
transform infrared spectroscopy (FTIR), and spectroscopic ellipsometry. The
combination of these analytical techniques provided information about the relative
surface coverage, molecular orientation, and surface termination of the molecular
assemblies.
With a better understanding of the processing-structure relationships that govern
the molecular assemblies of model conjugated dithiols on Au and GaAs, the second part
of this work focused on depositing Au electrodes on the conjugated dithiol assembly
surfaces using nTP. Specifically, we pursued the fabrication of two-terminal GaAs—
dithiol—Au junctions, akin to those demonstrated by Loo et. al.17,19-21 for 1,8-
octanedithiol assemblies. Following the deposition of the top Au electrodes by nTP, we
carried out spectroscopic characterization of both the dithiol-GaAs (bottom) and the
dithiol-Au (top) interfaces using x-ray photoelectron spectroscopy (XPS).
Finally, with the elucidation of both the assembly structure and the nature of
molecule-electrode contact, we used galinstan as the soft contact material for electrical
characterization. Galinstan is a liquid metal alloy consisting of gallium, indium, and tin,
and is an alternative to mercury in the hanging-drop mercury setup.23 First, we measured
the electrical response of BPDT, TPDT, and QPDT molecular assemblies by making
direct electrical contact to the molecular assembly surfaces using galinstan. Second,
5
GaAs—dithiol—Au junctions prepared via nTP were examined using the same galinstan
setup.
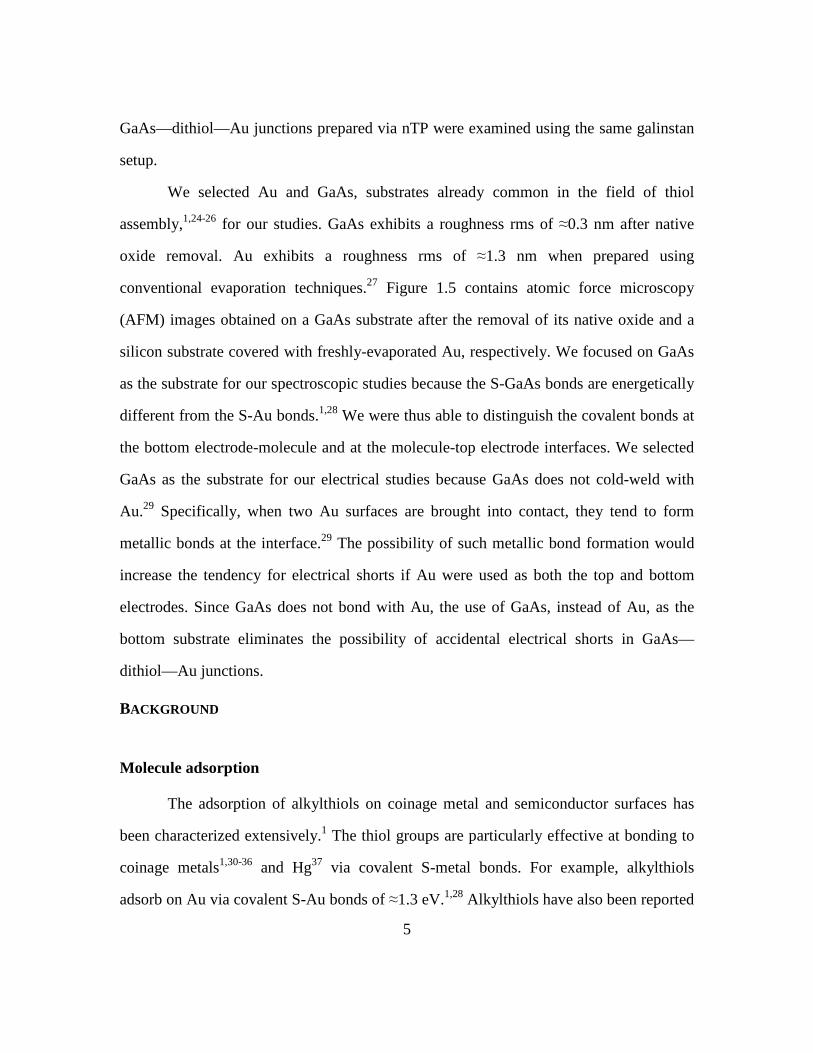
We selected Au and GaAs, substrates already common in the field of thiol
assembly,1,24-26 for our studies. GaAs exhibits a roughness rms of ≈0.3 nm after native
oxide removal. Au exhibits a roughness rms of ≈1.3 nm when prepared using
conventional evaporation techniques.27 Figure 1.5 contains atomic force microscopy
(AFM) images obtained on a GaAs substrate after the removal of its native oxide and a
silicon substrate covered with freshly-evaporated Au, respectively. We focused on GaAs
as the substrate for our spectroscopic studies because the S-GaAs bonds are energetically
different from the S-Au bonds.1,28 We were thus able to distinguish the covalent bonds at
the bottom electrode-molecule and at the molecule-top electrode interfaces. We selected
GaAs as the substrate for our electrical studies because GaAs does not cold-weld with
Au.29 Specifically, when two Au surfaces are brought into contact, they tend to form
metallic bonds at the interface.29 The possibility of such metallic bond formation would
increase the tendency for electrical shorts if Au were used as both the top and bottom
electrodes. Since GaAs does not bond with Au, the use of GaAs, instead of Au, as the
bottom substrate eliminates the possibility of accidental electrical shorts in GaAs—
dithiol—Au junctions.
BACKGROUND
Molecule adsorption
The adsorption of alkylthiols on coinage metal and semiconductor surfaces has
been characterized extensively.1 The thiol groups are particularly effective at bonding to
coinage metals1,30-36 and Hg37 via covalent S-metal bonds. For example, alkylthiols
adsorb on Au via covalent S-Au bonds of ≈1.3 eV.1,28 Alkylthiols have also been reported

6
to adsorb on GaAs,1,3,7,32 although via a weaker semi-ionic interaction of ≈0.81 eV.28
Molecular assemblies consisting of alkylthiols with longer backbones generally exhibit
preferentially upright molecular orientation due to increased intermolecular
interactions.30-32 The details of molecular orientation can be further affected by a variety
of processing conditions, including the types of substrate,38 the solvent quality,39 the
molecule concentration in solution,25,39,40 the temperature at which assembly takes
place,41 and post-assembly cleaning protocols.42
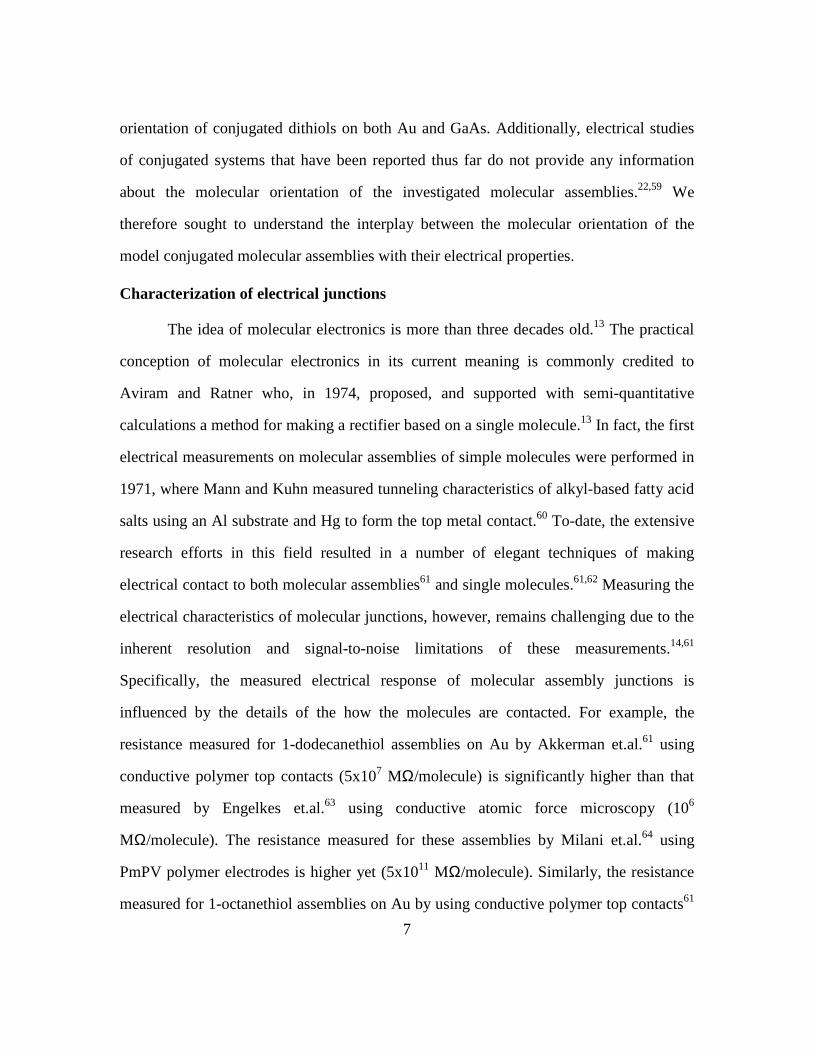
In contrast to alkylthiols, the assembly of conjugated molecules is far more
complicated. Recent structural studies have demonstrate the assembly of simple n-
phenyl,27,43,44 oligo(phenylene ethynylene),45 and a number of yet-more-complex
porphyrin-46 and rotaxane-based47 conjugated systems. Like alkylthiols, conjugated thiols
with longer conjugated backbones tend to adsorb in a preferentially upright fashion due
to increased intermolecular interactions.48-51 The procedures employed for forming
conjugated thiol assemblies tend to be more involved than those used for alkylthiol
assemblies. For example, conjugated dithiols are usually assembled from their acetyl-
protected precursors because aromatic thiols are prone to oxidation52 and dimerization.53
The structures of the acetyl-protected precursors of the molecules used in our study are
shown in Figure 1.6. The acetyl-protecting groups are normally cleaved in-situ using a
deprotecting agent (commonly, NH4OH54) to facilitate molecular assembly. To this end,
the details of the deprotection procedure have also been reported to affect the final
assembly structure.44,45,55 The studies addressing the assembly of conjugated dithiols are
limited and have focused exclusively on metal substrates.27,56-58 Additionally, the details
of molecular orientation and the factors that govern the organization of conjugated
dithiols on either Au or GaAs have not been systematically investigated. We were
therefore interested in understanding the factors that govern the adsorption and molecular
7
orientation of conjugated dithiols on both Au and GaAs. Additionally, electrical studies
of conjugated systems that have been reported thus far do not provide any information
about the molecular orientation of the investigated molecular assemblies.22,59 We
therefore sought to understand the interplay between the molecular orientation of the
model conjugated molecular assemblies with their electrical properties.
Characterization of electrical junctions
The idea of molecular electronics is more than three decades old.13 The practical
conception of molecular electronics in its current meaning is commonly credited to
Aviram and Ratner who, in 1974, proposed, and supported with semi-quantitative
calculations a method for making a rectifier based on a single molecule.13 In fact, the first
electrical measurements on molecular assemblies of simple molecules were performed in
1971, where Mann and Kuhn measured tunneling characteristics of alkyl-based fatty acid
salts using an Al substrate and Hg to form the top metal contact.60 To-date, the extensive
research efforts in this field resulted in a number of elegant techniques of making
electrical contact to both molecular assemblies61 and single molecules.61,62 Measuring the
electrical characteristics of molecular junctions, however, remains challenging due to the
inherent resolution and signal-to-noise limitations of these measurements.14,61
Specifically, the measured electrical response of molecular assembly junctions is
influenced by the details of the how the molecules are contacted. For example, the
resistance measured for 1-dodecanethiol assemblies on Au by Akkerman et.al.61 using
conductive polymer top contacts (5x10⁷ MΩ/molecule) is significantly higher than that
measured by Engelkes et.al.63 using conductive atomic force microscopy (106
MΩ/molecule). The resistance measured for these assemblies by Milani et.al.64 using
PmPV polymer electrodes is higher yet (5x10¹¹ MΩ/molecule). Similarly, the resistance
measured for 1-octanethiol assemblies on Au by using conductive polymer top contacts61
8
(2x10⁶ MΩ/molecule) is significantly higher than that measured using evaporated Au
contacts61,65 (2x10⁴ MΩ/molecule). The resistance measured for these assemblies using
conductive atomic force microscopy62 is higher yet (1011 MΩ/molecule). These variations
in the measured electrical response are believed to stem from differences in the details of
molecular organization on the surface,66 as well as the quality of the molecule-electrode
contact.14 For instance, the current densities of both alkylthiols and conjugated thiols
have been reported to increase as the molecular assemblies adopt a less upright molecular
orientation.16,66 This phenomenon has been attributed to the fact that less ordered
molecular assemblies result in shorter tunneling distances.16,66 We were therefore
interested in examining how the molecular orientation of our model conjugated molecular
assemblies affected the measured current densities.
In addition to the details of molecular orientation, electrical conduction through
molecules is believed to be affected by the molecule-electrode contact.14 For example,
Cui et. al.62 reported that the Au—1,8-octanedithiol—Au junctions were at least four
orders of magnitude more conductive than the Au—1-octanethiol—Au junctions. The
higher conductance of the dithiol junctions, relative to that of the monothiol junctions,
was attributed to covalent S-Au interactions at both of the S-Au interfaces for dithiol and
at only one S-Au interface for monothiol assemblies.62 In the case of substrate—
molecule—metal junctions, there are few methods to evaluate the molecule-metal
interface.67-71 The fact that this interface is buried under the top metal electrode presents
clear challenges for direct spectroscopic analysis, so the nature of the molecule-metal
contact is often evaluated indirectly.59,72 In the case of GaAs—dithiol—Au junctions, the
‘Scotch tape test’19 has been a dominant, albeit indirect, method used to speculate the
nature of the top dithiol-Au interface. In this test, Scotch tape is attached to the deposited
top Au electrode and then pulled off. One surmises the presence of covalent S-Au bonds
9
at the dithiol-Au interface if the Au electrode remains on the assembly surface after the
Scotch tape is pulled off. The potential of the nature of the top dithiol-Au interface to
affect electrical conduction through our GaAs—n-phenyldithiol—Au junctions coupled
with the lack of direct methods of examination of this interface prompted our effort in
developing a direct spectroscopic method to address these issues.
THESIS OVERVIEW
Chapter 2 describes the synthesis of the acetyl-protected precursors of BPDT,
TPDT, and QPDT used for forming the molecular assemblies in our work. This Chapter
also describes the experimental techniques employed in our studies and introduces the
associated data analysis protocols. The off-normal s-polarized transmission IR approach
we developed and the grazing-angle x-ray photoelectron spectroscopy method we
employed for probing the structures of our molecular assemblies on GaAs and their
interfaces with Au deposited via nTP, respectively, are also detailed in this Chapter.
Finally, the approach of using galinstan as the soft electrode material for electrical
measurements is described.
Chapters 3 and 4 elucidate the impacts of processing conditions on the final
structure of the molecular assemblies of conjugated dithiols. Specifically, Chapter 3
details the effect of solvent quality on the final structures of BPDT, TPDT, and QPDT
assembled on Au and GaAs surfaces. Chapter 4 examines the effects of the deprotecting
agent (NH4OH) and acetyl-protected precursor concentrations on the final structure of
molecular assemblies of the conjugated dithiols. The combined understanding of
processing-structure relationships developed in Chapters 3 and 4 gave us the ability to
10
assemble BPDT, TPDT, and QPDT with control and formed the basis of the junction
work reported in Chapters 5 and 6.
Chapter 5 examines the nature of S-GaAs and S-Au interactions at the dithiol-
GaAs and dithiol-Au interfaces in GaAs—dithiol—Au junctions. Specifically, we
deposited very thin Au by nTP to simulate the Au electrodes (generally much thicker in
the GaAs—dithiol—Au junctions). We then employed XPS to demonstrate that
depositing Au by nTP in solvent (dichloroethane) results in more reliable S-Au bond
formation than doing so at ambient conditions. The thickness of the Au was chosen such
that we could obtain XPS signal through the printed layer.
Chapter 6 details our attempts to make reproducible electrical contact to the
molecular assemblies. We extended the hanging-drop mercury approach (Figure 1.2) by
using galinstan as the soft electrode. This allowed us to directly measure electrical
conduction of and charge transport through GaAs—dithiol—Au junctions fabricated by
nTP.
Finally, Chapter 7 summarizes the major achievements of our research effort and
presents suggestions for future work.
11
FIGURES
Figure 1.1. Schematic representation of a molecular assembly formed on a substrate. The head group, the backbone, and the end group of the constituent molecule are identified.
12
Figure 1.2. Schematic representation of the hanging-drop mercury electrode setup.
13
Figure 1.3. Schematic of Au transfer onto an 1,8-octanedithiol molecular assembly by nano-transfer printing.

14
BPDT TPDT QPDT
SH
SH
SH
SH
SH
SH
BPDT TPDT QPDT
SH
SH
SH
SH
SH
SH
SH
SH
SH
SH
SH
SH
Figure 1.4. Chemical structures of biphenyldithiol (BPDT), terphenyldithiol (TPDT), and quaterphenyldithiol (QPDT) used in this work.

15
Figure 1.5. Atomic force microscopy topographical images of (a) etched GaAs substrate (rms roughness of ≈ 0.3 nm) and (b) a Si substrate with 100 nm thick Au (rms roughness of ≈ 1.3 nm).
16
Figure 1.6. Chemical structures of the acetyl-protected precursors of (a) BPDT, (b) TPDT, and (c) QPDT. These acetyl-protected precursors were used to form molecular assemblies of BPDT, TPDT, and QPDT in this work.

17
REFERENCES
1. Ulman, A. Chemical Reviews 1996, 96, 1533.
2. Lim, H.; Carraro, C.; Maboudian, R.; Pruessner, M. W.; Ghodssi, R. Langmuir 2004, 20, 743.
3. Baum, T.; Ye, S.; Uosaki, K. Langmuir 1999, 15, 8577.
4. Cox, J. D.; Curry, M. S.; Skirboll, S. K.; Gourley, P. L.; Sasaki, D. Y. Biomaterials 2001, 23, 929.
5. Ostuni, E.; Chapman, R. G.; Liang, M. N.; Meluleni, G.; Pier, G.; Ingber, D. E.; Whitesides, G. M. Langmuir 2001, 17, 6336.
6. Sung, I.-H.; Kim, D.-E. Applied Surface Science 2005, 239, 209.
7. Tiberio, R. C.; Craighead, H. G.; Lercel, M.; Lau, T.; Sheen, C. W.; Allara, D. L. Applied Physics Letters 1993, 62, 476.
8. Ahn, H.-S.; Cuong, P. D.; Park, S.; Kim, Y.-W.; Lim, J.-C. Wear 2003, 255, 819.
9. Perry, S. S.; Lee, S.; Shon, Y.-S.; Colorado, R., Jr.; Lee, T. R. Tribology Letters 2001, 10, 81.
10. Maboudian, R.; Carraro, C. Annual Review of Physical Chemistry 2004, 55, 35.
11. Maboudian, R.; Carraro, C. Journal of Adhesion Science and Technology 2003, 17, 583.
12. Hang, Q.; Wang, F.; Carpenter, P. D.; Zemlyanov, D.; Zakharov, D.; Stach, E. A.; Buhro, W. E.; Janes, D. B. Nano Letters 2008, 8, 49.
13. Aviram, A.; Ratner, M. A. Chemical Physics Letters 1974, 29, 277.
14. Hipps, K. W. Science 2001, 294, 536.
15. Nesher, G.; Shpaisman, H.; Cahen, D. Journal of the American Chemical Society 2007, 129, 734.
16. Nesher, G.; Vilan, A.; Cohen, H.; Cahen, D.; Amy, F.; Chan, C.; Hwang, J.; Kahn, A. Journal of Physical Chemistry B 2006, 110, 14363.
17. Loo, Y.-L.; Willett, R. L.; Baldwin, K. W.; Rogers, J. A. Applied Physics Letters 2002, 81, 562.

18
18. Hsu, J. W. P.; Loo, Y. L.; Lang, D. V.; Rogers, J. A. Journal of Vacuum Science & Technology B 2003, 21, 1928.
19. Loo, Y.-L.; Lang, D. V.; Rogers, J. A.; Hsu, J. W. P. Nano Letters 2003, 3, 913.
20. Loo, Y.-L.; Hsu, J. W. P.; Willett, R. L.; Baldwin, K. W.; West, K. W.; Rogers, J. A. Journal of Vacuum Science & Technology B 2002, 20, 2853.
21. Loo, Y.-L.; Willett, R. L.; Baldwin, K. W.; Rogers, J. A. Journal of the American Chemical Society 2002, 124, 7654.
22. Kushmerick, J. G. Materials Today 2005, 8, 26.
23. Smith Linda, S. Journal of Gerontological Nursing 2003, 29, 26.
24. Krapchetov, D. A.; Ma, H.; Jen, A. K. Y.; Fischer, D. A.; Loo, Y.-L. Langmuir 2005, 21, 5887.
25. Jun, Y.; Zhu, X. Y.; Hsu, J. W. P. Langmuir 2006, 22, 3627.
26. Nicoara, N.; Cerrillo, I.; Xueming, D.; Garcia, J. M.; Garcia, B.; Gomez-Navarro, C.; Mendez, J.; Baro, A. M. Nanotechnology 2002, 13, 352.
27. de Boer, B.; Meng, H.; Perepichka, D. F.; Zheng, J.; Frank, M. M.; Chabal, Y. J.; Bao, Z. Langmuir 2003, 19, 4272.
28. Camillone, N.; Khan, K. A.; Osgood, R. M. Surface Science 2000, 453, 83.
29. Kim, C.; Burrows, P. E.; Forrest, S. R. Science 2000, 288, 831.
30. Dubois, L. H.; Nuzzo, R. G. Annual Review of Physical Chemistry 1992, 43, 437.
31. Dubois, L. H.; Zegarski, B. R.; Nuzzo, R. G. Journal of Chemical Physics 1993, 98, 678.
32. Ye, S.; Li, G.; Noda, H.; Uosaki, K.; Osawa, M. Surface Science 2003, 529, 163.
33. Karpovich, D. S.; Blanchard, G. J. Langmuir 1994, 10, 3315.
34. Fischer, D.; Marti, A.; Hahner, G. Journal of Vacuum Science & Technology A 1997, 15, 2173.
35. Laibinis, P. E.; Whitesides, G. M.; Allara, D. L.; Tao, Y. T.; Parikh, A. N.; Nuzzo, R. G. Journal of the American Chemical Society 1991, 113, 7152.
36. Kondoh, H.; Nambu, A.; Ehara, Y.; Matsui, F.; Yokoyama, T.; Ohta, T. Journal of Physical Chemistry B 2004, 108, 12946.

19
37. Tamam, L.; Kraack, H.; Sloutskin, E.; Ocko, B. M.; Pershan, P. S.; Ulman, A.; Deutsch, M. Journal of Physical Chemistry B 2005, 109, 12534.
38. McGuiness, C. L.; Shaporenko, A.; Mars, C. K.; Uppili, S.; Zharnikov, M.; Allara, D. L. Journal of the American Chemical Society 2006, 128, 5231.
39. Dannenberger, O.; Buck, M.; Grunze, M. Journal of Physical Chemistry B 1999, 103, 2202.
40. Bain, C. D.; Troughton, E. B.; Tao, Y. T.; Evall, J.; Whitesides, G. M.; Nuzzo, R. G. Journal of the American Chemical Society 1989, 111, 321.
41. Asadi, K.; Gholamrezaie, F.; Smits, E. C. P.; Blom, P. W. M.; de Boer, B. Journal of Materials Chemistry 2007, 17, 1947.
42. Castner, D. G.; Hinds, K.; Grainger, D. W. Langmuir 1996, 12, 5083.
43. Shaporenko, A.; Adlkofer, K.; Johansson, L. S. O.; Ulman, A.; Grunze, M.; Tanaka, M.; Zharnikov, M. Journal of Physical Chemistry B 2004, 108, 17964.
44. Shaporenko, A.; Elbing, M.; Blaszczyk, A.; Von Haenisch, C.; Mayor, M.; Zharnikov, M. Journal of Physical Chemistry B 2006, 110, 4307.
45. Cai, L.; Yao, Y.; Yang, J.; Price, D. W., Jr.; Tour, J. M. Chemistry of Materials 2002, 14, 2905.
46. Hutchison, J. E.; Postlethwaite, T. A.; Murray, R. W. Langmuir 1993, 9, 3277.
47. Collier, C. P.; Wong, E. W.; Belohradsky, M.; Raymo, F. M.; Stoddart, J. F.; Kuekes, P. J.; Williams, R. S.; Heath, J. R. Science 1999, 285, 391.
48. Kang, J. F.; Ulman, A.; Liao, S.; Jordan, R.; Yang, G.; Liu, G.-Y. Langmuir 2001, 17, 95.
49. Zharnikov, M.; Grunze, M. Journal of Physics: Condensed Matter 2001, 13, 11333.
50. Frey, S.; Stadler, V.; Heister, K.; Eck, W.; Zharnikov, M.; Grunze, M.; Zeysing, B.; Terfort, A. Langmuir 2001, 17, 2408.
51. Himmel, H.-J.; Terfort, A.; Woell, C. Journal of the American Chemical Society 1998, 120, 12069.
52. Tour, J. M.; Jones, L.; Pearson, D. L.; Lamba, J. J. S.; Burgin, T. P.; Whitesides, G. M.; Allara, D. L.; Parikh, A. N.; Atre, S. Journal of the American Chemical Society 1995, 117, 9529.
20
53. Weckenmann, U.; Mittler, S.; Naumann, K.; Fischer, R. A. Langmuir 2002, 18, 5479.
54. Tour, J. M.; II, L. J.; Pearson, D. L.; Lamba, J. J. S.; Burgin, T. P.; Whitesides, G. M.; Allara, D. L.; Parikh, A. N.; Atre, S. V. Journal of American Chemical Society 1995, 117, 9529.
55. Krapchetov, D. A.; Ma, H.; Jen, A. K. Y.; Fischer, D. A.; Loo, Y.-L. Langmuir 2008, 24, 851.
56. Azzam, W.; Wehner, B. I.; Fischer, R. A.; Terfort, A.; Woell, C. Langmuir 2002, 18, 7766.
57. Jiang, W.; Zhitenev, N.; Bao, Z.; Meng, H.; Abusch-Magder, D.; Tennant, D.; Garfunkel, E. Langmuir 2005, 21, 8751.
58. de Boer, B.; Frank, M. M.; Chabal, Y. J.; Jiang, W.; Garfunkel, E.; Bao, Z. Langmuir 2004, 20, 1539.
59. Kushmerick, J. G.; Holt, D. B.; Yang, J. C.; Naciri, J.; Moore, M. H.; Shashidhar, R. Physical Review Letters 2002, 89, 086802/1.
60. Mann, B.; Kuhn, H. Journal of Applied Physics 1971, 42, 4398.
61. Akkerman Hylke, B.; Naber Ronald, C. G.; Jongbloed, B.; van Hal Paul, A.; Blom Paul, W. M.; de Leeuw Dago, M.; de Boer, B. Proceedings of the National Academy of Sciences of the United States of America 2007, 104, 11161.
62. Cui, X. D.; Primak, A.; Zarate, X.; Tomfohr, J.; Sankey, O. F.; Moore, A. L.; Moore, T. A.; Gust, D.; Harris, G.; Lindsay, S. M. Science 2001, 294, 571.
63. Engelkes, V. B.; Beebe, J. M.; Frisbie, C. D. Journal of the American Chemical Society 2004, 126, 14287.
64. Milani, F.; Grave, C.; Ferri, V.; Samori, P.; Rampi, M. A. ChemPhysChem 2007, 8, 515.
65. Kim, T.-W.; Wang, G.; Lee, H.; Lee, T. Nanotechnology 2007, 18, 315204/1.
66. Ishida, T.; Mizutani, W.; Liang, T.-T.; Azehara, H.; Miyake, K.; Sasaki, S.; Tokumoto, H. Annals of the New York Academy of Sciences 2003, 1006, 164.
67. Lummerstorfer, T.; Sohar, C.; Friedbacher, G.; Hoffmann, H. Langmuir 2006, 22, 18.
21
68. Richter, C. A.; Hacker, C. A.; Richter, L. J. Journal of Physical Chemistry B 2005, 109, 21836.
69. Haick, H.; Ghabboun, J.; Niitsoo, O.; Cohen, H.; Cahen, D.; Vilan, A.; Hwang, J.; Wan, A.; Amy, F.; Kahn, A. Journal of Physical Chemistry B 2005, 109, 9622.
70. Walker, A. V.; Tighe, T. B.; Cabarcos, O. M.; Reinard, M. D.; Haynie, B. C.; Uppili, S.; Winograd, N.; Allara, D. L. Journal of the American Chemical Society 2004, 126, 3954.
71. Qu, D.; Uosaki, K. Journal of Physical Chemistry B 2006, 110, 17570.
72. Salomon, A.; Boecking, T.; Gooding, J. J.; Cahen, D. Nano Letters 2006, 6, 2873.
22
Chapter 2: Experimental Techniques
This Chapter provides an overview of the synthetic, experimental, and analytical
details of our work. This Chapter begins with a description of the synthesis of the acetyl-
protected precursors of biphenyldithiol (BPDT), terphenyldithiol (TPDT), and
quaterphenyldithiol (QPDT). The formation of molecular assemblies with these
precursors is then detailed. Following is the description of nanotransfer printing (nTP),1-4
a technique that is used for transferring Au onto the surfaces of the molecular assemblies.
Finally, the various analytical techniques employed to characterize the molecular
assemblies are described. Associated data analysis approaches are also described.
SYNTHESIS OF DITHIOLS
The molecules used during this study were provided through a collaboration with
Dr. Hong Ma and Prof. Alex K.Y. Jen in the Materials Science and Engineering
Department, at the University of Washington in Seattle. Chemicals were purchased from
Aldrich and used as-received unless otherwise stated. Tetrahydrofuran (THF) that was
used during the synthesis of the model conjugated compounds was distilled under
nitrogen from sodium using benzophenone as an indicator. Methylene chloride was
distilled over P2O5. 1H NMR spectra (200 MHz) were acquired on a Bruker-200 FT NMR
spectrometer. ESI-MS spectra were collected on a Bruker Daltonics Esquire Ion Trap
Mass Spectrometer.
Compound 1. The acetyl-protected precursor of BPDT. This molecule
(Compound 1, Scheme 2.1) was synthesized using the following sequence. To a solution
of 4,4’-dibromobiphenyl (3.12 g, 10.0 mmol) in dry THF (100 mL), tert-butyllithium
23
(25.9 mL, 1.7 M in pentane) was added dropwise at -78 oC under a nitrogen atmosphere.
The solution was stirred at -78 oC for 2 h, followed by the addition of sulfur powder (0.90
g, 28.0 mmol). The reaction mixture was then stirred at –78 oC for 1 h, warmed to 0 oC,
and stirred again for an additional 1.5 h. The reaction mixture was then cooled to –78 oC,
followed by a dropwise addition of acetyl chloride (2.0 mL, 2.20 g, 28.0 mmol). The
resulting reaction mixture was slowly warmed to room temperature and stirred overnight.
The reaction was quenched with water, and THF was evaporated in vacuo. The residue
was extracted with methylene chloride. The combined methylene chloride layers were
washed with water, dried with Na2SO4, and concentrated. The crude product was then
purified over a silica gel column with hexane/methylene chloride (1:1 to 1:2) as the
eluent, yielding a white solid (0.44 g, 15%). 1H NMR (200 MHz, CDCl3): δ 7.63 (4H, d,
J = 8.1 Hz), 7.49 (4H, d, J = 8.1 Hz), 2.45 (6H). ESI-MS (m/z): Calcd. 302.0; Found
302.1.
Compound 2. The methylated intermediate (Compound 2, Scheme 2.1) that is
subsequently used for TPDT (Compound 3) synthesis was prepared using the following
steps. A Grignard solution was prepared by the dropwise addition of a solution of 1-
bromo-4-methylthiobenzene (10.56 g, 52.0 mmol) in dry THF (20 mL) to magnesium
(1.33 g, 54.6 mmol) in dry THF (40 mL) under nitrogen. The combined solution was
refluxed for 3.5 h at 65°C. The resulting Grignard solution was then cooled to room
temperature and transferred to a suspension of 1,4-dibromobenzene (4.72 g, 20.0 mmol)
and Ni(dppp)Cl2 (0.11 g, 0.2 mmol) in dry THF (100 mL) at 0 oC under nitrogen. The
mixture was further stirred for 24 h under reflux, cooled, and poured into 1 N HCl
solution (200 mL). The precipitate was filtered, washed with water, hexane, and
methylene chloride, and dried overnight at 40 oC under vacuum to yield a light-yellow
24
solid (5.90 g, 92%). 1H NMR (200 MHz, CDCl3): δ 7.65 (s, 4H), 7.55 (d, J = 8.0 Hz,
4H), 7.32 (d, J = 8.0 Hz, 4H), 2.55 (s, 6H). ESI-MS (m/z): Calcd. 322.1; Found 322.0.
Compound 3. TPDT. To a solution of 2 (Scheme 2.1) (1.00 g, 3.1 mmol) in
anhydrous dimethylformamide (DMF, 25 mL), sodium tert-butylthiolate (1.04 g, 9.3
mmol) was added. The reaction mixture was stirred vigorously and refluxed for 6 h under
nitrogen at 153°C.5,6 The solution was cooled to room temperature and was poured into a
10% HCl solution (65 mL). The resulting precipitate was filtered off, washed with water
and cold ethanol, and dried overnight at 40 oC under vacuum to yield a pale white solid
(0.86 g, 95%). 1H NMR (200 MHz, CDCl3): δ 7.62 (s, 4H), 7.51 (d, J = 8.2 Hz, 4H), 7.36
(d, J = 8.2 Hz, 4H), 3.51 (s, 2H). ESI-MS (m/z): Calcd. 294.1; Found 294.0.
Compound 4. Acetyl-protected precursor of TPDT. Due to the reported
tendency for dithiols to oxidize,7 the thiol end groups were converted to thiolacetyl end
groups per details below. The thioacetyl end groups were then converted back to thiolates
during molecular assembly formation (see details in Molecular Assembly Formation
below). To convert the thiols into thioacetyl groups, triethylamine (0.30 g, 3.0 mmol)
followed by acetyl chloride (0.24 g, 3.0 mmol)8,9 were added dropwise to a solution of
Compound 3 (TPDT, Scheme 2.1) (0.40 g, 1.4 mmol) in dry methylene chloride (20 mL)
under nitrogen. The mixture was then stirred for 24 h at room temperature, poured into
water, and extracted with methylene chloride. The combined methylene chloride layers
were washed with water, dried with Na2SO4, and concentrated. The crude product was
purified over silica gel column chromatography with hexane/methylene chloride (1:1) to
methylene chloride as the eluent, yielding a light-yellow solid (0.39 g, 75%). 1H NMR
(200 MHz, CDCl3): δ 7.65-7.75 (m, 8H), 7.50 (d, J = 7.8 Hz, 4H), 2.46 (s, 6H). ESI-MS
(m/z): Calcd. 378.1; Found 378.1.
25
Compound 5. Acetyl-protected precursor of QPDT. The acetyl-terminated
QPDT precursor (Compound 5, Scheme 2.1) was synthesized with 4,4’-dibromobiphenyl
as the starting material and using the same three-step procedure that was used to
synthesize Compound 4 (Scheme 2.1). A slightly yellow solid was obtained. 1H NMR
(200 MHz, CDCl3): δ 7.65-7.75 (m, 12H), 7.51 (d, J = 8.0 Hz, 4H), 2.47 (s, 6H). ESI-MS
(m/z): Calcd. 454.1; Found 454.0.
MOLECULAR ASSEMBLY FORMATION
SureSealTM-grade solvents from Aldrich were used as-received to assemble the
molecules on Au and GaAs. Polycrystalline Au substrates were prepared by evaporating
5 nm of Ti followed by 25 nm of Au on polished silicon test wafers (Wacker) in an
evaporation chamber with a base pressure of ≈1×10⁻⁷ Torr. These substrates were
immediately transferred into a glove box (MBraun, <0.1 ppm O2, <0.1 ppm H2O) for
immersion in the assembly solutions. Single-side-polished n+ Si-doped (0.8-1x1018 cm-3)
GaAs (100) from AXT was used for near-edge x-ray absorption fine structure (NEXAFS)
spectroscopy, x-ray photoelectron spectroscopy (XPS), and current-voltage (I-V)
characterization; double-side-polished undoped (100) GaAs from AXT was used for
transmission Fourier transform infrared (FTIR) spectroscopy.
The general steps of molecular assembly formation on Au and/or GaAs substrates
are illustrated in Figure 2.1. The assembly sequence consists of dissolving the acetyl-
terminated precursors in a solvent (EtOH, THF, or a combination of the two) at
prescribed concentrations, followed by the addition of NH4OH to convert the thioacetyl
end groups to thiolates. As illustrated in Scheme 2.2, the addition of NH4OH results in
the deprotection of the acetyl-protected precursors by cleaving the acetyl protecting
26
groups. The substrates are then immersed for approximately 18-24 hours before they are
retrieved, sonication and/or rinsed with EtOH and dried with a stream of nitrogen. During
this process, the solvent quality, concentrations of NH4OH and acetyl-protected
precursors, temperature at which the assembly takes place, and post-assembly cleaning
procedures can significantly affect the final structure of the resulting molecular
assemblies. In the subsequent chapters, we outline how careful control of these variables
allowed us to achieve high surface coverage molecular assemblies that are preferentially
upright.
For studies aimed at examining the impact of solvent quality on the final structure
of the model conjugated dithiol assemblies (Chapter 3), the native oxide layer on GaAs
was removed by etching the substrates in concentrated hydrochloric acid (HCl) for 1
minute, followed by rinsing with deionized water and drying with a stream of nitrogen.10
For all other studies, the native oxide layer on GaAs was removed by etching the
substrates in concentrated HCl for 30 seconds and then in concentrated NH4OH for 30
seconds;11,12 this procedure was repeated once again before the substrates were rinsed
with EtOH and dried with a stream of nitrogen following the first three etches. After the
fourth and last etch in NH4OH, the substrates were rinsed with deionized water and dried
with a stream of nitrogen. The more tedious HCl/NH4OH etching procedure was adopted
later in this project because it was reported to yield cleaner GaAs surfaces compared to
the former etching procedure with HCl alone.12 The etched substrates were immediately
transferred into the glove box for immersion in the assembly solutions.
In studying how the solvent quality impacts the final structure of the molecular
assemblies (Chapter 3), we prepared the assembly solutions by dissolving acetyl-
protected precursors of BPDT, TPDT or QPDT precursors at 80 µM in either EtOH,
THF, or in cosolvents of EtOH and THF. Throughout this Dissertation, we describe the
27
assembly solvent in terms of EtOH fraction in the solvent, or EF. EF = 1 indicates that
neat EtOH was used to assemble the molecules, while EF = 0 indicates that neat THF was
used. Accordingly, EF = 0.5 indicates a 50/50 (v/v) EtOH/THF cosolvent mixture.
NH4OH at 25 µL per 5 mL of assembly solution was then added to facilitate the
conversion of thioacetyl end groups to thiolates (S-NH4+).7 After the addition of NH4OH,
the solutions were agitated for 1 minute and left for an hour before freshly-evaporated Au
or freshly-etched GaAs substrates were immersed. The substrates remained immersed for
24 hours before they were removed and copiously rinsed with EtOH and dried in a stream
of nitrogen. The post-assembly protocol of rinsing with EtOH and drying with a stream
of nitrogen is used for all studies unless otherwise noted. Due to the low solubility of
acetyl-protected precursor of QPDT in EtOH, we were not able to assemble QPDT from
pure EtOH. We therefore assembled QPDT from solutions ranging from pure THF to a
cosolvent with EF = 0.9. The complete range of EtOH/THF solution compositions was
explored for TPDT. BPDT was only assembled from solutions with neat EtOH and THF.
In studies examining the concentration effects of NH4OH and acetyl-protected
precursor on the final structure of the molecular assemblies (Chapter 4), TPDT solutions
were prepared by dissolving the acetyl-protected TPDT precursor (at 250 µM for NH4OH
concentration studies; at a range of 50 – 500 µM for precursor concentration studies) in
either EtOH or THF. QPDT solutions were prepared by dissolving the acetyl-protected
precursor of QPDT (at 50 µM for NH4OH concentration studies; at a range of 50 – 250
µM for precursor concentration studies) in a cosolvent with EF = 0.75. NH4OH at 1, 10,
30, or 160 mM was then added to the solutions (no NH4OH was added for select samples,
as noted in Chapter 4). After the addition of NH4OH, the solutions were left for an hour
before freshly-evaporated Au or freshly-etched GaAs substrates were immersed for 18 -
24 hours. TPDT assemblies were carried out at 55°C; QPDT assemblies were carried out
28
at room temperature for NH4OH concentration studies and at 55°C for experiments to
examine the effect of varying precursor concentration on the structure of the final
assembly. The increased temperature was selected to aid the dissolution of the acetyl-
protected precursors in EtOH at the elevated concentrations. The Au and GaAs samples,
upon removal from the assembly solution, were rinsed thoroughly with EtOH, sonicated
in a 2 mM solution of tri-n-butylphosphine (TBP) in EtOH for 15 minutes, and left
immersing in the same TBP solution for 40 minutes to remove any disulfides that may
have formed during the assembly.13 After TBP treatment, the samples were thoroughly
rinsed with EtOH and dried in a stream of nitrogen.
For experiments examining how QPDT assembly surfaces interact with printed
Au (Chapter 5) and for the electrical studies of QPDT molecular assemblies (Chapter 6),
QPDT solutions were prepared by dissolving the acetyl-protected QPDT precursor in a
cosolvent with EF = 0.75 at 50 µM. For the same electrical studies, BPDT and TPDT
solutions were prepared by dissolving the corresponding acetyl-protected precursor at
250 µM in EtOH. NH4OH, was added at 1 mM (BPDT and TPDT) and 10 mM (QPDT)
before freshly-etched GaAs substrates were submerged for assembly 1 hour later. No
NH4OH was added for select samples, as noted in Chapter 6. The assembly of BPDT and
TPDT was carried out at 55°C; QPDT assembly was carried out at room temperature.
1,8-octanedithiol (99%; Acros Organics) was dissolved in EtOH as-received at 5
mM, immediately followed by substrate immersion. The assembly on Au and GaAs was
carried out for 18-24 hours at ambient conditions. The samples were copiously rinsed
with EtOH and dried in a stream of nitrogen. 1-hexadecanethiol (92%; Aldrich)
molecular assemblies on GaAs were formed in the same fashion.
29
NANO-TRANSFER PRINTING (NTP)
We employed nano-transfer printing (nTP), originally developed by Loo and co-
workers4 to transfer Au contacts, to make electrical contact to our model conjugated
assemblies on GaAs (Chapter 6). In this procedure, illustrated above in Figure 1.3, a
dithiol assembly is formed on a substrate, resulting in the covalent attachment between
one of the thiol groups and the substrate. Separately, an elastomeric
poly(dimethylsiloxane) (PDMS) stamp – commonly used in soft lithography14 – is
fabricated by casting and curing the prepolymer against a silicon master (flat or patterned
by conventional photolithography).14-16 Metal (Au in our case) is evaporated on the raised
and recessed regions of the elastomeric stamp, and the stamp is brought into contact with
the dithiol-treated substrate. Due to the intimate contact between the stamp and the
assembly surface, the free thiol end groups can bond to the metal that is on the stamp
surface without external pressure.17 Gently peeling the stamp away results in the transfer
of the metal from the raised regions of the stamp to the molecular assembly surface.
Currently, the deposition of Au and Cu on 1,8-octanedithiol molecular assemblies on
GaAs via nTP has been successfully demonstrated.2,18
Silicon masters,1,15,16 with recessed circular features having diameters ranging
from 100 to 2000 µm, were fabricated by conventional photolithography. Prior to casting
PDMS, the master treated with (tridecafluoro-1,1,2,2-tetrahydroctyl) trichlorosilane14
(Gelest) to render the silicon surface non-stick. The treatment was carried out by first
cleaning the silicon masters in a UV/Ozone chamber for 10 minutes, followed by placing
them over trichlorosilane vapors for 30 minutes under house vacuum.
PDMS stamps were made with Dow Corning Sylgard 184 PDMS formulation.
Sylgard 184 consists of a PDMS prepolymer and a crosslinker. We mixed the prepolymer
30
and crosslinker in a ratio of 10:1 (w:w) and allowed the mixture to degas.18 PDMS
stamps were then fabricated by casting and curing the PDMS prepolymer mixture against
a silicon master. The cure condition was 70°C for 2 hrs. The cured PDMS was then
peeled from the master. The PDMS stamp takes on the negative image of the silicon
master so we end up with posts of varying diameter in PDMS.
For the x-ray photoelectron spectroscopy studies (Chapter 5), the PDMS stamps
were leached prior to nTP. This procedure was adopted based on the discovery by Felmet
et.al.18 that the Au surface in contact with the PDMS stamps during nTP is normally
contaminated by residual oligomers transferred from the stamp. The residual oligomer
contamination can be reduced by leaching the elastomeric stamps in boiling toluene for
2-3 days and drying them in the oven overnight prior to nTP.18 We carried out leaching in
toluene at constant reflux (110°C) for 48 hours.18 Following the removal from toluene,
the stamps were dried of residual toluene in air at ambient conditions overnight, then in a
vacuum oven at 50°C overnight. While leaching with toluene produces cleaner
elastomeric stamps, we found these stamps to be less flexible and more ‘sticky’ toward
the evaporated Au.
In addition to conventional nTP, we developed and employed ‘wet’ nTP where
the Au pattern was transferred from the PDMS stamp onto the molecular assembly
surface in a solvent. Here, the wetting of the substrate surface by the Au film on the
PDMS stamp is governed by the surface tension, λ, of the solvent.19 Specifically, in order
for the Au film to wet a substrate, the solvent must be excluded from the Au-substrate
interface. Vilan and Cahen20 have argued that the solvent surface tension must typically
exceed 25 mJ m-2 for a Au leaf to float on the solvent surface. Additionally, Shimizu et.
al.19 have pointed out the importance of using a high surface tension solvent to ensure its
exclusion from the Au-substrate interface during printing. Indeed, we could not induce

31
wetting of the Au on the PDMS stamp to the molecular assembly surfaces in EtOH, a
solvent with low surface tension (λ = 23 mJ m-2)21. From a range of solvents with surface
tension above 25 mJ m-2 (anisole, λ = 35 mJ m-2; benzene, λ = 28 mJ m-2; chloroform, λ =
27 mJ m-2; cyclopentanone, λ = 33 mJ m-2; dichloroethane, λ = 39 mJ m-2)21, we found
dichloroethane (DCE) to result in the most controlled and reproducible wetting while
minimizing stamp distortion. We have thus selected DCE for our ‘wet’ nTP experiments.
NEAR-EDGE X-RAY ABSORPTION FINE STRUCTURE (NEXAFS) SPECTROSCOPY
NEXAFS spectroscopy uses polarized synchrotron x-rays to excite core electrons
into unoccupied antibonding states. We monitor the subsequent relaxation of these
electrons in order to obtain chemical and structural information about our molecular
assemblies. The NEXAFS spectra reflect the element’s characteristic transitions and,
accordingly, the elemental bonding environments.22 Due to the strong directional
character of molecular orbitals and the high degree of polarization of incident x-rays,
NEXAFS resonance intensities are proportional to the dot product of the electric field
vector, E, and the transitional dipole moment. Hence, if the molecules within the
molecular assembly are preferentially oriented, the integrated intensities of their
characteristic resonances will depend strongly on the x-ray incident angle. NEXAFS is
therefore an ideal technique of probing the ensemble-average orientation22 of molecular
assemblies adsorbed on substrates. In addition, NEXAFS provides relative surface
coverage information.
NEXAFS spectroscopy experiments were carried out at the NIST/Dow soft x-ray
materials characterization facility located at beamline U7A at the National Synchrotron
Light Source at Brookhaven National Laboratories.23 The partial electron yield (PEY)

32
NEXAFS spectra were obtained at the C K-edge using a retarding entrance grid bias of -
150V for enhanced surface sensitivity.24 Linearly polarized synchrotron soft x-rays with a
polarization factor, P, of ≈ 85% were used.25 For studies examining the effect of solvent
quality on the final structure of the molecular assemblies (Chapter 3), we used a scan step
of 0.1 eV in the region of interest (280-310 eV) and a scan step of 0.2 eV at the pre- (270-
280 eV) and post-edge (310-320 eV) regions.10 For all other experiments, we scanned in
increments of 0.1 eV in the region of interest (280-300 eV) and in increments of 0.5 eV at
the pre- (250-280 eV) and post-edge (300-330 eV) regions.11 All NEXAFS spectra were
collected in high vacuum of ≈1x10⁻⁸ torr at ambient temperature. Raw NEXAFS spectra
were normalized by the corresponding incident beam intensity, Io, obtained
concomitantly on a freshly-coated Au grid located upstream from the sample chamber.
This normalization accounts for any incident beam intensity fluctuations and
monochromator absorption features.26 For studies examining the effect of solvent quality
on the final structure of the molecular assemblies (Chapter 3), we corrected the
background curvature in the spectra of assemblies on Au by dividing each sample
spectrum by a third-order polynomial fit to the spectrum of bare Au.27
To evaluate the normalized surface coverage in molecular assemblies on Au and
GaAs, polarization-independent spectra were acquired at an x-ray incident angles (the
angle between the incidence beam and the substrate plane) of 50 or 55°. Both of these
angles are near 51°, commonly referred to as the ‘magic angle’.22 At the ‘magic angle’,
the spectra are independent of the details of molecular orientation and can therefore be
compared directly across various samples.22 A sample pre-edge normalized C 1s
NEXAFS spectrum of TPDT assembled on Au is shown in Figure 2.2. Clearly visible are
the prominent resonance at 285 eV attributed to the C1s → π*C=C transition22 of the
TPDT backbone and the broad resonances at 293 and 303 eV associated with the C1s →
33
σ1* and σ2* transitions.22 To quantify the relative surface coverage, we employed the
ratio of the integrated intensity of the π* resonance at 285 eV and the magnitude of the
carbon-edge jump10 (labeled ‘jump’ in Figure 2.2). Since the peak at 285 eV emanates
exclusively from the π* transition of phenyl backbones of the molecules and the
magnitude of the edge jump reflects the total carbon content on the surface, this ratio
accurately represents the relative surface coverage in our samples. This ratio is referred to
as π*/jump from this point forward.
Angle-dependent NEXAFS data were obtained by varying the x-ray incident
angle between 20° (grazing) and 75° (near-normal). A sample set of pre- and post-edge
normalized NEXAFS spectra of TPDT assembled on Au acquired at varying x-ray
incident angles is shown in Figure 2.3. The ensemble-average orientation of the
molecules with respect to the substrate surface can be quantified by examining the details
of angular dependence of the π* resonance intensity in these spectra. Specifically, the
resonance intensities in this sample set of spectra vary with the x-ray incident angle: the
π* resonance intensifies while the σ* resonances subside when the incident angle is
increased from 20° to 75°. This phenomenon, where the π* resonance intensifies at the
expense of the σ* resonances, is an indication that the assemblies are preferentially
oriented.28 The presence of preferential orientation is further corroborated by the
difference spectra presented in the lower portion the plot. We obtained the difference
spectra by subtracting the NEXAFS spectra acquired at 20° from the NEXAFS spectra
obtained at other x-ray incident angles, i.e., I(θ) – I(20°). As such, the difference spectra
emphasize the angle-dependent resonances originating from features that are
preferentially oriented. The ensemble-average orientation of the assemblies can be
qualitatively deduced from the way in which the orbitals interact with the electric field
vector, E, of the incident x-rays. Specifically, only orbitals with components collinear
34
with the electric field vector of the incident polarized x-rays can absorb energy.22 The
spectral intensity of a given resonance therefore depends on the extent of collinearity of
the molecular orbital with the electric field vector of incident x-rays. Considering that the
electric field vector, E, is normal to the x-ray incidence,22,27 we can qualitatively deduce
its interactions with the molecular orbitals by examining the NEXAFS spectra at varying
x-ray incident angles. For instance, the spectrum acquired at 75° in Figure 2.3 exhibits
the highest intensity of the π* resonance (285 eV) and the weakest intensity minimal
intensities of the σ* resonances (293 and 303 eV). At 20°, the spectrum is reversed, with
the π* resonance (285 eV) exhibiting the weakest intensity and the σ* resonances (293
and 303 eV) exhibiting the highest intensity. According to the dipole selection rule
outlined above, these trends indicate that the π* orbitals of the molecular backbones are
nearly collinear with E (hence maximal intensity), while the σ* planes are nearly
perpendicular to E (hence minimal intensity) in this configuration. In contrast, at grazing
x-ray incidence of 20°, the π* orbitals must be oriented nearly perpendicular to E (hence
minimal intensity of the π* resonance in this configuration), while the σ* planes must be
nearly collinear with E. Considering that the π* orbitals are normal to the long molecular
backbone axis, while the σ* planes are parallel to it, it follows from the intensity trends in
Figure 2.3 that the molecules must be oriented with their backbone axes preferentially
upright on the substrate surface.28
The ensemble-average molecular orientation can be quantified by a dichroic ratio
(DR):29
)I()I()I()I(
DR oo
oo
20752075
+−= Equation (2.1)
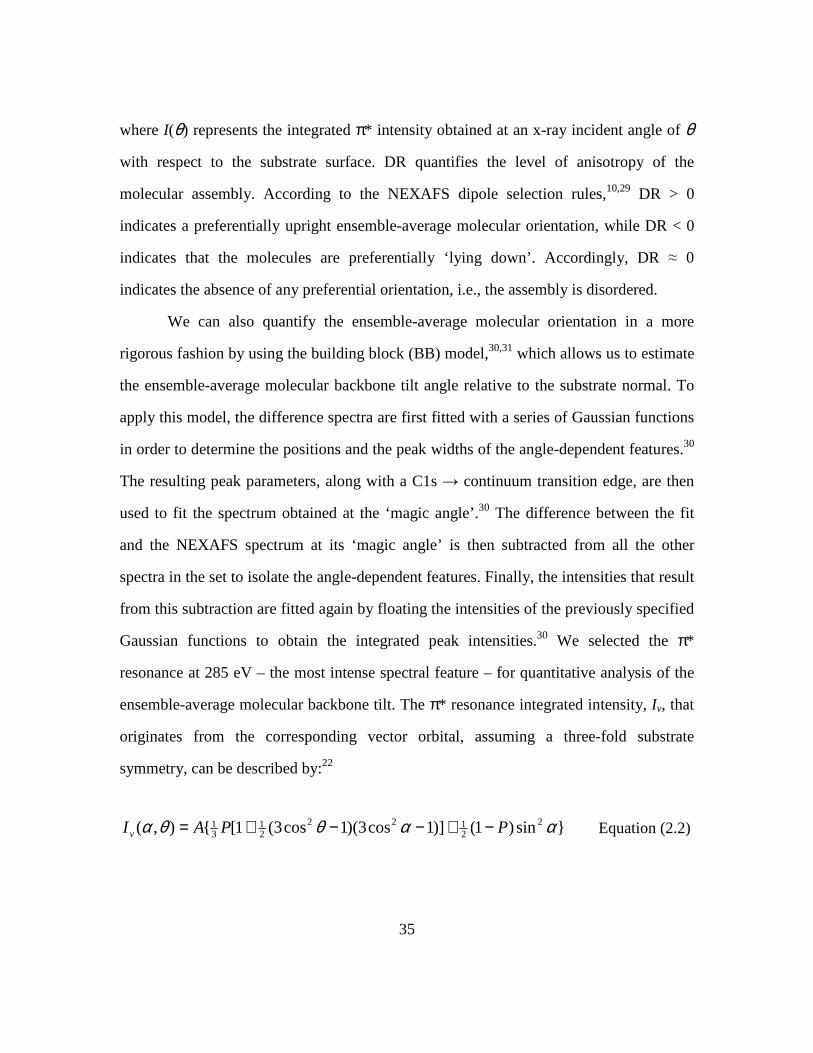
35
where I(θ) represents the integrated π* intensity obtained at an x-ray incident angle of θ
with respect to the substrate surface. DR quantifies the level of anisotropy of the
molecular assembly. According to the NEXAFS dipole selection rules,10,29 DR > 0
indicates a preferentially upright ensemble-average molecular orientation, while DR < 0
indicates that the molecules are preferentially ‘lying down’. Accordingly, DR ≈ 0
indicates the absence of any preferential orientation, i.e., the assembly is disordered.
We can also quantify the ensemble-average molecular orientation in a more
rigorous fashion by using the building block (BB) model,30,31 which allows us to estimate
the ensemble-average molecular backbone tilt angle relative to the substrate normal. To
apply this model, the difference spectra are first fitted with a series of Gaussian functions
in order to determine the positions and the peak widths of the angle-dependent features.30
The resulting peak parameters, along with a C1s → continuum transition edge, are then
used to fit the spectrum obtained at the ‘magic angle’.30 The difference between the fit
and the NEXAFS spectrum at its ‘magic angle’ is then subtracted from all the other
spectra in the set to isolate the angle-dependent features. Finally, the intensities that result
from this subtraction are fitted again by floating the intensities of the previously specified
Gaussian functions to obtain the integrated peak intensities.30 We selected the π*
resonance at 285 eV – the most intense spectral feature – for quantitative analysis of the
ensemble-average molecular backbone tilt. The π* resonance integrated intensity, Iv, that
originates from the corresponding vector orbital, assuming a three-fold substrate
symmetry, can be described by:22
sin)1()]1cos3)(1cos3(1[),( 22122
21
31 ααθθα PPAI v −+−−+= Equation (2.2)

36
where A is a proportionality constant; P is the x-ray polarization factor (≈85% in our set-
up); θ is the x-ray incident angle; and α is the angle between the orbital vector and the
substrate normal. Figure 2.4 presents a schematic of an adsorbed molecule, and it
illustrates the different angles involved in this analysis. From a geometrical standpoint:
ρϕα 222 sincoscos = Equation (2.3)
Equation (2.3) can be equivalently expressed as:
ρϕα 222 sincos1sin −= Equation (2.4)
where ρ is the tilt angle of the molecular backbone axis away from the substrate normal
(see Figure 2.4); ϕ is the ring-plane twist angle, defined as the angle between the π
transition dipole moment vector of the phenyl rings and the plane spanned by the
molecular backbone axis and the substrate normal. The average molecular tilt angle is
estimated by fitting the π* integrated resonance intensity as a function of x-ray incident
angle to Equation (2.2).22,30 During the fitting process, A and ρ are floating parameters.
We assumed ϕ = 32o and a planar backbone (i.e., successive phenyl rings are coplanar) in
our analysis for TPDT and QPDT molecular assemblies (BPDT assemblies are
disordered at all the conditions we explored).32-35 An example outcome of this fitting
procedure is shown in Figure 2.5, where we plotted the integrated π* intensities extracted
from the spectra in Figure 2.3 (black squares), along with their theoretical fits to Equation
(2.2), as a function of x-ray incident angle. The best fit (solid line) and the corresponding
backbone tilt angle, ρ, are highlighted. The dotted lines are graphical representations of
Equation (2.2) at other specified backbone tilt angles and are provided for reference. In
37
this example, our analysis indicates that TPDT on Au adopts an ensemble-average
backbone tilt of 32±3°. The uncertainty of the calculated backbone tilt angles is estimated
to be ±3o, based on experimental uncertainties and the uncertainty associated with the
assumed twist angle and phenyl backbone planarity.36-38
As evident from the fits (dotted and solid lines) shown in Figure 2.5, the rigorous
NEXAFS analysis based on the BB model does not distinguish between an assembly that
is disordered and an assembly with an ensemble-average backbone tilt of 43° away from
the substrate normal. In both of these cases, the integrated π* intensities do not depend on
the x-ray incident angle.10 This limitation is a result of the assumption of 3-fold substrate
symmetry, where the orbital tilt, α, and the incident angle, θ, are mathematically
equivalent in Equation (2.2). There thus exists a ‘magic orientation’ at α = 55° where the
NEXAFS resonance intensities do not depend on x-ray incident angle. Because we
assumed a molecular backbone twist of ϕ = 32° in our analysis, this magic orientation
occurs when the molecular backbone tilt happens to be 43°.
FOURIER TRANSFORM INFRARED (FTIR) SPECTROSCOPY
We used a dry-air purged Nicolet Magna-IR 860 spectrometer equipped with a
liquid nitrogen cooled MCT detector for both reflection measurements on Au and
transmission measurements on GaAs. All IR spectra are reported in absorbance units, A,
where A = -log R/R0, R is the reflectivity of the IR beam, and R0 is the reflectivity of a
reference sample. Assemblies on Au were characterized by reflection-absorption infrared
spectroscopy (RAIRS) and assemblies on GaAs were characterized by transmission IR
spectroscopy. All RAIRS spectra were recorded for 1000 scans at a resolution of 2 cm-1.
We used a spectrum of hexadecanethiol assembled on Au39 for background correction.

38
Ideally, the background spectrum should be acquired from a clean Au substrate.40
Preparing a pristine Au surface, however, is very difficult due to ambient hydrocarbon
adsorption on the surface. We therefore used hexadecanethiol assembled on Au as
background. The resonances associated with hexadecanethiol41 assembled on Au found at
1262, 1383 and 1468 cm-1 are weak, and do not interfere with the resonances associated
with n-phenyldithiol assemblies. With this background correction procedure, the
hexadecanethiol resonances appear as dips (or negative intensities) in the RAIRS spectra
of n-phenyldithiol assemblies on Au. We used a commercial VeeMax II variable-angle
accessory using p-polarized light with the grazing incident angle fixed at 79° relative to
the substrate normal for all RAIRS experiments.
A sample RAIRS spectrum of QPDT assembled on Au is shown in Figure 2.6a.
Prominent resonances originating from the phenyl backbone of QPDT include the in-
plane, ip, (1475 cm-1 and 1001 cm-1) and out-of-plane, op, (807 cm-1) phenyl ring
vibrational modes.9 Additionally, Figure 2.6a reveals features associated with the acetyl
protecting group: the peaks at 1706 and 1353 cm-1 are assigned to C=O and CH3 (CH3-
CO) vibrations9,42 of the thioacetyl functionality, respectively. Besides chemical
identification, we can assess the molecular orientation of the QPDT assembly on the
substrate by examining the intensities of the ip and op resonances.9,41 In RAIRS, the
electric field component that is parallel to the substrate is screened by the electronic
polarization of Au.9 The observed spectral intensity therefore depends solely on the
magnitude of the projected transitional dipole moment onto the substrate normal. As
such, only bonds vibrating along the substrate normal will be detected. We can therefore
qualitatively assess the orientation of the molecular assembly by comparing its spectrum
with that obtained from a powder sample.43 As illustrated in the model on the right in
Figure 2.6, the phenyl ring ip bands at 1475 and 1001 cm-1 exhibit a dipole moment in the
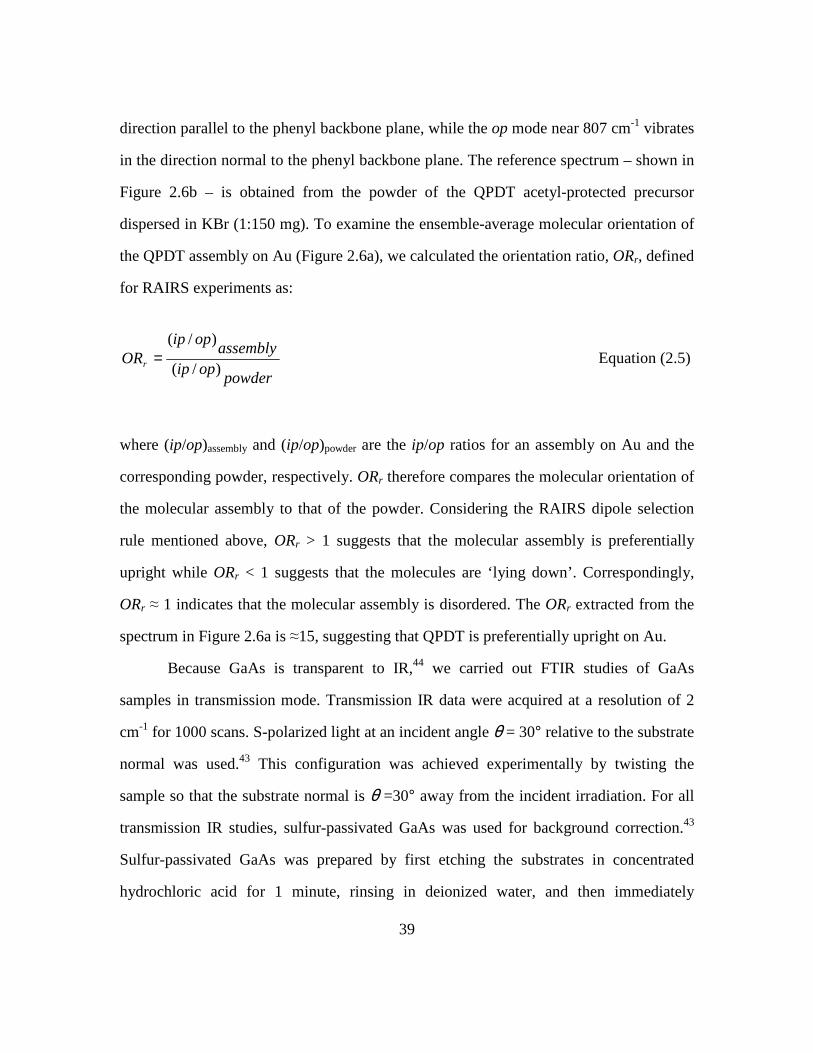
39
direction parallel to the phenyl backbone plane, while the op mode near 807 cm-1 vibrates
in the direction normal to the phenyl backbone plane. The reference spectrum – shown in
Figure 2.6b – is obtained from the powder of the QPDT acetyl-protected precursor
dispersed in KBr (1:150 mg). To examine the ensemble-average molecular orientation of
the QPDT assembly on Au (Figure 2.6a), we calculated the orientation ratio, ORr, defined
for RAIRS experiments as:
powderopip
assemblyopip
ORr )/(
)/(= Equation (2.5)
where (ip/op)assembly and (ip/op)powder are the ip/op ratios for an assembly on Au and the
corresponding powder, respectively. ORr therefore compares the molecular orientation of
the molecular assembly to that of the powder. Considering the RAIRS dipole selection
rule mentioned above, ORr > 1 suggests that the molecular assembly is preferentially
upright while ORr < 1 suggests that the molecules are ‘lying down’. Correspondingly,
ORr ≈ 1 indicates that the molecular assembly is disordered. The ORr extracted from the
spectrum in Figure 2.6a is ≈15, suggesting that QPDT is preferentially upright on Au.
Because GaAs is transparent to IR,44 we carried out FTIR studies of GaAs
samples in transmission mode. Transmission IR data were acquired at a resolution of 2
cm-1 for 1000 scans. S-polarized light at an incident angle θ = 30° relative to the substrate
normal was used.43 This configuration was achieved experimentally by twisting the
sample so that the substrate normal is θ =30° away from the incident irradiation. For all
transmission IR studies, sulfur-passivated GaAs was used for background correction.43
Sulfur-passivated GaAs was prepared by first etching the substrates in concentrated
hydrochloric acid for 1 minute, rinsing in deionized water, and then immediately

40
immersing the etched substrates in a solution of ammonium sulfide in water (20% v/v,
Aldrich) for 10 minutes.45 This procedure results in a stable overlayer of sulfur that
resists surface oxidation and hydrocarbon adsorption.45 The background-corrected spectra
were smoothed using conventional 12-point Fast Fourier Transform (FFT) smoothing46 in
Origin 6.1 commercial software to remove periodic interference44,47 (see Figure 2.7a and
b for representative spectra before and after smoothing). A multi-point baseline
correction was applied in GRAMS/AI commercial software to all transmission IR
spectra.
For our transmission IR experiments, we used s-polarized, rather than p-polarized,
light to examine the molecular orientation of the assemblies because s-polarized light is
selective for components of the dipole moment that are parallel to the substrate regardless
of the incident angle of irradiation.43 As a result, an unambiguous selection rule for the
phenyl backbone with respect to the substrate exists. In contrast, p-polarized light results
in sensitivity to a combination of dipole moments depending on the incident angle of the
irradiation; the determination of orientation from IR spectra obtained using p-polarized
light is therefore challenging and requires rigorous spectral simulations.48
As an example, consider an assembly of QPDT on GaAs with the dipole moment
directions of the molecule illustrated on the right in Figure 2.7. The two major features
providing insight into the molecular orientation are the ip ring vibration (1475 cm-1), with
a dipole moment directed along the molecular axis, and the op ring vibration (807 cm-1),
with a dipole moment directed perpendicular to the molecular axis and out of the phenyl
ring plane. That aromatic molecules obey a unique dipole selection rule in transmission
IR experiments using s-polarized light is best illustrated in Figure 2.8. A molecular
assembly with an azimuthally-average backbone tilt, ρ, away from the substrate normal
can be represented by an orientation cone. This orientation cone is characterized by a

41
dipole moment coordinate system with the z axis oriented along the cone symmetry axis.
The electric field vectors for s- and p-polarized light are also illustrated in Figure 2.8. For
an n-phenyldithiol assembly on GaAs whose substrate normal is parallel to the IR
incidence (as sketched in Figure 2.8b), the ip vibration of the n-phenyl backbone (1475
cm-1) is characterized by a dipole moment directed along the z axis, while the op
vibration (807 cm-1) is characterized by dipole moments directed along the x or y axes. In
order for a specific vibrational mode to absorb energy, the dipole moment of that
particular bond must be collinear with the electric field vector of the incident polarized
light. The comparison of Figures 2.8b and c reveals that the op vibration (dipole moment
along y) is collinear with the electric field vector of s-polarized light regardless of θ. The
op vibration therefore absorbs s-polarized light with a constant sampling cross-section.
As a result, the intensity of the op vibration is constant regardless of θ. Accordingly, the
intensity of the ip vibration is also independent of θ when s-polarized light is used. It
follows that an examination of the op/ip ratio – which does not depend on θ when s-
polarized light is used – should serve as an indication of the average orientation of the
molecular assembly. To illustrate this concept, representative transmission IR spectra of a
QPDT assembly on GaAs43 acquired with s-polarized light at θ = 25°, 45°, and 65° are
presented in Figure 2.9. A comparison of these spectra reveals ip and op intensities that
are each in itself independent of θ. The op/ip ratio is thus constant with θ when s-
polarized light is used. We can therefore directly infer the average orientation of the
molecular assembly from spectra obtained using s-polarized light. We empirically found
θ = 30° to be the optimal angle for transmission IR experiments using s-polarized light as
the optimal position of the specimen depends on a balance between increasing
interference at lower θ and decreasing substrate transmissivity at higher θ. Specifically,
the periodic interference fringes resulting from back-reflection of the double-side
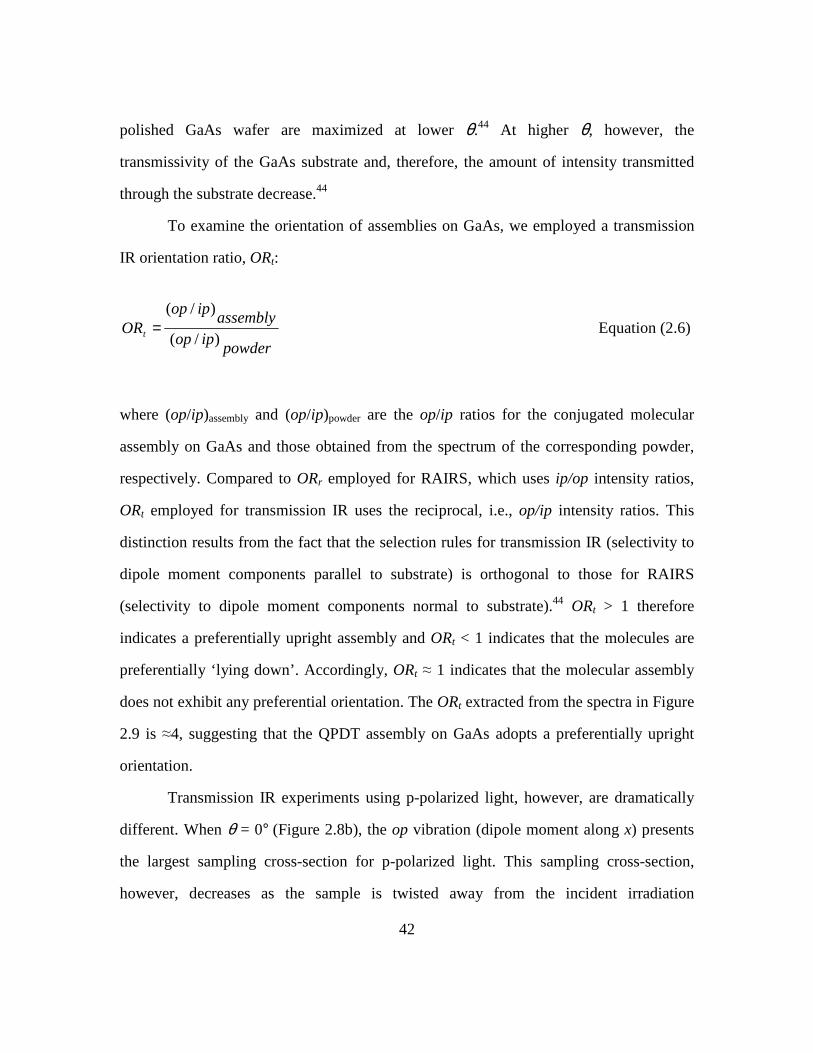
42
polished GaAs wafer are maximized at lower θ.44 At higher θ, however, the
transmissivity of the GaAs substrate and, therefore, the amount of intensity transmitted
through the substrate decrease.44
To examine the orientation of assemblies on GaAs, we employed a transmission
IR orientation ratio, ORt:
powderipop
assemblyipop
ORt )/(
)/(= Equation (2.6)
where (op/ip)assembly and (op/ip)powder are the op/ip ratios for the conjugated molecular
assembly on GaAs and those obtained from the spectrum of the corresponding powder,
respectively. Compared to ORr employed for RAIRS, which uses ip/op intensity ratios,
ORt employed for transmission IR uses the reciprocal, i.e., op/ip intensity ratios. This
distinction results from the fact that the selection rules for transmission IR (selectivity to
dipole moment components parallel to substrate) is orthogonal to those for RAIRS
(selectivity to dipole moment components normal to substrate).44 ORt > 1 therefore
indicates a preferentially upright assembly and ORt < 1 indicates that the molecules are
preferentially ‘lying down’. Accordingly, ORt ≈ 1 indicates that the molecular assembly
does not exhibit any preferential orientation. The ORt extracted from the spectra in Figure
2.9 is ≈4, suggesting that the QPDT assembly on GaAs adopts a preferentially upright
orientation.
Transmission IR experiments using p-polarized light, however, are dramatically
different. When θ = 0° (Figure 2.8b), the op vibration (dipole moment along x) presents
the largest sampling cross-section for p-polarized light. This sampling cross-section,
however, decreases as the sample is twisted away from the incident irradiation
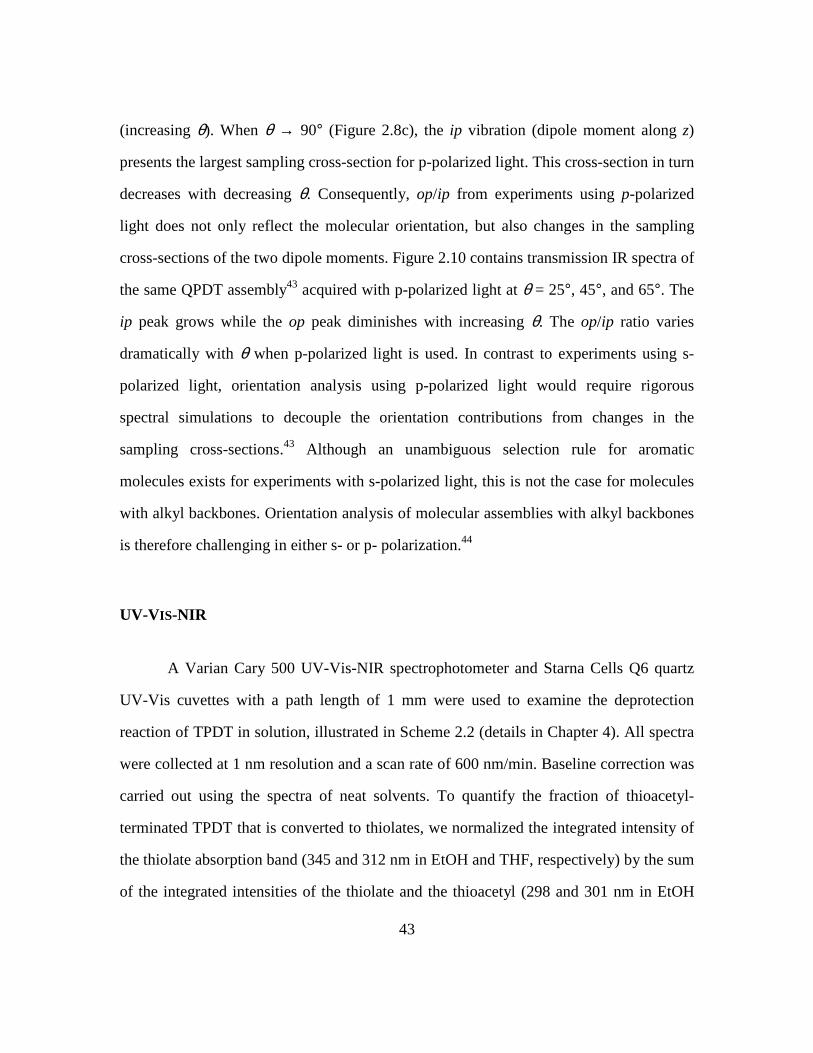
43
(increasing θ). When θ → 90° (Figure 2.8c), the ip vibration (dipole moment along z)
presents the largest sampling cross-section for p-polarized light. This cross-section in turn
decreases with decreasing θ. Consequently, op/ip from experiments using p-polarized
light does not only reflect the molecular orientation, but also changes in the sampling
cross-sections of the two dipole moments. Figure 2.10 contains transmission IR spectra of
the same QPDT assembly43 acquired with p-polarized light at θ = 25°, 45°, and 65°. The
ip peak grows while the op peak diminishes with increasing θ. The op/ip ratio varies
dramatically with θ when p-polarized light is used. In contrast to experiments using s-
polarized light, orientation analysis using p-polarized light would require rigorous
spectral simulations to decouple the orientation contributions from changes in the
sampling cross-sections.43 Although an unambiguous selection rule for aromatic
molecules exists for experiments with s-polarized light, this is not the case for molecules
with alkyl backbones. Orientation analysis of molecular assemblies with alkyl backbones
is therefore challenging in either s- or p- polarization.44
UV-VIS-NIR
A Varian Cary 500 UV-Vis-NIR spectrophotometer and Starna Cells Q6 quartz
UV-Vis cuvettes with a path length of 1 mm were used to examine the deprotection
reaction of TPDT in solution, illustrated in Scheme 2.2 (details in Chapter 4). All spectra
were collected at 1 nm resolution and a scan rate of 600 nm/min. Baseline correction was
carried out using the spectra of neat solvents. To quantify the fraction of thioacetyl-
terminated TPDT that is converted to thiolates, we normalized the integrated intensity of
the thiolate absorption band (345 and 312 nm in EtOH and THF, respectively) by the sum
of the integrated intensities of the thiolate and the thioacetyl (298 and 301 nm in EtOH
44
and THF, respectively) absorption bands. Integrated intensities of thioacetyl- and
thiolate- absorption bands were obtained by fitting each band with a Gaussian function.
The peak widths and positions were obtained from fits of spectra of acetyl-protected
precursors and solutions in which the deprotection reaction (Scheme 2.2) was complete.
ELLIPSOMETRY
The thickness of molecular assemblies on Au and GaAs was measured with a
spectroscopic ellipsometer (J.A. Woollam Co.). Measurements were carried out between
285-500 nm at incidence angles of 60, 65, and 70o with respect to the substrate normal.
The data were fitted using Wvase32 software using the conventional 2-layer model
consisting of a substrate and a top organic layer.49-51 Optical constants for bare Au
substrates were obtained from the same batches of freshly-evaporated Au on which the
molecules were assembled. Optical constants for GaAs were obtained from substrates
etched identically to those used for assembly and subsequently passivated with
ammonium sulfide.43 Refractive index values of n = 1.559 and n = 1.4550 were assumed
for the analysis of n-phenyl- and alkyl-based assemblies, respectively. We used the
Cauchy model for the top organic layer with A = n, B = 0.01, and C = 0.50
X-RAY PHOTOELECTRON SPECTROSCOPY (XPS)
We performed XPS measurements on two types of samples – (1) molecular
assemblies on Au and GaAs and (2) the same molecular assemblies on GaAs after ≈15Å
of Au was deposited on the assembly surface using nTP. XPS experiments were carried
out using either a Physical Electronics ESCA 5700 or a Kratos Axis Ultra DLD
45
spectrophotometer equipped with a monochromatic Al Kα X-ray source (1486.6 eV), a
hemispherical electron analyzer, and a low energy electron flood gun. All spectra were
collected in ultra high vacuum at a base pressure of ≈2x10⁻⁹ Torr at ambient temperature.
All elemental spectra were acquired at a photoelectron take off angle of 75° with respect
to substrate normal; analyzer pass energy of 20 eV; resolution of 0.1 eV; sweep time of
1000 ms/eV. The S 2p elemental spectra were collected with 10 energy sweeps and fitted
with symmetric Voigt functions and linear backgrounds.52 The individual S 2p doublets
were resolved with peaks with an S 2p3/2,1/2 branching ratio of 253-56 and separation of
1.18 eV.57 During data fitting, the full width at half maximum (FWHM) of the peaks and
the peak positions were held constant with the peak intensity being the only floating
parameter. Peaks with FWHM of 0.95 and 1.05 eV were used to fit the S 2p spectra of
1,8-octanedithiol and QPDT, respectively. S 2p doublets attributed to S-Au bonds, S-
GaAs bonds, and unbound thiol/thiolate/thioacetyl groups are located at ≈162, ≈162.8,
and ≈164 eV, respectively. The spectra of C 1s, Au 4f, and Cl 2p were acquired with 1
energy sweep; Ga 2p spectra were acquired with 5 energy sweeps. All elemental spectra
besides S 2p were corrected using Shirley background.52,58,59
SCANNING ELECTRON MICROSCOPY (SEM)
We used a LEO 1530 SEM with low operating voltage capabilities and an in-lens
annular detector to image the Au that had been printed onto the molecular assembly
surfaces by nTP. SEM images were acquired at 6-8kV with working distances of 5-6 mm.

46
ATOMIC FORCE MICROSCOPY (AFM)
The morphologies of the substrates and that of the Au that had been printed onto
molecular assembly surfaces by nTP were characterized using a Digital Instruments
Dimension 3100 AFM in tapping mode. We employed silicon tips with a resonant
frequency of 300 kHz, a spring constant of 40 N/m, and a tip radius of <10 nm, obtained
from NanoDevices. The r.m.s roughness was quantified using NanoScope software
ver.6.12r1. A typical scan window was 1 µm2.
CURRENT-VOLTAGE (I-V) CHARACTERIZATION
An Agilent 4156C Precision Semiconductor Parameter Analyzer was used to
make all electrical measurements. For current-voltage characterization of GaAs—
molecule—electrode junctions, 2 types of probes were used: a common tungsten probe
and a hanging-drop galinstan electrode which was constructed in-house. The needle-like
tungsten probe (available from Probing Solutions Inc.) was grounded to the GaAs
substrate through a scribed indium contact. The hanging-drop galinstan electrode was
used to contact either the molecular assembly surface or the printed top Au contact,
depending on experiment. Galinstan (can be acquired from www.scitoycatalog.com)
hanging drops were dispensed from a standard plastic 1 mL syringe through a 250 µm
goniometer needle (Hamilton). The needle was permanently attached to a stainless steel
wire using silver paint (high-purity, SPI). The stainless steel wire was clipped into the
parameter analyzer probe, providing electrical contact between the dispensed hanging
galinstan drop and the parameter analyzer while preventing any damage to the needle.
The cross-sections of the galinstan drop contacts were imaged using a video camera,
which allowed for measuring the contact area. Figure 2.11 shows examples of galinstan

47
contacts on a GaAs-molecule-Au junction and directly on the molecular assembly.
Because galinstan is prone to surface oxidation in air,60 all I-V characterization was
carried out under nitrogen purge. We applied a -0.5 V to 0.5 V bias to the hanging-drop
galinstan electrode in 0.1 V increments.
OPTICAL MICROSCOPY
An Eclipse ME 600L Nikon Metallurgical Microscope equipped with episcopic
differential interference contrast (DIC) and a Nomarski prism was used to image the top
Au contacts deposited by nTP. All images were collected at ambient conditions with a
digital camera (Nikon DXM 1200).

48
FIGURES
MeS Br
Mg, THFBr Br
Ni(dppp)C l292%
MeS SMe
t-BuSNa
95%HS SH
AcC l, Et3N
75%S S
O O
2
3 4 (TPDT)
MeS Br
Mg, THFBr
Ni(dppp)C l298%
MeS
t-BuSNa
98%
AcC l, E t3N
33%
S
O
Br
SMe
HS SHS
O5 (QPDT)
Br Br1) t-BuLi, THF
2) S
3) AcC l
S S
O O15% 1 (BPDT)
MeS Br
Mg, THFBr Br
Ni(dppp)C l292%
MeS SMe
t-BuSNa
95%HS SH
AcC l, Et3N
75%S S
O O
2
3 4 (TPDT)
MeS Br
Mg, THFBr
Ni(dppp)C l298%
MeS
t-BuSNa
98%
AcC l, E t3N
33%
S
O
Br
SMe
HS SHS
O5 (QPDT)
MeSMeS BrBr
Mg, THFMg, THFBrBr BrBr
Ni(dppp)C l2Ni(dppp)C l292%92%
MeSMeS SMeSMe
t-BuSNat-BuSNa
95%95%HSHS SHSH
AcC l, Et3NAcC l, Et3N
75%75%S S
O O
2
3 4 (TPDT)
MeSMeS BrBr
Mg, THFMg, THFBrBr
Ni(dppp)C l2Ni(dppp)C l298%98%
MeSMeS
t-BuSNat-BuSNa
98%98%
AcC l, E t3NAcC l, E t3N
33%33%
S
O
BrBr
SMeSMe
HSHS SHSHS
O5 (QPDT)
BrBr BrBr1) t-BuLi, THF1) t-BuLi, THF
2) S2) S
3) AcC l3) AcC l
S S
O O15%15% 1 (BPDT)
Scheme 2.1. Synthesis schemes for the acetyl-protected precursors of biphenyldithiol (BPDT), terphenyldithiol (TPDT) and quaterphenyldithiol (QPDT).
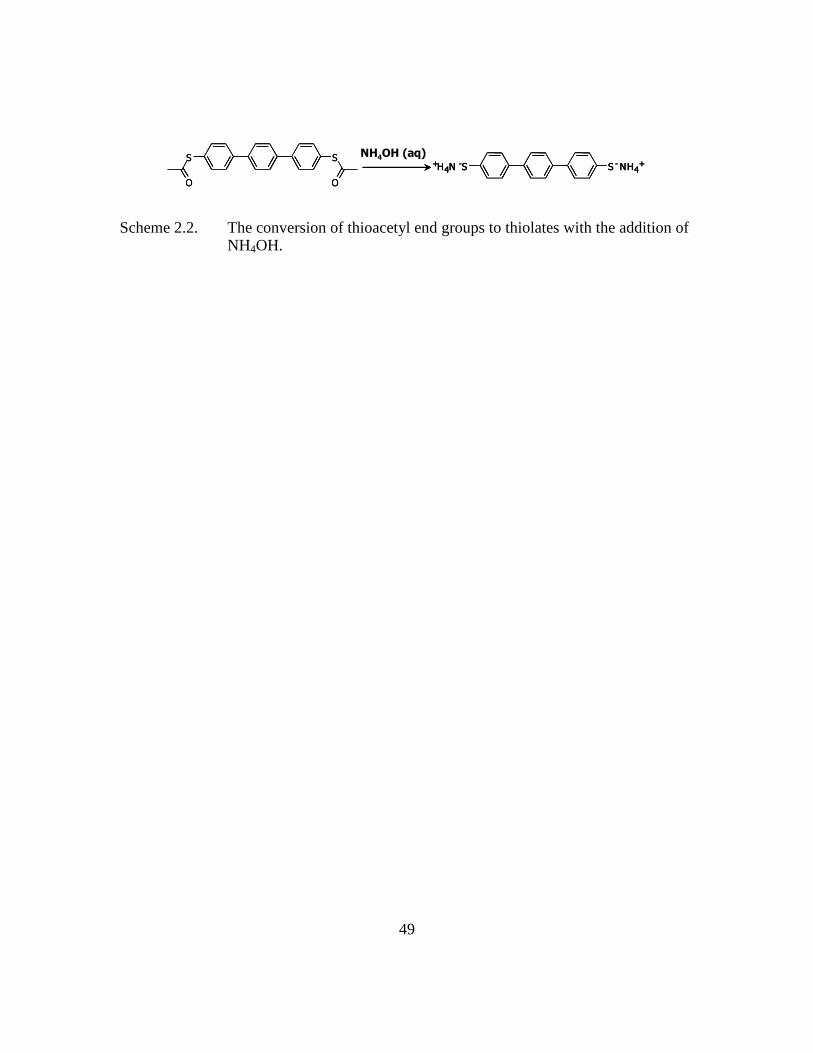
49
S S
OO
NH3.H2OS S
OO
NH3.H2ONH3.H2O+H4N
-S S -NH4++H4N
-S+H4N-S S -NH4
+S -NH4+
NH4OH (aq)
Scheme 2.2. The conversion of thioacetyl end groups to thiolates with the addition of NH4OH.
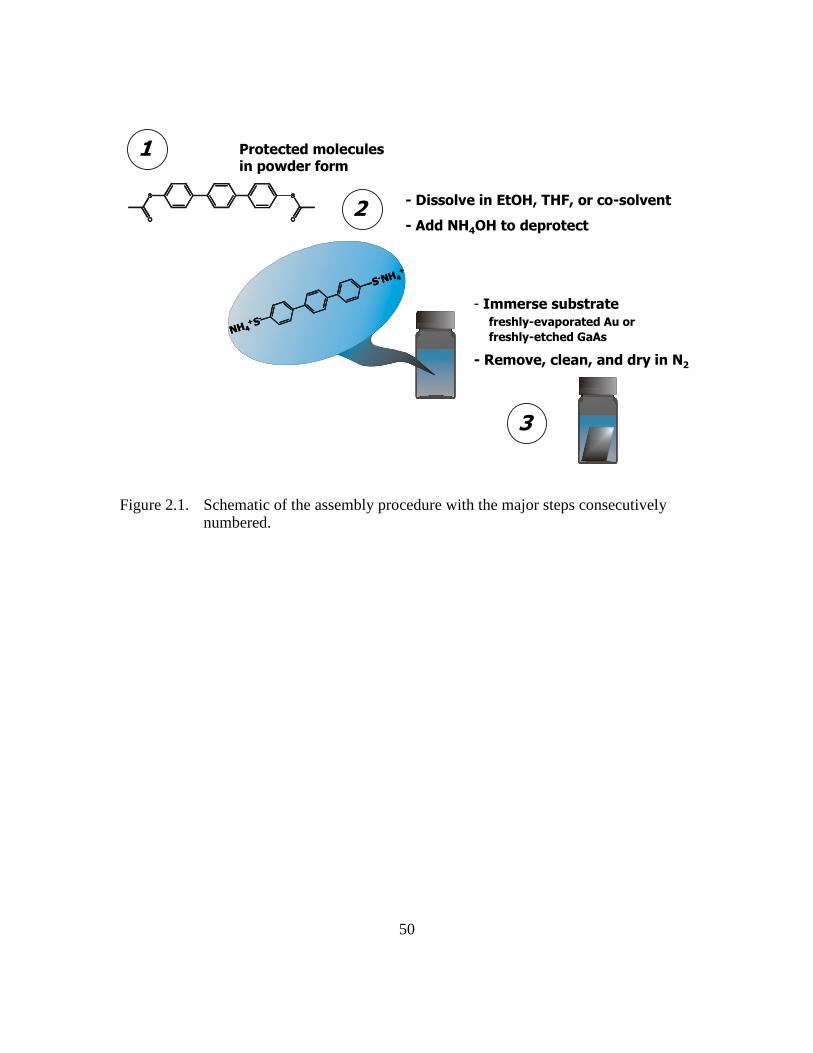
50
Protected molecules in powder form
- Dissolve in EtOH, THF, or co-solvent
- Add NH4OH to deprotect
- Immerse substrate freshly-evaporated Au or
freshly-etched GaAs
- Remove, clean, and dry in N2
S-NH4
+
NH4+S-
S-NH4
+
NH4+S-
2
3
1
Figure 2.1. Schematic of the assembly procedure with the major steps consecutively numbered.
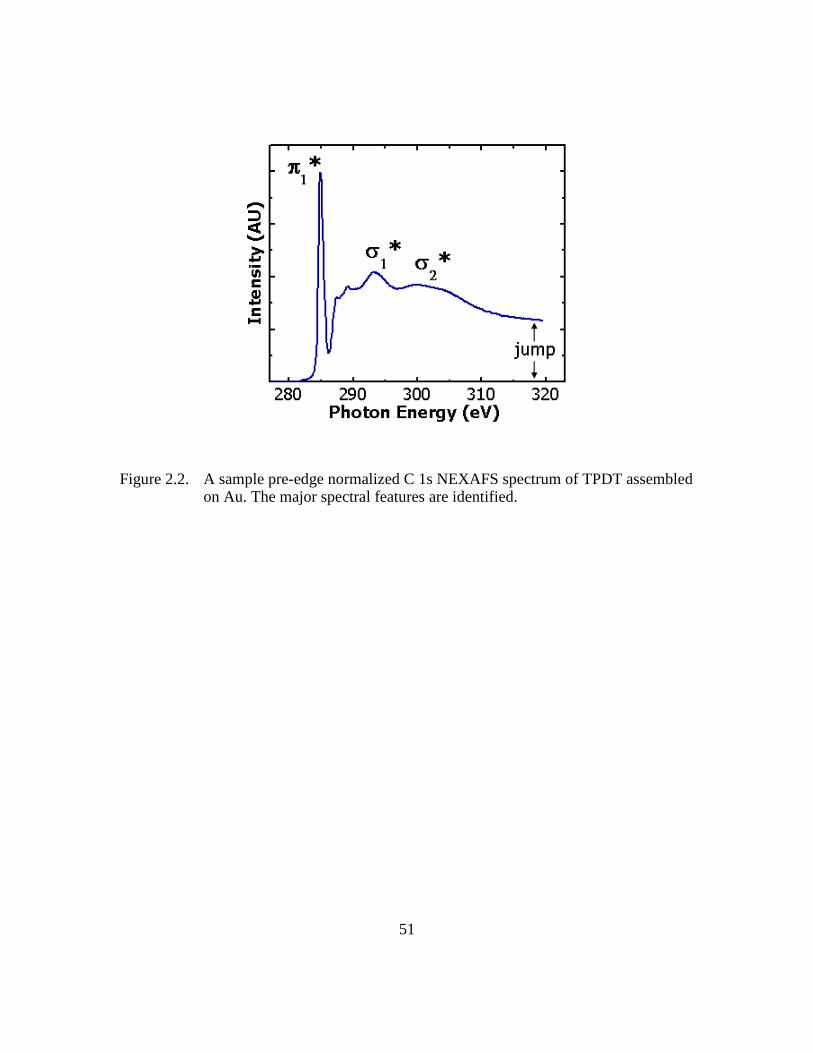
51
Figure 2.2. A sample pre-edge normalized C 1s NEXAFS spectrum of TPDT assembled on Au. The major spectral features are identified.
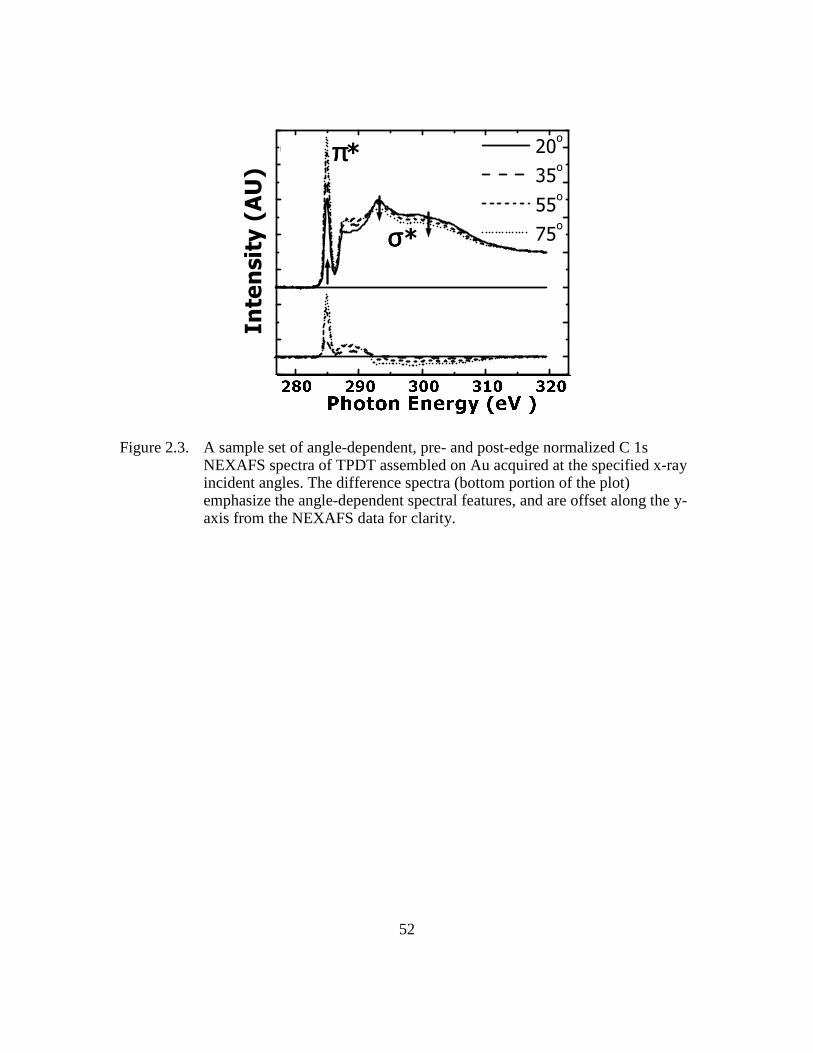
52
π∗π∗ π∗π∗ Int. Intensity (AU)
(a)
Intensity (AU)
20o
35o
55o
75o
ππππ*
σσσσ*
Figure 2.3. A sample set of angle-dependent, pre- and post-edge normalized C 1s NEXAFS spectra of TPDT assembled on Au acquired at the specified x-ray incident angles. The difference spectra (bottom portion of the plot) emphasize the angle-dependent spectral features, and are offset along the y-axis from the NEXAFS data for clarity.

53
Figure 2.4. Schematic of a TPDT molecule adsorbed on a substrate. The angles used in our NEXAFS orientation analysis based on the BB model30 are identified.
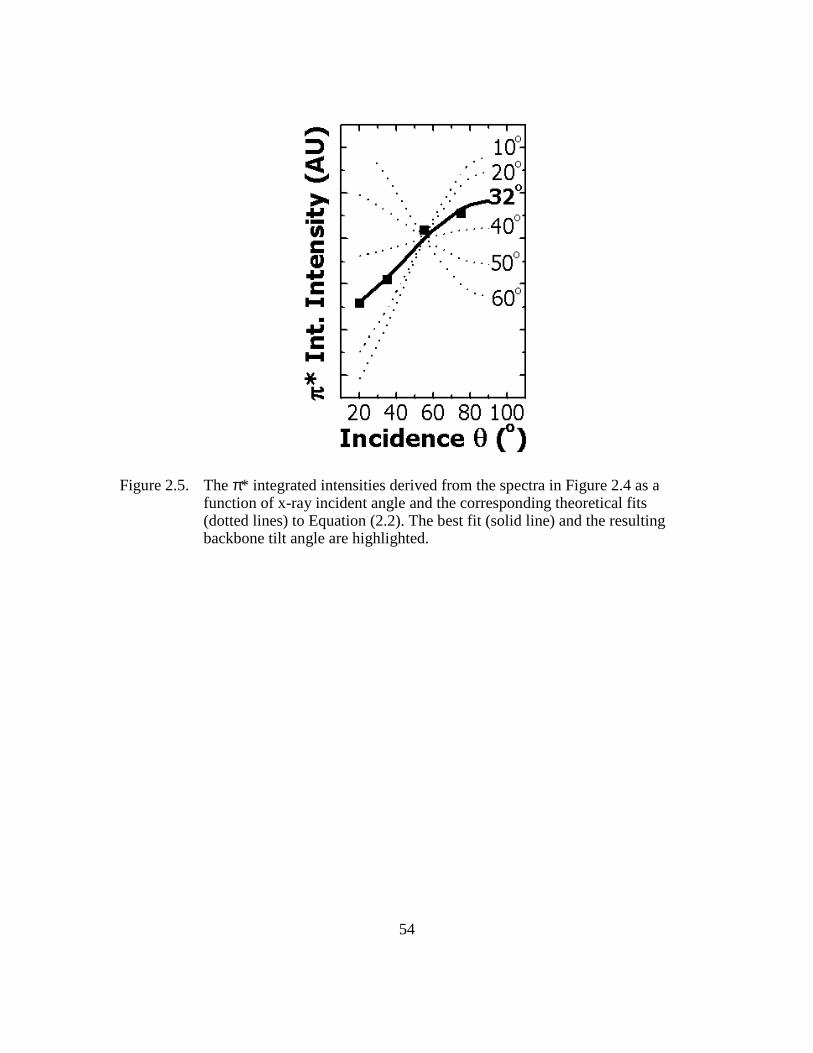
54
Figure 2.5. The π* integrated intensities derived from the spectra in Figure 2.4 as a function of x-ray incident angle and the corresponding theoretical fits (dotted lines) to Equation (2.2). The best fit (solid line) and the resulting backbone tilt angle are highlighted.
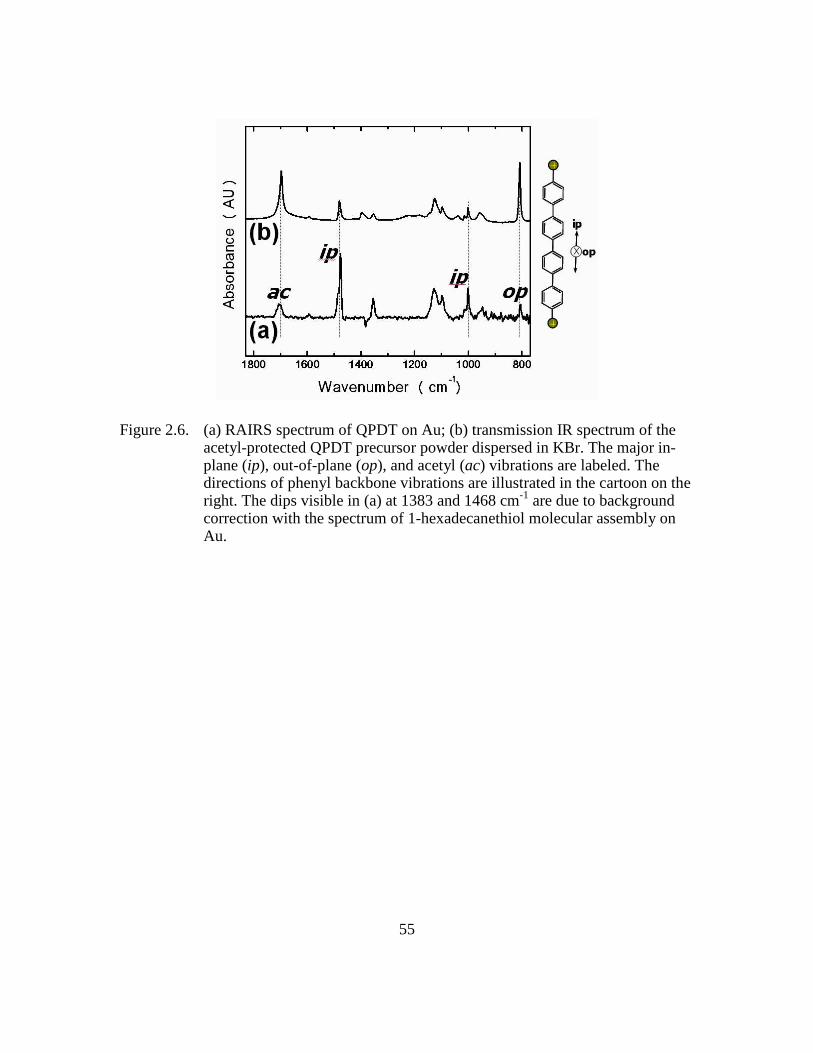
55
Figure 2.6. (a) RAIRS spectrum of QPDT on Au; (b) transmission IR spectrum of the acetyl-protected QPDT precursor powder dispersed in KBr. The major in-plane (ip), out-of-plane (op), and acetyl (ac) vibrations are labeled. The directions of phenyl backbone vibrations are illustrated in the cartoon on the right. The dips visible in (a) at 1383 and 1468 cm-1 are due to background correction with the spectrum of 1-hexadecanethiol molecular assembly on Au.
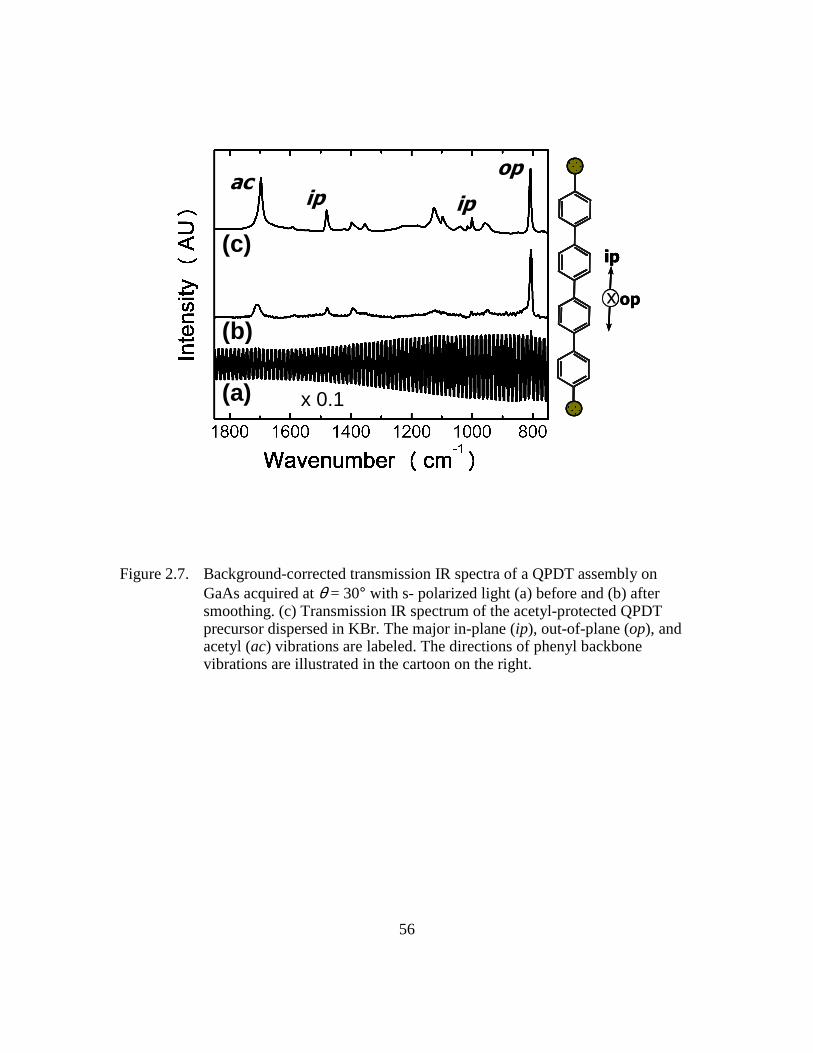
56
acip ip
op
(a)
(b)
(c)
x 0.1
opx
ip
opx
ip
x
ip
x
ip
Figure 2.7. Background-corrected transmission IR spectra of a QPDT assembly on GaAs acquired at θ = 30° with s- polarized light (a) before and (b) after smoothing. (c) Transmission IR spectrum of the acetyl-protected QPDT precursor dispersed in KBr. The major in-plane (ip), out-of-plane (op), and acetyl (ac) vibrations are labeled. The directions of phenyl backbone vibrations are illustrated in the cartoon on the right.
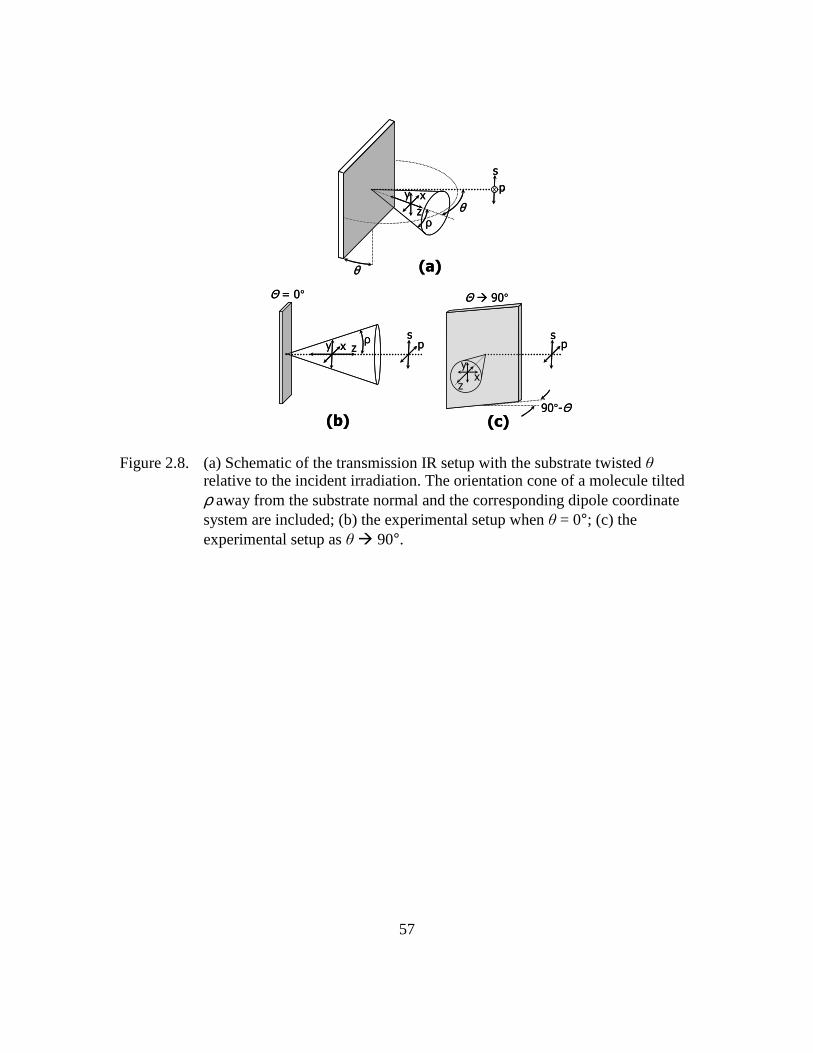
57
s
p
θ
θ
x
z
xy
(a)
(c)
ρ
x zysp
Θ = 0°
(b)
ρ
xz
y
sp
Θ 90°
90°-Θ
s
p
θ
θ
x
z
xy
(a)
(c)
ρ
x zysp
Θ = 0°
(b)
ρ
xz
y
sp
Θ 90°
90°-Θ
Figure 2.8. (a) Schematic of the transmission IR setup with the substrate twisted θ relative to the incident irradiation. The orientation cone of a molecule tilted ρ away from the substrate normal and the corresponding dipole coordinate system are included; (b) the experimental setup when θ = 0°; (c) the experimental setup as θ 90°.

58
1500 850 800
25O
45O
65O
Wavenumber (cm-1)
Intensity (AU)
op
ip
(a)
1500 850 800
25O
45O
65O
Wavenumber (cm-1)
Intensity (AU)
op
ip
(a)
Figure 2.9. Transmission IR spectra of a QPDT assembly on GaAs acquired at varying incident angles, θ, using s-polarized light.
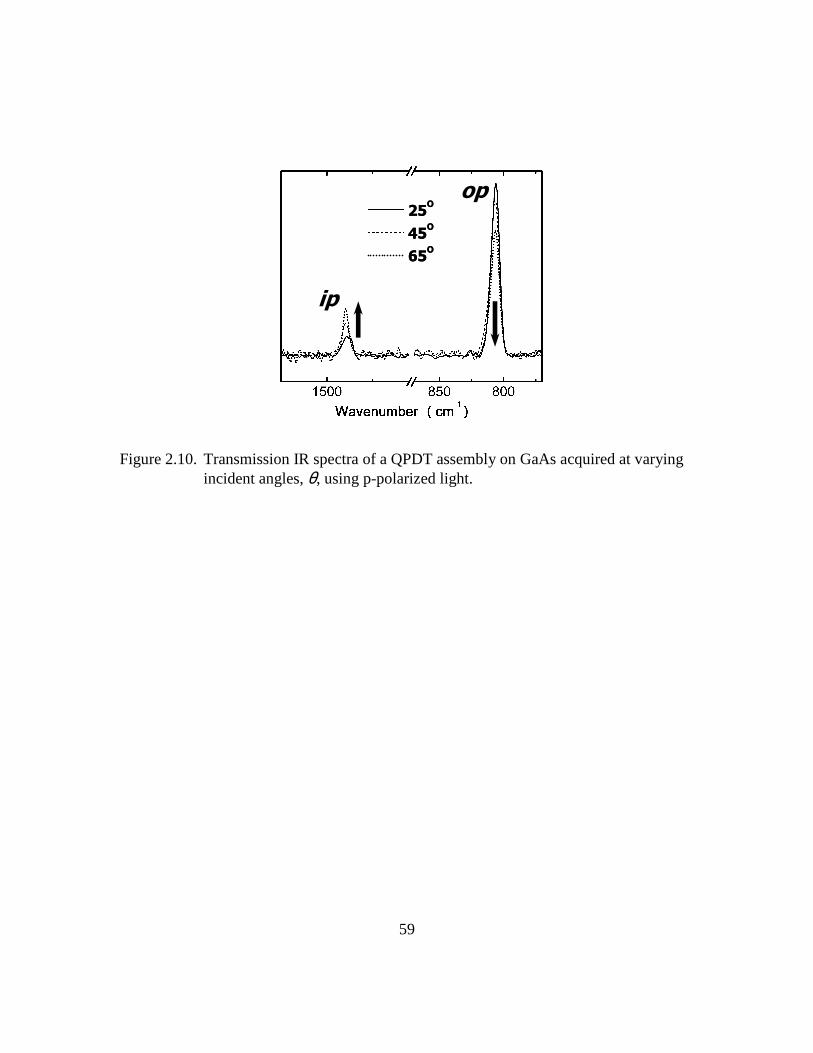
59
25O
45O
65O
25O
45O
65O
ip
op
Figure 2.10. Transmission IR spectra of a QPDT assembly on GaAs acquired at varying incident angles, θ, using p-polarized light.
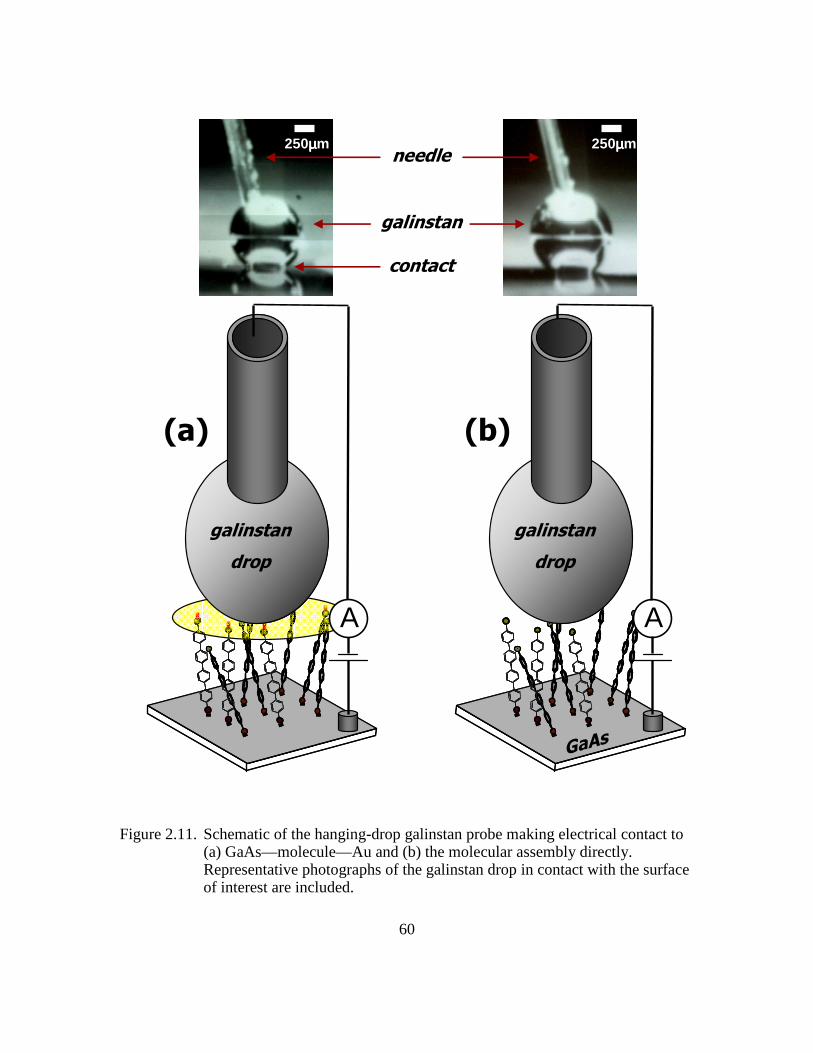
60
GaAs
galinstan
drop
A
galinstan
drop
A
galinstan
contact
needle250µµµµm 250µµµµm
(a) (b)
Figure 2.11. Schematic of the hanging-drop galinstan probe making electrical contact to (a) GaAs—molecule—Au and (b) the molecular assembly directly. Representative photographs of the galinstan drop in contact with the surface of interest are included.

61
REFERENCES
1. Loo, Y.-L.; Hsu, J. W. P.; Willett, R. L.; Baldwin, K. W.; West, K. W.; Rogers, J. A. Journal of Vacuum Science & Technology B 2002, 20, 2853.
2. Loo, Y.-L.; Lang, D. V.; Rogers, J. A.; Hsu, J. W. P. Nano Letters 2003, 3, 913.
3. Loo, Y.-L.; Willett, R. L.; Baldwin, K. W.; Rogers, J. A. Journal of the American Chemical Society 2002, 124, 7654.
4. Loo, Y.-L.; Willett, R. L.; Baldwin, K. W.; Rogers, J. A. Applied Physics Letters 2002, 81, 562.
5. Pinchart, A.; Dallaire, C.; Van Bierbeek, A.; Gingras, M. Tetrahedron Letters 1999, 40, 5479.
6. Kang, J. F.; Ulman, A.; Liao, S.; Jordan, R.; Yang, G.; Liu, G.-Y. Langmuir 2001, 17, 95.
7. Tour, J. M.; Jones, L.; Pearson, D. L.; Lamba, J. J. S.; Burgin, T. P.; Whitesides, G. M.; Allara, D. L.; Parikh, A. N.; Atre, S. Journal of the American Chemical Society 1995, 117, 9529.
8. Pearson, D. L.; Tour, J. M. Journal of Organic Chemistry 1997, 62, 1376.
9. de Boer, B.; Meng, H.; Perepichka, D. F.; Zheng, J.; Frank, M. M.; Chabal, Y. J.; Bao, Z. Langmuir 2003, 19, 4272.
10. Krapchetov, D. A.; Ma, H.; Jen, A. K. Y.; Fischer, D. A.; Loo, Y.-L. Langmuir 2005, 21, 5887.
11. Krapchetov, D. A.; Ma, H.; Jen, A. K. Y.; Fischer, D. A.; Loo, Y.-L. Langmuir 2008, 24, 851.
12. Jun, Y.; Zhu, X. Y.; Hsu, J. W. P. Langmuir 2006, 22, 3627.
13. Weckenmann, U.; Mittler, S.; Naumann, K.; Fischer, R. A. Langmuir 2002, 18, 5479.
14. Xia, Y.; Whitesides, G. M. Angewandte Chemie 1998, 37, 550.
15. Kumar, A.; Whitesides, G. M. Applied Physics Letters 1993, 63, 2002.
62
16. Xia, Y.; Rogers, J. A.; Paul, K. E.; Whitesides, G. M. Chemical Reviews 1999, 99, 1823.
17. Hsu, J. W. P.; Loo, Y. L.; Lang, D. V.; Rogers, J. A. Journal of Vacuum Science & Technology B 2003, 21, 1928.
18. Felmet, K.; Loo, Y.-L.; Sun, Y. Applied Physics Letters 2004, 85, 3316.
19. Shimizu, K. T.; Fabbri, J. D.; Jelincic, J. J.; Melosh, N. A. Advanced Materials 2006, 18, 1499.
20. Vilan, A.; Cahen, D. Advanced Functional Materials 2002, 12, 795.
21. Lide, D. R., CRC Handbook of Chemistry and Physics. CRC Press: Boca Raton, FL, 1994.
22. Stohr, J.; Outka, D. A. Physical Review B 1987, 36, 7891.
23. Detailed information on the NIST/Dow Soft X-Ray Materials Characterization Facility at NSLS BNL see: http://www.nsls.bnl.gov/newsroom/publications/newsletters/1996/96-nov.pdf
24. Genzer, J.; Kramer, E. J.; Fischer, D. A. Journal of Applied Physics 2002, 92, 7070.
25. Genzer, J.; Sivaniah, E.; Kramer, E. J.; Wang, J.; Koerner, H.; Char, K.; Ober, C. K.; DeKoven, B. M.; Bubeck, R. A.; Fischer, D. A.; Sambasivan, S. Langmuir 2000, 16, 1993.
26. Fischer, D. A.; Efimenko, K.; Bhat, R. R.; Sambasivan, S.; Genzer, J. Macromolecular Rapid Communications 2004, 25, 141.
27. Stohr, J., NEXAFS Spectroscopy. Springer: Berlin, 1992, p 158.
28. Shaporenko, A.; Adlkofer, K.; Johansson, L. S. O.; Ulman, A.; Grunze, M.; Tanaka, M.; Zharnikov, M. Journal of Physical Chemistry B 2004, 108, 17964.
29. Banerjee, S.; Hemraj-Benny, T.; Sambasivan, S.; Fischer, D. A.; Misewich, J. A.; Wong, S. S. Journal of Physical Chemistry B 2005, 109, 8489.
30. Kinzler, M.; Schertel, A.; Haehner, G.; Woell, C.; Grunze, M.; Albrecht, H.; Holzhueter, G.; Gerber, T. Journal of Chemical Physics 1994, 100, 7722.
31. Outka, D. A.; Stoehr, J.; Rabe, J. P.; Swalen, J. D. Journal of Chemical Physics 1988, 88, 4076.

63
32. Frey, S.; Stadler, V.; Heister, K.; Eck, W.; Zharnikov, M.; Grunze, M.; Zeysing, B.; Terfort, A. Langmuir 2001, 17, 2408.
33. Himmel, H.-J.; Terfort, A.; Woell, C. Journal of the American Chemical Society 1998, 120, 12069.
34. Trotter, J. Acta Crystallographica 1961, 14, 1135.
35. Shaporenko, A.; Adlkofer, K.; Johansson, L. S. O.; Tanaka, M.; Zharnikov, M. Langmuir 2003, 19, 4992.
36. Corish, J.; Morton-Blake, D. A.; O'Donoghue, F.; Baudour, J. L.; Beniere, F.; Toudic, B. Theochem 1995, 358, 29.
37. Cailleau, H.; Baudour, J. L.; Zeyen, C. M. E. Acta Crystallographica, Section B: Structural Crystallography and Crystal Chemistry 1979, B35, 426.
38. Baudour, J. L.; Delugeard, Y.; Rivet, P. Acta Crystallographica, Section B: Structural Crystallography and Crystal Chemistry 1978, B34, 625.
39. Stapleton, J. J.; Harder, P.; Daniel, T. A.; Reinard, M. D.; Yao, Y.; Price, D. W.; Tour, J. M.; Allara, D. L. Langmuir 2003, 19, 8245.
40. Hacker, C. A.; Batteas, J. D.; Garno, J. C.; Marquez, M.; Richter, C. A.; Richter, L. J.; Van Zee, R. D.; Zangmeister, C. D. Langmuir 2004, 20, 6195.
41. Nuzzo, R. G.; Dubois, L. H.; Allara, D. L. Journal of the American Chemical Society 1990, 112, 558.
42. Niklewski, A.; Azzam, W.; Strunskus, T.; Fischer, R. A.; Woell, C. Langmuir 2004, 20, 8620.
43. Krapchetov, D. A.; Ma, H.; Jen, A. K. Y.; Fischer, D. A.; Loo, Y.-L. Langmuir 2006, 22, 9491.
44. Tolstoy, V. P.; Chernyshova, I. V.; Skryshevsky, V. A., Handbook of Infrared Spectroscopy of Ultrathin Films. John Wiley & Sons, Inc.: 2003, pp 82-87.
45. Lebedev, M. V.; Mayer, T.; Jaegermann, W. Surface Science 2003, 547, 171.
46. Cranstoun Stephen, D.; Ombao Hernando, C.; von Sachs, R.; Guo, W.; Litt, B. IEEE Transactions on Bio-Medical Engineering 2002, 49, 988.
47. Maoz, R.; Sagiv, J.; Degenhardt, D.; Moehwald, H.; Quint, P. Supramolecular Science 1995, 2, 9.
64
48. Sheen, C. W.; Shi, J. X.; Maartensson, J.; Parikh, A. N.; Allara, D. L. Journal of the American Chemical Society 1992, 114, 1514.
49. Collins, R. W.; Kim, Y. T. Analytical Chemistry 1990, 62, 887A.
50. Nesher, G.; Vilan, A.; Cohen, H.; Cahen, D.; Amy, F.; Chan, C.; Hwang, J.; Kahn, A. Journal of Physical Chemistry B 2006, 110, 14363.
51. Shi, J.; Hong, B.; Parikh, A. N.; Collins, R. W.; Allara, D. L. Chemical Physics Letters 1995, 246, 90.
52. Shaporenko, A.; Elbing, M.; Blaszczyk, A.; Von Haenisch, C.; Mayor, M.; Zharnikov, M. Journal of Physical Chemistry B 2006, 110, 4307.
53. Heister, K.; Zharnikov, M.; Grunze, M.; Johansson, L. S. O. Journal of Physical Chemistry B 2001, 105, 4058.
54. Chaki, N. K.; Vijayamohanan, K. Biosensors & Bioelectronics 2002, 17, 1.
55. Zharnikov, M.; Grunze, M. Journal of Physics: Condensed Matter 2001, 13, 11333.
56. Tai, Y.; Shaporenko, A.; Rong, H. T.; Buck, M.; Eck, W.; Grunze, M.; Zharnikov, M. Journal of Physical Chemistry B 2004, 108, 16806.
57. Moulder, J. F.; Stickle, W. E.; Sobol, P. E.; Bomben, K. D., Handbook of X-ray Photoelectron Spectroscopy. Perkin-Elmer Corp.: Eden Prairie, MN: 1992, p 60.
58. Shirley, D. A. Physical Review B 1972, [3]5 , 4709.
59. Aronniemi, M.; Sainio, J.; Lahtinen, J. Surface Science 2005, 578, 108.
60. Surmann, P.; Zeyat, H. Analytical and Bioanalytical Chemistry 2005, 383, 1009.
65
Chapter 3: The Effect of Solvent Quality on the Structure of BPDT,
TPDT, and QPDT Assemblies on Au and GaAs
Extensive structural characterization of alkylthiol molecular assemblies on
coinage metal and GaAs surfaces has been reported.1-10 Alkylthiols are most commonly
assembled from EtOH,1 and their final structures are sensitive to the quality of the
solvent.11 In general, when assembled from EtOH solutions, alkylthiols with backbones
that consist of more than 12 methylene units9,12,13 tend to form ordered molecular
assemblies on Au,1-4 Ag,1,4,5 and GaAs1,6-10 with preferentially upright orientation.
Assemblies of alkylthiols with backbones consisting of less than 12 methylene units tend
to be disordered.1 In special cases, such as deposition in vacuum from the gas phase,14 a
preferentially upright orientation has been directly observed for alkylthiols with
backbones as short as 4 methylene units.14 The trend of increasingly upright molecular
orientation with increasing alkyl backbone length is commonly attributed to the increase
in Van der Waals intermolecular interactions between methylene units in neighboring
chains.1
In contrast to their monofunctional counterparts, the assembly of alkyldithiols –
symmetric alkane molecules with thiol termination on both ends – appears to be more
sensitive to assembly conditions. For instance, it has been demonstrated by direct
imaging that both 1,6-hexanedithiol15 and 1,8-octanedithiol16 generally lie flat on the
substrate surface when assembled on Au at low adsorbate exposures from the gas phase.
This preferential orientation is attributed to the strong interactions between the substrate
and thiol groups at both ends of the molecule.15,16 When assembled from EtOH solutions
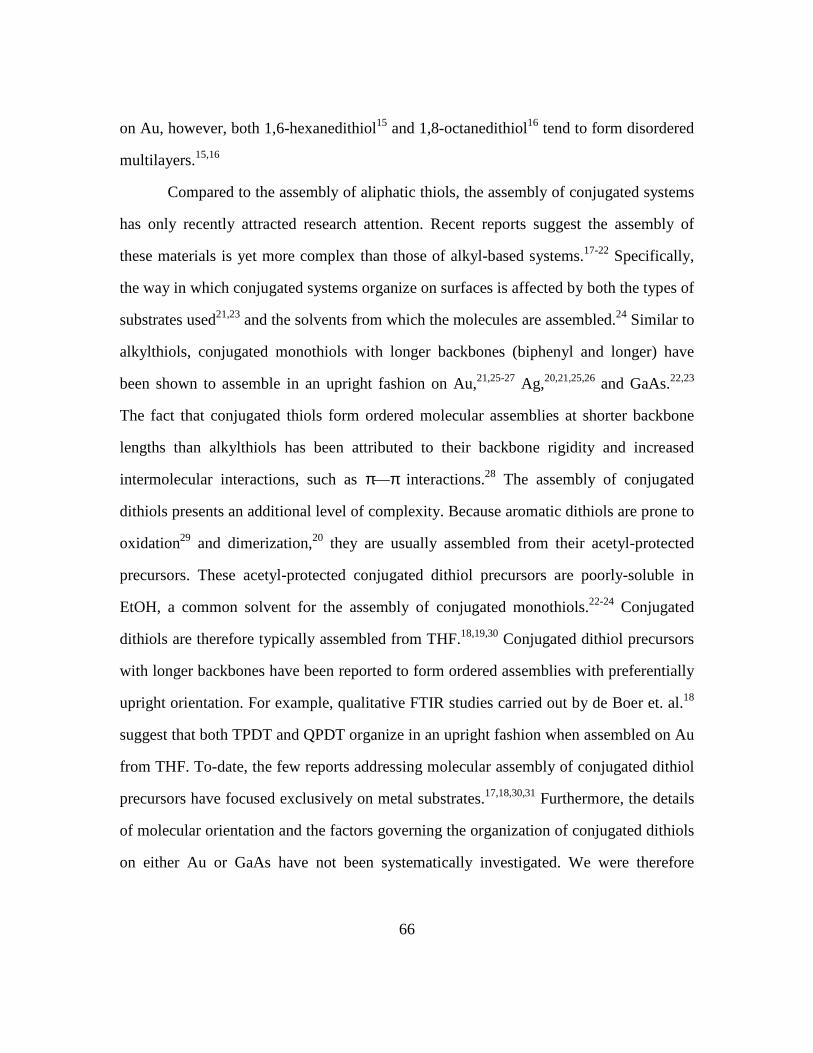
66
on Au, however, both 1,6-hexanedithiol15 and 1,8-octanedithiol16 tend to form disordered
multilayers.15,16
Compared to the assembly of aliphatic thiols, the assembly of conjugated systems
has only recently attracted research attention. Recent reports suggest the assembly of
these materials is yet more complex than those of alkyl-based systems.17-22 Specifically,
the way in which conjugated systems organize on surfaces is affected by both the types of
substrates used21,23 and the solvents from which the molecules are assembled.24 Similar to
alkylthiols, conjugated monothiols with longer backbones (biphenyl and longer) have
been shown to assemble in an upright fashion on Au,21,25-27 Ag,20,21,25,26 and GaAs.22,23
The fact that conjugated thiols form ordered molecular assemblies at shorter backbone
lengths than alkylthiols has been attributed to their backbone rigidity and increased
intermolecular interactions, such as π—π interactions.28 The assembly of conjugated
dithiols presents an additional level of complexity. Because aromatic dithiols are prone to
oxidation29 and dimerization,20 they are usually assembled from their acetyl-protected
precursors. These acetyl-protected conjugated dithiol precursors are poorly-soluble in
EtOH, a common solvent for the assembly of conjugated monothiols.22-24 Conjugated
dithiols are therefore typically assembled from THF.18,19,30 Conjugated dithiol precursors
with longer backbones have been reported to form ordered assemblies with preferentially
upright orientation. For example, qualitative FTIR studies carried out by de Boer et. al.18
suggest that both TPDT and QPDT organize in an upright fashion when assembled on Au
from THF. To-date, the few reports addressing molecular assembly of conjugated dithiol
precursors have focused exclusively on metal substrates.17,18,30,31 Furthermore, the details
of molecular orientation and the factors governing the organization of conjugated dithiols
on either Au or GaAs have not been systematically investigated. We were therefore
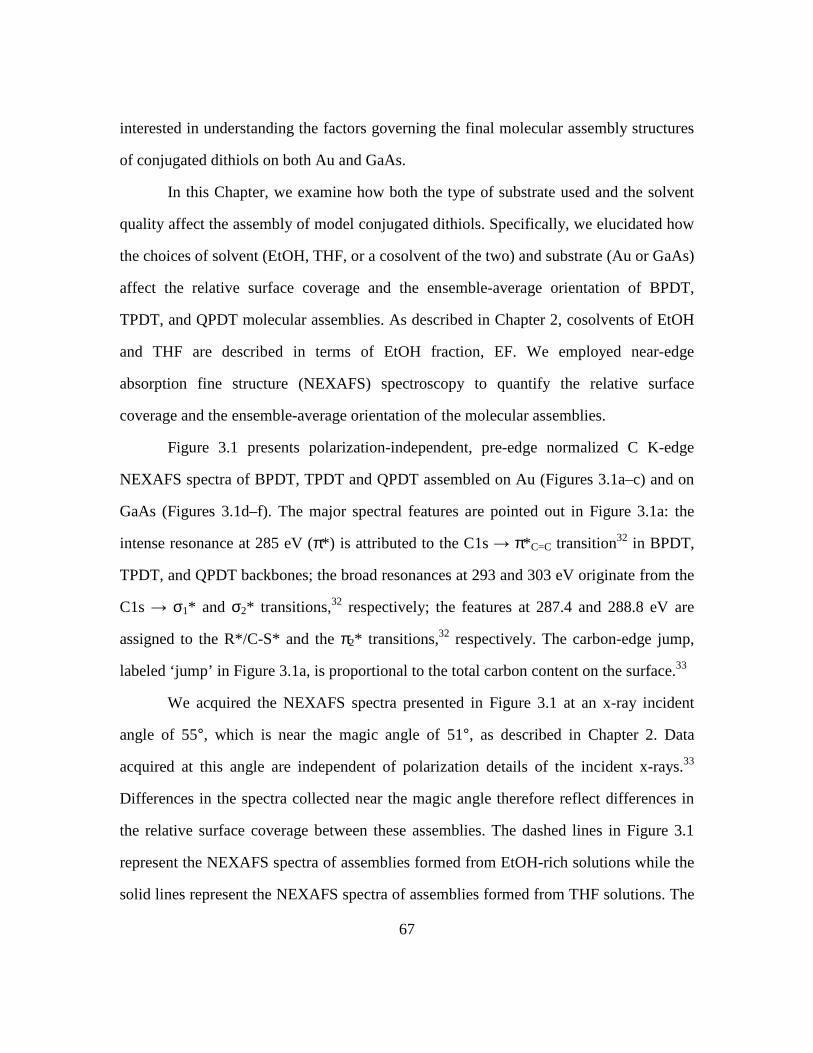
67
interested in understanding the factors governing the final molecular assembly structures
of conjugated dithiols on both Au and GaAs.
In this Chapter, we examine how both the type of substrate used and the solvent
quality affect the assembly of model conjugated dithiols. Specifically, we elucidated how
the choices of solvent (EtOH, THF, or a cosolvent of the two) and substrate (Au or GaAs)
affect the relative surface coverage and the ensemble-average orientation of BPDT,
TPDT, and QPDT molecular assemblies. As described in Chapter 2, cosolvents of EtOH
and THF are described in terms of EtOH fraction, EF. We employed near-edge
absorption fine structure (NEXAFS) spectroscopy to quantify the relative surface
coverage and the ensemble-average orientation of the molecular assemblies.
Figure 3.1 presents polarization-independent, pre-edge normalized C K-edge
NEXAFS spectra of BPDT, TPDT and QPDT assembled on Au (Figures 3.1a–c) and on
GaAs (Figures 3.1d–f). The major spectral features are pointed out in Figure 3.1a: the
intense resonance at 285 eV (π*) is attributed to the C1s → π*C=C transition32 in BPDT,
TPDT, and QPDT backbones; the broad resonances at 293 and 303 eV originate from the
C1s → σ1* and σ2* transitions,32 respectively; the features at 287.4 and 288.8 eV are
assigned to the R*/C-S* and the π2* transitions,32 respectively. The carbon-edge jump,
labeled ‘jump’ in Figure 3.1a, is proportional to the total carbon content on the surface.33
We acquired the NEXAFS spectra presented in Figure 3.1 at an x-ray incident
angle of 55°, which is near the magic angle of 51°, as described in Chapter 2. Data
acquired at this angle are independent of polarization details of the incident x-rays.33
Differences in the spectra collected near the magic angle therefore reflect differences in
the relative surface coverage between these assemblies. The dashed lines in Figure 3.1
represent the NEXAFS spectra of assemblies formed from EtOH-rich solutions while the
solid lines represent the NEXAFS spectra of assemblies formed from THF solutions. The
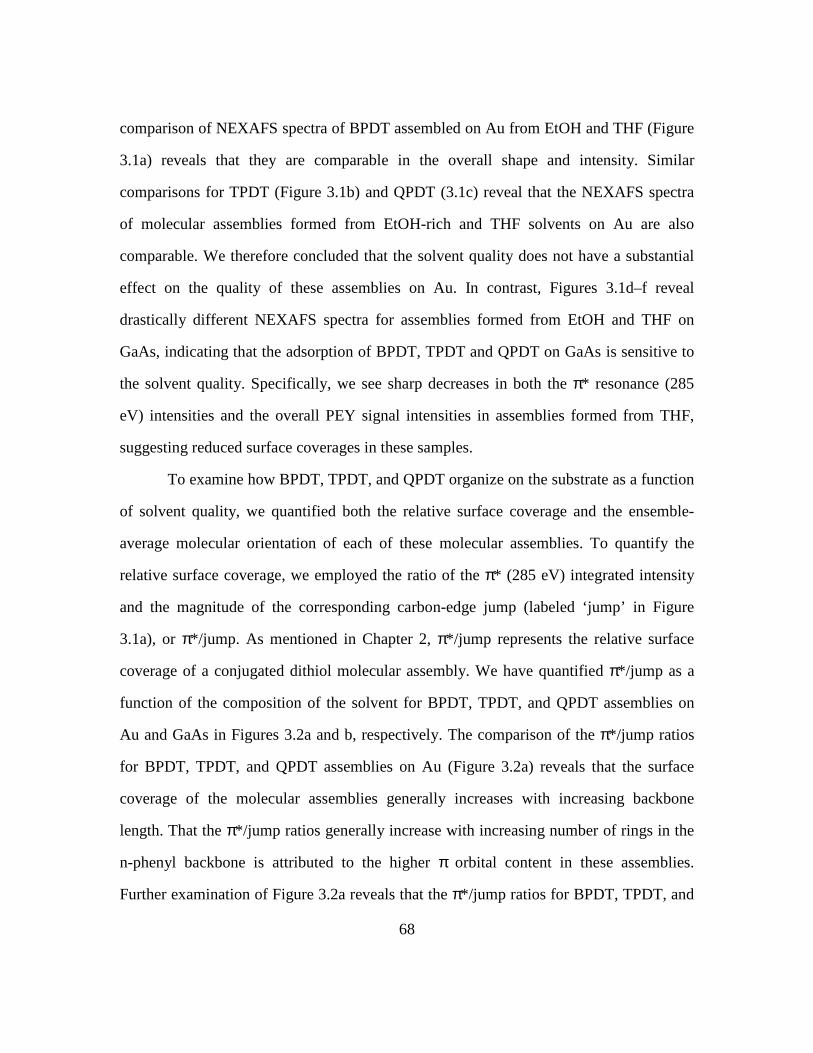
68
comparison of NEXAFS spectra of BPDT assembled on Au from EtOH and THF (Figure
3.1a) reveals that they are comparable in the overall shape and intensity. Similar
comparisons for TPDT (Figure 3.1b) and QPDT (3.1c) reveal that the NEXAFS spectra
of molecular assemblies formed from EtOH-rich and THF solvents on Au are also
comparable. We therefore concluded that the solvent quality does not have a substantial
effect on the quality of these assemblies on Au. In contrast, Figures 3.1d–f reveal
drastically different NEXAFS spectra for assemblies formed from EtOH and THF on
GaAs, indicating that the adsorption of BPDT, TPDT and QPDT on GaAs is sensitive to
the solvent quality. Specifically, we see sharp decreases in both the π* resonance (285
eV) intensities and the overall PEY signal intensities in assemblies formed from THF,
suggesting reduced surface coverages in these samples.
To examine how BPDT, TPDT, and QPDT organize on the substrate as a function
of solvent quality, we quantified both the relative surface coverage and the ensemble-
average molecular orientation of each of these molecular assemblies. To quantify the
relative surface coverage, we employed the ratio of the π* (285 eV) integrated intensity
and the magnitude of the corresponding carbon-edge jump (labeled ‘jump’ in Figure
3.1a), or π*/jump. As mentioned in Chapter 2, π*/jump represents the relative surface
coverage of a conjugated dithiol molecular assembly. We have quantified π*/jump as a
function of the composition of the solvent for BPDT, TPDT, and QPDT assemblies on
Au and GaAs in Figures 3.2a and b, respectively. The comparison of the π*/jump ratios
for BPDT, TPDT, and QPDT assemblies on Au (Figure 3.2a) reveals that the surface
coverage of the molecular assemblies generally increases with increasing backbone
length. That the π*/jump ratios generally increase with increasing number of rings in the
n-phenyl backbone is attributed to the higher π orbital content in these assemblies.
Further examination of Figure 3.2a reveals that the π*/jump ratios for BPDT, TPDT, and
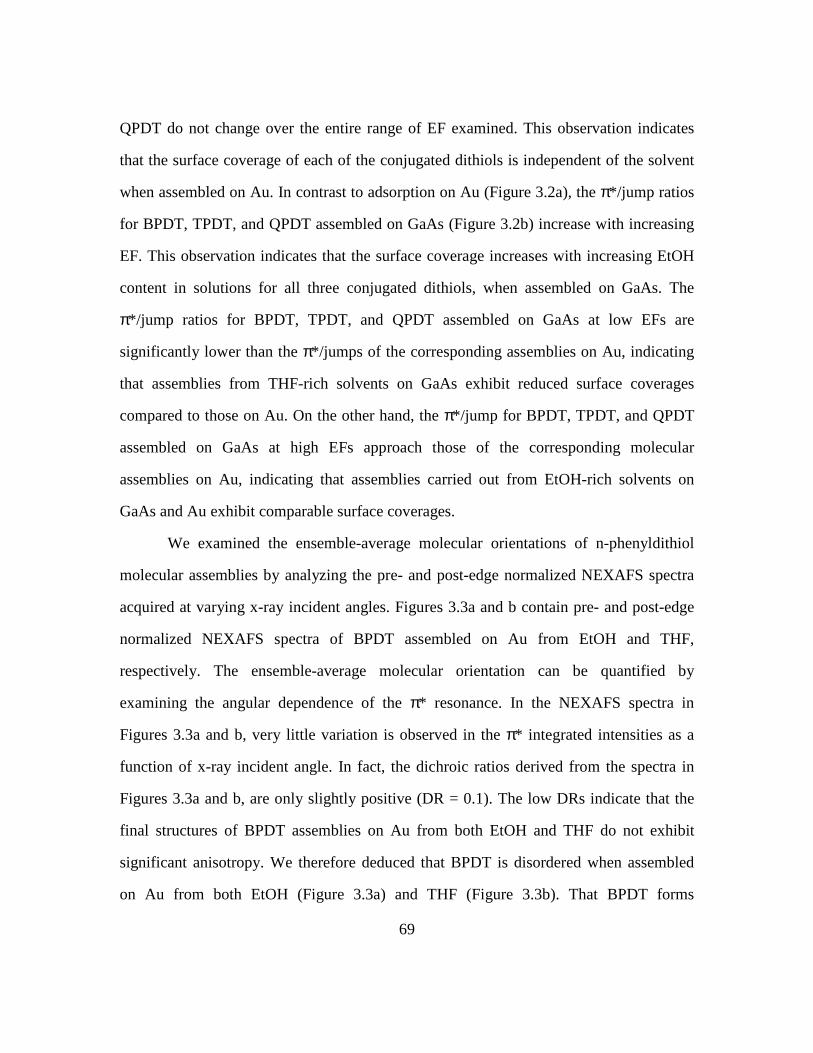
69
QPDT do not change over the entire range of EF examined. This observation indicates
that the surface coverage of each of the conjugated dithiols is independent of the solvent
when assembled on Au. In contrast to adsorption on Au (Figure 3.2a), the π*/jump ratios
for BPDT, TPDT, and QPDT assembled on GaAs (Figure 3.2b) increase with increasing
EF. This observation indicates that the surface coverage increases with increasing EtOH
content in solutions for all three conjugated dithiols, when assembled on GaAs. The
π*/jump ratios for BPDT, TPDT, and QPDT assembled on GaAs at low EFs are
significantly lower than the π*/jumps of the corresponding assemblies on Au, indicating
that assemblies from THF-rich solvents on GaAs exhibit reduced surface coverages
compared to those on Au. On the other hand, the π*/jump for BPDT, TPDT, and QPDT
assembled on GaAs at high EFs approach those of the corresponding molecular
assemblies on Au, indicating that assemblies carried out from EtOH-rich solvents on
GaAs and Au exhibit comparable surface coverages.
We examined the ensemble-average molecular orientations of n-phenyldithiol
molecular assemblies by analyzing the pre- and post-edge normalized NEXAFS spectra
acquired at varying x-ray incident angles. Figures 3.3a and b contain pre- and post-edge
normalized NEXAFS spectra of BPDT assembled on Au from EtOH and THF,
respectively. The ensemble-average molecular orientation can be quantified by
examining the angular dependence of the π* resonance. In the NEXAFS spectra in
Figures 3.3a and b, very little variation is observed in the π* integrated intensities as a
function of x-ray incident angle. In fact, the dichroic ratios derived from the spectra in
Figures 3.3a and b, are only slightly positive (DR = 0.1). The low DRs indicate that the
final structures of BPDT assemblies on Au from both EtOH and THF do not exhibit
significant anisotropy. We therefore deduced that BPDT is disordered when assembled
on Au from both EtOH (Figure 3.3a) and THF (Figure 3.3b). That BPDT forms

70
disordered molecular assemblies on Au is in contrast with the case of biphenylthiol (1
thiol end group as opposed to two) assembled on Au. Specifically, biphenylthiol has been
reported to form preferentially upright molecular assemblies on Au with an ensemble-
average tilt angle of ≈23° away from the substrate normal.21 We speculate that this
difference in adsorption of BPDT relative to that of biphenylthiol may stem from
differences in interactions between molecules during adsorption. For instance, thiolate
groups have the tendency to interact with each other in solution.20 The interaction
between the additional functional groups in BPDT may compete with the molecule-
substrate interactions during the adsorption process and thus affect the resulting
molecular orientation. Furthermore, the additional functional group of BPDT is likely
result in additional interactions at the molecular assembly surface, thus impacting the
molecular orientation. For example, the interactions between COOH functional groups in
COOH-terminated biphenylthiol molecular assemblies are believed to be responsible for
the less upright molecular orientation of these assemblies compared to those of
unsubstituted biphenylthiol.23
We also carried out orientation analysis of TPDT and QPDT assemblies on Au.
Figures 3.4a and b contain angle-dependent NEXAFS spectra of TPDT assembled on Au
from EtOH and THF, respectively. In these spectra, the π* resonance intensifies with
increasing x-ray incident angle. Concomitantly, the σ* resonances subside with
increasing x-ray incident angle. The angular dependence of the resonance intensities is
emphasized by the difference spectra, I(θ) – I(20°), included in lower portions of the
same figures. According to the NEXAFS selection rules described in Chapter 2, the
trends of π* resonance intensifying and σ* resonances subsiding with increasing x-ray
incident angle indicates that the TPDT molecules are oriented preferentially upright on
Au surface.
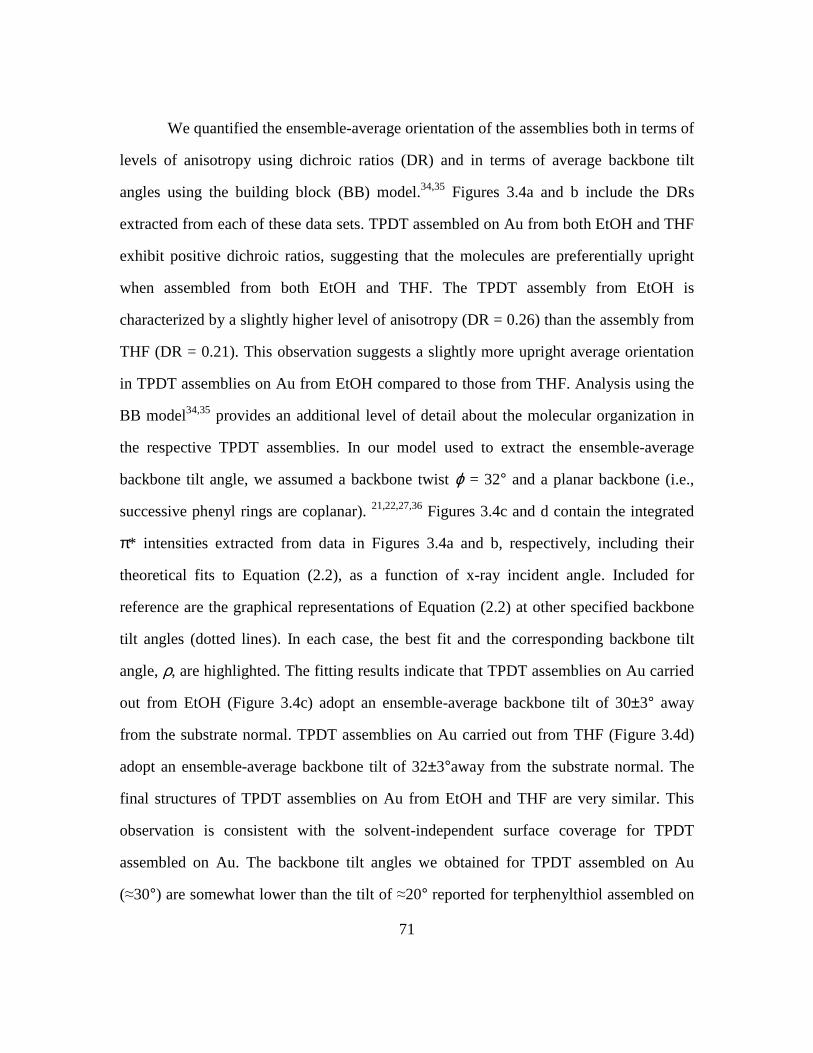
71
We quantified the ensemble-average orientation of the assemblies both in terms of
levels of anisotropy using dichroic ratios (DR) and in terms of average backbone tilt
angles using the building block (BB) model.34,35 Figures 3.4a and b include the DRs
extracted from each of these data sets. TPDT assembled on Au from both EtOH and THF
exhibit positive dichroic ratios, suggesting that the molecules are preferentially upright
when assembled from both EtOH and THF. The TPDT assembly from EtOH is
characterized by a slightly higher level of anisotropy (DR = 0.26) than the assembly from
THF (DR = 0.21). This observation suggests a slightly more upright average orientation
in TPDT assemblies on Au from EtOH compared to those from THF. Analysis using the
BB model34,35 provides an additional level of detail about the molecular organization in
the respective TPDT assemblies. In our model used to extract the ensemble-average
backbone tilt angle, we assumed a backbone twist ϕ = 32° and a planar backbone (i.e.,
successive phenyl rings are coplanar). 21,22,27,36 Figures 3.4c and d contain the integrated
π* intensities extracted from data in Figures 3.4a and b, respectively, including their
theoretical fits to Equation (2.2), as a function of x-ray incident angle. Included for
reference are the graphical representations of Equation (2.2) at other specified backbone
tilt angles (dotted lines). In each case, the best fit and the corresponding backbone tilt
angle, ρ, are highlighted. The fitting results indicate that TPDT assemblies on Au carried
out from EtOH (Figure 3.4c) adopt an ensemble-average backbone tilt of 30±3° away
from the substrate normal. TPDT assemblies on Au carried out from THF (Figure 3.4d)
adopt an ensemble-average backbone tilt of 32±3°away from the substrate normal. The
final structures of TPDT assemblies on Au from EtOH and THF are very similar. This
observation is consistent with the solvent-independent surface coverage for TPDT
assembled on Au. The backbone tilt angles we obtained for TPDT assembled on Au
(≈30°) are somewhat lower than the tilt of ≈20° reported for terphenylthiol assembled on
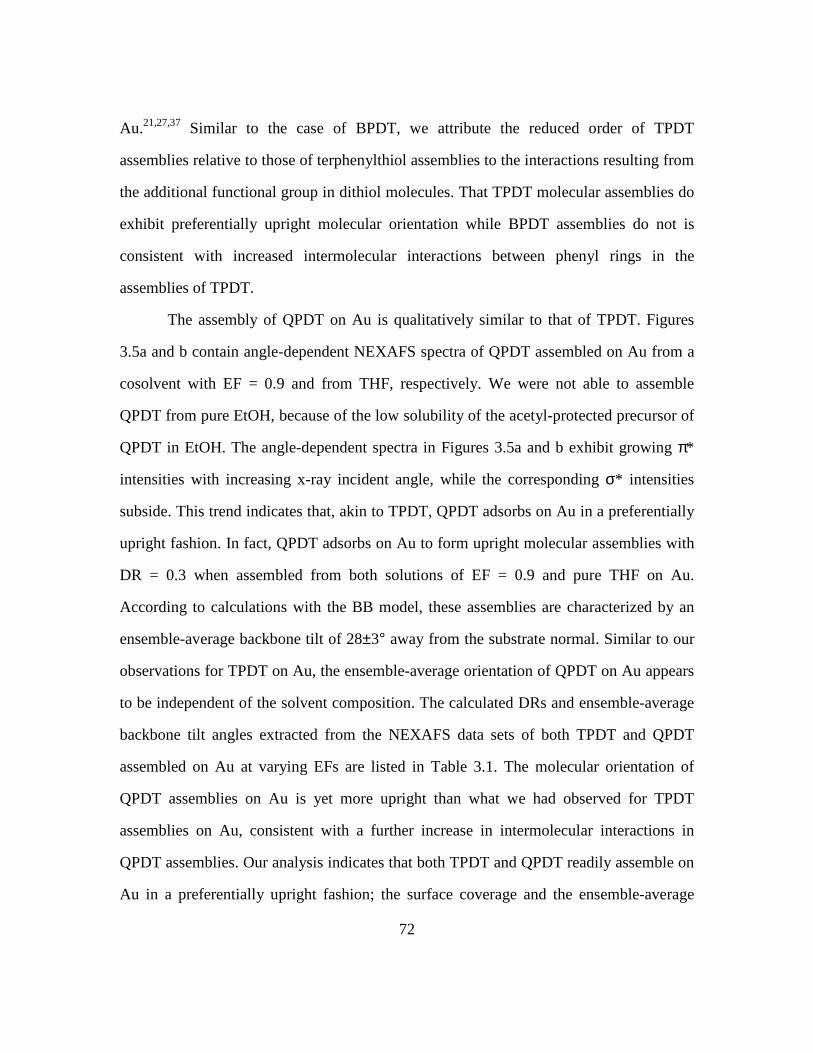
72
Au.21,27,37 Similar to the case of BPDT, we attribute the reduced order of TPDT
assemblies relative to those of terphenylthiol assemblies to the interactions resulting from
the additional functional group in dithiol molecules. That TPDT molecular assemblies do
exhibit preferentially upright molecular orientation while BPDT assemblies do not is
consistent with increased intermolecular interactions between phenyl rings in the
assemblies of TPDT.
The assembly of QPDT on Au is qualitatively similar to that of TPDT. Figures
3.5a and b contain angle-dependent NEXAFS spectra of QPDT assembled on Au from a
cosolvent with EF = 0.9 and from THF, respectively. We were not able to assemble
QPDT from pure EtOH, because of the low solubility of the acetyl-protected precursor of
QPDT in EtOH. The angle-dependent spectra in Figures 3.5a and b exhibit growing π*
intensities with increasing x-ray incident angle, while the corresponding σ* intensities
subside. This trend indicates that, akin to TPDT, QPDT adsorbs on Au in a preferentially
upright fashion. In fact, QPDT adsorbs on Au to form upright molecular assemblies with
DR = 0.3 when assembled from both solutions of EF = 0.9 and pure THF on Au.
According to calculations with the BB model, these assemblies are characterized by an
ensemble-average backbone tilt of 28±3° away from the substrate normal. Similar to our
observations for TPDT on Au, the ensemble-average orientation of QPDT on Au appears
to be independent of the solvent composition. The calculated DRs and ensemble-average
backbone tilt angles extracted from the NEXAFS data sets of both TPDT and QPDT
assembled on Au at varying EFs are listed in Table 3.1. The molecular orientation of
QPDT assemblies on Au is yet more upright than what we had observed for TPDT
assemblies on Au, consistent with a further increase in intermolecular interactions in
QPDT assemblies. Our analysis indicates that both TPDT and QPDT readily assemble on
Au in a preferentially upright fashion; the surface coverage and the ensemble-average
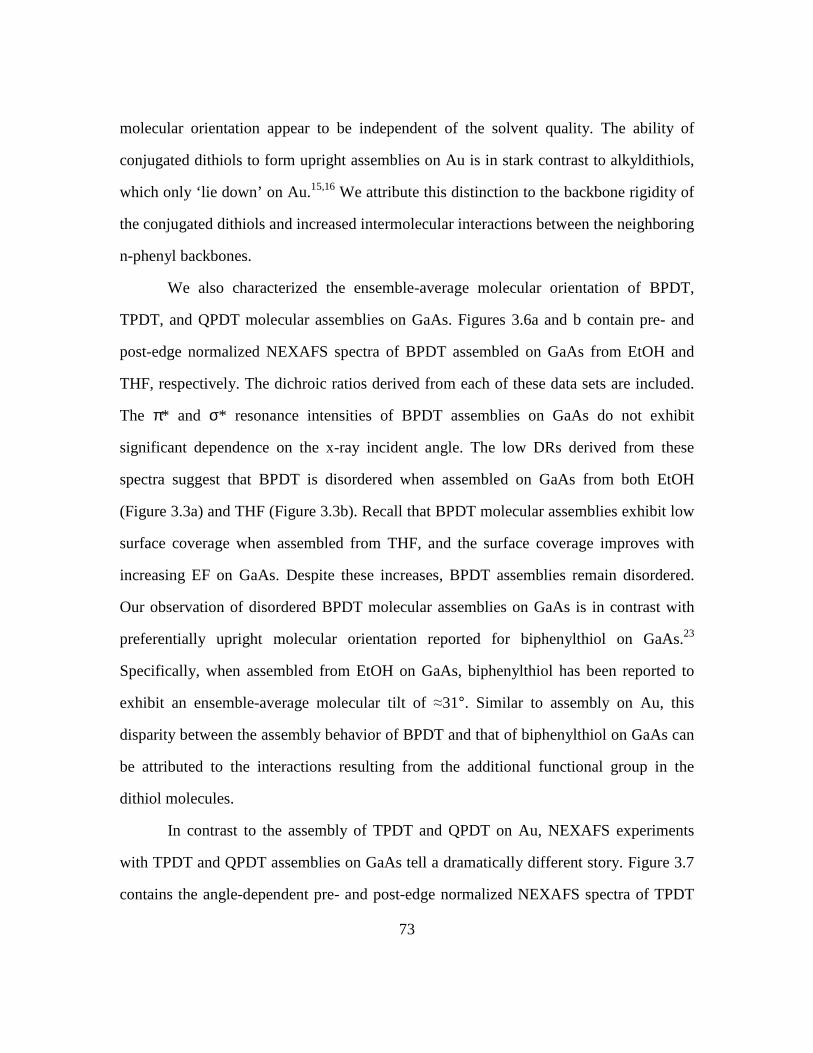
73
molecular orientation appear to be independent of the solvent quality. The ability of
conjugated dithiols to form upright assemblies on Au is in stark contrast to alkyldithiols,
which only ‘lie down’ on Au.15,16 We attribute this distinction to the backbone rigidity of
the conjugated dithiols and increased intermolecular interactions between the neighboring
n-phenyl backbones.
We also characterized the ensemble-average molecular orientation of BPDT,
TPDT, and QPDT molecular assemblies on GaAs. Figures 3.6a and b contain pre- and
post-edge normalized NEXAFS spectra of BPDT assembled on GaAs from EtOH and
THF, respectively. The dichroic ratios derived from each of these data sets are included.
The π* and σ* resonance intensities of BPDT assemblies on GaAs do not exhibit
significant dependence on the x-ray incident angle. The low DRs derived from these
spectra suggest that BPDT is disordered when assembled on GaAs from both EtOH
(Figure 3.3a) and THF (Figure 3.3b). Recall that BPDT molecular assemblies exhibit low
surface coverage when assembled from THF, and the surface coverage improves with
increasing EF on GaAs. Despite these increases, BPDT assemblies remain disordered.
Our observation of disordered BPDT molecular assemblies on GaAs is in contrast with
preferentially upright molecular orientation reported for biphenylthiol on GaAs.23
Specifically, when assembled from EtOH on GaAs, biphenylthiol has been reported to
exhibit an ensemble-average molecular tilt of ≈31°. Similar to assembly on Au, this
disparity between the assembly behavior of BPDT and that of biphenylthiol on GaAs can
be attributed to the interactions resulting from the additional functional group in the
dithiol molecules.
In contrast to the assembly of TPDT and QPDT on Au, NEXAFS experiments
with TPDT and QPDT assemblies on GaAs tell a dramatically different story. Figure 3.7
contains the angle-dependent pre- and post-edge normalized NEXAFS spectra of TPDT

74
assembled on GaAs as a function of EF. The corresponding difference spectra are
included to emphasize changes in the angle dependent π* and σ* resonances as a
function of EF. Unlike TPDT assemblies on Au, the assembly of TPDT on GaAs appears
to be extremely sensitive to the amount of EtOH in solution. In assemblies carried out
from EtOH-rich solvents (Figures 3.7a-c), the π* resonance intensifies at the expense of
the σ* resonances when the x-ray incident angle is increased from 20° to 75°. This angle
dependence and the resulting positive DRs suggest that TPDT assemblies are oriented
preferentially upright. More specifically, analysis with the BB model of the spectra of
TPDT assembled on GaAs from EtOH (Figure 3.7a) shows that these assemblies are
characterized by an ensemble-average backbone tilt angle of 33±3° away from the
substrate normal. In contrast, the assemblies carried out from EtOH-poor solvents exhibit
little change in their respective angle-dependent NEXAFS spectra (Figures 3.7d-f). These
difference spectra exhibit near-zero intensity (DR ≈ 0), suggesting disordered TPDT
assemblies. The dichroic ratios and ensemble-average backbone tilt angles for TPDT
assemblies on GaAs across the EF range are summarized in Table 3.2. The comparison of
these results suggests EtOH to be the optimal solvent for the formation of TPDT
molecular assemblies on GaAs with preferentially upright molecular orientation.
The angle-dependent pre- and post-edge normalized NEXAFS spectra of QPDT
assembled on GaAs as a function of EF are shown in Figure 3.8. The dichroic ratios
derived from each set of spectra are included. Additionally, the dichroic ratios and
ensemble-average backbone tilt angles for QPDT assemblies on GaAs with varying EF
are summarized in Table 3.2. At high EFs (> 0.5), QPDT behaves like TPDT and adopts
a preferentially upright molecular orientation, as suggested by positive DRs. Analysis
with the BB model results in ensemble-average backbone tilt angles of 27±3° and 24±3°
for QPDT assembled on GaAs at EFs of 0.9 (Figure 3.8a) and 0.75 (Figure 3.8b),

75
respectively. Decreasing EF, however, results in assemblies with progressively lower
surface coverage, and these assemblies are largely disordered, as evident from Figures
3.8c and d. That the QPDT forms upright assemblies on GaAs from EtOH-rich solutions
is consistent with increased surface coverage in these assemblies compared to those from
THF. We note that the most upright QPDT assembly on GaAs was achieved at EF = 0.75.
At this solvent composition, the dissolution of the acetyl-protected QPDT precursor is
maximized while the EtOH content is high enough in the solvent to achieve upright final
assembly structure on GaAs.
The solvent dependence of BPDT, TPDT, and QPDT assemblies on GaAs is not
in itself surprising. Indeed, solvent-dependent assembly has been previously reported for
conjugated systems. For instance, Ishida24 reported phase separation when terphenylthiol
was assembled from methylene chloride on Au. When terphenylthiol was assembled from
EtOH, however, ordered and densely-packed structure was observed by scanning
tunneling microscopy. Solvent-dependent assembly has also been reported for alkylthiol
assemblies on Ni. Mekhalif and coworkers38 reported the formation of high-quality
assemblies from a polar solvent, whereas little adsorption occurred from a non polar
solvent. These reports focused on assemblies on metal surfaces. What is surprising, in our
case, is that such a pronounced solvent dependence occurs on GaAs, but not on Au.
While the exact origin of this disparity remains uncertain, we believe it must arise from
differences in solvent-molecule-substrate interactions in the two systems. Specifically, in
the case of assemblies on Au, it is well known that the tendency to form S-Au bonds is
very strong, with exothermic thiolate adsorption (0.3 – 0.5 eV)39,40 resulting in covalent
S-Au bonds of ~1.3 eV.1,41 In fact, so strongly is the formation of S-Au bonds favored
that thioacetyl-terminated molecules can spontaneously adsorb on Au without prior
deprotection by surface-catalyzed cleaving of the acetyl protecting groups.29 The
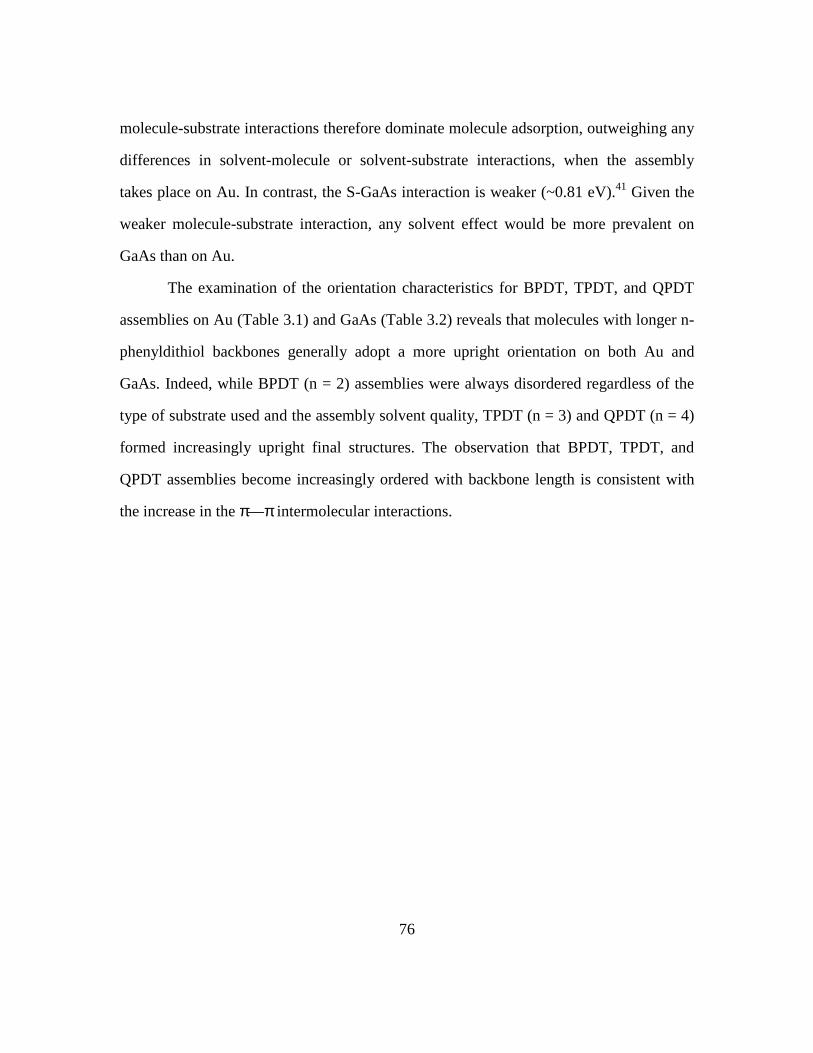
76
molecule-substrate interactions therefore dominate molecule adsorption, outweighing any
differences in solvent-molecule or solvent-substrate interactions, when the assembly
takes place on Au. In contrast, the S-GaAs interaction is weaker (~0.81 eV).41 Given the
weaker molecule-substrate interaction, any solvent effect would be more prevalent on
GaAs than on Au.
The examination of the orientation characteristics for BPDT, TPDT, and QPDT
assemblies on Au (Table 3.1) and GaAs (Table 3.2) reveals that molecules with longer n-
phenyldithiol backbones generally adopt a more upright orientation on both Au and
GaAs. Indeed, while BPDT (n = 2) assemblies were always disordered regardless of the
type of substrate used and the assembly solvent quality, TPDT (n = 3) and QPDT (n = 4)
formed increasingly upright final structures. The observation that BPDT, TPDT, and
QPDT assemblies become increasingly ordered with backbone length is consistent with
the increase in the π—π intermolecular interactions.
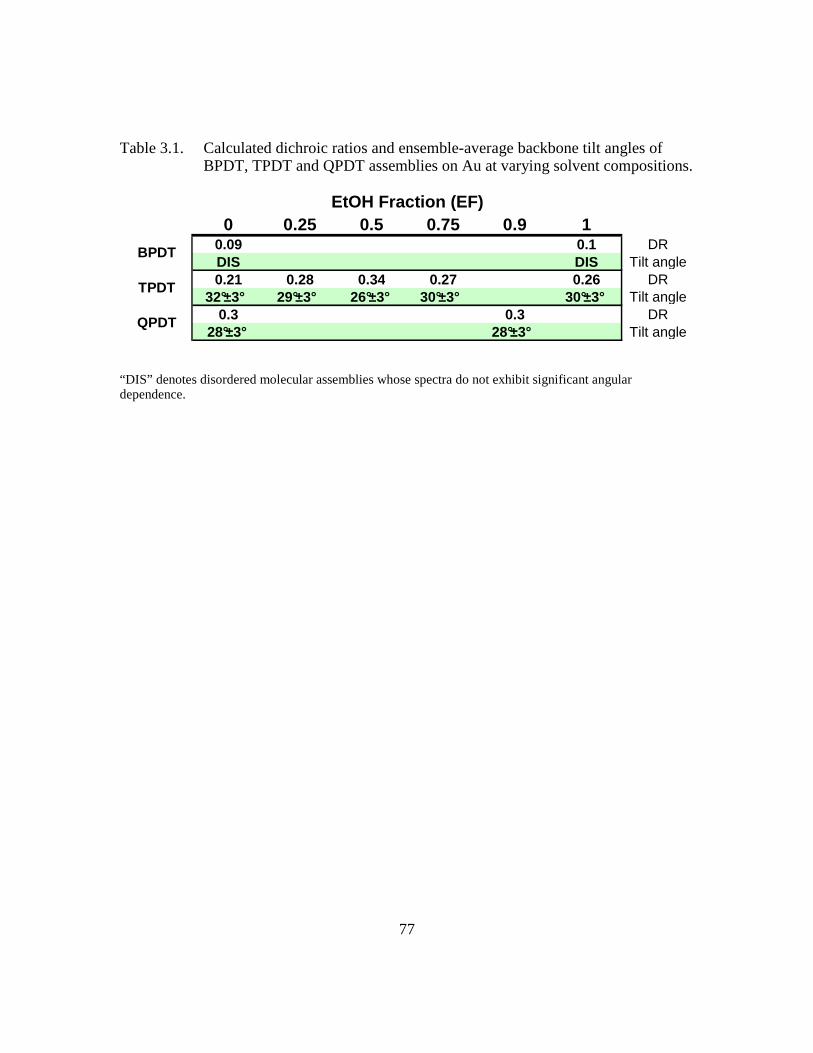
77
Table 3.1. Calculated dichroic ratios and ensemble-average backbone tilt angles of BPDT, TPDT and QPDT assemblies on Au at varying solvent compositions.
0 0.25 0.5 0.75 0.9 10.09 0.1 DRDIS DIS Tilt angle0.21 0.28 0.34 0.27 0.26 DR
32°±3° 29°±3° 26°±3° 30°±3° 30°±3° Tilt angle0.3 0.3 DR
28°±3° 28°±3° Tilt angle
EtOH Fraction (EF)
BPDT
TPDT
QPDT
“DIS” denotes disordered molecular assemblies whose spectra do not exhibit significant angular dependence.

78
Table 3.2. Calculated dichroic ratios and ensemble-average backbone tilt angles of BPDT, TPDT and QPDT assemblies on GaAs at varying solvent compositions.
0 0.25 0.5 0.75 0.9 10.1 0 DRDIS DIS Tilt angle0.07 0.05 0.18 0.17 0.21 DRDIS DIS 35°±3° 35°±3° 33°±3° Tilt angle0.09 0.1 0.37 0.31 DRDIS 39°±3° 24°±3° 27°±3° Tilt angle
EtOH Fraction (EF)
BPDT
TPDT
QPDT
“DIS” denotes disordered molecular assemblies whose spectra do not exhibit significant angular dependence.
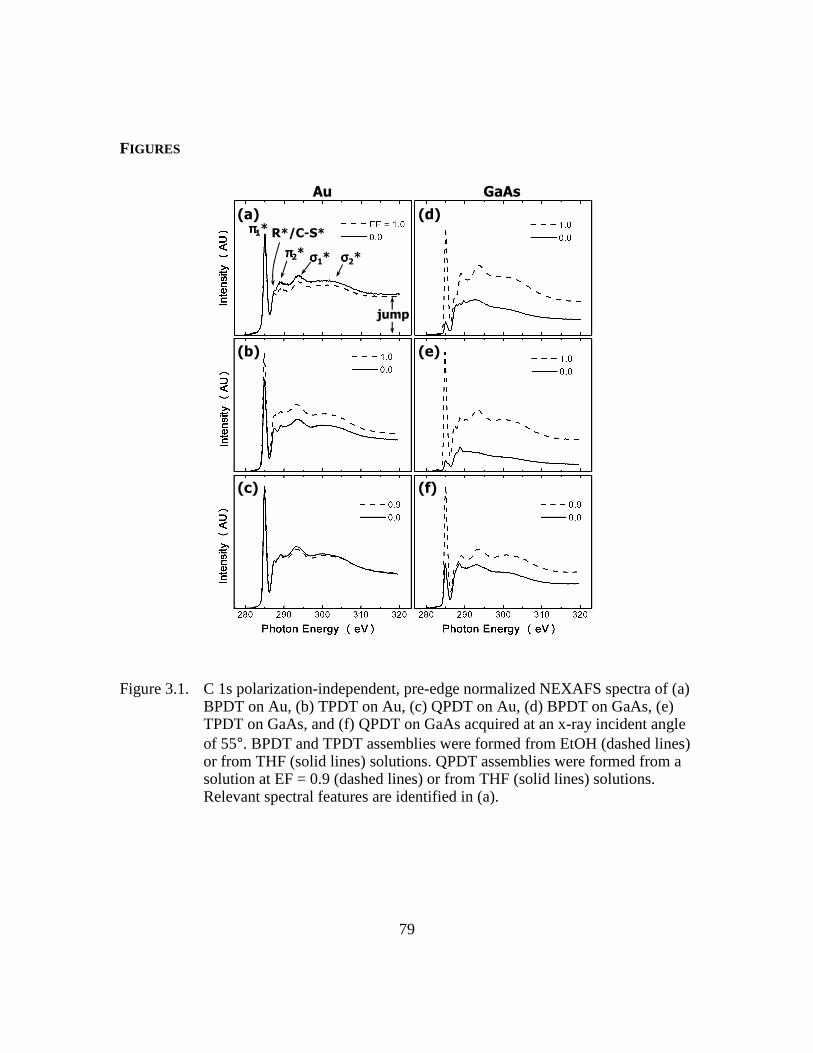
79
FIGURES
(a)
(b)
(c)
(d)
(e)
(f)
Au GaAs
ππππ1*
ππππ2* σσσσ2*σσσσ1*
R*/C-S*
jump
Figure 3.1. C 1s polarization-independent, pre-edge normalized NEXAFS spectra of (a) BPDT on Au, (b) TPDT on Au, (c) QPDT on Au, (d) BPDT on GaAs, (e) TPDT on GaAs, and (f) QPDT on GaAs acquired at an x-ray incident angle of 55°. BPDT and TPDT assemblies were formed from EtOH (dashed lines) or from THF (solid lines) solutions. QPDT assemblies were formed from a solution at EF = 0.9 (dashed lines) or from THF (solid lines) solutions. Relevant spectral features are identified in (a).
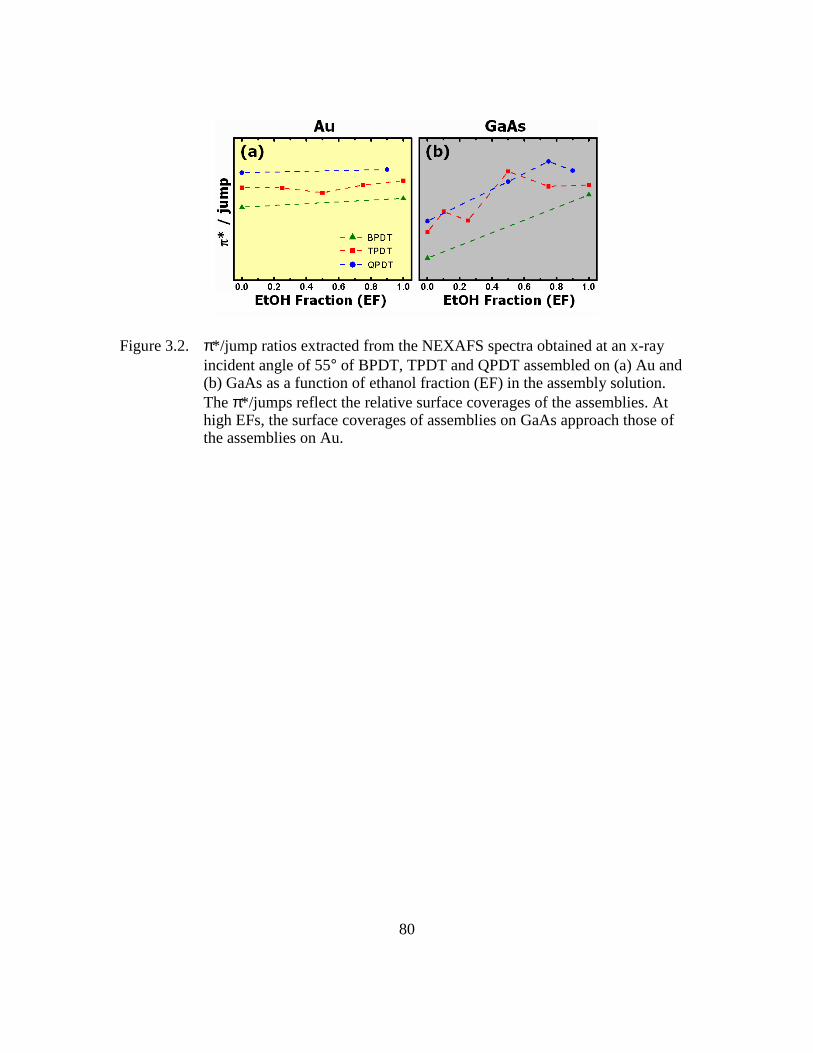
80
Figure 3.2. π*/jump ratios extracted from the NEXAFS spectra obtained at an x-ray incident angle of 55° of BPDT, TPDT and QPDT assembled on (a) Au and (b) GaAs as a function of ethanol fraction (EF) in the assembly solution. The π*/jumps reflect the relative surface coverages of the assemblies. At high EFs, the surface coverages of assemblies on GaAs approach those of the assemblies on Au.

81
(a)
(b)
DR = 0.1
DR = 0.09
Figure 3.3. C 1s angle-dependent, pre- and post-edge normalized NEXAFS spectra of BPDT assembled on Au from (a) EtOH and (b) THF acquired at varying x-ray incident angles. Dichroic ratios derived from each set of spectra are included.

82
Figure 3.4. C 1s angle-dependent, pre- and post-edge normalized NEXAFS spectra of TPDT assembled on Au from (a) EtOH and (b) THF acquired at varying x-ray incident angles. The difference spectra (bottom portions of plots) emphasize angle-dependent spectral features, and are offset from the angle-dependent NEXAFS data sets along the y-axis for clarity. The dichroic ratios derived from each set of spectra are included. The π* integrated intensities extracted from the NEXAFS spectra in (a) and (b) as a function of x-ray incident angle and the corresponding theoretical fits to Equation (2.2) are presented in (c) and (d), respectively. Best fits (solid lines) and the calculated backbone tilt angles are highlighted. The dashed lines are graphical representations of Equation (2.2) at other specified backbone tilt angles.
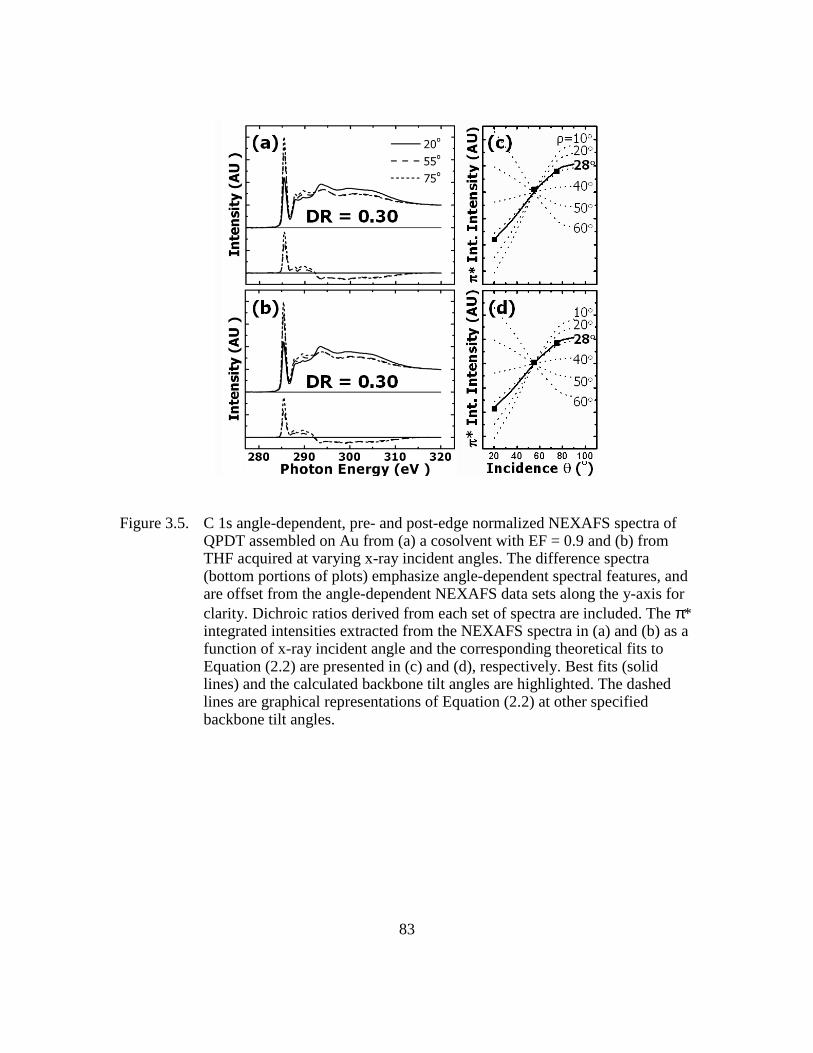
83
Figure 3.5. C 1s angle-dependent, pre- and post-edge normalized NEXAFS spectra of QPDT assembled on Au from (a) a cosolvent with EF = 0.9 and (b) from THF acquired at varying x-ray incident angles. The difference spectra (bottom portions of plots) emphasize angle-dependent spectral features, and are offset from the angle-dependent NEXAFS data sets along the y-axis for clarity. Dichroic ratios derived from each set of spectra are included. The π* integrated intensities extracted from the NEXAFS spectra in (a) and (b) as a function of x-ray incident angle and the corresponding theoretical fits to Equation (2.2) are presented in (c) and (d), respectively. Best fits (solid lines) and the calculated backbone tilt angles are highlighted. The dashed lines are graphical representations of Equation (2.2) at other specified backbone tilt angles.
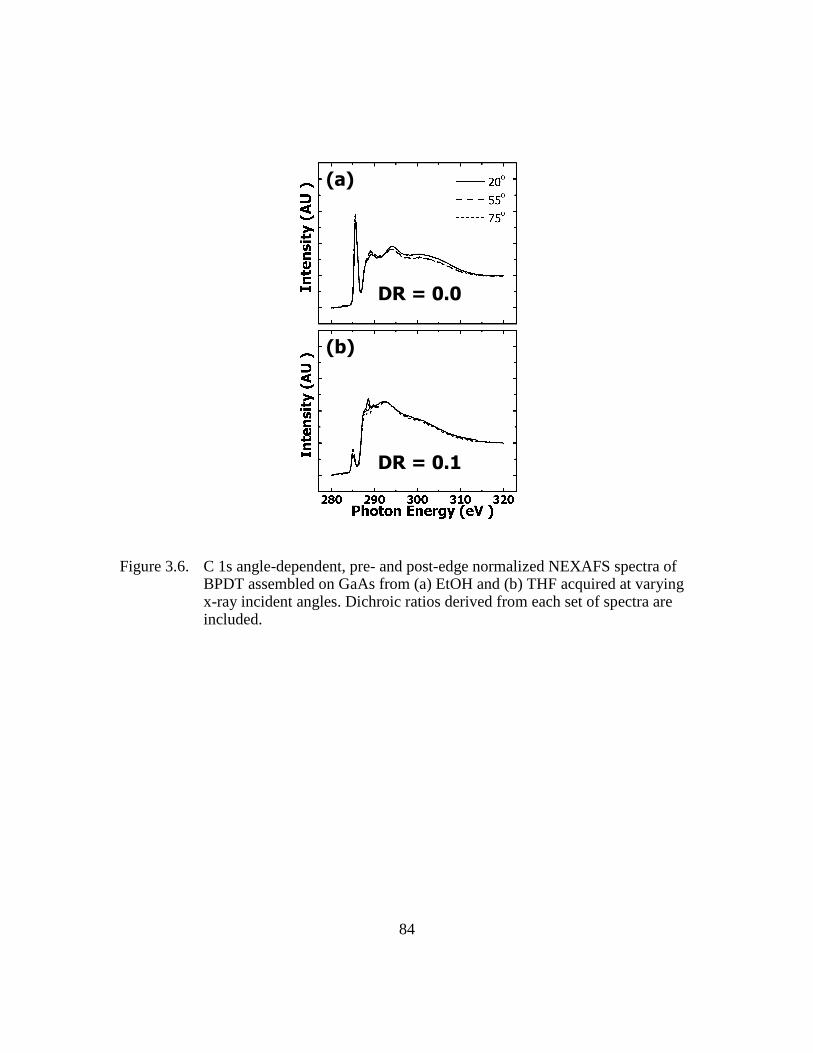
84
(a)
(b)
DR = 0.0
DR = 0.1
Figure 3.6. C 1s angle-dependent, pre- and post-edge normalized NEXAFS spectra of BPDT assembled on GaAs from (a) EtOH and (b) THF acquired at varying x-ray incident angles. Dichroic ratios derived from each set of spectra are included.
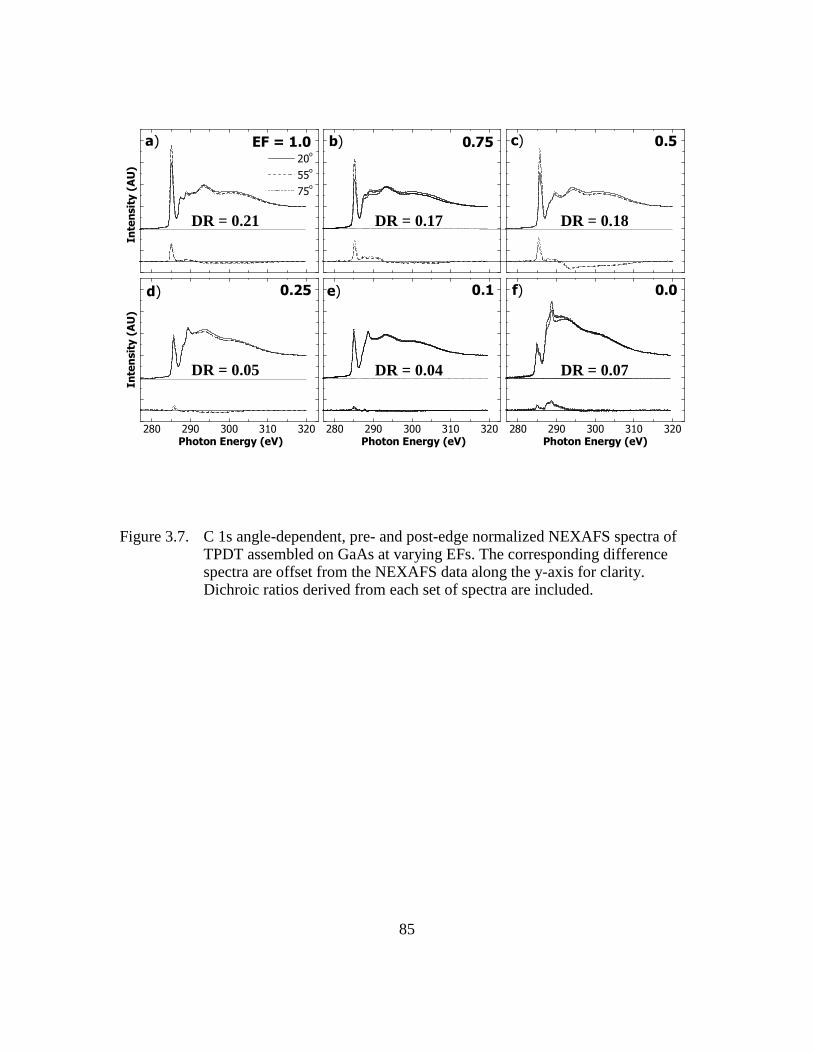
85
280 290 300 310 320
f) 0.0
Photon Energy (eV)
280 290 300 310 320
e)
Photon Energy (eV)
0.1
280 290 300 310 320
d)
Photon Energy (eV)
0.25
Intensity (AU)
c) 0.5b) 0.75
a) EF = 1.0Intensity (AU)
20o
55o
75o
Figure 3.7. C 1s angle-dependent, pre- and post-edge normalized NEXAFS spectra of TPDT assembled on GaAs at varying EFs. The corresponding difference spectra are offset from the NEXAFS data along the y-axis for clarity. Dichroic ratios derived from each set of spectra are included.
DR = 0.21 DR = 0.17 DR = 0.18
DR = 0.05 DR = 0.04 DR = 0.07
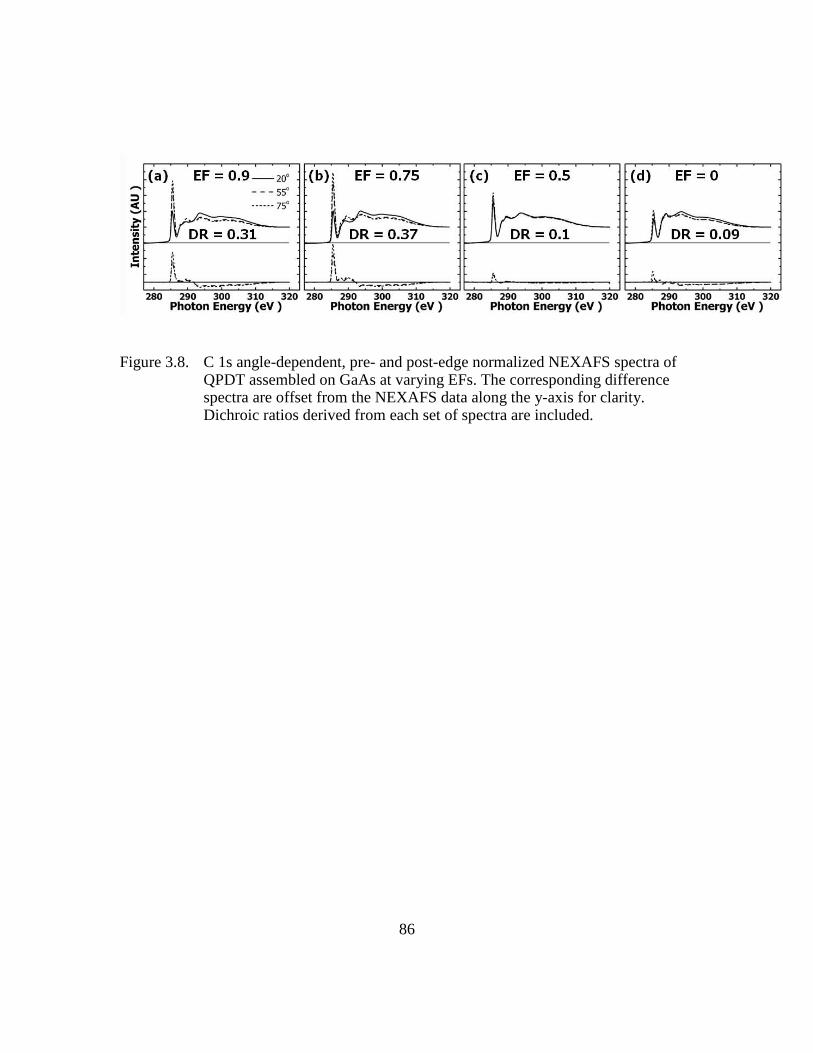
86
Figure 3.8. C 1s angle-dependent, pre- and post-edge normalized NEXAFS spectra of QPDT assembled on GaAs at varying EFs. The corresponding difference spectra are offset from the NEXAFS data along the y-axis for clarity. Dichroic ratios derived from each set of spectra are included.

87
REFERENCES
1. Ulman, A. Chemical Reviews 1996, 96, 1533.
2. Karpovich, D. S.; Blanchard, G. J. Langmuir 1994, 10, 3315.
3. Fischer, D.; Marti, A.; Hahner, G. Journal of Vacuum Science & Technology A 1997, 15, 2173.
4. Laibinis, P. E.; Whitesides, G. M.; Allara, D. L.; Tao, Y. T.; Parikh, A. N.; Nuzzo, R. G. Journal of the American Chemical Society 1991, 113, 7152.
5. Kondoh, H.; Nambu, A.; Ehara, Y.; Matsui, F.; Yokoyama, T.; Ohta, T. Journal of Physical Chemistry B 2004, 108, 12946.
6. Jun, Y.; Zhu, X. Y.; Hsu, J. W. P. Langmuir 2006, 22, 3627.
7. McGuiness, C. L.; Shaporenko, A.; Mars, C. K.; Uppili, S.; Zharnikov, M.; Allara, D. L. Journal of the American Chemical Society 2006, 128, 5231.
8. Baum, T.; Ye, S.; Uosaki, K. Langmuir 1999, 15, 8577.
9. Ye, S.; Li, G.; Noda, H.; Uosaki, K.; Osawa, M. Surface Science 2003, 529, 163.
10. Tiberio, R. C.; Craighead, H. G.; Lercel, M.; Lau, T.; Sheen, C. W.; Allara, D. L. Applied Physics Letters 1993, 62, 476.
11. Castner, D. G.; Hinds, K.; Grainger, D. W. Langmuir 1996, 12, 5083.
12. Dubois, L. H.; Nuzzo, R. G. Annual Review of Physical Chemistry 1992, 43, 437.
13. Dubois, L. H.; Zegarski, B. R.; Nuzzo, R. G. Journal of Chemical Physics 1993, 98, 678.
14. Poirier, G. E.; Pylant, E. D. Science 1996, 272, 1145.
15. Leung, T. Y. B.; Gerstenberg, M. C.; Lavrich, D. J.; Scoles, G.; Schreiber, F.; Poirier, G. E. Langmuir 2000, 16, 549.
16. Kobayashi, K.; Horiuchi, T.; Yamada, H.; Matsushige, K. Thin Solid Films 1998, 331, 210.
17. Azzam, W.; Wehner, B. I.; Fischer, R. A.; Terfort, A.; Woell, C. Langmuir 2002, 18, 7766.
88
18. de Boer, B.; Meng, H.; Perepichka, D. F.; Zheng, J.; Frank, M. M.; Chabal, Y. J.; Bao, Z. Langmuir 2003, 19, 4272.
19. Tai, Y.; Shaporenko, A.; Rong, H. T.; Buck, M.; Eck, W.; Grunze, M.; Zharnikov, M. Journal of Physical Chemistry B 2004, 108, 16806.
20. Weckenmann, U.; Mittler, S.; Naumann, K.; Fischer, R. A. Langmuir 2002, 18, 5479.
21. Frey, S.; Stadler, V.; Heister, K.; Eck, W.; Zharnikov, M.; Grunze, M.; Zeysing, B.; Terfort, A. Langmuir 2001, 17, 2408.
22. Shaporenko, A.; Adlkofer, K.; Johansson, L. S. O.; Tanaka, M.; Zharnikov, M. Langmuir 2003, 19, 4992.
23. Shaporenko, A.; Adlkofer, K.; Johansson, L. S. O.; Ulman, A.; Grunze, M.; Tanaka, M.; Zharnikov, M. Journal of Physical Chemistry B 2004, 108, 17964.
24. Ishida, T.; Mizutani, W.; Azehara, H.; Sato, F.; Choi, N.; Akiba, U.; Fujihira, M.; Tokumoto, H. Langmuir 2001, 17, 7459.
25. Kang, J. F.; Ulman, A.; Liao, S.; Jordan, R.; Yang, G.; Liu, G.-Y. Langmuir 2001, 17, 95.
26. Zharnikov, M.; Grunze, M. Journal of Physics: Condensed Matter 2001, 13, 11333.
27. Himmel, H.-J.; Terfort, A.; Woell, C. Journal of the American Chemical Society 1998, 120, 12069.
28. Ishida, T.; Mizutani, W.; Liang, T.-T.; Azehara, H.; Miyake, K.; Sasaki, S.; Tokumoto, H. Annals of the New York Academy of Sciences 2003, 1006, 164.
29. Tour, J. M.; Jones, L.; Pearson, D. L.; Lamba, J. J. S.; Burgin, T. P.; Whitesides, G. M.; Allara, D. L.; Parikh, A. N.; Atre, S. Journal of the American Chemical Society 1995, 117, 9529.
30. de Boer, B.; Frank, M. M.; Chabal, Y. J.; Jiang, W.; Garfunkel, E.; Bao, Z. Langmuir 2004, 20, 1539.
31. Jiang, W.; Zhitenev, N.; Bao, Z.; Meng, H.; Abusch-Magder, D.; Tennant, D.; Garfunkel, E. Langmuir 2005, 21, 8751.
32. Stohr, J.; Outka, D. A. Physical Review B 1987, 36, 7891.
33. Stohr, J., NEXAFS Spectroscopy. Springer: Berlin, 1992.

89
34. Kinzler, M.; Schertel, A.; Haehner, G.; Woell, C.; Grunze, M.; Albrecht, H.; Holzhueter, G.; Gerber, T. Journal of Chemical Physics 1994, 100, 7722.
35. Outka, D. A.; Stoehr, J.; Rabe, J. P.; Swalen, J. D. Journal of Chemical Physics 1988, 88, 4076.
36. Trotter, J. Acta Crystallographica 1961, 14, 1135.
37. Fuxen, C.; Azzam, W.; Arnold, R.; Witte, G.; Terfort, A.; Woell, C. Langmuir 2001, 17, 3689.
38. Mekhalif, Z.; Laffineur, F.; Couturier, N.; Delhalle, J. Langmuir 2003, 19, 637.
39. Schlenoff, J. B.; Li, M.; Ly, H. Journal of the American Chemical Society 1995, 117, 12528.
40. Lavrich, D. J.; Wetterer, S. M.; Bernasek, S. L.; Scoles, G. Journal of Physical Chemistry B 1998, 102, 3456.
41. Camillone, N.; Khan, K. A.; Osgood, R. M. Surface Science 2000, 453, 83.
90
Chapter 4: The Effect of NH4OH Concentration and Precursor
Concentration on the Structure of TPDT and QPDT Assemblies
As synthesized, conjugated dithiols are usually terminated with protecting groups
because free thiols have a tendency to oxidize1 and dimerize.1,2 The chemistries of the
protecting group include tetramethylsilylethyl3 and, more commonly, acetyl groups.1
These acetyl protecting groups are usually cleaved in-situ with the addition of a
deprotecting agent. Ammonium hydroxide (NH4OH) is the most commonly used
deprotecting agent,1,4,5 although sulfuric acid,5 triethylamine,6 and cesium bicarbonate5
have also been used as deprotecting agents during conjugated dithiol assembly. While the
impact of the different deprotecting agents on the final assembly structure of acetyl-
protected conjugated systems has been noted,6,7 we are not aware of any systematic
studies that show how the concentration of the deprotecting agent impacts the final
structure. This work aims to understand how the concentration of one such deprotection
agent, i.e., NH4OH, affects the assembly of conjugated dithiols.
The concentration of NH4OH used in the assembly of conjugated dithiols has not
been given close attention in the literature. For example, de Boer et al.8 studied molecular
assemblies of BPDT, TPDT, and QPDT on Au formed from THF using “one drop” of
NH4OH. The researchers qualitatively concluded that BPDT, TPDT, and QPDT adopted
progressively more upright molecular orientations with increasing number of rings in the
n-phenyl backbone. Shortly, after, Jiang et. al.9 reported STM studies on TPDT and
QPDT molecular assemblies formed on Au from THF using “a few drops” of NH4OH,
and the researchers found that TPDT and QPDT are disordered.9 Adding to the confusing
results, the molecular organization of TPDT and QPDT was not quantified in these
91
reports.8,9 Given the lack of understanding of how the concentration of NH4OH can
impact the structure of the molecular assembly of n-phenyldithiols, we examined the
structure of the assembly of TPDT and QPDT as a function of NH4OH concentration on
both Au and GaAs. Because BPDT tends to form disordered assemblies regardless of
processing conditions, we focused on TPDT and QPDT for these studies.
To understand how NH4OH concentration impacts the final structures of TPDT
and QPDT assemblies, we first examined the deprotection reaction in the assembly
solvents using UV-Vis-NIR spectroscopy. Although we focused our solution studies on
the case of TPDT precursor, the findings should be generally extendable to the
deprotection of QPDT precursor because the deprotection mechanism is the same. The
deprotection reaction, illustrated in Scheme 2.2, involves the conversion of thioacetyl end
groups to thiolates with the addition of NH4OH.7 The reaction Scheme in 2.2 suggests
that the concentration of NH4OH should directly impact the relative concentration of
thioacetyl- and thiolate-terminated molecules in solution. Given that thiolates should
freely adsorb, the fraction of thiolate-terminated molecules in solution should, in turn,
affect the final assembly structure. We assumed that the initial solution conditions have
the most dramatic impact on the final assembly structure because the adsorption of sulfur
on GaAs10,11 and thiolates on Au12,13 is known to occur rapidly, typically within the first
few minutes of substrate immersion. We thus characterized the assembly solutions at the
point of substrate immersion, i.e., 1 hour after the addition of NH4OH to the solution.
Figure 4.1a presents the UV-Vis-NIR spectra of TPDT in EtOH 1 hour after the addition
of NH4OH at varying concentrations. A spectrum of the acetyl-protected TPDT precursor
in EtOH prior to the addition of NH4OH is included for reference (solid line). The acetyl-
protected TPDT precursor in EtOH exhibits an absorption band with a peak maximum at
298 nm. When NH4OH is added, we observe the development of a new absorption band

92
at 345 nm. We assign this new absorption band to deprotected TPDT (see Scheme 2.2),
which are now terminated with thiolates (-S-NH4+). This absorption is band attributed to
thiolates, and not thiols (-SH), because thiol-terminated TPDT, obtained either by direct
synthesis14 or by deprotecting the acetyl-protected precursor with sulfuric acid,5,7 absorbs
at 302 nm in EtOH. The thiolate absorption band at 345 nm intensifies with increasing
NH4OH concentrations while the intensity of the thioacetyl absorption band at 298 nm
decreases. This trend suggests an increase in thiolate fraction in EtOH with increasing
NH4OH concentration. We observe a complete disappearance of the thioacetyl absorption
band at 298 nm within 60-70 minutes after the addition of NH4OH at 160 mM,
suggesting complete conversion of TPDT from its thioacetyl to thiolate form within this
time period.
Figure 4.1b presents the UV-Vis-NIR spectra of TPDT in THF 1 hour after the
addition of NH4OH at varying concentrations. The spectrum of the acetyl-protected
TPDT precursor in THF is also included (solid line in Figure 4.1b). We observe an
absorption band attributed to the acetyl-protected precursor at 301 nm.8 With the addition
of NH4OH, an absorption shoulder develops around 330 nm. We attribute this shoulder to
thiolate-terminated TPDT because of the increased electron delocalization length of the
thiolate-terminated molecule. Specifically, the additional electron density on the sulfur
atoms of the thiolate-terminated molecule likely enables extended charge delocalization
compared to the conjugated backbone of the thioacetyl-terminated molecule. Increased
charge delocalization is expected to shift the UV-Vis-NIR absorption maximum to a
higher wavelength.15 To quantify the position of the thiolate absorption band in THF, we
examined the UV-Vis-NIR spectrum of TPDT in THF 25 hours after the addition of 160
mM NH4OH (Figure 4.1c); from this point on the time-resolved UV-Vis-NIR spectra
remain unchanged, so we assumed that the deprotection reaction is complete. From this
93
spectrum, the absorption band maximum in THF is determined to be 312 nm. While the
UV-Vis-NIR data of TPDT in EtOH (Figure 4.1a) suggest complete conversion of TPDT
from its thioacetyl to thiolate form 1 hour after the addition of 160 mM NH4OH, the
corresponding reaction in THF appears to be significantly slower. We were able to obtain
estimates of the solution composition by fitting the absorption bands associated with
thioacetyl- and thiolate-terminated molecules with Gaussian peaks, as described in
Chapter 2. By examining the relative integrated intensities extracted from the fitted
absorption bands of thioacetyl (301 nm) and thiolate (312 nm) in Figures 4.1a and b, we
estimated that less than 50% of the thioacetyl end groups were converted to thiolates 1
hour after the addition of 160 mM NH4OH (Figure 4.1b) in THF. In fact, at 1 mM
NH4OH, we estimated only ≈1% of the thioacetyl groups were converted to thiolates in
THF as compared to ≈25% conversion in EtOH after 1 hour. The concentration of
NH4OH drastically affects the fraction of thiolates in the solution at the onset of the
assembly process. Considering potential differences in chemical reactivity and end group
size between these different species, the variations in their relative concentrations in
solution are expected to impact the final structure of TPDT on Au and GaAs.
Figure 4.2a contains RAIRS spectra of TPDT assemblies on Au. These
assemblies were formed in EtOH for 18-24 hours at NH4OH concentrations ranging from
0 to 160 mM. Prominent resonances originating from the phenyl backbone of TPDT
include the in-plane, ip, (1475 cm-1 and 1001 cm-1) and out-of-plane, op, (807 cm-1)
phenyl ring vibrational modes.8 Additionally, Figure 4.2a-i reveals features associated
with the acetyl protecting group: the peaks at 1706 and 1353 cm-1 are assigned to C=O
and CH3 (CH3-CO) vibrations8,16 of the thioacetyl functionality, respectively. We observe
that the acetyl-protected TPDT precursors can directly adsorb on Au from EtOH without
any prior deprotection. The adsorption of acetyl-protected precursors of conjugated
94
molecules has been previously reported on metal surfaces.1,17,18 On Au, the adsorption
was shown to proceed through spontaneous cleaving of the acetyl protecting groups
catalyzed by the Au surface, followed by the formation of sulfur-Au bonds.18 With the
absence of acetyl protecting groups at the molecule-substrate interface, the associated
resonances at 1706 and 1353 cm-1 we observe in Figure 4.2a-i must originate from acetyl
protecting groups located at the assembly surface (or molecule-air interface). The
intensities of the vibrations associated with the acetyl group (1706 and 1353 cm-1)
decrease with increasing NH4OH concentration, suggesting a corresponding decrease in
the concentration of acetyl protecting groups at the assembly surface with increasing
NH4OH concentrations. The overall spectral intensities in Figures 4.2a-ii–v are
comparable, suggesting that the surface coverages are comparable in all of these
assemblies. The composition of thiolates on the surface in these assemblies, however, is
quite different and is dependent on the NH4OH used during deprotection.
To gain a better understanding of the final assembly structure of TPDT on Au as a
function of NH4OH concentration, we examined the ensemble-average molecular
orientation of the TPDT assemblies on Au. Specifically, we compared the relative ip/op
intensities extracted from the RAIRS spectra of the TPDT assemblies to those obtained
on the acetyl-protected TPDT precursor powder. We quantified the ensemble-average
molecular orientation of each molecular assembly on Au by calculating the RAIRS
orientation ratio, ORr. The ORr is a measure of anisotropy in the molecular assembly,
with ORr > 1 characteristic of a preferentially upright molecular orientation. Accordingly,
ORr < 1 indicates that molecules are generally lying flat on the substrate surface, and ORr
≈ 1 indicates a disordered molecular assembly. TPDT assembled on Au from EtOH with
1 mM NH4OH (Figure 4.2a-i) exhibits ORr ≈ 14.7, indicating that the assembly adopts a
preferentially upright orientation. Figure 4.2a-i reveals that the thioacetyl-terminated
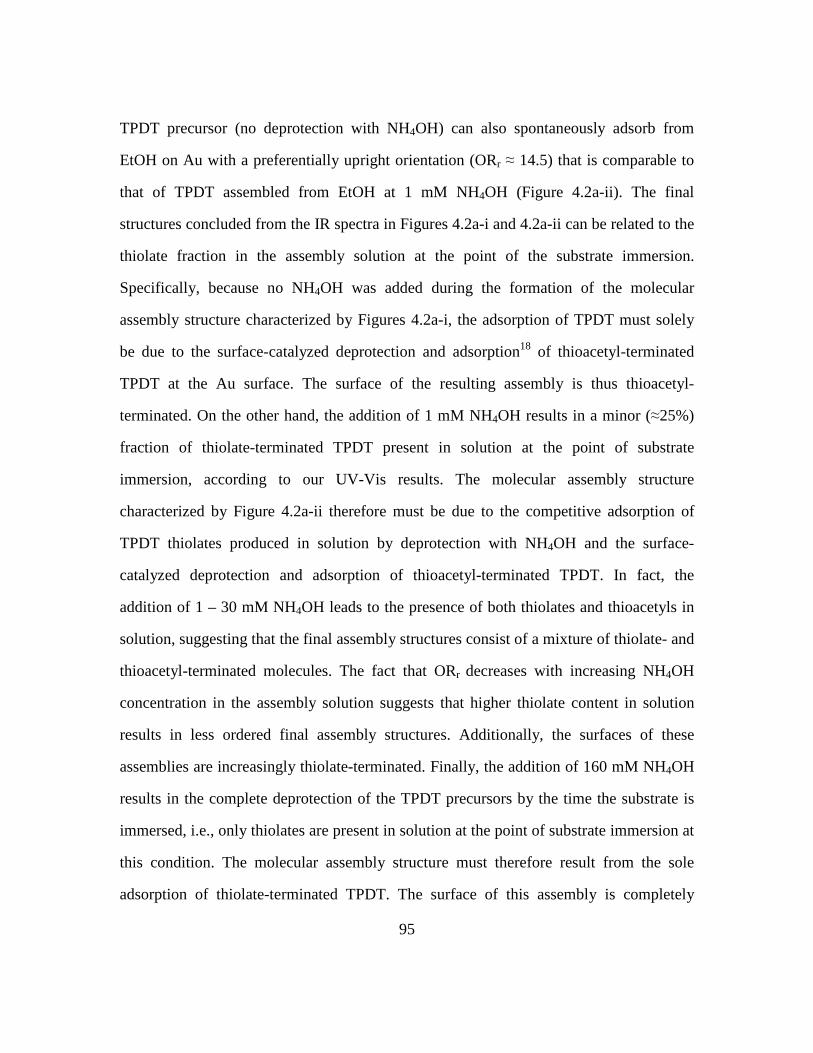
95
TPDT precursor (no deprotection with NH4OH) can also spontaneously adsorb from
EtOH on Au with a preferentially upright orientation (ORr ≈ 14.5) that is comparable to
that of TPDT assembled from EtOH at 1 mM NH4OH (Figure 4.2a-ii). The final
structures concluded from the IR spectra in Figures 4.2a-i and 4.2a-ii can be related to the
thiolate fraction in the assembly solution at the point of the substrate immersion.
Specifically, because no NH4OH was added during the formation of the molecular
assembly structure characterized by Figures 4.2a-i, the adsorption of TPDT must solely
be due to the surface-catalyzed deprotection and adsorption18 of thioacetyl-terminated
TPDT at the Au surface. The surface of the resulting assembly is thus thioacetyl-
terminated. On the other hand, the addition of 1 mM NH4OH results in a minor (≈25%)
fraction of thiolate-terminated TPDT present in solution at the point of substrate
immersion, according to our UV-Vis results. The molecular assembly structure
characterized by Figure 4.2a-ii therefore must be due to the competitive adsorption of
TPDT thiolates produced in solution by deprotection with NH4OH and the surface-
catalyzed deprotection and adsorption of thioacetyl-terminated TPDT. In fact, the
addition of 1 – 30 mM NH4OH leads to the presence of both thiolates and thioacetyls in
solution, suggesting that the final assembly structures consist of a mixture of thiolate- and
thioacetyl-terminated molecules. The fact that ORr decreases with increasing NH4OH
concentration in the assembly solution suggests that higher thiolate content in solution
results in less ordered final assembly structures. Additionally, the surfaces of these
assemblies are increasingly thiolate-terminated. Finally, the addition of 160 mM NH4OH
results in the complete deprotection of the TPDT precursors by the time the substrate is
immersed, i.e., only thiolates are present in solution at the point of substrate immersion at
this condition. The molecular assembly structure must therefore result from the sole
adsorption of thiolate-terminated TPDT. The surface of this assembly is completely
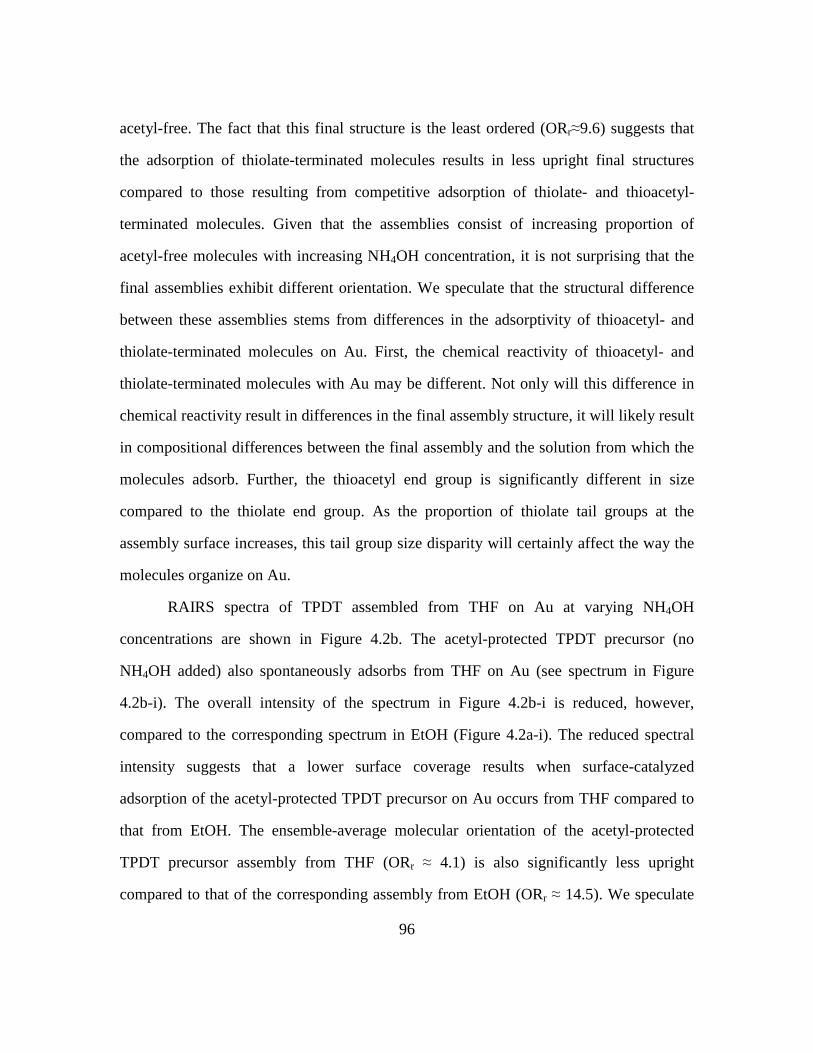
96
acetyl-free. The fact that this final structure is the least ordered (ORr≈9.6) suggests that
the adsorption of thiolate-terminated molecules results in less upright final structures
compared to those resulting from competitive adsorption of thiolate- and thioacetyl-
terminated molecules. Given that the assemblies consist of increasing proportion of
acetyl-free molecules with increasing NH4OH concentration, it is not surprising that the
final assemblies exhibit different orientation. We speculate that the structural difference
between these assemblies stems from differences in the adsorptivity of thioacetyl- and
thiolate-terminated molecules on Au. First, the chemical reactivity of thioacetyl- and
thiolate-terminated molecules with Au may be different. Not only will this difference in
chemical reactivity result in differences in the final assembly structure, it will likely result
in compositional differences between the final assembly and the solution from which the
molecules adsorb. Further, the thioacetyl end group is significantly different in size
compared to the thiolate end group. As the proportion of thiolate tail groups at the
assembly surface increases, this tail group size disparity will certainly affect the way the
molecules organize on Au.
RAIRS spectra of TPDT assembled from THF on Au at varying NH4OH
concentrations are shown in Figure 4.2b. The acetyl-protected TPDT precursor (no
NH4OH added) also spontaneously adsorbs from THF on Au (see spectrum in Figure
4.2b-i). The overall intensity of the spectrum in Figure 4.2b-i is reduced, however,
compared to the corresponding spectrum in EtOH (Figure 4.2a-i). The reduced spectral
intensity suggests that a lower surface coverage results when surface-catalyzed
adsorption of the acetyl-protected TPDT precursor on Au occurs from THF compared to
that from EtOH. The ensemble-average molecular orientation of the acetyl-protected
TPDT precursor assembly from THF (ORr ≈ 4.1) is also significantly less upright
compared to that of the corresponding assembly from EtOH (ORr ≈ 14.5). We speculate
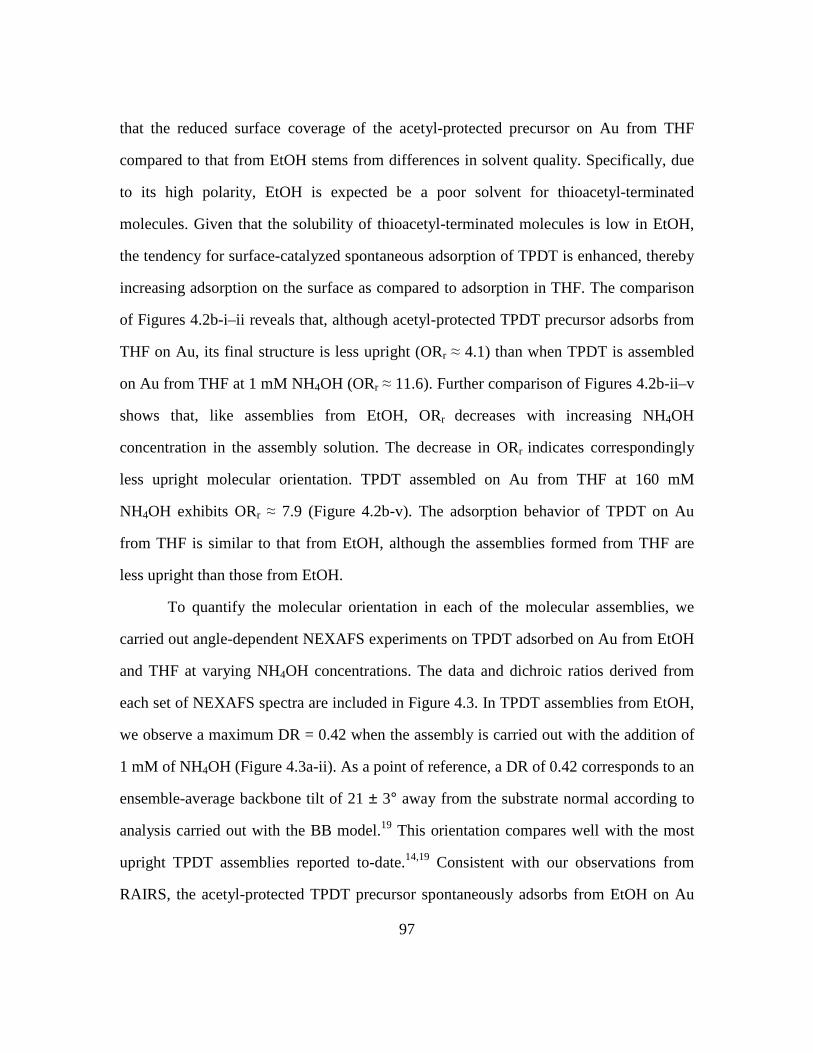
97
that the reduced surface coverage of the acetyl-protected precursor on Au from THF
compared to that from EtOH stems from differences in solvent quality. Specifically, due
to its high polarity, EtOH is expected be a poor solvent for thioacetyl-terminated
molecules. Given that the solubility of thioacetyl-terminated molecules is low in EtOH,
the tendency for surface-catalyzed spontaneous adsorption of TPDT is enhanced, thereby
increasing adsorption on the surface as compared to adsorption in THF. The comparison
of Figures 4.2b-i–ii reveals that, although acetyl-protected TPDT precursor adsorbs from
THF on Au, its final structure is less upright (ORr ≈ 4.1) than when TPDT is assembled
on Au from THF at 1 mM NH4OH (ORr ≈ 11.6). Further comparison of Figures 4.2b-ii–v
shows that, like assemblies from EtOH, ORr decreases with increasing NH4OH
concentration in the assembly solution. The decrease in ORr indicates correspondingly
less upright molecular orientation. TPDT assembled on Au from THF at 160 mM
NH4OH exhibits ORr ≈ 7.9 (Figure 4.2b-v). The adsorption behavior of TPDT on Au
from THF is similar to that from EtOH, although the assemblies formed from THF are
less upright than those from EtOH.
To quantify the molecular orientation in each of the molecular assemblies, we
carried out angle-dependent NEXAFS experiments on TPDT adsorbed on Au from EtOH
and THF at varying NH4OH concentrations. The data and dichroic ratios derived from
each set of NEXAFS spectra are included in Figure 4.3. In TPDT assemblies from EtOH,
we observe a maximum DR = 0.42 when the assembly is carried out with the addition of
1 mM of NH4OH (Figure 4.3a-ii). As a point of reference, a DR of 0.42 corresponds to an
ensemble-average backbone tilt of 21 ± 3° away from the substrate normal according to
analysis carried out with the BB model.19 This orientation compares well with the most
upright TPDT assemblies reported to-date.14,19 Consistent with our observations from
RAIRS, the acetyl-protected TPDT precursor spontaneously adsorbs from EtOH on Au
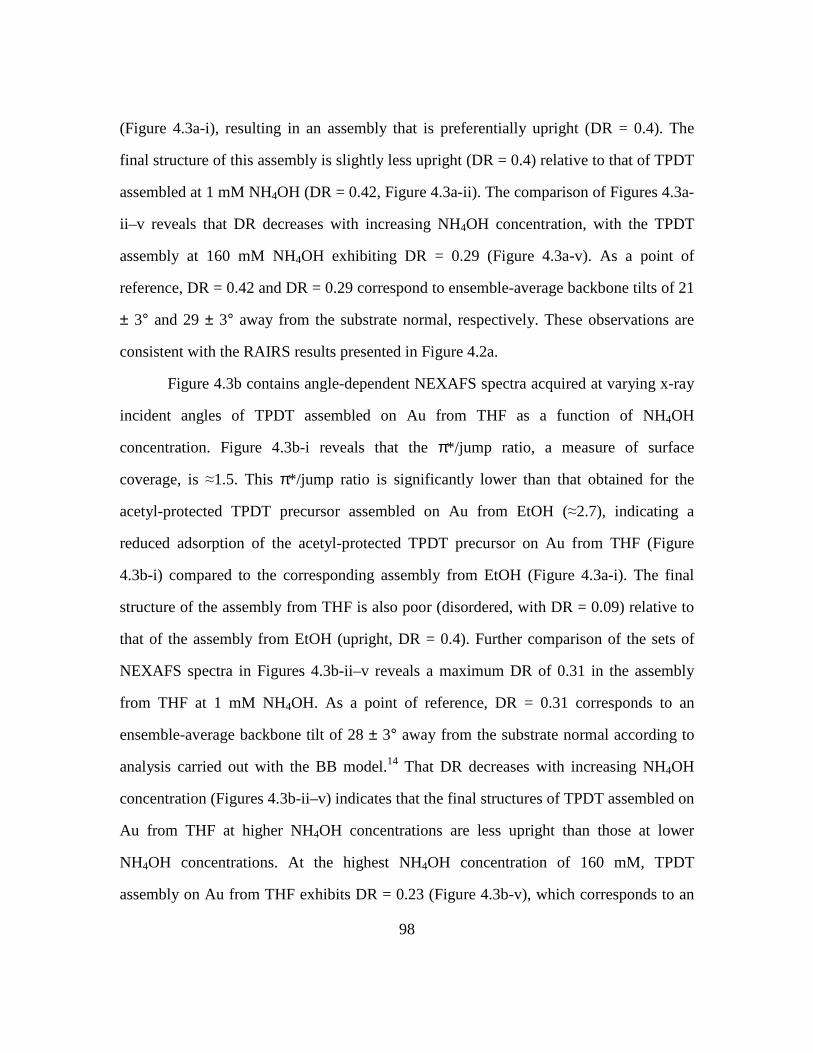
98
(Figure 4.3a-i), resulting in an assembly that is preferentially upright (DR = 0.4). The
final structure of this assembly is slightly less upright (DR = 0.4) relative to that of TPDT
assembled at 1 mM NH4OH (DR = 0.42, Figure 4.3a-ii). The comparison of Figures 4.3a-
ii–v reveals that DR decreases with increasing NH4OH concentration, with the TPDT
assembly at 160 mM NH4OH exhibiting DR = 0.29 (Figure 4.3a-v). As a point of
reference, DR = 0.42 and DR = 0.29 correspond to ensemble-average backbone tilts of 21
± 3° and 29 ± 3° away from the substrate normal, respectively. These observations are
consistent with the RAIRS results presented in Figure 4.2a.
Figure 4.3b contains angle-dependent NEXAFS spectra acquired at varying x-ray
incident angles of TPDT assembled on Au from THF as a function of NH4OH
concentration. Figure 4.3b-i reveals that the π*/jump ratio, a measure of surface
coverage, is ≈1.5. This π*/jump ratio is significantly lower than that obtained for the
acetyl-protected TPDT precursor assembled on Au from EtOH (≈2.7), indicating a
reduced adsorption of the acetyl-protected TPDT precursor on Au from THF (Figure
4.3b-i) compared to the corresponding assembly from EtOH (Figure 4.3a-i). The final
structure of the assembly from THF is also poor (disordered, with DR = 0.09) relative to
that of the assembly from EtOH (upright, DR = 0.4). Further comparison of the sets of
NEXAFS spectra in Figures 4.3b-ii–v reveals a maximum DR of 0.31 in the assembly
from THF at 1 mM NH4OH. As a point of reference, DR = 0.31 corresponds to an
ensemble-average backbone tilt of 28 ± 3° away from the substrate normal according to
analysis carried out with the BB model.14 That DR decreases with increasing NH4OH
concentration (Figures 4.3b-ii–v) indicates that the final structures of TPDT assembled on
Au from THF at higher NH4OH concentrations are less upright than those at lower
NH4OH concentrations. At the highest NH4OH concentration of 160 mM, TPDT
assembly on Au from THF exhibits DR = 0.23 (Figure 4.3b-v), which corresponds to an
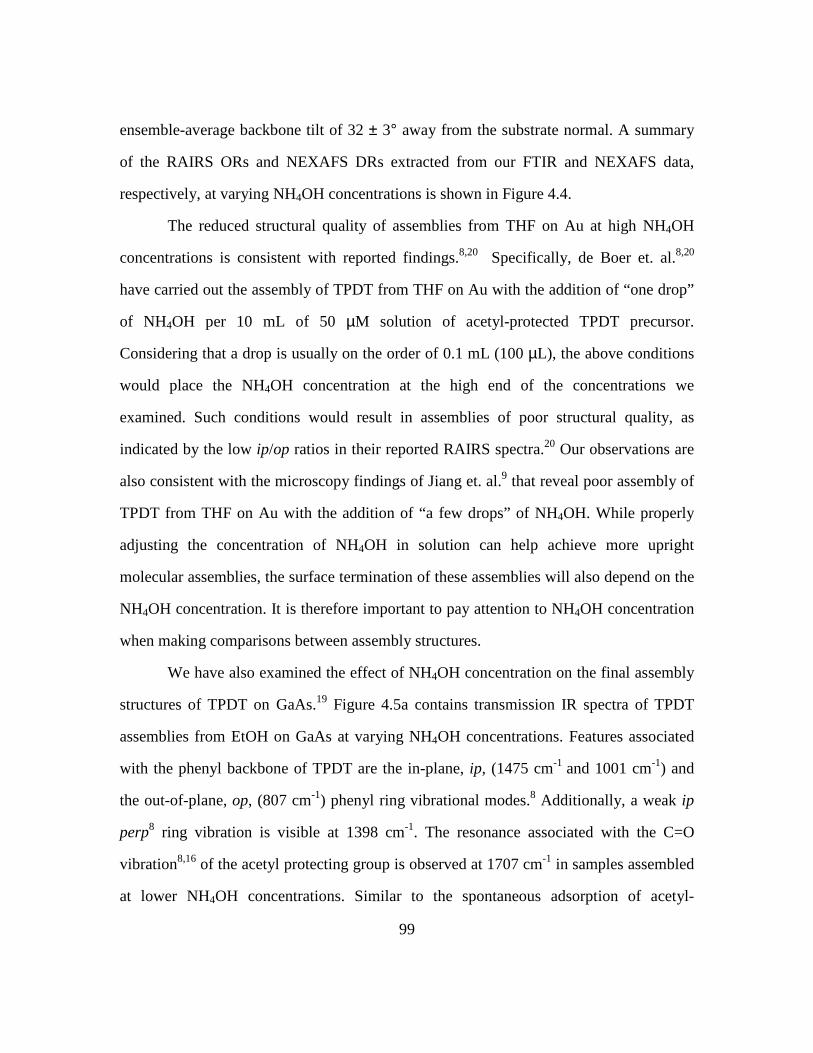
99
ensemble-average backbone tilt of 32 ± 3° away from the substrate normal. A summary
of the RAIRS ORs and NEXAFS DRs extracted from our FTIR and NEXAFS data,
respectively, at varying NH4OH concentrations is shown in Figure 4.4.
The reduced structural quality of assemblies from THF on Au at high NH4OH
concentrations is consistent with reported findings.8,20 Specifically, de Boer et. al.8,20
have carried out the assembly of TPDT from THF on Au with the addition of “one drop”
of NH4OH per 10 mL of 50 µM solution of acetyl-protected TPDT precursor.
Considering that a drop is usually on the order of 0.1 mL (100 µL), the above conditions
would place the NH4OH concentration at the high end of the concentrations we
examined. Such conditions would result in assemblies of poor structural quality, as
indicated by the low ip/op ratios in their reported RAIRS spectra.20 Our observations are
also consistent with the microscopy findings of Jiang et. al.9 that reveal poor assembly of
TPDT from THF on Au with the addition of “a few drops” of NH4OH. While properly
adjusting the concentration of NH4OH in solution can help achieve more upright
molecular assemblies, the surface termination of these assemblies will also depend on the
NH4OH concentration. It is therefore important to pay attention to NH4OH concentration
when making comparisons between assembly structures.
We have also examined the effect of NH4OH concentration on the final assembly
structures of TPDT on GaAs.19 Figure 4.5a contains transmission IR spectra of TPDT
assemblies from EtOH on GaAs at varying NH4OH concentrations. Features associated
with the phenyl backbone of TPDT are the in-plane, ip, (1475 cm-1 and 1001 cm-1) and
the out-of-plane, op, (807 cm-1) phenyl ring vibrational modes.8 Additionally, a weak ip
perp8 ring vibration is visible at 1398 cm-1. The resonance associated with the C=O
vibration8,16 of the acetyl protecting group is observed at 1707 cm-1 in samples assembled
at lower NH4OH concentrations. Similar to the spontaneous adsorption of acetyl-
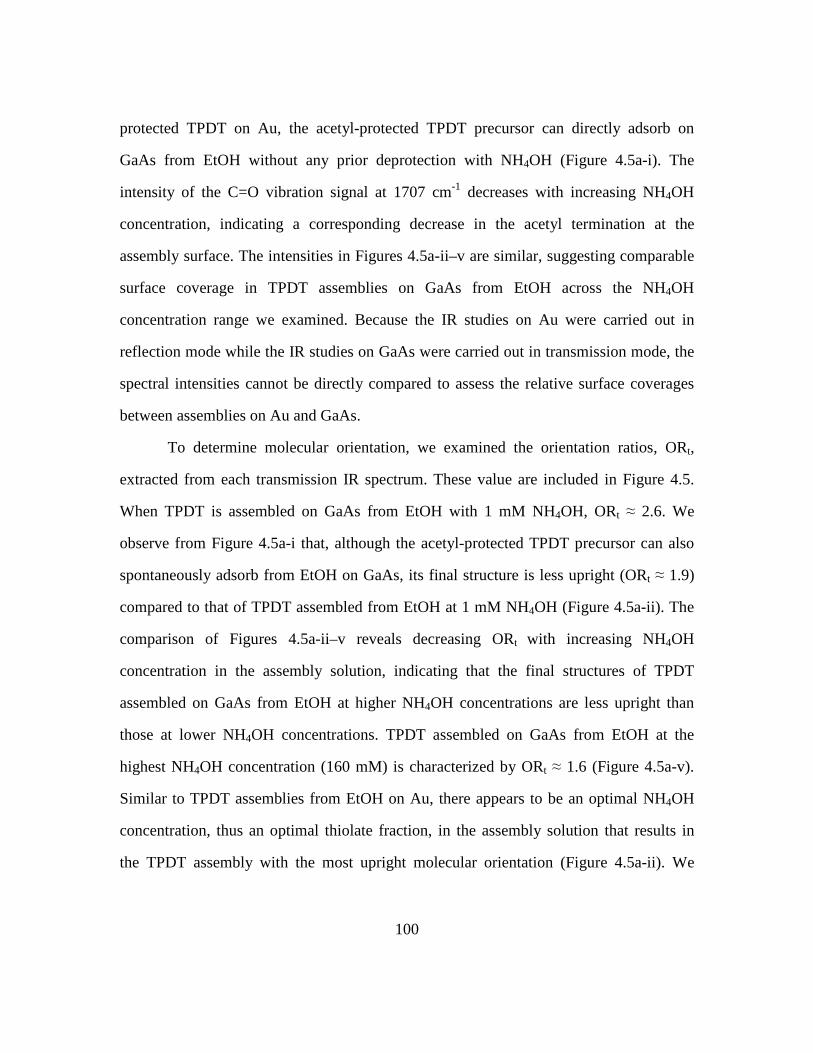
100
protected TPDT on Au, the acetyl-protected TPDT precursor can directly adsorb on
GaAs from EtOH without any prior deprotection with NH4OH (Figure 4.5a-i). The
intensity of the C=O vibration signal at 1707 cm-1 decreases with increasing NH4OH
concentration, indicating a corresponding decrease in the acetyl termination at the
assembly surface. The intensities in Figures 4.5a-ii–v are similar, suggesting comparable
surface coverage in TPDT assemblies on GaAs from EtOH across the NH4OH
concentration range we examined. Because the IR studies on Au were carried out in
reflection mode while the IR studies on GaAs were carried out in transmission mode, the
spectral intensities cannot be directly compared to assess the relative surface coverages
between assemblies on Au and GaAs.
To determine molecular orientation, we examined the orientation ratios, ORt,
extracted from each transmission IR spectrum. These value are included in Figure 4.5.
When TPDT is assembled on GaAs from EtOH with 1 mM NH4OH, ORt ≈ 2.6. We
observe from Figure 4.5a-i that, although the acetyl-protected TPDT precursor can also
spontaneously adsorb from EtOH on GaAs, its final structure is less upright (ORt ≈ 1.9)
compared to that of TPDT assembled from EtOH at 1 mM NH4OH (Figure 4.5a-ii). The
comparison of Figures 4.5a-ii–v reveals decreasing ORt with increasing NH4OH
concentration in the assembly solution, indicating that the final structures of TPDT
assembled on GaAs from EtOH at higher NH4OH concentrations are less upright than
those at lower NH4OH concentrations. TPDT assembled on GaAs from EtOH at the
highest NH4OH concentration (160 mM) is characterized by ORt ≈ 1.6 (Figure 4.5a-v).
Similar to TPDT assemblies from EtOH on Au, there appears to be an optimal NH4OH
concentration, thus an optimal thiolate fraction, in the assembly solution that results in
the TPDT assembly with the most upright molecular orientation (Figure 4.5a-ii). We
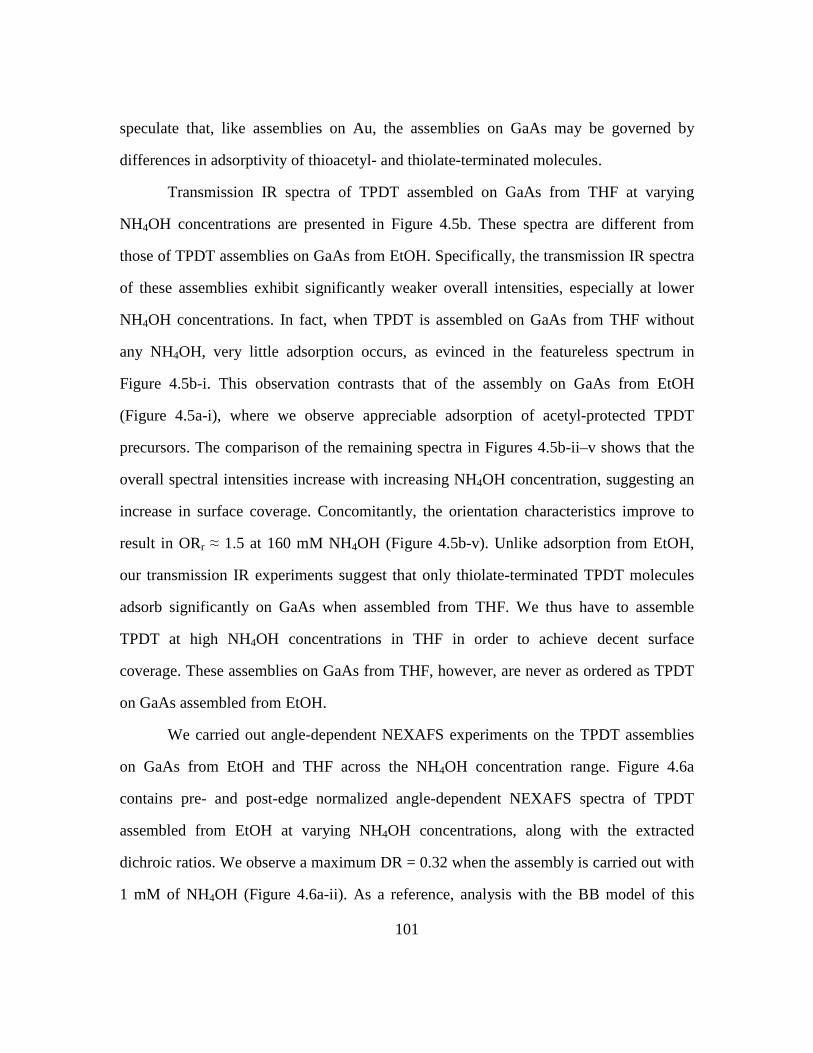
101
speculate that, like assemblies on Au, the assemblies on GaAs may be governed by
differences in adsorptivity of thioacetyl- and thiolate-terminated molecules.
Transmission IR spectra of TPDT assembled on GaAs from THF at varying
NH4OH concentrations are presented in Figure 4.5b. These spectra are different from
those of TPDT assemblies on GaAs from EtOH. Specifically, the transmission IR spectra
of these assemblies exhibit significantly weaker overall intensities, especially at lower
NH4OH concentrations. In fact, when TPDT is assembled on GaAs from THF without
any NH4OH, very little adsorption occurs, as evinced in the featureless spectrum in
Figure 4.5b-i. This observation contrasts that of the assembly on GaAs from EtOH
(Figure 4.5a-i), where we observe appreciable adsorption of acetyl-protected TPDT
precursors. The comparison of the remaining spectra in Figures 4.5b-ii–v shows that the
overall spectral intensities increase with increasing NH4OH concentration, suggesting an
increase in surface coverage. Concomitantly, the orientation characteristics improve to
result in ORr ≈ 1.5 at 160 mM NH4OH (Figure 4.5b-v). Unlike adsorption from EtOH,
our transmission IR experiments suggest that only thiolate-terminated TPDT molecules
adsorb significantly on GaAs when assembled from THF. We thus have to assemble
TPDT at high NH4OH concentrations in THF in order to achieve decent surface
coverage. These assemblies on GaAs from THF, however, are never as ordered as TPDT
on GaAs assembled from EtOH.
We carried out angle-dependent NEXAFS experiments on the TPDT assemblies
on GaAs from EtOH and THF across the NH4OH concentration range. Figure 4.6a
contains pre- and post-edge normalized angle-dependent NEXAFS spectra of TPDT
assembled from EtOH at varying NH4OH concentrations, along with the extracted
dichroic ratios. We observe a maximum DR = 0.32 when the assembly is carried out with
1 mM of NH4OH (Figure 4.6a-ii). As a reference, analysis with the BB model of this
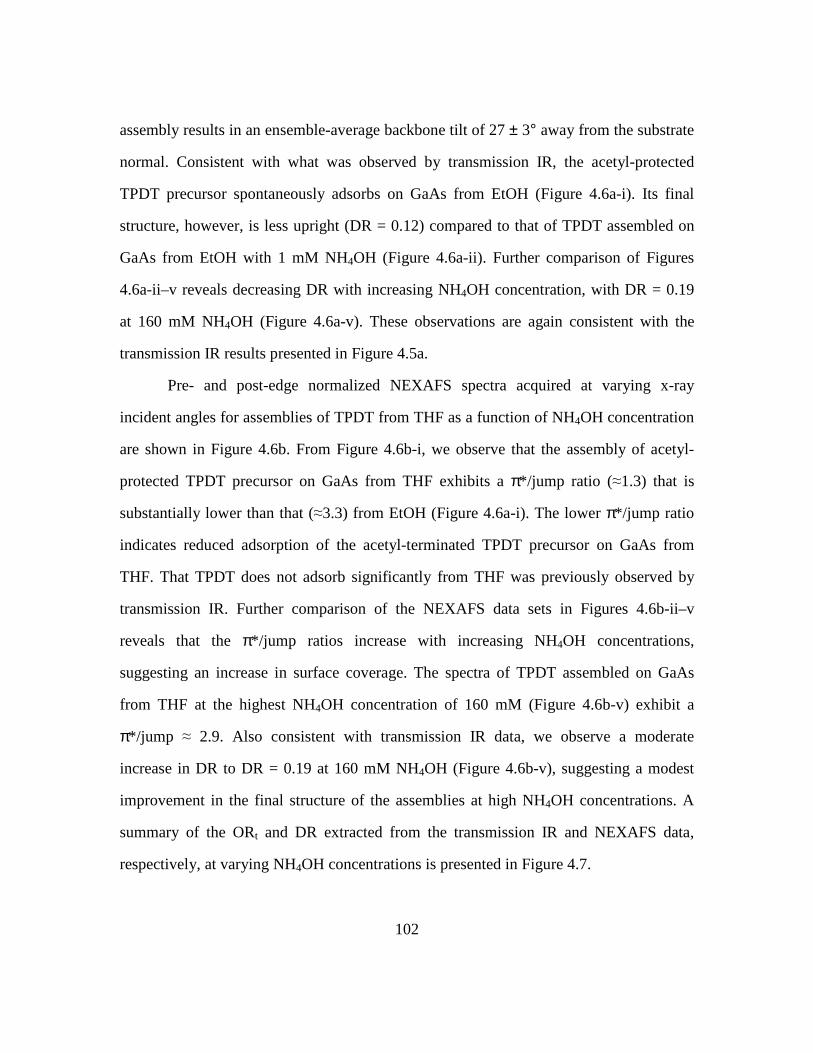
102
assembly results in an ensemble-average backbone tilt of 27 ± 3° away from the substrate
normal. Consistent with what was observed by transmission IR, the acetyl-protected
TPDT precursor spontaneously adsorbs on GaAs from EtOH (Figure 4.6a-i). Its final
structure, however, is less upright (DR = 0.12) compared to that of TPDT assembled on
GaAs from EtOH with 1 mM NH4OH (Figure 4.6a-ii). Further comparison of Figures
4.6a-ii–v reveals decreasing DR with increasing NH4OH concentration, with DR = 0.19
at 160 mM NH4OH (Figure 4.6a-v). These observations are again consistent with the
transmission IR results presented in Figure 4.5a.
Pre- and post-edge normalized NEXAFS spectra acquired at varying x-ray
incident angles for assemblies of TPDT from THF as a function of NH4OH concentration
are shown in Figure 4.6b. From Figure 4.6b-i, we observe that the assembly of acetyl-
protected TPDT precursor on GaAs from THF exhibits a π*/jump ratio (≈1.3) that is
substantially lower than that (≈3.3) from EtOH (Figure 4.6a-i). The lower π*/jump ratio
indicates reduced adsorption of the acetyl-terminated TPDT precursor on GaAs from
THF. That TPDT does not adsorb significantly from THF was previously observed by
transmission IR. Further comparison of the NEXAFS data sets in Figures 4.6b-ii–v
reveals that the π*/jump ratios increase with increasing NH4OH concentrations,
suggesting an increase in surface coverage. The spectra of TPDT assembled on GaAs
from THF at the highest NH4OH concentration of 160 mM (Figure 4.6b-v) exhibit a
π*/jump ≈ 2.9. Also consistent with transmission IR data, we observe a moderate
increase in DR to DR = 0.19 at 160 mM NH4OH (Figure 4.6b-v), suggesting a modest
improvement in the final structure of the assemblies at high NH4OH concentrations. A
summary of the ORt and DR extracted from the transmission IR and NEXAFS data,
respectively, at varying NH4OH concentrations is presented in Figure 4.7.
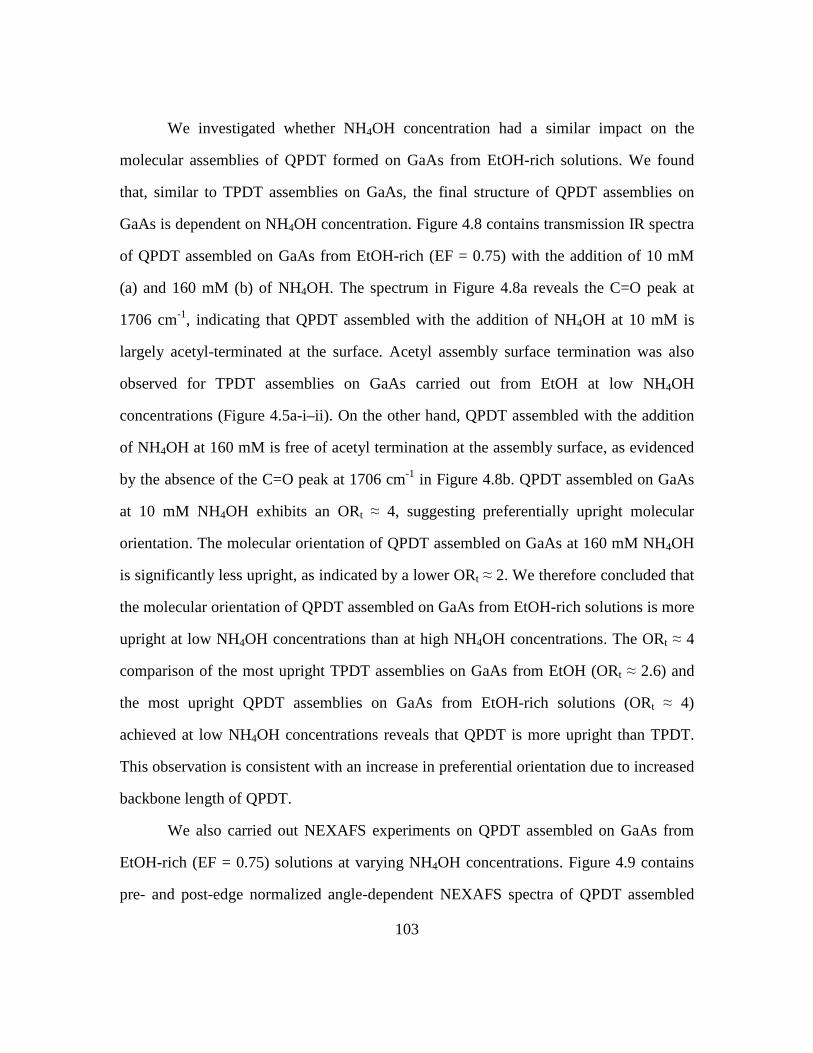
103
We investigated whether NH4OH concentration had a similar impact on the
molecular assemblies of QPDT formed on GaAs from EtOH-rich solutions. We found
that, similar to TPDT assemblies on GaAs, the final structure of QPDT assemblies on
GaAs is dependent on NH4OH concentration. Figure 4.8 contains transmission IR spectra
of QPDT assembled on GaAs from EtOH-rich (EF = 0.75) with the addition of 10 mM
(a) and 160 mM (b) of NH4OH. The spectrum in Figure 4.8a reveals the C=O peak at
1706 cm-1, indicating that QPDT assembled with the addition of NH4OH at 10 mM is
largely acetyl-terminated at the surface. Acetyl assembly surface termination was also
observed for TPDT assemblies on GaAs carried out from EtOH at low NH4OH
concentrations (Figure 4.5a-i–ii). On the other hand, QPDT assembled with the addition
of NH4OH at 160 mM is free of acetyl termination at the assembly surface, as evidenced
by the absence of the C=O peak at 1706 cm-1 in Figure 4.8b. QPDT assembled on GaAs
at 10 mM NH4OH exhibits an ORt ≈ 4, suggesting preferentially upright molecular
orientation. The molecular orientation of QPDT assembled on GaAs at 160 mM NH4OH
is significantly less upright, as indicated by a lower ORt ≈ 2. We therefore concluded that
the molecular orientation of QPDT assembled on GaAs from EtOH-rich solutions is more
upright at low NH4OH concentrations than at high NH4OH concentrations. The ORt ≈ 4
comparison of the most upright TPDT assemblies on GaAs from EtOH (ORt ≈ 2.6) and
the most upright QPDT assemblies on GaAs from EtOH-rich solutions (ORt ≈ 4)
achieved at low NH4OH concentrations reveals that QPDT is more upright than TPDT.
This observation is consistent with an increase in preferential orientation due to increased
backbone length of QPDT.
We also carried out NEXAFS experiments on QPDT assembled on GaAs from
EtOH-rich (EF = 0.75) solutions at varying NH4OH concentrations. Figure 4.9 contains
pre- and post-edge normalized angle-dependent NEXAFS spectra of QPDT assembled
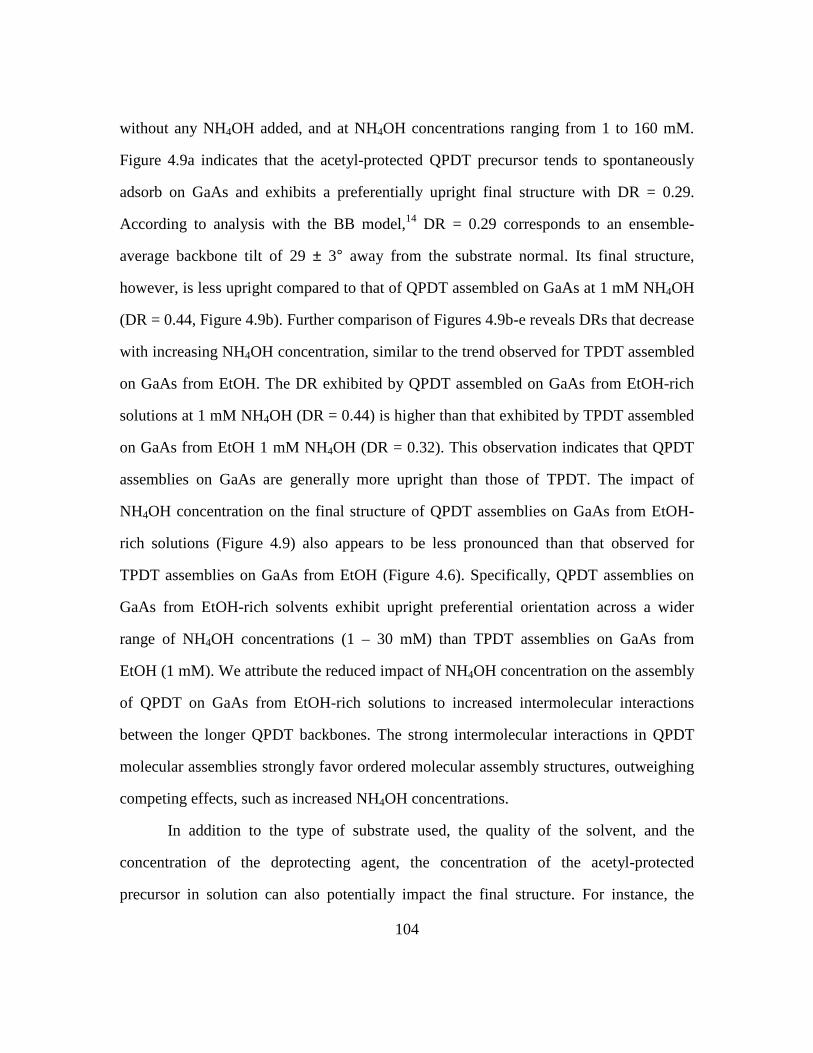
104
without any NH4OH added, and at NH4OH concentrations ranging from 1 to 160 mM.
Figure 4.9a indicates that the acetyl-protected QPDT precursor tends to spontaneously
adsorb on GaAs and exhibits a preferentially upright final structure with DR = 0.29.
According to analysis with the BB model,14 DR = 0.29 corresponds to an ensemble-
average backbone tilt of 29 ± 3° away from the substrate normal. Its final structure,
however, is less upright compared to that of QPDT assembled on GaAs at 1 mM NH4OH
(DR = 0.44, Figure 4.9b). Further comparison of Figures 4.9b-e reveals DRs that decrease
with increasing NH4OH concentration, similar to the trend observed for TPDT assembled
on GaAs from EtOH. The DR exhibited by QPDT assembled on GaAs from EtOH-rich
solutions at 1 mM NH4OH (DR = 0.44) is higher than that exhibited by TPDT assembled
on GaAs from EtOH 1 mM NH4OH (DR = 0.32). This observation indicates that QPDT
assemblies on GaAs are generally more upright than those of TPDT. The impact of
NH4OH concentration on the final structure of QPDT assemblies on GaAs from EtOH-
rich solutions (Figure 4.9) also appears to be less pronounced than that observed for
TPDT assemblies on GaAs from EtOH (Figure 4.6). Specifically, QPDT assemblies on
GaAs from EtOH-rich solvents exhibit upright preferential orientation across a wider
range of NH4OH concentrations (1 – 30 mM) than TPDT assemblies on GaAs from
EtOH (1 mM). We attribute the reduced impact of NH4OH concentration on the assembly
of QPDT on GaAs from EtOH-rich solutions to increased intermolecular interactions
between the longer QPDT backbones. The strong intermolecular interactions in QPDT
molecular assemblies strongly favor ordered molecular assembly structures, outweighing
competing effects, such as increased NH4OH concentrations.
In addition to the type of substrate used, the quality of the solvent, and the
concentration of the deprotecting agent, the concentration of the acetyl-protected
precursor in solution can also potentially impact the final structure. For instance, the

105
adsorption of alkylthiols on both Au12,21 and GaAs22 has been reported to be
concentration dependent. Specifically, Dannenberger et. al.21 observed that 1-
docosanethiol exhibited near-monolayer coverage on Au after ~1000 s when adsorbed
from a 0.5 µM solution in hexane. The same coverage was observed in ~100 s when the
adsorption of 1-docosanethiol on Au was carried out from a 10 µM solution.21 Similarly,
Jun et. al.22 reported final assembly thicknesses of 5 and 11Å for 1-hexadecanethiol
adsorbed on GaAs from 1 and 50 mM solutions in ethanol, respectively. The
concentration of conjugated thiols has also been shown to impact their adsorption on Au.
For example, Liao et. al.13 observed that 4’-methylmercapto-4-mercaptobiphenyl
exhibited equilibrium coverage on Au after ~600 s when adsorbed from a 60 µM solution
in toluene. The same molecule exhibited equilibrium coverage in ~150 s when the
adsorption on Au was carried out from a 256 µM solution in toluene,13 indicating that
higher molecule concentrations generally lead to faster assembly. Although different
molecular orientations were implied with varying precursor concentration, the molecular
orientation of the molecular assemblies was not actually quantified.12,21,22 In what
follows, we will specifically address how the concentration of the acetyl-protected
precursor influences the final surface coverage and ensemble-average orientation of
TPDT and QPDT molecular assemblies. Here, we focused on assemblies on GaAs. We
also held the NH4OH concentrations constant at concentrations that were previously
determined to yield the most ordered assemblies. Specifically, we used 1 mM NH4OH to
examine how the concentration of acetyl-protected TPDT precursor affects the assembly
on GaAs from EtOH. We used 160 mM NH4OH to examine how the acetyl-protected
TPDT and QPDT precursor concentration affects the assembly on GaAs from THF.
Figure 4.10a contains transmission IR spectra of TPDT assemblies on GaAs
formed from EtOH using 1 mM NH4OH. The concentration of the acetyl-protected TPDT
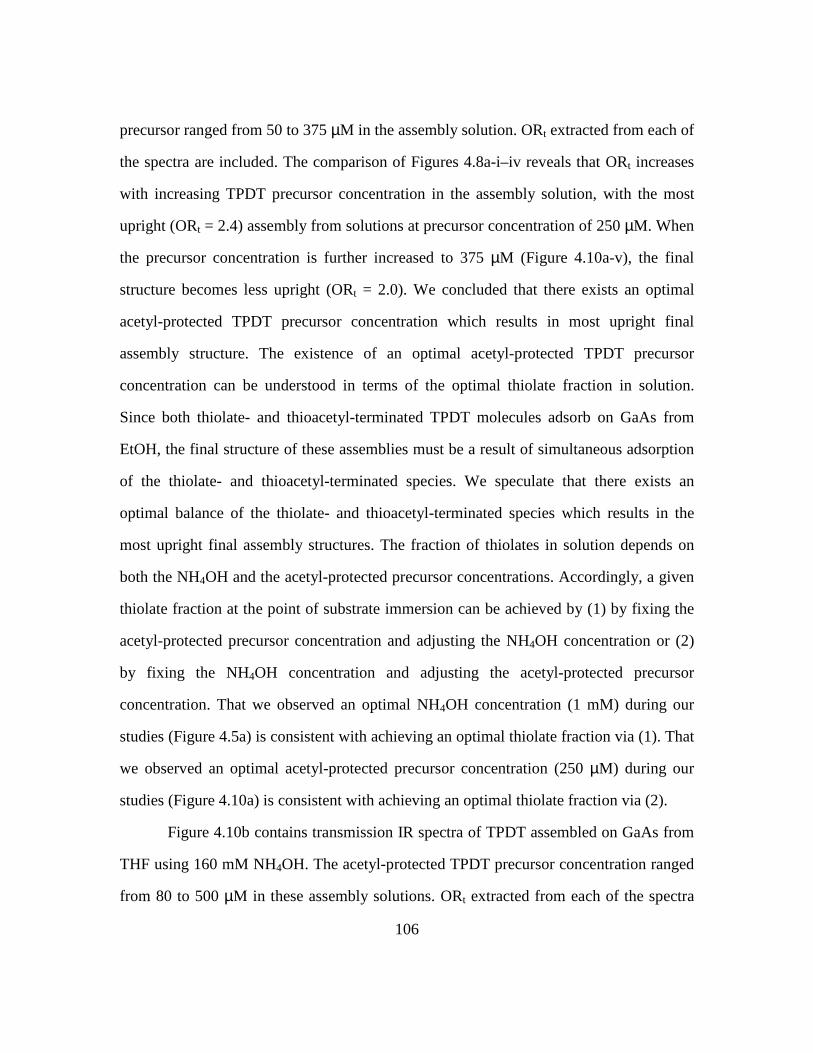
106
precursor ranged from 50 to 375 µM in the assembly solution. ORt extracted from each of
the spectra are included. The comparison of Figures 4.8a-i–iv reveals that ORt increases
with increasing TPDT precursor concentration in the assembly solution, with the most
upright (ORt = 2.4) assembly from solutions at precursor concentration of 250 µM. When
the precursor concentration is further increased to 375 µM (Figure 4.10a-v), the final
structure becomes less upright (ORt = 2.0). We concluded that there exists an optimal
acetyl-protected TPDT precursor concentration which results in most upright final
assembly structure. The existence of an optimal acetyl-protected TPDT precursor
concentration can be understood in terms of the optimal thiolate fraction in solution.
Since both thiolate- and thioacetyl-terminated TPDT molecules adsorb on GaAs from
EtOH, the final structure of these assemblies must be a result of simultaneous adsorption
of the thiolate- and thioacetyl-terminated species. We speculate that there exists an
optimal balance of the thiolate- and thioacetyl-terminated species which results in the
most upright final assembly structures. The fraction of thiolates in solution depends on
both the NH4OH and the acetyl-protected precursor concentrations. Accordingly, a given
thiolate fraction at the point of substrate immersion can be achieved by (1) by fixing the
acetyl-protected precursor concentration and adjusting the NH4OH concentration or (2)
by fixing the NH4OH concentration and adjusting the acetyl-protected precursor
concentration. That we observed an optimal NH4OH concentration (1 mM) during our
studies (Figure 4.5a) is consistent with achieving an optimal thiolate fraction via (1). That
we observed an optimal acetyl-protected precursor concentration (250 µM) during our
studies (Figure 4.10a) is consistent with achieving an optimal thiolate fraction via (2).
Figure 4.10b contains transmission IR spectra of TPDT assembled on GaAs from
THF using 160 mM NH4OH. The acetyl-protected TPDT precursor concentration ranged
from 80 to 500 µM in these assembly solutions. ORt extracted from each of the spectra

107
are included. The comparison of Figures 4.10b-i–iii reveals that ORt increase with
increasing acetyl-protected TPDT precursor concentrations, with the most upright (ORt =
1.9) assembly resulting at the highest precursor concentration of 500 µM. Since only
thiolate-terminated TPDT molecules adsorb on GaAs from THF, a high thiolate content
in solution is required to achieve decent surface coverages and structural organization.
High thiolate content in solution could result from both (1) increasing NH4OH
concentration and (2) increasing acetyl-protected precursor concentration at a given
NH4OH concentration. As demonstrated in our NH4OH concentration studies (Figure
4.5b) the highest NH4OH concentration of 160 mM resulted in the most upright
molecular assembly structure. The observation of the most upright molecular assembly
structure at the highest NH4OH concentration is consistent with achieving the highest
thiolate content in solution via (1). As we observed in this TPDT precursor concentration
study, the highest acetyl-protected TPDT precursor concentration of 500 µM led to the
most upright molecular assembly structure (Figure 4.10b). The occurrence of the most
upright molecular assembly structure at the highest TPDT precursor concentration is
consistent with achieving the highest thiolate content in solution via (2).
We examined the impact of the QPDT precursor concentration on its final
structure when assembled on GaAs from THF. Figure 4.11 contains transmission IR
spectra of QPDT assembled on GaAs from THF using 160 mM NH4OH. We explored the
precursor concentration ranging from 50 to 200 µM. ORt extracted from each of the
spectra are included. The comparison of Figures 4.11a-d reveals that ORt increase with
increasing acetyl-protected QPDT precursor concentrations in the assembly solution. A
maximum ORt = 4.5 was determined at the highest precursor concentration of 200 µM.
Similar assembly behavior, where more upright assembly structures resulted at higher
precursor concentrations, was observed for TPDT assembled on GaAs from THF (Figure
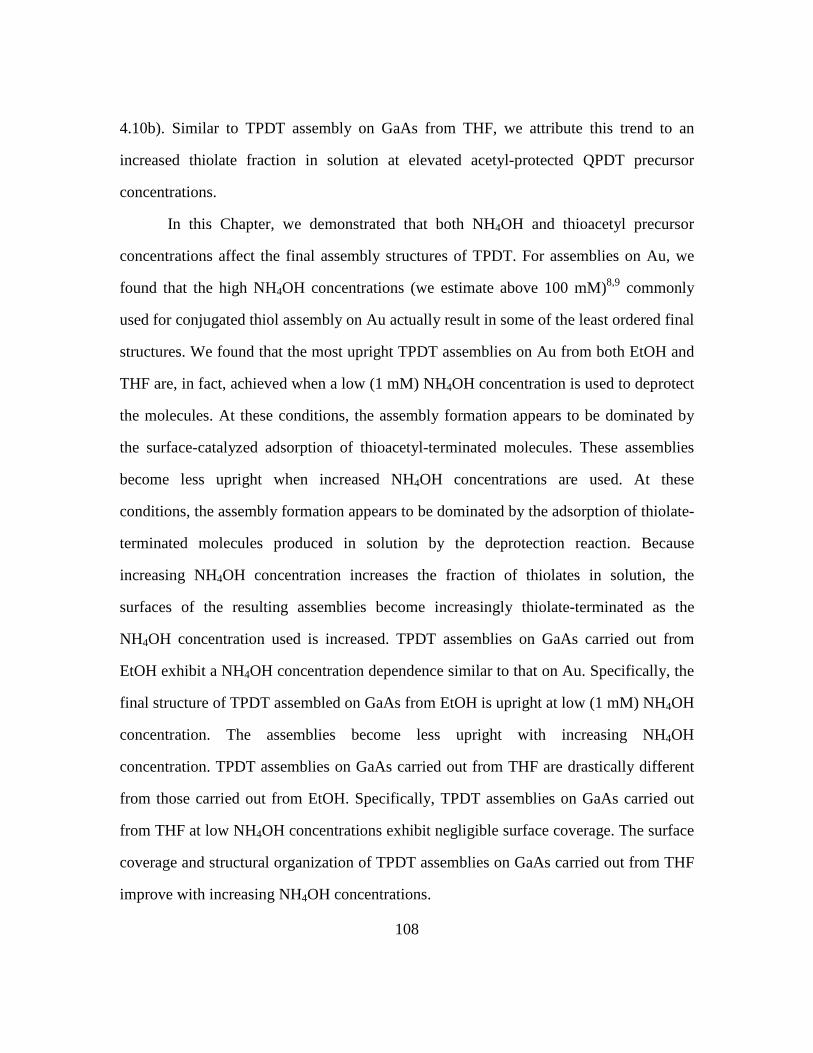
108
4.10b). Similar to TPDT assembly on GaAs from THF, we attribute this trend to an
increased thiolate fraction in solution at elevated acetyl-protected QPDT precursor
concentrations.
In this Chapter, we demonstrated that both NH4OH and thioacetyl precursor
concentrations affect the final assembly structures of TPDT. For assemblies on Au, we
found that the high NH4OH concentrations (we estimate above 100 mM)8,9 commonly
used for conjugated thiol assembly on Au actually result in some of the least ordered final
structures. We found that the most upright TPDT assemblies on Au from both EtOH and
THF are, in fact, achieved when a low (1 mM) NH4OH concentration is used to deprotect
the molecules. At these conditions, the assembly formation appears to be dominated by
the surface-catalyzed adsorption of thioacetyl-terminated molecules. These assemblies
become less upright when increased NH4OH concentrations are used. At these
conditions, the assembly formation appears to be dominated by the adsorption of thiolate-
terminated molecules produced in solution by the deprotection reaction. Because
increasing NH4OH concentration increases the fraction of thiolates in solution, the
surfaces of the resulting assemblies become increasingly thiolate-terminated as the
NH4OH concentration used is increased. TPDT assemblies on GaAs carried out from
EtOH exhibit a NH4OH concentration dependence similar to that on Au. Specifically, the
final structure of TPDT assembled on GaAs from EtOH is upright at low (1 mM) NH4OH
concentration. The assemblies become less upright with increasing NH4OH
concentration. TPDT assemblies on GaAs carried out from THF are drastically different
from those carried out from EtOH. Specifically, TPDT assemblies on GaAs carried out
from THF at low NH4OH concentrations exhibit negligible surface coverage. The surface
coverage and structural organization of TPDT assemblies on GaAs carried out from THF
improve with increasing NH4OH concentrations.
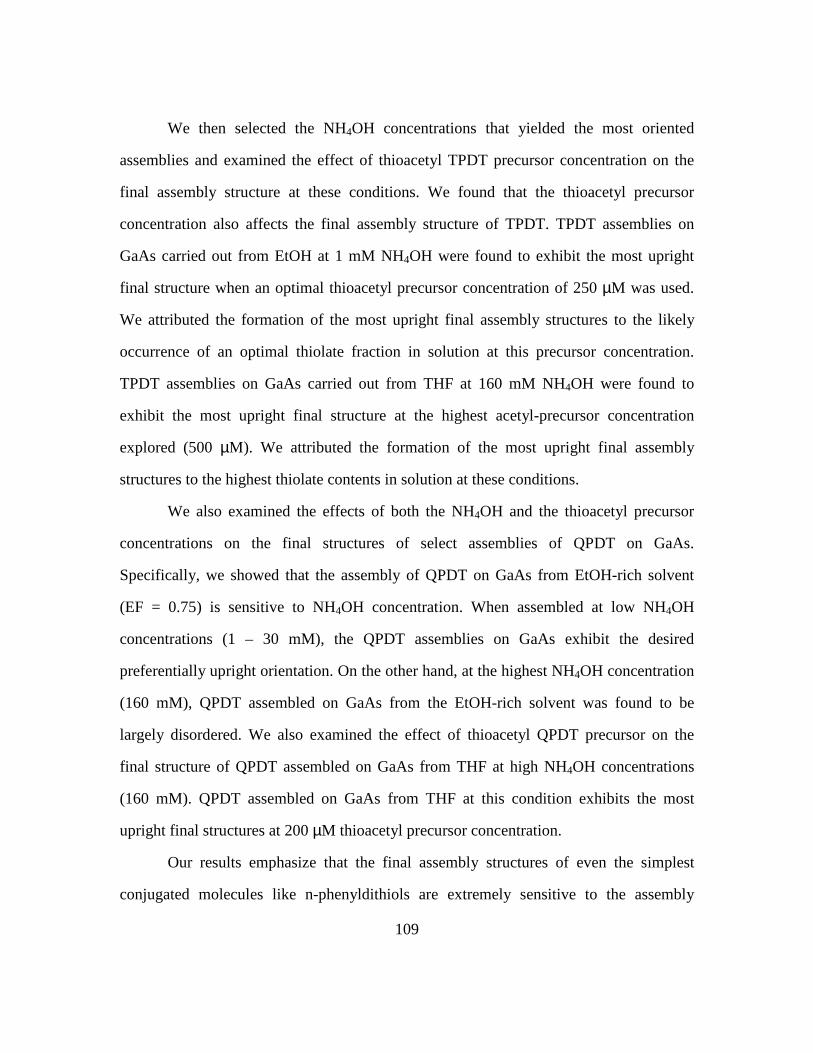
109
We then selected the NH4OH concentrations that yielded the most oriented
assemblies and examined the effect of thioacetyl TPDT precursor concentration on the
final assembly structure at these conditions. We found that the thioacetyl precursor
concentration also affects the final assembly structure of TPDT. TPDT assemblies on
GaAs carried out from EtOH at 1 mM NH4OH were found to exhibit the most upright
final structure when an optimal thioacetyl precursor concentration of 250 µM was used.
We attributed the formation of the most upright final assembly structures to the likely
occurrence of an optimal thiolate fraction in solution at this precursor concentration.
TPDT assemblies on GaAs carried out from THF at 160 mM NH4OH were found to
exhibit the most upright final structure at the highest acetyl-precursor concentration
explored (500 µM). We attributed the formation of the most upright final assembly
structures to the highest thiolate contents in solution at these conditions.
We also examined the effects of both the NH4OH and the thioacetyl precursor
concentrations on the final structures of select assemblies of QPDT on GaAs.
Specifically, we showed that the assembly of QPDT on GaAs from EtOH-rich solvent
(EF = 0.75) is sensitive to NH4OH concentration. When assembled at low NH4OH
concentrations (1 – 30 mM), the QPDT assemblies on GaAs exhibit the desired
preferentially upright orientation. On the other hand, at the highest NH4OH concentration
(160 mM), QPDT assembled on GaAs from the EtOH-rich solvent was found to be
largely disordered. We also examined the effect of thioacetyl QPDT precursor on the
final structure of QPDT assembled on GaAs from THF at high NH4OH concentrations
(160 mM). QPDT assembled on GaAs from THF at this condition exhibits the most
upright final structures at 200 µM thioacetyl precursor concentration.
Our results emphasize that the final assembly structures of even the simplest
conjugated molecules like n-phenyldithiols are extremely sensitive to the assembly
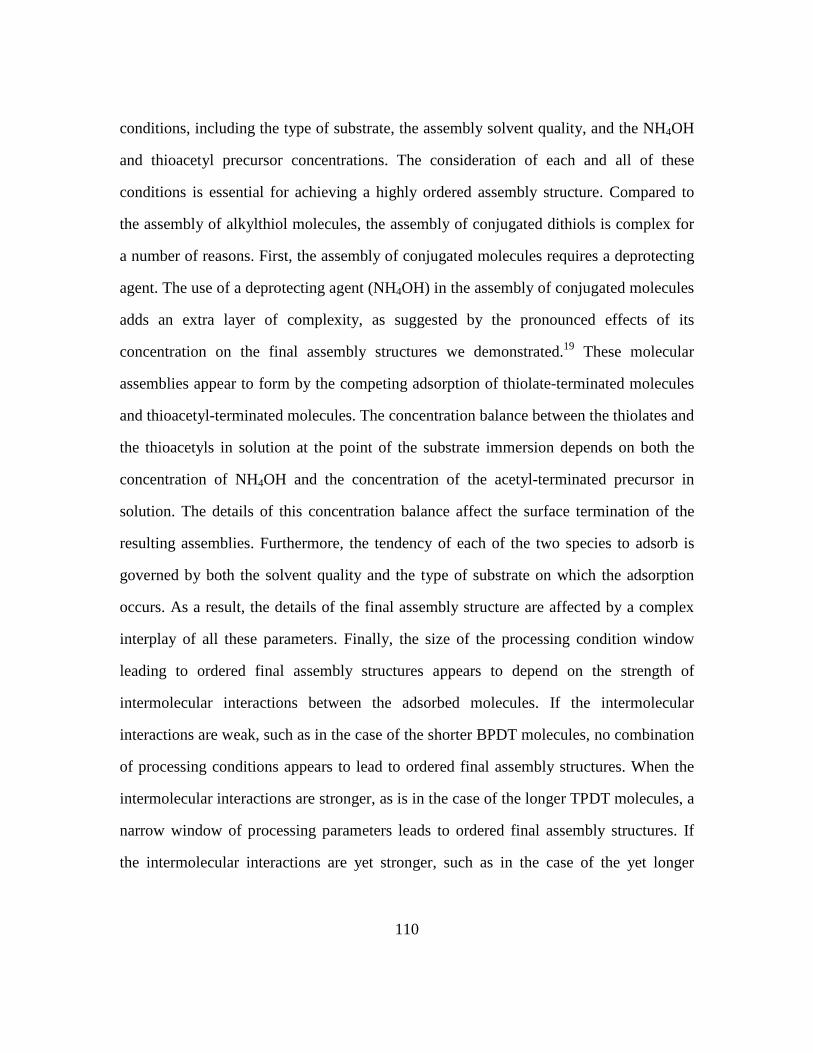
110
conditions, including the type of substrate, the assembly solvent quality, and the NH4OH
and thioacetyl precursor concentrations. The consideration of each and all of these
conditions is essential for achieving a highly ordered assembly structure. Compared to
the assembly of alkylthiol molecules, the assembly of conjugated dithiols is complex for
a number of reasons. First, the assembly of conjugated molecules requires a deprotecting
agent. The use of a deprotecting agent (NH4OH) in the assembly of conjugated molecules
adds an extra layer of complexity, as suggested by the pronounced effects of its
concentration on the final assembly structures we demonstrated.19 These molecular
assemblies appear to form by the competing adsorption of thiolate-terminated molecules
and thioacetyl-terminated molecules. The concentration balance between the thiolates and
the thioacetyls in solution at the point of the substrate immersion depends on both the
concentration of NH4OH and the concentration of the acetyl-terminated precursor in
solution. The details of this concentration balance affect the surface termination of the
resulting assemblies. Furthermore, the tendency of each of the two species to adsorb is
governed by both the solvent quality and the type of substrate on which the adsorption
occurs. As a result, the details of the final assembly structure are affected by a complex
interplay of all these parameters. Finally, the size of the processing condition window
leading to ordered final assembly structures appears to depend on the strength of
intermolecular interactions between the adsorbed molecules. If the intermolecular
interactions are weak, such as in the case of the shorter BPDT molecules, no combination
of processing conditions appears to lead to ordered final assembly structures. When the
intermolecular interactions are stronger, as is in the case of the longer TPDT molecules, a
narrow window of processing parameters leads to ordered final assembly structures. If
the intermolecular interactions are yet stronger, such as in the case of the yet longer

111
QPDT molecules, ordered final assembly structures result across a wider range of
processing conditions.
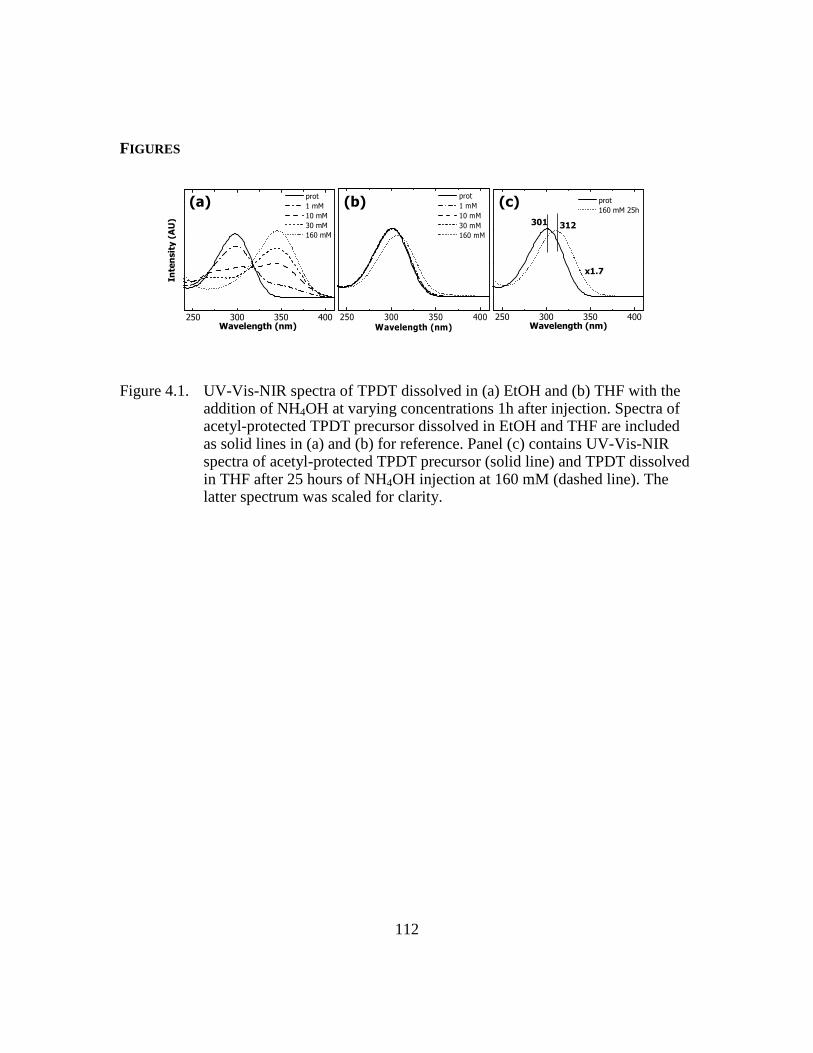
112
FIGURES
(a) (b) (c)
250 300 350 400
prot
1 mM
10 mM
30 mM
160 mM
Wavelength (nm)
Intensity (AU)
250 300 350 400
prot
160 mM 25h
Wavelength (nm)
x1.7
301 312
250 300 350 400
prot
1 mM
10 mM
30 mM
160 mM
Wavelength (nm)
Figure 4.1. UV-Vis-NIR spectra of TPDT dissolved in (a) EtOH and (b) THF with the addition of NH4OH at varying concentrations 1h after injection. Spectra of acetyl-protected TPDT precursor dissolved in EtOH and THF are included as solid lines in (a) and (b) for reference. Panel (c) contains UV-Vis-NIR spectra of acetyl-protected TPDT precursor (solid line) and TPDT dissolved in THF after 25 hours of NH4OH injection at 160 mM (dashed line). The latter spectrum was scaled for clarity.
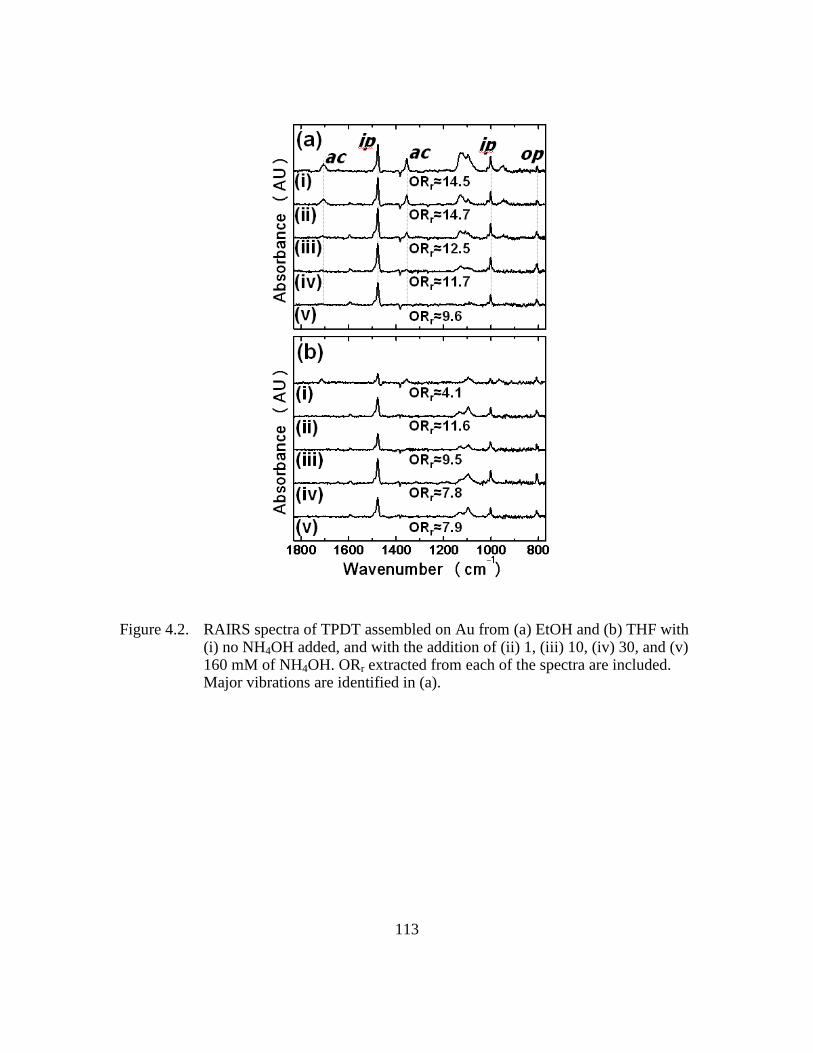
113
Figure 4.2. RAIRS spectra of TPDT assembled on Au from (a) EtOH and (b) THF with (i) no NH4OH added, and with the addition of (ii) 1, (iii) 10, (iv) 30, and (v) 160 mM of NH4OH. ORr extracted from each of the spectra are included. Major vibrations are identified in (a).

114
Figure 4.3. C 1s angle-dependent, pre- and post-edge normalized NEXAFS spectra of TPDT assembled on Au from (a) EtOH and (b) THF with (i) no NH4OH added, and with the addition of (ii) 1, (iii) 10, (iv) 30, and (v) 160 mM NH4OH. The dichroic ratios derived from each set of spectra are included.
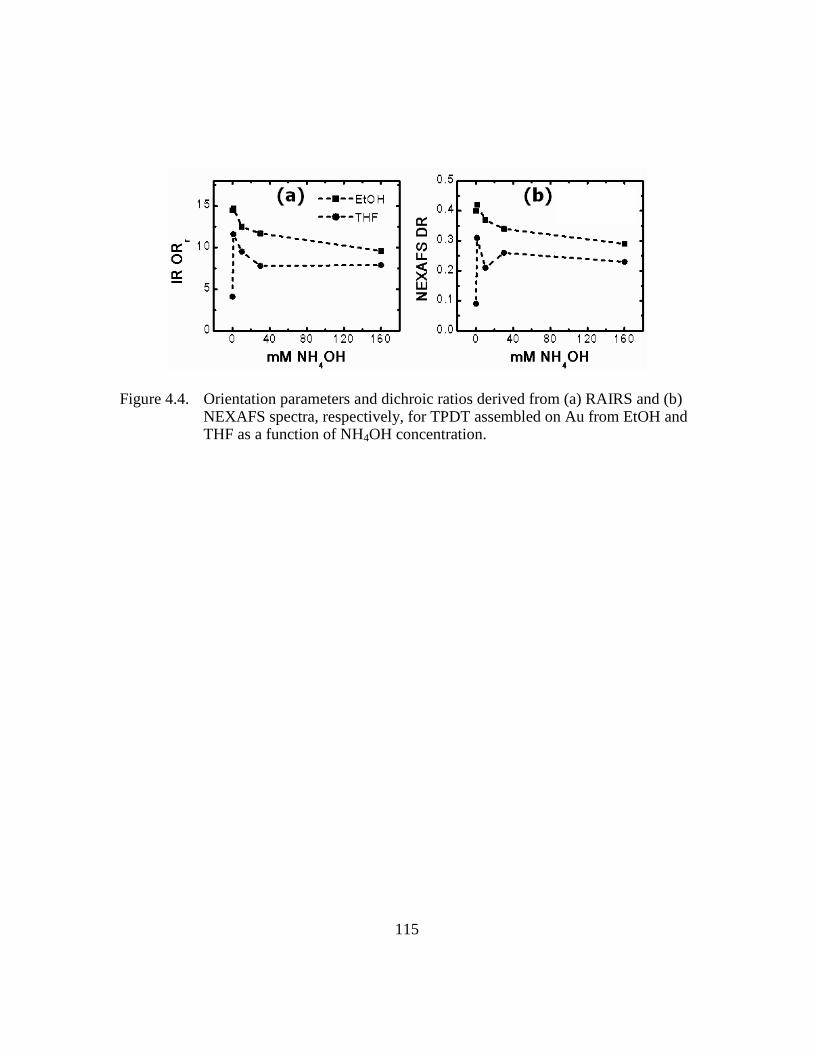
115
Figure 4.4. Orientation parameters and dichroic ratios derived from (a) RAIRS and (b) NEXAFS spectra, respectively, for TPDT assembled on Au from EtOH and THF as a function of NH4OH concentration.

116
1800 1600 1400 1200 1000 800
Absorbance (AU)
Wavenumber (cm-1)
1800 1600 1400 1200 1000 800
Absorbance (AU)
(a)
(v)
(iii)
(ii)
(i)
(b)
ac ip
op
(iv)
(v)
(iii)
(ii)
(i)
(iv)
OR≈1.6
OR≈1.6
OR≈2.0
OR≈2.6
OR≈1.9
OR≈1.5
OR≈1.1
OR≈0.8
OR≈0.4
OR≈0.1
ORt≈1.5
ORt≈1.9
ORt≈2.6
ORt≈2.0
ORt≈1.6
ORt≈1.5
ORt≈0.1
ORt≈0.4
ORt≈0.8
ORt≈1.1
Figure 4.5. Transmission IR spectra of TPDT assembled on GaAs from (a) EtOH and (b) THF with (i) no NH4OH added, and with the addition of (ii) 1, (iii) 10, (iv) 30, and (v) 160 mM NH4OH. ORt extracted from each of the spectra are included. Major vibrations are identified in (a).
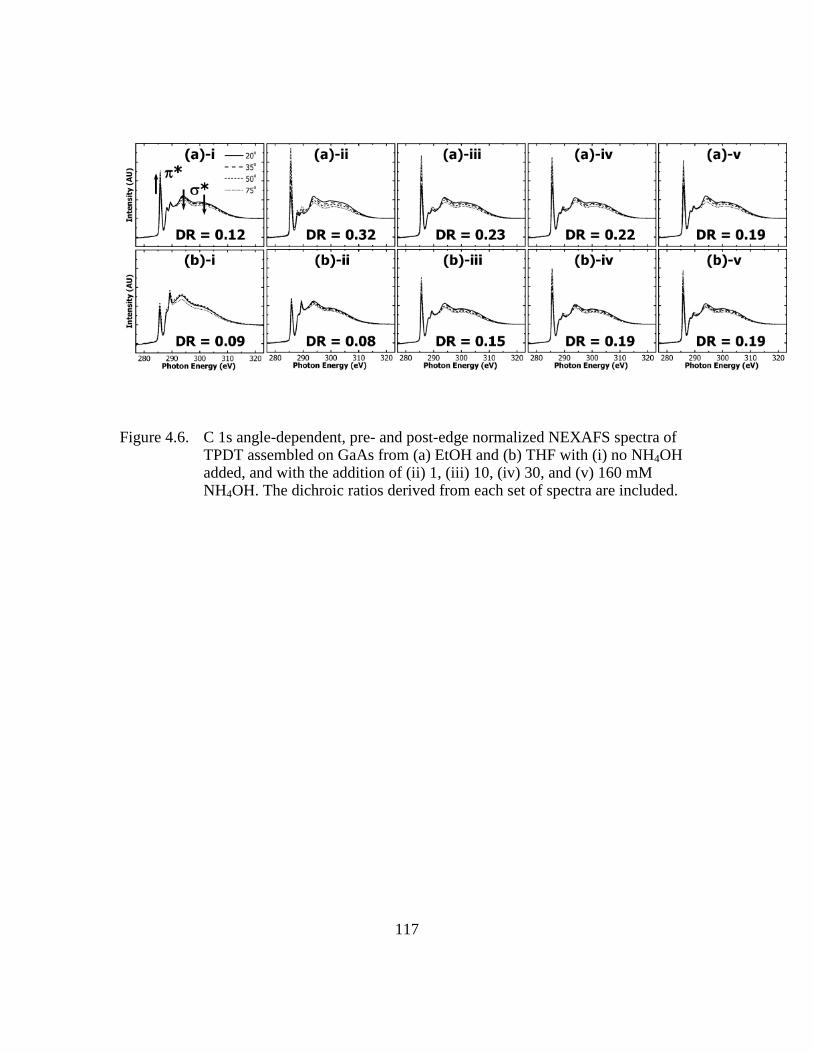
117
Figure 4.6. C 1s angle-dependent, pre- and post-edge normalized NEXAFS spectra of TPDT assembled on GaAs from (a) EtOH and (b) THF with (i) no NH4OH added, and with the addition of (ii) 1, (iii) 10, (iv) 30, and (v) 160 mM NH4OH. The dichroic ratios derived from each set of spectra are included.
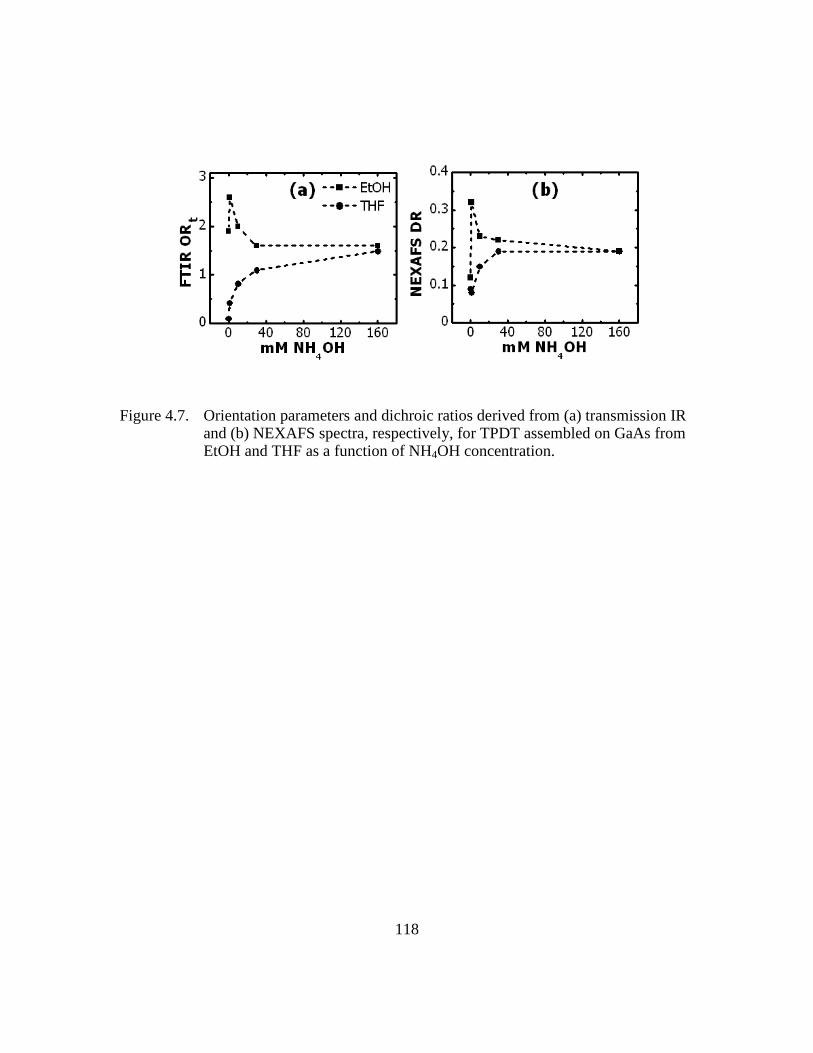
118
Figure 4.7. Orientation parameters and dichroic ratios derived from (a) transmission IR and (b) NEXAFS spectra, respectively, for TPDT assembled on GaAs from EtOH and THF as a function of NH4OH concentration.
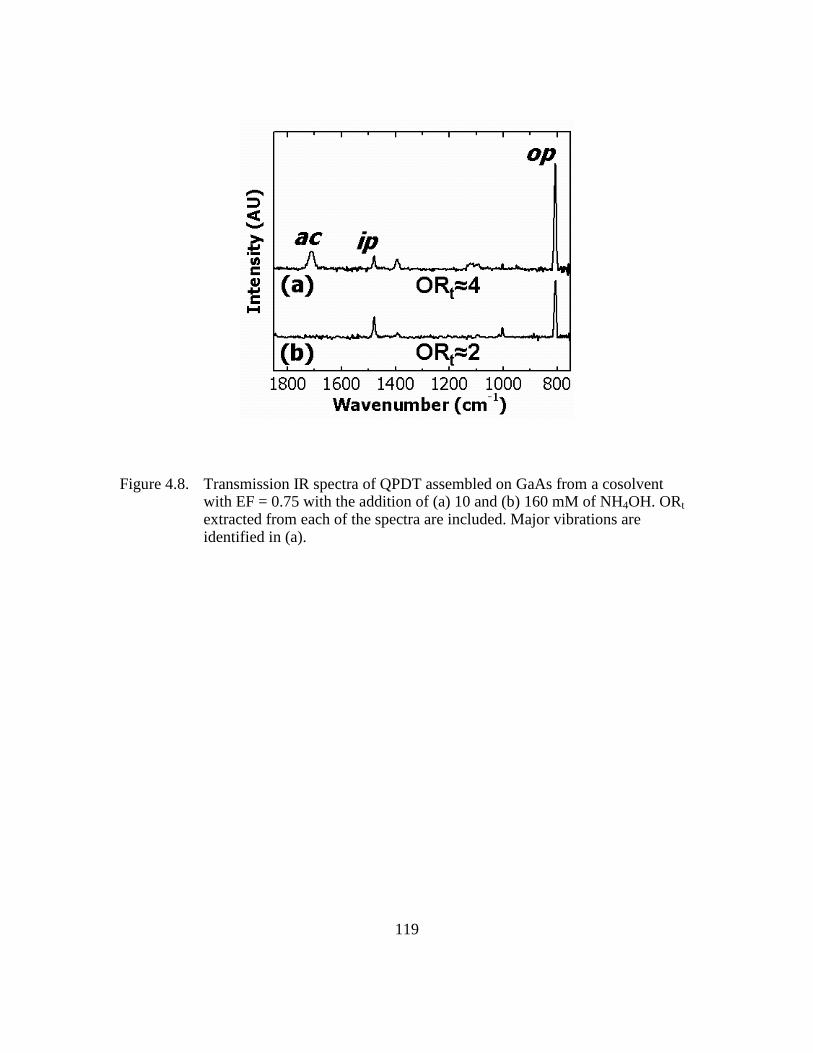
119
Figure 4.8. Transmission IR spectra of QPDT assembled on GaAs from a cosolvent with EF = 0.75 with the addition of (a) 10 and (b) 160 mM of NH4OH. ORt extracted from each of the spectra are included. Major vibrations are identified in (a).
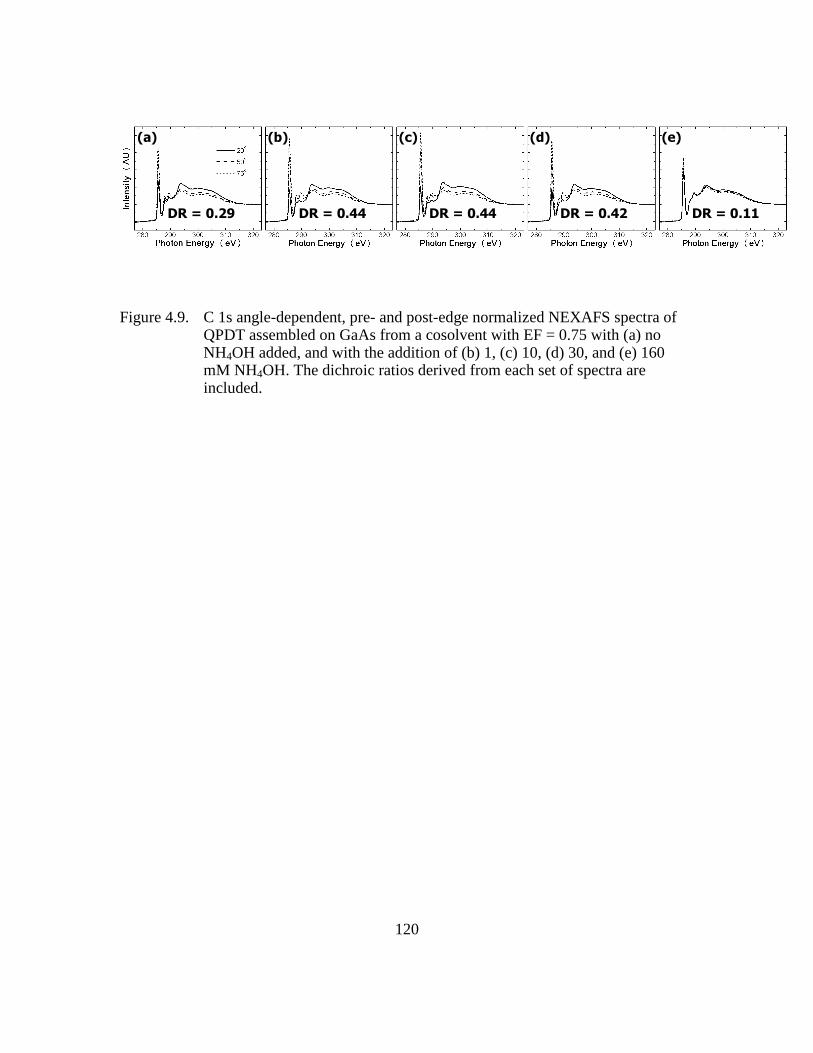
120
(a)
DR = 0.29
(b)
DR = 0.44
(c)
DR = 0.44
(d)
DR = 0.42
(e)
DR = 0.11
Figure 4.9. C 1s angle-dependent, pre- and post-edge normalized NEXAFS spectra of QPDT assembled on GaAs from a cosolvent with EF = 0.75 with (a) no NH4OH added, and with the addition of (b) 1, (c) 10, (d) 30, and (e) 160 mM NH4OH. The dichroic ratios derived from each set of spectra are included.

121
Figure 4.10. Transmission IR spectra of TPDT assembled on GaAs from (a) EtOH with the addition of 1 mM NH4OH and (b) THF with the addition of 160 mM NH4OH. The TPDT precursor concentration varied from (i) 50, (ii) 80, (iii) 125, (iv) 250, to (v) 375 µM for the assemblies from EtOH and from (i) 80, (ii) 200, to (iii) 500 µM for the assemblies from THF. ORt extracted from each of the spectra are included. Major vibrations are identified in (a).

122
Figure 4.11. Transmission IR spectra of QPDT assembled on GaAs from THF with the addition of 160 mM NH4OH and QPDT precursor concentration of (a) 50, (b) 100, (c) 150, and (d) 200 µM. ORt extracted from each of the spectra are included. Major vibrations are identified in (a).
123
REFERENCES
1. Tour, J. M.; Jones, L.; Pearson, D. L.; Lamba, J. J. S.; Burgin, T. P.; Whitesides, G. M.; Allara, D. L.; Parikh, A. N.; Atre, S. Journal of the American Chemical Society 1995, 117, 9529.
2. Weckenmann, U.; Mittler, S.; Naumann, K.; Fischer, R. A. Langmuir 2002, 18, 5479.
3. Pollack, S. K.; Naciri, J.; Mastrangelo, J.; Patterson, C. H.; Torres, J.; Moore, M.; Shashidhar, R.; Kushmerick, J. G. Langmuir 2004, 20, 1838.
4. Donhauser, Z. J.; Mantooth, B. A.; Kelly, K. F.; Bumm, L. A.; Monnell, J. D.; Stapleton, J. J.; Price Jr, D. W.; Rawlett, A. M.; Allara, D. L.; Tour, J. M.; Weiss, P. S. Science 2001, 292, 2303.
5. Cai, L.; Bahr, J. L.; Yao, Y.; Tour, J. M. Chemistry of Materials 2002, 14, 4235.
6. Shaporenko, A.; Elbing, M.; Blaszczyk, A.; Von Haenisch, C.; Mayor, M.; Zharnikov, M. Journal of Physical Chemistry B 2006, 110, 4307.
7. Cai, L.; Yao, Y.; Yang, J.; Price, D. W., Jr.; Tour, J. M. Chemistry of Materials 2002, 14, 2905.
8. de Boer, B.; Meng, H.; Perepichka, D. F.; Zheng, J.; Frank, M. M.; Chabal, Y. J.; Bao, Z. Langmuir 2003, 19, 4272.
9. Jiang, W.; Zhitenev, N.; Bao, Z.; Meng, H.; Abusch-Magder, D.; Tennant, D.; Garfunkel, E. Langmuir 2005, 21, 8751.
10. Lebedev, M. V.; Mayer, T.; Jaegermann, W. Surface Science 2003, 547, 171.
11. Ke, Y.; Milano, S.; Wang, X. W.; Tao, N.; Darici, Y. Surface Science 1998, 415, 29.
12. Bain, C. D.; Troughton, E. B.; Tao, Y. T.; Evall, J.; Whitesides, G. M.; Nuzzo, R. G. Journal of the American Chemical Society 1989, 111, 321.
13. Liao, S.; Shnidman, Y.; Ulman, A. Journal of the American Chemical Society 2000, 122, 3688.
14. Krapchetov, D. A.; Ma, H.; Jen, A. K. Y.; Fischer, D. A.; Loo, Y.-L. Langmuir 2005, 21, 5887.
124
15. L.G. Wade, J., Organic Chemistry. Prentice-Hall, Inc.: Upper Saddle River, New Jersey, 1999, p 649.
16. Niklewski, A.; Azzam, W.; Strunskus, T.; Fischer, R. A.; Woell, C. Langmuir 2004, 20, 8620.
17. Kushmerick, J. G.; Holt, D. B.; Yang, J. C.; Naciri, J.; Moore, M. H.; Shashidhar, R. Physical Review Letters 2002, 89, 086802/1.
18. Lau, K. H. A.; Huang, C.; Yakovlev, N.; Chen, Z. K.; O'Shea, S. J. Langmuir 2006, 22, 2968.
19. Krapchetov, D. A.; Ma, H.; Jen, A. K. Y.; Fischer, D. A.; Loo, Y.-L. Langmuir 2008, 24, 851.
20. de Boer, B.; Frank, M. M.; Chabal, Y. J.; Jiang, W.; Garfunkel, E.; Bao, Z. Langmuir 2004, 20, 1539.
21. Dannenberger, O.; Buck, M.; Grunze, M. Journal of Physical Chemistry B 1999, 103, 2202.
22. Jun, Y.; Zhu, X. Y.; Hsu, J. W. P. Langmuir 2006, 22, 3627.
125
Chapter 5: Deposition of Top Metal Electrode and Characterization of
the Molecule-Electrode Interface in Model Conjugated Assemblies on
GaAs
Nano-scale electronics where single molecules or molecular assemblies comprise
the electrically-active component1 require the ability to reliably ‘wire’ the molecules. One
of the common approaches of wiring the molecules involves covalently attaching the
molecules to a substrate which can then act as the electrode for self assembly, followed
by placing a second electrode, usually Au, in contact with the molecular assembly
surface. To-date, several approaches of depositing the top electrode on molecular
assembly surfaces have been developed.2-5 One of these approaches involves evaporating
a metal layer directly onto a molecular assembly surface.6-8 The metal source and the
assembly surface are placed within a direct line of sight relative to each other during
evaporation.6-8 Direct metal evaporation, however, often results in the evaporated metal
penetrating through the molecular assembly to the substrate surface,6,9,10 resulting in
electrical shorts between the evaporated top electrode and the substrate. To reduce the
occurrence of metal penetration, an indirect evaporation approach has been
developed.10,11 In indirect evaporation, the metal is evaporated onto the molecular
assembly surface by placing the metal source and the molecular assembly out of direct
line of sight relative to each other. Such placement minimizes the impingement of direct
metal flux on the molecular assembly surface. Although indirect evaporation helps to
reduce the occurrence of metal atom penetration through the molecular assembly,
electrical shorts still occur because metal atoms reach the substrate through pinholes in
the molecular assembly.11-13
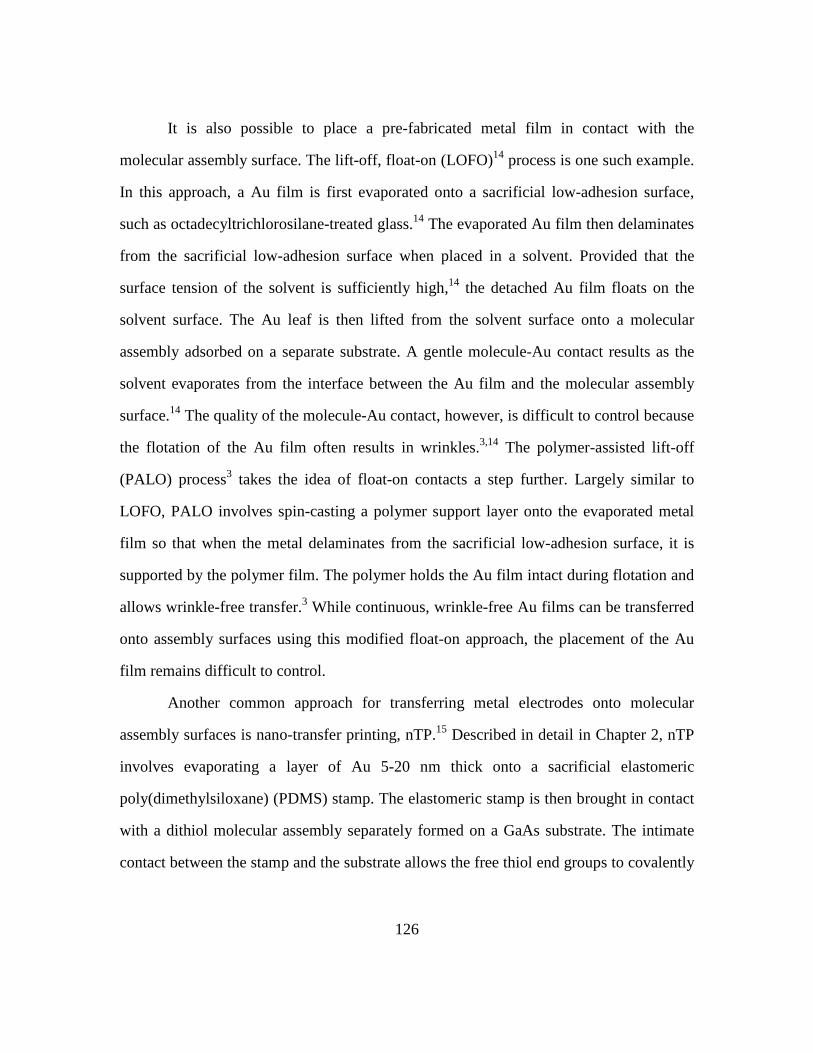
126
It is also possible to place a pre-fabricated metal film in contact with the
molecular assembly surface. The lift-off, float-on (LOFO)14 process is one such example.
In this approach, a Au film is first evaporated onto a sacrificial low-adhesion surface,
such as octadecyltrichlorosilane-treated glass.14 The evaporated Au film then delaminates
from the sacrificial low-adhesion surface when placed in a solvent. Provided that the
surface tension of the solvent is sufficiently high,14 the detached Au film floats on the
solvent surface. The Au leaf is then lifted from the solvent surface onto a molecular
assembly adsorbed on a separate substrate. A gentle molecule-Au contact results as the
solvent evaporates from the interface between the Au film and the molecular assembly
surface.14 The quality of the molecule-Au contact, however, is difficult to control because
the flotation of the Au film often results in wrinkles.3,14 The polymer-assisted lift-off
(PALO) process3 takes the idea of float-on contacts a step further. Largely similar to
LOFO, PALO involves spin-casting a polymer support layer onto the evaporated metal
film so that when the metal delaminates from the sacrificial low-adhesion surface, it is
supported by the polymer film. The polymer holds the Au film intact during flotation and
allows wrinkle-free transfer.3 While continuous, wrinkle-free Au films can be transferred
onto assembly surfaces using this modified float-on approach, the placement of the Au
film remains difficult to control.
Another common approach for transferring metal electrodes onto molecular
assembly surfaces is nano-transfer printing, nTP.15 Described in detail in Chapter 2, nTP
involves evaporating a layer of Au 5-20 nm thick onto a sacrificial elastomeric
poly(dimethylsiloxane) (PDMS) stamp. The elastomeric stamp is then brought in contact
with a dithiol molecular assembly separately formed on a GaAs substrate. The intimate
contact between the stamp and the substrate allows the free thiol end groups to covalently
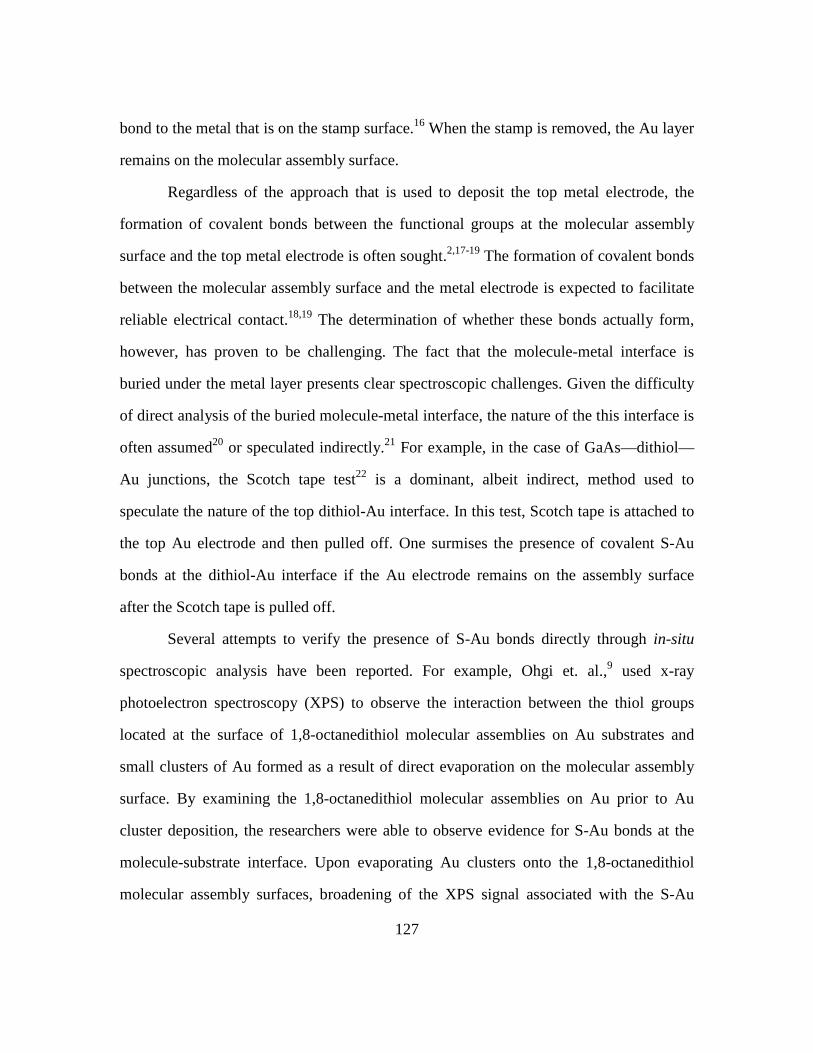
127
bond to the metal that is on the stamp surface.16 When the stamp is removed, the Au layer
remains on the molecular assembly surface.
Regardless of the approach that is used to deposit the top metal electrode, the
formation of covalent bonds between the functional groups at the molecular assembly
surface and the top metal electrode is often sought.2,17-19 The formation of covalent bonds
between the molecular assembly surface and the metal electrode is expected to facilitate
reliable electrical contact.18,19 The determination of whether these bonds actually form,
however, has proven to be challenging. The fact that the molecule-metal interface is
buried under the metal layer presents clear spectroscopic challenges. Given the difficulty
of direct analysis of the buried molecule-metal interface, the nature of the this interface is
often assumed20 or speculated indirectly.21 For example, in the case of GaAs—dithiol—
Au junctions, the Scotch tape test22 is a dominant, albeit indirect, method used to
speculate the nature of the top dithiol-Au interface. In this test, Scotch tape is attached to
the top Au electrode and then pulled off. One surmises the presence of covalent S-Au
bonds at the dithiol-Au interface if the Au electrode remains on the assembly surface
after the Scotch tape is pulled off.
Several attempts to verify the presence of S-Au bonds directly through in-situ
spectroscopic analysis have been reported. For example, Ohgi et. al.,9 used x-ray
photoelectron spectroscopy (XPS) to observe the interaction between the thiol groups
located at the surface of 1,8-octanedithiol molecular assemblies on Au substrates and
small clusters of Au formed as a result of direct evaporation on the molecular assembly
surface. By examining the 1,8-octanedithiol molecular assemblies on Au prior to Au
cluster deposition, the researchers were able to observe evidence for S-Au bonds at the
molecule-substrate interface. Upon evaporating Au clusters onto the 1,8-octanedithiol
molecular assembly surfaces, broadening of the XPS signal associated with the S-Au
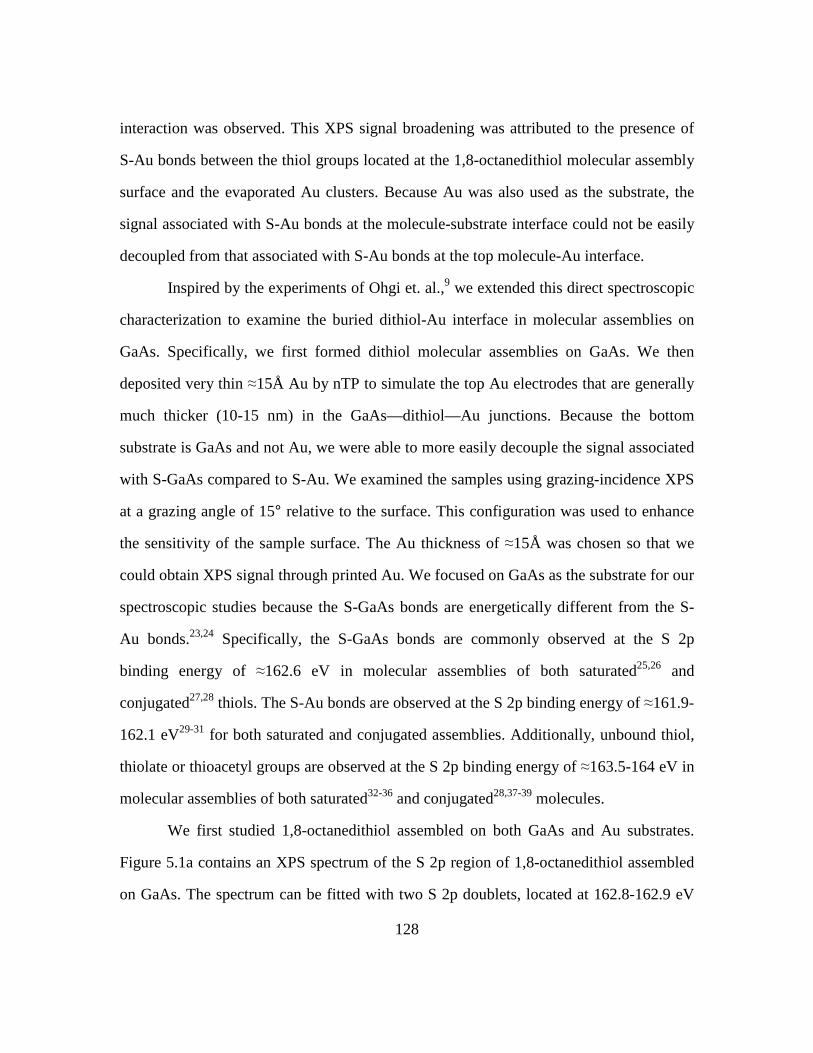
128
interaction was observed. This XPS signal broadening was attributed to the presence of
S-Au bonds between the thiol groups located at the 1,8-octanedithiol molecular assembly
surface and the evaporated Au clusters. Because Au was also used as the substrate, the
signal associated with S-Au bonds at the molecule-substrate interface could not be easily
decoupled from that associated with S-Au bonds at the top molecule-Au interface.
Inspired by the experiments of Ohgi et. al.,9 we extended this direct spectroscopic
characterization to examine the buried dithiol-Au interface in molecular assemblies on
GaAs. Specifically, we first formed dithiol molecular assemblies on GaAs. We then
deposited very thin ≈15Å Au by nTP to simulate the top Au electrodes that are generally
much thicker (10-15 nm) in the GaAs—dithiol—Au junctions. Because the bottom
substrate is GaAs and not Au, we were able to more easily decouple the signal associated
with S-GaAs compared to S-Au. We examined the samples using grazing-incidence XPS
at a grazing angle of 15° relative to the surface. This configuration was used to enhance
the sensitivity of the sample surface. The Au thickness of ≈15Å was chosen so that we
could obtain XPS signal through printed Au. We focused on GaAs as the substrate for our
spectroscopic studies because the S-GaAs bonds are energetically different from the S-
Au bonds.23,24 Specifically, the S-GaAs bonds are commonly observed at the S 2p
binding energy of ≈162.6 eV in molecular assemblies of both saturated25,26 and
conjugated27,28 thiols. The S-Au bonds are observed at the S 2p binding energy of ≈161.9-
162.1 eV29-31 for both saturated and conjugated assemblies. Additionally, unbound thiol,
thiolate or thioacetyl groups are observed at the S 2p binding energy of ≈163.5-164 eV in
molecular assemblies of both saturated32-36 and conjugated28,37-39 molecules.
We first studied 1,8-octanedithiol assembled on both GaAs and Au substrates.
Figure 5.1a contains an XPS spectrum of the S 2p region of 1,8-octanedithiol assembled
on GaAs. The spectrum can be fitted with two S 2p doublets, located at 162.8-162.9 eV
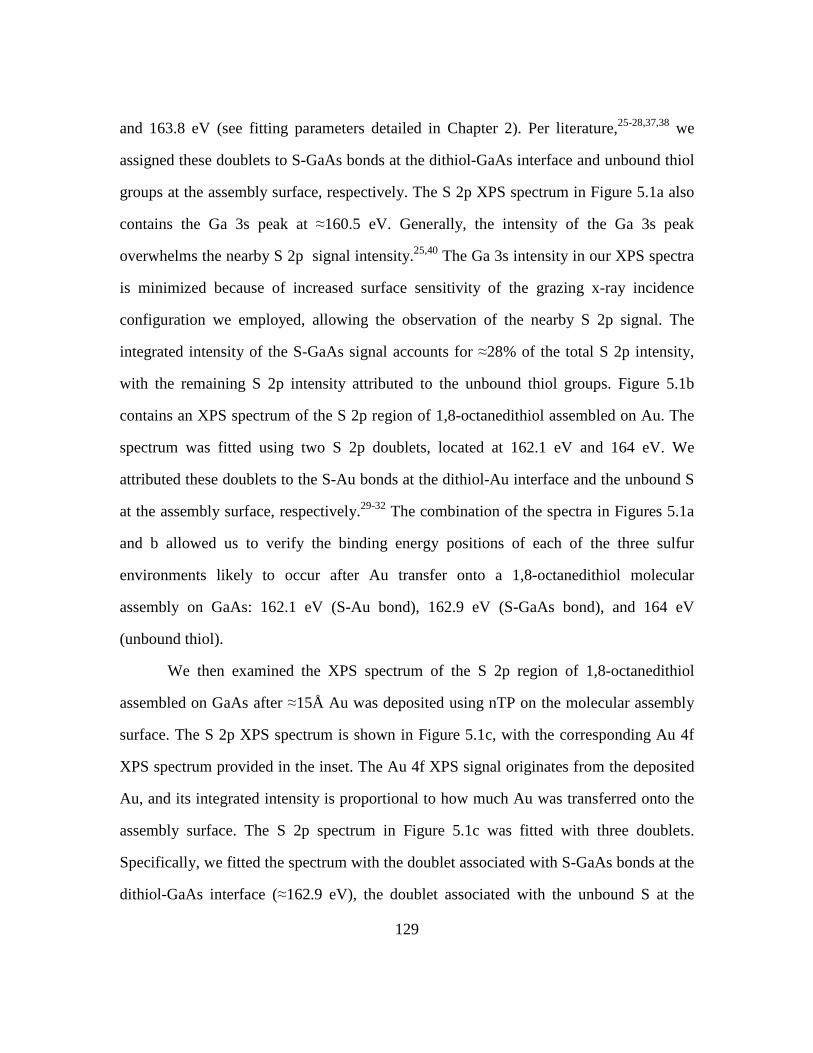
129
and 163.8 eV (see fitting parameters detailed in Chapter 2). Per literature,25-28,37,38 we
assigned these doublets to S-GaAs bonds at the dithiol-GaAs interface and unbound thiol
groups at the assembly surface, respectively. The S 2p XPS spectrum in Figure 5.1a also
contains the Ga 3s peak at ≈160.5 eV. Generally, the intensity of the Ga 3s peak
overwhelms the nearby S 2p signal intensity.25,40 The Ga 3s intensity in our XPS spectra
is minimized because of increased surface sensitivity of the grazing x-ray incidence
configuration we employed, allowing the observation of the nearby S 2p signal. The
integrated intensity of the S-GaAs signal accounts for ≈28% of the total S 2p intensity,
with the remaining S 2p intensity attributed to the unbound thiol groups. Figure 5.1b
contains an XPS spectrum of the S 2p region of 1,8-octanedithiol assembled on Au. The
spectrum was fitted using two S 2p doublets, located at 162.1 eV and 164 eV. We
attributed these doublets to the S-Au bonds at the dithiol-Au interface and the unbound S
at the assembly surface, respectively.29-32 The combination of the spectra in Figures 5.1a
and b allowed us to verify the binding energy positions of each of the three sulfur
environments likely to occur after Au transfer onto a 1,8-octanedithiol molecular
assembly on GaAs: 162.1 eV (S-Au bond), 162.9 eV (S-GaAs bond), and 164 eV
(unbound thiol).
We then examined the XPS spectrum of the S 2p region of 1,8-octanedithiol
assembled on GaAs after ≈15Å Au was deposited using nTP on the molecular assembly
surface. The S 2p XPS spectrum is shown in Figure 5.1c, with the corresponding Au 4f
XPS spectrum provided in the inset. The Au 4f XPS signal originates from the deposited
Au, and its integrated intensity is proportional to how much Au was transferred onto the
assembly surface. The S 2p spectrum in Figure 5.1c was fitted with three doublets.
Specifically, we fitted the spectrum with the doublet associated with S-GaAs bonds at the
dithiol-GaAs interface (≈162.9 eV), the doublet associated with the unbound S at the

130
assembly surface (≈164 eV), and a third doublet associated with S-Au bonds (≈162 eV).
The integrated intensity of the S-GaAs signal derived from our fit accounts for ≈26% of
the total S 2p intensity, with the rest of S 2p signal attributed to unbound S (≈40%) and
S-Au (≈34%). The S-GaAs intensity accounts for a similar fraction of the total S 2p
signal before (≈28%, Figure 5.1a) and after (≈26%, Figure 5.1c) Au deposition. Since the
S-GaAs relative intensity is unchanged, and the relative intensity attributed to the
unbound thiol groups before Au deposition decreased, we deduced that a fraction of the
unbound thiol groups at the molecular assembly surface bonded with the deposited Au.
We calculated the fraction of the unbound thiol groups that have formed S-Au
bonds with the deposited Au, or the S-Au conversion, as:
unboundSI
AuSI
AuSI
−+−
−=− conversionAu S Equation (5.1)
In Equation (5.1), IS-Au is the integrated intensity of the S-Au signal at ≈162 eV after Au
deposition; IS-unbound is the integrated intensity of the unbound S signal at ≈164 eV before
Au deposition. Applying Equation (5.1) to the integrated intensities extracted from Figure
5.1c shows that, out of ≈75% S 2p integrated intensity attributed to unbound thiols before
printing Au, a fraction of roughly 34/(40+34) ≈ 45% appears to have formed S-Au bonds
after Au deposition. The observation that this fraction is not 100% can be explained by
the reduced coverage of the deposited Au. Specifically, we found the ≈15Å Au deposited
on the 1,8-octanedithiol assembly surface using nTP is discontinuous. In fact, we
estimated that the coverage is only 40-45% by scanning electron microscopy. If
normalized by the coverage of deposited Au, the fraction of the unbound thiol groups that
have formed S-Au bonds with the deposited Au, is ≈100%. Our results suggest that we

131
are able to directly observe the S-Au bonds formed between the unbound thiol groups of
1,8-octanedithiol assembled on GaAs and Au deposited by nTP onto the assembly
surface.
Having established the ability to observe S-Au bonds at the buried dithiol-Au
interface prepared by transferring thin Au onto 1,8-octanedithiol assembled on GaAs, we
characterized a comparable interface prepared by transferring thin Au onto molecular
assemblies of QPDT on GaAs. QPDT was assembled on GaAs from a cosolvent with EF
= 0.75 using 10 mM NH4OH. As shown in Chapter 4, these processing conditions result
in a largely acetyl-terminated molecular assembly, with an ensemble-average QPDT
backbone tilt of 20±3° away from the substrate normal. We focused on these
preferentially upright molecular assemblies in an effort to maximize the amount of
functional groups potentially available for S-Au bond formation at the assembly surface.
We deposited Au on the assembly surfaces using our ‘wet’ nTP approach in
dichloroethane (DCE), as described in Chapter 2.
Figure 5.2a contains an XPS spectrum of the S 2p region of QPDT assembled on
GaAs. The spectrum was fitted with two S 2p doublets, located at ≈162.8 and ≈164 eV.
Similar to the 1,8-octanedithiol molecular assemblies, we attributed the doublet at ≈162.8
eV to S-GaAs bonds at the QPDT-GaAs interface. The doublet at ≈164 eV was attributed
to the unbound thiolate/thioacetyl groups at the QPDT molecular assembly surface.27,28
Additionally, the signal associated with the Ga 3s is located at ≈160.5 eV. The integrated
intensity of the S-GaAs signal in the S 2p spectrum in Figure 5.2a accounts for ≈19% of
the total S 2p intensity, with the remaining ≈81% from the unbound S at the molecular
assembly surface. The higher intensity of the unbound S relative to the S-GaAs is
attributed to the attenuation of the S-GaAs signal by the QPDT assembly and to the
increased surface sensitivity of the grazing x-ray incidence configuration.

132
Figure 5.2b contains an XPS spectrum of the S 2p region of QPDT assembled on
GaAs after the deposition of ≈15Å Au on the molecular assembly surface by ‘wet’ nTP.
The corresponding Au 4f XPS spectrum is provided in the inset. We fitted the S 2p
spectrum using 3 S 2p doublets. The doublets at ≈162.8 eV and ≈164 eV were assigned to
S-GaAs bonds at the QPDT-GaAs interface and the unbound thiolates/thioacetyls at the
assembly surface, similar to those observed for the ‘bare’ QPDT molecular assembly on
GaAs (Figure 5.2a). The binding energy of the third S 2p doublet, ≈162 eV, corresponds
to that of S-Au bonds observed in molecular assemblies of conjugated thiols on Au
substrates.29,41 This intensity must therefore stem from the formation of S-Au bonds at the
buried QPDT-Au interface. The integrated intensity of the S-GaAs signal derived from
our fit accounts for ≈22% of the total S 2p intensity, with the rest of S 2p signal attributed
to unbound thiolates/thioacetyls (≈43%) and S-Au (≈35%). The fact that the S-GaAs
intensity accounts for a similar fraction of the total S 2p signal before (≈19%, Figure
5.2a) and after (≈22%, Figure 5.2b) Au deposition is consistent with some of the unbound
functional groups at the molecular assembly surface bonding with the deposited Au,
while the QPDT-GaAs interface remains unchanged.
Out of ≈81% S 2p integrated intensity attributed to unbound S before printing Au,
roughly 35/(43+35) ≈ 44% reacted with the printed Au to form S-Au bonds. We
estimated the coverage of the Au transferred on the QPDT assembly surface to be 35-
45% using scanning electron microscopy. Accordingly, if normalized by the coverage of
deposited Au, the fraction of the surface groups that appear to form S-Au bonds with
deposited Au is ≈100%. Our results suggest that, despite a largely acetyl-terminated
surface, S-Au bonds form when Au is deposited onto QPDT assembled on GaAs using
‘wet’ nTP in DCE.
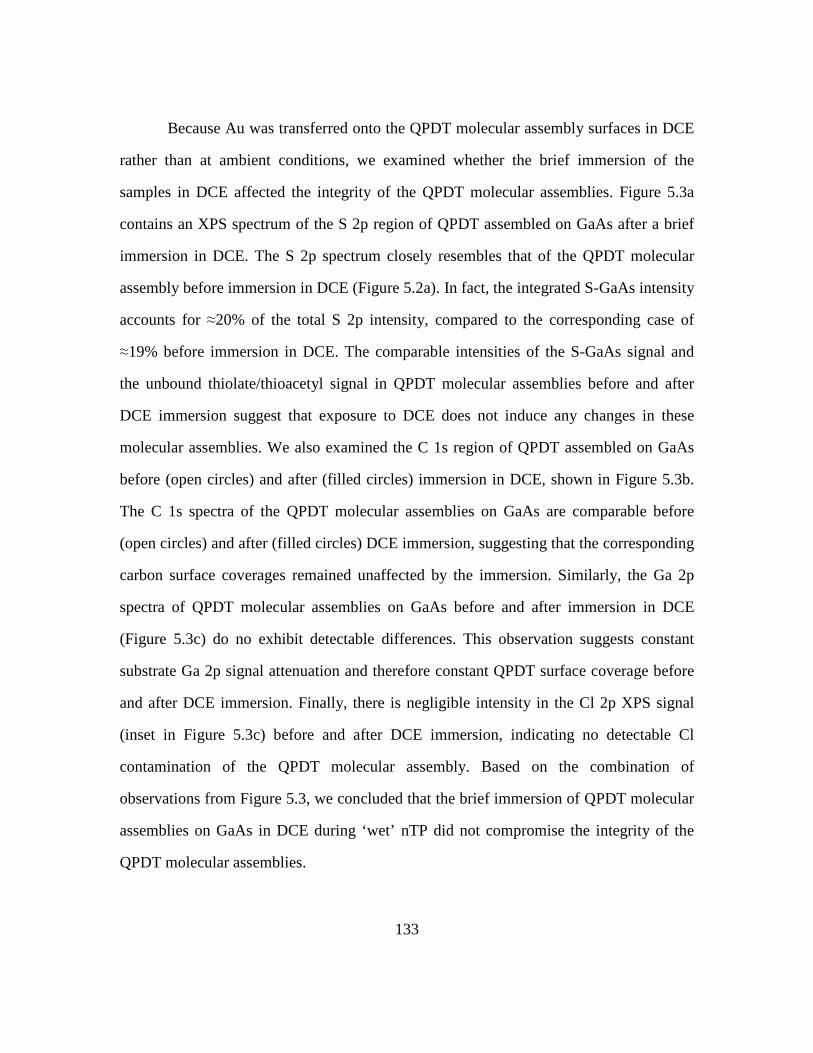
133
Because Au was transferred onto the QPDT molecular assembly surfaces in DCE
rather than at ambient conditions, we examined whether the brief immersion of the
samples in DCE affected the integrity of the QPDT molecular assemblies. Figure 5.3a
contains an XPS spectrum of the S 2p region of QPDT assembled on GaAs after a brief
immersion in DCE. The S 2p spectrum closely resembles that of the QPDT molecular
assembly before immersion in DCE (Figure 5.2a). In fact, the integrated S-GaAs intensity
accounts for ≈20% of the total S 2p intensity, compared to the corresponding case of
≈19% before immersion in DCE. The comparable intensities of the S-GaAs signal and
the unbound thiolate/thioacetyl signal in QPDT molecular assemblies before and after
DCE immersion suggest that exposure to DCE does not induce any changes in these
molecular assemblies. We also examined the C 1s region of QPDT assembled on GaAs
before (open circles) and after (filled circles) immersion in DCE, shown in Figure 5.3b.
The C 1s spectra of the QPDT molecular assemblies on GaAs are comparable before
(open circles) and after (filled circles) DCE immersion, suggesting that the corresponding
carbon surface coverages remained unaffected by the immersion. Similarly, the Ga 2p
spectra of QPDT molecular assemblies on GaAs before and after immersion in DCE
(Figure 5.3c) do no exhibit detectable differences. This observation suggests constant
substrate Ga 2p signal attenuation and therefore constant QPDT surface coverage before
and after DCE immersion. Finally, there is negligible intensity in the Cl 2p XPS signal
(inset in Figure 5.3c) before and after DCE immersion, indicating no detectable Cl
contamination of the QPDT molecular assembly. Based on the combination of
observations from Figure 5.3, we concluded that the brief immersion of QPDT molecular
assemblies on GaAs in DCE during ‘wet’ nTP did not compromise the integrity of the
QPDT molecular assemblies.
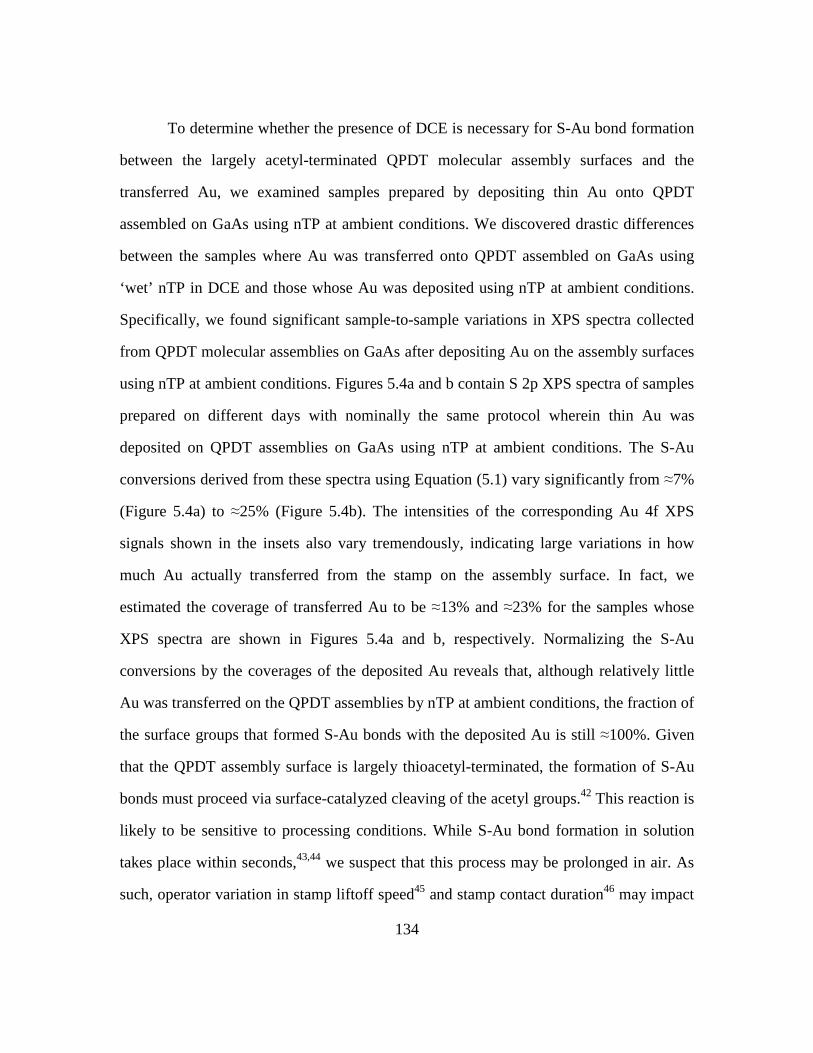
134
To determine whether the presence of DCE is necessary for S-Au bond formation
between the largely acetyl-terminated QPDT molecular assembly surfaces and the
transferred Au, we examined samples prepared by depositing thin Au onto QPDT
assembled on GaAs using nTP at ambient conditions. We discovered drastic differences
between the samples where Au was transferred onto QPDT assembled on GaAs using
‘wet’ nTP in DCE and those whose Au was deposited using nTP at ambient conditions.
Specifically, we found significant sample-to-sample variations in XPS spectra collected
from QPDT molecular assemblies on GaAs after depositing Au on the assembly surfaces
using nTP at ambient conditions. Figures 5.4a and b contain S 2p XPS spectra of samples
prepared on different days with nominally the same protocol wherein thin Au was
deposited on QPDT assemblies on GaAs using nTP at ambient conditions. The S-Au
conversions derived from these spectra using Equation (5.1) vary significantly from ≈7%
(Figure 5.4a) to ≈25% (Figure 5.4b). The intensities of the corresponding Au 4f XPS
signals shown in the insets also vary tremendously, indicating large variations in how
much Au actually transferred from the stamp on the assembly surface. In fact, we
estimated the coverage of transferred Au to be ≈13% and ≈23% for the samples whose
XPS spectra are shown in Figures 5.4a and b, respectively. Normalizing the S-Au
conversions by the coverages of the deposited Au reveals that, although relatively little
Au was transferred on the QPDT assemblies by nTP at ambient conditions, the fraction of
the surface groups that formed S-Au bonds with the deposited Au is still ≈100%. Given
that the QPDT assembly surface is largely thioacetyl-terminated, the formation of S-Au
bonds must proceed via surface-catalyzed cleaving of the acetyl groups.42 This reaction is
likely to be sensitive to processing conditions. While S-Au bond formation in solution
takes place within seconds,43,44 we suspect that this process may be prolonged in air. As
such, operator variation in stamp liftoff speed45 and stamp contact duration46 may impact

135
the formation of S-Au bonds and the area coverage of the Au transfer on the assembly
surface. Additionally, day-to-day variations of ambient conditions, such as humidity and
temperature, may also impact the formation of S-Au bonds at the top QPDT-Au interface.
When Au is deposited onto a highly-reactive thiol-terminated assembly surface, however,
such as 1,8-octanedithiol, processing conditions matter less, as evinced in our XPS results
in Figure 5.1.
In this Chapter, we demonstrated a direct spectroscopic approach to test for the
presence of the S-Au bonds at the buried dithiol-Au interface in samples prepared by
depositing Au on molecular assembly surfaces of dithiols adsorbed on GaAs. We showed
that the conditions under which Au is deposited onto the molecular assembly surface can
affect the nature of the dithiol-Au interaction. Specifically, the deposition of Au on the
largely acetyl-terminated QPDT assemblies on GaAs using ‘wet’ nTP results in
reproducible formation of S-Au bonds at the QPDT-Au interface. In contrast, the
deposition of Au on these assemblies using conventional nTP at ambient conditions
resulted in reduced and irreproducible formation of S-Au bonds at the QPDT-Au
interface.

136
FIGURES
Figure 5.1. XPS spectra of the S 2p region of 1,8-octanedithiol molecular assemblies on (a) GaAs and (b) on Au; (c) contains the S 2p spectrum of 1,8-octanedithiol assembled on GaAs after the deposition of ≈15Å Au using nTP at ambient conditions. Inset in (c) contains the Au 4f spectrum of the corresponding sample. The S 2p spectra are fitted with individual S 2p doublets: light gray, unbound thiol groups at the assembly surface; dark gray, S-GaAs bonds at the dithiol-GaAs interface; yellow, S-Au bonds formed at the dithiol-Au interface.
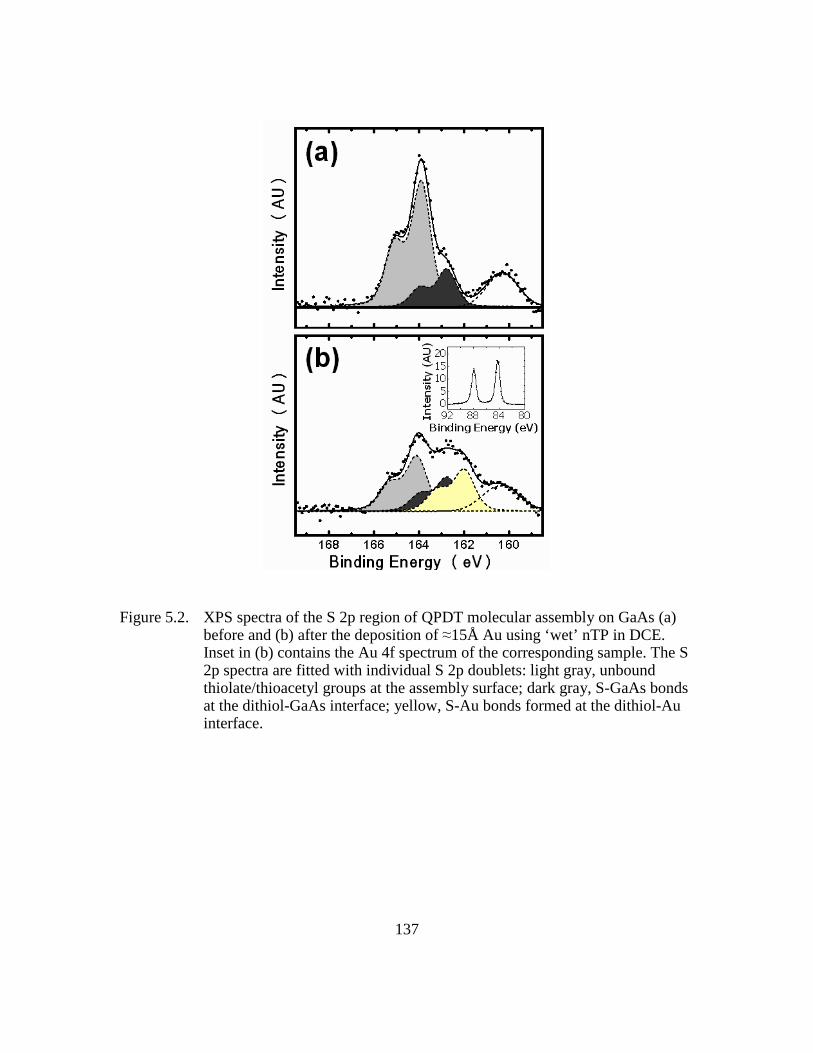
137
Figure 5.2. XPS spectra of the S 2p region of QPDT molecular assembly on GaAs (a) before and (b) after the deposition of ≈15Å Au using ‘wet’ nTP in DCE. Inset in (b) contains the Au 4f spectrum of the corresponding sample. The S 2p spectra are fitted with individual S 2p doublets: light gray, unbound thiolate/thioacetyl groups at the assembly surface; dark gray, S-GaAs bonds at the dithiol-GaAs interface; yellow, S-Au bonds formed at the dithiol-Au interface.
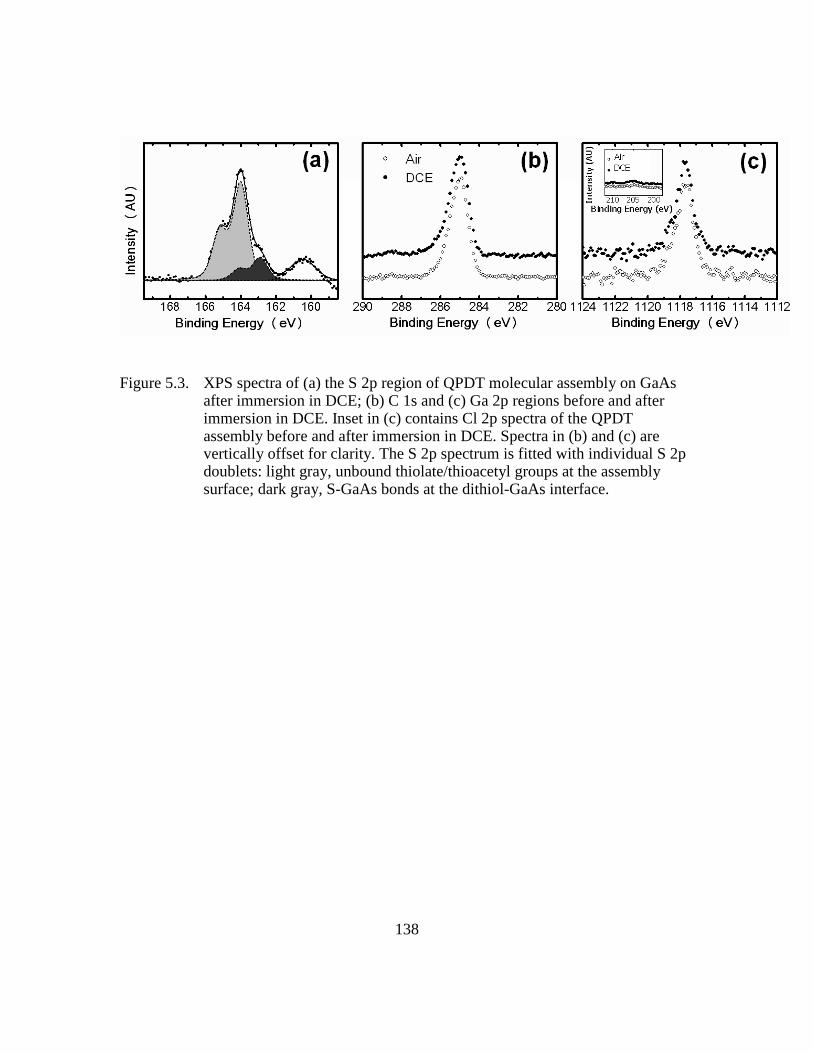
138
Figure 5.3. XPS spectra of (a) the S 2p region of QPDT molecular assembly on GaAs after immersion in DCE; (b) C 1s and (c) Ga 2p regions before and after immersion in DCE. Inset in (c) contains Cl 2p spectra of the QPDT assembly before and after immersion in DCE. Spectra in (b) and (c) are vertically offset for clarity. The S 2p spectrum is fitted with individual S 2p doublets: light gray, unbound thiolate/thioacetyl groups at the assembly surface; dark gray, S-GaAs bonds at the dithiol-GaAs interface.
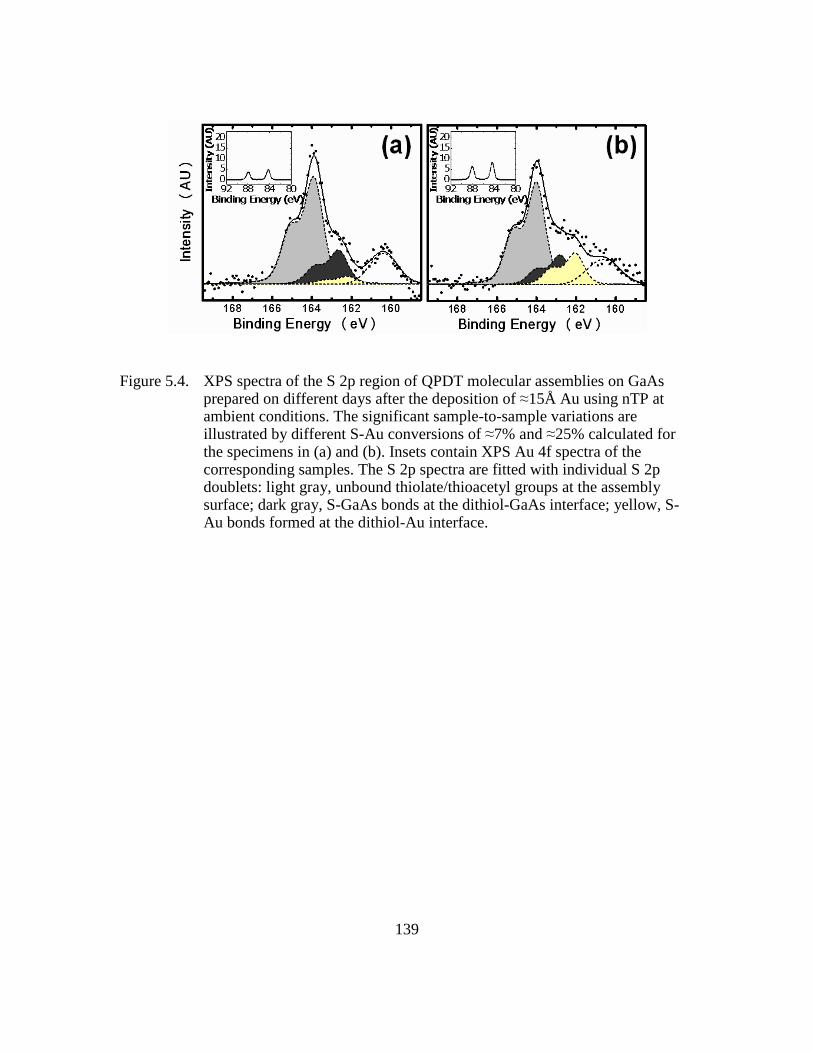
139
Figure 5.4. XPS spectra of the S 2p region of QPDT molecular assemblies on GaAs prepared on different days after the deposition of ≈15Å Au using nTP at ambient conditions. The significant sample-to-sample variations are illustrated by different S-Au conversions of ≈7% and ≈25% calculated for the specimens in (a) and (b). Insets contain XPS Au 4f spectra of the corresponding samples. The S 2p spectra are fitted with individual S 2p doublets: light gray, unbound thiolate/thioacetyl groups at the assembly surface; dark gray, S-GaAs bonds at the dithiol-GaAs interface; yellow, S-Au bonds formed at the dithiol-Au interface.
140
REFERENCES
1. Aviram, A.; Ratner, M. A. Chemical Physics Letters 1974, 29, 277.
2. Akkerman Hylke, B.; Naber Ronald, C. G.; Jongbloed, B.; van Hal Paul, A.; Blom Paul, W. M.; de Leeuw Dago, M.; de Boer, B. Proceedings of the National Academy of Sciences of the United States of America 2007, 104, 11161.
3. Shimizu, K. T.; Fabbri, J. D.; Jelincic, J. J.; Melosh, N. A. Advanced Materials 2006, 18, 1499.
4. Akkerman Hylke, B.; Blom Paul, W. M.; de Leeuw Dago, M.; de Boer, B. Nature 2006, 441, 69.
5. Nesher, G.; Shpaisman, H.; Cahen, D. Journal of the American Chemical Society 2007, 129, 734.
6. Ohgi, T.; Sheng, H. Y.; Nejoh, H. Applied Surface Science 1998, 130-132, 919.
7. de Boer, B.; Frank, M. M.; Chabal, Y. J.; Jiang, W.; Garfunkel, E.; Bao, Z. Langmuir 2004, 20, 1539.
8. Guerin, D.; Merckling, C.; Lenfant, S.; Wallart, X.; Pleutin, S.; Vuillaume, D. Journal of Physical Chemistry C 2007, 111, 7947.
9. Ohgi, T.; Sheng, H. Y.; Dong, Z. C.; Nejoh, H.; Fujita, D. Applied Physics Letters 2001, 79, 2453.
10. Walker, A. V.; Tighe, T. B.; Cabarcos, O. M.; Reinard, M. D.; Haynie, B. C.; Uppili, S.; Winograd, N.; Allara, D. L. Journal of the American Chemical Society 2004, 126, 3954.
11. Haick, H.; Ghabboun, J.; Niitsoo, O.; Cohen, H.; Cahen, D.; Vilan, A.; Hwang, J.; Wan, A.; Amy, F.; Kahn, A. Journal of Physical Chemistry B 2005, 109, 9622.
12. Haick, H.; Ambrico, M.; Ghabboun, J.; Ligonzo, T.; Cahen, D. Physical Chemistry Chemical Physics 2004, 6, 4538.
13. Haick, H.; Ghabboun, J.; Cahen, D. Applied Physics Letters 2005, 86, 042113/1.
14. Vilan, A.; Cahen, D. Advanced Functional Materials 2002, 12, 795.
15. Loo, Y.-L.; Willett, R. L.; Baldwin, K. W.; Rogers, J. A. Applied Physics Letters 2002, 81, 562.
141
16. Hsu, J. W. P.; Loo, Y. L.; Lang, D. V.; Rogers, J. A. Journal of Vacuum Science & Technology B 2003, 21, 1928.
17. Hipps, K. W. Science 2001, 294, 536.
18. Zhou, C.; Deshpande, M. R.; Reed, M. A.; Jones, K., II; Tour, J. M. Applied Physics Letters 1997, 71, 611.
19. Schumm, J. S.; Pearson, D. L.; Jones, L., II; Hara, R.; Tour, J. M. Nanotechnology 1996, 7, 430.
20. Salomon, A.; Boecking, T.; Gooding, J. J.; Cahen, D. Nano Letters 2006, 6, 2873.
21. Kushmerick, J. G.; Holt, D. B.; Yang, J. C.; Naciri, J.; Moore, M. H.; Shashidhar, R. Physical Review Letters 2002, 89, 086802/1.
22. Loo, Y.-L.; Lang, D. V.; Rogers, J. A.; Hsu, J. W. P. Nano Letters 2003, 3, 913.
23. Camillone, N.; Khan, K. A.; Osgood, R. M. Surface Science 2000, 453, 83.
24. Ulman, A. Chemical Reviews 1996, 96, 1533.
25. McGuiness, C. L.; Shaporenko, A.; Mars, C. K.; Uppili, S.; Zharnikov, M.; Allara, D. L. Journal of the American Chemical Society 2006, 128, 5231.
26. McGuiness, C. L.; Shaporenko, A.; Zharnikov, M.; Walker, A. V.; Allara, D. L. Journal of Physical Chemistry C 2007, 111, 4226.
27. Shaporenko, A.; Adlkofer, K.; Johansson, L. S. O.; Tanaka, M.; Zharnikov, M. Langmuir 2003, 19, 4992.
28. Shaporenko, A.; Adlkofer, K.; Johansson, L. S. O.; Ulman, A.; Grunze, M.; Tanaka, M.; Zharnikov, M. Journal of Physical Chemistry B 2004, 108, 17964.
29. Heister, K.; Zharnikov, M.; Grunze, M.; Johansson, L. S. O. Journal of Physical Chemistry B 2001, 105, 4058.
30. Laibinis, P. E.; Whitesides, G. M.; Allara, D. L.; Tao, Y. T.; Parikh, A. N.; Nuzzo, R. G. Journal of the American Chemical Society 1991, 113, 7152.
31. Zharnikov, M.; Grunze, M. Journal of Physics: Condensed Matter 2001, 13, 11333.
32. Castner, D. G.; Hinds, K.; Grainger, D. W. Langmuir 1996, 12, 5083.
33. Esplandiu, M. J.; Noeske, P. L. M. Applied Surface Science 2002, 199, 166.
142
34. Deng, W.; Yang, L.; Fujita, D.; Nejoh, H.; Bai, C. Applied Physics A 2000, 71, 639.
35. Rieley, H.; Kendall, G. K.; Zemicael, F. W.; Smith, T. L.; Yang, S. Langmuir 1998, 14, 5147.
36. Xu, L.; Liao, J.; Huang, L.; Gu, N.; Zhang, H.; Liu, J. Applied Surface Science 2003, 211, 184.
37. Tai, Y.; Shaporenko, A.; Rong, H. T.; Buck, M.; Eck, W.; Grunze, M.; Zharnikov, M. Journal of Physical Chemistry B 2004, 108, 16806.
38. Azzam, W.; Wehner, B. I.; Fischer, R. A.; Terfort, A.; Woell, C. Langmuir 2002, 18, 7766.
39. Tour, J. M.; Jones, L.; Pearson, D. L.; Lamba, J. J. S.; Burgin, T. P.; Whitesides, G. M.; Allara, D. L.; Parikh, A. N.; Atre, S. Journal of the American Chemical Society 1995, 117, 9529.
40. Moulder, J. F.; Stickle, W. E.; Sobol, P. E.; Bomben, K. D., Handbook of X-ray Photoelectron Spectroscopy. Perkin-Elmer Corp.: Eden Prairie, MN: 1992, p 60.
41. Shaporenko, A.; Roessler, K.; Lang, H.; Zharnikov, M. Journal of Physical Chemistry B 2006, 110, 24621.
42. Lau, K. H. A.; Huang, C.; Yakovlev, N.; Chen, Z. K.; O'Shea, S. J. Langmuir 2006, 22, 2968.
43. Bain, C. D.; Troughton, E. B.; Tao, Y. T.; Evall, J.; Whitesides, G. M.; Nuzzo, R. G. Journal of the American Chemical Society 1989, 111, 321.
44. Bensebaa, F.; Voicu, R.; Huron, L.; Ellis, T. H.; Kruus, E. Langmuir 1997, 13, 5335.
45. Feng, X.; Meitl, M. A.; Bowen, A. M.; Huang, Y.; Nuzzo, R. G.; Rogers, J. A. Langmuir 2007, 23, 12555.
46. Hur, S.-H.; Khang, D.-Y.; Kocabas, C.; Rogers, J. A. Applied Physics Letters 2004, 85, 5730.
143
Chapter 6: The Effects of Assembly Structure on Charge Transport
Across BPDT, TPDT, and QPDT Assemblies on GaAs
The idea of molecular electronics1,2 has motivated strong research interest in
understanding the electrical response of molecules. To this end, various methods of
making macroscopic and local electrical contacts to molecular assemblies have been
developed.2-8 The electrical conduction of molecular assemblies is commonly measured
in a two-electrode architecture. In this architecture, the molecular assemblies are first
formed on a substrate that acts as the bottom electrode, and then the molecules are
‘wired’ to a top electrode. There are two distinct approaches to ‘wiring’ the molecules.
One involves making direct electrical contact to the molecules with the probe of interest,
eliminating the use of a separate top contact. The other approach involves depositing a
top electrode, and then making an ohmic contact to the pre-deposited top electrode.
Examples of the electrode-less approach include scanning tunneling microscopy
(STM),9 conductive atomic force microscopy (CAFM),7 and hanging-drop mercury (Hg)
electrode.10 STM employs an atomically-sharp tip (schematically illustrated in Figure
6.1a) which hovers in proximity to the target surface guided by a piezo measuring the
tunneling current between the tip and the target surface.7,11,12 While STM allows the
measuring of tunneling currents with atomic resolution,9 its use is intrinsically limited to
measurements on conductive substrates that are atomically-flat.13-15 CAFM involves
making direct microscopic contact to single molecules or a small number of molecules in
molecular assemblies using a conductive tip3,16 several nanometers in size (schematically
illustrated in Figure 6.1b). CAFM has been used successfully for molecular conductance
studies of assemblies on a variety of coinage metal substrates.16,17 Because a physical
contact is made to the molecules, CAFM measurements are extremely sensitive to both
144
the force applied to the tip3,18,19 and the topographical details of the substrate surface.16
These constraints have limited the use of CAFM to specially-prepared metal substrates
containing atomically-flat terraces. The hanging-drop Hg electrode10,20 setup involves
making direct macroscopic contact to a molecular assembly surface using a drop of Hg,
as schematically illustrated in Figure 1.2. The very high surface tension of the liquid
metal limits Hg penetration into pinhole defects, precluding electrical shorts.10 As a
result, the hanging-drop Hg setup reproducibly measures electrical response of molecular
assemblies.10 This technique has been successfully used to measure the electrical
conduction of alkyl-based molecular assemblies on both metal and semiconductor
substrates.10,20-23
In the second approach of ‘wiring’ the molecules, where a separate top contact is
used, common techniques for top electrode deposition are described in Chapter 5 and
include evaporation,24-28 float-on,29,30 and nano-transfer printing (nTP).31 Regardless of
the deposition technique, the pre-deposited top metal electrode is then contacted using a
CAFM18,19,32 tip or a macroscopic tungsten probe,31,33-36 schematically illustrated in
Figures 6.2a and b, respectively. Considering that CAFM measurements are very
sensitive to the contact force of the tip and the surface topography,19,37 this technique is
difficult to implement on pre-deposited top electrodes. The use of macroscopic tungsten
probes has been reported for the electrical studies of assembly-based GaAs—1,8-
octanedithiol—Au junctions.31,33-36 In this setup, a needle-like tungsten probe is brought
in contact with the pre-deposited Au electrode manually. Generally, in all measurement
techniques, besides single-molecule STM, the measured electrical response reflects the
ensemble-average response of many molecules.
Having developed the ability to assemble QPDT, TPDT, and BPDT with control
on both Au and GaAs substrates, we measured the electrical response of the conjugated
145
assemblies using both of the routes to wire the molecules. In one case, we made electrical
contact directly to the molecular assembly surfaces. In another case, we deposited top Au
electrodes to make GaAs—molecule—Au junctions using nTP to minimize pinhole
electrical shorts. We focused on GaAs as the substrate for our electrical studies because
GaAs does not cold-weld with Au, thereby reducing the possibility of electrical shorts.38
Making reliable electrical contact to both the molecular assemblies and the
GaAs—molecule—Au junctions was challenging because the roughness of our samples
(0.3 nm and above) presented difficulties for STM and CAFM measurements. While the
hanging-drop Hg setup is often used to make soft electrical contact to molecular
assembly surfaces directly, it cannot be used to make contact with Au because Au tends
to rapidly amalgamate with Hg.39-41 As for the tungsten probes, we found it very difficult
to achieve a well-controlled manual surface approach to avoid puncture.
To measure the electrical response of the n-phenyldithiol assemblies on GaAs, we
developed an extension to the hanging-drop Hg setup (Figure 1.2). Specifically, we used
galinstan instead of Hg as the soft contact material. Galinstan is a eutectic alloy of
gallium, indium, and tin that is used increasingly in place of Hg in medical
thermometers.42 Galinstan does not pose any health hazards because of its negligible
vapor pressure and is a superior electrical conductor featuring an electrical resistivity
(435 nΩ m) that is roughly half of that of liquid Hg (≈980 nΩ m).43 A recent report
demonstrated galinstan to be a suitable alternative to Hg for voltammetric analysis in
solution.44 We constructed a simple in-house setup for making hanging galinstan drops
reproducibly, described in detail in Chapter 2. Galinstan drops were formed using a
syringe fitted with a goniometer needle with a diameter of 250 µm. This setup was wired
to the probe station and bias was applied to the hanging galinstan drop as it was brought
into contact with the target surface, as illustrated in Figure 2.11.

146
To examine the suitability of galinstan as a soft contact material for the
characterization of charge transport across molecular assemblies, we reproduced reported
studies of electrical conduction of a common alkylthiol assembly on GaAs.10,20 Referring
to studies of GaAs—1-hexadecanethiol—Hg junctions where mercury was used as the
soft electrode material,10,20 we used galinstan to make soft contact directly to 1-
hexadecanethiol assembled on GaAs. We measured the thickness of the 1-
hexadecanethiol molecular assembly on GaAs to be 20±1Å using ellipsometry. This
thickness is consistent with an organized molecular assembly where the molecular
backbones are oriented preferentially upright.10 This thickness is also in close agreement
with the reported thickness for 1-hexadecanethiol molecular assembly on GaAs (21Å),10
suggesting that the final assemblies have comparable structures. We thus expected the
electrical response of these assemblies to be similar to that reported by Nesher et. al.10
The measured currents were normalized by the contact area of the galinstan droplet to
obtain the current density, J. To obtain the contact area, we imaged every soft contact
during electrical data acquisition.
The absolute current density as a function of bias voltage applied to the galinstan
drop measured by making direct soft contact to 1-hexadecanethiol molecular assemblies
on GaAs are presented in Figure 6.3. The standard deviations (based on 23 separate
measurements) are included. The general shape of the J-V curve is typical of that of
alkylthiol junctions.10,20 A higher absolute current density at positive bias (V>0)
compared to that at negative bias (V<0) suggests that the flow of electrons from the n-
type GaAs substrate through the molecular assembly to galinstan is easier than the
reverse.45 The current densities we measured for 1-hexadecanethiol assembled on GaAs
at the lowest (-0.5 V) and the highest (0.5 V) bias applied to the galinstan drop are
1.1x10⁻⁶ ± 0.7x10⁻⁶ (A/cm2) and 5x10⁻⁶ ± 4x10⁻⁶ (A/cm2), respectively. These current
147
densities are comparable to the reported values of ≈ 1x10⁻⁶ and ≈ 9x10⁻⁶ (A/cm2)
measured at -0.5 and 0.5 V, respectively, using the Hg setup.10 The similarity in both the
measured thickness of 1-hexadecanethiol molecular assembly and the resulting current
densities using our galinstan setup and the reported Hg setup suggests galinstan to be a
suitable soft electrode material.
Having verified that galinstan can make reproducible, soft electrical contact to
molecular assembly surfaces directly, we used this setup to characterize charge transport
across molecular assemblies of QPDT, TPDT, and BPDT on GaAs. Figure 6.4 contains
the absolute current densities as a function of applied bias for assemblies of QPDT,
TPDT, and BPDT. QPDT was assembled on GaAs from solutions with ethanol fraction
(EF) of 0.75 without the addition of any NH4OH (QPDT-0) and with 10 mM NH4OH
(QPDT-10). These processing conditions were selected to achieve two preferentially
oriented QPDT assemblies with different molecular orientations. Specifically, as
described in Chapter 4, QPDT assemblies on GaAs formed without the addition of
NH4OH (QPDT-0) are preferentially upright, with an ensemble-average backbone tilt of
29±3° away from the substrate normal, and are completely acetyl-terminated at the
surface. QPDT assemblies on GaAs formed using 10 mM NH4OH are more upright than
QPDT-0, with an ensemble-average backbone tilt of 20±3° away from the substrate
normal, and are partially acetyl-terminated at the surface. The shapes of the J-V curves
exhibited by QPDT molecular assemblies are similar to that of 1-hexadecanethiol. The
flow of electrons from the n-type GaAs substrate through the QPDT molecular
assemblies to galinstan is therefore easier than the reverse, similar to that in 1-
hexadecanethiol assemblies. The comparison of the current densities observed for QPDT-
0 (blue circles) and QPDT-10 (red squares) in Figure 6.4 reveals that the current densities
exhibited by QPDT-10 (1.3 x10⁻⁴ ± 0.6 x10⁻⁴ A/cm2 at 0.5 V) are lower than those
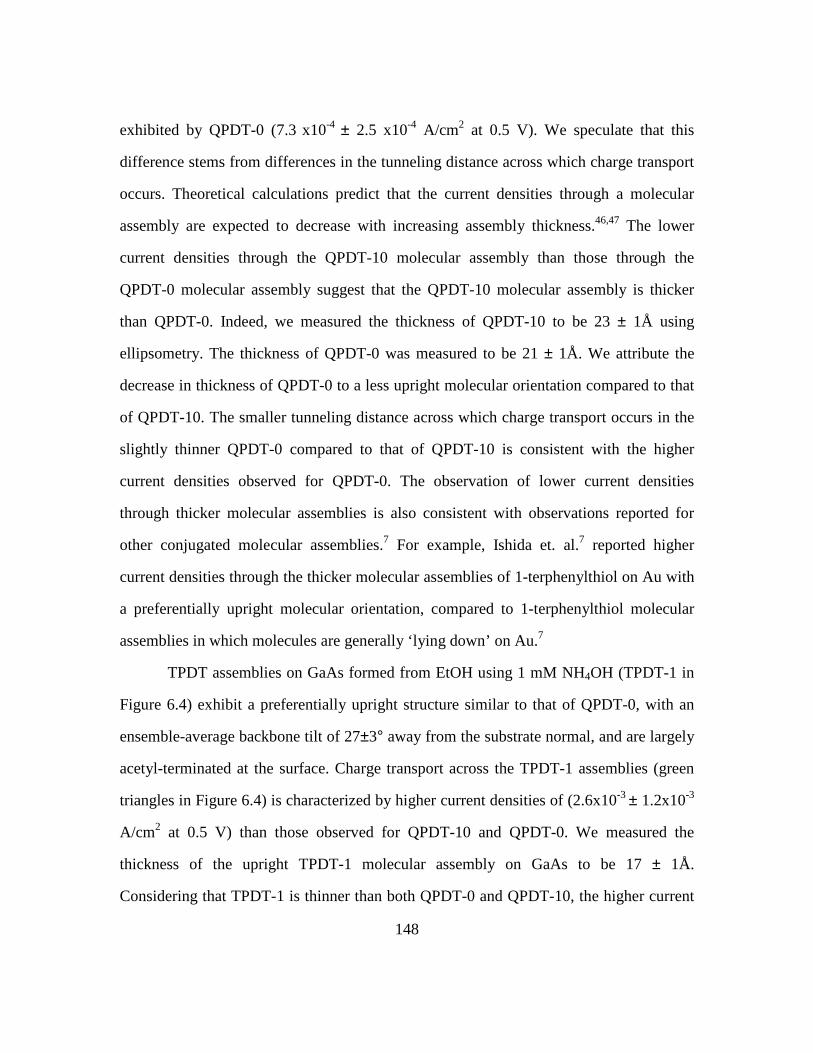
148
exhibited by QPDT-0 (7.3 x10⁻⁴ ± 2.5 x10⁻⁴ A/cm2 at 0.5 V). We speculate that this
difference stems from differences in the tunneling distance across which charge transport
occurs. Theoretical calculations predict that the current densities through a molecular
assembly are expected to decrease with increasing assembly thickness.46,47 The lower
current densities through the QPDT-10 molecular assembly than those through the
QPDT-0 molecular assembly suggest that the QPDT-10 molecular assembly is thicker
than QPDT-0. Indeed, we measured the thickness of QPDT-10 to be 23 ± 1Å using
ellipsometry. The thickness of QPDT-0 was measured to be 21 ± 1Å. We attribute the
decrease in thickness of QPDT-0 to a less upright molecular orientation compared to that
of QPDT-10. The smaller tunneling distance across which charge transport occurs in the
slightly thinner QPDT-0 compared to that of QPDT-10 is consistent with the higher
current densities observed for QPDT-0. The observation of lower current densities
through thicker molecular assemblies is also consistent with observations reported for
other conjugated molecular assemblies.7 For example, Ishida et. al.7 reported higher
current densities through the thicker molecular assemblies of 1-terphenylthiol on Au with
a preferentially upright molecular orientation, compared to 1-terphenylthiol molecular
assemblies in which molecules are generally ‘lying down’ on Au.7
TPDT assemblies on GaAs formed from EtOH using 1 mM NH4OH (TPDT-1 in
Figure 6.4) exhibit a preferentially upright structure similar to that of QPDT-0, with an
ensemble-average backbone tilt of 27±3° away from the substrate normal, and are largely
acetyl-terminated at the surface. Charge transport across the TPDT-1 assemblies (green
triangles in Figure 6.4) is characterized by higher current densities of (2.6x10⁻³ ± 1.2x10⁻³
A/cm2 at 0.5 V) than those observed for QPDT-10 and QPDT-0. We measured the
thickness of the upright TPDT-1 molecular assembly on GaAs to be 17 ± 1Å.
Considering that TPDT-1 is thinner than both QPDT-0 and QPDT-10, the higher current

149
densities measured for TPDT-1 are consistent with the reduced tunneling distance across
which charge transport must occur in this assembly.
BPDT assemblies on GaAs formed from EtOH using 1 mM NH4OH (BPDT-1 in
Figure 6.4) are disordered and are largely acetyl-terminated at the surface. BPDT-1
exhibits an ellipsometric thickness of 11 ± 1Å. Because the tunneling distance across
BPDT-1 is significantly smaller than that across TPDT-1 (17 ± 1Å), the absolute current
densities observed for BPDT-1 should be the highest. While BPDT-1 does indeed exhibit
the highest current densities (9x10⁻³ ± 7x10⁻³ A/cm2 at 0.5 V) amongst the samples
examined at positive biases, the current densities measured near-zero and at negative
voltages are comparable to those measured for TPDT-1. The shape of the J-V curve for
BPDT is thus inherently different from those of TPDT or QPDT assemblies. The
different shape of the J-V curve of BPDT-1 compared to that of the other samples
examined suggests a different conduction mechanism and/or a different interface
dominating the electrical response of this assembly. The characteristically different
electrical response of BPDT assemblies may stem from the absence of order in these
assemblies. For example, it has been reported that disorder in molecular assemblies
affects their electrical properties.7
The electrical conduction of TPDT and QPDT molecular assemblies measured
through direct soft contact with galinstan reveal that both the molecular orientation of the
assemblies and the backbone length of the molecules affect the electrical response.
Specifically, on the example of QPDT assemblies on GaAs, we demonstrated that the
absolute current densities decrease with an increasingly upright molecular orientation.
That the more upright QPDT assemblies result in the lower absolute current densities is
attributed to increased tunneling distance across which charge transport must occur in
these assemblies. Additionally, we found that the n-phenyldithiols with the longer
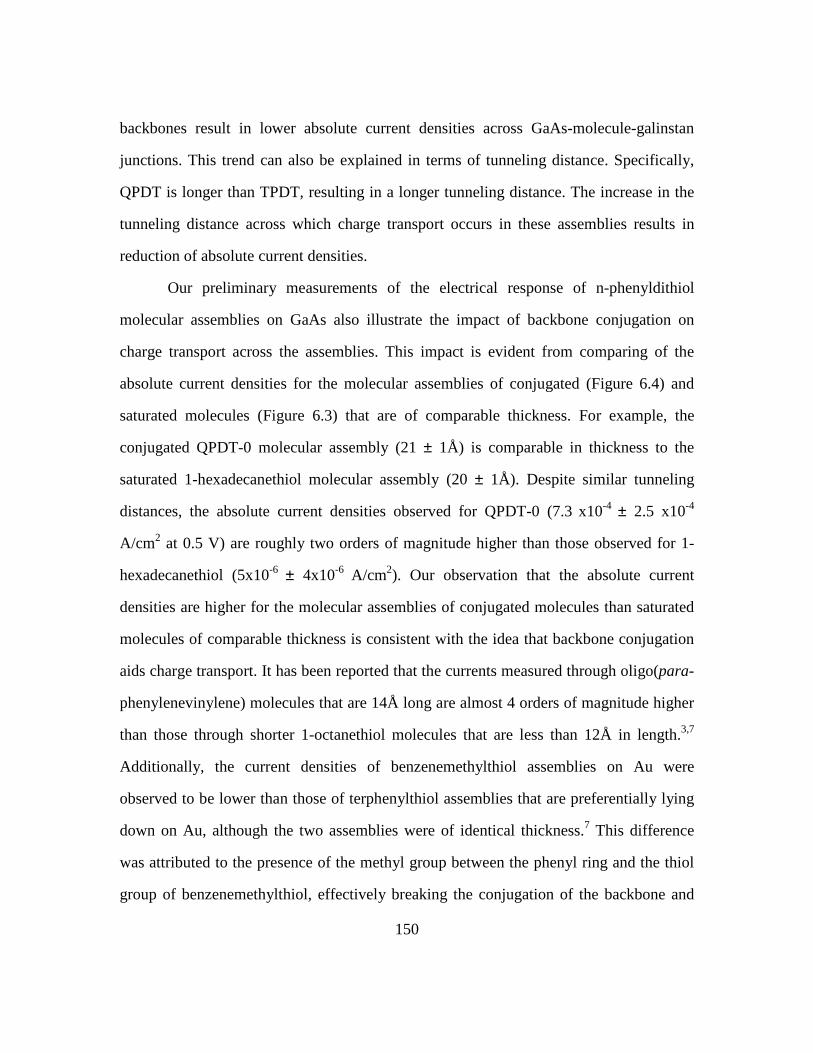
150
backbones result in lower absolute current densities across GaAs-molecule-galinstan
junctions. This trend can also be explained in terms of tunneling distance. Specifically,
QPDT is longer than TPDT, resulting in a longer tunneling distance. The increase in the
tunneling distance across which charge transport occurs in these assemblies results in
reduction of absolute current densities.
Our preliminary measurements of the electrical response of n-phenyldithiol
molecular assemblies on GaAs also illustrate the impact of backbone conjugation on
charge transport across the assemblies. This impact is evident from comparing of the
absolute current densities for the molecular assemblies of conjugated (Figure 6.4) and
saturated molecules (Figure 6.3) that are of comparable thickness. For example, the
conjugated QPDT-0 molecular assembly (21 ± 1Å) is comparable in thickness to the
saturated 1-hexadecanethiol molecular assembly (20 ± 1Å). Despite similar tunneling
distances, the absolute current densities observed for QPDT-0 (7.3 x10⁻⁴ ± 2.5 x10⁻⁴
A/cm2 at 0.5 V) are roughly two orders of magnitude higher than those observed for 1-
hexadecanethiol (5x10⁻⁶ ± 4x10⁻⁶ A/cm2). Our observation that the absolute current
densities are higher for the molecular assemblies of conjugated molecules than saturated
molecules of comparable thickness is consistent with the idea that backbone conjugation
aids charge transport. It has been reported that the currents measured through oligo(para-
phenylenevinylene) molecules that are 14Å long are almost 4 orders of magnitude higher
than those through shorter 1-octanethiol molecules that are less than 12Å in length.3,7
Additionally, the current densities of benzenemethylthiol assemblies on Au were
observed to be lower than those of terphenylthiol assemblies that are preferentially lying
down on Au, although the two assemblies were of identical thickness.7 This difference
was attributed to the presence of the methyl group between the phenyl ring and the thiol
group of benzenemethylthiol, effectively breaking the conjugation of the backbone and
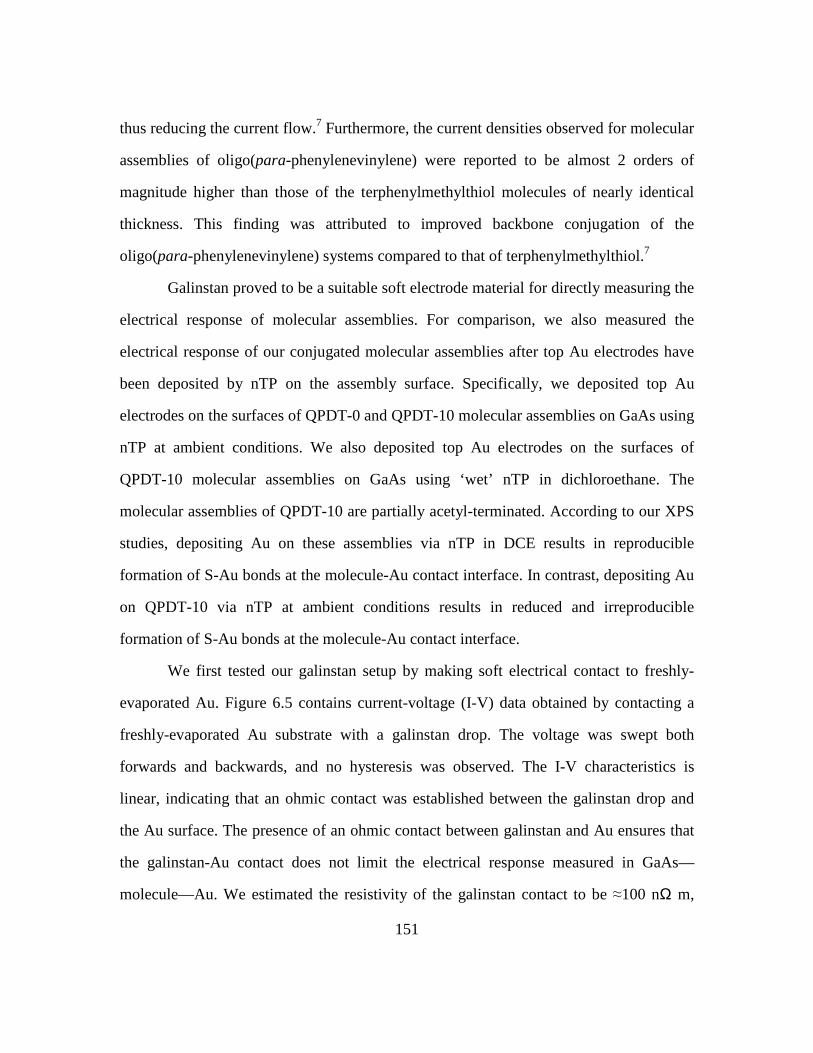
151
thus reducing the current flow.7 Furthermore, the current densities observed for molecular
assemblies of oligo(para-phenylenevinylene) were reported to be almost 2 orders of
magnitude higher than those of the terphenylmethylthiol molecules of nearly identical
thickness. This finding was attributed to improved backbone conjugation of the
oligo(para-phenylenevinylene) systems compared to that of terphenylmethylthiol.7
Galinstan proved to be a suitable soft electrode material for directly measuring the
electrical response of molecular assemblies. For comparison, we also measured the
electrical response of our conjugated molecular assemblies after top Au electrodes have
been deposited by nTP on the assembly surface. Specifically, we deposited top Au
electrodes on the surfaces of QPDT-0 and QPDT-10 molecular assemblies on GaAs using
nTP at ambient conditions. We also deposited top Au electrodes on the surfaces of
QPDT-10 molecular assemblies on GaAs using ‘wet’ nTP in dichloroethane. The
molecular assemblies of QPDT-10 are partially acetyl-terminated. According to our XPS
studies, depositing Au on these assemblies via nTP in DCE results in reproducible
formation of S-Au bonds at the molecule-Au contact interface. In contrast, depositing Au
on QPDT-10 via nTP at ambient conditions results in reduced and irreproducible
formation of S-Au bonds at the molecule-Au contact interface.
We first tested our galinstan setup by making soft electrical contact to freshly-
evaporated Au. Figure 6.5 contains current-voltage (I-V) data obtained by contacting a
freshly-evaporated Au substrate with a galinstan drop. The voltage was swept both
forwards and backwards, and no hysteresis was observed. The I-V characteristics is
linear, indicating that an ohmic contact was established between the galinstan drop and
the Au surface. The presence of an ohmic contact between galinstan and Au ensures that
the galinstan-Au contact does not limit the electrical response measured in GaAs—
molecule—Au. We estimated the resistivity of the galinstan contact to be ≈100 nΩ m,
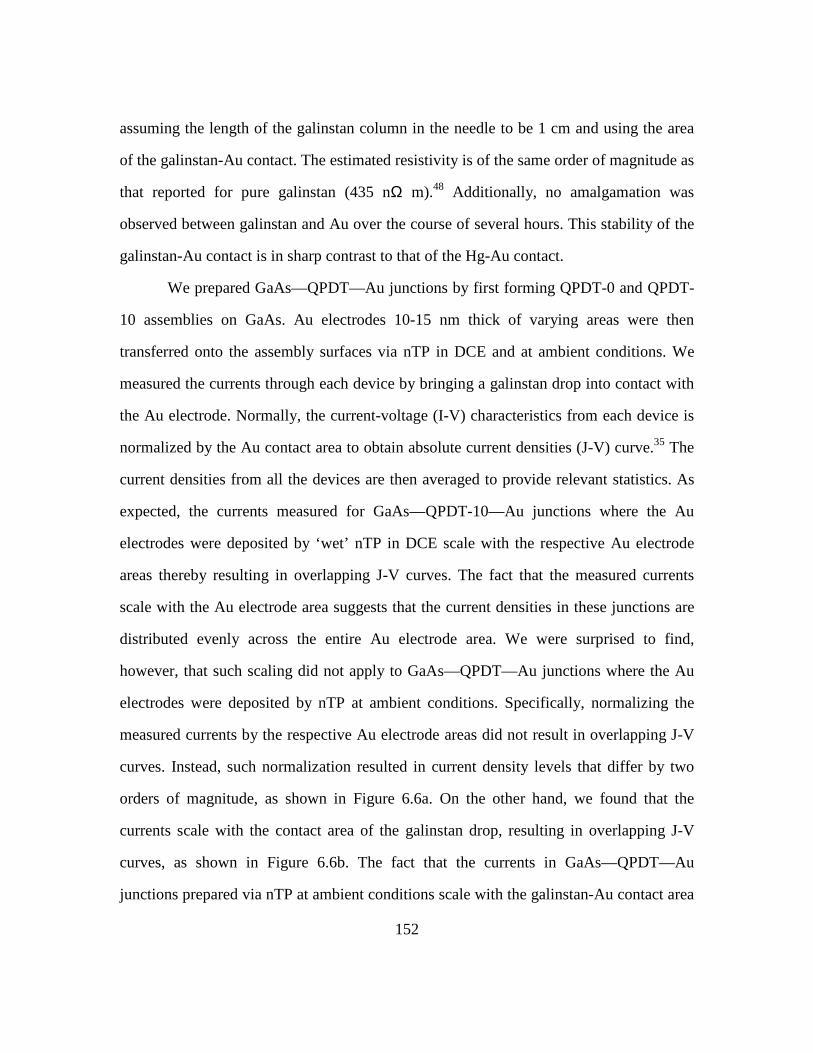
152
assuming the length of the galinstan column in the needle to be 1 cm and using the area
of the galinstan-Au contact. The estimated resistivity is of the same order of magnitude as
that reported for pure galinstan (435 nΩ m).48 Additionally, no amalgamation was
observed between galinstan and Au over the course of several hours. This stability of the
galinstan-Au contact is in sharp contrast to that of the Hg-Au contact.
We prepared GaAs—QPDT—Au junctions by first forming QPDT-0 and QPDT-
10 assemblies on GaAs. Au electrodes 10-15 nm thick of varying areas were then
transferred onto the assembly surfaces via nTP in DCE and at ambient conditions. We
measured the currents through each device by bringing a galinstan drop into contact with
the Au electrode. Normally, the current-voltage (I-V) characteristics from each device is
normalized by the Au contact area to obtain absolute current densities (J-V) curve.35 The
current densities from all the devices are then averaged to provide relevant statistics. As
expected, the currents measured for GaAs—QPDT-10—Au junctions where the Au
electrodes were deposited by ‘wet’ nTP in DCE scale with the respective Au electrode
areas thereby resulting in overlapping J-V curves. The fact that the measured currents
scale with the Au electrode area suggests that the current densities in these junctions are
distributed evenly across the entire Au electrode area. We were surprised to find,
however, that such scaling did not apply to GaAs—QPDT—Au junctions where the Au
electrodes were deposited by nTP at ambient conditions. Specifically, normalizing the
measured currents by the respective Au electrode areas did not result in overlapping J-V
curves. Instead, such normalization resulted in current density levels that differ by two
orders of magnitude, as shown in Figure 6.6a. On the other hand, we found that the
currents scale with the contact area of the galinstan drop, resulting in overlapping J-V
curves, as shown in Figure 6.6b. The fact that the currents in GaAs—QPDT—Au
junctions prepared via nTP at ambient conditions scale with the galinstan-Au contact area

153
suggests that the charge transport across these junctions is concentrated in the region
where the galinstan drop makes physical contact with the Au electrode, rather than across
the entire Au electrode.
While we are uncertain about the origin of this disparity in the electrical behavior
between the junctions formed by nTP in DCE and at ambient conditions, we suspect that
it may stem from differences in the number of S-Au bonds at the molecule-Au interface.
Specifically, when Au is deposited on QPDT-10 molecular assembly surfaces via nTP in
DCE, our XPS studies indicate reproducible formation of S-Au bonds. On the other hand,
when Au is deposited on QPDT-10 via nTP at ambient conditions, our XPS studies
indicate that the formation of S-Au bonds is reduced and inconsistent. That the currents
across these junctions scale with the galinstan contact area suggests that the electrical
response is sensitive to the force applied. In fact, electrical responses that are force
sensitive have been reported previously; this phenomenon was attributed to the absence
of covalent bonds at the charge transfer interface. For example, Cui et. al.3 reported that
the currents in Au—1-octanethiol—Au junctions exhibited strong dependence on the
compression force applied to the top Au electrode by the CAFM tip.3 An increase in
current of almost 2 orders of magnitude was reported to result when ≈2 nN per 10 nm2 as
compared to <0.5 nN per 10 nm2 was applied.3 In GaAs—QPDT—Au junctions prepared
using nTP at ambient conditions, the absence of S-Au bonds at the molecule-Au interface
likely provides a tunneling distance that is tunable; when force is applied to the Au
electrode by the galinstan drop the tunneling distance decreases. On the other hand, in
GaAs—QPDT—Au junctions prepared using nTP in DCE, the presence of S-Au bonds at
the molecule-Au interface appears to fix the tunneling distance thereby resulting in
currents that do not depend on the area of the galinstan-Au contact. This notion is
consistent with the observation by Cui et. al.3 that the currents in Au—1,8-
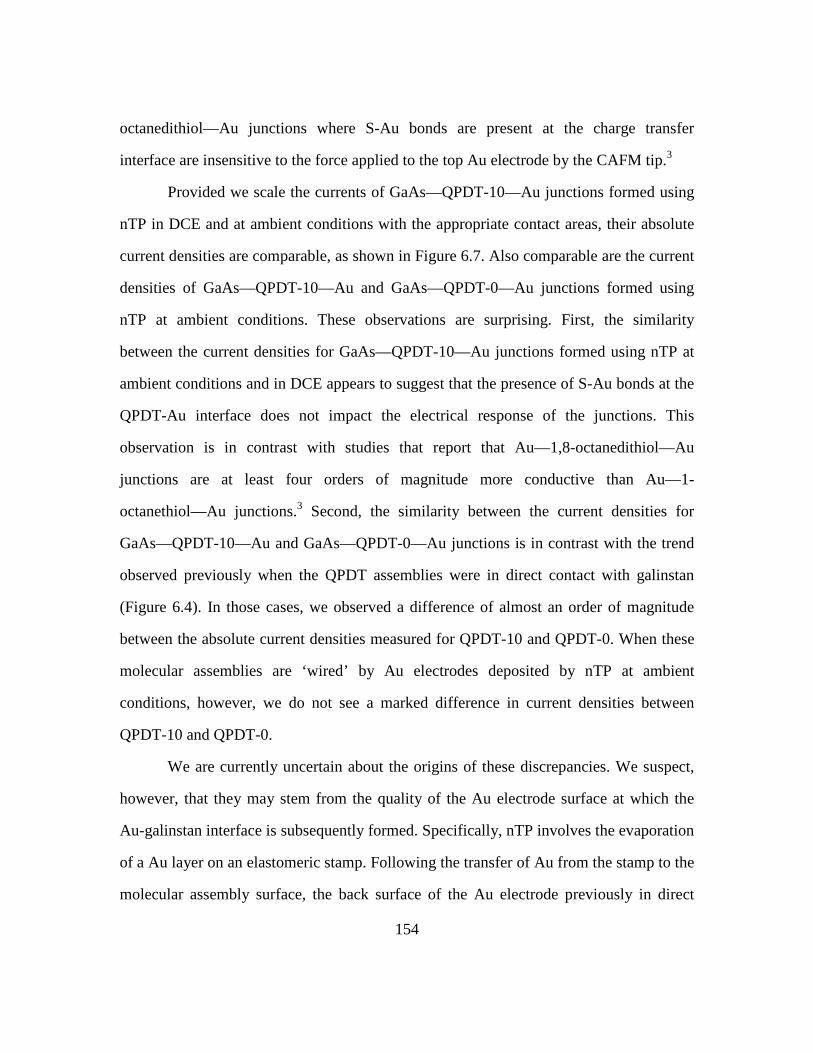
154
octanedithiol—Au junctions where S-Au bonds are present at the charge transfer
interface are insensitive to the force applied to the top Au electrode by the CAFM tip.3
Provided we scale the currents of GaAs—QPDT-10—Au junctions formed using
nTP in DCE and at ambient conditions with the appropriate contact areas, their absolute
current densities are comparable, as shown in Figure 6.7. Also comparable are the current
densities of GaAs—QPDT-10—Au and GaAs—QPDT-0—Au junctions formed using
nTP at ambient conditions. These observations are surprising. First, the similarity
between the current densities for GaAs—QPDT-10—Au junctions formed using nTP at
ambient conditions and in DCE appears to suggest that the presence of S-Au bonds at the
QPDT-Au interface does not impact the electrical response of the junctions. This
observation is in contrast with studies that report that Au—1,8-octanedithiol—Au
junctions are at least four orders of magnitude more conductive than Au—1-
octanethiol—Au junctions.3 Second, the similarity between the current densities for
GaAs—QPDT-10—Au and GaAs—QPDT-0—Au junctions is in contrast with the trend
observed previously when the QPDT assemblies were in direct contact with galinstan
(Figure 6.4). In those cases, we observed a difference of almost an order of magnitude
between the absolute current densities measured for QPDT-10 and QPDT-0. When these
molecular assemblies are ‘wired’ by Au electrodes deposited by nTP at ambient
conditions, however, we do not see a marked difference in current densities between
QPDT-10 and QPDT-0.
We are currently uncertain about the origins of these discrepancies. We suspect,
however, that they may stem from the quality of the Au electrode surface at which the
Au-galinstan interface is subsequently formed. Specifically, nTP involves the evaporation
of a Au layer on an elastomeric stamp. Following the transfer of Au from the stamp to the
molecular assembly surface, the back surface of the Au electrode previously in direct

155
contact with the elastomeric stamp becomes the surface onto which galinstan makes
contact. The cleanness of the back Au surface formerly in contact with the elastomeric
stamp is thus expected to be crucial for electrical studies. Felmet et. al.49 discovered that
the transferred Au surface is generally contaminated by residual oligomers via XPS. The
researchers also reported that the residual oligomer contamination can be reduced by
leaching the elastomeric stamps in boiling toluene for 2-3 days and drying them in the
oven overnight prior to nTP.49
We thus examined the impact of the residual oligomeric contamination on the
electrical characteristics of GaAs—1,8-octanedithiol—Au junctions.49 We prepared the
junctions by first forming 1,8-octanedithiol molecular assemblies on GaAs, followed by
Au electrode deposition using nTP at ambient conditions. We used two types of
elastomeric stamps during nTP: conventional unleached stamps (used for GaAs—
QPDT—Au junction formation) and leached stamps. During electrical characterization, a
soft contact was established between the galinstan drop and the Au electrode for each
measurement. The current densities were obtained by normalizing the measured currents
by the respective Au electrode areas. Figure 6.8 contains the absolute current densities as
a function of applied bias to the galinstan drop for GaAs—1,8-octanedithiol—Au
junctions prepared using unleached and leached elastomeric stamps. The absolute current
densities for junctions prepared using unleached and leached elastomeric stamps reveal
drastic differences. Specifically, the current densities measured for GaAs—1,8-
octanedithiol—Au junctions prepared using unleached stamps are roughly two orders of
magnitude lower than those of the junctions prepared using leached stamps. Given that
the only difference in the fabrication of these junctions is the use of leached or unleached
stamps, the difference in the current densities of these junctions must result from
differences in the quality of the Au-galinstan interface. The greatly reduced current
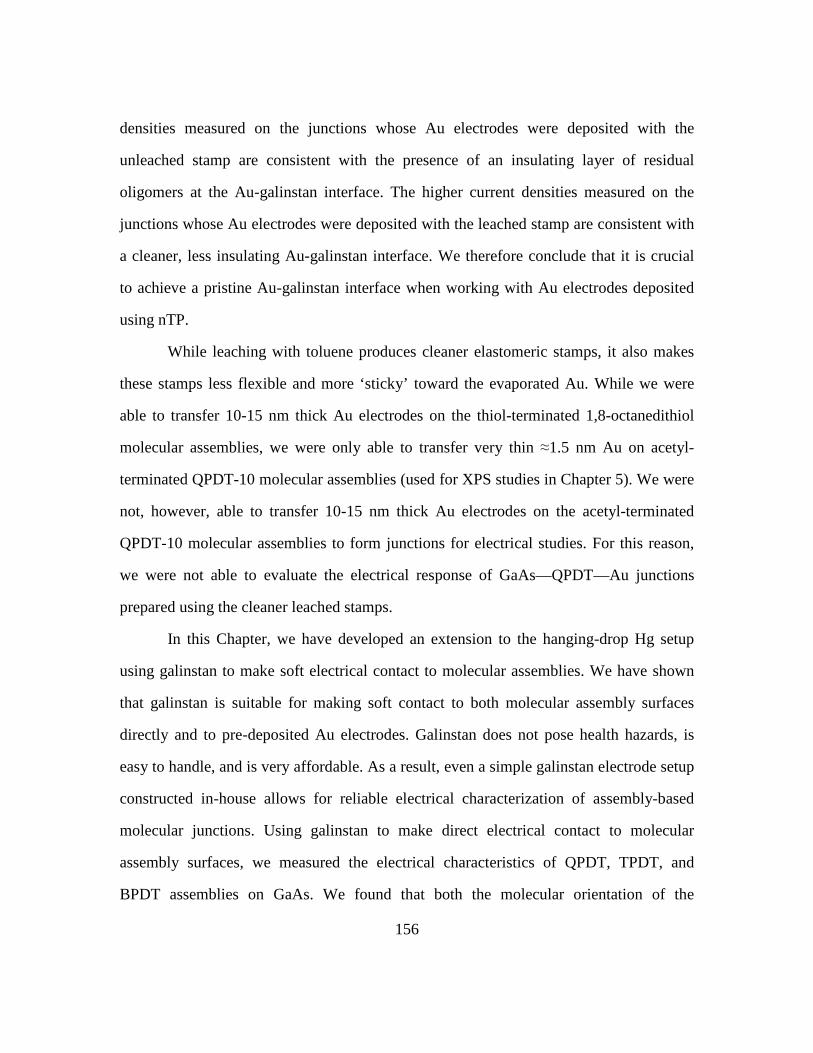
156
densities measured on the junctions whose Au electrodes were deposited with the
unleached stamp are consistent with the presence of an insulating layer of residual
oligomers at the Au-galinstan interface. The higher current densities measured on the
junctions whose Au electrodes were deposited with the leached stamp are consistent with
a cleaner, less insulating Au-galinstan interface. We therefore conclude that it is crucial
to achieve a pristine Au-galinstan interface when working with Au electrodes deposited
using nTP.
While leaching with toluene produces cleaner elastomeric stamps, it also makes
these stamps less flexible and more ‘sticky’ toward the evaporated Au. While we were
able to transfer 10-15 nm thick Au electrodes on the thiol-terminated 1,8-octanedithiol
molecular assemblies, we were only able to transfer very thin ≈1.5 nm Au on acetyl-
terminated QPDT-10 molecular assemblies (used for XPS studies in Chapter 5). We were
not, however, able to transfer 10-15 nm thick Au electrodes on the acetyl-terminated
QPDT-10 molecular assemblies to form junctions for electrical studies. For this reason,
we were not able to evaluate the electrical response of GaAs—QPDT—Au junctions
prepared using the cleaner leached stamps.
In this Chapter, we have developed an extension to the hanging-drop Hg setup
using galinstan to make soft electrical contact to molecular assemblies. We have shown
that galinstan is suitable for making soft contact to both molecular assembly surfaces
directly and to pre-deposited Au electrodes. Galinstan does not pose health hazards, is
easy to handle, and is very affordable. As a result, even a simple galinstan electrode setup
constructed in-house allows for reliable electrical characterization of assembly-based
molecular junctions. Using galinstan to make direct electrical contact to molecular
assembly surfaces, we measured the electrical characteristics of QPDT, TPDT, and
BPDT assemblies on GaAs. We found that both the molecular orientation of the
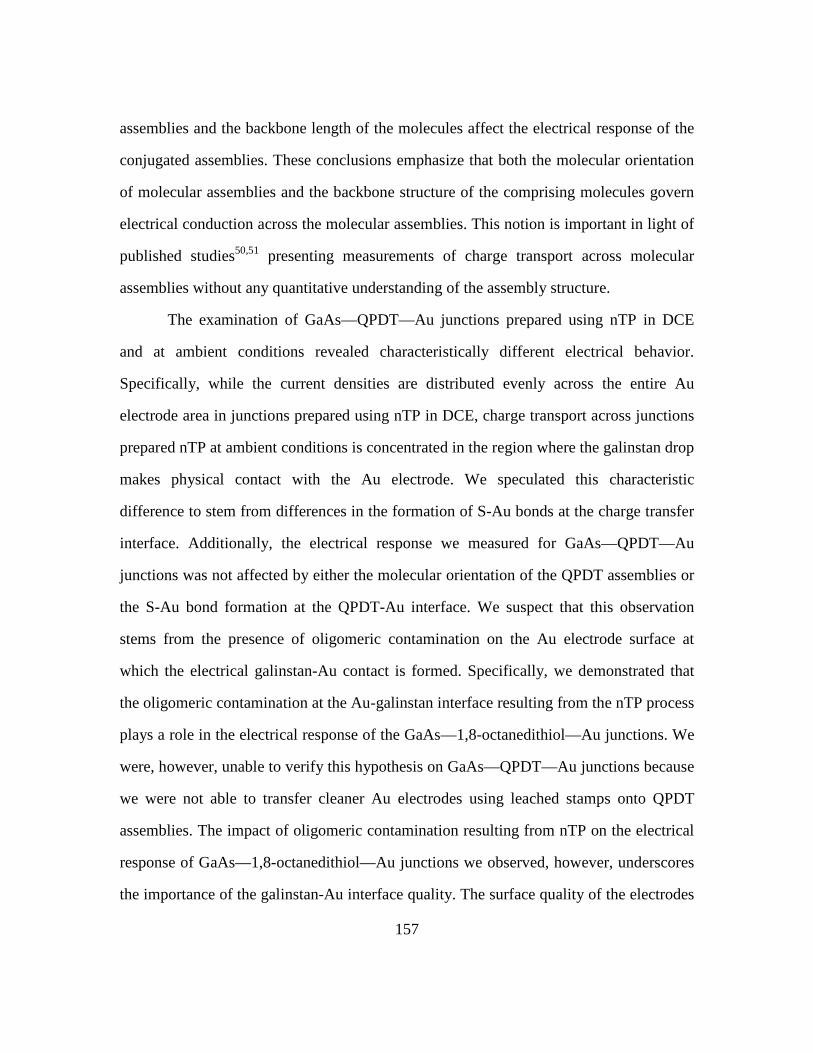
157
assemblies and the backbone length of the molecules affect the electrical response of the
conjugated assemblies. These conclusions emphasize that both the molecular orientation
of molecular assemblies and the backbone structure of the comprising molecules govern
electrical conduction across the molecular assemblies. This notion is important in light of
published studies50,51 presenting measurements of charge transport across molecular
assemblies without any quantitative understanding of the assembly structure.
The examination of GaAs—QPDT—Au junctions prepared using nTP in DCE
and at ambient conditions revealed characteristically different electrical behavior.
Specifically, while the current densities are distributed evenly across the entire Au
electrode area in junctions prepared using nTP in DCE, charge transport across junctions
prepared nTP at ambient conditions is concentrated in the region where the galinstan drop
makes physical contact with the Au electrode. We speculated this characteristic
difference to stem from differences in the formation of S-Au bonds at the charge transfer
interface. Additionally, the electrical response we measured for GaAs—QPDT—Au
junctions was not affected by either the molecular orientation of the QPDT assemblies or
the S-Au bond formation at the QPDT-Au interface. We suspect that this observation
stems from the presence of oligomeric contamination on the Au electrode surface at
which the electrical galinstan-Au contact is formed. Specifically, we demonstrated that
the oligomeric contamination at the Au-galinstan interface resulting from the nTP process
plays a role in the electrical response of the GaAs—1,8-octanedithiol—Au junctions. We
were, however, unable to verify this hypothesis on GaAs—QPDT—Au junctions because
we were not able to transfer cleaner Au electrodes using leached stamps onto QPDT
assemblies. The impact of oligomeric contamination resulting from nTP on the electrical
response of GaAs—1,8-octanedithiol—Au junctions we observed, however, underscores
the importance of the galinstan-Au interface quality. The surface quality of the electrodes

158
deposited on assembly surfaces using various techniques (nTP, float-on, evaporation)
must therefore be carefully examined to avoid possible misinterpretation of the electrical
junction characteristics due to contamination.
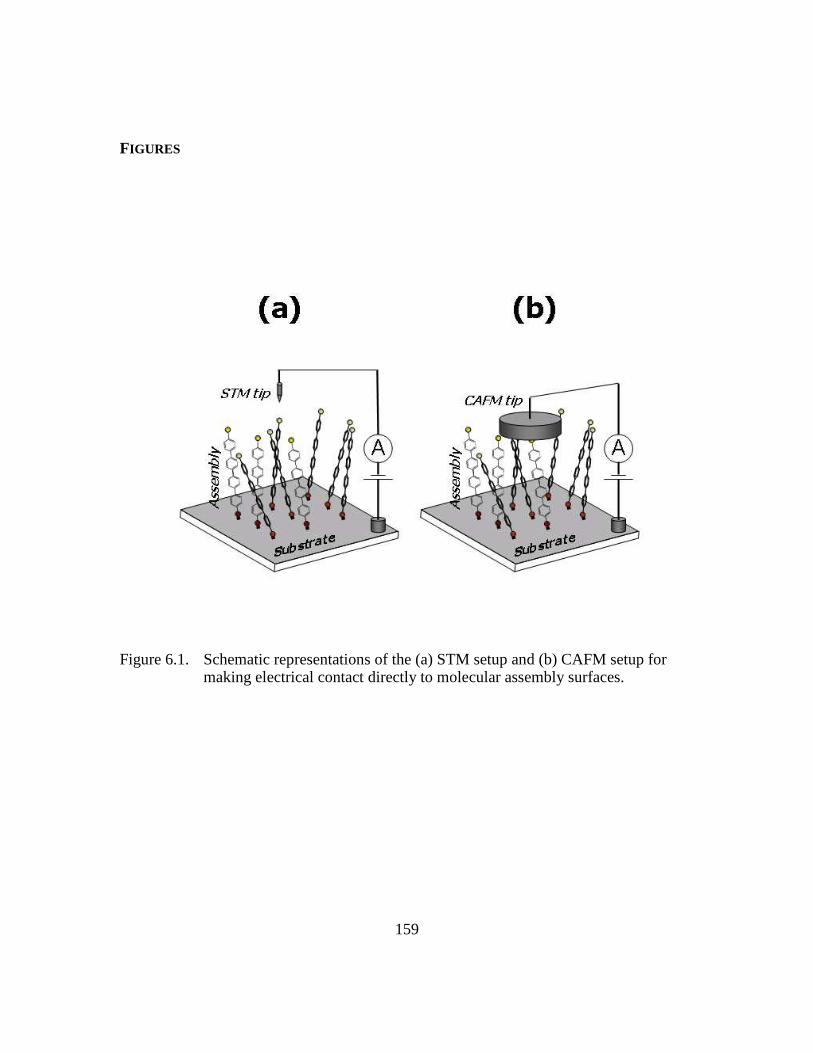
159
FIGURES
Figure 6.1. Schematic representations of the (a) STM setup and (b) CAFM setup for making electrical contact directly to molecular assembly surfaces.

160
Figure 6.2. Schematic representations of (a) CAFM and (b) tungsten probe setups for making electrical contact to the top Au electrodes that had been pre-deposited on the molecular assembly surfaces.

161
Figure 6.3. Absolute current density as a function of applied bias to the galinstan drop in contact with 1-hexadecanethiol molecular assembly on GaAs. Error bars reflect standard deviations based on 23 separate measurements on junctions of varying contact areas.
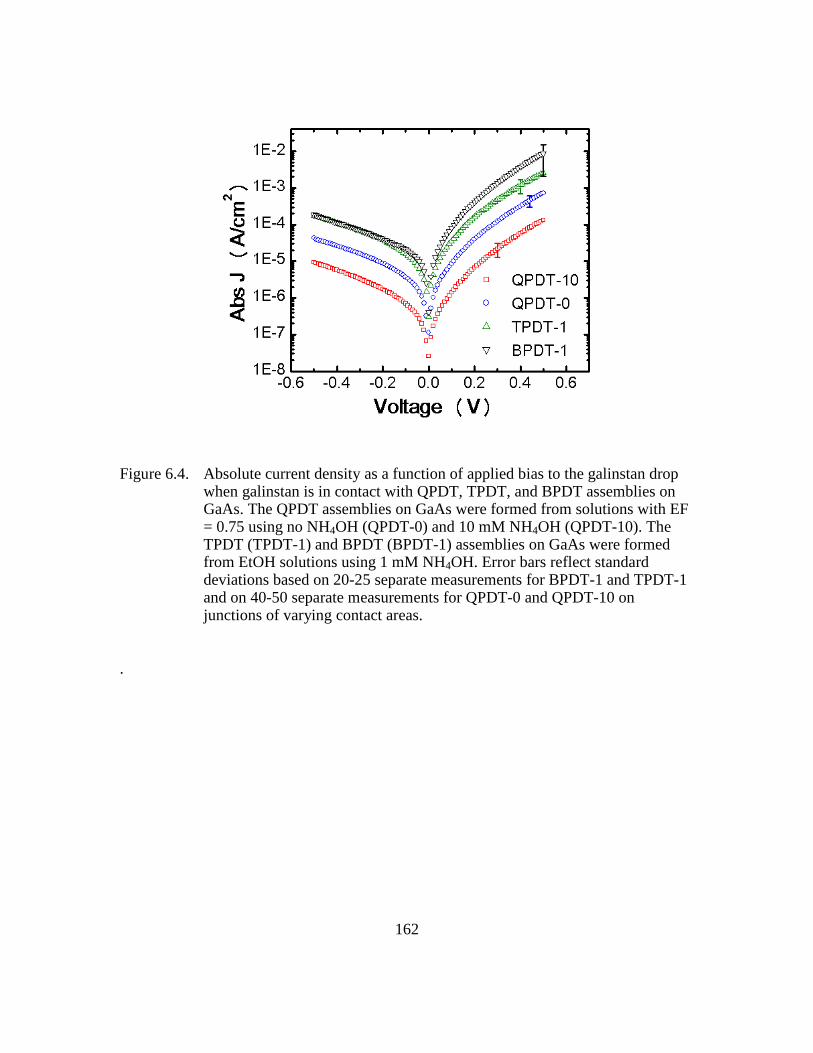
162
Figure 6.4. Absolute current density as a function of applied bias to the galinstan drop when galinstan is in contact with QPDT, TPDT, and BPDT assemblies on GaAs. The QPDT assemblies on GaAs were formed from solutions with EF = 0.75 using no NH4OH (QPDT-0) and 10 mM NH4OH (QPDT-10). The TPDT (TPDT-1) and BPDT (BPDT-1) assemblies on GaAs were formed from EtOH solutions using 1 mM NH4OH. Error bars reflect standard deviations based on 20-25 separate measurements for BPDT-1 and TPDT-1 and on 40-50 separate measurements for QPDT-0 and QPDT-10 on junctions of varying contact areas.
.

163
Figure 6.5. Current as a function of applied bias to the galinstan drop in contact with a freshly-evaporated Au substrate. The current was swept forwards and backwards and no hysteresis was observed. The linear I-V response indicates the formation of an ohmic contact between galinstan and the freshly-evaporated Au. We estimated the resistivity of galinstan to be ≈100 nΩ m.
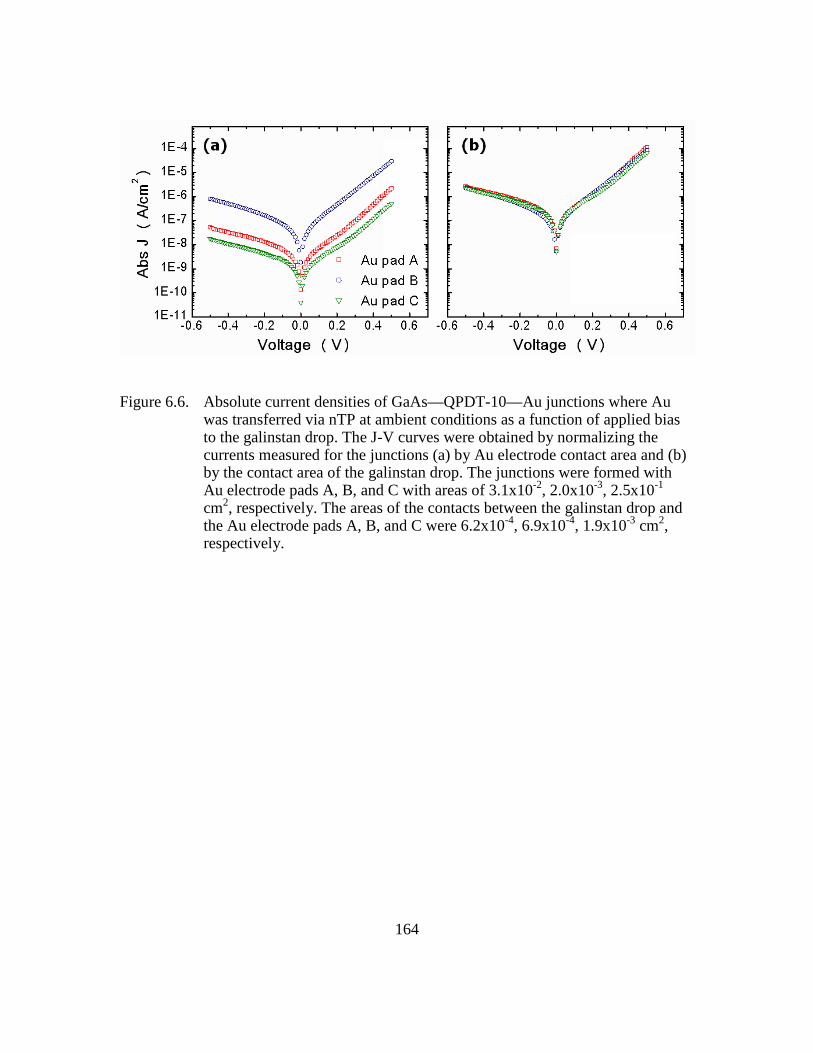
164
Figure 6.6. Absolute current densities of GaAs—QPDT-10—Au junctions where Au was transferred via nTP at ambient conditions as a function of applied bias to the galinstan drop. The J-V curves were obtained by normalizing the currents measured for the junctions (a) by Au electrode contact area and (b) by the contact area of the galinstan drop. The junctions were formed with Au electrode pads A, B, and C with areas of 3.1x10⁻², 2.0x10⁻³, 2.5x10⁻¹ cm2, respectively. The areas of the contacts between the galinstan drop and the Au electrode pads A, B, and C were 6.2x10⁻⁴, 6.9x10⁻⁴, 1.9x10⁻³ cm2, respectively.
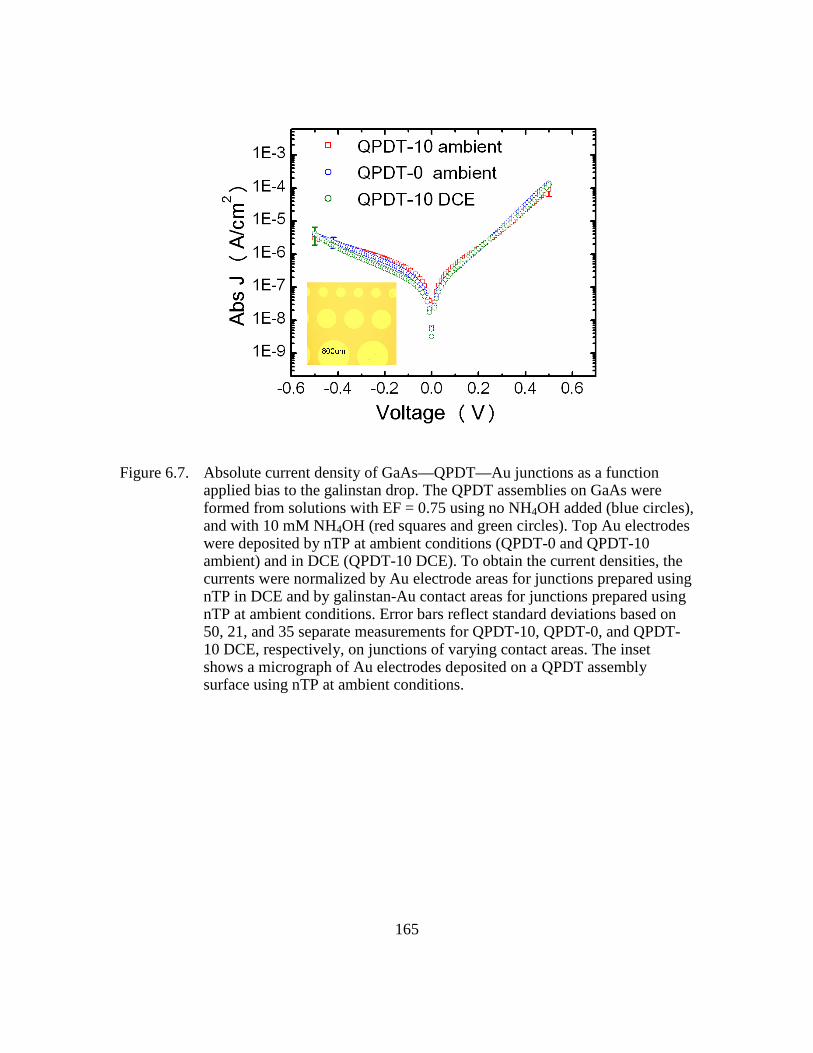
165
Figure 6.7. Absolute current density of GaAs—QPDT—Au junctions as a function applied bias to the galinstan drop. The QPDT assemblies on GaAs were formed from solutions with EF = 0.75 using no NH4OH added (blue circles), and with 10 mM NH4OH (red squares and green circles). Top Au electrodes were deposited by nTP at ambient conditions (QPDT-0 and QPDT-10 ambient) and in DCE (QPDT-10 DCE). To obtain the current densities, the currents were normalized by Au electrode areas for junctions prepared using nTP in DCE and by galinstan-Au contact areas for junctions prepared using nTP at ambient conditions. Error bars reflect standard deviations based on 50, 21, and 35 separate measurements for QPDT-10, QPDT-0, and QPDT-10 DCE, respectively, on junctions of varying contact areas. The inset shows a micrograph of Au electrodes deposited on a QPDT assembly surface using nTP at ambient conditions.
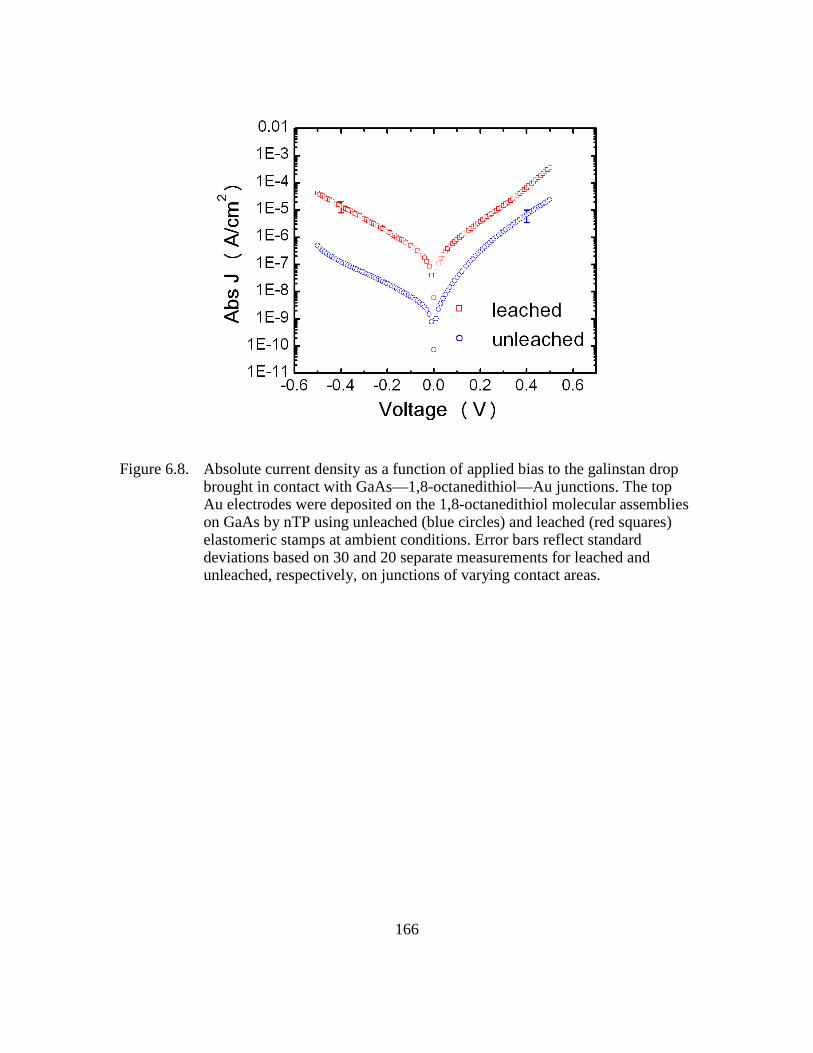
166
Figure 6.8. Absolute current density as a function of applied bias to the galinstan drop brought in contact with GaAs—1,8-octanedithiol—Au junctions. The top Au electrodes were deposited on the 1,8-octanedithiol molecular assemblies on GaAs by nTP using unleached (blue circles) and leached (red squares) elastomeric stamps at ambient conditions. Error bars reflect standard deviations based on 30 and 20 separate measurements for leached and unleached, respectively, on junctions of varying contact areas.
167
REFERENCES
1. Aviram, A.; Ratner, M. A. Chemical Physics Letters 1974, 29, 277.
2. Kwok, K. S.; Ellenbogen, J. C. Materials Today 2002, 5, 28.
3. Cui, X. D.; Primak, A.; Zarate, X.; Tomfohr, J.; Sankey, O. F.; Moore, A. L.; Moore, T. A.; Gust, D.; Harris, G.; Lindsay, S. M. Science 2001, 294, 571.
4. Hipps, K. W. Science 2001, 294, 536.
5. Akkerman Hylke, B.; Blom Paul, W. M.; de Leeuw Dago, M.; de Boer, B. Nature 2006, 441, 69.
6. Akkerman Hylke, B.; Naber Ronald, C. G.; Jongbloed, B.; van Hal Paul, A.; Blom Paul, W. M.; de Leeuw Dago, M.; de Boer, B. Proceedings of the National Academy of Sciences of the United States of America 2007, 104, 11161.
7. Ishida, T.; Mizutani, W.; Liang, T.-T.; Azehara, H.; Miyake, K.; Sasaki, S.; Tokumoto, H. Annals of the New York Academy of Sciences 2003, 1006, 164.
8. James, D. K.; Tour, J. M. Chemistry of Materials 2004, 16, 4423.
9. Attard, G.; Barnes, C., Surfaces. Oxford University Press Inc.: New York, 2004.
10. Nesher, G.; Vilan, A.; Cohen, H.; Cahen, D.; Amy, F.; Chan, C.; Hwang, J.; Kahn, A. Journal of Physical Chemistry B 2006, 110, 14363.
11. Cygan, M. T.; Dunbar, T. D.; Arnold, J. J.; Bumm, L. A.; Shedlock, N. F.; Burgin, T. P.; Jones, L., II; Allara, D. L.; Tour, J. M.; Weiss, P. S. Journal of the American Chemical Society 1998, 120, 2721.
12. Kobayashi, K.; Horiuchi, T.; Yamada, H.; Matsushige, K. Thin Solid Films 1998, 331, 210.
13. Yang, Y.-C.; Lee, Y.-L.; Yang, L.-Y. O.; Yau, S.-L. Langmuir 2006, 22, 5189.
14. Leung, T. Y. B.; Gerstenberg, M. C.; Lavrich, D. J.; Scoles, G.; Schreiber, F.; Poirier, G. E. Langmuir 2000, 16, 549.
15. Nicoara, N.; Cerrillo, I.; Xueming, D.; Garcia, J. M.; Garcia, B.; Gomez-Navarro, C.; Mendez, J.; Baro, A. M. Nanotechnology 2002, 13, 352.
168
16. Gosvami, N.; Lau, K. H. A.; Sinha, S. K.; O'Shea, S. J. Applied Surface Science 2006, 252, 3956.
17. Beebe, J. M.; Engelkes, V. B.; Miller, L. L.; Frisbie, C. D. Journal of the American Chemical Society 2002, 124, 11268.
18. Cui, X. D.; Primak, A.; Zarate, X.; Tomfohr, J.; Sankey, O. F.; Moore, A. L.; Moore, T. A.; Gust, D.; Nagahara, L. A.; Lindsay, S. M. Journal of Physical Chemistry B 2002, 106, 8609.
19. Cui, X. D.; Zarate, X.; Tomfohr, J.; Sankey, O. F.; Primak, A.; Moore, A. L.; Moore, T. A.; Gust, D.; Harris, G.; Lindsay, S. M. Nanotechnology 2002, 13, 5.
20. Nesher, G.; Shpaisman, H.; Cahen, D. Journal of the American Chemical Society 2007, 129, 734.
21. Salomon, A.; Boecking, T.; Gooding, J. J.; Cahen, D. Nano Letters 2006, 6, 2873.
22. Selzer, Y.; Salomon, A.; Cahen, D. Journal of the American Chemical Society 2002, 124, 2886.
23. Tran, E.; Rampi, M. A.; Whitesides, G. M. Angewandte Chemie 2004, 43, 3835.
24. Ohgi, T.; Sheng, H. Y.; Nejoh, H. Applied Surface Science 1998, 130-132, 919.
25. de Boer, B.; Frank, M. M.; Chabal, Y. J.; Jiang, W.; Garfunkel, E.; Bao, Z. Langmuir 2004, 20, 1539.
26. Guerin, D.; Merckling, C.; Lenfant, S.; Wallart, X.; Pleutin, S.; Vuillaume, D. Journal of Physical Chemistry C 2007, 111, 7947.
27. Walker, A. V.; Tighe, T. B.; Cabarcos, O. M.; Reinard, M. D.; Haynie, B. C.; Uppili, S.; Winograd, N.; Allara, D. L. Journal of the American Chemical Society 2004, 126, 3954.
28. Haick, H.; Ghabboun, J.; Niitsoo, O.; Cohen, H.; Cahen, D.; Vilan, A.; Hwang, J.; Wan, A.; Amy, F.; Kahn, A. Journal of Physical Chemistry B 2005, 109, 9622.
29. Vilan, A.; Cahen, D. Advanced Functional Materials 2002, 12, 795.
30. Shimizu, K. T.; Fabbri, J. D.; Jelincic, J. J.; Melosh, N. A. Advanced Materials 2006, 18, 1499.
31. Loo, Y.-L.; Willett, R. L.; Baldwin, K. W.; Rogers, J. A. Applied Physics Letters 2002, 81, 562.

169
32. Jiang, W.; Garfunkel, E.; Zhitenev, N.; Abusch-Magder, D.; Tennant, D.; Bao, Z. Applied Physics Letters 2006, 89, 113107/1.
33. Hsu, J. W. P.; Loo, Y. L.; Lang, D. V.; Rogers, J. A. Journal of Vacuum Science & Technology B 2003, 21, 1928.
34. Loo, Y.-L.; Hsu, J. W. P.; Willett, R. L.; Baldwin, K. W.; West, K. W.; Rogers, J. A. Journal of Vacuum Science & Technology B 2002, 20, 2853.
35. Loo, Y.-L.; Lang, D. V.; Rogers, J. A.; Hsu, J. W. P. Nano Letters 2003, 3, 913.
36. Loo, Y.-L.; Willett, R. L.; Baldwin, K. W.; Rogers, J. A. Journal of the American Chemical Society 2002, 124, 7654.
37. Morita, T.; Lindsay, S. Journal of the American Chemical Society 2007, 129, 7262.
38. Kim, C.; Burrows, P. E.; Forrest, S. R. Science 2000, 288, 831.
39. Levlin, M.; Niemi, H. E. M.; Hautojarvi, P.; Ikavalko, E. Fresenius' Journal of Analytical Chemistry 1996, 355, 2.
40. Butler, M. A.; Ricco, A. J.; Baughman, R. J. Journal of Applied Physics 1990, 67, 4320.
41. Thome, J.; Himmelhaus, M.; Zharnikov, M.; Grunze, M. Langmuir 1998, 14, 7435.
42. Smith Linda, S. Journal of Gerontological Nursing 2003, 29, 26.
43. See http://www.rgmd.com/msds/msds.pdf for MSDS of galinstan; see http://www.espimetals.com/tech/Tech-%20Mercury.htm for MSDS of Hg.
44. Surmann, P.; Zeyat, H. Analytical and Bioanalytical Chemistry 2005, 383, 1009.
45. Metzger, R. M.; Chen, B.; Hoepfner, U.; Lakshmikantham, M. V.; Vuillaume, D.; Kawai, T.; Wu, X.; Tachibana, H.; Hughes, T. V.; Sakurai, H.; Baldwin, J. W.; Hosch, C.; Cava, M. P.; Brehmer, L.; Ashwell, G. J. Journal of the American Chemical Society 1997, 119, 10455.
46. Magoga, M.; Joachim, C. Physical Review B 1999, 59, 16011.
47. Samanta, M. P.; Tian, W.; Datta, S.; Henderson, J. I.; Kubiak, C. P. Physical Review B 1996, 53, R7626.
48. See http://www.rgmd.com/msds/msds.pdf for MSDS of galinstan.

170
49. Felmet, K.; Loo, Y.-L.; Sun, Y. Applied Physics Letters 2004, 85, 3316.
50. Kushmerick, J. G.; Holt, D. B.; Yang, J. C.; Naciri, J.; Moore, M. H.; Shashidhar, R. Physical Review Letters 2002, 89, 086802/1.
51. Beebe, J. M.; Kushmerick, J. G. Applied Physics Letters 2007, 90, 083117/1.
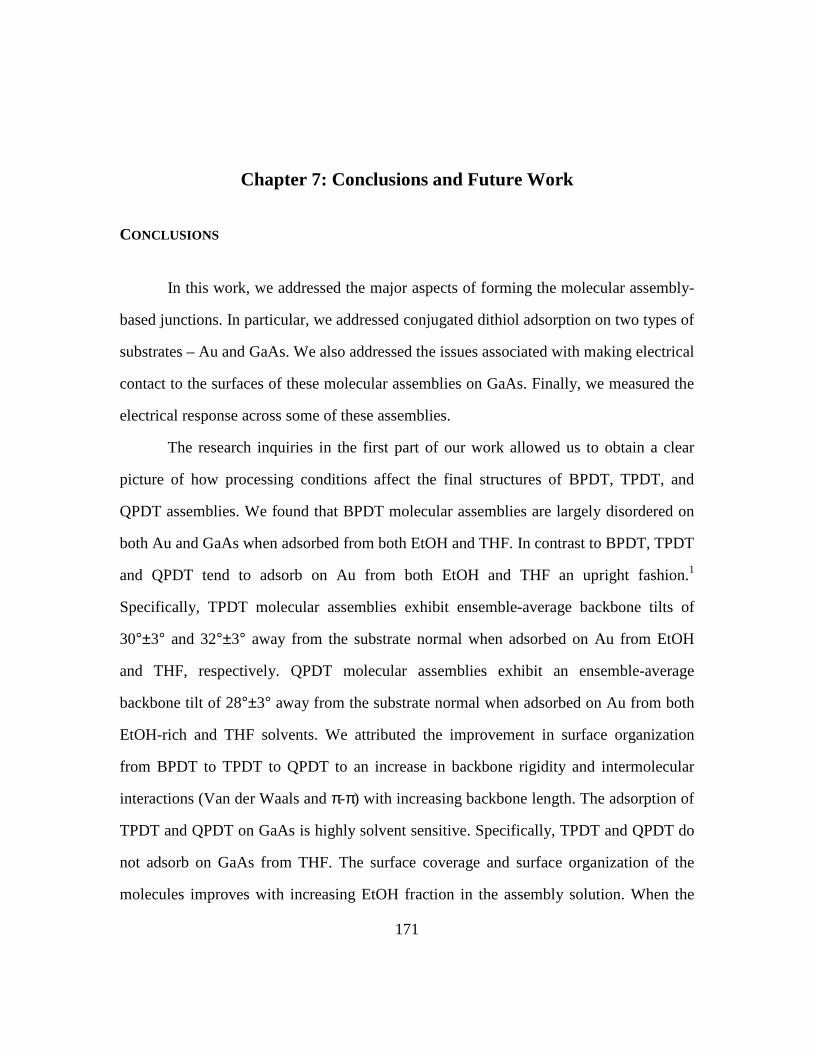
171
Chapter 7: Conclusions and Future Work
CONCLUSIONS
In this work, we addressed the major aspects of forming the molecular assembly-
based junctions. In particular, we addressed conjugated dithiol adsorption on two types of
substrates – Au and GaAs. We also addressed the issues associated with making electrical
contact to the surfaces of these molecular assemblies on GaAs. Finally, we measured the
electrical response across some of these assemblies.
The research inquiries in the first part of our work allowed us to obtain a clear
picture of how processing conditions affect the final structures of BPDT, TPDT, and
QPDT assemblies. We found that BPDT molecular assemblies are largely disordered on
both Au and GaAs when adsorbed from both EtOH and THF. In contrast to BPDT, TPDT
and QPDT tend to adsorb on Au from both EtOH and THF an upright fashion.1
Specifically, TPDT molecular assemblies exhibit ensemble-average backbone tilts of
30°±3° and 32°±3° away from the substrate normal when adsorbed on Au from EtOH
and THF, respectively. QPDT molecular assemblies exhibit an ensemble-average
backbone tilt of 28°±3° away from the substrate normal when adsorbed on Au from both
EtOH-rich and THF solvents. We attributed the improvement in surface organization
from BPDT to TPDT to QPDT to an increase in backbone rigidity and intermolecular
interactions (Van der Waals and π-π) with increasing backbone length. The adsorption of
TPDT and QPDT on GaAs is highly solvent sensitive. Specifically, TPDT and QPDT do
not adsorb on GaAs from THF. The surface coverage and surface organization of the
molecules improves with increasing EtOH fraction in the assembly solution. When the

172
adsorption of TPDT and QPDT is carried out from EtOH and an EtOH-rich cosolvent,
the molecular assemblies exhibit a preferentially upright orientation. Specifically, TPDT
molecular assemblies on GaAs exhibit an ensemble-average backbone tilt of 33°±3°
away from the substrate normal when adsorbed from EtOH. QPDT molecular assemblies
on GaAs exhibit an ensemble-average backbone tilt of 27°±3° away from the substrate
normal when adsorbed from a cosolvent with EF = 0.9. We concluded that assembly
from EtOH-rich solvents results in better structural organization in n-phenyldithiols on
GaAs.
These model conjugated systems are assembled from their acetyl-protected
precursors, with the protecting acetyl groups cleaved in-situ using a deprotecting agent,
NH4OH. We discovered that the concentrations of both the deprotecting agent (NH4OH)
and the acetyl-protected precursors in the assembly solution affect the final assembly
structures of n-phenyldithiols. Specifically, TPDT adsorbed from EtOH on Au at 1 mM
NH4OH exhibits an ensemble-average backbone tilt of 21°±3° away from the substrate
normal. The assembly becomes less upright when formed at 160 mM NH4OH, exhibiting
an ensemble-average backbone tilt of 29°±3°. Similarly, TPDT adsorbed from EtOH on
GaAs exhibits ensemble-average backbone tilts of 27°±3° and 34°±3° at 1 and 160 mM
NH4OH, respectively. We concluded that the final structure of TPDT assembled on GaAs
from EtOH is upright at low NH4OH concentrations and becomes less so with increasing
NH4OH concentrations. TPDT assemblies on GaAs carried out from THF are drastically
different from those carried out from EtOH. Specifically, TPDT assemblies on GaAs
carried out from THF at low NH4OH concentrations exhibit negligible surface coverage.
The surface coverage and structural organization of TPDT assemblies on GaAs carried
out from THF improve with increasing NH4OH concentrations, although these
assemblies are never as upright as those achieved from EtOH at low NH4OH
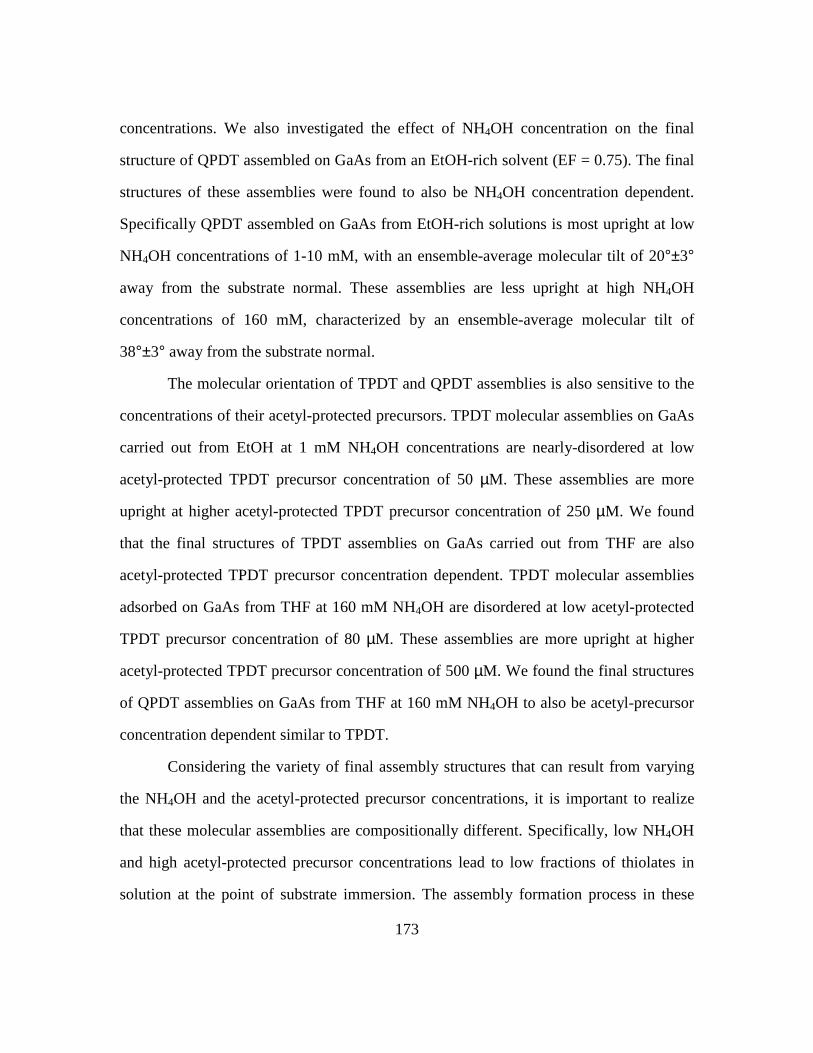
173
concentrations. We also investigated the effect of NH4OH concentration on the final
structure of QPDT assembled on GaAs from an EtOH-rich solvent (EF = 0.75). The final
structures of these assemblies were found to also be NH4OH concentration dependent.
Specifically QPDT assembled on GaAs from EtOH-rich solutions is most upright at low
NH4OH concentrations of 1-10 mM, with an ensemble-average molecular tilt of 20°±3°
away from the substrate normal. These assemblies are less upright at high NH4OH
concentrations of 160 mM, characterized by an ensemble-average molecular tilt of
38°±3° away from the substrate normal.
The molecular orientation of TPDT and QPDT assemblies is also sensitive to the
concentrations of their acetyl-protected precursors. TPDT molecular assemblies on GaAs
carried out from EtOH at 1 mM NH4OH concentrations are nearly-disordered at low
acetyl-protected TPDT precursor concentration of 50 µM. These assemblies are more
upright at higher acetyl-protected TPDT precursor concentration of 250 µM. We found
that the final structures of TPDT assemblies on GaAs carried out from THF are also
acetyl-protected TPDT precursor concentration dependent. TPDT molecular assemblies
adsorbed on GaAs from THF at 160 mM NH4OH are disordered at low acetyl-protected
TPDT precursor concentration of 80 µM. These assemblies are more upright at higher
acetyl-protected TPDT precursor concentration of 500 µM. We found the final structures
of QPDT assemblies on GaAs from THF at 160 mM NH4OH to also be acetyl-precursor
concentration dependent similar to TPDT.
Considering the variety of final assembly structures that can result from varying
the NH4OH and the acetyl-protected precursor concentrations, it is important to realize
that these molecular assemblies are compositionally different. Specifically, low NH4OH
and high acetyl-protected precursor concentrations lead to low fractions of thiolates in
solution at the point of substrate immersion. The assembly formation process in these
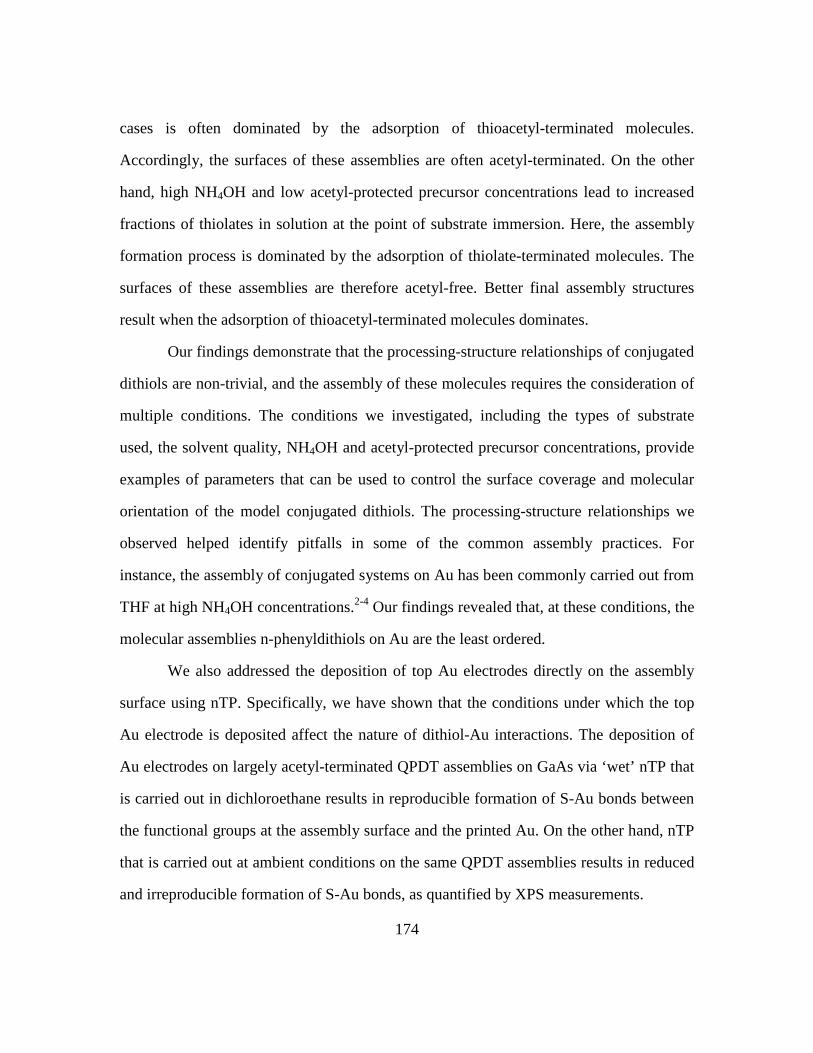
174
cases is often dominated by the adsorption of thioacetyl-terminated molecules.
Accordingly, the surfaces of these assemblies are often acetyl-terminated. On the other
hand, high NH4OH and low acetyl-protected precursor concentrations lead to increased
fractions of thiolates in solution at the point of substrate immersion. Here, the assembly
formation process is dominated by the adsorption of thiolate-terminated molecules. The
surfaces of these assemblies are therefore acetyl-free. Better final assembly structures
result when the adsorption of thioacetyl-terminated molecules dominates.
Our findings demonstrate that the processing-structure relationships of conjugated
dithiols are non-trivial, and the assembly of these molecules requires the consideration of
multiple conditions. The conditions we investigated, including the types of substrate
used, the solvent quality, NH4OH and acetyl-protected precursor concentrations, provide
examples of parameters that can be used to control the surface coverage and molecular
orientation of the model conjugated dithiols. The processing-structure relationships we
observed helped identify pitfalls in some of the common assembly practices. For
instance, the assembly of conjugated systems on Au has been commonly carried out from
THF at high NH4OH concentrations.2-4 Our findings revealed that, at these conditions, the
molecular assemblies n-phenyldithiols on Au are the least ordered.
We also addressed the deposition of top Au electrodes directly on the assembly
surface using nTP. Specifically, we have shown that the conditions under which the top
Au electrode is deposited affect the nature of dithiol-Au interactions. The deposition of
Au electrodes on largely acetyl-terminated QPDT assemblies on GaAs via ‘wet’ nTP that
is carried out in dichloroethane results in reproducible formation of S-Au bonds between
the functional groups at the assembly surface and the printed Au. On the other hand, nTP
that is carried out at ambient conditions on the same QPDT assemblies results in reduced
and irreproducible formation of S-Au bonds, as quantified by XPS measurements.
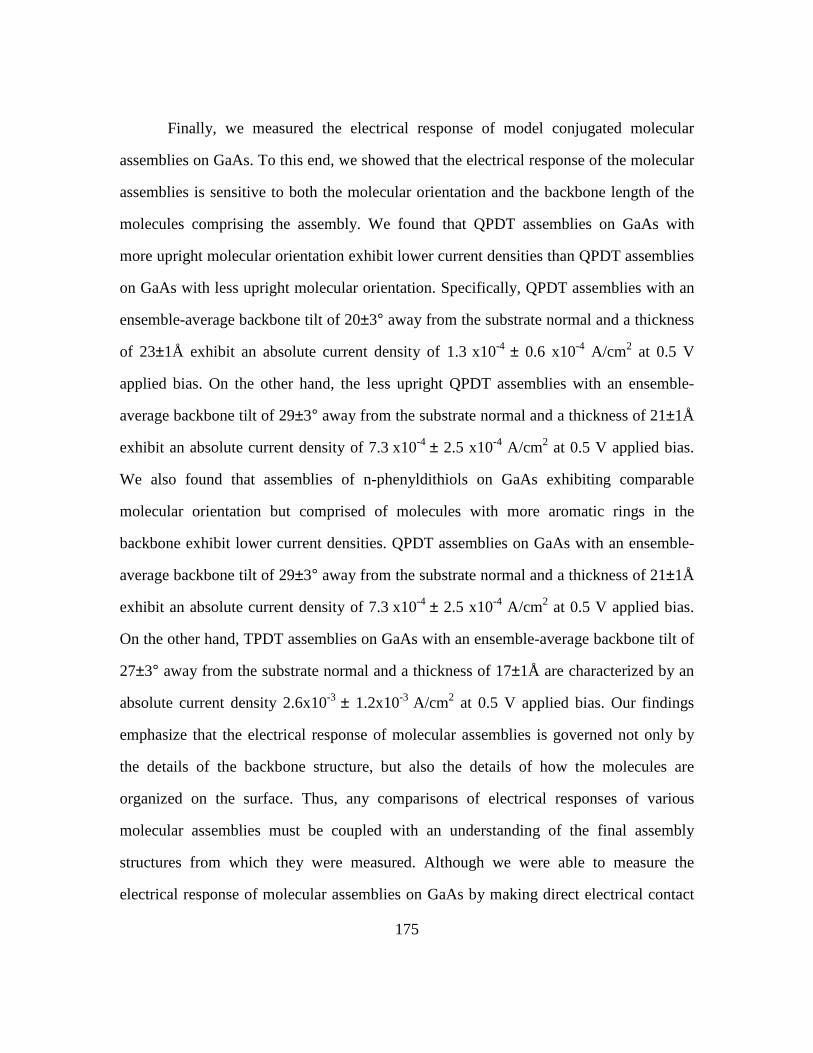
175
Finally, we measured the electrical response of model conjugated molecular
assemblies on GaAs. To this end, we showed that the electrical response of the molecular
assemblies is sensitive to both the molecular orientation and the backbone length of the
molecules comprising the assembly. We found that QPDT assemblies on GaAs with
more upright molecular orientation exhibit lower current densities than QPDT assemblies
on GaAs with less upright molecular orientation. Specifically, QPDT assemblies with an
ensemble-average backbone tilt of 20±3° away from the substrate normal and a thickness
of 23±1Å exhibit an absolute current density of 1.3 x10⁻⁴ ± 0.6 x10⁻⁴ A/cm2 at 0.5 V
applied bias. On the other hand, the less upright QPDT assemblies with an ensemble-
average backbone tilt of 29±3° away from the substrate normal and a thickness of 21±1Å
exhibit an absolute current density of 7.3 x10⁻⁴ ± 2.5 x10⁻⁴ A/cm2 at 0.5 V applied bias.
We also found that assemblies of n-phenyldithiols on GaAs exhibiting comparable
molecular orientation but comprised of molecules with more aromatic rings in the
backbone exhibit lower current densities. QPDT assemblies on GaAs with an ensemble-
average backbone tilt of 29±3° away from the substrate normal and a thickness of 21±1Å
exhibit an absolute current density of 7.3 x10⁻⁴ ± 2.5 x10⁻⁴ A/cm2 at 0.5 V applied bias.
On the other hand, TPDT assemblies on GaAs with an ensemble-average backbone tilt of
27±3° away from the substrate normal and a thickness of 17±1Å are characterized by an
absolute current density 2.6x10⁻³ ± 1.2x10⁻³ A/cm2 at 0.5 V applied bias. Our findings
emphasize that the electrical response of molecular assemblies is governed not only by
the details of the backbone structure, but also the details of how the molecules are
organized on the surface. Thus, any comparisons of electrical responses of various
molecular assemblies must be coupled with an understanding of the final assembly
structures from which they were measured. Although we were able to measure the
electrical response of molecular assemblies on GaAs by making direct electrical contact
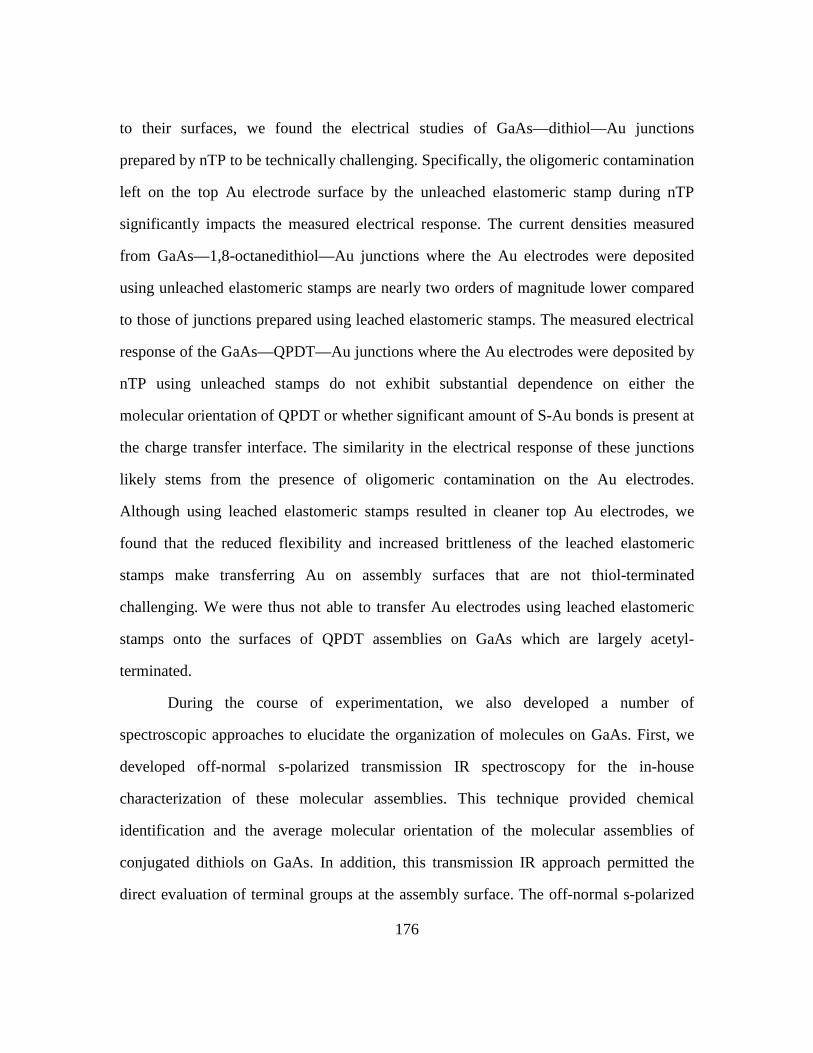
176
to their surfaces, we found the electrical studies of GaAs—dithiol—Au junctions
prepared by nTP to be technically challenging. Specifically, the oligomeric contamination
left on the top Au electrode surface by the unleached elastomeric stamp during nTP
significantly impacts the measured electrical response. The current densities measured
from GaAs—1,8-octanedithiol—Au junctions where the Au electrodes were deposited
using unleached elastomeric stamps are nearly two orders of magnitude lower compared
to those of junctions prepared using leached elastomeric stamps. The measured electrical
response of the GaAs—QPDT—Au junctions where the Au electrodes were deposited by
nTP using unleached stamps do not exhibit substantial dependence on either the
molecular orientation of QPDT or whether significant amount of S-Au bonds is present at
the charge transfer interface. The similarity in the electrical response of these junctions
likely stems from the presence of oligomeric contamination on the Au electrodes.
Although using leached elastomeric stamps resulted in cleaner top Au electrodes, we
found that the reduced flexibility and increased brittleness of the leached elastomeric
stamps make transferring Au on assembly surfaces that are not thiol-terminated
challenging. We were thus not able to transfer Au electrodes using leached elastomeric
stamps onto the surfaces of QPDT assemblies on GaAs which are largely acetyl-
terminated.
During the course of experimentation, we also developed a number of
spectroscopic approaches to elucidate the organization of molecules on GaAs. First, we
developed off-normal s-polarized transmission IR spectroscopy for the in-house
characterization of these molecular assemblies. This technique provided chemical
identification and the average molecular orientation of the molecular assemblies of
conjugated dithiols on GaAs. In addition, this transmission IR approach permitted the
direct evaluation of terminal groups at the assembly surface. The off-normal s-polarized
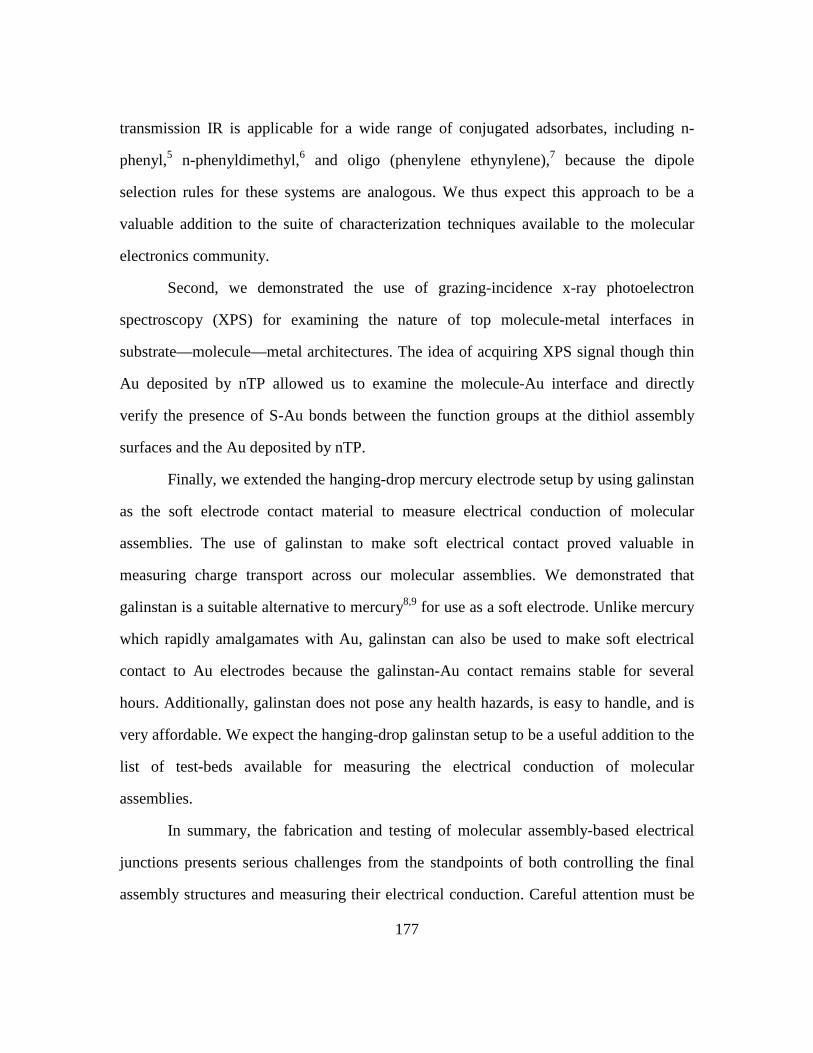
177
transmission IR is applicable for a wide range of conjugated adsorbates, including n-
phenyl,5 n-phenyldimethyl,6 and oligo (phenylene ethynylene),7 because the dipole
selection rules for these systems are analogous. We thus expect this approach to be a
valuable addition to the suite of characterization techniques available to the molecular
electronics community.
Second, we demonstrated the use of grazing-incidence x-ray photoelectron
spectroscopy (XPS) for examining the nature of top molecule-metal interfaces in
substrate—molecule—metal architectures. The idea of acquiring XPS signal though thin
Au deposited by nTP allowed us to examine the molecule-Au interface and directly
verify the presence of S-Au bonds between the function groups at the dithiol assembly
surfaces and the Au deposited by nTP.
Finally, we extended the hanging-drop mercury electrode setup by using galinstan
as the soft electrode contact material to measure electrical conduction of molecular
assemblies. The use of galinstan to make soft electrical contact proved valuable in
measuring charge transport across our molecular assemblies. We demonstrated that
galinstan is a suitable alternative to mercury8,9 for use as a soft electrode. Unlike mercury
which rapidly amalgamates with Au, galinstan can also be used to make soft electrical
contact to Au electrodes because the galinstan-Au contact remains stable for several
hours. Additionally, galinstan does not pose any health hazards, is easy to handle, and is
very affordable. We expect the hanging-drop galinstan setup to be a useful addition to the
list of test-beds available for measuring the electrical conduction of molecular
assemblies.
In summary, the fabrication and testing of molecular assembly-based electrical
junctions presents serious challenges from the standpoints of both controlling the final
assembly structures and measuring their electrical conduction. Careful attention must be
178
paid to each aspect of molecular assembly-based junction formation and analysis. We
also presented a number of technical approaches to help address both the structural
details of the molecular assemblies and their electrical response.
FUTURE WORK
We elucidated the ensemble-average structural details of n-phenyldithiol
assemblies on GaAs. We also demonstrated macroscopic electrical characterization of
charge transport across these assemblies. Our ensemble-average studies can be
complemented by understanding the structure and charge transport characteristics at the
individual molecule level. The understanding of the local structure and electrical
characteristics would help shed light on the fundamental properties of the single
molecules comprising the assembly structure. The comparison of single-molecule
characteristics to the ensemble-average characteristics of molecular assemblies will help
determine whether differences between the two exist. The structural and charge transport
details at the molecular scale are commonly examined using scanning tunneling
microscopy (STM). Etched GaAs surfaces like those we used for molecular assembly
formation, however, are not smooth enough for STM characterization. Instead,
atomically-flat topographies are required. We propose that work should be carried out to
form molecular assemblies on cleaved, rather than etched GaAs surfaces. Cleaved GaAs
surfaces are known to contain atomically-flat regions.10,11 If cleaved in-situ in the
assembly solution, the GaAs surface should remain oxide-free and allow the formation of
molecular assemblies. The local details of molecular surface organization on GaAs and
charge transport through such assemblies should then be accessible via STM
characterization.

179
We also propose that additional work should be carried out on the electrical
characterization of GaAs—molecule—Au in which the top Au electrodes are deposited
using nTP. We demonstrated that the cleanness of the transferred Au impacts the quality
of the Au-galinstan electrical contact and is important for measuring the electrical
response of the molecular assemblies. Using leached elastomeric stamps to transfer Au
electrodes resulted in a cleaner Au-galinstan interface in the GaAs—molecule—Au
junctions. Leached stamps, however, are mechanically less flexible and more ‘sticky’ to
Au, preventing Au transfer on molecular assembly surfaces that are not thiol-terminated.
Further work should be done to allow the formation of cleaner Au-galinstan interfaces in
the GaAs-molecule-Au junctions. One way to potentially achieve cleaner Au-galinstan
interfaces involves modifying the printing process. For instance, it has been demonstrated
that that by carefully controlling the speed at which the stamp is removed during nTP,
metal films can be transferred even onto relatively ‘non-stick’ target surfaces, such as
glass treated with (tridecafluoro-1,1,2,2-tetrahydrooctyl) trichlorosilane.12 The
implementation of a mechanical setup allowing stamp removal at controlled speeds may
aid in transferring Au electrodes on acetyl-terminated assemblies or even assemblies
without a reactive surface functionality with leached stamps. Having a pristine Au-
galinstan interface would allow for high quality electrical contact to GaAs-molecule-Au
junctions and enable reliable characterization of charge transfer across the molecular
assemblies.
Having developed the ability to control the structure of the molecular assembly
and to measure the electrical response of the molecular assemblies of simple n-
phenyldithiols, we propose extending the studies to more complex conjugated chemistries
relevant to the molecular electronics community. For example, asymmetric conjugated
molecules, including thiophene-, pyrole-, and oligo(phenylene ethynylene)-based systems
180
have been reported to exhibit conductance switching.13,14 The development of conjugated
molecules capable of useful electrical response and their implementation in functional
junction architectures would help realize the potential of molecular electronics originally
envisioned by Aviram and Ratner15 three decades ago.
Finally, we propose the simultaneous spectroscopic and electrical characterization
of GaAs-molecule-Au junctions. Provided that the continuity and cleanness of thin Au
layers deposited on assembly surfaces can be improved, setups combining spectroscopic
structural characterization through the metal overlayer with electrical characterization can
be envisioned. For example, the fluorescence yield (FY) capability of near-edge
absorption fine structure (NEXAFS) spectroscopy16,17 can be used for spectroscopic
characterization of buried interfaces. Specifically, in the FY mode, fluorescent radiation
that results from radiative core hole annihilation is detected.17 Fluorescent radiation is
more penetrating (≈50 nm)17 than electrons (≈5 nm),17 extending the depth of detection.
FY NEXAFS can therefore be used for characterizing molecular assemblies buried under
top Au electrodes. In fact, preliminary experiments have shown that we are indeed able to
observe a single layer of molecules constrained between a GaAs substrate and 5 nm thick
Au deposited by nTP. Figure 7.1 contains C 1s pre- and post-edge normalized FY
NEXAFS spectra of QPDT molecular assemblies on GaAs before (bottom) and after
(top) depositing 5 nm thick Au by nTP. As illustrated by the presence of π* and σ*
resonances characteristic of the molecular assembly in the spectrum of the GaAs—
QPDT—Au junction, we are able to observe the QPDT molecular assembly through the
Au. Given that sufficiently continuous and clean Au can be deposited on the molecular
assembly surfaces to form GaAs—molecule—Au junctions, and an electrical stage can be
constructed within the NEXAFS chamber so bias can be applied to these junctions in-

181
situ, both the structure and the electrical behavior of the molecular assembly can be
characterized simultaneously.
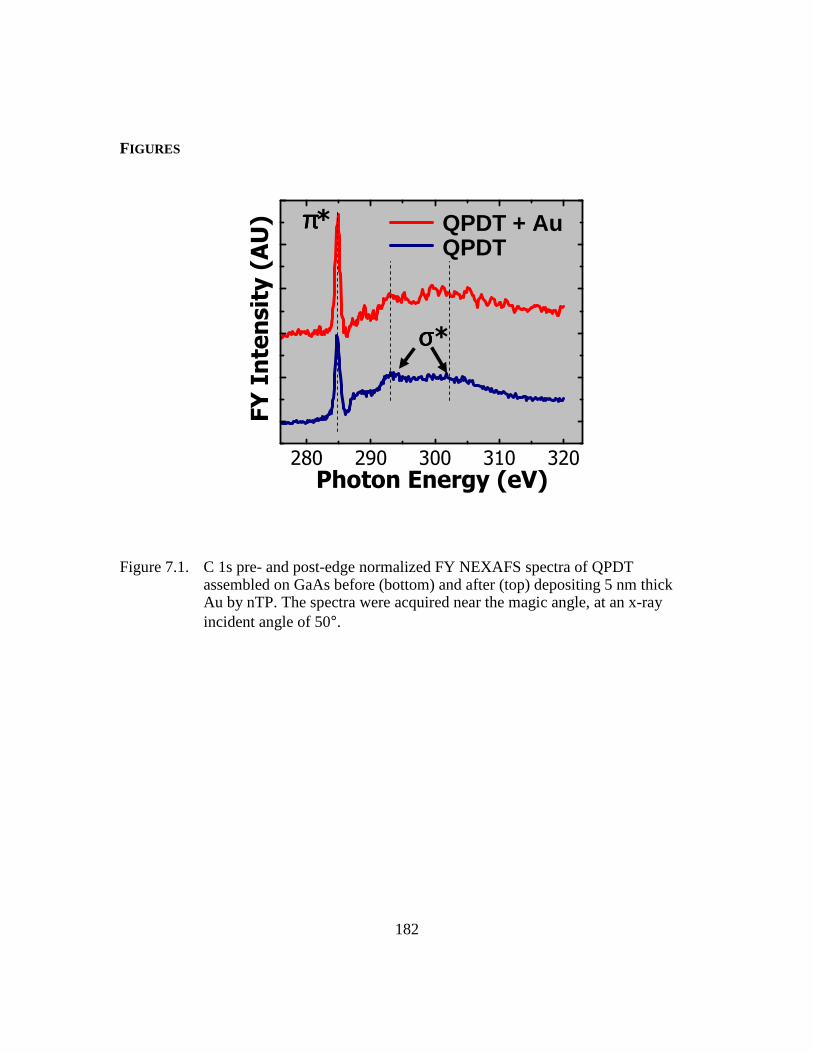
182
FIGURES
36% Au area coverage
280 290 300 310 320
FY Intensity (AU)
Photon Energy (eV)
SAM + Au print
Open SAM
ππππ*
σσσσ*
QPDTQPDT + Au
Figure 7.1. C 1s pre- and post-edge normalized FY NEXAFS spectra of QPDT assembled on GaAs before (bottom) and after (top) depositing 5 nm thick Au by nTP. The spectra were acquired near the magic angle, at an x-ray incident angle of 50°.
183
REFERENCES
1. Krapchetov, D. A.; Ma, H.; Jen, A. K. Y.; Fischer, D. A.; Loo, Y.-L. Langmuir 2005, 21, 5887.
2. Cai, L.; Yao, Y.; Yang, J.; Price, D. W., Jr.; Tour, J. M. Chemistry of Materials 2002, 14, 2905.
3. de Boer, B.; Meng, H.; Perepichka, D. F.; Zheng, J.; Frank, M. M.; Chabal, Y. J.; Bao, Z. Langmuir 2003, 19, 4272.
4. Jiang, W.; Zhitenev, N.; Bao, Z.; Meng, H.; Abusch-Magder, D.; Tennant, D.; Garfunkel, E. Langmuir 2005, 21, 8751.
5. Krapchetov, D. A.; Ma, H.; Jen, A. K. Y.; Fischer, D. A.; Loo, Y.-L. Langmuir 2006, 22, 9491.
6. Tai, Y.; Shaporenko, A.; Rong, H. T.; Buck, M.; Eck, W.; Grunze, M.; Zharnikov, M. Journal of Physical Chemistry B 2004, 108, 16806.
7. Richter, L. J.; Yang, C. S. C.; Wilson, P. T.; Hacker, C. A.; Van Zee, R. D.; Stapleton, J. J.; Allara, D. L.; Yao, Y.; Tour, J. M. Journal of Physical Chemistry B 2004, 108, 12547.
8. Akkerman Hylke, B.; Naber Ronald, C. G.; Jongbloed, B.; van Hal Paul, A.; Blom Paul, W. M.; de Leeuw Dago, M.; de Boer, B. Proceedings of the National Academy of Sciences of the United States of America 2007, 104, 11161.
9. Nesher, G.; Vilan, A.; Cohen, H.; Cahen, D.; Amy, F.; Chan, C.; Hwang, J.; Kahn, A. Journal of Physical Chemistry B 2006, 110, 14363.
10. Jiang, C.-S.; Nakayama, T.; Aono, M. Applied Surface Science 1998, 130-132, 425.
11. Ruppalt, L. B.; Albrecht, P. M.; Lyding, J. W. Fourth IEEE Conference on Nanotechnology, Muenchen, Germany 2004, 7.
12. Feng, X.; Meitl, M. A.; Bowen, A. M.; Huang, Y.; Nuzzo, R. G.; Rogers, J. A. Langmuir 2007, 23, 12555.
13. Beebe, J. M.; Kushmerick, J. G. Applied Physics Letters 2007, 90, 083117/1.
14. Whalley, A. C.; Steigerwald, M. L.; Guo, X.; Nuckolls, C. Journal of the American Chemical Society 2007, 129, 12590.

184
15. Aviram, A.; Ratner, M. A. Chemical Physics Letters 1974, 29, 277.
16. Fischer, D.; Marti, A.; Hahner, G. Journal of Vacuum Science & Technology A 1997, 15, 2173.
17. Stohr, J., NEXAFS Spectroscopy. Springer: Berlin, 1992.
185
REFERENCES
1. Ulman, A. Chemical Reviews 1996, 96, 1533.
2. Lim, H.; Carraro, C.; Maboudian, R.; Pruessner, M. W.; Ghodssi, R. Langmuir 2004, 20, 743.
3. Baum, T.; Ye, S.; Uosaki, K. Langmuir 1999, 15, 8577.
4. Cox, J. D.; Curry, M. S.; Skirboll, S. K.; Gourley, P. L.; Sasaki, D. Y. Biomaterials 2001, 23, 929.
5. Ostuni, E.; Chapman, R. G.; Liang, M. N.; Meluleni, G.; Pier, G.; Ingber, D. E.; Whitesides, G. M. Langmuir 2001, 17, 6336.
6. Sung, I.-H.; Kim, D.-E. Applied Surface Science 2005, 239, 209.
7. Tiberio, R. C.; Craighead, H. G.; Lercel, M.; Lau, T.; Sheen, C. W.; Allara, D. L. Applied Physics Letters 1993, 62, 476.
8. Ahn, H.-S.; Cuong, P. D.; Park, S.; Kim, Y.-W.; Lim, J.-C. Wear 2003, 255, 819.
9. Perry, S. S.; Lee, S.; Shon, Y.-S.; Colorado, R., Jr.; Lee, T. R. Tribology Letters 2001, 10, 81.
10. Maboudian, R.; Carraro, C. Annual Review of Physical Chemistry 2004, 55, 35.
11. Maboudian, R.; Carraro, C. Journal of Adhesion Science and Technology 2003, 17, 583.
12. Hang, Q.; Wang, F.; Carpenter, P. D.; Zemlyanov, D.; Zakharov, D.; Stach, E. A.; Buhro, W. E.; Janes, D. B. Nano Letters 2008, 8, 49.
13. Aviram, A.; Ratner, M. A. Chemical Physics Letters 1974, 29, 277.
14. Hipps, K. W. Science 2001, 294, 536.
15. Nesher, G.; Shpaisman, H.; Cahen, D. Journal of the American Chemical Society 2007, 129, 734.
16. Nesher, G.; Vilan, A.; Cohen, H.; Cahen, D.; Amy, F.; Chan, C.; Hwang, J.; Kahn, A. Journal of Physical Chemistry B 2006, 110, 14363.
17. Loo, Y.-L.; Willett, R. L.; Baldwin, K. W.; Rogers, J. A. Applied Physics Letters 2002, 81, 562.
186
18. Hsu, J. W. P.; Loo, Y. L.; Lang, D. V.; Rogers, J. A. Journal of Vacuum Science & Technology B 2003, 21, 1928.
19. Loo, Y.-L.; Lang, D. V.; Rogers, J. A.; Hsu, J. W. P. Nano Letters 2003, 3, 913.
20. Loo, Y.-L.; Hsu, J. W. P.; Willett, R. L.; Baldwin, K. W.; West, K. W.; Rogers, J. A. Journal of Vacuum Science & Technology B 2002, 20, 2853.
21. Loo, Y.-L.; Willett, R. L.; Baldwin, K. W.; Rogers, J. A. Journal of the American Chemical Society 2002, 124, 7654.
22. Kushmerick, J. G. Materials Today 2005, 8, 26.
23. Smith Linda, S. Journal of Gerontological Nursing 2003, 29, 26.
24. Krapchetov, D. A.; Ma, H.; Jen, A. K. Y.; Fischer, D. A.; Loo, Y.-L. Langmuir 2005, 21, 5887.
25. Jun, Y.; Zhu, X. Y.; Hsu, J. W. P. Langmuir 2006, 22, 3627.
26. Nicoara, N.; Cerrillo, I.; Xueming, D.; Garcia, J. M.; Garcia, B.; Gomez-Navarro, C.; Mendez, J.; Baro, A. M. Nanotechnology 2002, 13, 352.
27. de Boer, B.; Meng, H.; Perepichka, D. F.; Zheng, J.; Frank, M. M.; Chabal, Y. J.; Bao, Z. Langmuir 2003, 19, 4272.
28. Camillone, N.; Khan, K. A.; Osgood, R. M. Surface Science 2000, 453, 83.
29. Kim, C.; Burrows, P. E.; Forrest, S. R. Science 2000, 288, 831.
30. Dubois, L. H.; Nuzzo, R. G. Annual Review of Physical Chemistry 1992, 43, 437.
31. Dubois, L. H.; Zegarski, B. R.; Nuzzo, R. G. Journal of Chemical Physics 1993, 98, 678.
32. Ye, S.; Li, G.; Noda, H.; Uosaki, K.; Osawa, M. Surface Science 2003, 529, 163.
33. Karpovich, D. S.; Blanchard, G. J. Langmuir 1994, 10, 3315.
34. Fischer, D.; Marti, A.; Hahner, G. Journal of Vacuum Science & Technology A 1997, 15, 2173.
35. Laibinis, P. E.; Whitesides, G. M.; Allara, D. L.; Tao, Y. T.; Parikh, A. N.; Nuzzo, R. G. Journal of the American Chemical Society 1991, 113, 7152.
36. Kondoh, H.; Nambu, A.; Ehara, Y.; Matsui, F.; Yokoyama, T.; Ohta, T. Journal of Physical Chemistry B 2004, 108, 12946.
187
37. Tamam, L.; Kraack, H.; Sloutskin, E.; Ocko, B. M.; Pershan, P. S.; Ulman, A.; Deutsch, M. Journal of Physical Chemistry B 2005, 109, 12534.
38. McGuiness, C. L.; Shaporenko, A.; Mars, C. K.; Uppili, S.; Zharnikov, M.; Allara, D. L. Journal of the American Chemical Society 2006, 128, 5231.
39. Dannenberger, O.; Buck, M.; Grunze, M. Journal of Physical Chemistry B 1999, 103, 2202.
40. Bain, C. D.; Troughton, E. B.; Tao, Y. T.; Evall, J.; Whitesides, G. M.; Nuzzo, R. G. Journal of the American Chemical Society 1989, 111, 321.
41. Asadi, K.; Gholamrezaie, F.; Smits, E. C. P.; Blom, P. W. M.; de Boer, B. Journal of Materials Chemistry 2007, 17, 1947.
42. Castner, D. G.; Hinds, K.; Grainger, D. W. Langmuir 1996, 12, 5083.
43. Shaporenko, A.; Adlkofer, K.; Johansson, L. S. O.; Ulman, A.; Grunze, M.; Tanaka, M.; Zharnikov, M. Journal of Physical Chemistry B 2004, 108, 17964.
44. Shaporenko, A.; Elbing, M.; Blaszczyk, A.; Von Haenisch, C.; Mayor, M.; Zharnikov, M. Journal of Physical Chemistry B 2006, 110, 4307.
45. Cai, L.; Yao, Y.; Yang, J.; Price, D. W., Jr.; Tour, J. M. Chemistry of Materials 2002, 14, 2905.
46. Hutchison, J. E.; Postlethwaite, T. A.; Murray, R. W. Langmuir 1993, 9, 3277.
47. Collier, C. P.; Wong, E. W.; Belohradsky, M.; Raymo, F. M.; Stoddart, J. F.; Kuekes, P. J.; Williams, R. S.; Heath, J. R. Science 1999, 285, 391.
48. Kang, J. F.; Ulman, A.; Liao, S.; Jordan, R.; Yang, G.; Liu, G.-Y. Langmuir 2001, 17, 95.
49. Zharnikov, M.; Grunze, M. Journal of Physics: Condensed Matter 2001, 13, 11333.
50. Frey, S.; Stadler, V.; Heister, K.; Eck, W.; Zharnikov, M.; Grunze, M.; Zeysing, B.; Terfort, A. Langmuir 2001, 17, 2408.
51. Himmel, H.-J.; Terfort, A.; Woell, C. Journal of the American Chemical Society 1998, 120, 12069.
52. Tour, J. M.; Jones, L.; Pearson, D. L.; Lamba, J. J. S.; Burgin, T. P.; Whitesides, G. M.; Allara, D. L.; Parikh, A. N.; Atre, S. Journal of the American Chemical Society 1995, 117, 9529.

188
53. Weckenmann, U.; Mittler, S.; Naumann, K.; Fischer, R. A. Langmuir 2002, 18, 5479.
54. Tour, J. M.; II, L. J.; Pearson, D. L.; Lamba, J. J. S.; Burgin, T. P.; Whitesides, G. M.; Allara, D. L.; Parikh, A. N.; Atre, S. V. Journal of American Chemical Society 1995, 117, 9529.
55. Krapchetov, D. A.; Ma, H.; Jen, A. K. Y.; Fischer, D. A.; Loo, Y.-L. Langmuir 2008, 24, 851.
56. Azzam, W.; Wehner, B. I.; Fischer, R. A.; Terfort, A.; Woell, C. Langmuir 2002, 18, 7766.
57. Jiang, W.; Zhitenev, N.; Bao, Z.; Meng, H.; Abusch-Magder, D.; Tennant, D.; Garfunkel, E. Langmuir 2005, 21, 8751.
58. de Boer, B.; Frank, M. M.; Chabal, Y. J.; Jiang, W.; Garfunkel, E.; Bao, Z. Langmuir 2004, 20, 1539.
59. Kushmerick, J. G.; Holt, D. B.; Yang, J. C.; Naciri, J.; Moore, M. H.; Shashidhar, R. Physical Review Letters 2002, 89, 086802/1.
60. Mann, B.; Kuhn, H. Journal of Applied Physics 1971, 42, 4398.
61. Akkerman Hylke, B.; Naber Ronald, C. G.; Jongbloed, B.; van Hal Paul, A.; Blom Paul, W. M.; de Leeuw Dago, M.; de Boer, B. Proceedings of the National Academy of Sciences of the United States of America 2007, 104, 11161.
62. Cui, X. D.; Primak, A.; Zarate, X.; Tomfohr, J.; Sankey, O. F.; Moore, A. L.; Moore, T. A.; Gust, D.; Harris, G.; Lindsay, S. M. Science 2001, 294, 571.
63. Engelkes, V. B.; Beebe, J. M.; Frisbie, C. D. Journal of the American Chemical Society 2004, 126, 14287.
64. Milani, F.; Grave, C.; Ferri, V.; Samori, P.; Rampi, M. A. ChemPhysChem 2007, 8, 515.
65. Kim, T.-W.; Wang, G.; Lee, H.; Lee, T. Nanotechnology 2007, 18, 315204/1.
66. Ishida, T.; Mizutani, W.; Liang, T.-T.; Azehara, H.; Miyake, K.; Sasaki, S.; Tokumoto, H. Annals of the New York Academy of Sciences 2003, 1006, 164.
67. Lummerstorfer, T.; Sohar, C.; Friedbacher, G.; Hoffmann, H. Langmuir 2006, 22, 18.

189
68. Richter, C. A.; Hacker, C. A.; Richter, L. J. Journal of Physical Chemistry B 2005, 109, 21836.
69. Haick, H.; Ghabboun, J.; Niitsoo, O.; Cohen, H.; Cahen, D.; Vilan, A.; Hwang, J.; Wan, A.; Amy, F.; Kahn, A. Journal of Physical Chemistry B 2005, 109, 9622.
70. Walker, A. V.; Tighe, T. B.; Cabarcos, O. M.; Reinard, M. D.; Haynie, B. C.; Uppili, S.; Winograd, N.; Allara, D. L. Journal of the American Chemical Society 2004, 126, 3954.
71. Qu, D.; Uosaki, K. Journal of Physical Chemistry B 2006, 110, 17570.
72. Salomon, A.; Boecking, T.; Gooding, J. J.; Cahen, D. Nano Letters 2006, 6, 2873.
73. Pinchart, A.; Dallaire, C.; Van Bierbeek, A.; Gingras, M. Tetrahedron Letters 1999, 40, 5479.
74. Pearson, D. L.; Tour, J. M. Journal of Organic Chemistry 1997, 62, 1376.
75. Xia, Y.; Whitesides, G. M. Angewandte Chemie 1998, 37, 550.
76. Kumar, A.; Whitesides, G. M. Applied Physics Letters 1993, 63, 2002.
77. Xia, Y.; Rogers, J. A.; Paul, K. E.; Whitesides, G. M. Chemical Reviews 1999, 99, 1823.
78. Felmet, K.; Loo, Y.-L.; Sun, Y. Applied Physics Letters 2004, 85, 3316.
79. Shimizu, K. T.; Fabbri, J. D.; Jelincic, J. J.; Melosh, N. A. Advanced Materials 2006, 18, 1499.
80. Vilan, A.; Cahen, D. Advanced Functional Materials 2002, 12, 795.
81. Lide, D. R., CRC Handbook of Chemistry and Physics. CRC Press: Boca Raton, FL, 1994.
82. Stohr, J.; Outka, D. A. Physical Review B 1987, 36, 7891.
83. Detailed information on the NIST/Dow Soft X-Ray Materials Characterization Facility at NSLS BNL see: http://www.nsls.bnl.gov/newsroom/publications/newsletters/1996/96-nov.pdf
84. Genzer, J.; Kramer, E. J.; Fischer, D. A. Journal of Applied Physics 2002, 92, 7070.
190
85. Genzer, J.; Sivaniah, E.; Kramer, E. J.; Wang, J.; Koerner, H.; Char, K.; Ober, C. K.; DeKoven, B. M.; Bubeck, R. A.; Fischer, D. A.; Sambasivan, S. Langmuir 2000, 16, 1993.
86. Fischer, D. A.; Efimenko, K.; Bhat, R. R.; Sambasivan, S.; Genzer, J. Macromolecular Rapid Communications 2004, 25, 141.
87. Stohr, J., NEXAFS Spectroscopy. Springer: Berlin, 1992.
88. Banerjee, S.; Hemraj-Benny, T.; Sambasivan, S.; Fischer, D. A.; Misewich, J. A.; Wong, S. S. Journal of Physical Chemistry B 2005, 109, 8489.
89. Kinzler, M.; Schertel, A.; Haehner, G.; Woell, C.; Grunze, M.; Albrecht, H.; Holzhueter, G.; Gerber, T. Journal of Chemical Physics 1994, 100, 7722.
90. Outka, D. A.; Stoehr, J.; Rabe, J. P.; Swalen, J. D. Journal of Chemical Physics 1988, 88, 4076.
91. Trotter, J. Acta Crystallographica 1961, 14, 1135.
92. Shaporenko, A.; Adlkofer, K.; Johansson, L. S. O.; Tanaka, M.; Zharnikov, M. Langmuir 2003, 19, 4992.
93. Corish, J.; Morton-Blake, D. A.; O'Donoghue, F.; Baudour, J. L.; Beniere, F.; Toudic, B. Theochem 1995, 358, 29.
94. Cailleau, H.; Baudour, J. L.; Zeyen, C. M. E. Acta Crystallographica 1979, B35, 426.
95. Baudour, J. L.; Delugeard, Y.; Rivet, P. Acta Crystallographica 1978, B34, 625.
96. Stapleton, J. J.; Harder, P.; Daniel, T. A.; Reinard, M. D.; Yao, Y.; Price, D. W.; Tour, J. M.; Allara, D. L. Langmuir 2003, 19, 8245.
97. Hacker, C. A.; Batteas, J. D.; Garno, J. C.; Marquez, M.; Richter, C. A.; Richter, L. J.; Van Zee, R. D.; Zangmeister, C. D. Langmuir 2004, 20, 6195.
98. Nuzzo, R. G.; Dubois, L. H.; Allara, D. L. Journal of the American Chemical Society 1990, 112, 558.
99. Niklewski, A.; Azzam, W.; Strunskus, T.; Fischer, R. A.; Woell, C. Langmuir 2004, 20, 8620.
100. Krapchetov, D. A.; Ma, H.; Jen, A. K. Y.; Fischer, D. A.; Loo, Y.-L. Langmuir 2006, 22, 9491.
191
101. Tolstoy, V. P.; Chernyshova, I. V.; Skryshevsky, V. A., Handbook of Infrared Spectroscopy of Ultrathin Films. John Wiley & Sons, Inc.: 2003.
102. Lebedev, M. V.; Mayer, T.; Jaegermann, W. Surface Science 2003, 547, 171.
103. Cranstoun Stephen, D.; Ombao Hernando, C.; von Sachs, R.; Guo, W.; Litt, B. IEEE Transactions on Bio-Medical Engineering 2002, 49, 988.
104. Maoz, R.; Sagiv, J.; Degenhardt, D.; Moehwald, H.; Quint, P. Supramolecular Science 1995, 2, 9.
105. Sheen, C. W.; Shi, J. X.; Maartensson, J.; Parikh, A. N.; Allara, D. L. Journal of the American Chemical Society 1992, 114, 1514.
106. Collins, R. W.; Kim, Y. T. Analytical Chemistry 1990, 62, 887A.
107. Shi, J.; Hong, B.; Parikh, A. N.; Collins, R. W.; Allara, D. L. Chemical Physics Letters 1995, 246, 90.
108. Heister, K.; Zharnikov, M.; Grunze, M.; Johansson, L. S. O. Journal of Physical Chemistry B 2001, 105, 4058.
109. Chaki, N. K.; Vijayamohanan, K. Biosensors & Bioelectronics 2002, 17, 1.
110. Tai, Y.; Shaporenko, A.; Rong, H. T.; Buck, M.; Eck, W.; Grunze, M.; Zharnikov, M. Journal of Physical Chemistry B 2004, 108, 16806.
111. Moulder, J. F.; Stickle, W. E.; Sobol, P. E.; Bomben, K. D., Handbook of X-ray Photoelectron Spectroscopy. Perkin-Elmer Corp.: Eden Prairie, MN: 1992.
112. Shirley, D. A. Physical Review B 1972, [3]5 , 4709.
113. Aronniemi, M.; Sainio, J.; Lahtinen, J. Surface Science 2005, 578, 108.
114. Surmann, P.; Zeyat, H. Analytical and Bioanalytical Chemistry 2005, 383, 1009.
115. Poirier, G. E.; Pylant, E. D. Science 1996, 272, 1145.
116. Leung, T. Y. B.; Gerstenberg, M. C.; Lavrich, D. J.; Scoles, G.; Schreiber, F.; Poirier, G. E. Langmuir 2000, 16, 549.
117. Kobayashi, K.; Horiuchi, T.; Yamada, H.; Matsushige, K. Thin Solid Films 1998, 331, 210.
118. Ishida, T.; Mizutani, W.; Azehara, H.; Sato, F.; Choi, N.; Akiba, U.; Fujihira, M.; Tokumoto, H. Langmuir 2001, 17, 7459.
192
119. Fuxen, C.; Azzam, W.; Arnold, R.; Witte, G.; Terfort, A.; Woell, C. Langmuir 2001, 17, 3689.
120. Mekhalif, Z.; Laffineur, F.; Couturier, N.; Delhalle, J. Langmuir 2003, 19, 637.
121. Schlenoff, J. B.; Li, M.; Ly, H. Journal of the American Chemical Society 1995, 117, 12528.
122. Lavrich, D. J.; Wetterer, S. M.; Bernasek, S. L.; Scoles, G. Journal of Physical Chemistry B 1998, 102, 3456.
123. Pollack, S. K.; Naciri, J.; Mastrangelo, J.; Patterson, C. H.; Torres, J.; Moore, M.; Shashidhar, R.; Kushmerick, J. G. Langmuir 2004, 20, 1838.
124. Donhauser, Z. J.; Mantooth, B. A.; Kelly, K. F.; Bumm, L. A.; Monnell, J. D.; Stapleton, J. J.; Price Jr, D. W.; Rawlett, A. M.; Allara, D. L.; Tour, J. M.; Weiss, P. S. Science 2001, 292, 2303.
125. Cai, L.; Bahr, J. L.; Yao, Y.; Tour, J. M. Chemistry of Materials 2002, 14, 4235.
126. Ke, Y.; Milano, S.; Wang, X. W.; Tao, N.; Darici, Y. Surface Science 1998, 415, 29.
127. Liao, S.; Shnidman, Y.; Ulman, A. Journal of the American Chemical Society 2000, 122, 3688.
128. L.G. Wade, J., Organic Chemistry. Prentice-Hall, Inc.: Upper Saddle River, New Jersey, 1999.
129. Lau, K. H. A.; Huang, C.; Yakovlev, N.; Chen, Z. K.; O'Shea, S. J. Langmuir 2006, 22, 2968.
130. Akkerman Hylke, B.; Blom Paul, W. M.; de Leeuw Dago, M.; de Boer, B. Nature 2006, 441, 69.
131. Ohgi, T.; Sheng, H. Y.; Nejoh, H. Applied Surface Science 1998, 130-132, 919.
132. Guerin, D.; Merckling, C.; Lenfant, S.; Wallart, X.; Pleutin, S.; Vuillaume, D. Journal of Physical Chemistry C 2007, 111, 7947.
133. Ohgi, T.; Sheng, H. Y.; Dong, Z. C.; Nejoh, H.; Fujita, D. Applied Physics Letters 2001, 79, 2453.
134. Haick, H.; Ambrico, M.; Ghabboun, J.; Ligonzo, T.; Cahen, D. Physical Chemistry Chemical Physics 2004, 6, 4538.
193
135. Haick, H.; Ghabboun, J.; Cahen, D. Applied Physics Letters 2005, 86, 042113/1.
136. Zhou, C.; Deshpande, M. R.; Reed, M. A.; Jones, K., II; Tour, J. M. Applied Physics Letters 1997, 71, 611.
137. Schumm, J. S.; Pearson, D. L.; Jones, L., II; Hara, R.; Tour, J. M. Nanotechnology 1996, 7, 430.
138. McGuiness, C. L.; Shaporenko, A.; Zharnikov, M.; Walker, A. V.; Allara, D. L. Journal of Physical Chemistry C 2007, 111, 4226.
139. Esplandiu, M. J.; Noeske, P. L. M. Applied Surface Science 2002, 199, 166.
140. Deng, W.; Yang, L.; Fujita, D.; Nejoh, H.; Bai, C. Applied Physics A 2000, 71, 639.
141. Rieley, H.; Kendall, G. K.; Zemicael, F. W.; Smith, T. L.; Yang, S. Langmuir 1998, 14, 5147.
142. Xu, L.; Liao, J.; Huang, L.; Gu, N.; Zhang, H.; Liu, J. Applied Surface Science 2003, 211, 184.
143. Shaporenko, A.; Roessler, K.; Lang, H.; Zharnikov, M. Journal of Physical Chemistry B 2006, 110, 24621.
144. Bensebaa, F.; Voicu, R.; Huron, L.; Ellis, T. H.; Kruus, E. Langmuir 1997, 13, 5335.
145. Feng, X.; Meitl, M. A.; Bowen, A. M.; Huang, Y.; Nuzzo, R. G.; Rogers, J. A. Langmuir 2007, 23, 12555.
146. Hur, S.-H.; Khang, D.-Y.; Kocabas, C.; Rogers, J. A. Applied Physics Letters 2004, 85, 5730.
147. Kwok, K. S.; Ellenbogen, J. C. Materials Today 2002, 5, 28.
148. James, D. K.; Tour, J. M. Chemistry of Materials 2004, 16, 4423.
149. Attard, G.; Barnes, C., Surfaces. Oxford University Press Inc.: New York, 2004.
150. Cygan, M. T.; Dunbar, T. D.; Arnold, J. J.; Bumm, L. A.; Shedlock, N. F.; Burgin, T. P.; Jones, L., II; Allara, D. L.; Tour, J. M.; Weiss, P. S. Journal of the American Chemical Society 1998, 120, 2721.
151. Yang, Y.-C.; Lee, Y.-L.; Yang, L.-Y. O.; Yau, S.-L. Langmuir 2006, 22, 5189.
194
152. Gosvami, N.; Lau, K. H. A.; Sinha, S. K.; O'Shea, S. J. Applied Surface Science 2006, 252, 3956.
153. Beebe, J. M.; Engelkes, V. B.; Miller, L. L.; Frisbie, C. D. Journal of the American Chemical Society 2002, 124, 11268.
154. Cui, X. D.; Primak, A.; Zarate, X.; Tomfohr, J.; Sankey, O. F.; Moore, A. L.; Moore, T. A.; Gust, D.; Nagahara, L. A.; Lindsay, S. M. Journal of Physical Chemistry B 2002, 106, 8609.
155. Cui, X. D.; Zarate, X.; Tomfohr, J.; Sankey, O. F.; Primak, A.; Moore, A. L.; Moore, T. A.; Gust, D.; Harris, G.; Lindsay, S. M. Nanotechnology 2002, 13, 5.
156. Selzer, Y.; Salomon, A.; Cahen, D. Journal of the American Chemical Society 2002, 124, 2886.
157. Tran, E.; Rampi, M. A.; Whitesides, G. M. Angewandte Chemie 2004, 43, 3835.
158. Jiang, W.; Garfunkel, E.; Zhitenev, N.; Abusch-Magder, D.; Tennant, D.; Bao, Z. Applied Physics Letters 2006, 89, 113107/1.
159. Morita, T.; Lindsay, S. Journal of the American Chemical Society 2007, 129, 7262.
160. Levlin, M.; Niemi, H. E. M.; Hautojarvi, P.; Ikavalko, E. Fresenius' Journal of Analytical Chemistry 1996, 355, 2.
161. Butler, M. A.; Ricco, A. J.; Baughman, R. J. Journal of Applied Physics 1990, 67, 4320.
162. Thome, J.; Himmelhaus, M.; Zharnikov, M.; Grunze, M. Langmuir 1998, 14, 7435.
163. See http://www.rgmd.com/msds/msds.pdf for MSDS of galinstan; see http://www.espimetals.com/tech/Tech-%20Mercury.htm for MSDS of Hg.
164. Metzger, R. M.; Chen, B.; Hoepfner, U.; Lakshmikantham, M. V.; Vuillaume, D.; Kawai, T.; Wu, X.; Tachibana, H.; Hughes, T. V.; Sakurai, H.; Baldwin, J. W.; Hosch, C.; Cava, M. P.; Brehmer, L.; Ashwell, G. J. Journal of the American Chemical Society 1997, 119, 10455.
165. Magoga, M.; Joachim, C. Physical Review B 1999, 59, 16011.
166. Samanta, M. P.; Tian, W.; Datta, S.; Henderson, J. I.; Kubiak, C. P. Physical Review B 1996, 53, R7626.
195
167. See http://www.rgmd.com/msds/msds.pdf for MSDS of galinstan.
168. Beebe, J. M.; Kushmerick, J. G. Applied Physics Letters 2007, 90, 083117/1.
169. Richter, L. J.; Yang, C. S. C.; Wilson, P. T.; Hacker, C. A.; Van Zee, R. D.; Stapleton, J. J.; Allara, D. L.; Yao, Y.; Tour, J. M. Journal of Physical Chemistry B 2004, 108, 12547.
170. Jiang, C.-S.; Nakayama, T.; Aono, M. Applied Surface Science 1998, 130-132, 425.
171. Ruppalt, L. B.; Albrecht, P. M.; Lyding, J. W. Fourth IEEE Conference on Nanotechnology, Muenchen, Germany, Aug. 16-19 2004, 7.
172. Whalley, A. C.; Steigerwald, M. L.; Guo, X.; Nuckolls, C. Journal of the American Chemical Society 2007, 129, 12590.

196
Vita
Dmitri Alexandrovich Kraptchetov was born on February 10, 1982, in Azov,
Russia, the son of Svetlana Stepanovna Krapchetova and Alexander Vasilyevich
Krapchetov. He graduated from Kamensk High School in 1998 in Kamensk, Russia and
spent an additional year as an exchange student in Clear Lake High School in Houston,
the United States. In 1999, he entered Blinn Community College in Bryan, TX, from
where he transferred to Texas A&M University in College Station, TX in 2000. Dmitri
earned his Bachelor of Science degree in Chemical Engineering from Texas A&M
University in 2003. Immediately after the completion of his studies at Texas A&M
University, he entered the Ph.D. program in Chemical Engineering at the University of
Texas at Austin under the supervision of Professor Yueh-Lin Loo. Upon completion of
his doctorate degree, Dmitri will begin work with Rohm and Haas Company in Spring
House, PA.
Permanent address: Rostov Region, 78756 Kamensk-Shahtinski, Voroshilova 5-A, 24
This dissertation was typed by Dmitri A. Kraptchetov.