Copyright © 2011 Nelson Education Limited Finance for Non-Financial Managers, 6 th edition...
26
Copyright © 2011 Nelson Education Limited Finance for Non-Financial Managers, 6 th edition PowerPoint Slides to accompany Prepared by Pierre Bergeron, University of Ottawa
-
date post
21-Dec-2015 -
Category
Documents
-
view
223 -
download
0
Transcript of Copyright © 2011 Nelson Education Limited Finance for Non-Financial Managers, 6 th edition...
Copyright © 2011 Nelson Education Limited
Finance for Non-Financial Managers, 6th edition
PowerPoint Slidesto accompany
Prepared by Pierre Bergeron, University of Ottawa
Copyright © 2011 Nelson Education Limited
Finance for Non-Financial Managers, 6th edition
CHAPTER 12
BUSINESS VALUATION
Copyright © 2011 Nelson Education Limited
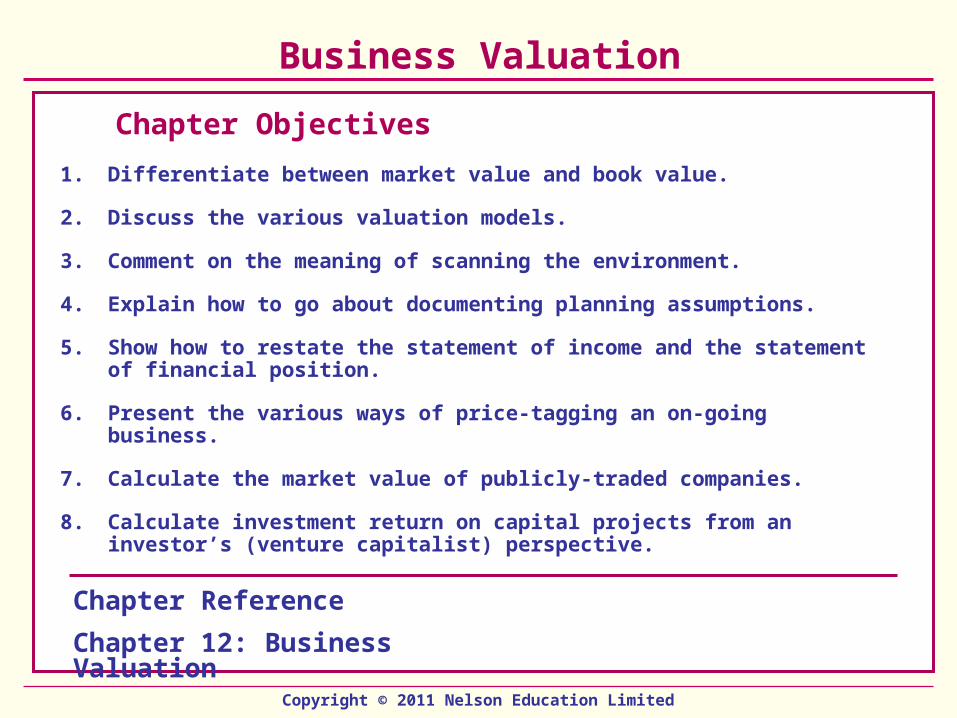
Business Valuation
Chapter Objectives
1. Differentiate between market value and book value.
2. Discuss the various valuation models.
3. Comment on the meaning of scanning the environment.
4. Explain how to go about documenting planning assumptions.
5. Show how to restate the statement of income and the statement of financial position.
6. Present the various ways of price-tagging an on-going business.
7. Calculate the market value of publicly-traded companies.
8. Calculate investment return on capital projects from an investor’s (venture capitalist) perspective.
Chapter Reference
Chapter 12: Business Valuation
Copyright © 2011 Nelson Education Limited
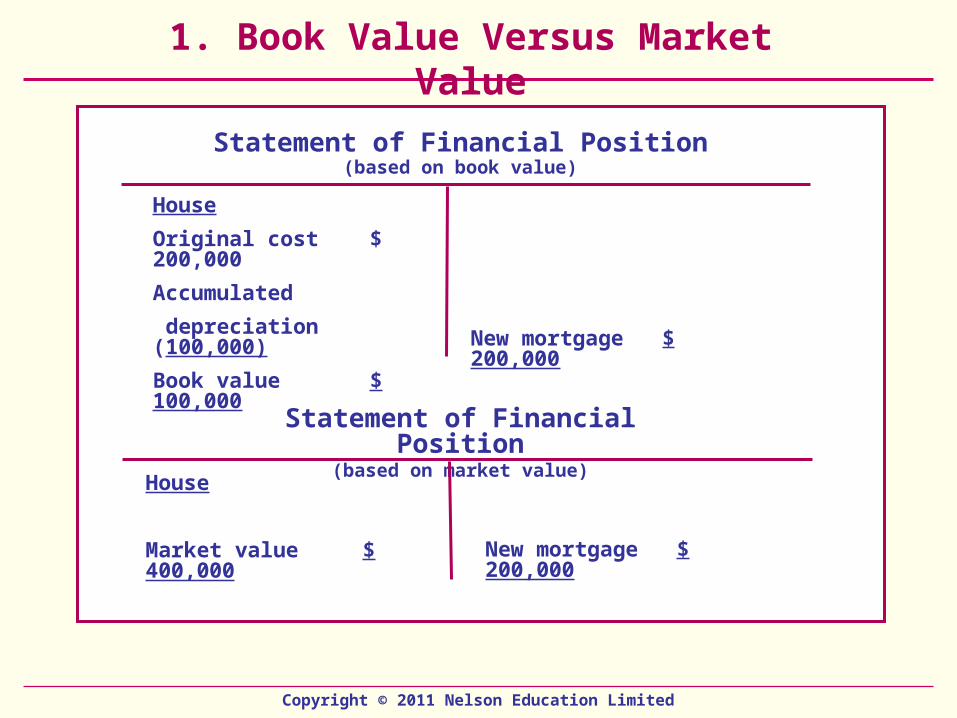
1. Book Value Versus Market Value
Statement of Financial Position(based on book value)
Statement of Financial Position(based on market value)
House
Original cost $ 200,000
Accumulated
depreciation (100,000)
Book value $ 100,000 New mortgage $ 200,000
House
Market value $ 400,000 New mortgage $ 200,000
Copyright © 2011 Nelson Education Limited
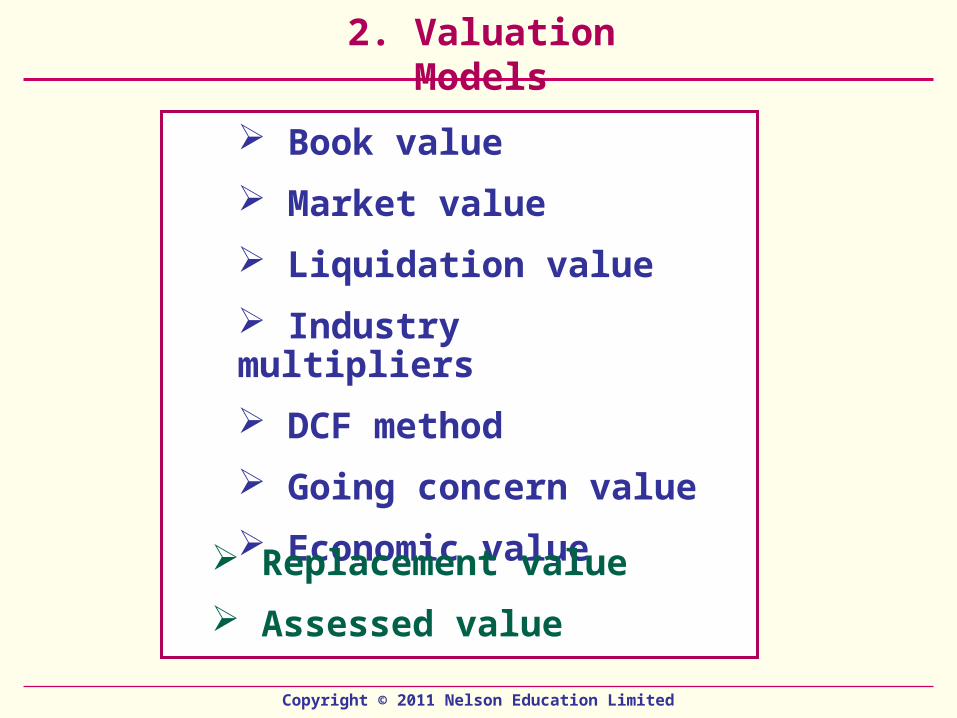
2. Valuation Models
Book value
Market value
Liquidation value
Industry multipliers
DCF method
Going concern value
Economic value Replacement value
Assessed value
Copyright © 2011 Nelson Education Limited
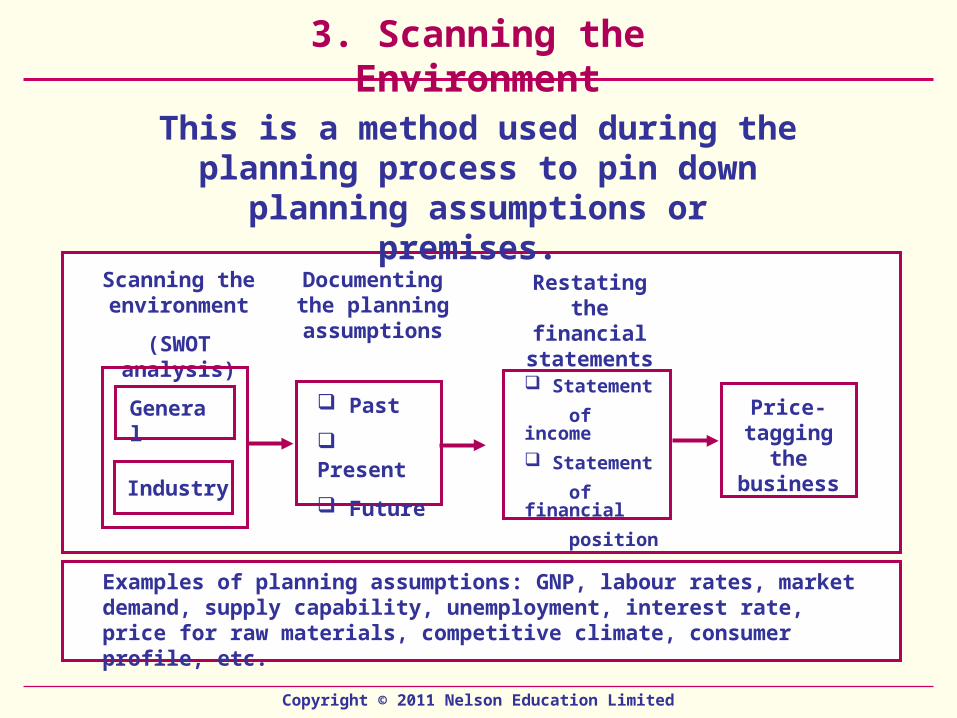
3. Scanning the Environment
This is a method used during the planning process to pin down planning
assumptions or premises.
General Past
Present
Future
Statement
of income
Statement
of financial
position
Scanning the environment
(SWOT analysis)
Documenting the planning assumptions
Restating the financial
statements
Industry
Examples of planning assumptions: GNP, labour rates, market demand, supply capability, unemployment, interest rate, price for raw materials, competitive climate, consumer profile, etc.
Price-tagging the business

Copyright © 2011 Nelson Education Limited
4. Documenting Planning AssumptionsPlanning assumptions are used to prepare a company’s projected financial statements. The following are typical planning assumptions related to the statement of income.
Revenue: size of market, profile of key competitors, consumer preferences, selling price, existing products/services
Cost of sales: key suppliers, location of suppliers, cost of raw materials, labour rates, freight costs, distribution network, competencies or skills required in manufacturing
Distribution costs: profile of typical sales representative, compensation package, competencies or skills needed, advertising costs, promotional programs, training and development, management fees, insurance premiums
Administrative expenses: number of people and composition of people working in overhead units, compensation package, leasing costs, composition of non-current assets, management fees
Other charges: interests, downsizing costs, fluctuation of Canadian dollar

Copyright © 2011 Nelson Education Limited
Documenting Planning Assumptions (continued)
The following are typical planning assumptions related to the statement of financial position.
Non-current assets: assets to be purchased, composition of non-current assets, amount to be invested in new assets, modernization, expansion, assets to be sold, depreciation and CCA rates for different non-current assets
Current assets: cash required in the bank to meet on-going activities, composition of the prepaid expenses, aging of the trade receivables, estimated bad debts, inventories in raw materials, work-in-process and finished goods, holding costs, ordering costs
Equity: number of shares outstanding, dividend policy
Long-term borrowings: amount outstanding, cost of debt, nature of agreements
Current liabilities: payment policies, terms required by suppliers, amount outstanding and interest rates, nature of accruals
Copyright © 2011 Nelson Education Limited
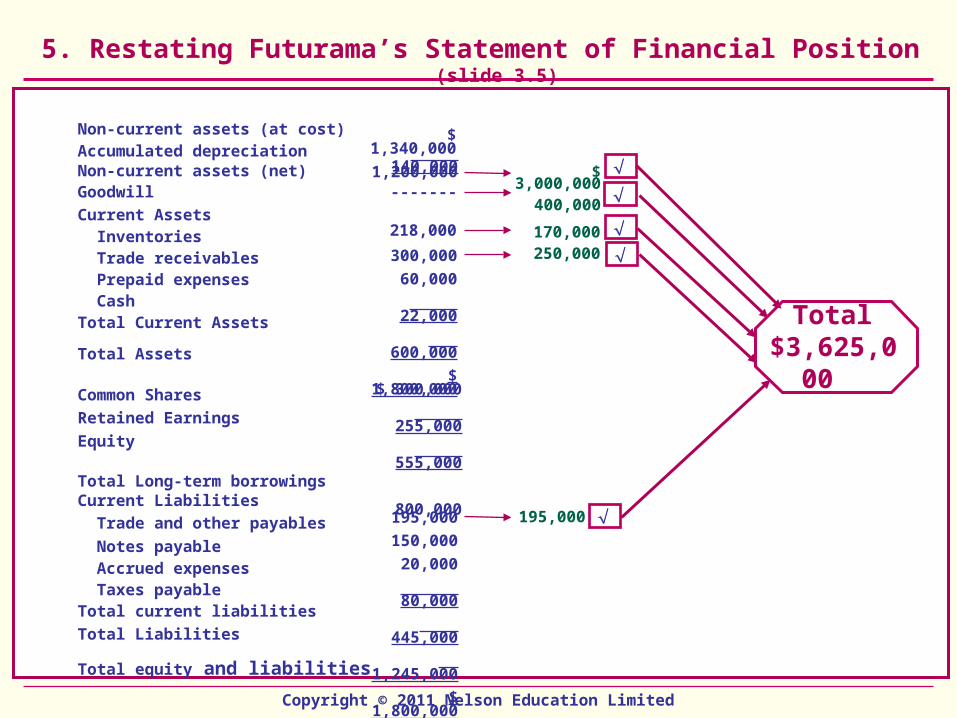
5. Restating Futurama’s Statement of Financial Position (slide 3.5)
Non-current assets (at cost)Accumulated depreciationNon-current assets (net)Goodwill
Current Assets Inventories Trade receivables Prepaid expenses CashTotal Current Assets
Total Assets
Common Shares
Retained Earnings
Equity
Total Long-term borrowingsCurrent Liabilities
Trade and other payables
Notes payable Accrued expenses Taxes payableTotal current liabilities
Total Liabilities
Total equity and liabilities
$ 3,000,000400,000
170,000250,000
195,000
$ 1,340,000 140,000 1,200,000
-------
218,000
300,000
60,000
22,000
600,000
$ 1,800,000
$ 300,000
255,000
555,000
800,000
195,000
150,000
20,000
80,000
445,000
1,245,000
$ 1,800,000
Total $3,625,000

Copyright © 2011 Nelson Education Limited
Restating Futurama’s Income Statement (slide 3.6)
Revenue $ 2,500,000
Cost of sales (1,900,000)
Gross profit 600,000
Salaries (300,000)
Rent (50,000)
Depreciation (40,000)
Other expenses (15,000)
Total expenses 405,000
Profit before taxes 195,000
Income tax expense (97,500)
Profit for the year 97,500
Add back depreciation 40,000
Total cash flow $ 137,000
$ 4,000,000
$ 369,000
$ 150,000
$ 519,000

Copyright © 2011 Nelson Education Limited
6. Book Value Method Futurama Ltd. (slide 3.5)
Book Value
Assets
Non-current assets $ 1,200,000
Inventories 218,000
Trade receivables 300,000
Prepaid expenses 60,000
Cash 22,000
Total assets $ 1,800,000
Equity
Liabilities
Trade and other payables 195,000
Misc. loans 1,050,000
Total Liabilities 1,245,000
Total equity and _________
liabilities $ 1,800,000
Difference between assets and liabilities
Book value
$ 555,000
Copyright © 2011 Nelson Education Limited
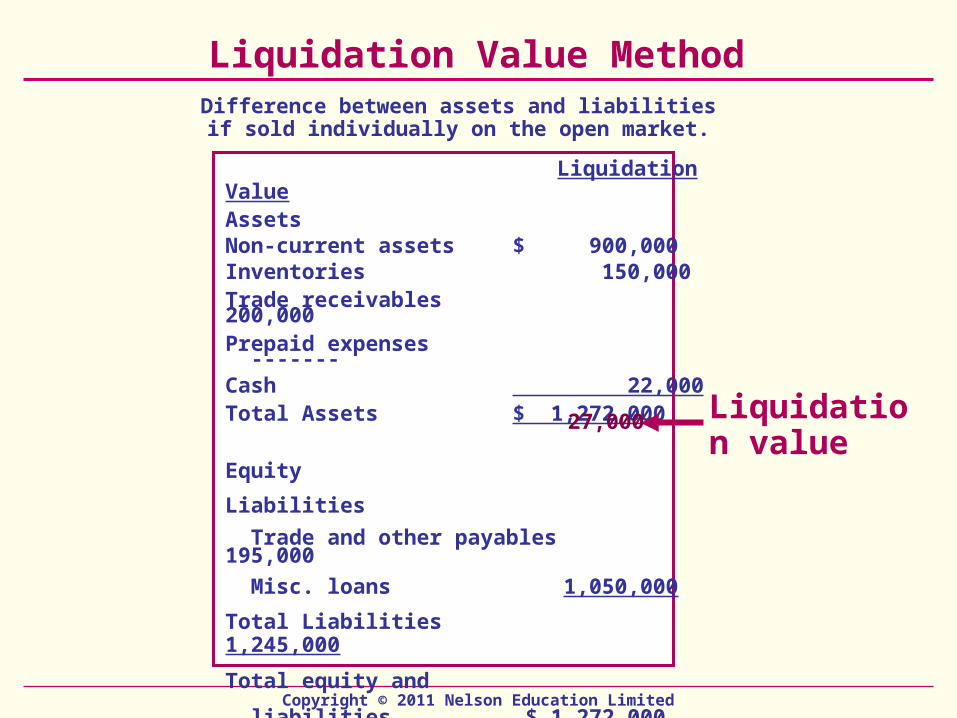
Liquidation Value Method
Liquidation ValueAssetsNon-current assets $ 900,000Inventories 150,000Trade receivables 200,000Prepaid expenses -------Cash 22,000Total Assets $ 1,272,000
Equity
Liabilities
Trade and other payables 195,000
Misc. loans 1,050,000
Total Liabilities 1,245,000
Total equity and
liabilities $ 1,272,000
Difference between assets and liabilities if sold individually on the open market.
Liquidation value
27,000
Copyright © 2011 Nelson Education Limited
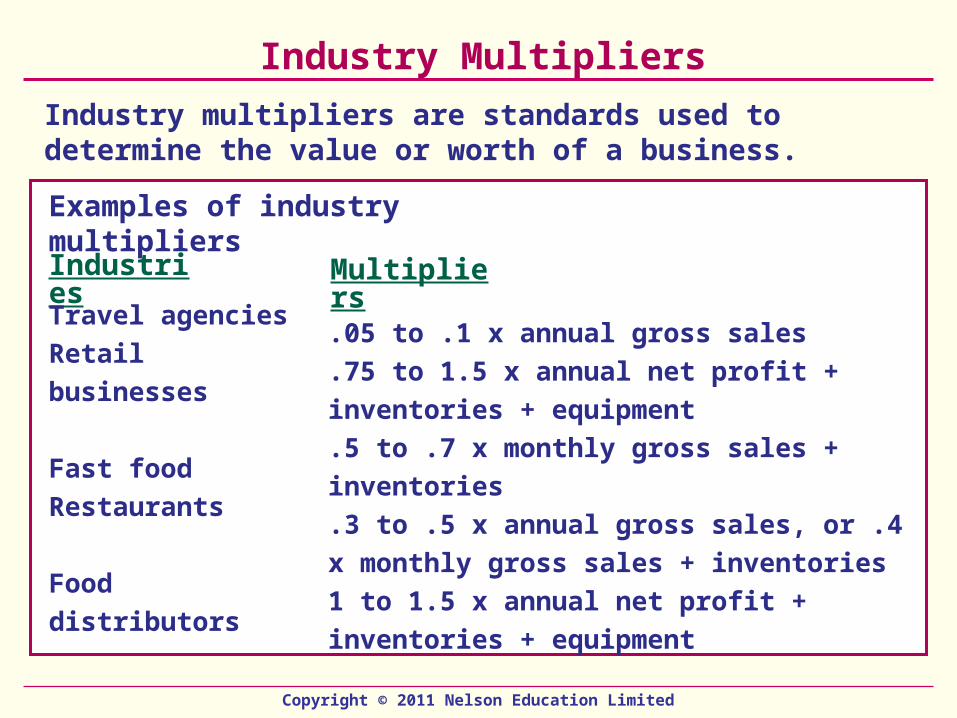
Industry Multipliers
Industry multipliers are standards used to determine the value or worth of a business.
Examples of industry multipliers
MultipliersIndustries
Travel agencies
Retail businesses
Fast food
Restaurants
Food distributors
.05 to .1 x annual gross sales
.75 to 1.5 x annual net profit + inventories +
equipment
.5 to .7 x monthly gross sales + inventories
.3 to .5 x annual gross sales, or .4 x monthly
gross sales + inventories
1 to 1.5 x annual net profit + inventories +
equipment
Copyright © 2011 Nelson Education Limited
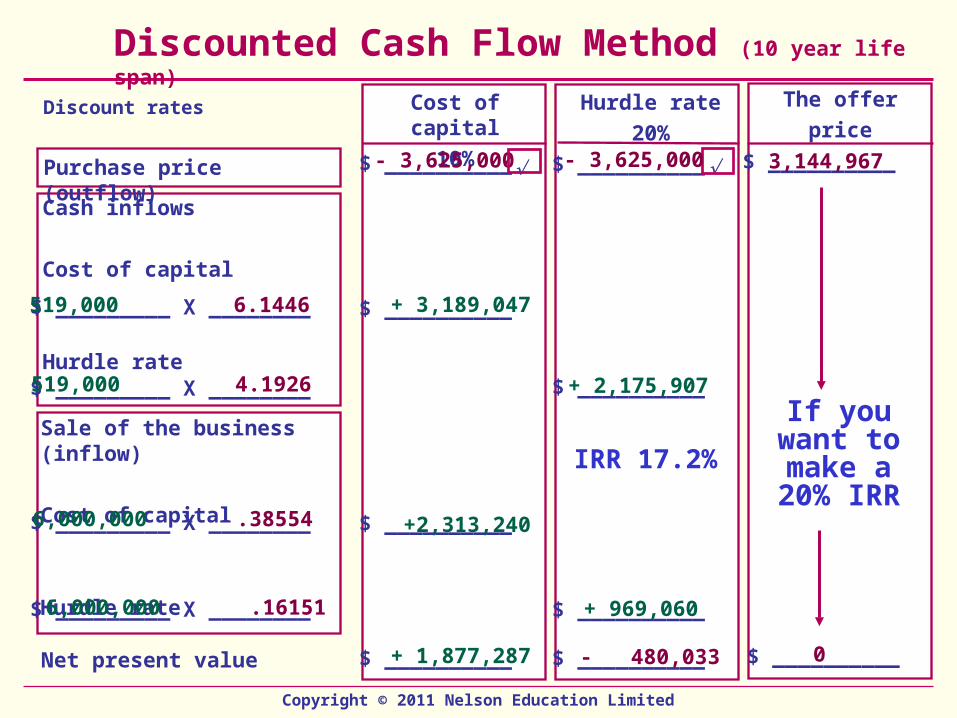
Discounted Cash Flow Method (10 year life span)
Discount rates Cost of capital
10%
Purchase price (outflow)
Cash inflows
Cost of capital
Hurdle rate
Net present value
Sale of the business (inflow)
Cost of capital
Hurdle rate
Hurdle rate
20%
The offer
price
$ __________
$ __________
$ __________
$ __________
$ __________
$ __________
$ __________
$ _________ X ________
$ _________ X ________
$ _________ X ________
$ _________ X ________
$ __________
- 3,625,000
519,000 6.1446 + 3,189,047
519,000 4.1926 + 2,175,907
6,000,000 .38554 +2,313,240
+ 969,0606,000,000 .16151
+ 1,877,287 - 480,033
IRR 17.2%
$ __________
- 3,625,000 $ __________3,144,967
0
If you want to make a
20% IRR

Copyright © 2011 Nelson Education Limited
Going Concern Value (using the capitalization rate)
Capitalization Value
Cash flow from operations $ 519,000
(from transparency 12.8)
Divided by capitalization rate* ÷ 20%
Going concern value (present value) $2,595,000
*Capitalization rate represents the required rate of return for the company which is based on a number of subjective factors and conditions at the time of the valuation.
Company will be sold as a viable business generating a cash flow of say $519,000/year forever.
Going concern value
Copyright © 2011 Nelson Education Limited
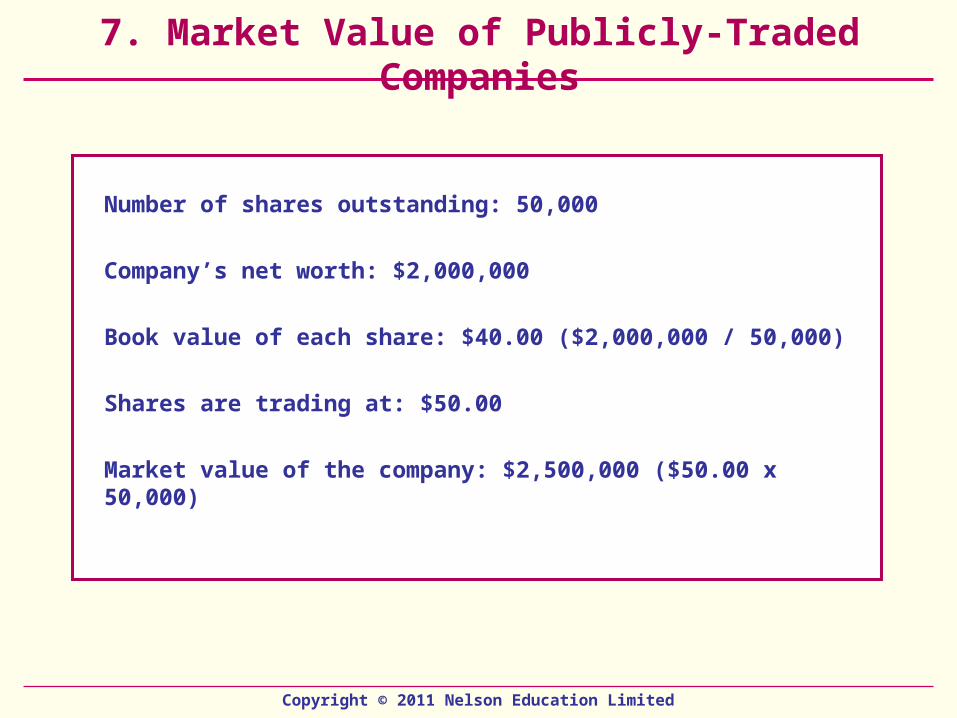
7. Market Value of Publicly-Traded Companies
Number of shares outstanding: 50,000
Company’s net worth: $2,000,000
Book value of each share: $40.00 ($2,000,000 / 50,000)
Shares are trading at: $50.00
Market value of the company: $2,500,000 ($50.00 x 50,000)

Copyright © 2011 Nelson Education Limited
8. Projects From an Investor’s Perspective
Step 1: Cash flow forecast
Step 2: Residual value of the forecast period
Step 3: Estimated market value
Step 4: Investor’s return (40% investment in the business)a) Before taxb) After tax
Copyright © 2011 Nelson Education Limited
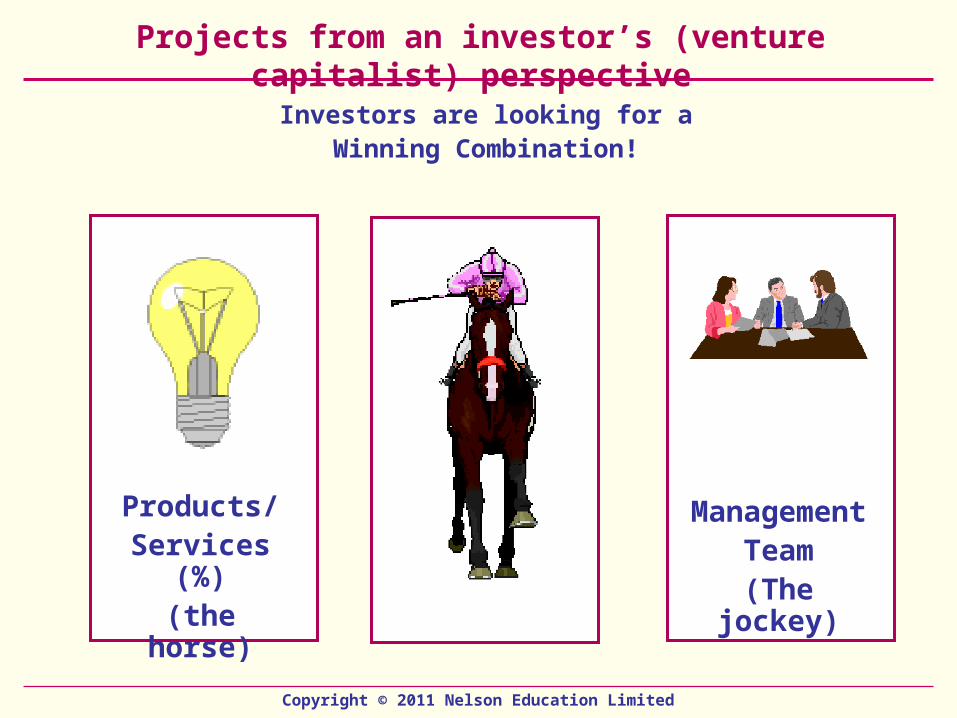
Projects from an investor’s (venture capitalist) perspective
Investors are looking for a Winning Combination!
Products/Services (%)(the horse)
Management Team
(The jockey)

Copyright © 2011 Nelson Education Limited
The Rich-Gumpert Evaluation System
1/1
2/1 2/2
1/2
3/1 3/2 3/3
2/3
1/3
4/1 4/2 4/3 4/4
3/4
2/4
1/4
Level 1A single would-be
founder/Entrepreneur.
Management Status
MOST
DESIRABLE
MOST DESIRABLE
PRODUCT/SERVICE
STATUS
Level 2Two founders, additional slots
but personnel not identified.
Level 3Partly staffed team, absent members
but will join when firm is funded.
Level 4Fully staffed by
experienced management
team.
Level 4Product/servicefully developed.
Many satisfied users.Market established.
Level 2Product/service
pilot operative. Notyet developed for
production.Market assumed.
Level 3Product/servicefully developed.
Few or no users as yet.Market assumed.
Level 1Product/service
idea and notyet operable.
Market assumed.
Source: Business Plans that Wins $$$, Stanley R. Rich and David E. Gumpert, Harpor & Row, 1986, p. 169.
Ready for an IPO
Copyright © 2011 Nelson Education Limited
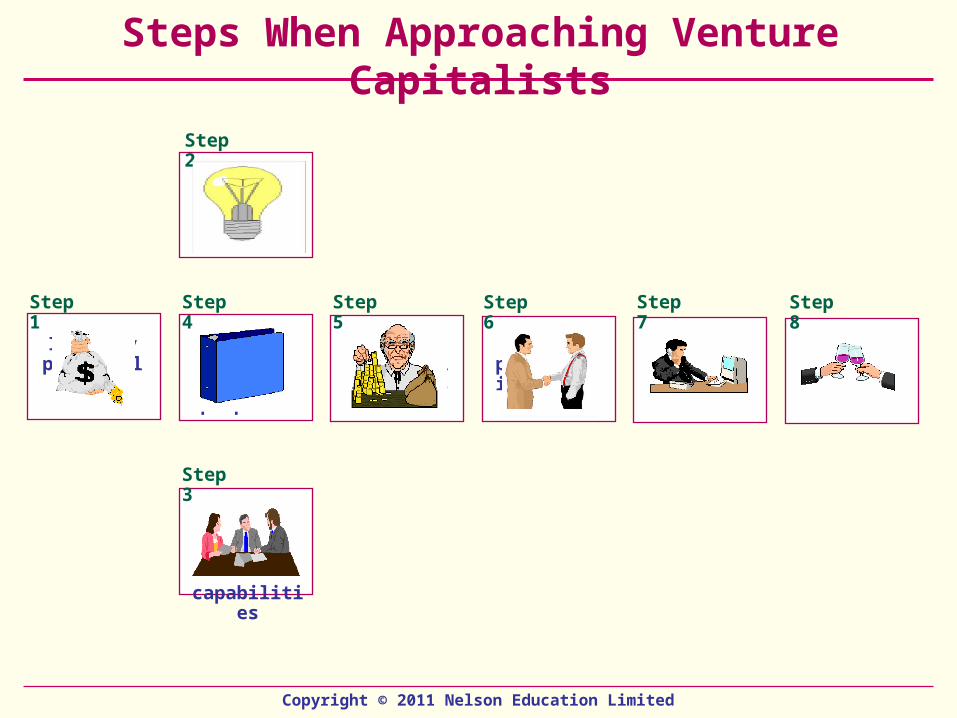
Steps When Approaching Venture Capitalists
Demonstrate investment
potential
Demonstrate management
team capabilities
Identify potential
needs
Write investment proposal
Meet potential investors
Negotiate the deal
Close the deal
Identify potential investors
Step 1 Step 6 Step 7Step 5Step 4
Step 3
Step 2
Step 8
Copyright © 2011 Nelson Education Limited
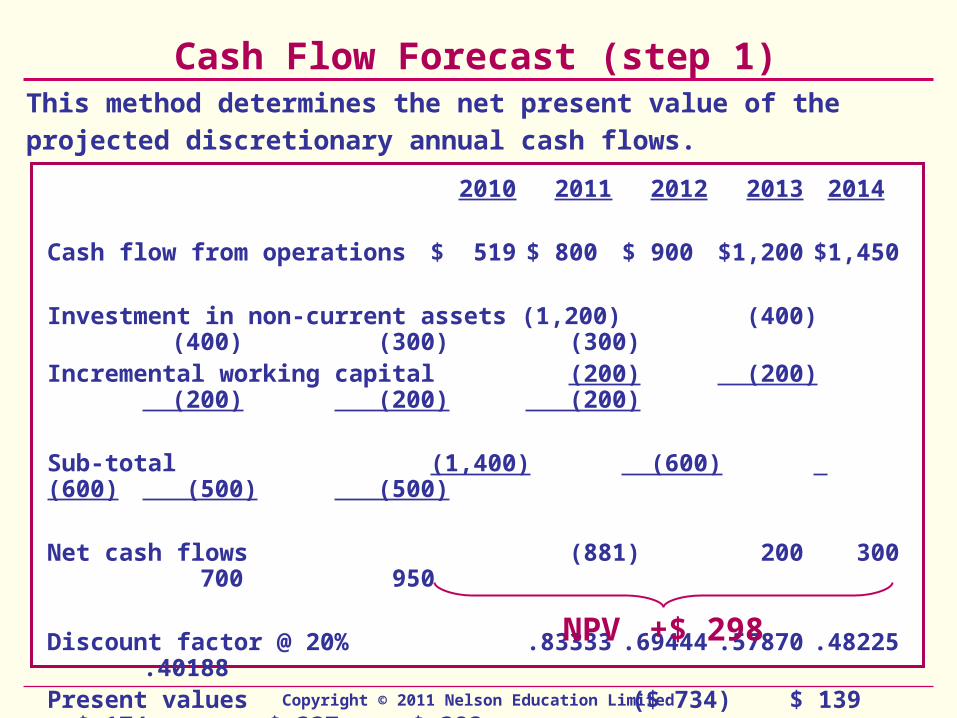
2010 2011 2012 2013 2014
Cash flow from operations $ 519 $ 800 $ 900 $1,200 $1,450
Investment in non-current assets (1,200) (400) (400) (300) (300)Incremental working capital (200) (200) (200) (200) (200)
Sub-total (1,400) (600) (600) (500) (500)
Net cash flows (881) 200 300 700 950
Discount factor @ 20% .83333 .69444 .57870 .48225 .40188Present values ($ 734) $ 139 $ 174 $ 337 $ 382
Cash Flow Forecast (step 1)This method determines the net present value of the projected
discretionary annual cash flows.
NPV +$ 298
Copyright © 2011 Nelson Education Limited
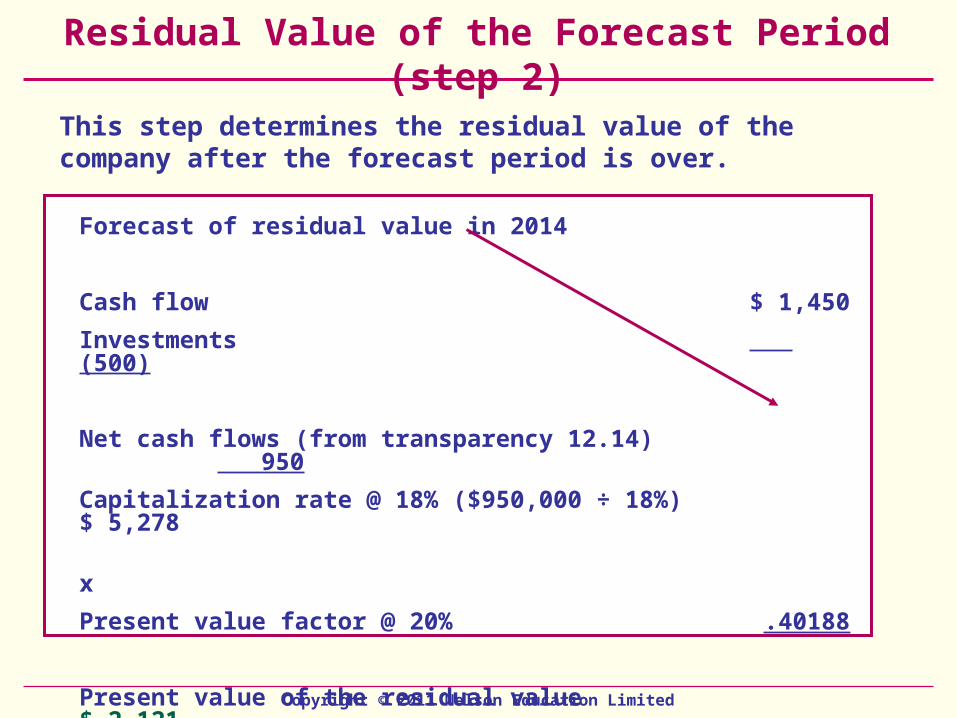
Residual Value of the Forecast Period (step 2)
Forecast of residual value in 2014
Cash flow $ 1,450
Investments (500)
Net cash flows (from transparency 12.14) 950
Capitalization rate @ 18% ($950,000 ÷ 18%) $ 5,278
x
Present value factor @ 20% .40188
Present value of the residual value $ 2,121
This step determines the residual value of the company after the forecast period is over.

Copyright © 2011 Nelson Education Limited
Estimated Market Value (step 3)
Forecast of discretionary cash flow $ 298 (from transp. 12.19)
Add: residual value 2,121 (from transp. 12.20)
Estimated fair market $ 2,419
value of the shares
This step determines the residual value of the company after the forecast period is over.
Estimated fair market
value

Copyright © 2011 Nelson Education Limited
2009 2010 2011 2012 2013 2014
A. Investment return before taxes --- --- --- ---
Initial investment ($ 600) --- --- --- ---
Cash distribution to investors (transparency 12.19) $ 950 Multiplier 8.0 Total value at exit 7,600
Investor’s required share (40%) --- --- --- 3,040 Initial investment ($ 600) Total discounted cash inflow $ 600 $ 3,040
Investor’s Return - Before Tax (step 4)This method takes into account the discounted value of the future cash flows to calculate the investor’s return.
Before-tax return to investor 38.34%

Copyright © 2011 Nelson Education Limited
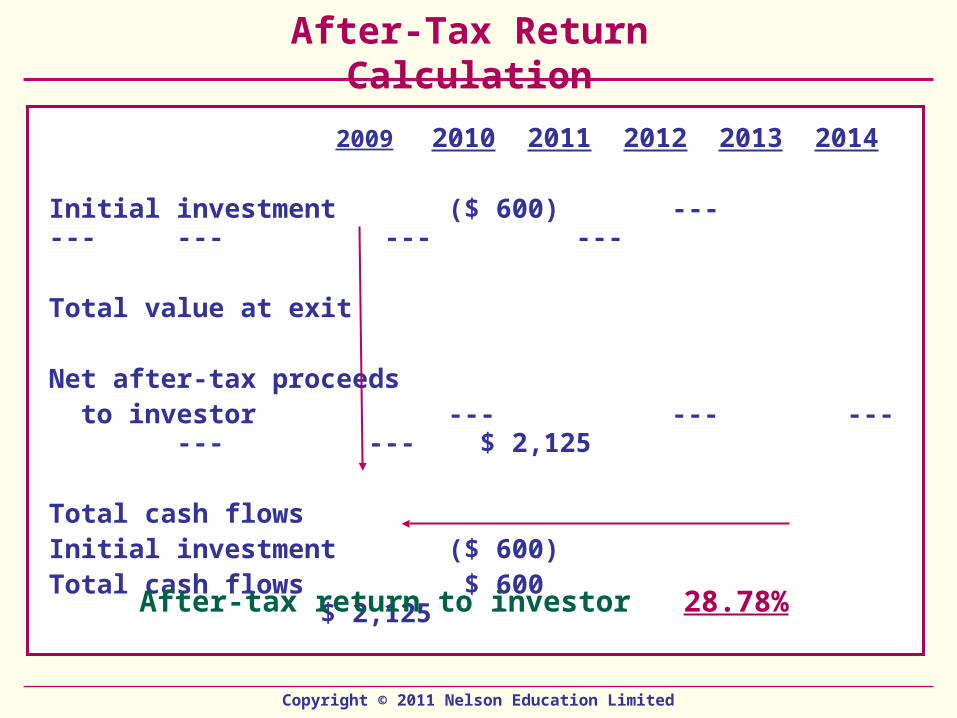
B. After-tax return Proceeds received on exit $3,040 Initial investment (600) Capital gain on investment 2,440
Taxable portion (75%) 1,830 Investor’s tax payable (50%) 915
Gross proceeds received on exit 3,040 Investor’s tax payable 915
Net after-tax proceeds to investor $ 2,125
Investor’s Return - After Tax
Copyright © 2011 Nelson Education Limited
2009 2010 2011 2012 2013 2014
Initial investment ($ 600) --- --- --- --- ---
Total value at exit
Net after-tax proceeds to investor --- --- --- --- --- $ 2,125
Total cash flowsInitial investment ($ 600)Total cash flows $ 600 $ 2,125
After-Tax Return Calculation
After-tax return to investor 28.78%