Copyright © 2002 by Thomson Learning, Inc. Chapter 12 Budget Balance and Government Debt Copyright...
39
Copyright © 2002 by Thomson Learning, Inc. Chapter 12 Budget Balance and Government Debt Copyright © 2002 Thomson Learning, Inc. Thomson Learning™ is a trademark used herein under license. ALL RIGHTS RESERVED. Instructors of classes adopting PUBLIC FINANCE: A CONTEMPORARY APPLICATION OF THEORY TO POLICY, Seventh Edition by David N. Hyman as an assigned textbook may reproduce material from this publication for classroom use or in a secure electronic network environment that prevents downloading or reproducing the copyrighted material. Otherwise, no part of this work covered by the copyright hereon may be reproduced or used in any form or by any means—graphic, electronic, or mechanical, including, but not limited to, photocopying, recording, taping, Web distribution, information networks, or information storage and retrieval systems—without the written permission of the publisher. Printed in the United States of America ISBN 0-03-033652-X
-
date post
19-Dec-2015 -
Category
Documents
-
view
222 -
download
3
Transcript of Copyright © 2002 by Thomson Learning, Inc. Chapter 12 Budget Balance and Government Debt Copyright...

Copyright © 2002 by Thomson Learning, Inc.
Chapter 12
Budget Balance and Government Debt
Copyright © 2002 Thomson Learning, Inc. Thomson Learning™ is a trademark used herein under license.
ALL RIGHTS RESERVED. Instructors of classes adopting PUBLIC FINANCE: A CONTEMPORARY APPLICATION OF THEORY TO POLICY, Seventh Edition by David N. Hyman as an assigned textbook may reproduce material from this publication for classroom
use or in a secure electronic network environment that prevents downloading or reproducing the copyrighted material. Otherwise, no part of this work covered by the copyright hereon may be reproduced or used in any form or by any means—graphic, electronic, or mechanical, including, but not limited to, photocopying, recording, taping, Web distribution, information networks, or information storage and retrieval
systems—without the written permission of the publisher. Printed in the United States of America
ISBN 0-03-033652-X
Copyright © 2002 by Thomson Learning, Inc.
I- DefinitionsII- Economic EffectsIII- Public Debt

Copyright © 2002 by Thomson Learning, Inc.
Budget Terms
A Budget Surplus exists when Tax Revenues are greater than Expenditures and is the difference between the two.
A Budget Deficit exists when Expenditures are
greater than Tax Revenues and is the difference between the two.
The National Debt is the sum of deficits minus the
sum of all surpluses since 1776.

Copyright © 2002 by Thomson Learning, Inc.
Figure 12.1A Federal Budget Outlays, Receipts, Deficits, and Surpluses, 1950-1999
Bill
ion
s o
f D
olla
rs
Year
1,500 1,400 1,300 1,200
1,000
800
600
400
200
0
Outlays Receipts
Surplus
Deficit
1950 1955 1960 1965 1970 1975 1980 1985 1990
1,700 1,800
1,600
1995 1999
Deficit Surplus

Copyright © 2002 by Thomson Learning, Inc.
Déficit Public, Liban
0
2,000
4,000
6,000
8,000
10,000
12,000
1993
1995
1997
1999
2001
2003
2005
LB
P m
illi
ard
s
recettestotales
dépensestotales
Copyright © 2002 by Thomson Learning, Inc.
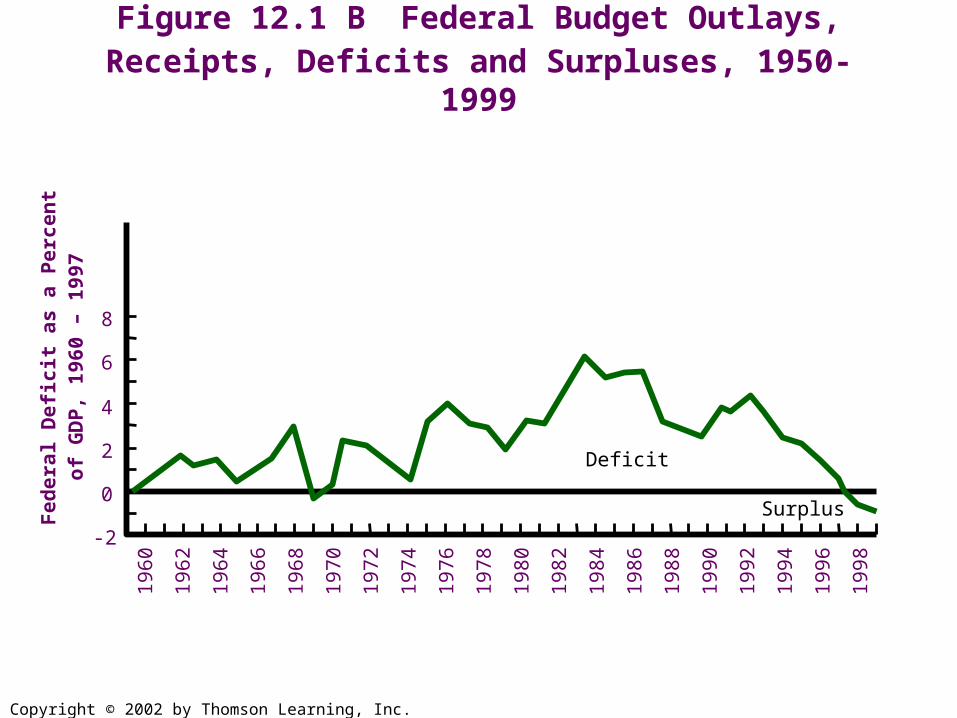
Figure 12.1 B Federal Budget Outlays, Receipts, Deficits and Surpluses, 1950-1999F
ed
era
l D
efi
cit
as
a P
erc
en
t o
f G
DP
, 1
96
0 –
19
97
8
6
4
2
0
-2
19
60
19
62
19
64
19
66
19
68
19
70
19
72
19
74
19
76
19
78
19
80
19
82
19
84
19
86
19
88
19
90
19
92
Surplus
Deficit
19
94
19
96
19
98

Copyright © 2002 by Thomson Learning, Inc.
Surpluses, Deficits and the Debt as a Percentage of GDP
Nominal figures are less important than their relationship to the size of the economy.
Economists tend to look at these figures as a percentage of GDP.

Copyright © 2002 by Thomson Learning, Inc.
Controversies Over What To Do With the Current Surpluses Options Pay off portions of the national debt Cut taxes Increase spending on programs Set surpluses aside to make Social
Security and Medicare more solvent
Copyright © 2002 by Thomson Learning, Inc.
High-Employment Deficit or Surplus
The budget balance is altered significantly by the state of the economy.
If GDP is rising quickly, then fewer people are drawing on the welfare state and more are paying taxes.
The high-employment deficit or surplus is what the surplus would be if unemployment were low.
Economists often prefer this measure to the actual level of the deficit or surplus when advocating policy.

Copyright © 2002 by Thomson Learning, Inc.
Measuring Budget Balance
On Budget vs Off Budget Social Security and the Post Office are run off
budget. Since 1982 Social Security has run a considerable
surplus. This money is loaned to the rest of the on budget
side of the government with the bonds issued to the Social Security Administration being the Social Security Trust Fund.

Copyright © 2002 by Thomson Learning, Inc.
Unified Budget
The Unified Budget is the sum of the on- and off-budget deficits and surpluses.
If this is a net deficit, then the government must borrow new money from the public.
If it is a net surplus, then it is a net provider of capital to the private sector.
Copyright © 2002 by Thomson Learning, Inc.
National Income and Product Accounts Budget
The NIPA Budget does not include any transactions that finance preexisting debts such as outlays for deposit insurance.

Copyright © 2002 by Thomson Learning, Inc.
Real Surpluses and Deficits
Real Surpluses and Real Deficits are expressed in inflation-adjusted terms.

Copyright © 2002 by Thomson Learning, Inc.
Economic Effects of Federal Budget Deficits
Unified budget deficits require additional borrowing.

Copyright © 2002 by Thomson Learning, Inc.
Figure 12.2 Government Demand for Loanable Funds and the Market Rate of Interest
Inte
res
t R
ate
Loanable Funds per Year 0 L1
E'
L2
i2
i1 E
S
D1 + DG
D1
Copyright © 2002 by Thomson Learning, Inc.
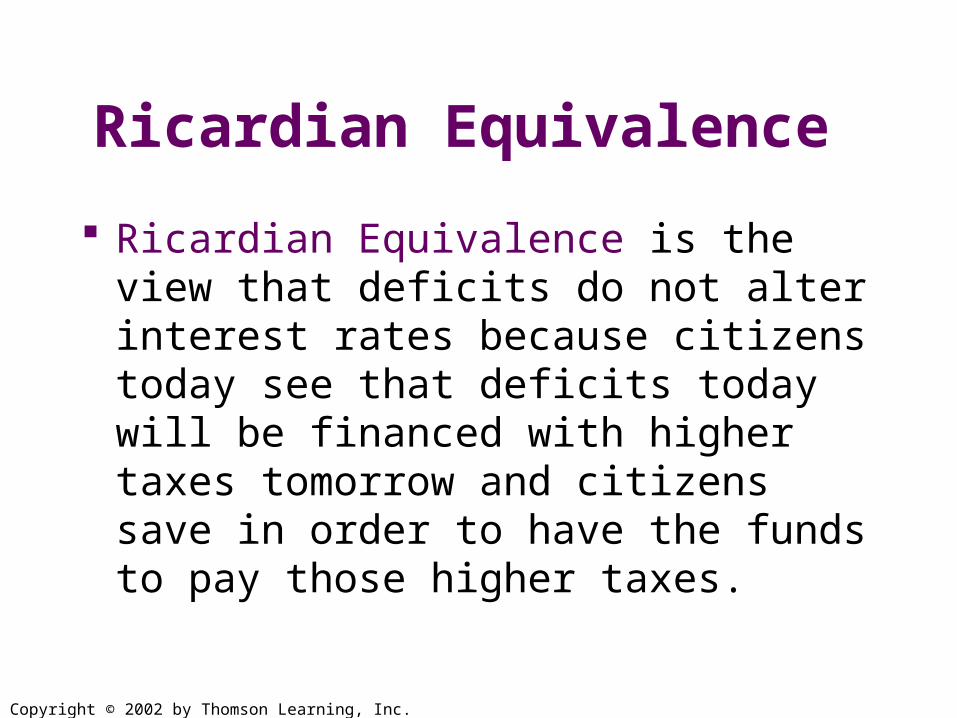
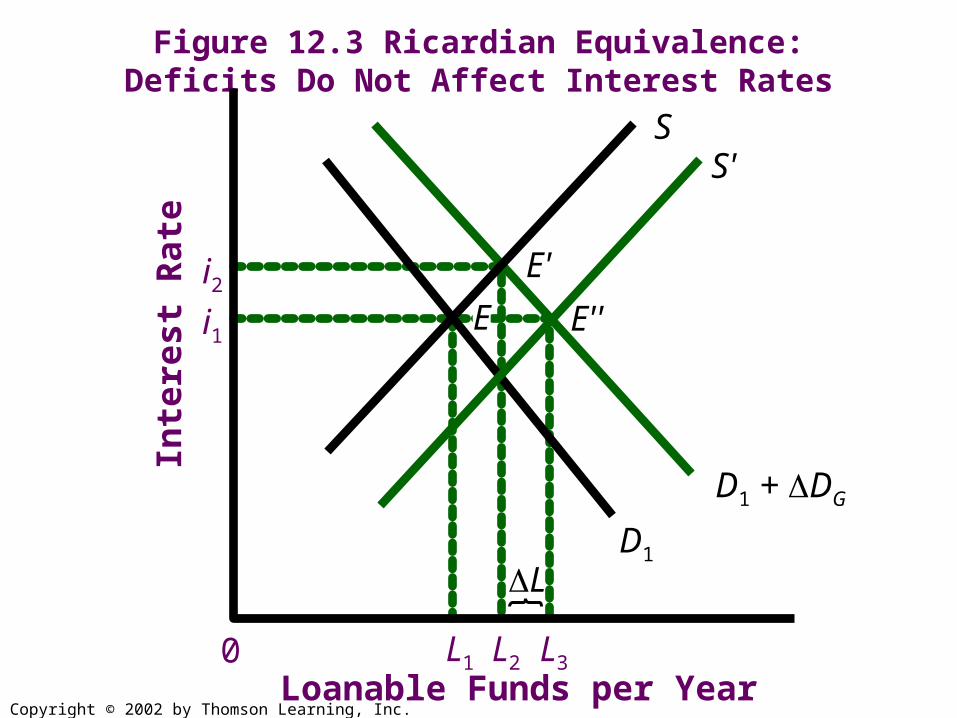
Ricardian Equivalence
Ricardian Equivalence is the view that deficits do not alter interest rates because citizens today see that deficits today will be financed with higher taxes tomorrow and citizens save in order to have the funds to pay those higher taxes.
Copyright © 2002 by Thomson Learning, Inc.
Figure 12.3 Ricardian Equivalence: Deficits Do Not Affect Interest Rates
Inte
res
t R
ate
0 L1
E'
L2 L3
E'' i2
i1
Loanable Funds per Year
L
D1 + DG
E
S
D1
S'

Copyright © 2002 by Thomson Learning, Inc.
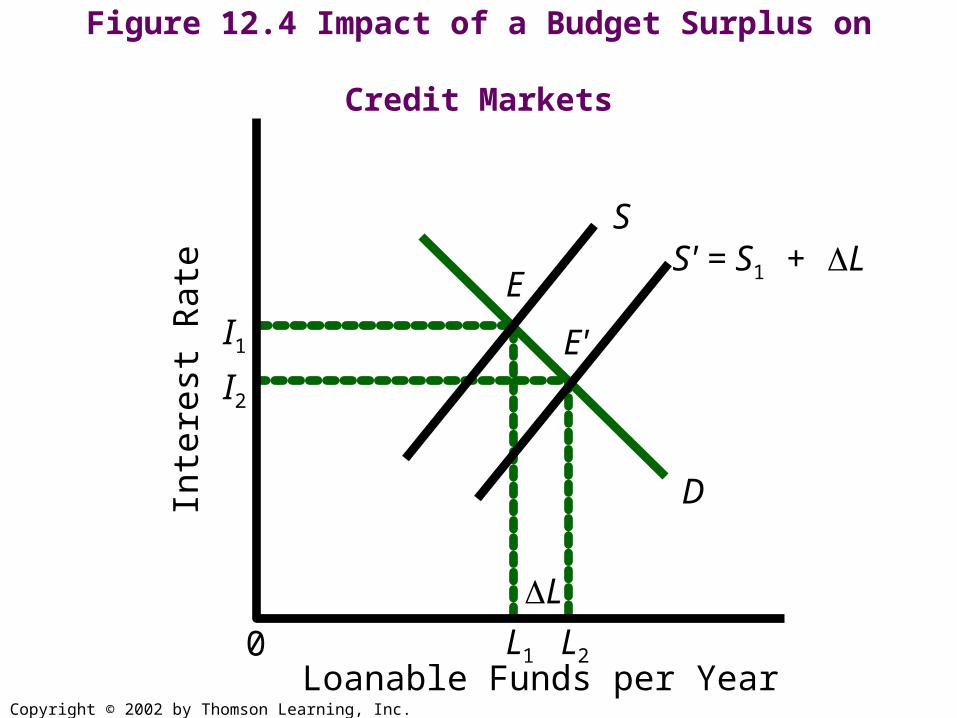
Economic Effects of Federal Budget Surpluses
Unified budget surpluses allow government to provide capital to the loanable funds market.
Copyright © 2002 by Thomson Learning, Inc.
Figure 12.4 Impact of a Budget Surplus on Credit Markets
Inte
rest
Ra
te
Loanable Funds per Year 0
L
D
E'
E I1
I2
L1 L2
S S' = S1 + L

Copyright © 2002 by Thomson Learning, Inc.
Budget Balance, National Saving, and Economic Growth
An increase in the deficit contributes to a decrease in national savings while an increase in a surplus contributes to a increase in national savings.
Increases in national savings increases the potential for the economy to grow.

Copyright © 2002 by Thomson Learning, Inc.
Figure 12.5 The National Savings Rate and its Components, 1959-1999 (Measured as a Ratio of
Savings to Gross National Product)*
59 5
0
5
10
15
20
Gross Saving
Corporate and Other Private Saving
Personal Saving
Gross Government Saving
25
Pe
rce
nt
61 63 65 67 69 71 73 75 77 79 81 83 85 87 89 91 93 95 97 99
Recession

Copyright © 2002 by Thomson Learning, Inc.
Incidence of Deficit Finance
Lower growth rates imply lower incomes for future generations.
If Ricardian Equivalence holds, then this is not the case.
Deficits may also change political equilibrium so that there are increases in government infrastructure that could lean to increased future growth.

Copyright © 2002 by Thomson Learning, Inc.
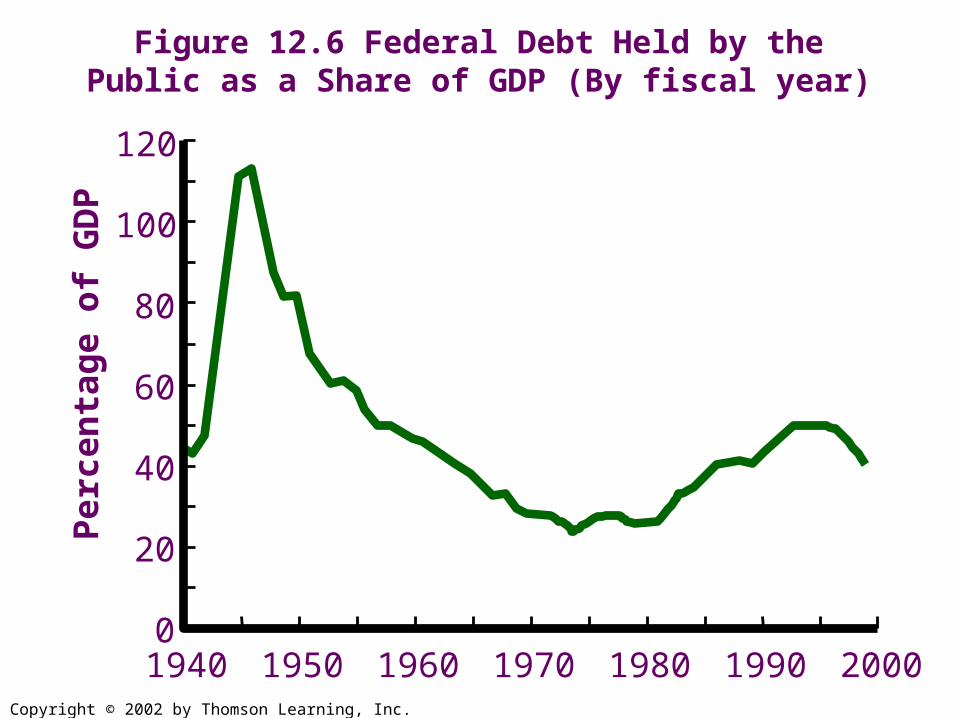
The Government Debt
Mid-2000 Federal Debt $5.66 trillion State and Local Debt $1 trillion
Copyright © 2002 by Thomson Learning, Inc.
Figure 12.6 Federal Debt Held by the Public as a Share of GDP (By fiscal year)
120
100
80
60
40
20
0 1940 1950
Pe
rce
nta
ge
of
GD
P
1960 1970 1980 1990 2000

Copyright © 2002 by Thomson Learning, Inc.
0%
20%
40%
60%
80%
100%
120%
140%
160%
180%
200%
1996 1997 1998 1999 2000 2001 2002 2003 2004
Gross Public Debt
Net Public Debt

Copyright © 2002 by Thomson Learning, Inc.
Net Federal Debt
The Net Federal Debt is the portion of the debt not held by the federal government.

Copyright © 2002 by Thomson Learning, Inc.
Gross public Debt of the US Treasury
by Holder July 31, 2000 Holder Amount of
Debt (Billions of Dollars)
Percent of Total
U.S. Govt. AgenciesTrust Funds and Federal Reserve
2,229.5 39.4
Private Investors 3,429.3 60.6
Total 5,658.8 100.0
Copyright © 2002 by Thomson Learning, Inc.
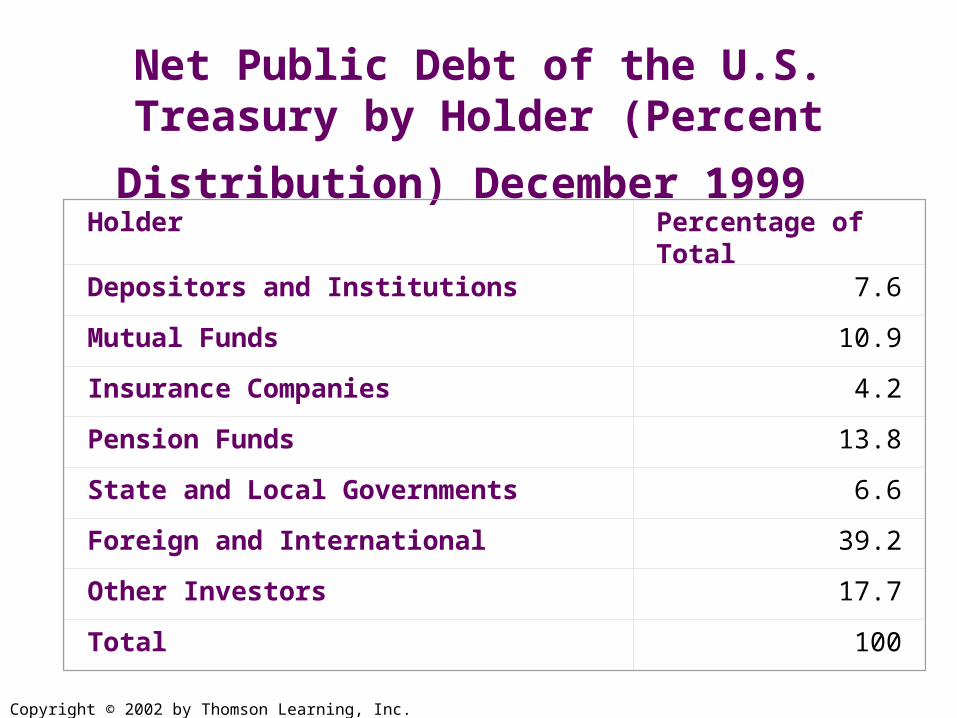
Net Public Debt of the U.S. Treasury by Holder (Percent Distribution) December
1999 Holder Percentage of
TotalDepositors and Institutions 7.6
Mutual Funds 10.9
Insurance Companies 4.2
Pension Funds 13.8
State and Local Governments 6.6
Foreign and International 39.2
Other Investors 17.7
Total 100

Copyright © 2002 by Thomson Learning, Inc.
Public Sector External Debt By Type of Creditor (1)(2)
(In millions of U.S Dollars)
1999 2000 2001 2002 2003
BILATERAL 476 454 446 465 1,124
MULTILATERAL 768 880 951 1,053 1,217
COMMERCIAL BANKS 487 398 357 289 225
EUROBONDS 3,685 5,260 7,613 12,512 12,790
TOTAL 5,416 6,992 9,367 14,319 15,356

Copyright © 2002 by Thomson Learning, Inc.
Internal and External Debt
The Internal Debt is the portion of the debt owed to our own citizens.
The External Debt is the portion of the debt owed to people other than U.S. citizens.

Copyright © 2002 by Thomson Learning, Inc.
LBP billions 2001 2002 2003 2004 Mars, 05
Eurobonds 11,788 19,222 19,566 23,682 23,687
Loans. 2,643 2,752 3,876 3,995 3,921
Paris II related concessional loans
0 0 942 1,026 977
Bilateral and multilateral loans
2,105 2,316 2,595 2,700 2,677
Foreign private sector loans
539 436 338 270 267
Total Foreign Debt 14,431 21,974 23,442 27,677 27,608
Dette externe, Liban

Copyright © 2002 by Thomson Learning, Inc.
Dette interne, Liban
LBPBillions
2001 2002 2003 2004March,
2005
Total Domestic
Debt28,214 25,302 26,843 26,371 25,912
Long term bonds
24,069 22,268 24,691 20,766 18,837
Short term bills
3,974 2,866 1,799 5,102 6,574
Other domestic
debt172 169 353 504 502

Copyright © 2002 by Thomson Learning, Inc.
State and Local Borrowing
Bonds are issued by state and local governments to fund large projects.
They are rated by financial companies for their riskiness.
Similar to federal debt, much of it is held externally.

Copyright © 2002 by Thomson Learning, Inc.
General Obligation vs Revenue Bonds
General Obligation Bonds are backed by the state or local government’s ability to tax.
Revenue Bonds are backed by the revenue that a state or local enterprise would generate.
Copyright © 2002 by Thomson Learning, Inc.
Social Security and the Deficit
Social Security Surpluses are used to purchase federal government debt.
This will happen until benefits exceed revenues (estimated to be 2023).
Thereafter it will run deficits and will be forced to sell off those bonds.
Whether Social Security is on- or off-budget and whether or not there is a trust fund has no effect on the net national debt.

Copyright © 2002 by Thomson Learning, Inc.
Burden of the Debt
Impact on future generations: People have to pay increased taxes to pay interest
on that debt. Some may inherit the original bonds. Growth rates are reduced because of higher
interest rates. These impacts can be offset by the increased
private savings of the generation that does the borrowing, or by returns that come from programs that were funded by the borrowing.

Copyright © 2002 by Thomson Learning, Inc.
European Union
Entry into the EU required that members have inflation rates no more than 1.5 percentage point
more than that of the three lowest inflation countries.
interest rates on government debt be no more than 3 points higher than that of the three lowest interest countries.
government deficit as a percentage of GDP be no greater than 3% and debt no more than 60% of GDP.

Copyright © 2002 by Thomson Learning, Inc.
EU Deficit and Debt FiguresNation Surplus/Deficit as a
percentage of GDP 1998
Debt as a percentage of GDP 1998
Belgium –0.9 118.2
Germany –2.0 61.1
France –2.9 58.8
Italy –2.7 118.7
Sweden 1.9 74.2
United Kingdom 0.5 48.7

Copyright © 2002 by Thomson Learning, Inc.
What Should be Done With Surpluses?
Social Security and Medicare solvency Tax Cuts Other Spending Programs Reduce National Debt