Copyright 1998, Catherine A. Duran
170
THE IMPACT OF ORGANIZATIONAL DOWNSIZING ON CORPORATE AND STRATEGIC BUSINESS UNIT ECONOMIC PERFORMANCE: AN EMPIRICAL INVESTIGATION OF THE ROLE OF WORK FORCE REDUCTION by CATHERINE A. DURAN, B.S., M.S., M.B.A. A DISSERTATION IN BUSINESS ADMINISTRATION Submitted to the Graduate Faculty of Texas Tech University in Partial Fulfillment of the Requirements for the Degree of DOCTOR OF PHILOSOPHY Approved Chairperson of the Committee Accepted Dedtn of the Graduate School May, 1998
Transcript of Copyright 1998, Catherine A. Duran

THE IMPACT OF ORGANIZATIONAL DOWNSIZING ON CORPORATE
AND STRATEGIC BUSINESS UNIT ECONOMIC PERFORMANCE:
AN EMPIRICAL INVESTIGATION OF THE ROLE
OF WORK FORCE REDUCTION
by
CATHERINE A. DURAN, B.S., M.S., M.B.A.
A DISSERTATION
IN
BUSINESS ADMINISTRATION
Submitted to the Graduate Faculty of Texas Tech University in
Partial Fulfillment of the Requirements for
the Degree of
DOCTOR OF PHILOSOPHY
Approved
Chairperson of the Committee
Accepted
Dedtn of the Graduate School
May, 1998

Copyright 1998, Catherine A. Duran

ACKNOWLEDGMENTS
I would like to thank all the members of ray committee.
Dr. Robert L. Phillips, Dr. Roy D. Howell, Dr. Grant T.
Savage, and Dr. Carlton J. Whitehead for their advice and
never-ending support during the course of my doctoral
program. I am especially grateful to my major professor. Dr.
Phillips, whose knowledge and expertise guided me throughout
my work. I have learned so much from him, not only for this
study, but also for my professional development. I would
also like to especially thank Dr. Howell for giving me his
valuable time on the statistical analysis for this study.
I would like to express deep appreciation to vinitia
Mathews, whose understanding and encouragement were paramount
to this endeavor; and to John Ryan, without whose technical
expertise, programming knowledge and good humor, I could not
have completed this study.
Thanks to my parents for their lasting belief in me, and
for providing so much help in so many ways, without whom this
accomplishment would not be possible. I want to especially
thank my husband, Steve, for his continued support,
encouragement and patience throughout this work, again
without whom I could not have been successful. Finally, I
would like to thank my son, Robert, for keeping me happy and
providing the best reason of all for this achievement.
11
TABLE OF CONTENTS
ACKNOWLEDGMENTS ii
ABSTRACT V
LIST OF TABLES vii
CHAPTER
I. INTRODUCTION 1
Significance of the Study 7
Organization of the Dissertation 8
II. LITERATURE REVIEW 9
Organizational Size 12
Decline in Organizations 16
Organizational Size and Decline 28
Corporate Restructuring 29
Divestment 33
Downsizing Practices 35
Gaps in the Reviewed Literature 42
III. RATIONALE 45
The Point at the End of the Cornucopia 45
Research Strategy 48
IV. METHODOLOGY 49
Data 49
Performance Measures 51
Downsizing Measures 53
Control Measures 54
111

Method of Analysis 57
Empirical Model 58
V. DATA ANALYSIS 60
Descriptive Statistics 60
Time Series Cross-sectional Regression Analysis 63
Base Year Performance as Independent Variables 71
Pooled Cross-sectional Regression Results 7 3
VI. DISCUSSION AND CONCLUSIONS 128
Conclusions 130
Implications 140
Limitations and Strengths 144
Directions for Future Research 146
REFERENCES 148
IV

ABSTRACT
The relationship between downsizing and performance has
not been studied thoroughly, despite the prevalence of
downsizing in the U.S. and overseas. The downsizing issue
continues to be a topic of interest for the nation and the
business world. The streamlining of organizations has become
a perceived necessity in gaining a competitive edge in the
marketplace; however, it has not been clear whether
downsizing does indeed improve profitability. This study
addresses the downsizing-performance link, using
comprehensive multi-year, multi-industry data, and provides a
beginning to understanding the growing (both in occurrence
and importance) phenomenon of downsizing.
The study employs multivariate analysis for the inclusion
of many specific variables that have an impact on economic
performance of an organization. The impact of downsizing (as
workforce reduction) on both corporate and strategic business
unit (SBU) performance is studied, controlling for market
conditions. The study employs both an accounting measure and
a hybrid market/accounting measure of performance to
investigate, not only the impact of downsizing on
organizational profitability, but also on the perceptions of
the market.
The study shows that when controlling for other factors
that affect organizational performance, downsizing has some

negative and some positive effects on SBU and corporate
performance, and that these effects persist for a limited
period of time. Downsizing appears to have some of the
positive effects presented in the anecdotal literature;
however, there appear to be important negative ramifications
of downsizing as well.
VI
LIST OF TABLES
5.1 Descriptive Statistics (SBU datasets) 80
5.2 Descriptive Statistics (CORP datasets) 81
5.3 Correlation Matrices (SBU datasets) 82
5.4 Correlation Matrices (CORP datasets) 83
5.5 Number of SBU's/CORPS by Year 84
5-6 Years of Data Available for TSCS Regressions 85
5.7 Time Series Regression Results (SBU)--All Variables Included 86
5.8 Lagged Time Series Regression Results (SBU)--All Variables Included 87
5.9 Time Series Regression Results (SBU)--ADVINT Excluded 88
5.10 Lagged Time Series Regression Results (SBU)--ADVINT Excluded 89
5.11 Time Series Regression Results (SBU)--RDINT Excluded 90
5.12 Lagged Time Series Regression Results (SBU)--RDINT Excluded 91
5.13 Time Series Regression Results (SBU)--RDINT and ADVINT Excluded 92
5.14 Lagged Time Series Regression Results (SBU)--RDINT and ADVINT Excluded 93
5.15 Time Series Regression Results (CORP)--All Variables Included 94
5.16 Lagged Time Series Regression Results (CORP)--All Variables Included (ROA as Dependent Variable)...95
5.17 Time Series Regression Results (CORP)--ADVINT Excluded 96
5.18 Lagged Time Series Regression Results (CORP)--ADVINT Excluded. (ROA as Dependent Variable) 97
vu

5.19 Time Series Regression Results (CORP)--RDINT Excluded 98
5.20 Lagged Time Series Regression Results (CORP)--RDINT Excluded (ROA as Dependent Variable) 99
5.21 Time Series Regression Results (CORP)--RDINT and ADVINT Excluded 100
5.22 Lagged Time Series Regression Results (CORP)--RDINT and ADVINT Excluded (ROA as Dependent Variable) 101
5.23 Lagged Time Series Regression Results (CORP)--All Variables Included (TOBQ as Dependent Variable).102
5.24 Lagged Time Series Regression Results (CORP)--ADVINT Excluded. (TOBQ as Dependent Variable) 103
5.25 Lagged Time Series Regression Results (CORP)--RDINT Excluded (TOBQ as Dependent Variable) 104
5.26 Lagged Time Series Regression Results (CORP)--RDINT and ADVINT Excluded (TOBQ as Dependent Variable) 105
5.27 Special Lagged Regression Results (SBU)--Base Year ROA as Independent Variable 106
5.28 Special Lagged Regression Results (CORP)--Base Year ROA as Independent Variable 107
5.29 Special Lagged Regression Results (CORP)--Base Year TOBQ as Independent Variable 108
5.30 Concurrent and Lagged (0-2) Regression Results (SBU)--All Variables Included (ROA as Dependent Variable) 109
5.31 Concurrent and Lagged (3-5) Regression Results (SBU)--All Variables Included (ROA as Dependent Variable) 110
5.32 Concurrent and Lagged (0-2) Regression Results (SBU)--RDINT Excluded (ROA as Dependent Variable) Ill
5.33 Concurrent and Lagged (3-5) Regression Results (SBU)--RDINT Excluded (ROA as Dependent Variable) 112
Vlll
5.34 Concurrent and Lagged (0-2) Regression Results (SBU)--RDINT and ADVINT Excluded (ROA as Dependent Variable) 113
5.35 Concurrent and Lagged (3-5) Regression Results (SBU)--RDINT and ADVINT Excluded (ROA as Dependent Variable) 114
5.36 Concurrent and Lagged (0-2) Regression Results (CORP)--All Variables Included (ROA as Dependent Variable) 115
5.37 Concurrent and Lagged (3-5) Regression Results (CORP)--All Variables Included (ROA as Dependent Variable) 116
5.38 Concurrent and Lagged (0-2) Regression Results (CORP)--RDINT Excluded (ROA as Dependent Variable) 117
5.39 Concurrent and Lagged (3-5) Regression Results (CORP)--RDINT Excluded (ROA as Dependent Variable) 118
5.40 Concurrent and Lagged (0-2) Regression Results (CORP)--RDINT and ADVINT Excluded (ROA as Dependent Variable) 119
5.41 Concurrent and Lagged (3-5) Regression Results (CORP)--RDINT and ADVINT Excluded (ROA as Dependent Variable) 120
5.42 Concurrent and Lagged (0-2) Regression Results (CORP)--All Variables Included (TOBQ as Dependent Variable) 121
5.43 Concurrent and Lagged (3-5) Regression Results (CORP)--All Variables Included (TOBQ as Dependent Variable) 122
5.44 Concurrent and Lagged (0-2) Regression Results (CORP)--RDINT Excluded (TOBQ as Dependent Variable) 123
5.45 Concurrent and Lagged (3-5) Regression Results (CORP)--RDINT Excluded (TOBQ as Dependent Variable) 124
5.46 Concurrent and Lagged (0-2) Regression Results (CORP)--RDINT and ADVINT Excluded (TOBQ as Dependent Variable) 125
IX

5.47 Concurrent and Lagged (3-5) Regression Results (CORP)--RDINT and ADVINT Excluded (TOBQ as Dependent Variable) 126
CHAPTER I
INTRODUCTION
This Study explores the relationship between downsizing
and performance. In this study, downsizing is characterized
as a facet of organizational strategy for improving
performance (Cameron, Freeman, & Mishra, 1993). Although the
subtleties of defining organizational downsizing will be
discussed later, in this research downsizing is defined as an
intentional set of activities designed to improve
organizational performance, and which involves reductions in
personnel (Cameron, Freeman, & Mishra, 1993).
Since the 1980's through the present time, around ten
million jobs have been eliminated in the U.S. (Budros, 1997).
Organizational downsizing has been called a "key feature" of
the system of "new capitalism," an economy characterized by
international competition, deregulation of industries, and
technological change (Budros, 1997). It is not clear whether
downsizing does indeed improve profitability, since despite
the prevalence of downsizing, it has not been studied much
(Cameron, 1994). Budros (1997) points out that expectations
are that downsizing will improve performance, and that
companies that downsized are generally seen as positive role
models and acquire social benefits, whether or not operating
efficiencies are achieved. However, there are critics of

downsizing who point out various adverse effects, as well as
more emphasis on growth in recent years (Budros, 1997).
Nevertheless, numerous companies have undergone varying
degrees of downsizing. Over eighty-five percent of the
Fortune 1000 corporations have undergone downsizing (Cameron,
Freeman, & Mishra, 1991). For example, companies that have
downsized extensively include Eastman Kodak (five times in
seven years eliminating over 12,000 jobs). Zenith Electronics
(50 percent of its workforce), UNISYS (50 percent), ITT (over
40 percent), K-Mart (over 20 percent), Peat Marwick (over 20
percent), AT&T (over 10 percent), Sears, Roebuck, & Co. (over
10 percent),and Westinghouse (6 percent) (Cameron, Freeman, &
Mishra, 1991; Lesly & Light, 1992). The downsizing trend is
continuing; among companies with current and future plans of
downsizing are IBM, Xerox, the Postal Service, TRW, Inc., and
General Motors (Cascio, 1993). The 1990's are still filled
with reports of more downsizing (e.g., Uchitelle &
Kleinfield, 1996).
The downsizing issue continues to be a topic of interest
for the nation and the business world. For example, one of
the largest and best known computer businesses in the world,
IBM, has been forced to reevaluate its strategies for
competing in the global market. In an interview with Fortune
(Kirkpatrick, 1993), IBM's new CEO Lou Gerstner says his
first priority is to "get the company right-sized," which
implies more downsizing. Gerstner also says that the
decision on the magnitude and placement of further downsizing
will be at the business unit level. It is not only premiere
U.S. corporations that are facing this phenomenon; Daimler-
Benz of Germany has also announced plans for a workforce
reduction.
The streamlining of organizations has become a
perceived necessity in gaining a competitive edge in the
marketplace; however, it is not clear whether downsizing does
indeed improve profitability. Lesly and Light (1992) point
out that although some downsized companies (e.g., Unisys
Corp., which also narrowed its market) have benefited, many
restructured and so-called "lean" corporations do not appear
to have garnered the long-term expected earnings benefits
from their work-force reductions (e.g., Eastman Kodak, Zenith
Electronics, Sears Roebuck). Interestingly, only one of the
top ten in Fortune's 1993 Ranking of Most Admired
Corporations has fewer employees than it did 5 years ago
(Henkoff, 1993).
Despite the prevalence of downsizing in the U.S. and
overseas, studies of downsizing are relatively sparse in the
strategy and organizational theory literature. The
consequences of downsizing on micro-level issues (e.g.,
usually in human resources and organizational behavior areas)
have, however, been researched, but only to a degree. For
example, studies have been done on survivors of work-force
reductions, and on relating layoffs with motivation (e.g..
Brockner, Davy, & Carter, 1988), self-esteem (e.g., Brockner,
Grover, O'Malley, Reed, & Glynn, 1993, Brockner, 1995;
Daniels, 1995), and organizational commitment (e.g., Wong &
Davis, 1993; Wong & McNally, 1994) . Other work has been done
on how to manage the effects of workforce reductions on those
who remain with the organization, including steps to be taken
before, during, and after the layoffs (Brockner, 1992).
Maintaining the morale of survivors is discussed as an
essential element in successfully implementing mergers and
acquisitions and the attendant layoffs (Gutknecht & Keys,
1993). The phenomenon of survivor guilt has also been
explored (e.g., Brockner, Grover, Reed, DeWitt, & O'Malley,
1987) . Specific issues such as Total Quality Management have
been considered in the literature in relationship to
downsizing (Niven, 1993).
Research on motives behind downsizing actions is just
now beginning to emerge. Kozlowski, Chao, Smith, and Hedlund
(1993) point out that there are many causes and intended
goals associated with downsizing. Harrison (p. 40, 1994)
suggests that downsizing could be explained by diverse
reasons such as "vertical disintegration" of large firms
seeking to escape "bad business climates," an overall shift
from large manufacturing firms to smaller service firms, and
conglomerates trying to return to their core competencies.
Many publications focus on the management of effective
downsizing, attempting to identify processes to implement
downsizing successfully (e.g., Tomasko, 1987; Cameron,
Freeman, & Mishra, 1991; Hendricks, 1992; De Meuse, Bergmann,
Sc Vanderheiden, 1997). Most of the literature on
implementation does not, however, address post-downsizing
organizational performance. In the view of some strategists,
performance issues should be included for research questions
to be of any consequence (Meyer, 1991). There are very few
systematic studies published on the precursors, effects, and
strategies associated with organizational downsizing
(Cameron, Freeman, & Mishra, 1991) . The most extensive and
systematic study of organizational downsizing is that of
Cameron, Freeman, and Mishra (1993), an in-depth field study
including perceptual performance criteria.
Another issue concerning the study of downsizing is that
of divestiture versus work-force reduction. Most of the
strategy literature on restructuring examines divestiture and
diversification refocusing as opposed to work force
reduction. Other studies consider size, but often in terms
of sales or assets instead of number of employees. The
operationalization of size varies greatly by study.
Organizational-size research has been reported in the
organizational theory literature concerning decreasing
financial resources and/or work-force reduction (e.g., see
McKinley, 1992; Sutton & D'Aunno, 1989, 1992). However, in
the organizational theory literature, the dependent variable
in most models is structural (e.g, administrative intensity)
in nature, rather than performance based.
Ginsberg (1988) characterizes empirical research in the
strategy field as addressing two basic questions: (1) "what
factors influence the occurrence of various types of
changes"; and (2) "what are the performance outcomes of these
various types of change." Ginsberg (1988) points out that
the strategy researcher, at some point, must examine
performance outcomes, as improving performance is a basic
tenet of strategic management (Venkatraman & Ramanujam,
1986). This study contributes to the field by focusing on
performance outcomes after downsizing occurs in corporations.
Most of the references to downsizing include anecdotal
evidence (with no clear support for either a negative or
positive effect on profitability) as to the impact of
downsizing. Given the limited amount of theoretical and
empirical work on the very topical and timely issue of
downsizing, especially linked with performance issues, the
primary research question for this study is: What is the
impact of downsizing on corporate and strategic business unit
economic performance, controlling for market conditions?
The use of comprehensive multi-year, multi-industry data
for the examination of performance issues should provide a
beginning to understanding the growing (in both occurrence
and importance) phenomenon of downsizing.

Significance of the Study
This study is significant for the strategic management
field, as well as for the field of organizational theory. It
is concerned with the effect of a strategic change (workforce
reduction) on the performance of organizations, which is of
importance to the strategy field. It also addresses issues
of size, which are clearly of interest in the field of
organizational theory.
The study employs multivariate analysis for the
inclusion of many specific variables that could have an
impact on economic performance of an organization. It uses a
large multi-industry database, which has a variety of
organizations of different sizes. The study provides
information on the relationship between downsizing and
profitability and on the impact of downsizing on the
organization. In summary, the study addresses an issue that
is currently short on theoretical concepts but is of great
importance, not only to the business world, but also to the
national economy.
Limitations
There are some limitations in this study arising from
the use of secondary data bases. For example, the researcher
cannot influence what types or forms of data are collected.
Some variables may not be available in the data base, and

there is little contextual information. Another limitation
to the study is that there is no hypothesis testing; however,
a tentative empirical model is tested.
Organization of the Dissertation
This dissertation has six chapters. Chapter I is the
Introduction. Chapter II contains a review of the relevant
literature in several related subfields of strategy and
organizational theory. Chapter III discusses the rationale
for the study. Chapter IV shows the methodology used, the
regression equations, and the operationalization of the
variables. Chapter V presents the results of the data
analysis. Chapter VI discusses the conclusions based on the
results, and offers implications and strengths and
limitations of the study. Chapter VI closes with directions
for future research.
8
CHAPTER II
LITERATURE REVIEW
The literature reviewed for this study, in the areas of
organizational size, decline, turnaround and retrenchment,
corporate restructuring, and divestiture does not reflect a
consensus on how to conceptualize downsizing. There have
been few empirical research studies on downsizing, and very
little theoretical development. However, there are several
publications geared to practitioners on the implementation of
downsizing.
In addition, there is a small body of literature that
concerns itself with micro-level issues of downsizing, such
as the effect on layoff survivors and how managers should
treat survivors to increase work motivation (e.g., see
Brockner, Grover, O'Malley, Reed, & Glynn, 1993; Brockner,
1995; Daniels, 1995). Other researchers are looking at
layoffs, plant closings, and worker displacement on a
national level (see Hansen, 1988). Hansen (1988) is
concerned with legislation for a displaced worker adjustment
program as part of a comprehensive national employment and
training policy.
The strategic management literature has only just begun
to address the issue of downsizing per se; it appears that
downsizing itself may not have been viewed as a strategic
change. The literature on decline (e.g., see Cameron,

Sutton, & Whetten, 1988; D'Aveni, 1989, Weitzel & Jonsson,
1989) suggests that downsizing is not synonymous with
decline; rather downsizing may be a strategic response to
organizational decline (Greenhalgh, Lawrence, & Sutton, 1988)
or turbulence in the environment.
The corporate restructuring literature generally does
not acknowledge downsizing specifically as an aspect of
restructuring; it instead focuses on asset restructuring
(acquisitions and divestitures), capital restructuring
(infusion of debt), and management restructuring (changes in
organizational structure) (Singh, 1993). In this literature,
downsizing possibly may often be seen as an effect of
restructuring (Bowman & Singh, 1990; Hoskisson, Hitt, & Hill,
1991).
In spite of the scarcity of research on the impact of
downsizing on organizational economic performance, workforce
reduction is viewed as part of the process necessary for
long-term organizational improvements (Cascio, 1993). Many
popular business books and journals give advice to "cut out
the fat" and "get lean and mean" (Cascio, 1993). Tom Peters
(1992) argues for "rethinking scale," and that "big is
dead."
However, some doubt is emerging as to whether the
anticipated economic results of downsizing actually
materialize (Cascio, 1993; Lesly & Light, 1992). Studies by
consulting firms are showing that in many companies that have
10
downsized, expenses have not been reduced adequately, profits
have not increased as expected, and stock prices have not
necessarily gone up over the long term (AMA, 1993; Cascio,
1993; Lesly & Light, 1992). For example, the American
Management Association's (AMA) 1993 Survey on Downsizing
showed that fewer than half of the surveyed organizations
that had downsized since 1988 reported increased profits.
The question of whether downsizing has a positive or
negative relationship with corporate performance has not been
resolved. The American Management Association's (AMA) 1993
Survey on Downsizing showed that on the average, over the
last five years, 45% of the companies surveyed had downsized,
with a five-year average of a 10% reduction of the workforce.
Fewer than half of the surveyed organizations that had
downsized since 1988 reported increased profits. The AMA
(1993) points out that profit levels are affected by many
other variables in addition to workforce reductions. In
contrast, most surveys by consulting and investment firms
usually investigate only a bivariate relationship between
downsizing and profits, leaving out a host of other important
variables that may affect performance.
Neither the practitioner nor the academic literatures
offer theoretical frameworks in which downsizing may be
studied. Indeed, Cameron, Freeman, and Mishra (1993)
recommend that at this early stage of organizational
downsizing study, researchers should be building theories.
11
particularly including the association of downsizing with
successful organizational performance. The impact of
downsizing should be examined in light of strategic moves
(both corporate and SBU), as well as changes in the
environment (e.g., industry structure).
Organizational Size
This section reviews the relevant literature on
organizational size, primarily in the field of organizational
theory. Organizational size is one of the three core
contingency variables (along with technology and the
environment) studied extensively in the organizational theory
field (Bluedorn, 1993). Several basic propositions arose
from the dominant theoretical position of size; the
propositions were concerned with the relationship between
size and organizational structural variables, such as
structural differentiation, administrative proportion,
centralization, and formalization (Bluedorn, 1993). Some
studies have dealt with the relationship between size and
other variables, such as employee pay (Mellow, 1982; villemez
& Bridges, 1988), executive compensation (Gomez-Mejia, Tosi,
Sc Hankin, 1987; Rajagopalan & Prescott, 1990), and
absenteeism (Markham & McKee, 1991).
Other issues concerning size include diversification,
divisionalization, and innovation. There is a debate in the
organizational literature on whether size or diversification
12
strategy is more closely associated with divisionalization
(see Grinyer & Yasai-Ardekani, 1981; Child, 1982; Donaldson,
1982; Grinyer, 1982). Damanpour (1992) found a positive
relationship between size (measured in different ways) and
innovation in a meta-analytic study using 36 correlations.
It was found that the size-innovation relationship was
stronger when size was measured in terms of assets, rather
than number of employees. Damanpour (1992) also suggests
that there is a curvilinear relationship between size and
innovation.
However, there are relatively few studies that consider
performance and size. Christenson and Sachs (1980) found
that government size was positively correlated with perceived
quality of public services. Size was measured as: (1)
number of government employees in a county; (2) the ratio of
government employees to the total population of a county; and
(3) the number of public employees relative to the number of
administrative units. They also found that number of
administrative units was uncorrelated with quality.
A meta-analysis by Gooding and Wagner (1985) showed a
positive correlation between size and performance (absolute
measures), but not between size and efficiency (relative
output/input measures). Results varied with the measure of
size. Performance was measured in various ways including
profits, sales, and number of clients. Size was measured as
number of employees, the log of the number of employees.
13
capacity, assets, and transactions. There was a positive
correlation with performance only when size was
operationalized as the log of the number of employees. No
correlation was seen when size was operationalized as the raw
number of employees, nor as assets. There was a negative
correlation when size was operationalized as capacity or
transactions. Gooding and Wagner (1985) also found that at
the subunit level (as opposed to the organizational level),
there was a negative correlation between size and performance
(depending on the operationalization of performance). It is
evident from the results of the meta-analysis that the
empirical evidence on the relationship between size and
performance is mixed.
Interestingly, an empirical study by Smith, Guthrie, and
Chen (1989) showed that size moderated the relationship
between strategy and firm performance, with strategy measured
using the Miles and Snow (197 8) typology. However,
performance was measured using self-report data. Size was
measured as number of employees.
A meta-analysis was done by Capon, Farley, and Hoenig
(1990) on the determinants of financial performance, relating
environmental, strategic, and organizational factors to
performance. The studies in the meta-analysis analyzed
performance at three levels: industry (7 3 studies),
corporate (205 studies, 163 in multiple industries), and
business (42 studies). Size itself (measured in a variety
14

of ways, usually in terms of sales or assets, but never as
downsizing) appeared to be unrelated to financial performance
(Capon, Farley, & Hoenig, 199 0).
A study examining the relationship between size and
change (measured as expansion into new markets) found an
inverted U-shaped relationship between size and change for
some markets (Haveman, 1993). Haveman (1993) suggests that
size should not be conceptualized as solely an organizational
characteristic, as internal and external constraints vary
among settings, which could affect the relationships under
study.
An empirical study on diversification and corporate
restructuring by Chang (1996) showed that larger firms can
improve performance more than smaller firms, with various
entry and exit strategies. However, firm size was measured
as the log of total assets, rather than in terms of numbers
of employees.
The concept of downsizing certainly has some connection
with the literature on organizational size. However, most
studies on size do not consider changes in size within
organizations, which is inherent in any study of downsizing.
The operationalization of size is also open to question in
the literature; size is not often measured in terms of number
of employees. The literature does not thoroughly address the
relationship between size and performance, as there is little
agreement seen in empirical studies. Additionally, the
15

operationalization of performance is usually perceptual,
rather than objective, in nature.
Decline in Organizations
This section briefly considers the literature on
organizational decline. Within the stream of research on
phases of the organizational life cycle, particularly on
birth, death, and decline (Bluedorn, 1993), the decline phase
has emerged as a very important topic for business
researchers. The high number of overall business failures
and the extensive loss of jobs in the manufacturing
industries (Cameron, Sutton, & whetten, 1988) underscores the
significance of studying decline. However, organizational
decline has been defined in many ways, often ambiguously
(Cameron, Sutton, & Whetten, 1988). Also, downsizing and
retrenchment have frequently been confused with decline.
Cameron, Sutton, and whetten (1988) have suggested a
working definition of organizational decline that
distinguishes responses to decline from decline itself. In
their definition, deterioration of the organization's
adaptation to the microniche leads to reduction of resources
within the organization.
There are organizational, group, and individual
responses to organizational decline. Cameron, Sutton, and
Whetten (1988) clearly consider downsizing, along with
turnaround, divestment, and executive succession, as possible
16

organizational responses to decline. It is interesting to
note that downsizing could occur in response to either K-type
(shifting market demand results in a declining population) or
r-type (where the population is stable or growing) decline.
(See Wilson [1980] for detailed writings on K-type and r-type
deterioration.)
Zammuto and Cameron (1985), in a model based on
population ecology, propose four types of decline: erosion
(continuous change in niche size), contraction (discontinuous
change in niche size), dissolution (continuous change in
niche shape), and collapse (discontinuous change in niche
shape). They suggest that organizations in niches of
decreasing size would be likely candidates for cutback
activities (i.e., a type of structural adjustment). Zammuto
and Cameron (1985) also propose five domain-altering
strategic responses: domain defense (buffering from the
environment), domain offense (expanding markets or product
line), domain creation (diversifying or innovating), domain
consolidation (reducing size of domain and peripheral
actions), and domain substitution (replacing domain when
carrying capacity of original niche goes to zero).
Downsizing activities could be part of a domain consolidating
strategy, with change by deletion as the primary structural
adjustment, in response to a contraction type of decline.
Kozlowski, Chao, Smith, and Hedlund (1993) have combined
the Zammuto and Cameron (1985) dimensions with a model of
17
downsizing decision process formulated by Freeman and Cameron
(1993) . Freeman and Cameron (1993) use the Tushman and
Romanelli (1985) notions of convergence (long time spans of
incremental change) and reorientation (shorter periods of
discontinuous change). Kozlowski, Chao, Smith, and Hedlund
(1993) suggest that environmental variation can affect the
downsizing decision process, and have proposed that
convergent forms of downsizing are more likely to be
associated with changes in niche size, whereas reorientation
forms of downsizing are more likely to be associated with
changes in niche shape. DeWitt (1993) presents a normative
model of downsizing implementation, which includes four
downsizing strategy alternatives to be used when an
organization is facing organizational and/or environmental
decline. The strategies vary in terms of domain and
structural changes. However, the above models are primarily
concerned with processes, rather than performance outcomes,
of downsizing.
Cameron, Sutton, and Whetten (1988) further emphasize
the distinction between decline and downsizing or
retrenchment. Workforce reduction is a strategic response to
conditions caused by decline, but is not decline itself
(Greenhalgh, Lawrence, & Sutton, 1988). Furthermore,
downsizing can be either functional or dysfunctional
(Cameron, Sutton, & Whetten, 1988). If the wrong strategy is
chosen, or a strategy is poorly implemented, further erosion
18
in organizational adaptation and resource flow may occur. On
the other hand, downsizing could signal to customers and
stockholders that the organization is responding correctly to
decline. Cameron, Sutton, and Whetten (1988) point out that
a majority of Fortune 500 companies have downsized to some
degree, regardless of their objective growth or decline
pattern.
There is little integrative work on the consequences of
decline, with most of the literature relying on case studies
in single industries (Cameron, Sutton, & Whetten, 1988). Nor
has there been much work on the consequences of
organizational responses to decline, such as downsizing.
Ford (1980a) proposed a conceptual framework for looking at
the structural changes in declining organizations, where the
occurrence of structural hysteresis is explained. Ford
(19 80a) suggests the relationship between size and structure
is different depending on whether the organization is growing
or declining, but downsizing itself was not considered, and
performance outcomes were not included.
Some of the work that has been done on decline is
concerned with the relationship between decline and
organization variables such as technical and structural
complexity, administrative intensity (McKinley, 1987), and
centralization (Cameron, Whetten, & Kim 1987). McKinley
(1987) found that the positive relationship between
19

internal complexity and administrative intensity was
moderated by organizational growth and decline.
Ludwig (1993) investigated structural and organizational
adaptations of a population of a religious order under
conditions of decline (decreasing membership). In Ludwig's
(1993) study, retrenchment was characterized as either
cutback (percentage by which total organizational operations
were reduced) or reallocation (percentage of allocations to
individual units). Personnel changes were examined in terms
of admissions, departures, and transfers; while downsizing
itself was not addressed.
Others have investigated organizational decline in
relation to the environment. For example, Cameron, Kim, and
Whetten (1987) investigated the related constructs of
turbulence, stagnation and environmental decline. They base
their ideas on three streams of research: (1) organization-
environment literature, especially resource dependence; (2)
crisis-management literature; and (3) uncertainty literature.
They point out that the environment may or may not have
changed when a company goes into decline (as a reduction of
the resources within the organization itself). They also
view decline neutrally; i.e., the management of the decline
will determine positive or negative consequences (Cameron,
Kim, and Whetten, 1987).
An interesting study by Meyer (1982) showed that
organizations respond and adapt in many different ways to
20
environmental jolts (in this case, a doctors' strike
affecting numerous hospitals). Although hospital admission
and occupancy levels were drastically lowered, some hospital
administrators used employee layoffs as short-term solutions,
while others did not.
Harrigan (1980) suggests that firms in declining
industries follow different strategies based on environmental
traits. Divestiture is shown as part of one strategy (early
exit), but downsizing is not mentioned.
Hambrick and D'Aveni (1988) looked at dynamics of
corporate failure where poor performance was a significant
feature of a downward spiral. Weitzel and Jonsson (1991)
provide a model of decline that may serve as a frame of
reference for managers to try to ameliorate or reverse the
downward spiral.
Some researchers chose to study part of the process of
decline by investigating retrenchment as a response to
financial decline and also as an initial phase of a
turnaround strategy (see Robbins & Pearce, 1992). Robbins
and Pearce (1992) roughly classify several activities,
including restructuring, downsizing, and downscoping, as
retrenchment. They use the term retrenchment to primarily
signify cost and asset reductions, and they briefly mention
"head count cuts" as one of the possible strategies in the
retrenchment stage of the turnaround response model.
However, in the empirical test of their model, they did not
21

operationalize retrenchment as workforce reduction; instead
they used reduction of total costs between two times, and net
reduction in assets between two times (Robbins & Pearce,
1992). Turnaround performance was considered as the net
change in ROI between two times.
Barker and Mone (1994) take issue with the contention
that retrenchment is a cause of turnaround (as Robbins and
Pearce [1992] maintain) and suggest that retrenchment is
instead a consequence of organizational decline. Barker and
Mone (1994) believe that how an organization executes its
downsizing or retrenching activities is more important to
turnaround (i.e., performance recovery), than the actual
initiation of retrenchment programs. Again, retrenchment in
the Barker and Mone (1994) empirical study, was
operationalized as reduction in assets or costs, rather than
reduction in personnel.
There is a growing debate in the strategic management
literature on the organizational significance of retrenchment
and downsizing. Pearce and Robbins (1994) assert that the
Barker and Mone (1994) research actually supports the
original Robbins and Pearce (1992) turnaround process theory
with retrenchment as its cornerstone. The question of
retrenchment value has not been resolved.
A later study by Barker and Duhaime (1997) avers that
although some empirical studies demonstrate performance
turnarounds for declining firms resulting from cutback
22

activities (i.e., retrenchment) which increase efficiency,
strategic reorientation is vital to the recovery process of
declining firms. They present a model where the extent of
strategic change varies with the need for and capacity of
declining firms to reorient their strategies. In their
model, firms must have weak strategic postures for strategic
change to be critical for turnaround; i.e., levels of
strategic health, as well as the amount of strategic change,
must be identified and measured for a definitive turnaround
study. They also point out that the causes (or types) of
decline should be controlled for (e.g., firm-based decline
vs. industry-based decline). For example, extensive
strategic change is seen in turnarounds from firm-based
decline, whereas, little strategic change is seen in
industry-based decline. The latter is described in the study
as operational turnaround based on asset and cost reduction
as discussed by Hofer (1980). Also, the capacity for
strategic change is important, and can be controlled for by
firm size and diversification profile.
There appears to be a need for more empirical research
and theory building. Special care should be taken in the
operationalization of variables, particularly when dealing
with downsizing specifically, as has scarcely been done.
The strategic and managerial consequences of
organizational decline were studied by D'Aveni (1989). The
consequences reflected threat-rigidity responses. Like
23
others mentioned in this section, D'Aveni (1989) makes a
clear distinction between decline and downsizing. D'Aveni
(19 89) defines organizational decline as decreasing internal
resource munificence over time. His definition of downsizing
involves changes of organizational size and scope, including
selling off fixed assets, or subsidiaries (e.g.,
divestiture), and reducing product-market domains. However,
he does not explicitly include work-force reduction in his
definition of downsizing, nor in his operationalization in
the study.
D'Aveni (1989) also maintains that while many declining
organizations downsize, "downsizing and decline do not always
occur simultaneously or at the same rate" (p. 57 8). He also
concludes that the effectiveness of downsizing depends on
environmental conditions. Downsizing may give the
organization time to wait for environmental improvement, but
does not necessarily guarantee turnaround (D'Aveni, 1989).
D'Aveni (1989) also concludes that downsizing may become a
habit, "providing an illusion of temporary well-being" (p.
600). He found that, contrary to the idea that downsizing
could be a factor in creating slack for diversification
efforts and strategic change, post-decline managerial
imbalances inhibited the use of funds garnered from
downsizing efforts for successful turnaround strategies.
Murray and Jick (1985) studied six underfunded hospitals
over a period of five years, and documented responses of the
24
hospitals. They propose a framework for organizational
decline management, providing managers with a problem-solving
approach to resource scarcity threats, while recommending to
researchers that a holistic view must be taken (and a multi-
method approach) when studying organizational decline.
Other researchers have looked at decline and
retrenchment issues in terms of turnaround and rejuvenation.
Some have offered prescriptions. For example, Hofer (1980)
offers a framework for designing turnaround strategies at the
SBU level, in response to major declines in performance (in
terms of decreasing profitability, sales, or market share).
Hofer (19 80) distinguishes between operational and strategic
turnaround. Cutting costs or assets is termed operational in
nature, but downsizing itself is not considered.
Stopford and Baden-Fuller (1990) differentiate between
corporate turnaround (finance and efficiency oriented) and
corporate rejuvenation (concerned with both efficiency and
creation of sustainable growth). Detailed industry and case
analyses yielded insights on how corporate rejuvenation was
accomplished. Holistic changes in structure, strategy,
systems, technology, and individuals were required for
sustainable corporate rejuvenation (Stopford & Baden-Fuller,
1990).
Greenhalgh (1982) believes organizational retrenchment
occurs in a situation where an organization fails to adapt or
the carrying capacity of an environmental niche is reduced.
25

The organization then responds by cutting back its scale of
operations, and the size of the workforce is usually reduced
proportionally. Greenhalgh (1982) recommends an action
research program to facilitate comprehensive work force
planning and maintain organizational effectiveness.
Greenhalgh's (1982) action research program is designed
primarily to alleviate common problems arising from workforce
reduction, such as impaired job security. Organizational
effectiveness measures were self-report data on employee
productivity and propensity to leave the organization.
Much of the decline research looks at organizations
under conditions of decline and the concomitant unique
situational aspects and management challenges. Cameron,
Whetten, and Kim (1987) empirically explored a set of
dysfunctional characteristics (including many at the
individual and group levels) of organizations in decline.
Organizational dysfunctions associated with decline include
increases in conflict, secrecy, scapegoating, self-protective
behaviors, rigidity, turnover, decreases in morale,
innovativeness, participation, and long-term planning.
Weitzel and Jonsson (1989) point out an interesting
aspect of decline, in that cutback in terms of size (Whetten,
1980) does not necessarily negatively affect the survival an
organization. Whetten (1980) explains cutbacks in size as
rising from a reduction in the market in which the
organization operates, or from a decrease in the
26
organization's ability to compete with others in its market.
Weitzel and Jonsson (1989) suggest that cutback may not be a
form of decline; instead it may be "temporary adjustment that
is an appropriate response to the environment and enhances,
rather than diminishes, long-term viability" (p.93). This
would be in line with considering downsizing as a strategic
change, its organizational impact to be empirically
determined.
An interesting study by Wiseman and Bromiley (1996)
explores the relationship between decline, risk and
performance. They contrast two theoretical perspectives: a
decline theoretical approach which states that declining
organizations decrease risky activities, and the decreased
risk-taking leads to further poor performance, versus a risk
theoretical approach which states that declining firms take
more risks, and the increased risky behavior (again) leads to
more low performance. The ensuing empirical investigation
shows that when financial resources are decreased (i.e.,
organizational decline), risk-taking is increased, which in
turn leads to lower performance. Although performance is
central to the study, downsizing itself is not considered (as
financial resources are considered in terms of different
kinds of slack, none involving numbers of employees).
The literature on decline clearly shows that downsizing
and decline are not synonymous. Organizational downsizing is
often seen as a type of adaptation to organizational decline.
27
and is considered to be a subject of controversy (McKinley,
1993).
Organizational Size and Decline
This section extends the discussion on organizational
size and decline by briefly reviewing the relevant literature
on the relationship between decreasing size and
organizational decline. Much of the work in this area is
concerned with how to implement downsizing or workforce
reduction strategies. For example, Greenhalgh, Lawrence, and
Sutton (1988) introduce five strategies for workforce
reduction, along with sample tactics for implementing the
strategies. Further, they offer a set of propositions on
which strategies will be chosen, depending on labor
oversupply characteristics, and on contextual factors such as
skill levels, age and seniority, company structure
(multidivisional vs. unitary), and ownership.
Another study looked at the relationship between
decreasing organizational size and unemployment rates,
focusing on absenteeism (Markham & McKee, 1991). Ford
(1980b) found in a study of school districts that the
relationship between size and administrative components
differed depending on whether the study was conducted cross-
sectionally or longitudinally, and that the number of
personnel actually increased during periods of decline.
28

A debate in the organizational theory literature between
researchers (see Sutton & D'Aunno, 1989; McKinley, 1992;
Sutton Sc D'Aunno, 1992) concerns building a model of
workforce reduction. Sutton and D'Aunno (1989) focus on the
effects of decreased workforce size on organizational
structure, including degree of mechanistic structure, and
need for coordination and control.
McKinley (1992) criticizes the Sutton and D'Aunno (1989)
model, by questioning some of their assumptions. McKinley
(1992) believes that there are asymmetries between growth and
decline, both in magnitude and direction of structural
change. However, throughout the debate in the literature,
organizational performance is not addressed.
Corporate Restructuring
This section of the literature review discusses some of
the literature on corporate restructuring and its
relationship to the issue of downsizing. Some researchers
maintain that downsizing and downscoping are a result of
corporate restructuring (Hoskisson, Hitt, & Hill, 1991; Hitt
Sc Keats, 1992). Hoskisson, Hitt and Hill (1991) say that
downsizing and downscoping: (1) reduce vertical controls;
and (2) facilitate the development of strong core values in
the organization.
Hitt and Keats (1992) take an interesting approach and
show a reciprocal interdependence between restructuring and
29

strategic leadership. They define restructuring activities
as mergers and acquisitions, downscoping (reduction in the
number of businesses or products), and downsizing (reducing
operational slack, subtracting administrative layers).
Workforce reduction is seen as a component of both
downscoping and downsizing.
Hitt and Keats (1992) note three human resource
approaches in downsizing and downscoping activities:
decreasing numbers of upper-echelon, highly paid members of
the organization; eliminating middle management layers; and
across-the-board layoffs. Hitt and Keats (1992) point out
that effective restructuring does not necessarily mean
indeterminate workforce reduction; critical organizational
functions must be evaluated in light of long-term goals and
individual skills. They develop the argument that effective
strategic leadership during restructuring must balance short-
term needs with long-term growth and survival.
Other researchers characterize corporate restructuring
as change along the dimensions of assets, capital structure,
or management (Bowman & Singh, 1990, 1993) . Bowman and Singh
(1993) point out that restructuring decisions are a part of
long-term strategic planning. They also discuss the
multidimensionality of restructuring, and the need to
consider the consequences of restructuring on performance.
One type of restructuring, corporate refocusing, was
investigated by Markides (1992). He looked at the
30

relationship between reduction of diversification and
profitability, finding a curvilinear relationship- However,
his study did not include downsizing as a variable.
Markides* (1992) findings are in line with the evidence from
Hoskisson and Hitt (1990), work which shows a curvilinear
relationship between diversification and performance.
Markides (1995) later goes on to further investigate the
links between diversification, restructuring, and
performance. A decrease in diversification (by divestiture,
thereby refocusing on the firm's core business) by
overdiversifled firms was shown to lead to increased
profitability. The study defined restructuring as
refocusing, rather than share repurchasing, consolidation, or
leveraged recapitalization, nor was downsizing considered.
Lewis (1990) includes acquisition or divestiture,
replacement or reassignment of senior managers, reduction in
employee counts, and debt recapitalization as restructuring
activities, and contends that the degree of restructuring is
very important. Most articles and book chapters on corporate
restructuring appear to focus on issues such as valuation,
board of director involvement and corporate governance,
leveraged buyouts, employee stock ownership, executive
succession and compensation, and tax implications (e.g., see
Rock Sc Rock, 1990; Bowman & Singh, 1993) . Downsizing is
considered rarely, with possible limited significance, and
31
sometimes as a part of the aforementioned restructuring
issues.
An exception to the restricted use of downsizing as an
important research concept is the work of Bethel and
Liebeskind (1993). They show that blockholder ownership is a
significant determinant of corporate restructuring, as
operationalized as downsizing (percentage change in firm
sales and firm employees over a period of time). Bethel and
Liebeskind (1993) consider downsizing as a measure of
portfolio restructuring. They frame their study and results
within agency theory. Performance issues, however, were not
addressed.
Singh (1993) uses a trade definition of corporate
restructuring as he found no accepted definition in the
academic literature. The term restructuring is used for
"significant and rapid changes in the firm's assets, capital
structure, or organizational structure" (p. 147). Singh
(1993) reiterates the multifaceted and complex nature of
restructuring. He discusses many aspects of corporate
restructuring, including acquisitions, divestitures,
management buyouts, top management teams and boards, and
mergers; however, downsizing is not included.
Hatfield, Liebeskind, and Opler (1996) explore the
relationship between corporate restructuring and
specialization at the industry level. The study found that
while plant closings and industry entry were important.
32

corporate control transactions such as sell-offs had no
effect on aggregate industry specialization. Although plant
closing were dealt with, downsizing specifically was not.
A study by Chang (1996) examined firm entry and exit
decisions as searching for improved performance, in terms of
diversification and corporate restructuring. Poor
performance was shown to lead to exit, but not entry.
Divestiture (exit) was associated with improved performance,
but when industry profitability was taken into account, the
performance improvements disappeared. Although many
variables were included in the analysis, including firm size
(measured as log of total assets), and line of business size
(measured in terms of sales), downsizing was not considered.
Divestment
This section discusses the relevant literature on
divestment and any links with downsizing. Much of the
literature on divestitures is in the finance field, and very
specifically related to corporate investment and financing
decisions. Pre- and post-divestment organizational
performance was compared by divesting and non-divesting firms
by Montgomery and Thomas (1988) . Weak performers were shown
to be more likely to divest. However, downsizing was not
addressed.
Other work on divestment has focused on the performance
of the divested business -- spin-offs of the corporate parent
33

(see Woo, Willard, & Daellenbach, 1992). The results showed
that for both related and unrelated subsidiaries, post spin
off performance declined. Again, downsizing was not
included.
Duhaime and Grant (1984) point out that several branches
of the management literature are related to divestment, such
as life cycle theory, end-game strategies, stages of
corporate development, and corporate portfolio theory. Their
work focuses on the effects of various factors hypothesized
to be important influences on the divestment decisions of
large, diversified firms.
Factors influencing corporate divestment decisions
include business unit financial and competitive strength,
business unit interdependency, and corporate financial
strength relative to industry averages (Duhaime & Grant,
1984). General economic conditions and managerial attachment
did not influence corporate divestment decisions. Although
Duhaime and Grant (1984) define corporate divestment as a
decision to dispose a significant portion of assets,
downsizing did not play a role in their study.
Duhaime and Baird (1987) focused on business unit size
effects on divestment decisions. Divestment situations were
characterized as defensive (eliminating a unit with poor
performance) and aggressive (opportunity grabbing, or funding
for potential stars in the portfolio, gathering cash for
bankrolling a new product). Divestment reason was found to
34

be curvilinear; small and large units were divested for
defensive reasons, while medium units were divested for
aggressive reasons (Duhaime & Baird, 1987).
Questions were brought up as to the minimum efficient
size for business units in a corporation's portfolio.
Differences in size of business units was specifically
addressed in the Duhaime and Baird (1987) study, but
downsizing was not.
Wright and Ferris (1997) studied the effect of
divestment on corporate value (in terms of stock returns).
The study was based on agency theory and explored the effect
of public and private political forces on corporate strategy,
The effect of divestment of South African business units on
stock price was found to be negative, indicating that
managers do not always act in the best interests of firm
owners. Downsizing per se was not a part of the study.
Downsizing Practices
Much has been written on how to implement downsizing,
retrenchment, and work-force reduction; however, there are
few theoretical frameworks, nor are there many attempts to
associate various downsizing practices with actual
performance (especially objective measures). This section
offers a brief glimpse of some of the literature on "the
management of downsizing."
35
Hardy (1987) compared two organizations, one that
successfully retrenched, and another that was unsuccessful.
Hardy's (1987) observations were based on attempted plant
and hospital closings, rather than on the more general
concept of downsizing. Through interviews and documentation
analysis. Hardy (1987) suggests how to avoid the costs of
retrenchment by managing several issues, including awareness,
involvement, fair play, disclosure, understanding, and blame.
Another study on the management of workforce reduction
focuses on plant closings (Price & D'Aunno, 1983). Price and
D'Aunno (1983) take the perspective that exchange
relationships are the key to managing the transitions
associated with organizational decline. The links between
the company, transition managers, displaced workers, and the
community are examined through case studies. Prescriptions
are offered for the role of transition manager, including
such concepts as bounded rationality, top management's key
role, the necessity for a long-term view, and the management
of transactions rather than people.
A downsizing program is outlined by Appelbaum, Simpson,
and Shapiro (1987). In their paper, downsizing is defined as
a systematic reduction of a workforce. They develop ten
steps for the human resource department of an organization to
follow for successful downsizing, as well as ten very general
steps for top management, particularly the strategic human
resources executives, to take while planning the downsizing
36

action. Appelbaum, Simpson, and Shapiro (1987) view
downsizing as one possible tool for maintaining or improving
performance, and suggest that monitoring and evaluation are
important for success.
Organizational downsizing may be necessary for many
hospitals in the future (Mullaney, 1989). Mullaney (1989)
offers a case study of a hospital system facing decreasing
demand. Mullaney (19 89) recommends the establishment of a
steering committee, a productivity measurement system, and a
specific reduction-in-force plan.
Robertson (1987) presents two approaches to downsizing,
that have been successful in large organizations. The
product/service approach to downsizing determines which
products and/or services can be streamlined or eliminated,
and then staffing is reduced. The more commonly used
management systems approach is often budget driven, where
middle managers are given new resource allocations to define
the number of workers they can fund (Robertson, 1987) .
Robertson (1987) concludes with suggesting that a vision and
a process for integrating the vision are crucial for
successful downsizing efforts. Performance issues are not
discussed.
An attitudinal study on downsizing in manufacturing
firms was done by McCune, Beatty, and Montagno (1988) , which
sought to identify prescriptions for human resource practice,
Seniority was perceived to be the most used determinant for
37

layoffs, although worker performance was considered in many
non-union firms. Downsizing "programs" typically were
planned and implemented in less than two months.
Prescriptions for human resource managers included using
human resources as a competitive weapon, as well as
integrating human resource strategy with organization
strategy; developing a flexible workforce, adopting employee
stabilization techniques; and ensuring that downsizings are
strategically planned.
McCune, Beatty, and Montagno (1988) also call for future
research, particularly empirical investigation to examine the
validity of the many prescriptive models that abound. They
also suggest that research should be done on the consequences
of downsizing, especially in the areas of survivor reactions,
as well as career transitions.
Cameron, Freeman, and Mishra (1991) present six general
strategies for successful downsizing, gleaned from a field
study of U.S. automobile manufacturers. The "best practice"
strategies appear contradictory in some respects. For
example, successful downsizing was implemented from the top-
down, but was also initiated from the bottom-up; successful
downsizing was short-term and across-the-board, but also
long-term when systemically implemented. Other successful
downsizing practices included outplacement services and
family counseling.
38
The most interesting aspect of the Cameron, Freeman, and
Mishra (1991) study was the apparent contradictory strategies
of effective downsizers. Therein lies much fodder for future
research, especially along broad lines.
A study by De Meuse, Bergmann, and Vanderheiden (1997)
explicates several myths about corporate downsizing. The
first myth is that downsizing is widespread in the U.S., but
in fact, there has been more growth in jobs that loss of
jobs. However, restructuring has become a common corporate
way of life. The second myth is that downsizing improves
profitability, but in reality the savings are overestimated,
and the costs of downsizing are underestimated. The third
myth is that downsizing increases corporate responsiveness,
including communication within the company and with
customers, while there is actually much fear, anger and
resentment which impedes communication and involvement. The
fourth myth is that downsizing focuses on terminated
employees, yet actually those employees left in the company
often have lasting impact on the corporation after downsizing
(e.g., in terms of low morale, increased health costs,
decreased productivity, and increased numbers of lawsuits).
The fifth myth is that downsizing is a last resort, whereas
in reality, it is often implemented without considering
creative alternatives such as pay cuts, unpaid vacations,
shortened work weeks, job sharing, retraining for temporary
other jobs, etc. The sixth myth is that downsizing only
39

happens once, but if downsizing is used for cost cutting, it
will be likely used again. The seventh and final myth
discussed by De Meuse, Bergmann, and Vanderheiden (1997) is
that downsizing is an end in itself, while instead it should
be part of a complete organizational plan that focuses on the
firm after the downsizing occurs. The authors maintain that
downsizing can be implemented successfully if there is
effective strategic planning and communication programs in
place, as well as a supportive corporate culture, where
temporary measures are taken to solve financial problems,
using employee involvement to produce some of the solutions.
Bruton, Keels, and Shook (1996) showed that downsizing
could be beneficial to firms, if the downsizing were a part
of strategic reorientations, by refocusing the firm on its
core businesses. Successful downsizers often reduced asset
size through divestiture. Bruton, Keels, and Shook (1996)
recommend a contingency approach of downsizing integrated
with strategic direction.
An interesting study by Lee (1997) showed differences in
the effect of layoffs on stock price, depending on nation
(U.S. or Japan) . Additionally, the U.S. results showed that
although layoff announcements had a negative effect on stock
price overall (within a five-day period), the type of layoff
mitigated the lowered stock price.
For example, single layoff announcements are worse that
multiple announcements; permanent layoffs are worse than
40

temporary layoffs; the extent of the layoff is important; the
first announcement in the industry is the worst; and
reactive layoffs (those that are the only response to poor
financial performance) are worse than proactive layoffs
(those that are part of a deliberate restructuring strategy).
DeWitt (1998) considers downsizing approaches as
strategic choices for staying in or leaving an industry (or
somewhere in between) . The study characterizes downsizing as
retrenchment, downscaling, or downscoping. Retrenchment
approaches keep the same scope and output of a firm, while
redundant facilities or jobs are eliminated, or managerial
responsibilities are realigned. Downscaling keeps the same
scope but lowers output, by making permanent cuts in human
and physical resources. Downscoping reduces both scope and
output, by product line pruning or market withdrawal, for the
most part.
Firm influences such as capacity and production
investment; industry influences, such as cost advantages
and product differentiation; and strategy influences, such as
domain breadth were shown to be important in choosing
downsizing type, depending on whether the firm was broad of
focused in terms of scope. Dewitt (1998) points out that the
characterization of downsizing is important for understanding
strategic decisions and their impact, and that the downsizing
approach itself is different from the complete strategy of a
declining firm.
41

Gaps in the Reviewed Literature
There are gaps in the organizational science literature
in the exploration and explication of downsizing and its
relationships with other concepts. In the literature on
"size," one of the most important gaps is that changes in
size within organizations are not addressed. One of the
effects, therefore, is that there are no definitions of
downsizing, nor theoretical frameworks on downsizing offered.
Moreover, the operationalization of size is inconsistent,
often contributing to differences in results. Another
drawback in the size literature, at least in relation to
downsizing, is that number of employees is not always
considered. The performance and size relationship is
inadequately studied, and when performance is addressed,
perceptual measures are usually used instead of objective
measures.
In the literature on "decline," there is great
conceptual confusion between downsizing and decline. There
is also blurring of the distinction between decline and
responses to decline. There are few theoretical linkages
between downsizing and decline. Rather, there are many
discussions on how to "handle" decline and the focus is often
on implementation issues. In addition, in the decline
literature, performance relationships are rarely addressed.
In the small amount of literature on "size and decline"
42

together, there is no definitional clarity of concepts;
workforce reduction is often used, even as decline itself.
Implementations issues are addressed, with little emphasis on
theoretical constructs. There is disagreement in the
literature on the possible asymmetry between growth and
decline. Performance issues are, again, not addressed.
The "corporate restructuring" literature has gaps in it
relating to downsizing, as well. Downsizing itself is rarely
considered; downsizing is not usually included in
restructuring definitions. In the one study reviewed. Bethel
and Liebeskind (1993), there was no study of the relationship
between downsizing and performance. Overall, the
consequences of restructuring on performance have been
neglected.
In the literature on "divestment," downsizing is not
addressed. Divestment could be part of an overall downsizing
strategy, but it is not seen that way in the literature on
divestment. Downsizing and divestment appear to be separate
and distinct concepts.
There is a body of literature on "downsizing practices."
Most is at the individual and group level, rather than the
organizational level. Theoretical frameworks are lacking in
the downsizing practices literature. At the same time, there
is little empirical support offered. Another problem in the
downsizing practices literature is that there are no explicit
conceptualizations of downsizing; often, downsizing is
43

discussed in very general terms. The relationship between
downsizing practices and performance has scarcely been
considered. Overall, there is scant scholarly and systematic
research in the area of downsizing practices, and downsizing
in general.
44
CHAPTER III
RATIONALE
The Point at the End of the Cornucopia
The previous literature review may be thought of as a
vast cornucopia of ideas and information related to the
concept of downsizing. There are many yet unresolved
questions about downsizing, including how to study this
phenomenon, and whether (or under what conditions) downsizing
has a positive or negative effect on organizational
profitability. There has been very little systematic and
scholarly research on downsizing. In the words of Cameron,
Freeman, and Mishra (1993),
...it is because of the underdeveloped downsizing theory that investigators should first adopt a theory-building approach as opposed to a theory-testing approach. That is, because no current theories exist regarding organizational downsizing or its association with successful performance, an important first step in research is to identify patterns, relationships, and dynamics rather than to set forth a theory for testing, (p. 28, italics added)
Cameron, Freeman, and Mishra (1993) have set forth
several research questions for current downsizing research,
one of which is the basis for this study, namely: "what is
the impact of downsizing on the organization?" Cameron,
Freeman, and Mishra (1993) state
... almost no empirical studies have empirically investigated the effectiveness of (these) prescriptions. The question of whether
45
organizational downsizing inhibits or enhances organizational performance has largely remained unaddressed, as has the more precise question of which particular downsizing processes are helpful and which are hurtful, (p. 30)
The study attempts to answer the question of whether
organizational downsizing inhibits or enhances organizational
performance.
In the study, organizational downsizing is defined and
characterized as an intentional set of activities designed to
improve organizational performance, and involving reductions
in personnel (Cameron, Freeman, & Mishra, 1993). Downsizing
is considered conceptually distinct from organizational
decline (Cameron, Freeman, & Mishra, 1991, 1993; DeWitt,
1993; Kozlowski, Chao, Smith, & Hedlund, 1993; McKinley,
1993) . According to Cameron, Freeman, and Mishra (1993),
downsizing is strategic in nature, and its purpose is to
improve organizational performance. In the study, the
performance effects of downsizing are studied using a multi-
year, multi-organizational data base. The study includes an
empirical investigation of the performance implications of
downsizing, based on a tentative model. The study does not
test hypotheses, as there is not enough testable theory on
organizational downsizing at this point in time. Instead,
the study contributes to the field by providing systematic
research results for future theory building.
46

DeWitt (1993) suggests that research on downsizing
should be longitudinal, and across- and within-organizations.
The study is longitudinal, as organizations are investigated
over a period of time and the secondary databases provide a
view across organizations.
The study of organizational downsizing has not
explicitly been characterized in terms of level of analysis.
On one hand, most of the popular press information seems to
have been concerned with the corporation as a whole, or with
displaced workers (e.g., see Byrne, 1994). On the other
hand, much of the anecdotal evidence on how to downsize
appears to be at the SBU or site level (e.g., see Hardy,
1987) . A very interesting study by Baily, Bartelsman, and
Haltiwanger (1994) investigated the relationship between
downsizing and productivity, comparing results at the
aggregate industry level versus the disaggregated plant
level. The aggregrate data across the U.S. manufacturing
sector showed falling employment and rising productivity.
However, when the plant level data were examined, there were
both successful and unsuccessful (in terms of increased
productivity) plants that downsized. The Baily, Bartelsman,
and Haltiwanger (1994) study is the only research reviewed
that controlled for industry and other factors (e.g.,
industry, size, region, wages, and ownership type) when
looking at organizational effectiveness. However,
profitability was not addressed. The Baily, Bartelsman, and
47

Haltiwanger (1994) study brings up interesting questions
about downsizing research, including level of analysis
issues.
Based on the literature reviewed, and Rumelt's (1991)
study of industry, corporate, and SBU effects on
organizational profitability, the study investigates the
impact of downsizing on both corporate and SBU profitability,
while controlling for factors that have been shown to affect
profitability. Industry conditions and corporate strategy,
as well as SBU strategy, are included as control measures.
Research Strategy
The research strategy is to use large data bases
(COMPUSTAT Annual Industrial Files and the Industry Segment
Database) to both identify and measure the impact of
downsizing. There are multiple measures of benefits
(performance measures) at a time period starting at a point
from zero (the year of the downsizing) to five years after
the downsizing event. Aside from the direct relationship
between downsizing and corporate performance, there are two
classes of control variables--market conditions and corporate
strategy. The primary analytical tool for building the
theoretical model is the use of pooled cross-section
regression analysis, and also time-series regression
analysis.
48
CHAPTER IV
METHODOLOGY
This chapter presents the data analyzed in this study,
the definition and operationalization of the variables, the
analytical method to be used (multiple regression analysis),
the formulation of the empirical model, and strengths and
limitations of this study.
Data
This section discusses the data used in this study. The
data used in this study is taken from the COMPUSTAT^ II
Business Information Industry Segment and the COMPUSTAT^
Annual Industrial Files. The COMPUSTAT^ Annual Industrial
Files provide financial information at the consolidated
corporate level. The data on the COMPUSTAT^ II Business
Information Industry Segment File were disclosed due to
requirements of the Financial Accounting Standards Board
(FASB) Issued Statement of Financial Accounting Standards
Number 14, Financial Reporting for Segments of a Business
Enterprise (SFAS No. 14). The data are compiled from the
corporations' annual reports and 10-K reports to the
Securities and Exchange Commission (SEC). Corporations are
required to provide information on their principal lines of
business (industry segments).
49

The FASB defines a segment as "a component of an
enterprise engaged in providing a product or service or a
group of related products and services that are sold
primarily to unaffiliated customers (i.e., customers outside
the enterprise) for a profit" (Davis & Duhaime, 1992, p.
512). The unit of observation is the line of business.
The COMPUSTAT II Industry Segment file contains multiple
years of information for each company, and there may be up to
ten industry segments reported per year per company. There
are approximately 7 000 companies in the database.
Each corporation is required to report information on
segments that account for at least ten percent of
consolidated sales, operating profits, or assets. Each line
of business is required to report the following information:
net sales, operating profit or loss, depreciation, capital
expenditures, identifiable assets, equity in earnings of
unconsolidated subsidiaries, investments at equity, number of
employees, order backlog, and research and development
expenditures (company and customer sponsored).
Industry and corporate identification is possible for
all business units, as a 4-digit SIC code and a corporation
code is assigned to each industry segment. SIC codes of
0100-1999 (raw materials), 2000-3999 (manufacturing), and
4000-9999 (service) are represented in the database. This
study uses data from corporations that operate primarily in
the manufacturing sector (SIC codes 2000-3999).
50

An important advantage of the COMPUSTAT II Industry
Segment database is its disaggregation of corporate data to
study multibusiness corporations at the unit of business
level. This database has been shown to be appropriate for
use on research of strategic diversity, industry trends, and
vertical integration (Davis & Duhaime, 1992). The use of the
COMPUSTAT II Industry Segment database in conjunction with
the COMPUSTAT Annual Industrial Files will allow the
calculation of the weighted averages of SBU level data for
the market and corporate strategy control variables.
Another advantage of the COMPUSTAT II Industry Segment
database is the industry comprehensiveness due to the SEC and
FASB requirements, providing a representative sample of major
public corporations of most economic sectors.
Performance Measures
Corporate economic performance has been measured by a
variety of approaches, including accounting-based measures,
such as return on assets (ROA), return on equity (ROE), and
return on sales (ROS); market-based measures, such as
Jensen's alpha; and hybrid measures, such as Tobin's q (a
ratio of market value to replacement costs). In this study,
corporate economic performance is measured in two ways. One
is the accounting-based profitability measure, ROA, due to
its year to year stability in the COMPUSTAT data (Hill, Hitt,
Sc Hoskisson, 1992) . The second is an approximation of
51

Tobin's q, market to book equity. The ROA and Tobin's q
approximation performance variables are measured zero to five
years after the downsizing action occurred.
Return on Assets
Return on assets is defined as operating income divided
by total assets. However, there has been some criticism of
the validity accounting-based measures (Lubatkin & Shrieves,
1986). Therefore, corporate economic performance will also
be measured using the hybrid Tobin's q proxy.
Tobin's q
Tobin's q combines security market data and accounting
data to provide a long run measure of corporate economic
performance (Lindenberg & Ross, 1981; Montgomery &
Wernerfelt, 1991). The market value of debt is difficult to
obtain, so a proxy of Tobin's q (market to book assets) is
often used in strategy research (Bowman, 1980). Amit and
Livnat (1988) used another approximation of Tobin's q (market
to book equity) that is generally constructable from
COMPUSTAT files. The Tobin's q approximation (market to book
equity) used for this study is defined as the share price at
year's end multiplied by the number shares outstanding, then
divided by shareholder's equity.
Business unit economic performance is measured as
profitability (ROA or operating income of the SBU divided by
52

total assets of the SBU). There is no market data for
strategic business units, since they have no stock nor
shareholders themselves (market data are aggregated at the
corporate level).
The dependent variables are lagged for periods of time
after the downsizing action occurred.
Downsizing Measures
The operationalization of the downsizing measure is
discussed in this section. In this study, for corporations
only (not for SBU's), it is not possible to distinguish
between a change in the number of employees due to
divestiture as opposed to the direct elimination of
employees. In other words, the situation where the number of
employees drops due to the selling off of a strategic
business unit, for example, is not differentiated from the
situation where the n\m±>er of employees decreases
dramatically, but without a sell-off.
In this study, downsizing is operationalized as
percentage change in the number of employees from one year to
another. As several years are included in the model for a
given corporation, the regression parameter (and t-value) for
the percentage change in the number of employees will provide
insight into the change in the various performance criteria
listed above.
53

Control Measures
Since the antecedents of organization economic
performance are so varied and comprehensive, there are three
groups of independent variables for each set of regression
equations (with dependent variables of corporate ROA,
corporate Tobin's q approximation, and business unit ROA).
The independent variables used include industry structure
variables, corporate strategy variables, and business unit
strategy variables, since it has been shown that industry,
corporate, and SBU effects all have an impact on ROA (Rumelt,
1991).
Industry Conditions
Industry profitability, industry growth, and industry
concentration represent industry structure (Christensen &
Montgomery, 1981) in this study.
Industry Profitability. Industry profitability is
defined as industry operating income divided by total
industry assets.
Industry Growth. Industry growth is defined as total
industry sales in yeart minus total industry sales in yeart-i,
divided by total industry sales in yeart-i.
Industry Concentration. Industry concentration is
defined as the sum of the sales of the four largest firms in
the industry divided by total industry sales.
54
Corporate Strategy
Corporate strategy is measured as degree of
diversification.
Degree of Diversification. Degree of diversification is
measured as an unweighted, SIC-based, continuous
diversification measure based on narrow and broad product
counts (Lubatkin, Merchant, & Srinivasan, 1993; Varadarajan &
Ramanujam, 1987) .
Business Level Strategy
Ramanujam and Venkatraman (1984) have identified several
variables that measure business-level strategy. In this
study, business-level strategy is measured as advertising
intensity (for a subsample for which these data are
available) , capital intensity, R&D intensity (for a subsample
for which these data are available), and SBU number of
employees, including the downsizing measure.
Advertising Intensity. Advertising intensity is
considered to be representative of differentiation strategies
(Porter, 1980, 1985). Advertising intensity is usually
measured by advertising expenditures divided by total SBU
sales; however, in this study, those data are not available
at the business level. Instead, a corporate proxy can be
calculated using the consolidated corporate advertising
expenditures divided by corporate consolidated sales.
55

Unfortunately, advertising expenditures are not always
reported, so the sample size is reduced when this variable is
included. Therefore in this study, the regression equations
are run both without the advertising intensity variable (for
a large sample size), and with the advertising intensity
variable (a limited sample).
Capital Intensity- Capital intensity represents
production and investment strategy and cost position.
Capital intensity is measured as total SBU assets divided by
total SBU sales.
R&D Intensity. Research and development (R&D) intensity
is also considered to be representative of differentiation
strategies (Porter, 1980, 1985). R&D intensity is measured
as total SBU R&D expenditures (customer and company
sponsored) divided by total SBU sales. The disadvantage to
using R&D intensity is that it reduces the sample size
drastically, as many companies do not report these
expenditures (Hoskisson & Johnson, 1992; Hill, Hitt, &
Hoskisson, 1992). Therefore in this study, the regression
equations are run both without the R&D intensity variable
(for a large sample size), and with the R&D intensity
variable (a limited sample).
56
Method of Analysis
The statistical analyses performed in this study are
based on multiple regression techniques (Neter, Wasserman, &
Kutner, 1989). Since the data in this study cover several
years, and they are pooled, parts of this study can be called
a pooled, time-series, cross-sectional analysis.
The time-series cross-sectional regression analysis is
done with the SAS/ETS (econometric package) VAX software.
The SAS procedure is TSCSREG, which is specifically written
for panel data sets made up of observations in a time series
(7 years for this study), over a particular number of cross-
sectional units (corporations or SBU's in this study). The
econometric model upon which the TSCSREG procedure is based
is as follows:
p
y i t = E XitkPk + JLAit i = l / - - w N; t = l , . . . , T k = l
where N is the number of cross sections, T is the length of
the time series for each cross section, and p is the number
of exogenous variables. The error structure used is the
variance components (or error components) model,
ILiit = t i + et + Cit
with the Fuller-Battese method used to estimate this model.
The fitting-of-constants method is used to estimate the
variance components, and generalized least squares (GLS) are
used to estimate the regression parameters.
57
The TSCSREG procedure requires that all cross sections
(in this study, corporations and SBU's) have the same number
of time periods (contiguous time sequence; 7 years in this
study), and that there is no missing data for any variable.
These requirements reduced the data sets for this study,
depending on which independent variables are in each model,
and on which corporations and SBU's were in the data for all
seven years (see Table 5.6 for the number of corporations and
SBU's). The TSCS regressions were run for models that (1)
included all the independent variables discussed earlier, (2)
included all except R&D intensity, (3) included all except
advertising intensity, and (4) included all except R&D
intensity and advertising intensity.
The other analyses in this study (e.g., datasets with
downsizers only) were done using the SAS regression
procedure, which is not time series.
Kmpiriral Model
The corporate model is specified as:
Corporate Economic Performance = [Industry Structure] +
[Corporate Strategy] +
[Downsizing] +
[SBU Strategy].
More specifically,
Y = bo + biXi + baXs + bsXs + hA + 5X5 + beXg + b7X7 + bgXe + e
58

where,
Y = corporate economic performance (ROA; Tobin's q
approximation, market
to book equity)
Xi = industry concentration
X2 = industry growth
X3 = industry profitability
X4 = level of diversification
X5 = corporate downsizing Xe = advertising intensity (for a subsample)
X7 = capital intensity
XQ = R&D intensity (for a small subsample)
e= error term.
The strategic business unit model is specified as:
SBU Economic Performance = [Industry Structure] +
[Downsizing] +
[SBU Strategy].
More specifically,
YsBu = bo + biXi + b2X2 + 103X2 + b4X4 + bsXB + bgXe + hjXj + e
where,
YsBu = SBU economic performance (ROA)
Xi = industry concentration of the industry in which the
SBU operates X2 = industry growth of the industry in which the SBU
operates X3 = industry profitability of the industry in which the
SBU operates Xg = SBU downsizing
X7 = advertising intensity of the SBU (for a subsample)
Xg = capital intensity of the SBU
X9 = R&D intensity of the SBU (for a small subsample)
e= error term.
59

CHAPTER V
DATA ANALYSIS
This chapter presents the results of the descriptive and
regression analyses in this study. These results are
presented in four sections. The first section presents the
descriptive statistics for the data used in the regression
analyses. The second section shows the time series cross-
sectional (TSCS) regression results, at the SBU and corporate
levels. Both concurrent and lagged equations are presented.
The third section shows the regression models where the base
year ROA and/or TOBQ are used as independent variables with
downsizing for a series of lagged dependent measures. The
fourth section presents the pooled cross-sectional regression
results (not time series) for all models, including SBU and
corporate equations, with concurrent and lagged dependent
measures.
Dpsrriptive Statistics
The means and standard deviations for the data sets used
for the regression analyses are shown in Tables 5.1 and 5.2.
Descriptive statistics are given for entire data sets (from
which the time series cross-sectional data sets are
constructed) and data sets of those SBU's and corporations
that have downsized. The following statistics are for the
SBU level data (Table 5.1). First presented are those for
60
the entire dataset. The mean SBU profitability (ROA) is
0.0245. For industry structure variables, the mean for
industry concentration (INDCN) is 0.7730, for industry growth
(INDGR) is 1.7165, and for industry profitability (INDPR) is
0.0951. The mean for downsizing (DS) is 0.0814. For
business level strategy variables, the mean for capital
intensity (CAPINT) is 5.7350, the mean for advertising
intensity (ADVINT) is 0.0354, and the mean for research and
development intensity (RDINT) is 0.3799.
The second part of Table 5-1 presents the statistics for
the downsizers only dataset. The mean SBU profitability
(ROA) is -0.0419. For industry structure variables, the mean
for industry concentration (INDCN) is 0.7576, for industry
growth (INDGR) is 0.4032, and for industry profitability
(INDPR) is 0.0633. The mean for downsizing (DS) is -0.0557.
For business level strategy variables, the mean for capital
intensity (CAPINT) is 4.7757, the mean for advertising
intensity (ADVINT) is 0.0358, and the mean for research and
development intensity (RDINT) is 0.2201.
The next set of statistics are for the corporate level
data (Table 5.2) . The first part of the table is for the
entire dataset. The mean corporate profitability (ROA) is
0.0856. The mean corporate Tobin's Q (TOBQ) is 2.4366. For
industry structure variables, the mean for industry
concentration (INDCN) is 0.8718, for industry growth (INDGR)
is 0.1482, and for industry profitability (INDPR) is 0.1040.
61
The mean for downsizing (DS) is 0.0679. For business level
strategy variables, the mean for capital intensity (CAPINT)
is 1.3320, the mean for advertising intensity (ADVINT) is
0.0383, and the mean for research and development intensity
(RDINT) is 0.2223. For the corporate strategy variable
diversification (DIVER), the mean is 7.9503.
The second part of the Table 5.2 is for the downsizers
only dataset. The mean corporate profitability (ROA) is
0.0500. The mean corporate Tobin's Q (TOBQ) is 1.6463. For
industry structure variables, the mean for industry
concentration (INDCN) is 0.8773, for industry growth (INDGR)
is 0.1307, and for industry profitability (INDPR) is 0.0991.
The mean for downsizing (DS) is -0.0374. For business level
strategy variables, the mean for capital intensity (CAPINT)
is 1.1872, the mean for advertising intensity (ADVINT) is
0.0396, and the mean for research and development intensity
(RDINT) is 0.1297. For the corporate strategy variable
diversification (DIVER), the mean is 7.9876.
Correlation tables are shown in Tables 5.3 and 5.4.
Table 5.5 shows the number of SBU's and corporations per
year), and Table 5.6 shows how many SBU's and corporations
have how many years of data.
62
Time Series Cross-Sectional (TSCS) Regression Analysis
The time series cross-sectional (TSCS) regression were
run at the SBU level (ROA as the dependent variable) , and at
the corporate level (ROA and TOBQ as dependent variables).
Four different models for each regression equation (SBU-ROA,
CORP-ROA, and CORP-TOBQ) were run to increase the sample
size; i.e., one model with all independent variables
included, one with ADVINT excluded, one with RDINT excluded,
and one with both ADVINT and RDINT excluded.
SBU Level Results
Tables 5.7-5.14 show the regression parameter estimates
(if significant at the .05 level or better, in most cases)
and the p-values for the SBU level data, for the concurrent
and lagged dependent measures.
All Variables (Tables 5.7 and 5.8). The models
containing all the variables (ROA as dependent variable, and
DS, ADVINT, CAPINT, RDINT, INDCN, INDGR, INDPR as independent
variables) for the SBU level data had very few observations
(4 to 8 SBU's, over 3 to 6 years depending on the lag period,
yielding only 24 to 30 observations). Therefore, caution
must be observed in reaching conclusions based on these data.
It can be seen that the downsizing variable is significant
(p-value .06 for the concurrent equation and .05 for the Lag
1 equation) and negative (-0.16 for no lag and -0.14 for Lag
63

1) for the concurrent and the Lag 1 equations only. None of
the other independent variables are significant. The
downsizing variable is insignificant in the Lag 2 and Lag 3
equations, suggesting that the slight but negative impact of
downsizing on SBU performance (ROA) can be seen only in the
year in which the downsizing occurs, and the year after the
downsizing action. ADVINT, CAPINT, and INDCN have a
significant and positive impact on SBU ROA in the second year
after downsizing occurs. CAPINT remains significant, and
INDGR is significant (and negative) in the third year after
downsizing occurs.
Advertising Intensity Excluded (Tables 5.9 and 5.10).
The number of SBU's in the models containing RDINT, but not
ADVINT, range from 66 to 97 SBU's (over 3 to 6 years and from
291 to 415 observations). Downsizing has a significant and
negative impact on SBU ROA in the year of the downsizing (p-
value .0001, parameter estimate -0.20) and in the next year
after the downsizing action (p-value .0004, parameter
estimate -0.11), but not in the second year after downsizing.
However, the DS significance returns (p-value .007, parameter
estimate -0.09) in the third year after downsizing occurs.
CAPINT has a significant and small positive impact on SBU ROA
(concurrent equation only), while RDINT has a significant and
diminishing negative impact (no lag. Lag 1, and Lag 2
64
equations). INDPR becomes significant (positive) in the Lag
2 and Lag 3 equations.
R and P Intensitv Excluded (Tables 5.11 and ^.^7) The
number of SBU's in the models containing ADVINT, but not
RDINT, range from 115 to 129 SBU's (over 3 to 6 years and
from 387 to 690 observations). Downsizing has a significant
(p-value .01) and small negative (parameter estimate -0.02)
impact on SBU ROA in the year of the downsizing action only.
The DS variable is insignificant for the Lag 1 and Lag 2
equations, and then is significant (p-value .01) and positive
(parameter estimate 0.04) in the Lag 3 equation, suggesting
that the negative impact of downsizing on SBU profitability
washes out over two years, and then goes to a small positive
impact. ADVINT is significant and negative in the concurrent
equation only. CAPINT is significant and negative in the no
lag. Lag l and Lag 3 equations. INDPR is significant and
positive in all of the equations (no lag. Lag 1, Lag 2 , and
Lag 3).
ADVINT and RDINT Excluded (Tables 5,13 and 5,14), The
number of SBU's in the models excluding both ADVINT and
RDINT, is 993 SBU'S (over 3 to 6 years and from 2979 to 5958
observations). Downsizing has a significant and small
negative impact on SBU ROA in the year of the downsizing (p-
value .0001, parameter estimate -.05) and the next year (p-
value .03, parameter estimate -.01) only. DS is
65

insignificant in the Lag 2 and Lag 3 equations, showing a
diminishing negative impact of downsizing on SBU performance.
INDPR is significant (p-value .0001) and positive in all
equations (no lag. Lag 1, Lag 2, and Lag 3). CAPINT is
significant and negative (although very small) in the lagged
equations. INDCN is significant and positive in the Lag 2
equation only.
Corporate Level Results
Tables 5.15-5.26 show the regression parameter estimates
(if significant at the .05 level or better,) and the p-values
for the corporate (CORP) level regressions, for the
concurrent and lagged dependent measures. Corporate
performance measures used are ROA and Tobin's Q (TOBQ).
All Variables - ROA (Tables 5.15 and 5.16). The models
containing all the variables (ROA as dependent variable, and
DS, DIVER, ADVINT, CAPINT, RDINT, INDCN, INDGR, INDPR as
independent variables) range from 156 to 193 corporations
(over 3 to 6 years and from 579 to 936 observations)..
Downsizing has a significant and negative impact on CORP ROA
in the year downsizing occurs, and for the following two
years (no lag p-value .0001, parameter estimate -0.06; Lag 1
p-value .0001, parameter estimate -0.06; Lag 2 p-value .02,
parameter estimate -0.03). DS is no longer significant in
the third year. As in the SBU equations, downsizing has a
66
negative effect on profitability. However, the effect
continues to be seen for 2 years after downsizing for
corporations, versus only one year after downsizing for
SBU'S. RDINT, CAPINT, and INDCN are all significant and
negative for all concurrent and lagged regressions. INDPR is
significant and positive for all concurrent and lagged
equations. Diversification (DIVER) does not have a
significant impact on CORP ROA in any of the equations, when
all variables are present.
Advertising Int. Excluded - ROA (Tables 5.17 and 5.18).
The number of corporations in the models containing RDINT,
but not ADVINT, range from 411 to 455 corporations (over 3 to
6 years and from 1365 to 2466 observations) . Downsizing has
a significant and negative impact on CORP ROA in the
concurrent (p-value .0001, parameter estimate -0.03) and the
Lag 1 (p-value .001, parameter estimate -0.02) equations.
The downsizing effect is seen only in the year of, and the
year after it occurs. RDINT is significant and negative in
the no lag equation, but significant and positive in the Lag
1 and Lag 2 equations. CAPINT is significant and negative in
the no lag and Lag 2 equations. INDCN is significant and
negative in only the Lag 1 and Lag 2 equations. INDPR is
significant and positive in all concurrent and lagged
regressions. DIVER is significant and positive for the no
lag. Lag l, and Lag 3 equations (DIVER is significant and
67
negative in Lag 2); however, the parameter estimates are very
small in all cases (around .001).
R and D Intensity Excluded - ROA (Tables 5.19 and 5.20).
The number of corporations in the models containing ADVINT,
but not RDINT, range from 236 to 295 corporations (over 3 to
6 years and from 885 to 1416 observations) . Downsizing is
significant (p-value .0001) and negative (parameter estimate
-.02) for the concurrent equation, and significant (p-value
-03) and positive (parameter estimate .01) in the Lag 3
equation. DS is not significant in either the Lag 1 or Lag 2
equations. Again, it appears that downsizing has a
significant, although small, negative effect on corporate ROA
lasting a short while only, later going to a very small
positive effect. ADVINT is significant and negative in the
concurrent equation only. CAPINT is significant and negative
in all concurrent and lagged equations. INDCN is significant
and negative in the concurrent and the Lag 2 equations.
INDPR is significant and positive in all concurrent and
lagged equations. DIVER is significant and positive (small
values of around .002) for the concurrent. Lag 2, and Lag 3
equations. INDGR becomes significant and positive in the Lag
2 and Lag 3 equations.
ADVTNT and pnTNT ExcJiidPd - ROA (Tables 5.21 and 5,22).
The number of corporations in the models excluding both
ADVINT and RDINT, range from 664 to 7 04 corporations (over 3
68
to 6 years and from 2112 to 3984 observations). Downsizing
has a significant and small negative impact on CORP ROA in
the concurrent year (p-value .002, parameter estimate -.009)
and the year following the downsizing (Lag l, p-value .04,
parameter estimate -.006) only. The effect of downsizing on
corporate profitability again seems to wash out after a
relatively short time. DIVER is significant (p-values .001
to .003) and positive (parameter estimates .002) for all
concurrent and lagged regressions. INDPR is also significant
and positive for all concurrent and lagged equations. INDGR
becomes significant and positive (very small values) in the
Lag 2 and Lag 3 equations. CAPINT is not significant in the
no lag and Lag 2 equations, but significant and positive for
Lag 1 and significant and negative for Lag 3.
All variables - TOBQ (Tables 5.15 and 5.23). The models
containing all the variables (TOBQ as dependent variable, and
DS, DIVER, ADVINT, CAPINT, RDINT, INDCN, INDGR, INDPR as
independent variables) range from 156 to 192 corporations
(over 3 to 6 years and from 57 6 to 936 observations).
Downsizing has a significant (p-value .001) and negative
impact (parameter estimate -1.04) on CORP TOBQ in the year
downsizing occurs, is insignificant for the following two
years (Lag 1 and Lag 2), and is significant (p-value .04 and
positive (parameter estimate 2.02) in the third year (Lag 3).
RDINT is significant and positive for only the Lag 2
69

equation. CAPINT is significant and negative for the Lag 2
and Lag 3 equations. INDPR is significant and positive for
the concurrent and Lag l and Lag 3 equations.
Diversification (DIVER) does not have a significant impact on
CORP TOBQ in any of the equations, when all variables are
present.
Advertising Int. Excluded - TOBO (Tables 5.17 and 5.24).
The number of corporations in the models containing RDINT,
but not ADVINT, range from 411 to 454 corporations (over 3 to
6 years and from 1362 to 2466 observations) . Downsizing has
a significant and negative impact on CORP TOBQ in the
concurrent (p-value .0001, parameter estimate -1.29) equation
only. The downsizing effect is seen only in the year of the
downsizing action. RDINT is not significant for any of the
equations. CAPINT is significant and positive in the no lag
and Lag 1 equations. INDGR is significant and positive in
only the Lag 1 equation. INDPR is significant and positive
(values from 12.65 to 6.13) in all concurrent and lagged
regressions. DIVER is significant and negative (values
around -.03) for the no lag and Lag 2 equations.
p nri n Tnt. Fvrindpd - TOBO (Tables 5.19 and 5.25).
The number of corporations in the models containing ADVINT,
but not RDINT, range from 236 to 291 corporations (over 3 to
6 years and from 87 3 to 1416 observations). Downsizing is
not significant for any of the concurrent or lagged
70
regressions. ADVINT is significant and positive (values
around 9) in the Lag 2 and Lag 3 equations only. CAPINT is
insignificant for all equations. INDPR is significant and
positive (values from 13 to 8) in all concurrent and lagged
equations. DIVER is insignificant for all equations.
ADVINT and RDINT Excluded - TOBQ (Tables 5-21 and 5.26).
The number of corporations in the models excluding both
ADVINT and RDINT, range from 664 to 7 00 corporations (over 3
to 6 years and from 2100 to 3984 observations). Downsizing
is not significant for any of the concurrent or lagged
equations, nor is DIVER. INDCN is significant and negative
(values from -3.3 to -5-4) for all concurrent and lagged
equations. INDPR is significant and positive for the
concurrent and Lag l equations.
BasP Year ROA or TOBQ as Independent Variables
The following results were obtained by "subsuming" all
the independent variables for each regression equation into
the base year (year of the downsizing) dependent variable.
The base year ROA or TOBQ was then used along with the
downsizing variable as another independent variable. The
dependent variables for this analysis were the lagged ROA and
TOBQ (for one through five years after the downsizing
occurred). Tables 5.27-5.29 show the results of the
following regressions.
71
SBU Level Results (ROALAGS = DS + ROA) (Table 5-27)
Five lag periods were tested; the base year ROA was
significant at the .0001 level for all of the lag periods.
However, downsizing was significant (p-value .03) and
negative (parameter estimate -.086) for only the Lag 3
equation. Downsizing had a small negative effect on SBU ROA
that appears three years after the downsizing action, and
then extinguishes thereafter.
Corporate Level Results (ROALAGS = DS + ROA) (Table 5.28)
Of the five lag periods tested, the base year ROA was
significant at the .0001 level for the first four of the lag
periods. However, downsizing was not significant for any of
the equations. This set of equations show no effect of
downsizing on CORP ROA for one through five years after the
downsizing occurs.
Corporate Level Results (TPOBQLAGS = DS + TOBO) (Table 5.29)
Again, five lag periods were tested; the base year TOBQ
was significant for the Lag l and Lag 5 equations.
Downsizing was significant (p-value .02) and positive for
only the Lag 4 (parameter estimate 1.9) and Lag 5 (parameter
72

estimate 10.47) regressions. Downsizing had a positive
effect on CORP TOBQ that only appears four and five years
after the downsizing action.
Pooled Cross-Sectional Regression Results
In this set of analyses, the datasets used contained
only those SBU's or corporations which had downsized at least
by 10 percent in a particular year, including the data for up
to five years after the downsizing occurred. The lagged
equations use the variables DSP1-DSP5, showing downsizing
one to five years before the dependent measures. Note that
the DS variable is retained in all the lagged equations to
control for the current year's change in number of employees.
Concurrent and lagged (for up to five years) equations were
run for SBU ROA and corporate ROA/Tobin's Q. Three models
were used for each dependent variable (to increase sample
size), one with all variables included, one with R&D
intensity (RDINT) excluded, and another with both R&D
intensity and advertising intensity (ADVINT) excluded.
SBU Level Results
Tables 5.30-5.35 show the regression parameter estimates
(if significant at the .05 level or better) and the p-values
for the SBU level data, for the concurrent and lagged
equations.
73

All Variables (Tables 5.30 and 5.31). As with the time
series data, the models containing all the variables (ROA as
dependent variable, and DS (and DSP1-DSP5 representing
downsizing in the previous years), ADVINT, CAPINT, RDINT,
INDCN, INDGR, INDPR as independent variables) for the SBU
level data often had small numbers of observations (24 to
4171 observations, depending on the lag period). In the SBU
set of equations, the Lag 1 through 5 equations had too few
observations (0 to 7) to run. The following values are for
the concurrent equation (only 24 observations, so care must
be taken in evaluating these results). The downsizing
variable is insignificant (p-value .39). ADVINT is
significant (p-value .01) and negative (parameter estimate
-7.09). CAPINT, RDINT, INDCN, INDGR, and INDPR are
insignificant.
R and D Intensity Excluded (Tables 5.32 and 5.33). The
niomber of observations in the models containing ADVINT, but
not RDINT, range from 22 (Lag 5) to 447 (concurrent or no
lag). Downsizing is insignificant for SBU ROA in the year of
the downsizing action (DS), and for all the years (Lags 1
through 5, DSPl - DSP5) after downsizing occurred. The
control variable DS for the current year is significant and
negative for the Lag 2 equation only. CAPINT is significant
in the concurrent year only (p-value .01, parameter estimate
-.009). ADVINT, INDCN, and INDGR are insignificant for the
74
concurrent and all lagged equations. INDPR is significant
and positive in the no lag (p-value .0001, parameter estimate
.59) and Lag 2 (p-value .005, parameter estimate .7 9)
equations.
RDINT and ADVINT Excluded (Tables 5.34 and 5.35). The
number of observations in the models excluding both RDINT and
ADVINT, is from 196 (lag 5) to 4171 (no lag). Downsizing has
a significant and negative impact on SBU ROA in the year of
the downsizing (p-value .0001, parameter estimate -.08), the
next year (p-value .0001, parameter estimate -.30), Lag 2 (p-
value .0001, parameter estimate -.24), and Lag 3 (p-value
.01, parameter estimate -.18). DSP is insignificant in the
Lag 4 and Lag 5 equations. In this model without RDINT and
ADVINT, a negative effect of downsizing on SBU ROA is
sustained (but diminishing in magnitude) over three years
after the downsizing occurs, and then washes out. The
control variable DS for the current year is significant and
negative for all lagged equations. CAPINT is significant (p-
values from .0001 to .02) and negative (parameter estimates
around -.00005 to -.02) in the concurrent and Lag 1, Lag 3,
and Lag 5 equations. INDCN is significant and positive in
the Lag 5 equation. INDGR is insignificant in all equations.
INDPR is significant (p-value .0001 to .006) and positive in
all except the Lag 4 and Lag 5 equations (no lag. Lag l. Lag
2, Lag 3).
75

Corporate Level Results
Tables 5.36-5.47 show the regression parameter estimates
(if significant at the .05 level or better,) and the p-values
for the corporate (CORP) level regressions, for the
concurrent and lagged dependent measures. Corporate
performance measures used are ROA and Tobin's Q (TOBQ) .
All Variables--ROA (Tables 5.36 and 5.37). The models
containing all the variables (ROA as dependent variable, and
DS (and DSP1-DSP5 representing downsizing in the previous
years), DIVER, ADVINT, CAPINT, RDINT, INDCN, INDGR, INDPR as
independent variables) range from 27 (Lag 5) to 425 (no lag)
observations. Downsizing has a significant and negative (p-
value .003, parameter estimate -.09) impact on CORP ROA in
the year downsizing occurs only. Previous downsizing (DSPl -
DSP5) is not significant in Lags 1-5. The control variable
DS for the current year is also insignificant for all lagged
equations. RDINT is significant (p values .0001 to .001) and
negative (parameter estimates from -1.28 to -.89) for the
concurrent. Lag 1 and Lag 3 regressions. CAPINT is
significant and positive in only the no lag equation. INDPR
is significant and positive for only the concurrent and Lag 5
equations. ADVINT, INDCN, and INDGR are not significant in
any concurrent or lagged equations. Diversification (DIVER)
does not have a significant impact on CORP ROA in any of the
equations, when all variables are present.
76

R and D Tntensitv Excluded--ROA (Tables 5-38 and s 3Q)
The number of observations in the models containing ADVINT,
but not RDINT, range from 48 (Lag 5) to 680 (no lag).
Downsizing is not significant in the concurrent, nor any of
the lagged equations. The control variable DS for the
current year is significant and negative in only the Lag 2
equation. CAPINT is significant and negative in the
concurrent and Lag 3 equations. INDGR is significant and
negative in the no lag and Lag 2 regressions. INDPR is
significant and positive in the concurrent and Lag 5
equations. ADVINT and INDCN are not significant for any
concurrent or lagged equations. DIVER is significant and
positive (small values of around .005) for the concurrent.
Lag 1, and Lag 3 equations.
ADVINT and RDINT Excluded--ROA (Tables 5.40 and 5-41)-
The number of observations in the models excluding both
ADVINT and RDINT, range from 13 0 (Lag 5) to 1690 (no lag)
observations. Downsizing is not significant for the
concurrent, nor any of the lagged equations, for corporate
ROA. The control variable DS is insignificant also for all
lagged equations. DIVER is significant (p-values .0001 to
.006) and positive (parameter estimates .002 to .005) for all
concurrent and lagged regressions, except Lag 5. INDPR is
also significant and positive for the concurrent and Lag 3,
Lag 4, and Lag 5 equations. INDGR is significant and
77

negative in the no lag and Lag 2 equations. CAPINT is
significant and negative for all concurrent and lagged
regressions.
All Variables--TOBQ (Tables 5.42 and 5.43). The models
containing all the variables (TOBQ as dependent variable, and
DS (and DSP1-DSP5 representing downsizing in previous years),
DIVER, ADVINT, CAPINT, RDINT, INDCN, INDGR, INDPR as
independent variables) range from 27 (Lag 5) to 406 (no lag)
observations. Downsizing has a significant and positive
impact on CORP TOBQ in the Lag 2 (p-value .02, parameter
estimate 39.26), and the Lag 3 (p-value .003, parameter
estimate 21.07) equations. The DS control variable for the
current year is significant and negative only for the Lag l
equation. RDINT is significant and positive (as opposed to
the regressions using ROA) for the Lag 2, Lag 3, Lag 4 , and
Lag 5 equations (p-values from .0001 to .002, parameter
estimates from 17.55 to 195.72). ADVINT is significant and
negative for the concurrent equation, and then significant
and positive for the Lag 4 and Lag 5 equations. CAPINT is
significant and negative only for the Lag 5 equation. INDCN
is significant and positive for the concurrent equation only.
INDGR is significant and negative for the Lag 5 equation.
INDPR is not significant for any equation, concurrent or
lagged. Diversification (DIVER) shows a significant (and
78

positive) impact on CORP TOBQ in only the Lag 4 equation,
when all variables are present.
R and D Int. Excluded--TOBQ (Tables 5.44 and 5.45). The
number of observations in the models containing ADVINT, but
not RDINT, range from 47 (Lag 5) to 653 (no lag). Downsizing
is significant and positive for the Lag 2 (p-value .02,
parameter estimate 26.77) and the Lag 3 (p-value .02,
parameter estimate 13.34) regressions. The DS control
variable for the current year is not significant in any
lagged equation. ADVINT is significant and negative in the
concurrent equation, and significant and positive in the Lag
5 equation. CAPINT is significant and positive for only the
Lag 3 equation. INDCN is significant and positive in the
concurrent equation, and significant and negative in the Lag
1 equation. INDGR, INDPR and DIVER are not significant in
any concurrent or lagged equation.
RDINT and ADVINT Excluded--TOBO (Tables 5-46 and 5-47),
The number of observations in the models excluding both RDINT
and ADVINT, range from 126 to 1627 observations. Downsizing
has a significant and positive impact on CORP TOBQ in the Lag
2 (p-value .05, parameter estimate 7.80), the Lag 3 (p-value
.0001, parameter estimate 8.39), and Lag 5 (p-value .0007,
parameter estimate 15.60) equations. The DS control variable
for the current is not significant for any lagged equation.
CAPINT is significant and positive for all concurrent and
lagged equations, with the exception of Lag 5. INDCN is
79

significant and negative for the Lag 5 equation only. INDGR
is significant and positive for the concurrent equation, but
none of the lagged equations. INDPR is significant and
positive for the Lag 1 and Lag 5 equations. DIVER is
insignificant for all equations.
80
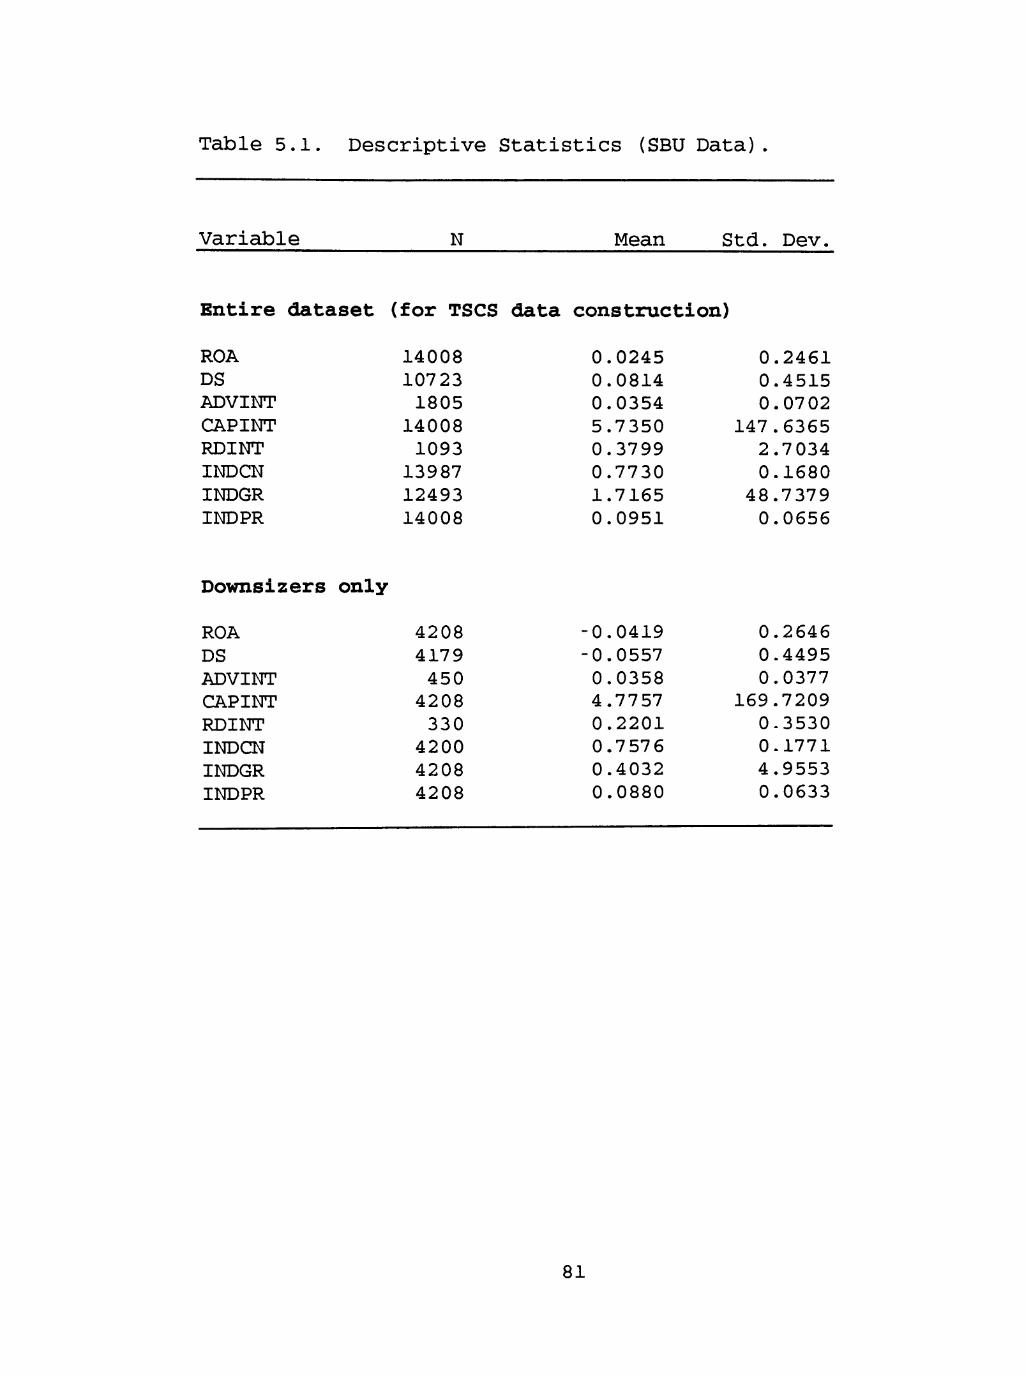
Table 5.1. Descriptive Statistics (SBU Data).
Variable N Mean Std. Dev.
Entire dataset (for TSCS data construction)
ROA DS ADVINT CAPINT RDINT INDCN INDGR INDPR
14008 10723 1805
14008 1093
13987 12493 14008
0.0245 0.0814 0.0354 5.7350 0.3799 0.7730 1.7165 0.0951
0.2461 0.4515 0.0702
147.6365 2.7034 0.1680
48.7379 0.0656
Downsizers only
ROA DS ADVINT CAPINT RDINT INDCN INDGR INDPR
4208 4179 450 4208 330
4200 4208 4208
-0.0419 -0.0557 0.0358 4.7757 0.2201 0.7 57 6 0.4032 0.0880
0.2646 0.4495 0.0377
169.7209 0-3530 0-1771 4.9553 0.0633
81

Table 5.2. Descriptive Statistics (CORP Data)
Variable N Mean Std. Dev.
Entire dataset (for TSCS data construction)
ROA TOBQ DS DIVER ADVINT CAPINT RDINT INDCN INDGR INDPR
6391 6030 5343 5830 2725 6392 4150 6396 5576 6396
0.0856 2.4366 0.0679 7.9503 0-0383 1.3320 0.2223 0.8718 0.1482 0.1040
0.1828 19.9614 0.4555 6.6101 0.0726 15.5213 8.1624 0.17 07 0.6626 0.0549
Downsizers only
ROA TOBQ DS DIVER ADVINT CAPINT RDINT INDCN INDGR INDPR
1917 1849 1910 1697 765 1917 1254 1917 1917 1917
0-0500 1.6463 -0.0374 7.9876 0.0396 1.1872 0.1297 0.8773 0.1307 0.0991
0.1584 9.4201 0.4620 6.5487 0.0466 3.8077 1.7785 0.1673 0.8305 0.0529
82
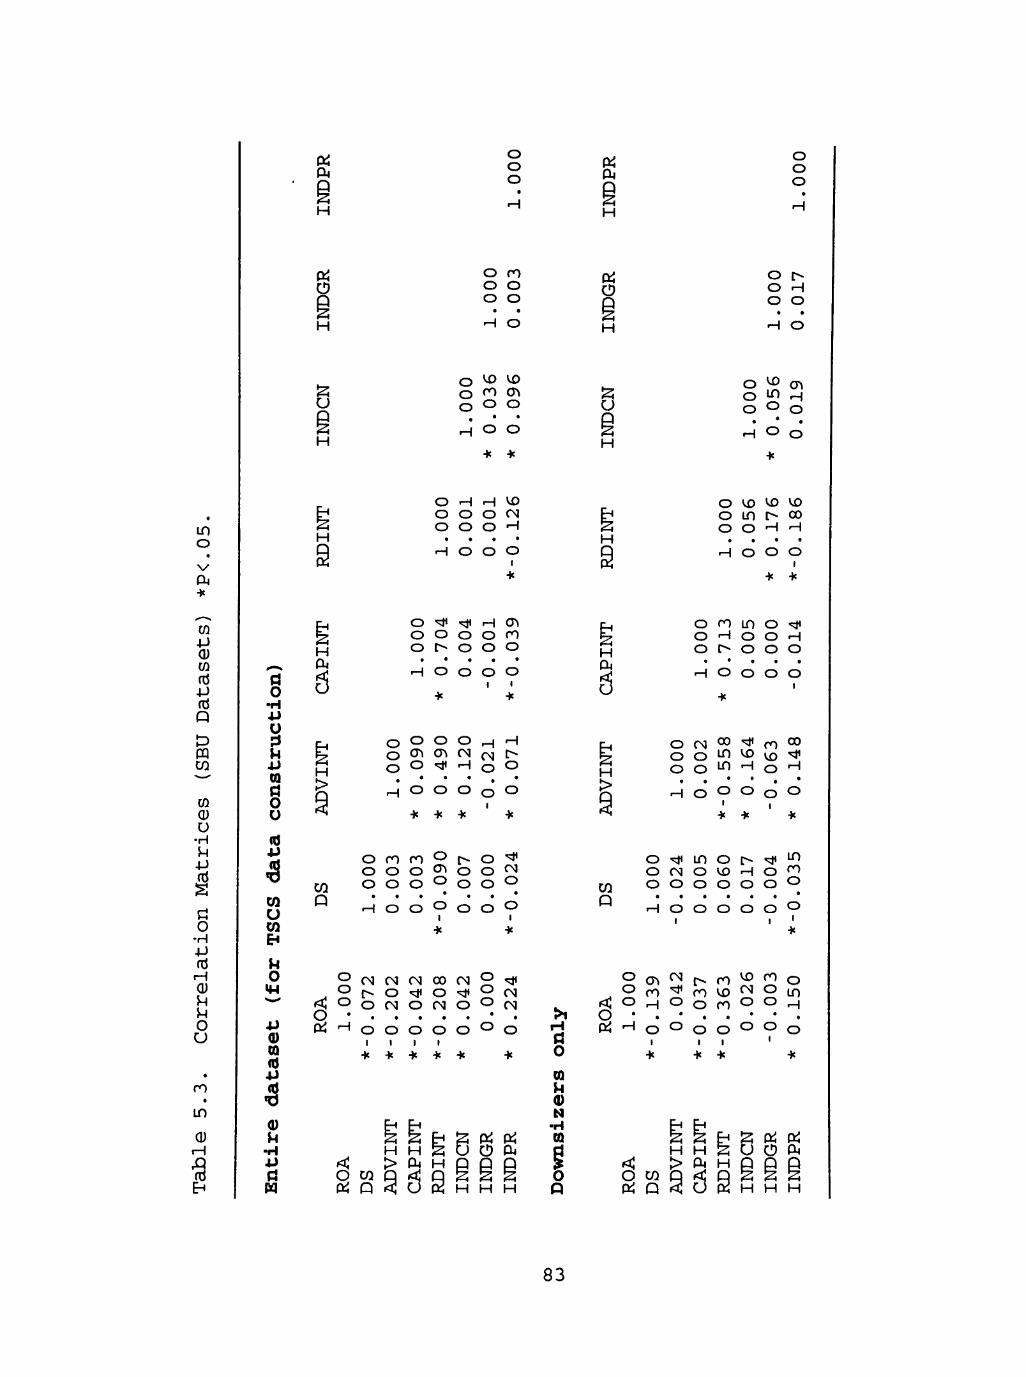
O o o
o o o
H H
H
O ro O O O O
• • H O H
o r-O H o o
H O
H
O O O o o
H O O H
o "^ en o l£J H o o o
H O O
in o
CO 4J <U CO
nJ
Q
0) u
• H }^ 4-)
a o
-H
CD }^ o u ro in
EH
o •H
o
tQ a o o <d
U CO
O
<u (d
0) M
• H
a
H
H
6
H
Q
Pi
o o o H
O o o
• H
^ O r-o
H o o
• o
^ o o o
H o o
• o
H o o o
1
vo <N H
• o
1
cr* ro o o
o o o o H •-' O <^ O^ CN o^ C^ O O -^ H O O
• • • . • H o o o o o
* * • » « *
O ro ro '^ t O ' o o o o o o ^ o o o * o o <
o o ^ o o " I I
o o o
•
03 OJ CN 00 CN r-- o ^ o -NJ* o (N o r<j o
o o o o o I I I I
o o o 03
S S EH S CK; PtJ H H s o o a<
<; > cu H p p p O W P r f j P g g g C K J P ^ U K H H H
o
(U N
•H (Q
I o p
H
H
o o o
o o o
• H
ro H t^
U) in o
• o
in o o
<X) r H
• O
o o o
vo 00 H
• o
1
^ H o
H O O O O
H 000
H
002
o
.558
o
*
.164
o
• » «
063
o 1
.148
o
*
CO p
o "^ in o t"- ^ ^ O (N O V^ H O ^ o o o o o o o
• • • • • • * H O O O O O O
I I '
Pi
o o o
CN < i : O ro ro ^ ro «X) ^ H o o ro
vo ro o
o I
o o I I
o o
o I
o in
O W Oci P
H H S > Cl< H
9 6 S
iz; ptj Di U O OJ
H H H
83

H
H
O rn "^ O IT) ^ O o H
. • • H O O
I
O H O "^ o o
CN O O
(N ro o
H O O O
13
H
H
o o o
o o o
• H
00 H O
CM ^ O
• o
o H O
in rvj o
• o
1
vo ro o
H O O O
in o v P
CQ 4-> Q) m fd j j nJ P
Ot Pi O u
CQ Q) U
• H U 4-)
(d
o •H 4-) fd
rH Q) U U O U
in
<u
EH
o • H 4J O J3
4J 00 a o u <d
^
O Ui b* U
o
0 09
(d
-H
r ,
5 H
INT
ADV
> H P
000
• H
000
•
010
• o
1
o o o
H
089
o
031
o 1
*
in 00 CTi
o
*
221
o
049
o
*
' 't • ^
o
o 036
•
o I
104
o
*
CM o o
o 010
•
o 1
63
0
o 1
*
t^ CM O
O
* 105
o
038
o
*
-^
H
CAP
INT
ADV
Pi
> H P
p
PQ o EH
O CM H in CM ^ °o O ' ^ r H O O C M t ^ f ^ o i ^ j o o o o o o . o , . . . • •
H ' O O O O O O O I , 1 1
o i n c M O " < * c r > o i t ^ c ? » O H C M v D ^ ' ; } < i n O r O o o o o o o o o o H O O O O O O O O
I I
* * -Jt * *
O r o o > t ^ r o t ^ C M V D O O o < ^ o r - c M U ) r ^ c M H c r »
< ; O O O O C M H H O O H
o C k i H O O O O O O O O O
I I I I I I I
Pti S S EH S PH PcJ a W H H S U O P 4
rilPQ > > & j H p P P
C k i E H P P ^ O S H H H
P
CQ
o EH
o o o
« H
O o o
H
H O O
• o
1
VX) 00 00
o
•X
<o H o
• o
1
CNJ <o o
o 1
cr» >x) o
• o
1
CM O O
O
t^ ro o
• o
1
<T\ H O
O
H U> l J
• o •Je
o in "^ in . in "<:d< o in CM •^ m f* f^ o o o o r i o o
o o o Q o o ' ' I '
O i n H ^ t ^ V D V D H O H O H O O r O O O O O O O O O O
H O O O O O O O I I I I I
o c r » r o c M | > o o H r o c M O C M H ' ; l i ( ^ V D H r o r O
o o o o o o o o o H O O O O O O O O
o ^ o t ^ C J ^ ^ o o o ^ ( J ^ ^ o c M
> l rH
a 0
OQ
u (D N
•H (0
0 Q
< o pti
O O O H O r O r O O O H
H O O O O O O O O O
•Je + -K * *
CtJ S S EH ^ pc! Pd
a H H H ^ u o c u rfjcQ > > a 4 H p p p o o w H p < d p s s s p t i E H P P ^ U K H H H
84

Table 5.5. Number of SBU's and Corps, by Year
Year
1985 1986 1987 1988 1989 1990 1990
SBU'S
1499 1718 1930 2048 2198 2354 2270
Number of Corporations
814 853 904 922 947 97 9 1002
85

Table 5.6. Years of Data Available For TCSC regressions.
Years of Data
1 2 3 4 5 6 7
SBU'S
440 394 372 308 272 355 993
Number of Corporations
33 34 44 38 51 64 771
86
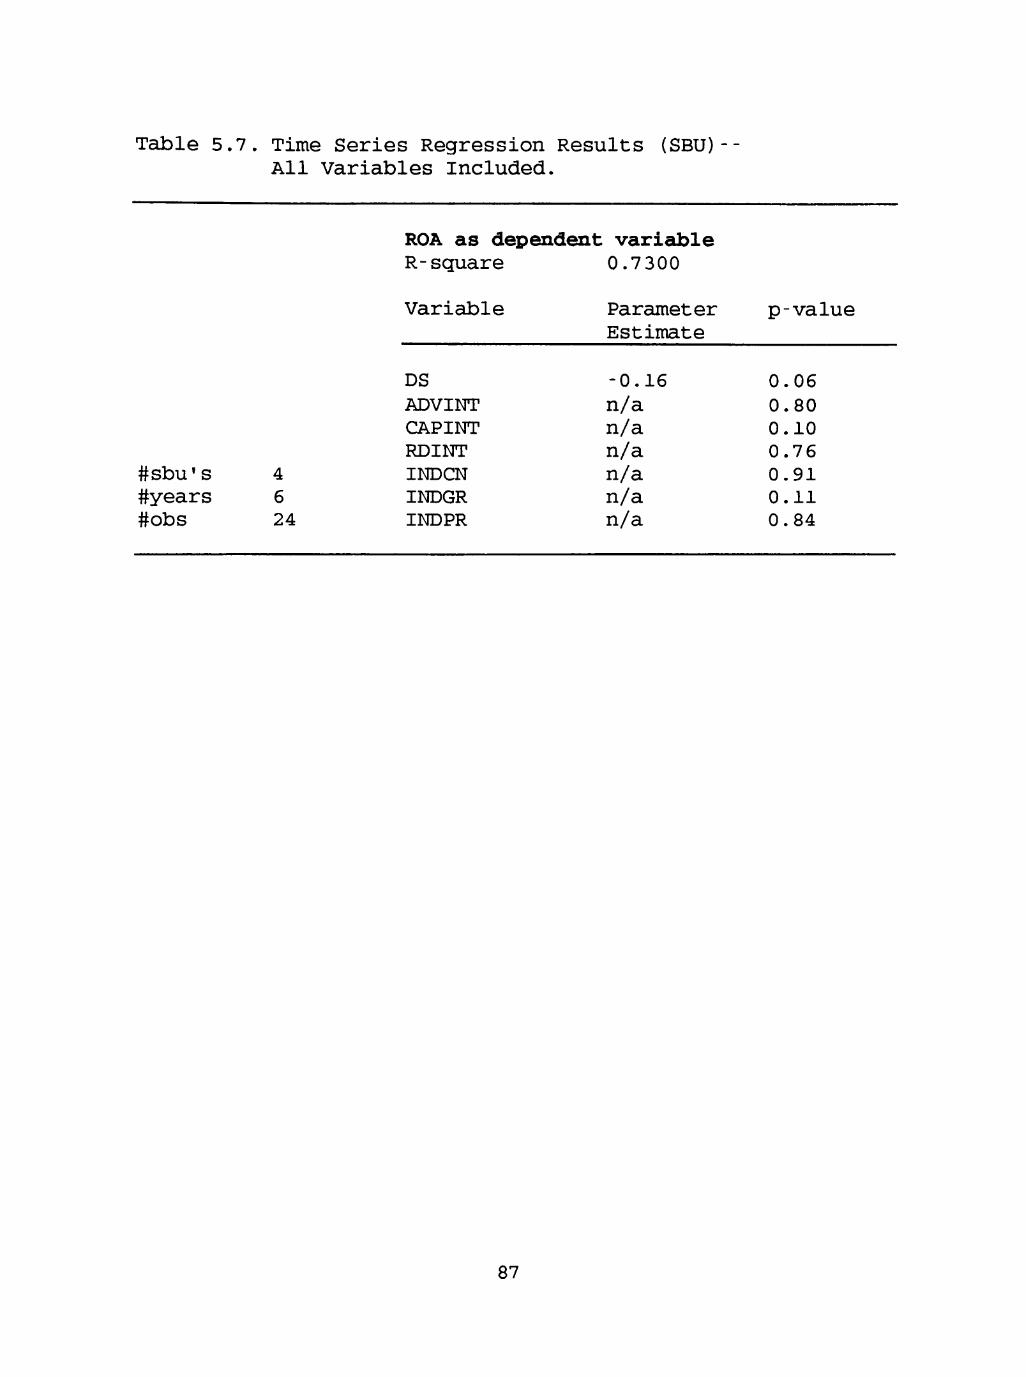
Table 5.7. Time Series Regression Results (SBU)--All Variables Included.
ROA as dependent varieible R-square 0.7 300
#sbu's #years #obs
4 6 24
Variable
DS ADVINT CAPINT RDINT INDCN INDGR INDPR
Parameter Estimate
-0.16 n/a n/a n/a n/a n/a n/a
p-value
0.06 0.80 0.10 0.76 0.91 0.11 0.84
87

Table 5.8. Lagged Time Series Regression Results (SBU)-All Variables Included. (ROA as Dependent Variable)
Lag 1 #sbu's #years #obs R-square
Lag 2 #sbu's #years #obs R-square
Lag 3 #sbu's #years #obs R-square
6 5 30 0.4751
6 4 24 0.4104
8 3 24 0.3613
Variable
DS ADVINT CAPINT RDINT INDCN INDGR INDPR
Variable
DS ADVINT CAPINT RDINT INDCN INDGR INDPR
Variable
DS ADVINT CAPINT RDINT INDCN INDGR INDPR
Parameter Estimate
-0.14 n/a n/a n/a n/a n/a n/a
Parameter Estimate
n/a 1.35 n/a n/a 0.36 n/a n/a
Parameter Estimate
n/a n/a 0.12 n/a n/a -0.20 n/a
p-value
0.05 0.08 0.71 0.11 0.15 0.39 0.35
p-value
0.70 0.04 0.06 0.13 0.05 0.70 0.11
p-value
0.09 0.60 0.05 0.09 0.28 0.04 0.69
88

Table 5.9. Time Series Regression Results (SBU) ADVINT Excluded.
ROA as dependent varieible R-square 0.2540
#sbu's #years #obs
66 6 396
Variable
DS CAPINT RDINT INDCN INDGR INDPR
Parameter Estimate
-0.20 0.05 -0.67 n/a n/a n/a
p-value
0.0001 0.0001 0.0001 0.90 0.88 0.26
89

Table 5.10. Lagged Time Series Regression Results (SBU)-ADVINT Excluded. (ROA as Dependent Variable)
Lag 1 #sbu's #years #obs R-square
Lag 2 #sbu's #years #obs R-square
Lag 3 #sbu's #years #obs R-square
83 5 415 0.0643
86 4 344 0.0535
97 3 291 0.0794
Variable
DS CAPINT RDINT INDCN INDGR INDPR
Variable
DS CAPINT RDINT INDCN INDGR INDPR
Variable
DS CAPINT RDINT INDCN INDGR INDPR
Parameter Estimate
-0.109 n/a -0.039 n/a n/a n/a
Parameter Estimate
n/a n/a -0.04 n/a n/a 0.45
Parameter Estimate
-0.085 -0.003 n/a n/a n/a 0.39
p-value
0.0004 0.30 0.03 0.6 0.44 0.29
p-value
0.30 0.75 0.02 0.26 0.78 0.03
p-value
0.007 0.09 0.15 0.21 0.92 0-04
90

Table 5.11. Time Series Regression Results (SBU)--RDINT Excluded.
ROA as dependent varieible R-square 0-1485
#sbu's #years #obs
115 6 690
Variable
DS ADVINT CAPINT INDCN INDGR INDPR
Parameter Estimate
-0.02 -0.71 -0.06 n/a n/a 0.72
p-value
0.01 0.0003 0.0001 0.11 0.64 0.0001
91

Table 5.12 Lagged Time Series Regression Results (SBU) RDINT Excluded. (ROA as Dependent Variable)
Lag 1 #sbu' s #years #obs R-square
Lag 2 #sbu's #years #obs R-square
Lag 3 #sbu's #years #obs R-square
122 5 610 0.0242
127 4 508 0.0206
129 3 387 0.0674
Variable
DS ADVINT CAPINT INDCN INDGR INDPR
Variable
DS ADVINT CAPINT INDCN INDGR INDPR
Variable
DS ADVINT CAPINT INDCN INDGR INDPR
Parameter Estimate
n/a n/a -0.03 n/a n/a 0.29
Parameter Estimate
n/a n/a n/a n/a n/a 0.32
Parameter Estimate
0.044 n/a -0.04 n/a n/a 0.36
p-value
0.99 0.75 0.03 0.46 0.51 0.006
p-value
0.42 0.81 0.56 0.69 0.72 0.005
p-value
0.009 0.15 0.02 0.87 0.87 0.003
92
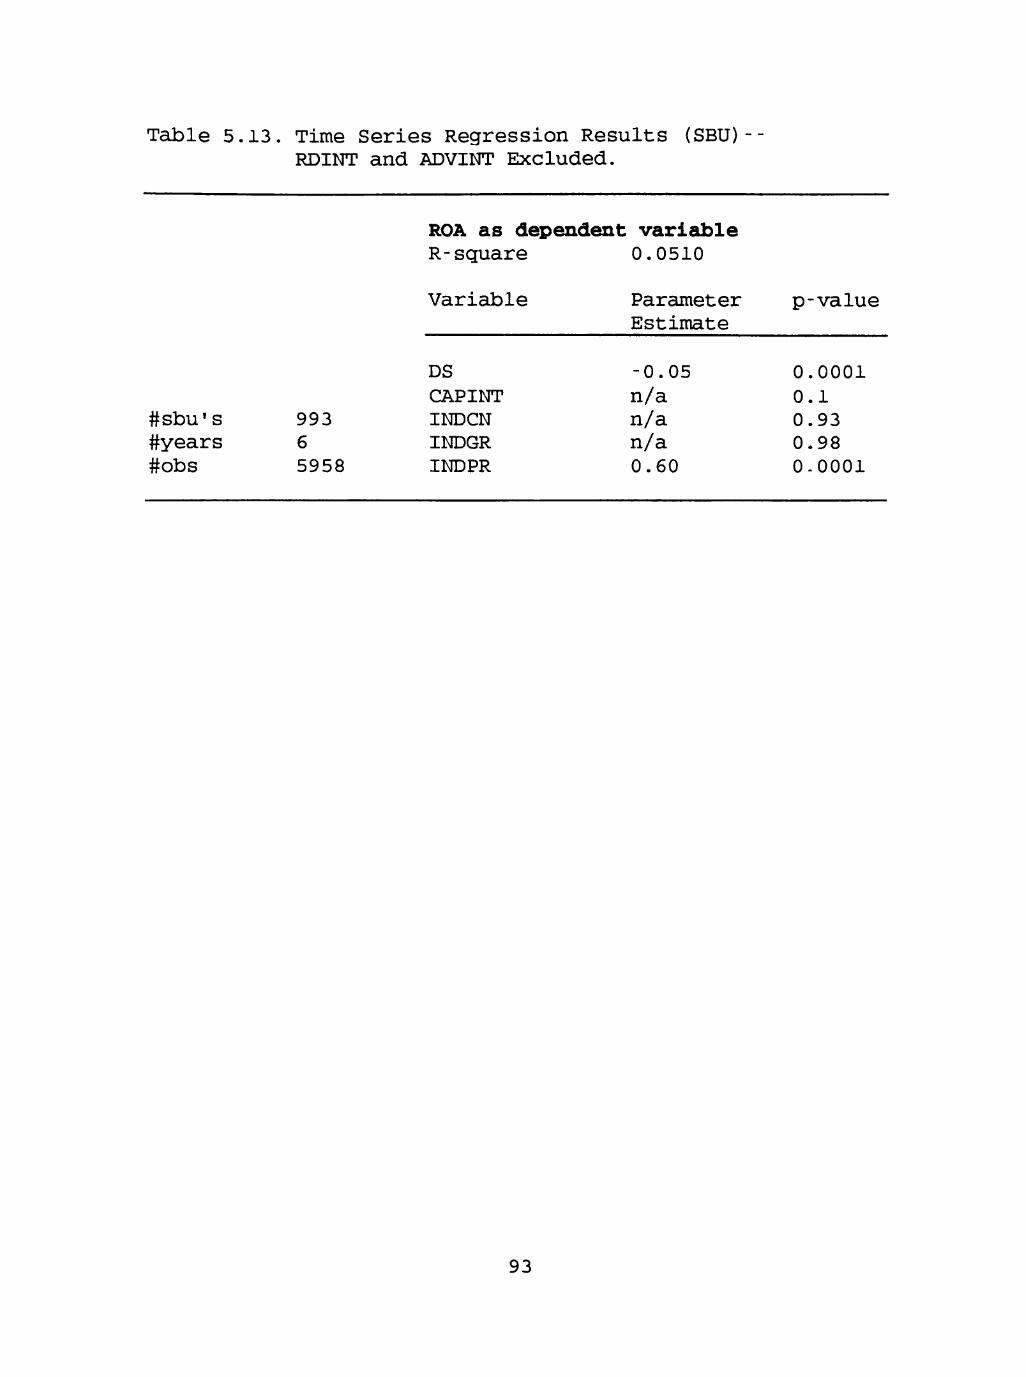
Table 5.13. Time Series Regression Results (SBU)-RDINT and ADVINT Excluded.
ROA as dependent variable R-square 0.0510
#sbu's #years #obs
993 6 5958
Variable
DS CAPINT INDCN INDGR INDPR
Parameter Estimate
-0.05 n/a n/a n/a 0.60
p-value
0.0001 0.1 0.93 0.98 0.0001
93
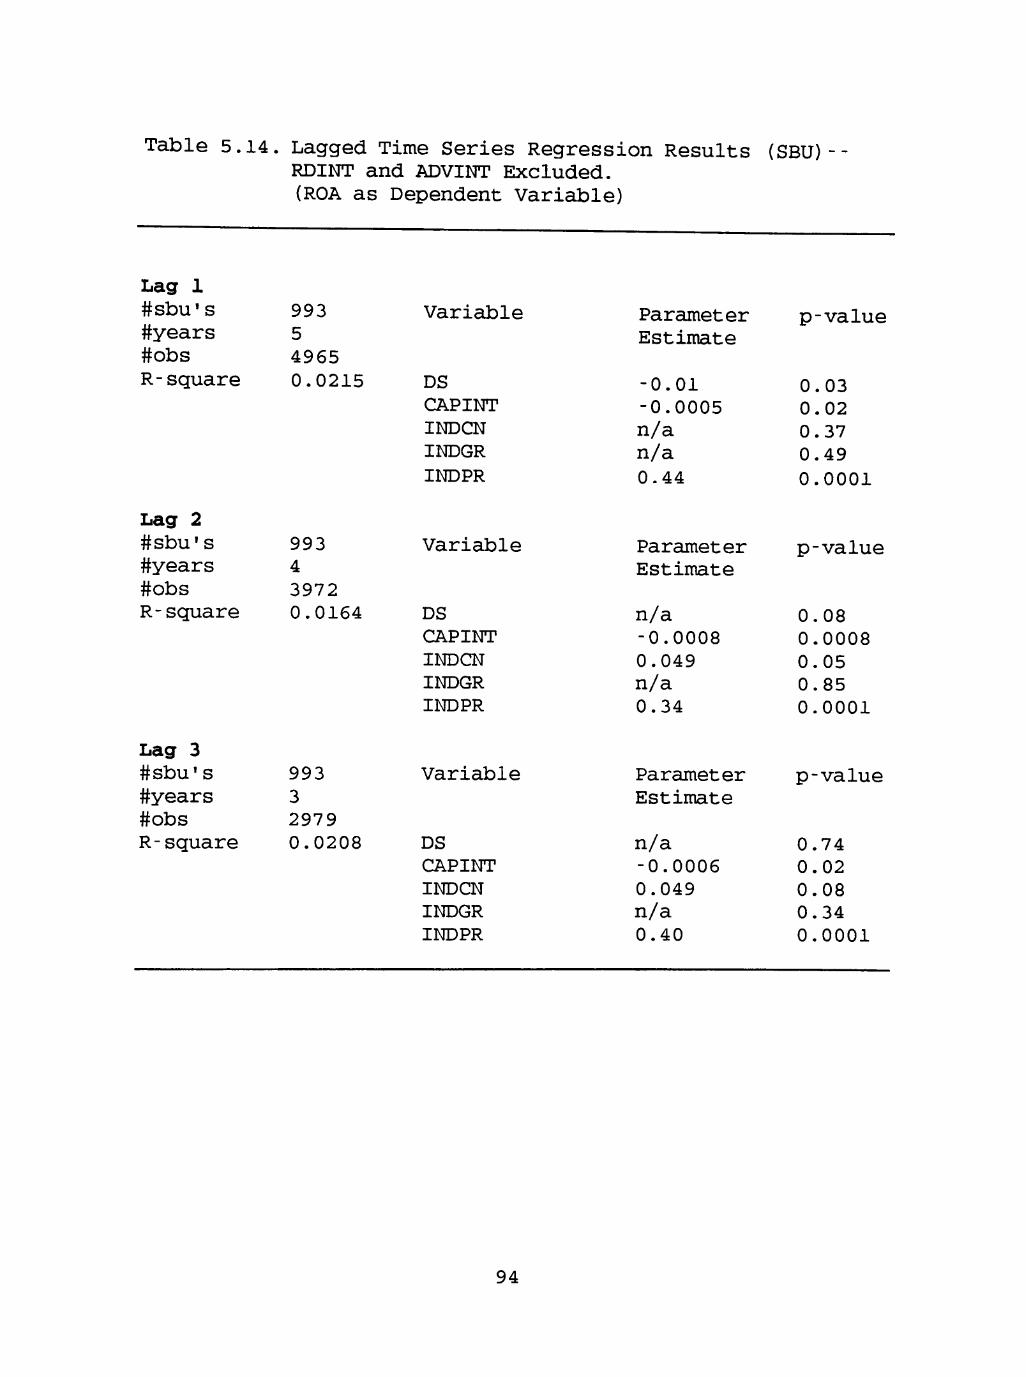
Table 5.14. Lagged Time Series Regression Results (SBU) RDINT and ADVINT Excluded. (ROA as Dependent Variable)
Lag 1 #sbu's #years #obs R-square
Lag 2 #sbu's #years #obs R-square
Lag 3 #sbu's #years #obs R-square
993 5 4965 0.0215
993 4 3972 0.0164
993 3 2979 0.0208
Variable
DS CAPINT INDCN INDGR INDPR
Variable
DS CAPINT INDCN INDGR INDPR
Variable
DS CAPINT INDCN INDGR INDPR
Parameter Estimate
-0.01 -0.0005 n/a n/a 0-44
Parameter Estimate
n/a -0.0008 0.049 n/a 0.34
Parameter Estimate
n/a -0.0006 0.049 n/a 0.40
p-value
0.03 0.02 0.37 0.49 0.0001
p-value
0.08 0.0008 0.05 0.85 0.0001
p-value
0.74 0.02 0.08 0.34 0.0001
94
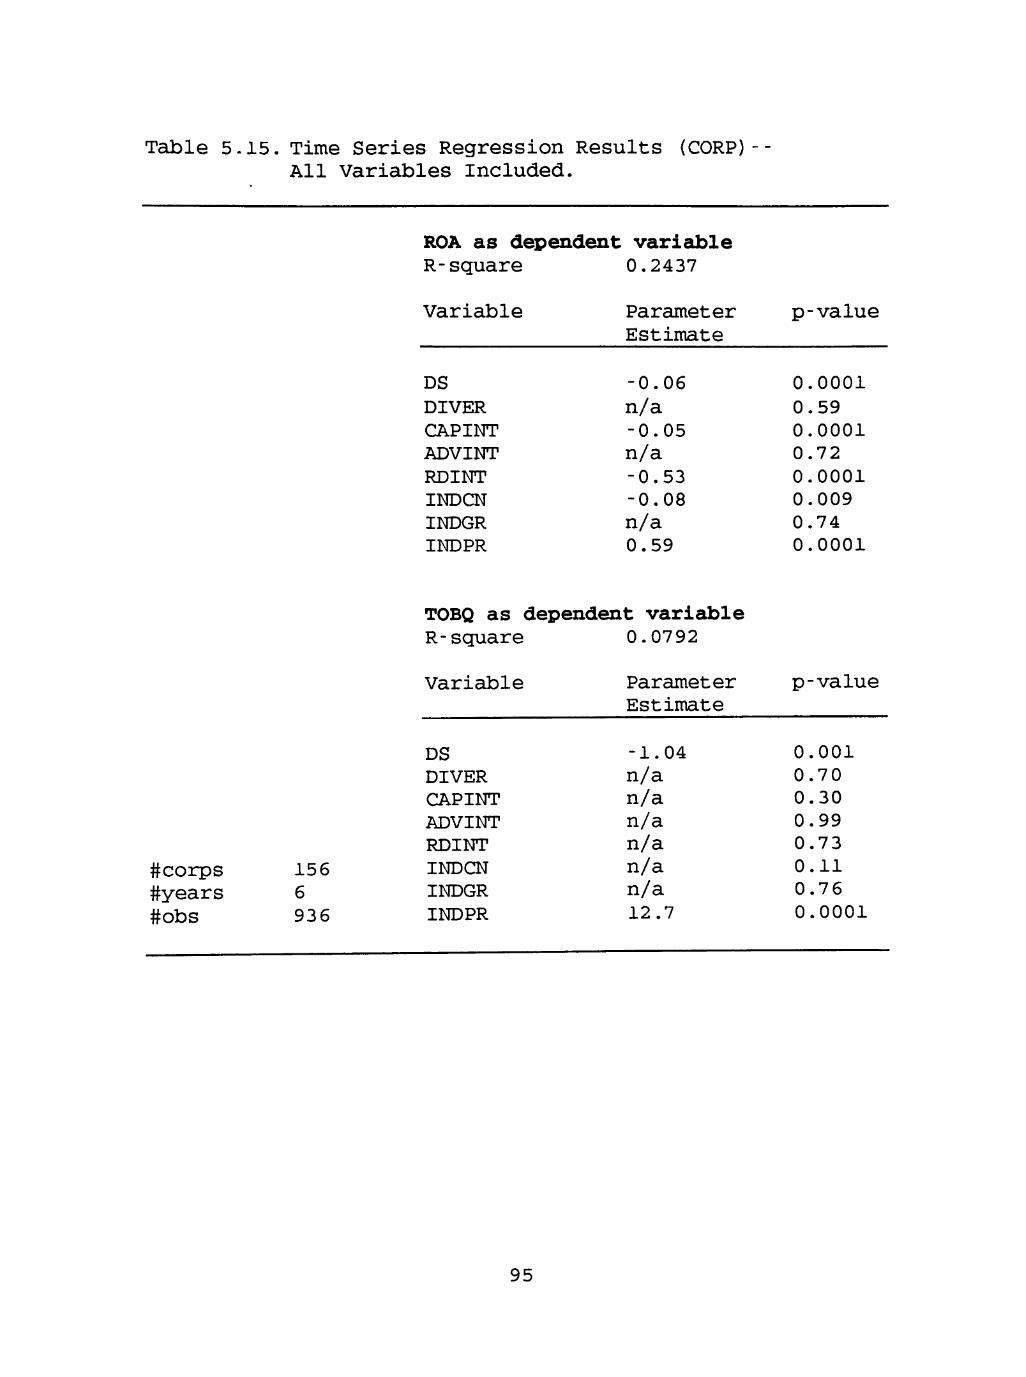
Table 5-15. Time Series Regression Results (CORP) All Variables included.
ROA as dependent variable R-square 0.2437
Variable
DS DIVER CAPINT ADVINT RDINT INDCN INDGR INDPR
Parameter Estimate
-0.06 n/a -0.05 n/a -0.53 -0.08 n/a 0.59
p-value
0.0001 0.59 0.0001 0.72 0.0001 0.009 0.74 0.0001
TOBQ as dependent variable R-square 0.07 92
#corps #years #obs
156 6 936
Variable
DS DIVER CAPINT ADVINT RDINT INDCN INDGR INDPR
Parameter Estimate
-1.04 n/a n/a n/a n/a n/a n/a 12.7
p-value
0.001 0.70 0.30 0.99 0.73 0.11 0.76 0.0001
95
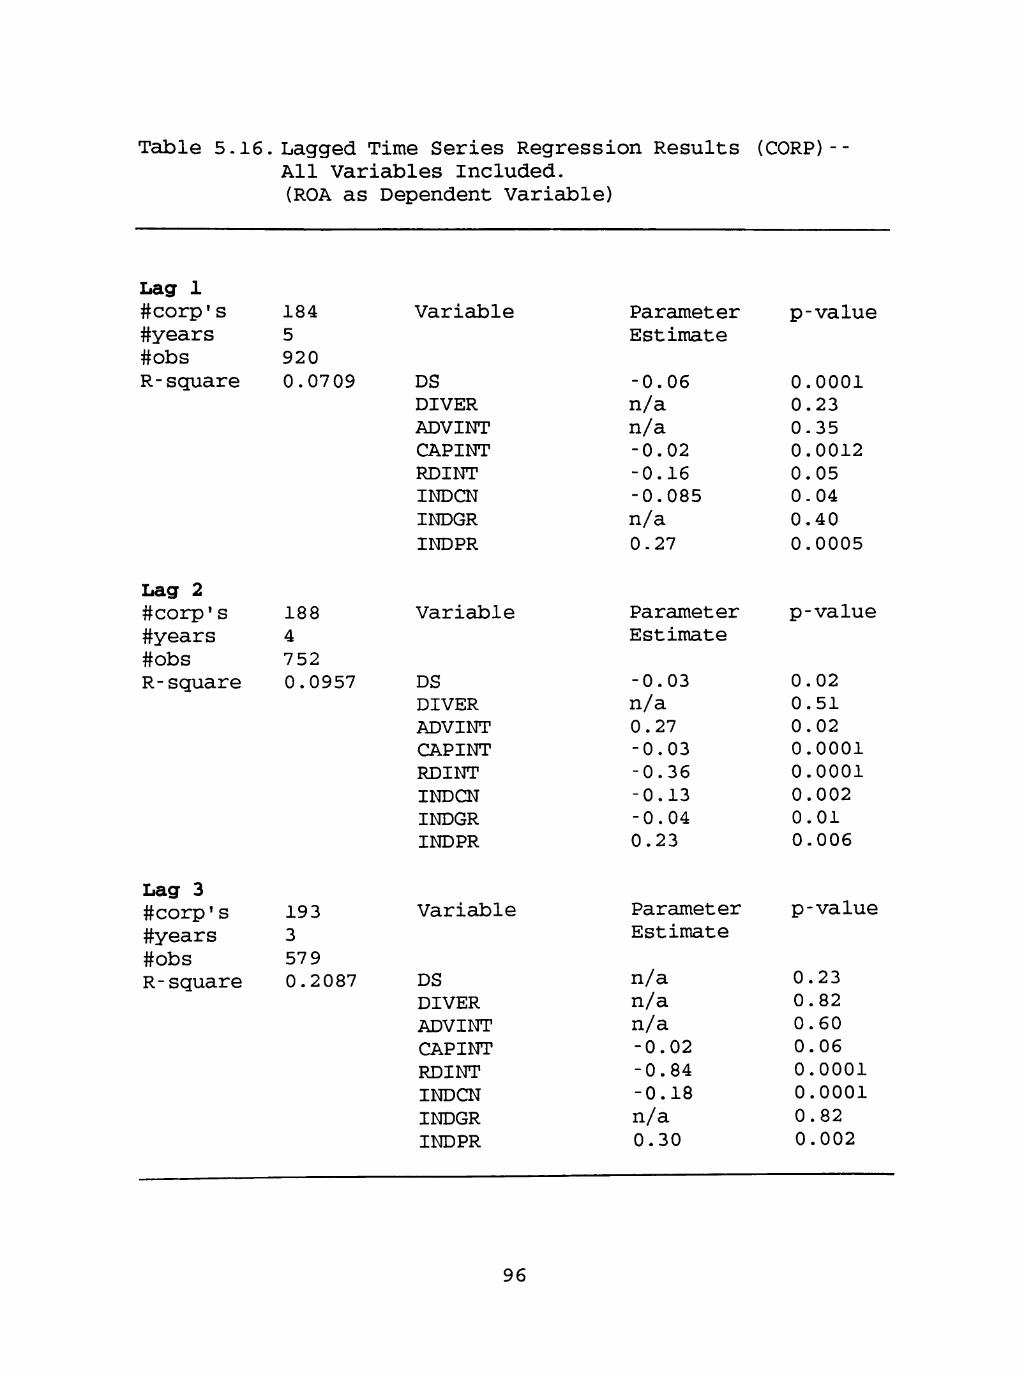
Table 5.16. Lagged Time Series Regression Results (CORP)--All Variables Included. (ROA as Dependent Variable)
Lag 1 #corp's #years #obs R-square
Lag 2 #corp's #years #obs R-square
Lag 3 #corp's #years #obs R-square
184 5 920 0.0709
188 4 752 0.0957
193 3 57 9 0.2087
Variable
DS DIVER ADVINT CAPINT RDINT INDCN INDGR INDPR
Variable
DS DIVER ADVINT CAPINT RDINT INDCN INDGR INDPR
Variable
DS DIVER ADVINT CAPINT RDINT INDCN INDGR INDPR
Parameter Estimate
-0.06 n/a n/a -0.02 -0.16 -0.085 n/a 0.27
Parameter Estimate
-0.03 n/a 0.27 -0.03 -0.36 -0.13 -0.04 0.23
Parameter Estimate
n/a n/a n/a -0.02 -0.84 -0.18 n/a 0.30
p-value
0.0001 0.23 0.35 0.0012 0.05 0-04 0.40 0.0005
p-value
0.02 0.51 0.02 0.0001 0.0001 0.002 0.01 0.006
p-value
0.23 0.82 0.60 0.06 0.0001 0.0001 0.82 0.002
96

Table 5.17. Time Series Regression Results (CORP) ADVINT Excluded.
ROA as dependent variable R-square 0.1495
Variable
DS DIVER CAPINT RDINT INDCN INDGR INDPR
Parameter Estimate
-0.03 0.001 0.007 -0.02 n/a n/a 0.81
p-value
0.0001 0.03 0.0001 0.0001 0.53 0.40 0.0001
TOBQ as dependent varieible R-square 0.0494
#corps #years #obs
411 6 2466
Variable
DS DIVER CAPINT RDINT INDCN INDGR INDPR
Parameter Estimate
-1.29 -0.03 0.18 n/a n/a n/a 12.65
p-value
0.0001 0.04 0.0008 0.83 0.15 0.83 0.0001
97

Table 5.18. Lagged Time Series Regression Results (CORP) ADVINT Excluded. (ROA as Dependent Variable)
Lag 1 #corp's #years #obs R-square
Lag 2 #corp's #years #obs R-square
Lag 3 #corp's #years #obs R-square
448 5 2240 0.0525
450 4 1800 0.0220
455 3 1365 0.0417
Variable
DS DIVER CAPINT RDINT INDCN INDGR INDPR
Variable
DS DIVER CAPINT RDINT INDCN INDGR INDPR
Variable
DS DIVER CAPINT RDINT INDCN INDGR INDPR
Parameter Estimate
-0.019 0.001 n/a 0.005 -0.05 n/a 0.43
Parameter Estimate
n/a -0.0013 -0.012 0.019 -0.05 n/a 0.23
Parameter Estimate
n/a 0.0012 n/a n/a n/a n/a 0.31
p-value
0.001 0.02 0.20 0.05 0.05 0-43 0.0001
p-value
0.67 0.03 0.006 0.003 0.05 0.31 0.0001
p-value
0.40 0.04 0.33 0.78 0.26 0.72 0.0001
98
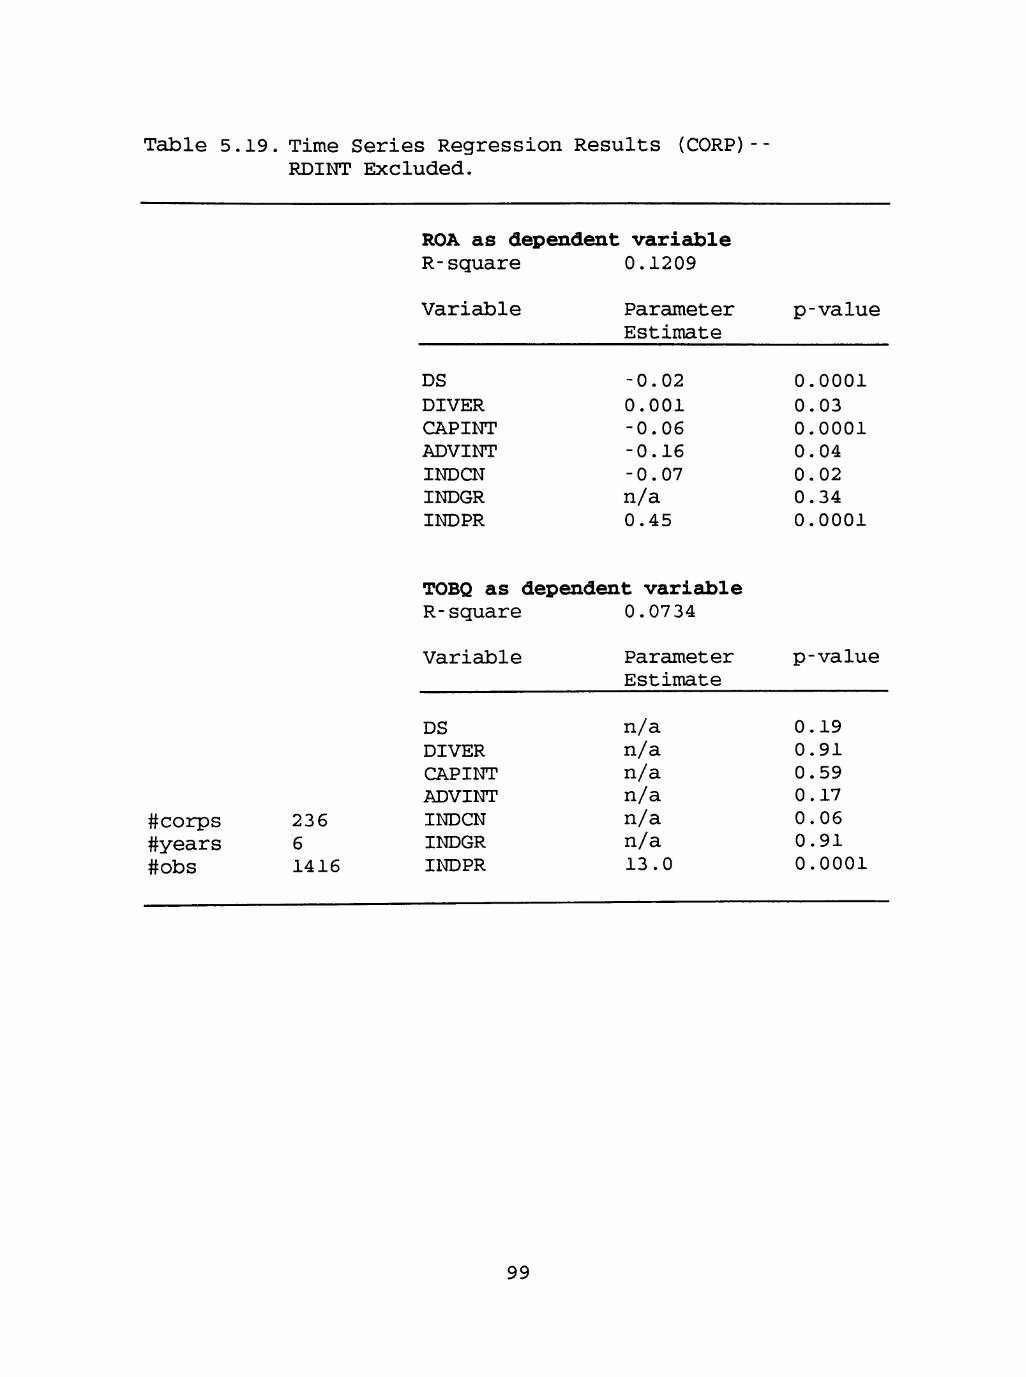
Table 5.19. Time Series Regression Results (CORP) RDINT Excluded.
ROA as dependent variable R-square 0.1209
Variable
DS DIVER CAPINT ADVINT INDCN INDGR INDPR
Parameter Estimate
-0.02 0.001 -0.06 -0.16 -0.07 n/a 0.45
p-value
0.0001 0.03 0.0001 0.04 0.02 0.34 0.0001
TOBQ as dependent variaible R-square 0.07 34
#corps #years #obs
236 6 1416
Variable
DS DIVER CAPINT ADVINT INDCN INDGR INDPR
Parameter Estimate
n/a n/a n/a n/a n/a n/a 13.0
p-value
0.19 0.91 0.59 0.17 0.06 0.91 0.0001
99

Table 5.20. Lagged Time Series Regression Results (CORP)--RDINT Excluded. (ROA as Dependent Variable)
Lag 1 #corp's #years #obs R-square
Lag 2 #corp's #years #obs R-square
Lag 3 #corp's #years #obs R-square
277 5 1385 0.0322
285 4 1140 0.0437
295 3 885 0.0854
Variable
DS DIVER ADVINT CAPINT INDCN INDGR INDPR
Variable
DS DIVER ADVINT CAPINT INDCN INDGR INDPR
Variable
DS DIVER ADVINT CAPINT INDCN INDGR INDPR
Parameter Estimate
n/a n/a n/a -0.022 n/a n/a 0.28
Parameter Estimate
n/a 0.002 n/a -0.027 -0.077 0.01 0.226
Parameter Estimate
0.013 0.002 n/a -0-012 n/a 0.017 0.44
p-value
0.32 0.07 0.995 0.0007 0.13 0.27 0.0001
p-value
0.47 0.04 0.31 0.0003 0.04 0.001 0.002
p-value
0.03 0.04 0.52 0.04 0.11 0.0001 0.0001
100

Table 5.21 Time Series Regression Results (CORP) RDINT and ADVINT Excluded.
ROA as dependent variedsle R-square 0.0894
Variable
DS DIVER CAPINT INDCN INDGR INDPR
Parameter Estimate
-0.009 0.002 n/a n/a n/a 0.67
p-value
0.002 0.003 0.15 0.18 0.95 0.0001
TOBQ as dependent variable R-square 0.0062
#corps #years #obs
664 6 3984
Variable
DS DIVER CAPINT INDCN INDGR INDPR
Parameter Estimate
n/a n/a n/a -3.3 n/a 9.7
p-value
0.53 0.09 0.13 0.002 0.31 0.005
101
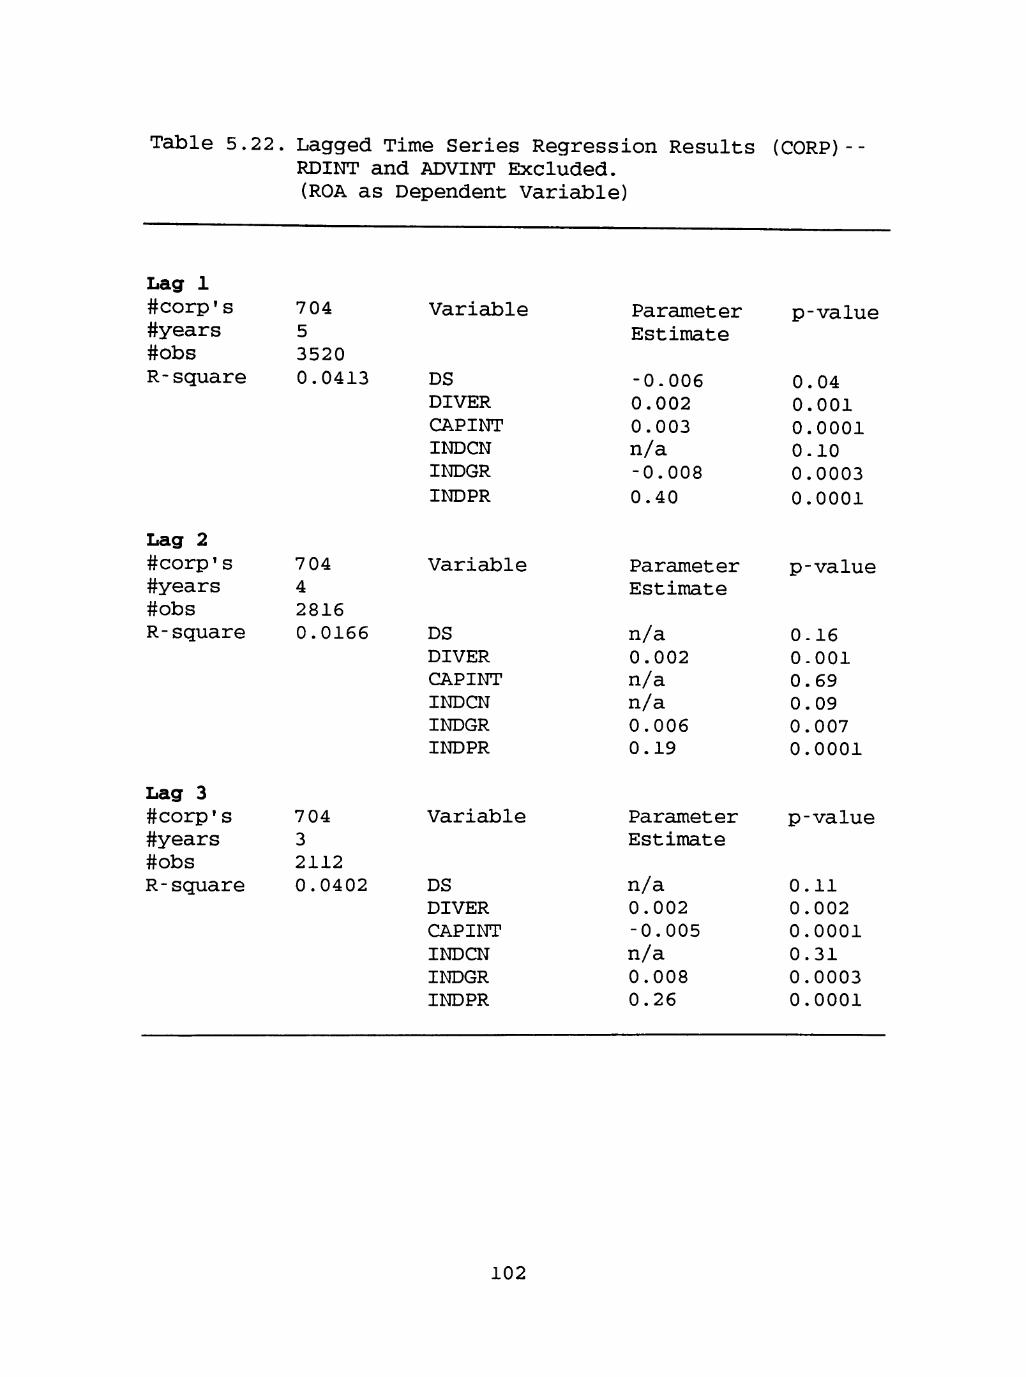
Table 5.22. Lagged Time Series Regression Results (CORP) RDINT and ADVINT Excluded. (ROA as Dependent Variable)
Lag 1 #corp's #years #obs R-square
Lag 2 #corp's #years #obs R-square
Lag 3 #corp's #years #obs R-square
704 5 3520 0.0413
704 4 2816 0.0166
704 3 2112 0.0402
Variable
DS DIVER CAPINT INDCN INDGR INDPR
Variable
DS DIVER CAPINT INDCN INDGR INDPR
Variable
DS DIVER CAPINT INDCN INDGR INDPR
Parameter Estimate
-0-006 0.002 0.003 n/a -0.008 0.40
Parameter Estimate
n/a 0.002 n/a n/a 0.006 0.19
Parameter Estimate
n/a 0.002 -0.005 n/a 0.008 0.26
p-value
0.04 0.001 0.0001 0.10 0.0003 0.0001
p-value
0-16 0-001 0.69 0.09 0.007 0.0001
p-value
0.11 0.002 0.0001 0.31 0.0003 0.0001
102

Table 5.23. Lagged Time Series Regression Results (CORP)-All Variables Included. (TOBQ as Dependent Variable)
Lag 1 #corp•s #years #obs R-square
Lag 2 #corp's #years #obs R-square
Lag 3 #corp's #years #obs R-square
17 8 5 890 0.0186
184 4 736 0.0285
192 3 57 6 0.0368
Variable
DS DIVER ADVINT CAPINT RDINT INDCN INDGR INDPR
Variable
DS DIVER ADVINT CAPINT RDINT INDCN INDGR INDPR
Variable
DS DIVER ADVINT CAPINT RDINT INDCN INDGR INDPR
Parameter Estimate
n/a n/a n/a n/a n/a n/a n/a 9.14
Parameter Estimate
n/a n/a n/a -1.25 14.5 n/a n/a 8.89
Parameter Estimate
2.02 n/a n/a -2.03 n/a n/a n/a 17.40
p-value
0.12 0-45 0.59 0.12 0.56 0.16 0.38 0.05
p-value
0.15 0.81 0.39 0.02 0.003 0.58 0.20 0.09
p-value
0.04 0.58 0.83
.0.02 ' 0.07 0.58 0.60 0.009
103
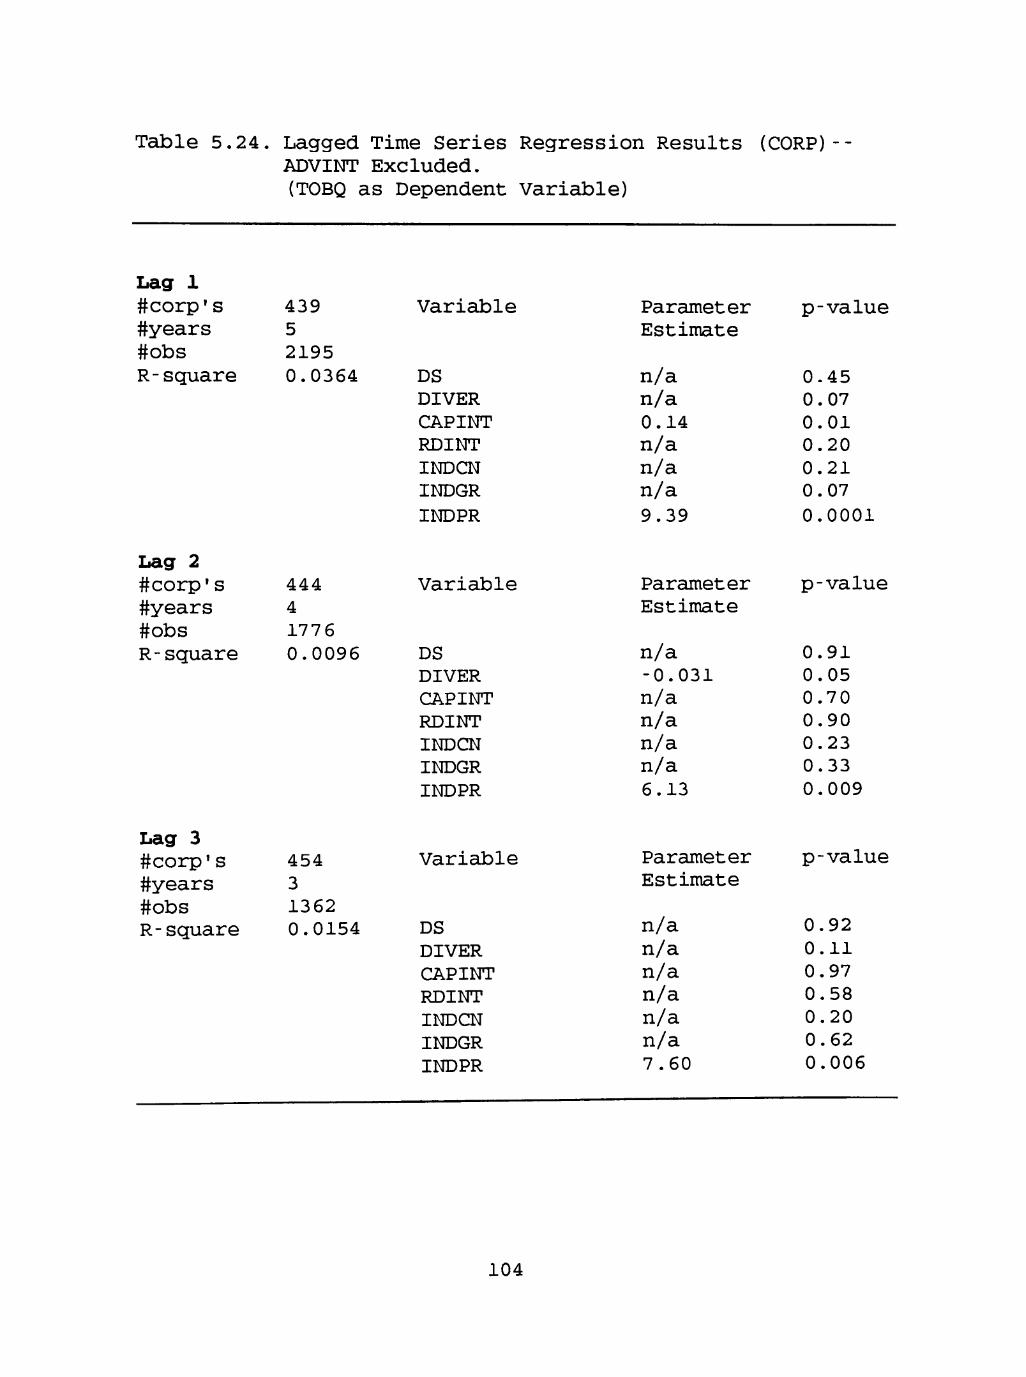
Table 5.24. Lagged Time Series Regression Results (CORP)--ADVINT Excluded. (TOBQ as Dependent Variable)
Lag 1 #corp's #years #obs R-square
Lag 2 #corp's #years #obs R-square
Lag 3 #corp's #years #obs R-square
439 5 2195 0.0364
444 4 1776 0.0096
454 3 1362 0.0154
Variable
DS DIVER CAPINT RDINT INDCN INDGR INDPR
Variable
DS DIVER CAPINT RDINT INDCN INDGR INDPR
Variable
DS DIVER CAPINT RDINT INDCN INDGR INDPR
Parameter Estimate
n/a n/a 0.14 n/a n/a n/a 9.39
Parameter Estimate
n/a -0.031 n/a n/a n/a n/a 6.13
Parameter Estimate
n/a n/a n/a n/a n/a n/a 7.60
p-value
0-45 0.07 0.01 0.20 0.21 0.07 0.0001
p-value
0.91 0.05 0.70 0.90 0.23 0.33 0.009
p-value
0.92 0.11 0.97 0.58 0.20 0.62 0.006
104
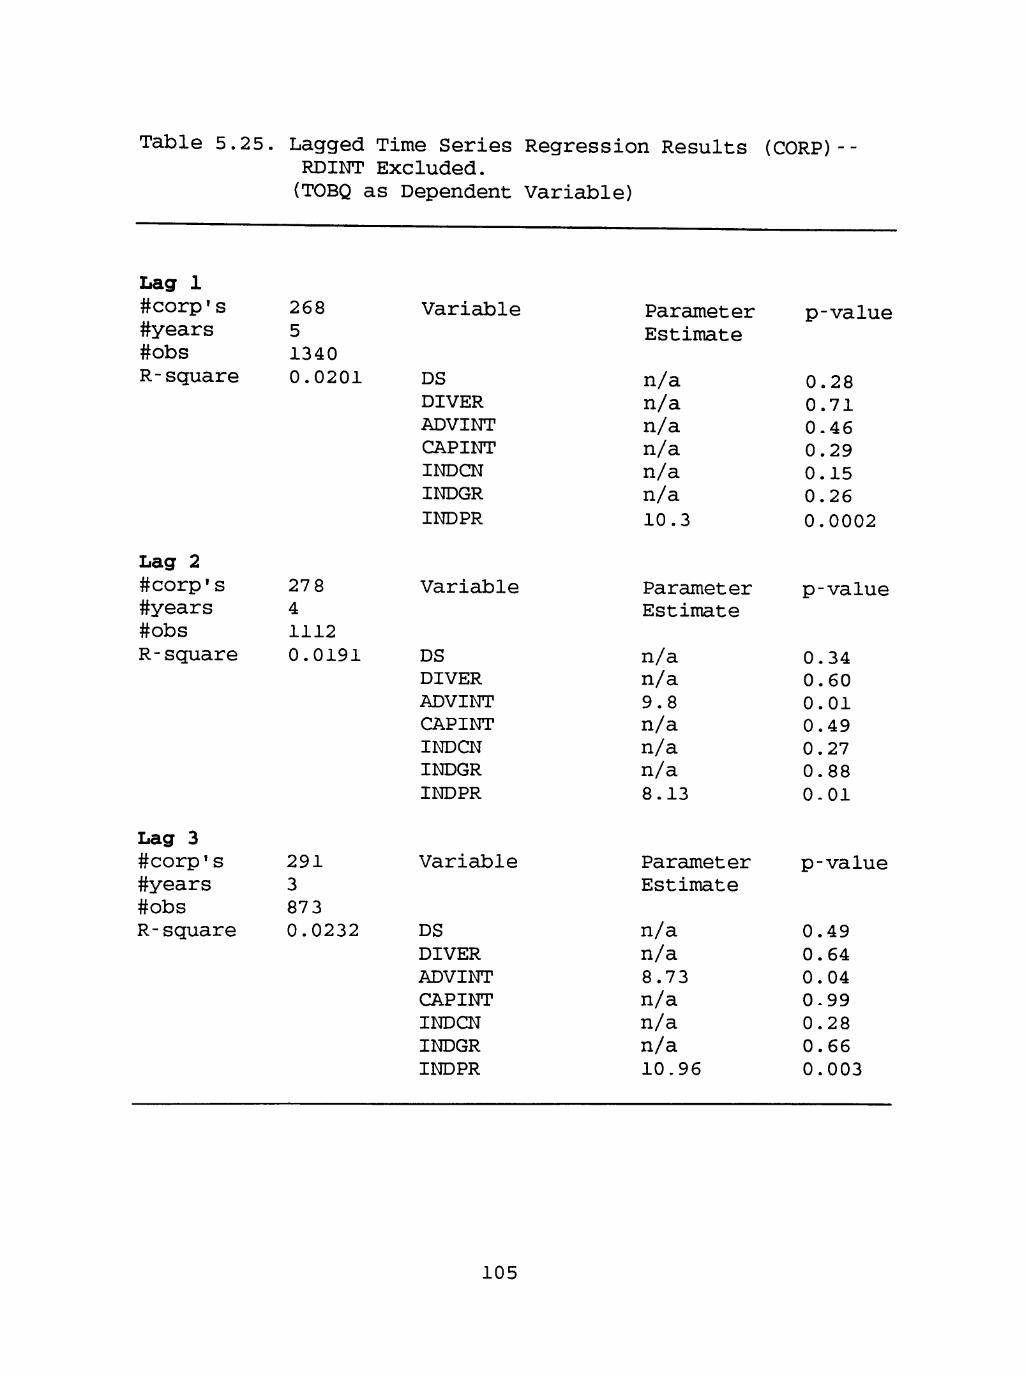
Table 5.25. Lagged Time Series Regression Results (CORP) RDINT Excluded. (TOBQ as Dependent Variable)
Lag 1 #corp's #years #obs R-square
Lag 2 #corp's #years #obs R-square
Lag 3 #corp's #years #obs R-square
268 5 1340 0.0201
27 8 4 1112 0.0191
291 3 87 3 0.0232
Variable
DS DIVER ADVINT CAPINT INDCN INDGR INDPR
Variable
DS DIVER ADVINT CAPINT INDCN INDGR INDPR
Variable
DS DIVER ADVINT CAPINT INDCN INDGR INDPR
Parameter Estimate
n/a n/a n/a n/a n/a n/a 10.3
Parameter Estimate
n/a n/a 9.8 n/a n/a n/a 8.13
Parameter Estimate
n/a n/a 8.73 n/a n/a n/a 10.96
p-value
0.28 0.71 0.46 0.29 0.15 0.26 0.0002
p-value
0.34 0.60 0.01 0.49 0.27 0.88 0-01
p-value
0.49 0.64 0.04 0-99 0.28 0.66 0.003
105
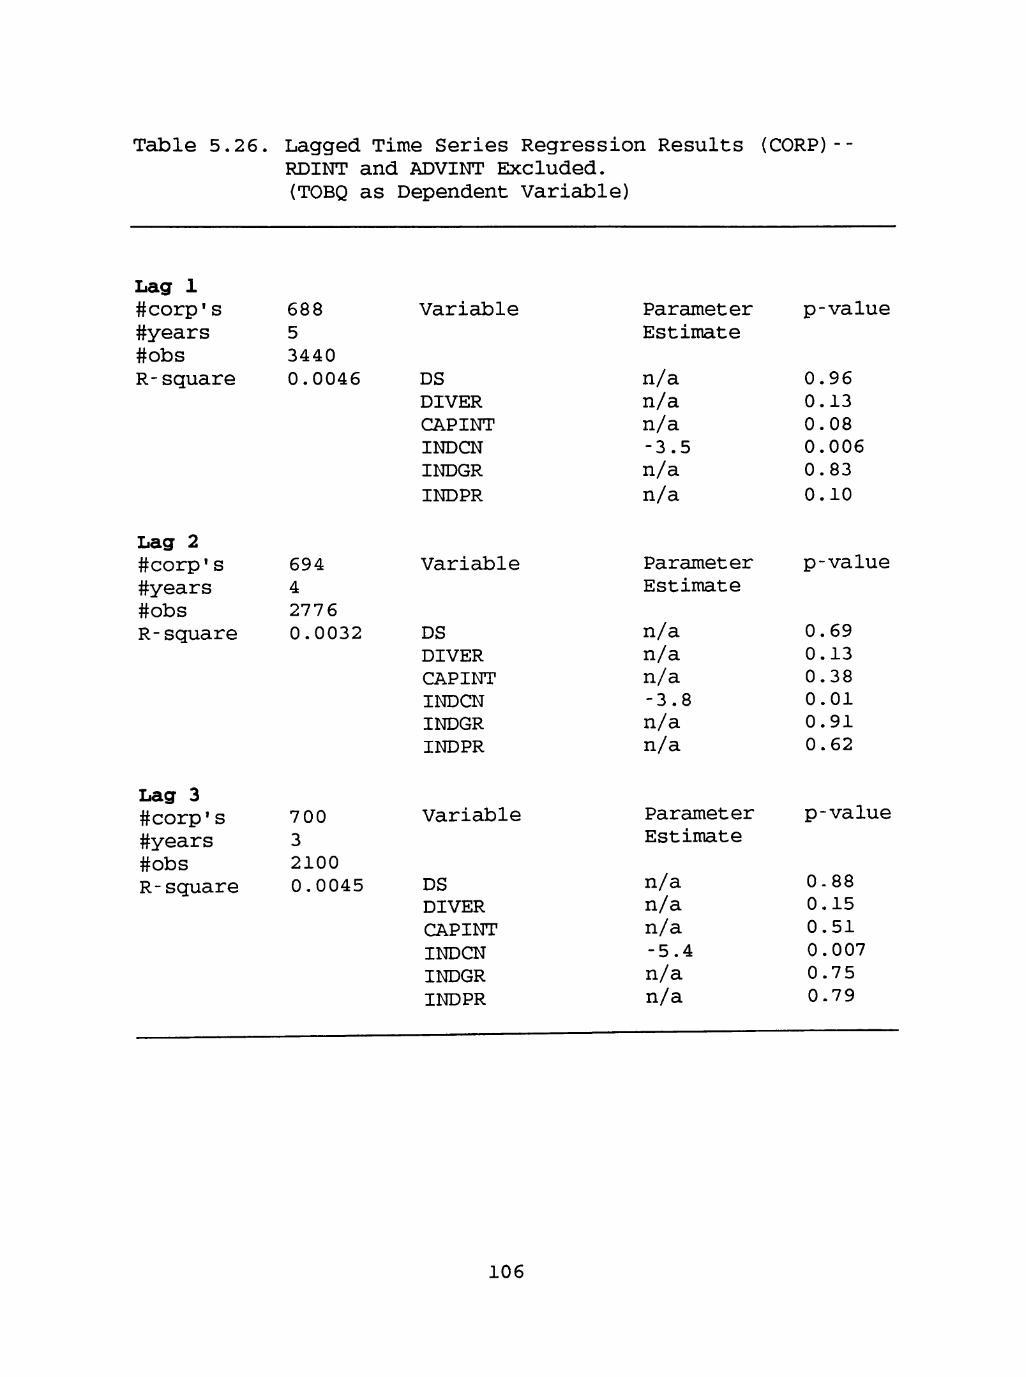
Table 5.26 Lagged Time Series Regression Results (CORP)--RDINT and ADVINT Excluded. (TOBQ as Dependent Variable)
Lag 1 #corp's #years #obs R-square
Lag 2 #corp's #years #obs R-square
Lag 3 #corp's #years #obs R-square
688 5 3440 0.0046
694 4 2776 0.0032
700 3 2100 0.0045
Variable
DS DIVER CAPINT INDCN INDGR INDPR
Variable
DS DIVER CAPINT INDCN INDGR INDPR
Variable
DS DIVER CAPINT INDCN INDGR INDPR
Parameter Estimate
n/a n/a n/a -3.5 n/a n/a
Parameter Estimate
n/a n/a n/a -3.8 n/a n/a
Parameter Estimate
n/a n/a n/a -5.4 n/a n/a
p-value
0.96 0.13 0.08 0.006 0.83 0.10
p-value
0.69 0.13 0.38 0.01 0.91 0.62
p-value
0-88 0.15 0.51 0.007 0.75 0.79
106
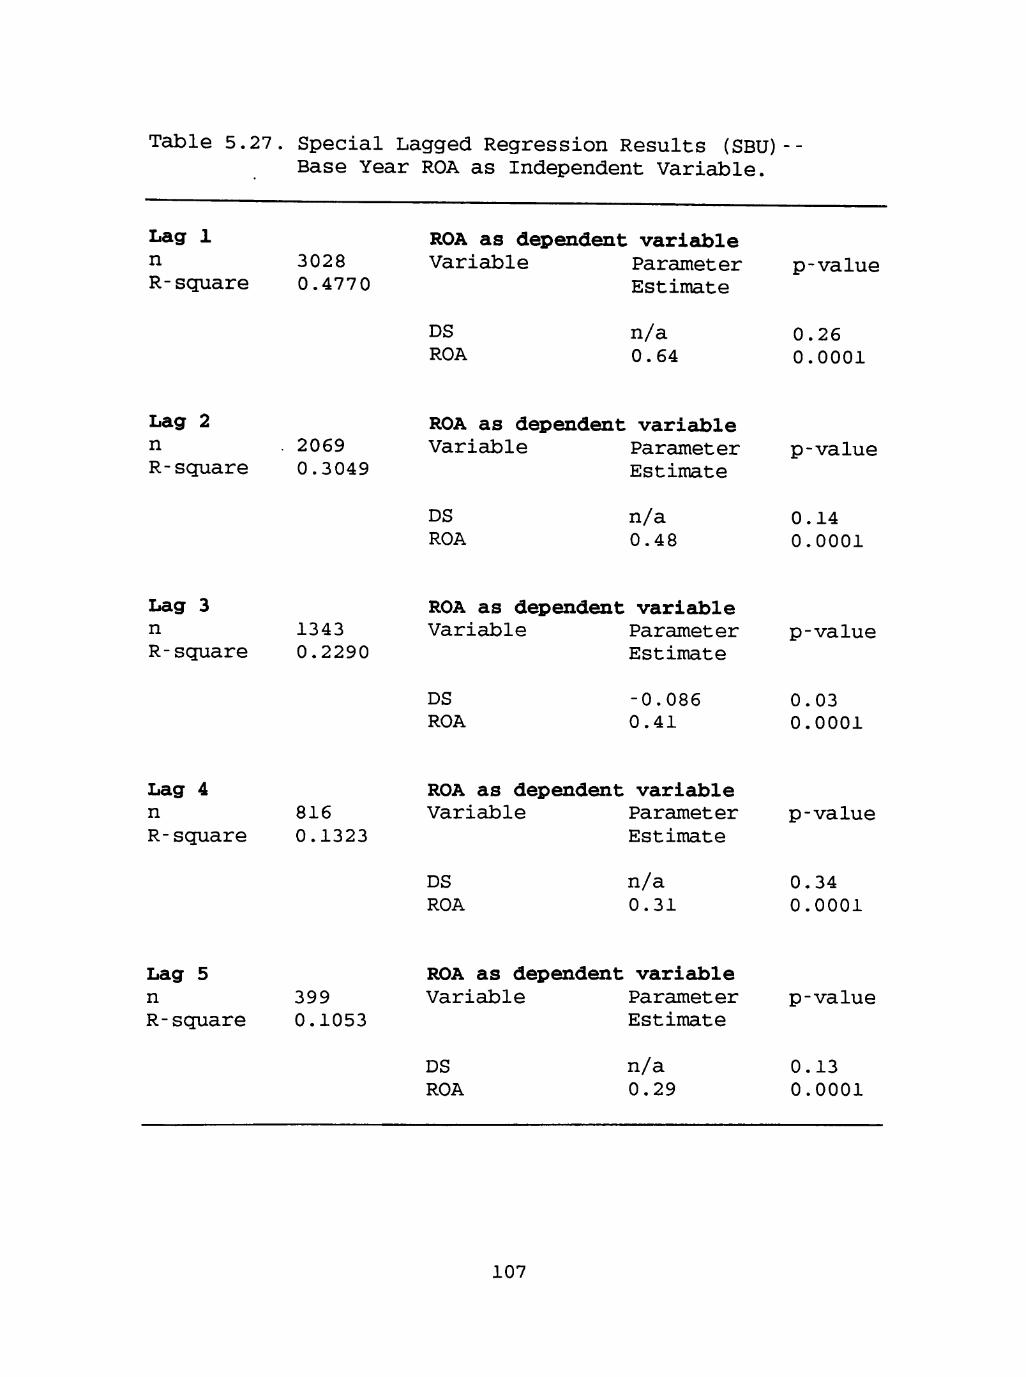
Table 5.27. Special Lagged Regression Results (SBU)-Base Year ROA as Independent Variable.
Lag 1 n R-scjuare
3028 0.4770
ROA as dependent -vsLriahle Variable Parameter
Estimate
DS ROA
n/a 0.64
p-
0. 0.
-value
.26
.0001
Lag 2 n R-scjuare
2069 0.3049
ROA as dependent variable V a r i a b l e
DS ROA
Parameter Estimate
n/a 0.48
P-
0. 0.
•value
.14
.0001
Lag 3 n R-scjuare
1343 0.2290
ROA as dependent variable Variable Parameter
Estimate p-value
DS ROA
-0.086 0.41
0.03 0.0001
Lag 4 n R-square
816 0.1323
ROA as dependent varieUsle Variable Parameter
Estimate p-value
DS ROA
n/a 0.31
0.34 0.0001
Lag 5 n R-square
399 0.1053
ROA as dependent variable Variable
DS ROA
Parameter Estimate
n/a 0.29
p-value
0.13 0.0001
107

Table 5.28 Special Lagged Regression Results (CORP) Base Year ROA as independent Variable.
Lag 1 n R-scjuare
17 50 0.5197
ROA as dependent variable Variable Parameter
Estimate p-value
DS ROA
n/a 0.67
0.62 0.0001
Lag 2 n R-square
1306 0.3912
ROA as dependent variable Variable Parameter
Estimate p-value
DS ROA
n/a 0.45
0.95 0.0001
Lag 3 n R-scjuare
950 0.3243
ROA as dependent variable Variable
DS ROA
Parameter Estimate
n/a 0.37
p-value
0.23 0.0001
Lag 4 n R-square
649 0.1890
ROA as dependent variable Variable Parameter
Estimate
DS ROA
n/a 0.25
p-value
0.17 0.0001
Lag 5 n R-square
350 0.0095
ROA as dependent variable Variable Parameter
Estimate
DS ROA
n/a n/a
p-value
0.11 0.65
108
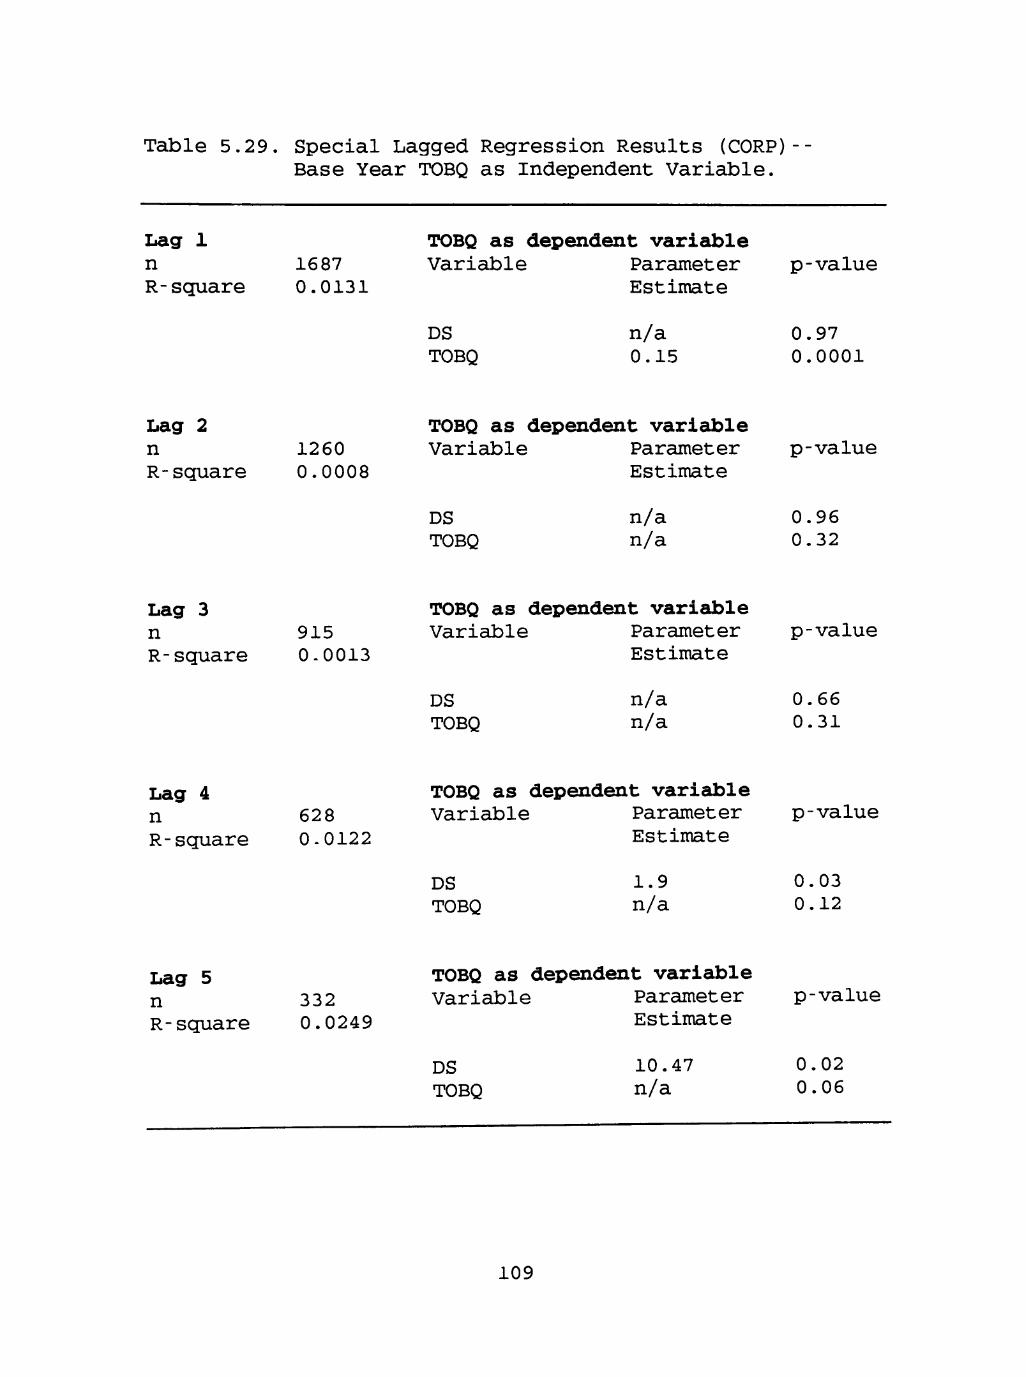
Table 5.29. Special Lagged Regression Results (CORP)--Base Year TOBQ as independent Variable.
Lag 1 n R-square
1687 0.0131
TOBQ as dependent varisible Variable Parameter
Estimate p-value
DS TOBQ
n/a 0.15
0.97 0.0001
Lag 2 n R-square
1260 0.0008
TOBQ as dependent variable Variable Parameter
Estimate p-value
DS TOBQ
n/a n/a
0.96 0.32
Lag 3 n R-square
915 0-0013
TOBQ as dependent variable Variable Parameter
Estimate
DS TOBQ
n/a n/a
p-value
0.66 0.31
Lag 4 n R-square
628 0-0122
TOBQ as dependent variable Variable Parameter
Estimate
DS TOBQ
1.9 n/a
p-value
0.03 0.12
Lag 5 n R-scjuare
332 0.0249
TOBQ as dependent variable Variable Parameter
Estimate
DS TOBQ
10.47 n/a
p-value
0.02 0.06
109

Table 5.30. Concurrent and Lagged (0-2) Regression Results (SBU)--All Variables Included. (ROA as Dependent Variable)
No lag
n R-square
Lag 1
n R-square
Lag 2
n R-square
24 0.5184
7 n/a
4 n/a
Variable
DS ADVINT CAPINT RDINT INDCN INDGR INDPR
Variable
DSPl ADVINT CAPINT RDINT INDCN INDGR INDPR DS
Variable
DSP2 ADVINT CAPINT RDINT INDCN INDGR INDPR DS
Parameter Estimate
n/a -7.09 n/a n/a n/a n/a n/a
Parameter Estimate
n/a n/a n/a n/a n/a n/a n/a n/a
Parameter Estimate
n/a n/a n/a n/a n/a n/a n/a n/a
p-value
0.39 0.01 0.98 0.22 0.68 0.61 0.98
p-value
n/a n/a n/a n/a n/a n/a n/a n/a
p-value
n/a n/a n/a n/a n/a n/a n/a n/a
110

Table 5.31. Concurrent and Lagged (3-5) Regression Results (SBU)--All Variables included. (ROA as Dependent Variable)
Lag 3
n R-square
Lag 4
n R-square
Lag 5
n R-square
2 n/a
2 n/a
0 n/a
Variable
DSP3 ADVINT CAPINT RDINT INDCN INDGR INDPR DS
Variable
DSP4 ADVINT CAPINT RDINT INDCN INDGR INDPR DS
Variable
DSP5 ADVINT CAPINT RDINT INDCN INDGR INDPR DS
Parameter Estimate
n/a n/a n/a n/a n/a n/a n/a n/a
Parameter Estimate
n/a n/a n/a n/a n/a n/a n/a n/a
Parameter Estimate
n/a n/a n/a n/a n/a n/a n/a n/a
p-value
n/a n/a n/a n/a n/a n/a n/a n/a
p-value
n/a n/a n/a n/a n/a n/a n/a n/a
p-value
n/a n/a n/a n/a n/a n/a n/a n/a
111
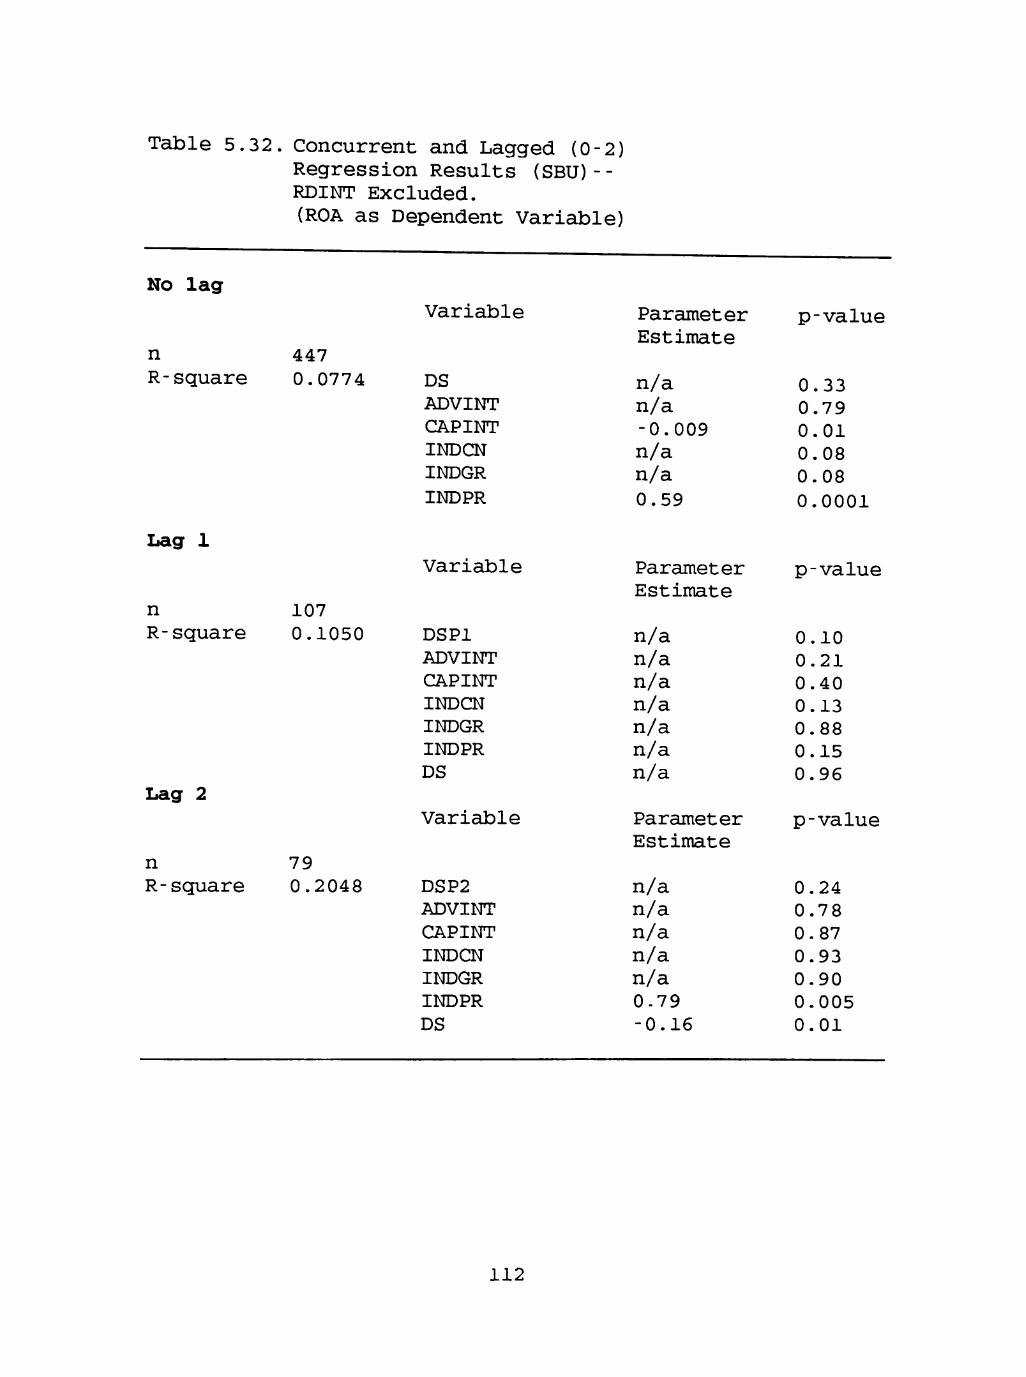
Table 5.32. Concurrent and Lagged (0-2) Regression Results (SBU)--RDINT Excluded. (ROA as Dependent Variable)
No lag
n R-square
Lag 1
n R-square
Lag 2
n R-square
447 0.0774
107 0.1050
79 0.2048
Variable
DS ADVINT CAPINT INDCN INDGR INDPR
Variable
DSPl ADVINT CAPINT INDCN INDGR INDPR DS
Variable
DSP2 ADVINT CAPINT INDCN INDGR INDPR DS
Parameter Estimate
n/a n/a -0.009 n/a n/a 0.59
Parameter Estimate
n/a n/a n/a n/a n/a n/a n/a
Parameter Estimate
n/a n/a n/a n/a n/a 0-79 -0.16
p-value
0.33 0.79 0.01 0.08 0.08 0.0001
p-value
0.10 0.21 0.40 0.13 0.88 0.15 0.96
p-value
0.24 0.78 0.87 0.93 0.90 0.005 0.01
112
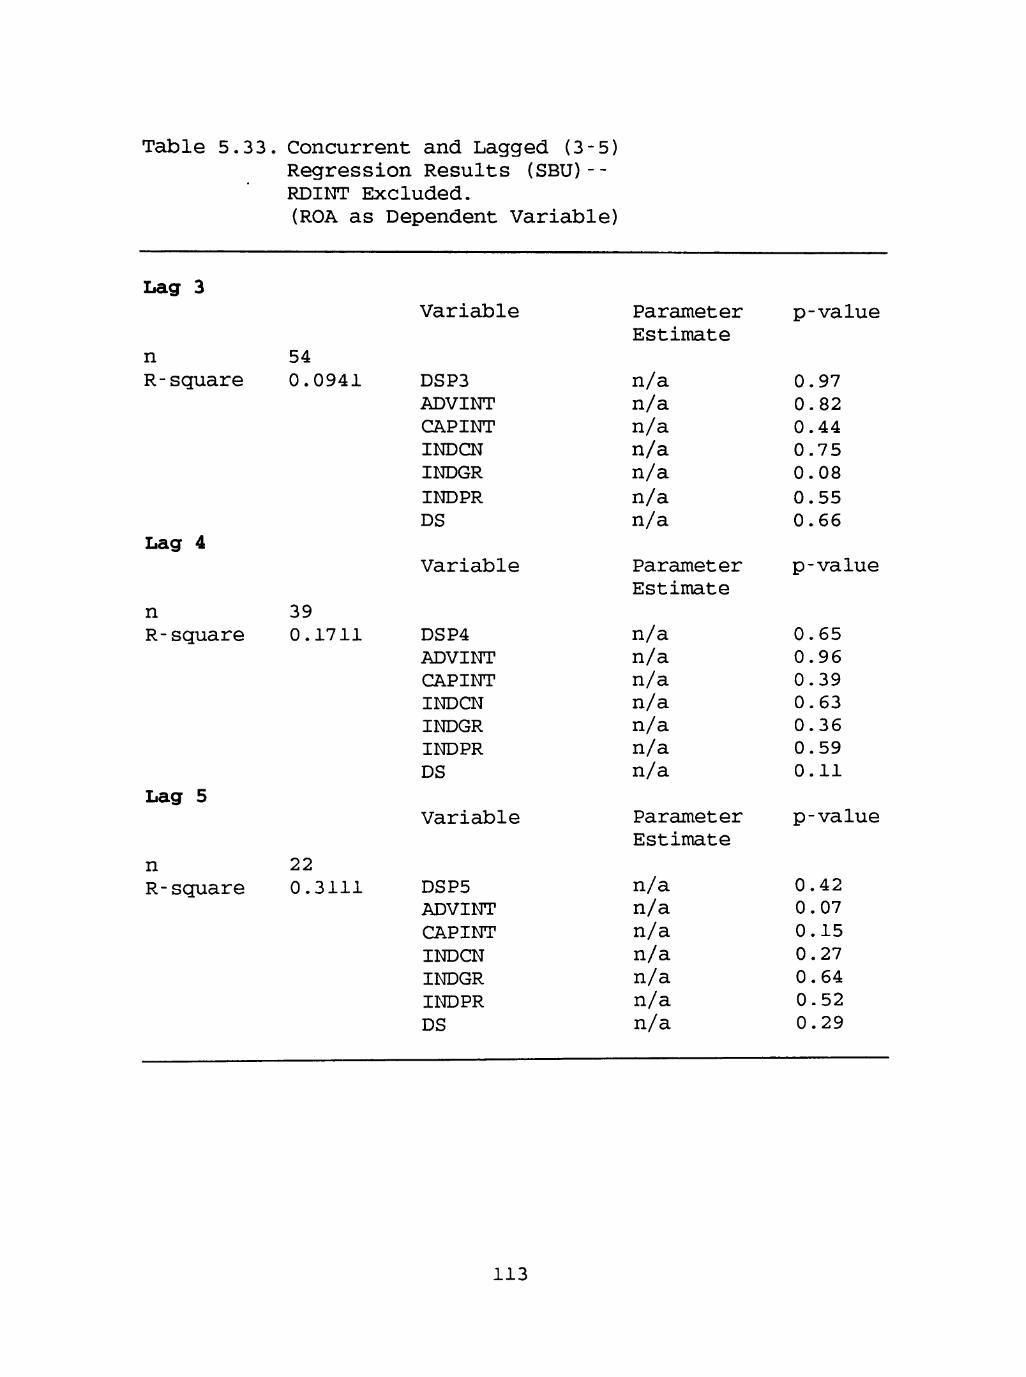
Table 5.33. Concurrent and Lagged (3-5) Regression Results (SBU)--RDINT Excluded. (ROA as Dependent Variable)
Lag 3
n R-square
Lag 4
n R-square
Lag 5
n R-square
54 0.0941
39 0.1711
22 0.3111
Variable
DSP3 ADVINT CAPINT INDCN INDGR INDPR DS
Variable
DSP4 ADVINT CAPINT INDCN INDGR INDPR DS
Variable
DSP5 ADVINT CAPINT INDCN INDGR INDPR DS
Parameter Estimate
n/a n/a n/a n/a n/a n/a n/a
Parameter Estimate
n/a n/a n/a n/a n/a n/a n/a
Parameter Estimate
n/a n/a n/a n/a n/a n/a n/a
p-value
0.97 0.82 0.44 0.75 0.08 0.55 0.66
p-value
0.65 0.96 0.39 0.63 0.36 0.59 0.11
p-value
0.42 0.07 0.15 0.27 0.64 0.52 0.29
113
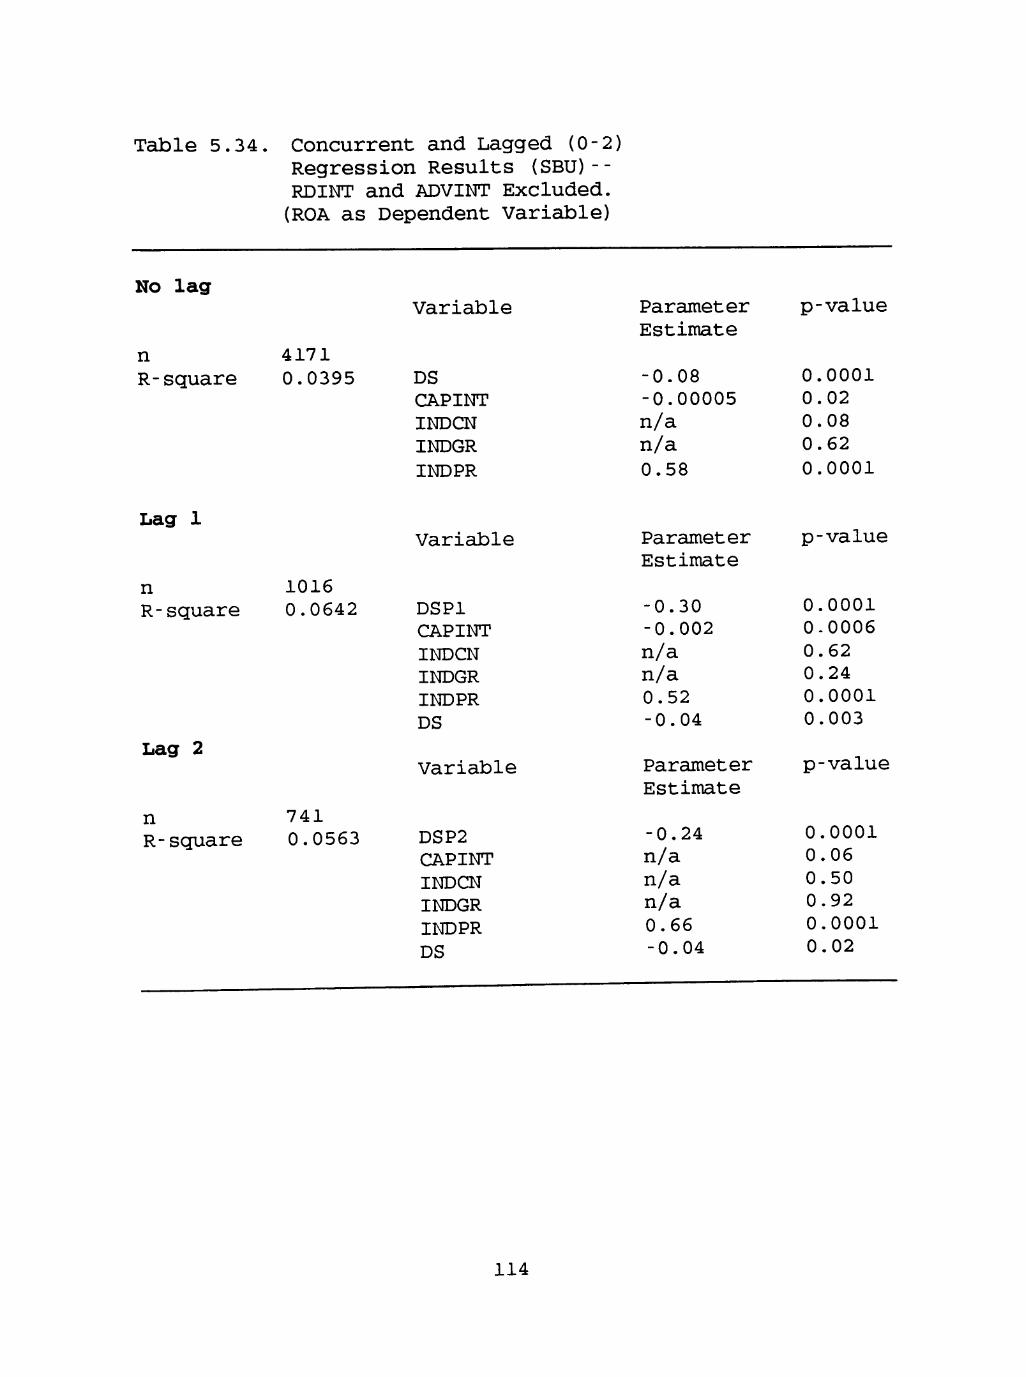
Table 5.34. Concurrent and Lagged (0-2) Regression Results (SBU)--RDINT and ADVINT Excluded. (ROA as Dependent Variable)
No lag
n R-square
Lag 1
n R-square
Lag 2
n R-square
4171 0.0395
1016 0.0642
741 0.0563
Variable
DS CAPINT INDCN INDGR INDPR
Variable
DSPl CAPINT INDCN INDGR INDPR DS
Variable
DSP2 CAPINT INDCN INDGR INDPR DS
Parameter Estimate
-0.08 -0.00005 n/a n/a 0.58
Parameter Estimate
-0.30 -0.002 n/a n/a 0.52 -0.04
Parameter Estimate
-0.24 n/a n/a n/a 0.66 -0.04
p-value
0.0001 0.02 0.08 0.62 0.0001
p-value
0.0001 0-0006 0.62 0.24 0.0001 0.003
p-value
0.0001 0.06 0.50 0.92 0.0001 0.02
114
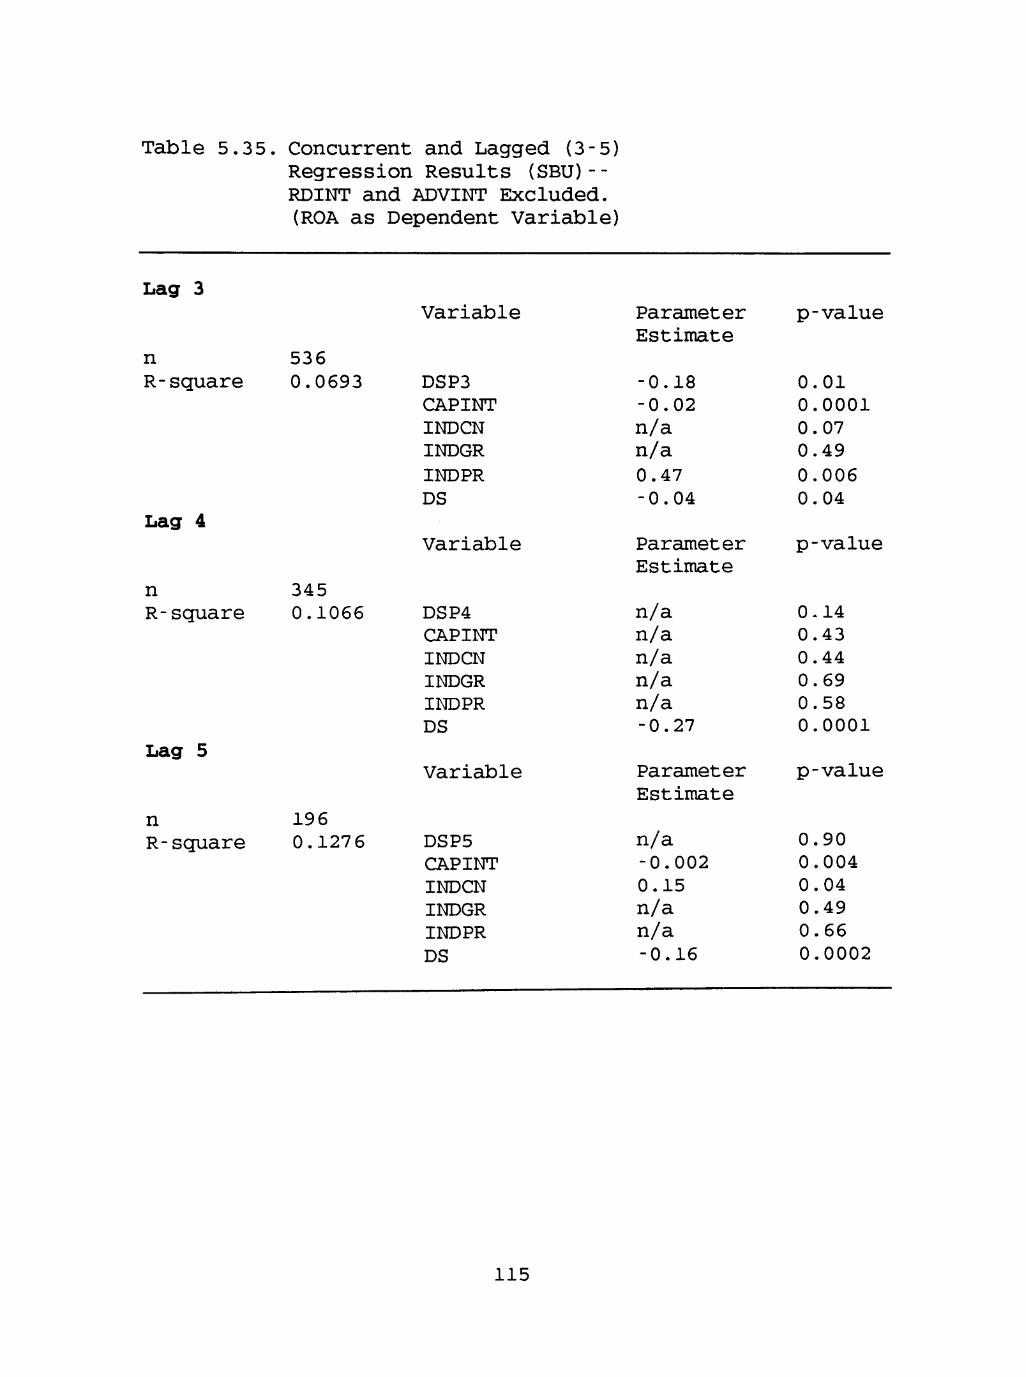
Table 5.35. Concurrent and Lagged (3-5) Regression Results (SBU)--RDINT and ADVINT Excluded. (ROA as Dependent Variable)
Lag 3
n R-square
Lag 4
n R-square
Lag 5
n R-square
536 0.0693
345 0.1066
196 0.1276
Variable
DSP3 CAPINT INDCN INDGR INDPR DS
Variable
DSP4 CAPINT INDCN INDGR INDPR DS
Variable
DSP5 CAPINT INDCN INDGR INDPR DS
Parameter Estimate
-0.18 -0.02 n/a n/a 0.47 -0.04
Parameter Estimate
n/a n/a n/a n/a n/a -0.27
Parameter Estimate
n/a -0.002 0.15 n/a n/a -0.16
p-value
0.01 0.0001 0.07 0.49 0.006 0.04
p-value
0-14 0.43 0.44 0.69 0.58 0.0001
p-value
0.90 0.004 0.04 0.49 0.66 0.0002
115

Table 5.36. Concurrent and Lagged (0-2) Regression Results (CORP)--All Variables Included. (ROA as Dependent Variable)
No lag
n R-square
Lag 1
n R-square
Lag 2
n R-square
425 0.2568
101 0.1512
71 0.1279
Variable
DS DIVER ADVINT CAPINT RDINT INDCN INDGR INDPR
Variable
DSPl DIVER ADVINT CAPINT RDINT INDCN INDGR INDPR DS
Variable
DSP2 DIVER ADVINT CAPINT RDINT INDCN INDGR INDPR DS
Parameter Estimate
-0.09 n/a n/a 0.08 -0.89 n/a n/a 0.43
Parameter Estimate
n/a n/a n/a n/a -1.28 n/a n/a n/a n/a
Parameter Estimate
n/a n/a n/a n/a n/a n/a n/a n/a n/a
p-value
0.003 0.78 0.39 0.0001 0.0001 0.91 0.48 0.002
p-value
0.27 0.48 0.18 0.80 0.006 0.73 0.68 0-47 0.92
p-value
0.67 0.31 0.35 0.51 0.20 0.42 0.53 0.56 0.88
116

Table 5.37. Concurrent and Lagged (3-5) Regression Results (CORP)- -All Variables Included. (ROA as Dependent Variable)
Lag 3
n R-square
Lag 4
n R-square
Lag 5
n R-square
59 0.5056
46 0.4590
27 0.6519
Variable
DSP3 DIVER ADVINT CAPINT RDINT INDCN INDGR INDPR DS
Variable
DSP4 DIVER ADVINT CAPINT RDINT INDCN INDGR INDPR DS
Variable
DSP5 DIVER ADVINT CAPINT RDINT INDCN INDGR INDPR DS
Parameter Estimate
n/a n/a n/a n/a -0.98 n/a n/a n/a n/a
Parameter Estimate
n/a n/a n/a n/a n/a n/a n/a n/a n/a
Parameter Estimate
n/a n/a n/a n/a n/a n/a n/a 0.81 n/a
p-value
0.37 0.63 0.16 0.06 0.001 0.30 0.72 0.30 0.37
p-value
0.63 0.24 0.12 0.23 0.09 0.07 0.06 0.98 0.07
p-value
0.25 0.72 0.16 0.43 0.71 0.48 0.15 0.01 0.21
117

Table 5.38. Concurrent and Lagged (0-2) Regression Results (CORP)- -RDINT Excluded. (ROA as Dependent Variable)
No lag
n R-square
Lag 1
n R-square
Lag 2
n R-square
680 0.0588
158 0.0724
118 0.1908
Variable
DS DIVER ADVINT CAPINT INDCN INDGR INDPR
Variable
DSPl DIVER ADVINT CAPINT INDCN INDGR INDPR DS
Variable
DSP2 DIVER ADVINT CAPINT INDCN INDGR INDPR DS
Parameter Estimate
n/a 0.004 n/a -0.01 n/a -0.02 0.23
Parameter Estimate
n/a 0.005 n/a n/a n/a n/a n/a n/a
Parameter Estimate
n/a n/a n/a n/a n/a -0.03 n/a -0.11
p-value
0-09 0-0001 0.45 0.009 0.94 0.008 0.05
p-value
0-43 0.04 0.07 0.69 0.64 0.19 0.51 0.50
p-value
0.63 0.13 0.22 0.55 0.74 0.0003 0.80 0.05
118

Table 5.39. Concurrent and Lagged (3-5) Regression Results (CORP)--RDINT Excluded. (ROA as Dependent Variable)
Lag 3
n R-square
94 0.1581
Lag 4
n R-square
73 0.2405
Lag 5
n R-square
48 0.5022
Variable
DSP3 DIVER ADVINT CAPINT INDCN INDGR INDPR DS
Variable
DSP4 DIVER ADVINT CAPINT INDCN INDGR INDPR DS
Variable
DSP5 DIVER ADVINT CAPINT INDCN INDGR INDPR DS
Parameter Estimate
n/a 0.005 n/a -0-07 n/a n/a n/a n/a
Parameter Estimate
n/a n/a n/a n/a n/a n/a n/a n/a
Parameter Estimate
n/a n/a n/a n/a n/a n/a 0.90 n/a
p-value
0.79 0.04 0.18 0.009 0.28 0.68 0.45 0.85
p-value
0.72 0.12 0.12 0.15 0.45 0.11 0.33 0.23
p-value
0.43 0.74 0.07 0.88 0.31 0.14 0.0001 0.21
119

Table 5.40. Concurrent and Lagged (0-2) Regression Results (CORP)- -RDINT and ADVINT Excluded. (ROA as Dependent Variable)
No Lag
n R-square
Lag 1
n R-square
Lag 2
n R-square
1690 0.1070
37 3 0.2117
311 0.2342
Variable
DS DIVER CAPINT INDCN INDGR INDPR
Variable
DSPl DIVER CAPINT INDCN INDGR INDPR DS
Variable
DSP2 DIVER CAPINT INDCN INDGR INDPR DS
Parameter Estimate
n/a 0.004 -0.01 n/a -0.02 0.34
Parameter Estimate
n/a 0.005 -0.02 n/a n/a n/a n/a
Parameter Estimate
n/a 0.003 -0.04 n/a -0.03 n/a n/a
p-value
0.15 0.0001 0.0001 0.64 0.003 0.0001
p-value
0.32 0.0004 0.0001 0.92 0.09 0.10 0.56
p-value
0.91 0.001 0-0001 0.82 0.0001 0.12 0.09
120

Table 5.41. Concurrent and Lagged (3-5) Regression Results (CORP)--RDINT and ADVINT Excluded. (ROA as Dependent Variable)
Lag 3
n R-square
Lag 4
n R-square
Lag 5
n R-square
250 0.2113
186 0-4821
130 0.3181
Variable
DSP3 DIVER CAPINT INDCN INDGR INDPR DS
Variable
DSP4 DIVER CAPINT INDCN INDGR INDPR DS
Variable
DSP5 DIVER CAPINT INDCN INDGR INDPR DS
Parameter Estimate
n/a 0.003 -0.008 n/a n/a 0.39 n/a
Parameter Estimate
n/a 0.002 -0.06 n/a n/a 0.34 n/a
Parameter Estimate
n/a n/a -0.04 n/a n/a 0.84 n/a
p-value
0.49 0.006 0.0001 0.79 0.61 0.004 0.86
p-value
0.57 0.005 0.0001 0.24 0.06 0.001 0.17
p-value
0.99 0.23 0.04 0-54 0.92 0.0001 0.09
121

Table 5.42 Concurrent and Lagged (0-2) Regression Results (CORP)--All Variables Included. (TOBQ as Dependent Variable)
No Lag
n R-square
406 0.0373
Lag 1
Variable
DS DIVER ADVINT CAPINT RDINT INDCN INDGR INDPR
Variable
n R-square
Lag 2
n R-square
98 0.1703
67 0.2562
DSPl DIVER ADVINT CAPINT RDINT INDCN INDGR INDPR DS
Variable
DSP2 DIVER ADVINT CAPINT RDINT INDCN INDGR INDPR DS
Parameter Estimate
n/a n/a -32.82 n/a n/a 10.16 n/a n/a
Parameter Estimate
n/a n/a n/a n/a n/a n/a n/a n/a -3.56
Parameter Estimate
39.26 n/a n/a n/a 195.72 n/a n/a n/a n/a
p-value
0.14 0.65 0.03 0.27 0.12 0.03 0.74 0.34
p-value
0.33 0.86 0.43 0-90 0.33 0.21 0.79 0.21 0.02
p-value
0.02 0.80 0.46 0.95 0.001 0.25 0.60 0.17 0.95
122

Table 5.43. Concurrent and Lagged (3-5) Regression Results (CORP)--All Variables included. (TOBQ as Dependent Variable)
Lag 3
n R-square
Lag 4
n R-scjuare
Lag 5
n R-square
56 0.5231
46 0.5720
27 0.8281
Variable
DSP3 DIVER ADVINT CAPINT RDINT INDCN INDGR INDPR DS
Variable
DSP4 DIVER ADVINT CAPINT RDINT INDCN INDGR INDPR DS
Variable
DSP5 DIVER ADVINT CAPINT RDINT INDCN INDGR INDPR DS
Parameter Estimate
21.07 n/a n/a n/a 76.99 n/a n/a n/a n/a
Parameter Estimate
n/a 0.09 15.76 n/a 22.90 n/a n/a n/a n/a
Parameter Estimate
n/a n/a 26.02 -2.99 17.55 n/a 6.96 n/a n/a
p-value
0.003 0.85 0.93 0.72 0.0001 0.16 0.14 0.09 0.19
p-value
0.15 0.05 0.01 0.11 0.0001 0.93 0.61 0.11 0.62
p-value
0.07 0.51 0.005 0.04 0.002 0.33 0.01 0.73 0.87
123
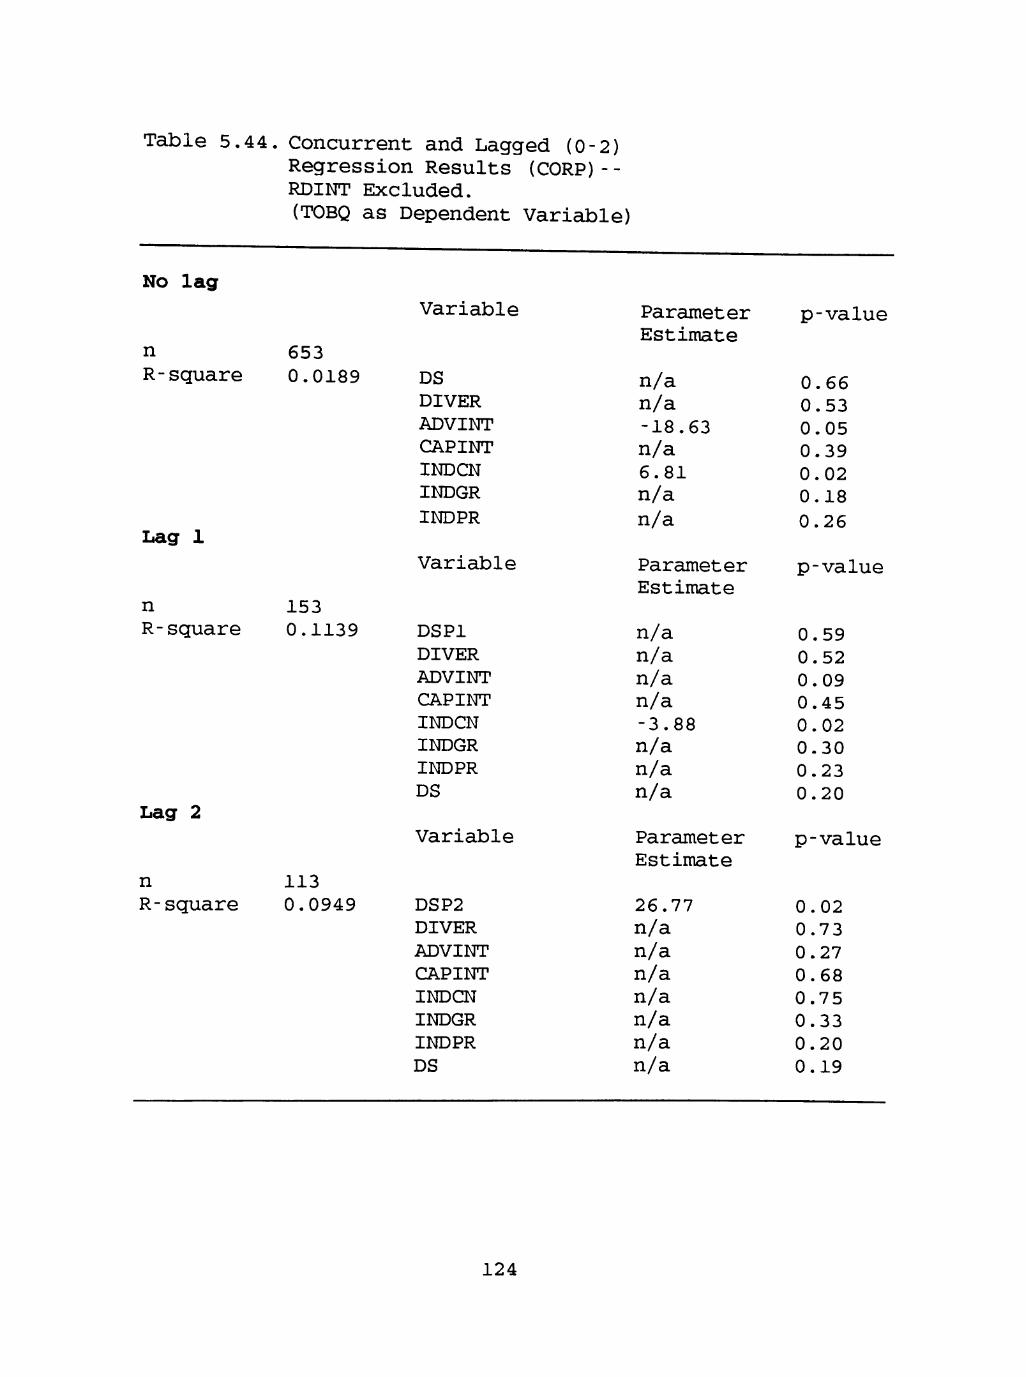
Table 5.44. Concurrent and Lagged (0-2) Regression Results (CORP)--RDINT Excluded. (TOBQ as Dependent Variable)
No lag
n R-square
Lag 1
n R-square
Lag 2
n R-square
653 0.0189
153 0.1139
113 0.0949
Variable
DS DIVER ADVINT CAPINT INDCN INDGR INDPR
Variable
DSPl DIVER ADVINT CAPINT INDCN INDGR INDPR DS
Variable
DSP2 DIVER ADVINT CAPINT INDCN INDGR INDPR DS
Parameter Estimate
n/a n/a -18.63 n/a 6.81 n/a n/a
Parameter Estimate
n/a n/a n/a n/a -3.88 n/a n/a n/a
Parameter Estimate
26.77 n/a n/a n/a n/a n/a n/a n/a
p-value
0.66 0.53 0.05 0.39 0.02 0.18 0.26
p-value
0.59 0.52 0.09 0.45 0.02 0.30 0.23 0.20
p-value
0.02 0.73 0.27 0.68 0.75 0.33 0.20 0.19
124
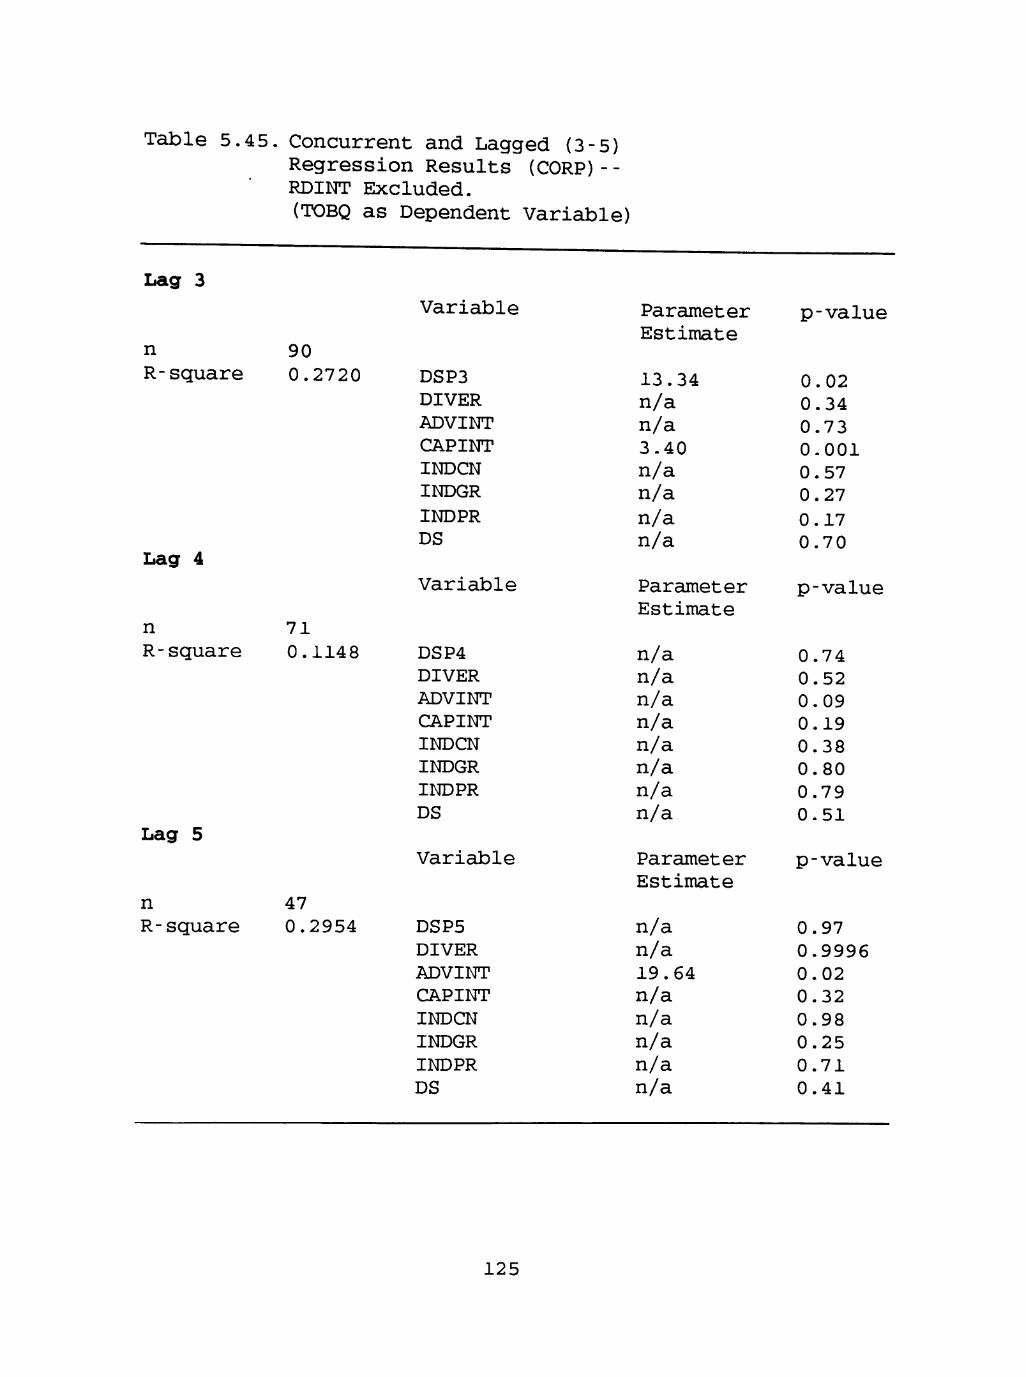
Table 5.45. Concurrent and Lagged (3-5) Regression Results (CORP)- -RDINT Excluded. (TOBQ as Dependent Variable)
Lag 3
n R-square
Lag 4
n R-square
Lag 5
n R-square
90 0.2720
71 0.1148
47 0.2954
Variable
DSP3 DIVER ADVINT CAPINT INDCN INDGR INDPR DS
Variable
DSP4 DIVER ADVINT CAPINT INDCN INDGR INDPR DS
Variable
DSP5 DIVER ADVINT CAPINT INDCN INDGR INDPR DS
Parameter Estimate
13.34 n/a n/a 3.40 n/a n/a n/a n/a
Parameter Estimate
n/a n/a n/a n/a n/a n/a n/a n/a
Parameter Estimate
n/a n/a 19.64 n/a n/a n/a n/a n/a
p-value
0.02 0.34 0.73 0-001 0.57 0.27 0.17 0.70
p-value
0.74 0.52 0.09 0.19 0.38 0.80 0.79 0.51
p-value
0.97 0.9996 0.02 0.32 0.98 0.25 0.71 0.41
125
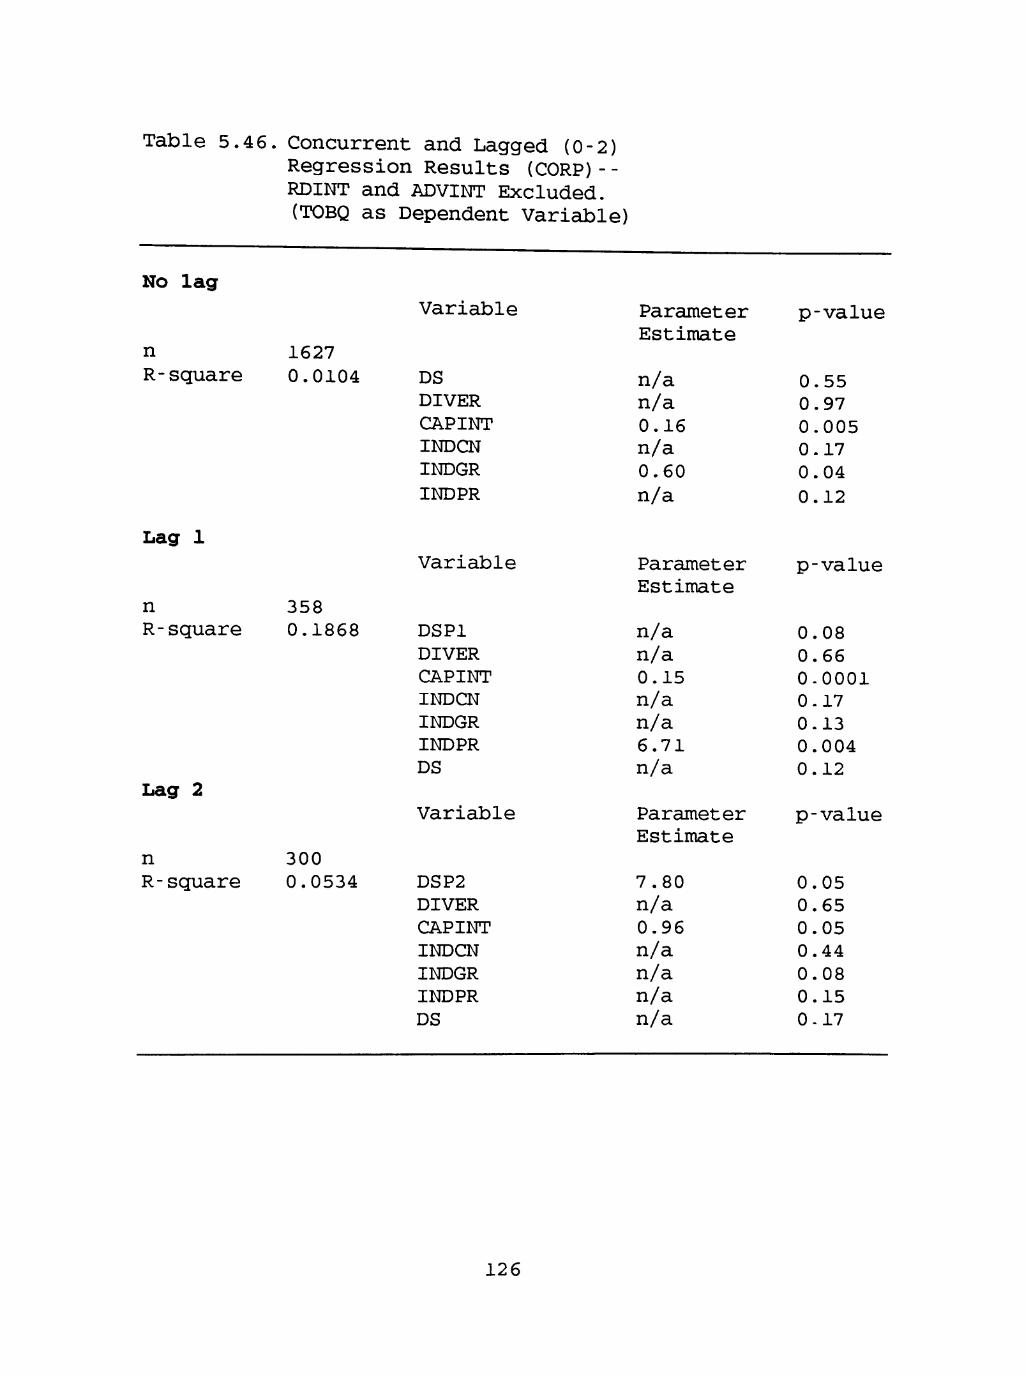
Table 5.46. Concurrent and Lagged (0-2) Regression Results (CORP)- -RDINT and ADVINT Excluded. (TOBQ as Dependent Variable)
No lag
n R-square
Lag 1
n R-square
Lag 2
n R-square
1627 0.0104
358 0.1868
300 0.0534
Variable
DS DIVER CAPINT INDCN INDGR INDPR
Variable
DSPl DIVER CAPINT INDCN INDGR INDPR DS
Variable
DSP2 DIVER CAPINT INDCN INDGR INDPR DS
Parameter Estimate
n/a n/a 0.16 n/a 0.60 n/a
Parameter Estimate
n/a n/a 0.15 n/a n/a 6.71 n/a
Parameter Estimate
7.80 n/a 0.96 n/a n/a n/a n/a
p-value
0.55 0.97 0.005 0.17 0.04 0.12
p-value
0.08 0.66 0-0001 0.17 0.13 0.004 0.12
p-value
0.05 0.65 0.05 0.44 0.08 0.15 0-17
126

Table 5.47. Concurrent and Lagged (3-5) Regression Results (CORP)--RDINT and ADVINT Excluded. (TOBQ as Dependent Variable)
Lag 3
Variable
n R-scjuare
Lag 4
n R-square
Lag 5
n R-square
242 0.1041
181 0.1400
126 0.2412
DSP3 DIVER CAPINT INDCN INDGR INDPR DS
Variable
DSP4 DIVER CAPINT INDCN INDGR INDPR DS
Variable
DSP5 DIVER CAPINT INDCN INDGR INDPR DS
Parameter Estimate
8.39 n/a 0.14 n/a n/a n/a n/a
Parameter Estimate
n/a n/a 0.82 n/a n/a n/a n/a
Parameter Estimate
15.60 n/a n/a -10.80 n/a 35.63 n/a
p-value
0.0001 0.84 0.003 0-46 0-40 0.21 0.67
p-value
0.88 0.99 0.0001 0.59 0.78 0.06 0.33
p-value
0.0007 0.09 0.15 0.003 0.34 0.002 0.73
127

CHAPTER VI
DISCUSSION AND CONCLUSIONS
This chapter presents an overview of the study,
including the research question and its importance; a
discussion of the results of the study and the conclusions
based on the results; and the implications for researchers
and practitioners. The strengths and limitations of the
study are discussed, and directions for further research are
presented.
The purpose of this study is to explore the relationship
between downsizing and performance. In this study,
downsizing is characterized as a facet of organizational
strategy for improving performance (Cameron, Freeman, &
Mishra, 1993). In this study downsizing is defined as an
intentional set of activities designed to improve
organizational performance, and which involves reductions in
personnel (Cameron, Freeman, & Mishra, 1993).
Since the 1980's through the present time, around ten
million jobs have been eliminated in the U.S. (Budros, 1997) .
Organizational downsizing has been called a "key feature" of
the system of "new capitalism," an economy characterized by
international competition, deregulation of industries, and
technological change (Budros, 1997). It is not clear whether
downsizing does indeed improve profitability, since despite
the prevalence of downsizing, it has not been studied much
128

(Cameron, 1994). Budros (1997) points out that expectations
are that downsizing will improve performance, and that
companies that downsized are generally seen as positive role
models and accjuire social benefits, whether or not operating
efficiencies are achieved. However, there are critics of
downsizing who point out various adverse effects, as well as
more emphasis on growth in recent years (Budros, 1997).
Because of the limited amount of theoretical and
empirical work on downsizing, especially linked with
performance issues, the primary research cguestion for this
study is: 'What is the impact of downsizing on corporate and
strategic business unit economic performance, controlling for
market conditions? This study contributes to the field by
examining performance outcomes after downsizing occurs in
corporations and strategic business units (SBU's).
The study employs multivariate regression analysis
(including time series cross-sectional regression) for the
inclusion of specific variables that could have an impact on
economic performance of an organization. The study uses
comprehensive multi-year, multi-industry ciata for the
examination of performance issues (measured both as
accounting-based and as hybrid market/accounting variables)
associated with downsizing, including industry structure
variables (industry concentration, industry growth, industry
profitability), corporate strategy variables
(diversification), and business unit strategy variables
129

(capital intensity, R&D intensity, advertising intensity).
This study addresses an issue that is underdeveloped
theoretically, but is widespread and iirportant for businesses
and the national economy.
Conclusions
Time Series Cross-Sectic^nai (TSCS) Regression--SBU LPVPI
Over the four models run (one with all independent
variables of downsizing, capital intensity, advertising
intensity, R&D intensity, industry concentration, industry
growth, and industry profitability; one with advertising
excluded; one with R&D intensity excluded; and one with both
advertising intensity and R&D intensity excluded) , downsizing
has a small negative effect on SBU ROA in the year of the
downsizing. The negative effect generally continues into the
year after the downsizing occurs (Lag l), and then
extinguishes. The exceptions to the early wash out are seen
only in the equation excluding advertising intensity (where
the negative effect reappears in the third year after
downsizing), and the equation excluding R&D intensity (where
the negative effect is seen only on the year of the
downsizing, is insignificant for the next two years, and then
becomes a small positive effect in the third year after
downsizing).
130
other variables that are shown to have an impact on SBU
ROA include capital intensity (generally negative and small,
in most concurrent and lagged equations); advertising
intensity (negative, and only in the concurrent equation) ;
R&D intensity (negative but weakening effect from the
concurrent year through the second year after downsizing);
industry concentration (positive in the Lag 2 ecjuation, only
when both advertising intensity and R&D intensity are
excluded); and industry profitability (positive throughout
most no lag and lagged periods).
TSCS Regression - Corporate Level (ROA)
Over the four models run (one with all independent
variables of downsizing, diversification, capital intensity,
advertising intensity, R&D intensity, industry concentration,
industry growth, and industry profitability; one with
advertising excluded; one with R&D intensity excluded; and
one with both advertising intensity and R&D intensity
excluded), downsizing has a small negative effect on
corporate ROA in the year of the downsizing. The corporate
ROA effects are similar to those found for the SBU ROA. The
negative effect generally continues into the year after the
downsizing occurs (Lag 1), and then abates. The negative
effect continues for two years after downsizing in the
ecjuation with all the independent variables. The exception
is seen only in the equation excluding R&D intensity where
131
the negative effect is seen only on the year of the
downsizing, is insignificant for the next two years, and then
becomes a small positive effect in the third year after
downsizing, again similar results to those obtained for SBU
ROA.
Other variables that are shown to have an impact on
corporate ROA include capital intensity (usually negative and
small, in most concurrent and lagged ecjuations) ; R&D
intensity (generally negative, although when advertising
intensity is excluded from the equation, it is positive in
the Lag l and Lag 2 periods) ; industry concentration
(negative for most concurrent and lagged equations) ; and
industry profitability (positive throughout all ecjuations,
both concurrent and lagged). interestingly, the
diversification variable is significant (and generally
positive) when either or both advertising intensity or R&D
intensity are excluded from the ecjuation.
TSCS Regression - Corporate Level (TQBQ)
Over the four models run (one with all independent
variables of downsizing, diversification, capital intensity,
advertising intensity, R&D intensity, industry concentration,
industry growth, and industry profitability; one with
advertising excluded; one with R & D intensity excluded; and
one with both advertising intensity and R&D intensity
excluded) , downsizing has a negative effect on corporate TOBQ
132
in the year of the downsizing. However, the downsizing
effect does not persist beyond the year of the downsizing,
except in one case, in the equation with all the variables,
the downsizing variable is insignificant for Lag 1 and Lag 2,
but reverses its sign and becomes positive in the third year
after downsizing (Lag 3). Interestingly, the downsizing
variable is never significant when R&D intensity is excluded
from the equation.
Other variables that are shown to have an impact on
corporate TOBQ include capital intensity (positive when
advertising intensity is excluded, no lag and Lag l; but
negative when all variables are included. Lag 2 and Lag 3);
industry concentration (negative for the concurrent and
lagged ecjuations when advertising and R&D intensity are
excluded); and industry profitability (positive throughout
all ecjuations, both concurrent and lagged, except the
equation excluding both advertising intensity and R&D
intensity). The diversification variable is significant (and
negative) only when advertising intensity is excluded from
the equation (no lag and Lag 2).
Base Year ROA or TQBQ as Independent Variables
The dependent variables for this analysis were the
lagged ROA and TOBQ (for one through five years after the
downsizing occurred).
133
SBU Level Results. These results show that downsizing
has a small negative effect on SBU ROA that appears three
years after the downsizing action, and then extinguishes
thereafter.
Corporate Level Results - ROA. This set of equations
show that downsizing has no effect on CORP ROA for one
through five years after the downsizing occurs.
Corporate Level Results - TQBQ. These results show that
downsizing has a positive effect on CORP TOBQ that only
appears four and five years after the downsizing action.
Two basic conclusions have been made with respect to the
time series and other above analyses: (l) there appears to
be a dampening effect of the downsizing impact over time, and
(2) SBU's seem to be more sensitive to the impact of
downsizing than are corporations. In this study, a more in-
depth analysis was done to further investigate and clarify
the relationship between downsizing and organizational
performance. The next section discusses the results from the
analysis done on only those SBU's or corporations that
downsized at least ten percent, and continues for the next
five years after the downsizing occurred.
Pooled Crnss-Sectional Regression Ppsnits - SBU
Only those SBU's which had downsized at least by 10
percent in a particular year are included for this set of
134

regressions, including the data for up to five years after
the downsizing occurred.
In the model with both advertising intensity and R & D
intensity excluded, downsizing has a negative effect on SBU
ROA in the year of the downsizing. The negative effect
persists for three years after the downsizing occurs (Lag 1,
Lag 2, and Lag 3) and then extinguishes.
Other variables that are shown to have an impact on SBU
ROA include downsizing in the current year (negative in all
lagged equations), capital intensity (negative and small);
and industry profitability (positive throughout the
concurrent. Lag 1, Lag 2, and Lag 3 periods).
Pooled Cross-Sectional Regression Results - Corporate ROA
Again, only those corporations which had downsized at
least by lO percent in a particular year are included for
this set of regressions, including the data for up to five
years after the downsizing occurred.
Over the three models run (one with all independent
variables of downsizing, diversification, capital intensity,
advertising intensity, R&D intensity, industry concentration,
industry growth, and industry profitability; one with R&D
intensity excluded; and one with both advertising intensity
and R&D intensity excluded), both current year downsizing
(control variable DS), and previous years downsizing (DSPl -
135
DSP5) are insignificant for corporate ROA in the year of the
downsizing, and all subsecjuent years measured, with two
exceptions. In the model with all variables, downsizing is
significant and negative for the concurrent equation, and in
the model with RDINT excluded, the current DS control
variable is significant and negative in the Lag 2 ecjuation.
The corporate ROA effects are different than those found for
SBU ROA. The negative effect is practically imperceptible;
in the comparable equations (the model with both RDINT and
ADVINT excluded) , downsizing has no effect on corporate ROA
in any year.
Other variables that are shown to have an impact on
corporate ROA include diversification (positive and very
small), capital intensity (usually negative and small, in
most concurrent and lagged ecjuations) ; R&D intensity
(negative); and industry profitability (positive).
In comparing the above SBU and corporate ROA analyses,
it appears that SBU's are more sensitive to downsizing than
are corporations, when controlling for many factors. Some
explanations for the apparent SBU ROA downsizing sensitivity
could include: (1) corporations do not downsize across SBU's
evenly, and SBU's have more market-specific activities; (2)
corporations may be able to recover faster than SBU's as they
can draw upon a more diffuse workforce enabling the overall
corporation to recoup and return to efficiency more rapidly a
single SBU; and (3) corporations can spread risk across
136
several SBU's, and the downsizing negative charges against
ROA are spread over the whole corporation, rather than a
particular SBU. Therefore, the following proposition is
presented:
Proposition 1
Strategic business unit ROA is more sensitive to downsizing
than is corporate ROA.
The study also shows that the negative impact of
downsizing on SBU ROA begins in the year of the downsizing,
then continues, but abates, for three years after the
downsizing took place, and then goes to insignificance for
the next two years.
Proposition 2
The impact of downsizing on SBU ROA is initially negative,
but the organization tends to recover to previous levels of
performance.
Proposition 3
SBU's with significant downsizing do not improve ROA
performance in the out years.
Differences in the impact of downsizing on ROA have been
found in this study, depending on the level of analysis.
137

whereby corporate ROA appears to be impervious (but not
improved either) to downsizing.
Proposition 4
Downsizing has minimal impact on corporate ROA, possibly due
to the impact being disproportionately absorbed by SBU's.
Pooled Cross-Sectional Regression Results - Corporate TQBQ
Over the three models run, downsizing is not significant
for corporate TOBQ in the year of the downsizing, nor for the
first year after downsizing. However, previous downsizing
has a positive effect on market value starting in the second
year (Lag 2) after the downsizing. In the equation with all
the variables, and the equation with RDINT excluded, the
previous downsizing variable is insignificant for Lag 1, is
positive in the second and third years after downsizing (Lag
2 and Lag 3), and is insignificant again for the fourth and
fifth years. In the comparable equations (the model with
both RDINT and ADVINT excluded) , the positive effect of
previous downsizing on market perceptions is the same as
above, but reappears in the fifth year after downsizing.
Other variables that are shown to have an impact on
corporate TOBQ include capital intensity (generally
positive); advertising intensity (negative in the concurrent
ecjuations, and positive in Lag 4 and Lag 5 equations);
138

industry concentration (positive for some concurrent
ecjuations, and negative for some lagged ecjuations); and
industry profitability (positive in the Lag 1 and Lag 5
ecjuations when both advertising intensity and R & D intensity
are excluded). The diversification variable is insignificant
throughout all the models, both concurrent and lagged
equations (except in one instance, where it is positive for
the Lag 4 ecjuation with all variables included) .
The above results show that there is little reaction
with respect to the Tobin's Q proxy, to corporate downsizing
within the year of the downsizing action. However, the
market value of downsized corporations seems to increase in
the years after the downsizing, starting in the second year.
One explanation could be that the market is slow to react,
given that it may take many months for a downsizing to
actually be implemented and be completed. The concurrent
year is the year the downsizing began, but may not be
completed. It often takes at least one full year or more to
downsize. Perhaps the market wants to see the downsizing
actually occur and what subsequently happens.
Proposition 5
Market reaction to downsizing, in terms of the Tobin's Q
proxy, appears to have a lagged effect.
139

Proposition 6
The reality of the downsizing (implementation) has a positive
effect on market value.
It is interesting that this study shows that SBU ROA is
negatively affected by downsizing (the negative effect
diminishes over time) ; and that corporate ROA is not affected
by downsizing, but corporate Tobin's Q is positively affected
by downsizing (albeit later in time).
Perhaps the market is looking for signs that a downsized
corporation is going to stabilize in performance.
Reconsidering the antecedents to downsizing/consequences of
downsizing puzzle, if a corporation had declining ROA's for
some years, then downsized and improved by arresting the
decline, the market may have positive perceptions.
Proposition 7
Lack of eroding ROA in downsized corporations leads to
increased market value.
Implications
Implications for Research
The results and conclusions of this study continue to
demonstrate the need to address performance implications when
examining strategic issues, such as downsizing. The study
shows that downsizing does have an effect on organizational
140
performance, even when controlling for other performance
related factors, in fact, the study shows that when
addressing organizational performance, many other factors
should be taken into account to better isolate the relative
effects of each factor, including downsizing.
The study also shows that it is important to address
performance not only in terms of accounting based measures,
but also in terms of market perceptions (for corporations) ,
as results may differ. This study shows that for
corporations that downsize at least by ten percent, the
accounting based measure ROA is not affected, but the hybrid
accounting/market measure Tobin's Q proxy, is positively
affected.
The study also affirms the value of examining strategic
issues over time, especially when looking at performance
after a strategic action such as downsizing. Concurrent
studies do not always reveal the entire picture; lagged
studies should be considered for many strategy research
issues. In this study, the value of lagged ecjuations is
clearly illustrated in showing the diminishing negative
effect of previous downsizing on SBU ROA, as well as the late
positive effect on corporate Tobin's Q, particularly in those
ecjuations where downsizing is represented as ten percent or
more.
Another issue for researchers in studying downsizing and
performance is the antecedent/consecjuence conundrum. More
141

research should be done on what precipitates the downsizing
action (e.g., past poor performance, changes in environment
or niche, organizational theory size issues, "new capitalism"
forces (Budros [1997], etc.), as well as what the
consequences are on future performance.
Another interesting facet brought up by this study is
the level of analysis issue for organizations. Again,
results may differ significantly depending on whether the
sample is composed of SBU's or corporations. This study
shows that SBU's are much more highly sensitive to downsizing
than corporations, in terms of ROA. The negative effect of
previous downsizing continues for three years for those SBU's
who have downsized ten percent or more, while the ROA for
corporations that have downsized at least ten percent is not
affected. More research is needed on the relationships,
similarities, and differences between corporations and
strategic business units, including how they may implement
and handle the consecjuences of downsizing.
It is also interesting to explore downsizing in terms of
strategic change, which has not always been done in the
strategy literature. Is downsizing a strategic response to
organizational decline? Does downsizing contribute to
organizational decline? Is downsizing truly part of the
process necessary for long term organizational improvements,
as Cascio (1993) suggests? This study shows that downsizing
effects persist for up to three years for SBU's, are almost
142
imperceptible for corporation in terms of ROA, and often do
not appear until the second year for corporations in terms of
market value.
Implications for Practice
This study helps to address the heretofore unresolved
cjuestion of whether downsizing has a positive or negative
effect on performance. The study shows that in general,
downsizing has a negative effect on SBU performance lasting
up to three years after the downsizing. An exception (a
small positive effect of downsizing) in the third year lagged
(time series only) equation without R&D intensity needs
further study, including the relationship between R&D
expenditures and downsizing. The study shows different
results with corporate performance, when measured as ROA, as
a very small negative effect for up to one year after the
downsizing, as in the time series regression, or no effect as
shown by the ten percent or more downsizers regression. When
corporate performance is measured as a Tobin's Q proxy (a
hybrid market/accounting measure), downsizing has a positive
effect that only appears by the second year (at least ten
percent downsizers only) or third year (time series) after
downsizing. The time series regressions show some early
negative effect of downsizing on Tobin's Q, but when those
corporations that downsized by ten percent or more are
examined, there are no negative effects seen.
143
One possible explanation for the initial (and
continuing, in the case of SBU's) negative impact on ROA is
that the accounting charges associated with downsizing
actions (e.g., severance packages, outplacement counseling,
early retirement incentives, etc.) are reflected in the year
of the downsizing, and sometimes for another year or longer.
It is interesting that the negative effect of downsizing on
ROA does abate, but that no positive effect is seen, even
after five years in the ten percent or more downsizer
ecjuations.
The downsizing effect on the Tobin's Q proxy is
positive for those corporations that downsized ten percent or
more, but only appearing two years after the downsizing. One
explanation may be that initially the market perceives that
the corporation is in trouble and therefore is downsizing.
(In the time series regression, a concurrent year negative
effect disappears in the year after downsizing.) Then later,
after the market sees how the organization copes with the
downsizing, it then rewards the downsized corporation.
Limitations and Strengths
Limitations
There are some limitations in this study arising from
the use of secondary data bases. For example, the researcher
cannot influence what types or forms of ciata are collected.
144
Some variables may not be available in the data base, and
there is little contextual information, it would be
interesting to know, for example, at what levels of the
organization was the downsizing being carried out.
Another limitation of the study is that is does not
attempt to test a set of hypotheses generated from the
existing literature, because of the lack of theory at this
time. However, the study contributes to theory building in
the nascent field of downsizing research, by testing a
tentative empirical model.
Another limitation is that only seven years of data were
available, so the effects of downsizing could be examined for
a period of up to only five years after the downsizing took
place.
Strengths
There are several strengths of the study. The study is
one of the first studies on the performance implications of
downsizing. This type of research on downsizing is currently
being called for in the organization science literature. It
is needed, not only in the academic world of scholarly
research, but also in the practitioner world of business.
This study attempts to answer the often asked question, "What
impact does downsizing have on the bottom line?" Strategy
researchers call for studies that investigate performance
relationships; businessmen and employees want to know if
145
downsizing will help their organizations, as conventional
wisdom tells them. The study should be of use to both
researchers and practitioners, in that it addresses an issue
that is of great importance and timeliness, not only to the
business world, but also to the national economy.
Another strength of this study is that it employs
multivariate analysis for the inclusion of many specific
variables that could have an impact on economic performance
of an organization. It uses a large multi-industry database,
which has a variety of organizations of different sizes.
The study also contributes in that it uses not only
corporate data, but also strategic business unit (SBU) data.
There is little research reported in the literature on
performance of SBU's, as SBU level data is often difficult to
obtain.
Directions for Future Research
The performance implications of downsizing need to be
studied further, both in breadth and depth. It would be
useful to have additional years of data to be able to follow
more strategic business units and corporations for a longer
period of time, especially to confirm the flex point of
performance change (i.e., the point at which the negative
effect of downsizing on SBU ROA washes out, and if it ever
goes to a positive effect).
14 6

The apparent disproportionate negative impact of
downsizing on SBU's vis-a-vis corporations should be examined
more closely. The SBU downsizing sensitivity issue would be
of interest to both researchers and those in industry.
The lagged positive effect of downsizing on the Tobin's
Q proxy is also interesting, and should be researched
further. Examining the relationship of market value and
downsizing, requires a closer look at what goes on in
antecedent years. The cjuestion of what primarily drives
downsizing is important.
Finally, this study puts forth some propositions which
may be useful in forming tentative hypotheses to be tested
with other data. The theoretical development of downsizing
and performance implications may be pushed forward.
147
REFERENCES
American Management Association. 1993. 1993 AMA Suirvey on Downsizing and Assistance to Displaced Workers, New York: American Management Association.
Amit, R., and Livnat, J. 1988. Diversification and the risk-return trade-off. Academy of Management Journal, Vol. 31, pp. 154-166.
Appelbaum, S. H., Simpson, R., and Shapiro, B. T. 1987. The tough test of downsizing. Organizational Dynamics, Autumn, pp. 68-79.
Baily, M. N., Bartelsman, E. J., and Haltiwanger, J. 1994. Downsizing and productivity growth: Myth or reality?, NBER Working Paper Series, Working Paper No. 47 41, May, Cambridge, MA: National Bureau of Economic Research.
Barker, V. L. Ill, and Duhaime, I. M. 1997. Strategic change in the turnaround process: Theory and empirical evidence, Strategic Management Journal, Vol. 18, No. l, pp. 13-38.
Barker, V. L. Ill, and Mone, M. A. 1994. Retrenchment: Cause of turnaround or consequence of decline?. Strategic Management Journal, Vol. 15, pp. 395-405.
Beard, D. W., and Dess, G. G. 1981. Corporate-level strategy, business-level strategy, and firm performance. Academy of Management Journal, Vol. 24, No. 4, pp. 663-688.
Bethel, J. E., and Liebeskind, J. 1993. The effects of ownership structure on corporate restructuring. Strategic Management Journal, Vol. 14, Summer Special Issue, pp. 15-31.
Bluedorn, A. C. 1993. Pilgrim's progress: Trends and convergence in research on organizational size and environments. Journal of Management, Vol. 19, No. 2, pp. 163-191.
Bowman, R. G. 1980. The irrportance of a market value measurement of debt in assessing leverage. Journal of Accounting Research, Vol. 18. pp. 242-254.
148
Bowman, E. H., and Singh, H. 1990. Overview of corporate restructuring trends and consequences. In Corporate Restructuring, eds. M. L. Rock and R. H. Rock, pp 8-22 New York: McGraw-Hill.
Bowman, E. H., and Singh, H. 1993. Corporate restructuring: Reconfiguring the firm. Strategic Management Journal Vol. 14, Summer Special Issue, pp. 5-14.
Brockner, j. 1992. Managing the effects of layoffs on survivors, California Management Review, winter, po 9-28. ' i -
Brockner, J. 1995. Towards enhancing survivors' organizational and personal reactions to layoffs: A rejoinder to Daniels, Strategic Management Journal, Vol 16, No. 4, pp- 329-331.
Brockner, j., Grover, s.. Reed, T. F., De Witt, R. L., and O'Malley, M. N. 1987. Survivors' reactions to layoffs: We get by with a little help for our friends. Administrative Science Quarterly, Vol. 32, pp. 241-261.
Brockner, J., Davy, j., and Carter, C. 1988. Layoffs, self-esteem, and survivor guilt: Motivational, affective, and attitudinal consequences. In In Readings in Organizational Decline, eds. K. S. Cameron, R. i. Sutton, and D. A. Whetten, pp. 279-290. Cambridge, Mass.: Ballinger.
Brockner, J., Grover, S., O'Malley, M. N., Reed, T. F., and Glynn, M. A. 1993. Threat of future layoffs, self-esteem, and survivors' reactions: Evidence from the laboratory and the field. Strategic Management Journal, Vol. 14, Summer Special Issue, pp. 153-166.
Bruton, G. D., Keels, J. K., and Shook, C. L. 1996. Downsizing the firm: Answering the strategic questions. Academy of Management Executive, Vol. 10, No. 2, pp. 38-45.
Budros, A. 1997. Rationality: The adoption of downsizing programs, 1979-1994, Social Forces, Vol. 76, No. 1, pp. 229-250.
Byrne, J. A. 1994. The pain of downsizing. Business Week, May 9. pp. 60-69.
149
Cameron, K. S. 1994. Guest editor's note: Investigating organizational downsizing - fundamental issues. Human Resource Management, Vol. 33, pp. 183-188.
Cameron, K. S., Kim, M. u., and Whetten, D. A. 1987. Organizational effects of decline and turbulence. Administrative Science Quarterly, Vol. 32, pp. 222-240.
Cameron, K. S., Whetten, D. A., and Kim, M. u. 1987. Organizational dysfunctions of decline. Academy of Management Journal, Vol. 30, No. 1, pp. 126-138.
Cameron, K. S., Sutton, R. I., and Whetten, D. A. 1988. Issues in organizational decline. In Readings in Organizational Decline, eds. K. S. Cameron, R. I. Sutton, and D. A. Whetten, pp. 3-19. Cambridge, Mass.: Ballinger.
Cameron, K. S., and Freeman, S. J., and Mishra, A. K. 1993. Downsizing and redesigning organizations. In Organizational Change and Redesign, eds. G. P. Huber and W. H. Glick, pp. 19-65. New York: Oxford University Press.
Cameron, K. S., and Freeman, S. J., and Mishra, A. K. 1991. Best-practices in white-collar downsizing: Managing contradictions. Academy of Management Executive, Vol. 5, No. 3, pp. 57-7 3.
Capon, N., Farley, J. U., and Hoenig, S. 1990. Determinants of finacial performance: A meta-analysis. Management Science, Vol. 36, No. 10, pp. 114 3-1159.
Cascio, W. F. 1993. Downsizing: What do we know? What have we learned?. Academy of Management Executive, Vol. 7, No. 1, pp- 95-104.
Chang, S. J. 1996. An evolutionary perspective on diversification and corporate restructuring: Entry, exit, and economic performance during 1981-1989, Strategic Management Journal, Vol. 17, No- 8, pp. 587-611.
Child, J. 1982. Discussion note: Divisionalization and size: A comment on the Donaldson/Grinyer debate. Organization Studies, Vol. 3, No. 4, pp. 351-353.
Christensen, H., and Montgomery, C. 1981. Corporate economic performance: Diversification strategy versus market structure. Strategic Management Journal, Vol. 2, pp. 327-343.
150
Christenson, j. A., and Sachs, C. E. 1980. The impact of government size and number of administrative units on the quality of public services. Administrative Science Quarterly, Vol. 25, pp. 89-101.
Damanpour, F. 1992. Organizational size and innovation. Organization Studies, Vol. 13, No. 3, pp. 375-402.
Daniels, K. 1995. A comment on Brockner et al. (1993), Strategic Management Journal, Vol. 16, No. 4, pp. 325-328.
D'Aveni, R. A. 1989. The aftermath of organizational decline: A longitudinal study of the strategic and managerial characteristics of declining firms, Acadenv^ of Management Journal, Vol. 32, No. 3, pp. 577-605.
Davis, R., and Duhaime, I. M. 1992. Diversification, vertical integration, and industry analysis: New perspectives and measurement. Strategic Management Journal, Vol. 13, No. 7, pp. 511-524.
De Meuse, K. P., Bergmann, T. J., and Vanderheiden, P. A. 1997. Corporate downsizing: Separating myth from fact. Journal of Management Inquiry, Vol. 6, No. 2, pp. 168-17 6.
DeWitt, R. 1993. The structural consequences of downsizing, Orgranization Science, Vol. 4, No. l, pp. 30-40.
DeWitt, R. 1998. Firm, industry, and strategy influences on choice of downsizing approach. Strategic Management Journal, Vol. 19, No. 1, pp. 59-79.
Donaldson, L. 1982. Divisionalization and size: A theoretical and empirical critique. Organization Studies, Vol. 3, No. 4, pp. 321-337.
Duhaime, I. M., and Baird, I. S. 1987. Divestment decisionmaking: The role of business size. Journal of Management, Vol. 13, No. 3, pp. 483-498.
Duhaime, I. M., and Grant, J. H. 1984. Factors influencing divestment decision-making: Evidence from a field study. Strategic Management Journal, Vol. 5, pp. 301-318.
Ford, J. D. 1980a. The occurrence of structural hysteresis in declining organizations. Academy of Management Review, Vol. 5, No- 4, pp. 589-598.
151
Ford, J. D. 1980b. The administrative component in growing and declining organizations: A longitudinal analysis. Academy of Management Journal, Vol. 23, No. 4, pp. 615-630.
Freeman, S. J., and Cameron, K. S. 1993. Organizational downsizing: A convergence and reorientation framework. Organization Science, Vol. 4, No. 1, pp. 10-29.
Ginsberg, A. 1988. Measuring and modelling changes in strategy: Theoretical foundations and empirical directions. Strategic Management Journal, Vol. 9, No. 6, pp. 559-575.
Gomez-Mejia, L. R., Tosi, H., and, Hinkin, T. 1987. Managerial control, performance, and executive compensation. Academy of Management Journal, Vol. 30, pp. 51-70.
Gooding, R. z., and Wagner, J. A. III. 1985. A meta-analytic view of the relationship between size and performance: The productivity and efficiency of organizations and their subunits. Administrative Science Quarterly, Vol. 30, pp. 462-481.
Greenhalgh, L. 1982. Maintaining organizational effectiveness during organizational retrenchment. The Journal of Applied Behavioral Science, Vol. 18, No. 2, pp. 155-17 0.
Greenhalgh, L., Lawrence, A. T., and Sutton, R. I. 1988. Determinants of work force reduction strategies in declining organizations. Academy of Management Review, Vol. 13, No. 2, pp. 241-254.
Grinyer, P. H. 1982. Discussion note: Divisionalization and size: A rejoinder. Organization Studies, Vol. 3, No. 4, pp. 339-350.
Grinyer, P. H., and Yasai-Ardekani, M. 1981. Strategy, structure, size, and bureaucracy. Academy of Management Journal, Vol. 24, No. 3, pp. 471-486.
Gutknecht, J. E. , and Keys, J. B. 1993. Mergers, acquisitions and takeovers: Maintaining morale of survivors and protecting employees. Academy of Management Executive, Vol. 7, No. 3, pp. 26-36.
Hambrick, D. C. , and D'Aveni, R. A. 1988. Large corporate failures as downward spirals. Administrative Science Quarterly, Vol. 33, pp. 1-23.
152

Hansen, G. B. 1988. Layoffs, plant closings, and worker displacement in America: Serious problems that need a national solution. Journal of Social Issues, Vol. 44, No. 4, pp. 153-171.
Hardy, C. 1987. Investing in retrenchment: Avoiding the hidden costs, California Management Review, Vol. 29, No. 4, pp. 111-125.
Harrigan, K. R. 1980. Strategy formulation in declining industries. Academy of Management Review, Vol. 5, No. 4, pp. 599-604.
Harrison, B. 1994. Lean and Mean: The Changing Landscape of Corporate Power in the Age of Flexibility. New York: BasicBooks.
Hatfield, D. E., Liebeskind, J. P., and Opler, T. C. 1996. The effects of corporate restructuring on aggregate industry specialization, Strategic Management Journal, Vol. 17, No. 1, pp. 55-72.
Haveman, H. A. 1993. Organizational size and change: Diversification in the savings and loan industry after deregulation. Administrative Science Quarterly, Vol. 38, pp. 20-50.
Hendricks, C. S. 1992. The Rightsizing Remedy: How Managers Can Respond to the Downsizing Dilemma. Homewood, 111.: Business One Irwin; Alexandria, Va.: Society for Human Resource Management.
Henkoff, R. 1993. The White House search for axmen. Fortune, May 17, p. 13.
Hill, C. W. L., Hitt, M. A., and Hoskisson, R. E. 1992. Cooperative versus competitive structures in related and unrelated diversified firms, Orgranization Science, Vol. 3, No. 4, pp. 501-521.
Hitt, M. A., and Keats, B. W. 1992. Strategic leadership and restructuring: A reciprocal interdependence. In Strategic Leadership: A Multiorganizational-Level Perspective, eds. R. L. Phillips and J. G. Hunt, pp. 45-61. Westport, Conn.: Quorum.
Hofer, C. W. 1980. Turnaround strategies. Journal of Business Strategy, Vol. 1, pp. 19-31.
153

Hoskisson, R. E., and Hitt, M. A. 1990. Antecedents and performance outcomes of diversification: A review and critique of theoretical perspectives. Journal of Management, Vol. 16, No. 2, pp. 461-509.
Hoskisson, R. E., Hitt, M. A., and Hill, c. W. 1991. Managerial risk taking in diversified firms: An evolutionary perspective. Organization Science, Vol. 2, No. 3, pp. 296-314.
Hoskisson, R. 0., and Johnson, R. A. 1992. Corporate restructuring and strategic change: The effect on diversification strategy and R&D intensity. Strategic Management Journal, Vol. 13, pp. 625-634.
Kirkpatrick, D. 1993. Lou Gerstner's first 30 days. Fortune, May 31, pp. 57-62.
Kozlowski, S. W. J., Chao, G. T., Smith, E. M., and Hedlund, J. 1993. Organizational downsizing: Strategies, interventions, and research implications. In International Review of Industrial and Organizational Psychology, Vol. 8, eds. C. L. Cooper and I. T. Robertson, pp. 263-332. New York: Wiley.
Lee, P. M. 1997. A corporate analysis of layoff announcements and stock price reactions in the United States and Japan, Strategic Management Journal, Vol. 18, No. 11, pp. 879-894.
Lesly, E., and Light, L. 1992. When layoffs alone don't turn the tide. Business Week, December 7, pp. lOO-iOl.
Lewis, W. W. 1990. Strategic restructuring: A critical requirement in the search for corporate potential. In Corporate Restructuring, eds. M. L. Rock and R. H. Rock, pp. 43-55. New York: McGraw-Hill.
Lindenberg, F., and Ross, S. 1981. Tobin's q ratio and industrial organization. Journal of Business. January, pp. 1-32.
Lubatkin, M., and Shrieves, R. E. 1986. Toward reconciliation of market performance measures to strategic management research. Academy of Management Review, Vol. 11, No. 3, pp. 497-512.
Lubatkin, M., Merchant, H., and Srinivasan, N. 1993. Construct validity of some unweighted product- count diversification measures. Strategic Management Journal, Vol. 14, No. 6, pp. 433-449.
154
Ludwig, D. C. 1993. Adapting to a declining environment: Lessons from a religious order. Organization Science, Vol'. 4, No. 1, pp. 41-56.
Markham, S. E., and McKee, G. H. 1991. Declining organizational size and increasing unemployment rates: Predicting employee absenteeism from within- and between-plant perspectives. Academy of Management Journal, Vol. 34, No. 4, pp. 952-965.
Markides, C. C. 1992. Consequences of corporate refocusing: Ex ante evidence. Academy of Management Journal, Vol. 35, No. 2, pp. 398-412.
Markides, C. C. 1995. Diversification, restructuring, and economic performance. Strategic Management Journal, Vol. 16, No. 2, pp. 101-118.
McCune, J. T., Beatty, R. W. , and Montagno, R. V. 1988. Downsizing: Practices in manufacturing firms. Human Resource Management, Vol. 27, No. 2, pp. 145-161.
McKinley, W. 1987. Complexity and acininistrative intensity: The case of declining organizations. Administrative Science Quarterly, Vol. 32, pp. 87-105.
McKinley, W. 1992. Decreasing organizational size: To untangle or not to untangle?. Academy of Management Review, Vol. 17, No. 1, pp. 112-123.
McKinley, W. 1993. Organizational decline and adaptation: Theoretical controversies. Organization Science, Vol. 4, No. 1, pp. 1- 9.
Mellow, W. 1982. Employer size and wages. Review of Economics and Statistics, Vol. 64, pp. 495-501.
Meyer, A. D. 1982. Adapting to environmental jolts. Administrative Science Quarterly, Vol. 27, pp. 515-537.
Meyer, A. D. 1991. What is strategy's distinctive competence?. Journal of Management, Vol. 17, No. 4, pp. 821-833.
Miles, R. E., and Snow, C. C. 1978. Organizational strategy, structure and process. New York: McGraw-Hill.
155
Montgomery, C. A., and Thomas, A. R. 1988. Divestment: Motives and gains. Strategic Management Journal, Vol. 9, No. 1, pp. 93-97.
Montgomery, C. A., and Wernerfelt, B. 1991. Sources of superior performance: Market share versus industry effects in the U. S. brewing industry. Management Science, Vol. 37, pp. 954-959.
Mullaney, A, D. 1989. Downsizing: How one hospital responded to decreasing demand. Health Care Management Review, Vol. 14, No. 3, pp. 41-48.
Murray, V. v., and Jick, T. D. 1985- Taking stock of organizational decline management: Some issues and illustrations from an empirical study. Journal of Management, Vol. 11, No. 3, pp. 111-123.
Neter, J., Wasserman, w., and Kutner, M. H. 1989. Applied Linear Statistical Models, (2nd ed.). Homewood, 111.: Irwin.
Niven, D. 1993. When times get tough, what happens to TQM?, Harvard Business Review, May-June, pp. 20-34.
Pearce, J. A. II, and Robbins, D. K. 1994. Retrenchment remains the foundation of business turnaround. Strategic Management Journal, Vol. 15, pp. 407-417.
Peters, T. 1992. Rethinking scale, California Management Review, Fall, pp. 7-29.
Porter, M. E. 1980. Competitive Strategy: Techniques for Analyzing Industries and Competitors. New York: The Free Press.
Porter, M. E. 1985. Competitive Advantage. New York: The Free Press.
Price, R. H., and D'Aunno, T. 1983. Managing workforce reduction. Human Resource Management, Vol. 22, No. 4, pp. 413-430.
Rajagopalan, N., and Prescott, J. E. 1990. Determinants of top management compensation: Explaining the impact of economic, behavioral, and strategic constructs, and the moderating effects of industry. Journal of Management, vol. 16, pp. 515-538.
156

Ramanujam V and Venkatramn, N. 1984. An inventory and ZadlZV^M^^^^ research using the PIMS database. Academy of Management Review, Vol. 9, No. l, pp. 138-
Robbins, D. K., and Pearcp .T Z TT IQQO m. ^ pot-r--nr.>,rr,«t ticirce, J. A., II. 1992. Turnaround: v^? ?? ^ """ recovery. Strategic Management Journal, Vol. 13, pp. 287-309.
Robertsc.n, j. M. 1987. Downsizing to meet strategic ?o]^?^^^®^' ^^^^^"^^^ Productivity Review, Vol. 3, pp.
Rock, M. L., and Rock, R. H. 1990. Introduction. In Corporate Restructuring, eds. M. L. Rock and R. H. Rock, pp. 1-6. New York: McGraw-Hill.
Rumelt, R. P. 1991. How much does industry matter?. Strategic Management Journal, Vol. 12, pp. 167-185.
Singh, H. 1993. Challenges in researching corporate restructuring. Journal of Management Studies, Vol. 30. No. 1, pp. 147-172.
Smith, K. G., Guthrie, J. P., and Chen, M. 1989. Strategy, size, and performance. Organization Studies, Vol. 10, No. 1, pp. 63-81.
Stopford, J. M., and Baden-Fuller, C. 1990. Corporate rejuvenation. Journal of Management Studies, Vol. 27, No. 4, pp. 399-415.
Sutton, R. I., and D'Aunno, T. 1989. Decreasing organizational size: Untangling the effects of money and people. Academy of Management Review, Vol. 14, No. 2, pp. 194-212.
Sutton, R. I., and D'Aunno, T. 1992. Building a model of work force reduction that is grounded in pertinent theory and data: Reply to McKinley, Academy of Management Review, Vol. 17, No. 1, pp. 124-137.
Tomasko, R. M. 1987. Downsizing: Reshaping the Corporation for the Future. New York: AMACOM.
Tushman, M. L., and Romanelli, E. 1985. Organizational evolution: A metamorphosis model of convergence and reorientation. In Research in Organizational Behavior, Vol. 7, eds. L. L. Cummings and B. M. Staw- Greenwich, CT: JAI Press.
157
Uchitelle, L., and Kleinfield, N. 1996. On the battlefields of business, millions of casualties. New York Times, March 3, p. 1.
Varadarajan, R., and Ramanujam, V. 1987. Diversification and performance: A reexamination using a new two-dimensional conceptualization of diversity in firms. Academy of Management Journal, Vol. 30, No. 2, pp. 380-393.
Venkatraman, N., and Ramanujam, V. 1986. Measurement of business performance in strategy research: A comparison of approaches. Academy of Management Review, Vol. 11, No. 4, pp. 801-814.
Villemez, W. J., and Bridges, W. P. 1988. When bigger is better: Differences in the individual-level effect of firm and establishment size, American Sociological Review, Vol. 53. pp. 237-255.
Weitzel, W., and Jonsson, E. 1989. Decline in organizations: A literature integration and extension, Ac2ministrative Science Quarterly, Vol. 34, pp. 91-109.
Weitzel, W., and Jonsson, E. 1991. Reversing the downward spiral: Lessons from W. T. Grant and Sears Roebuck, Academy of Management Executive, Vol. 5, No. 3, pp. 7-22.
Whetten, D. A. 1980. Organizational decline: A neglected topic in the organizational sciences. Academy of Management Review, Vol. 4, pp. 577-588.
Wilson, E. 1980. Socio-Biology. Cambridge, Mass.: Harvard University Press.
Wiseman, R. M., and Bromiley, P. 1996. Toward a model of risk in declining organizations: An empirical investigation of risk, performance, and decline. Organization Science, Vol. 7, No. 5, pp. 524-543.
Wong, L., and Davis, A. L. 1993. Managing work-force reduction with incentives: The effects of the perceived value of the incentive and incentive-taker exposure. Academy of Management Best Paper Proceedings, pp. 27 2-27 6.
Wong, L., and McNally, J. 1994. Downsizing the Army: Some policy implications affecting the survivors. Armed Forces and Society, Vol. 20, No. 2, pp. 199-216.
158
Woo, C. Y., Willard, G. E., and Daellenbach, U. S. 1992. Spin-off performance: A case of overstated expectations?. Strategic Management Journal, Vol. 13, pp 433-447.
Wright, P., and Ferris, S. P. 1997. Agency conflict and corporate strategy: The effect of divestment on corporate value. Strategic Management Journal, Vol. 18, No. 1, pp. 77-83.
Zammuto, R. F., and Cameron, K. S. 1985. Environmental decline and organizational response. Research in Organizational Behavior, Vol. 7, pp. 223-262.
159