
Coping with Floods, Strengthening Growth - worldbank.org€¦ · The team of authors comprises...
84
SOUTH EAST EUROPE Regular Economic Report January 2015 No. 7 Coping with Floods, Strengthening Growth BOSNIA AND HERZEGOVINA SERBIA KOSOVO MONTENEGRO FYR MACEDONIA ALBANIA
Transcript of Coping with Floods, Strengthening Growth - worldbank.org€¦ · The team of authors comprises...

View this report online:www.worldbank.org/eca/seerer
SOUTH EAST EUROPE Regular Economic Report
January 2015
No. 7
Coping with Floods,Strengthening Growth
South E
ast Europe R
egular Econom
ic Report
No.7
January 2015
BOSNIA AND HERZEGOVINA SERBIA
KOSOVOMONTENEGRO
FYR MACEDONIA
ALBANIA


Report No. 93611-ECA
South East Europe Regular Economic Report No.7
Coping with Floods, Strengthening Growth
January 2015

Acknowledgments
This Regular Economic Report (RER) covers economic developments, prospects, and economic policies in six South Eastern European countries (SEE6): Albania, Bosnia and Herzegovina, Kosovo, FYR Macedonia, Montenegro, and Serbia.
The report is produced twice a year by staff of economists at the World Bank working on the Western Balkans. The team of authors comprises Gallina A Vincelette (task team leader and lead author), Anil Onal (lead author), Simon Davies (lead author), Abebe Adugna, Agim Demukaj, Doerte Doemeland, Sandra Hlivnjak, Johanna Jaeger, Suzana Petrovic, Lazar Sestović, Sanja Madzarević-Sujster, Hilda Shijaku and Bojan Shimbov. Mizuho Kida, Anna Raggl, Erika Jorgensen, Joaquin Toro, Fernanda Senra de Moura provided inputs on global developments and global outlook, migration, the global economic impact of climate change, the economic impact of weather-related shocks in SEE6, respectively. Budy Wirasmo provided assistance in designing this report. Maria Andreina Clower, Nejme Kotere, and Dragana Varezić provided team assistance.
Dissemination of the report and external and media relations is managed by an EXT team comprising Lundrim Aliu, Anita Bozinovska, Ana Gjokutaj, Jasmina Hadzić, Andrew Kircher, Vesna Kostić, Mirjana Popovć, John Mackedon, Kristyn Schrader-King.
The team is grateful to Ellen Goldstein (Country Director, South Eastern Europe), Satu Kähkönen (Director, Macroeconomics and Fiscal Management Global Practice), Ivailo Izvorski (Practice Manager, Macroeconomics and Fiscal Management Global Practice) and the South Eastern Europe Country Management team for their guidance in the preparation of this report. The team is thankful for comments on earlier drafts of this report received from Central Banks and Ministries of Finance in the SEE6 countries.
This and previous SEE RERs may be found at: www.worldbank.org/eca

Standard Disclaimer:
This volume is a product of the staff of the International Bank for Reconstruction and Development/ The World Bank. The findings, interpretations, and conclusions expressed in this paper do not necessarily reflect the views of the Executive Directors of The World Bank or the governments they represent. The World Bank does not guarantee the accuracy of the data included in this work. The boundaries, colors, denominations, and other information shown on any map in this work do not imply any judgment on the part of The World Bank concerning the legal status of any territory or the endorsement or acceptance of such boundaries.
Copyright Statement:
The material in this publication is copyrighted. Copying and/or transmitting portions or all of this work without permission may be a violation of applicable law. The International Bank for Reconstruction and Development/ The World Bank encourages dissemination of its work and will normally grant permission to reproduce portions of the work promptly. For permission to photocopy or reprint any part of this work, please send a request with complete information to the Copyright Clearance Center, Inc., 222 Rosewood Drive, Danvers, MA 01923, USA, telephone 978-750-8400, fax 978-750-4470, http://www.copyright.com/. All other queries on rights and licenses, including subsidiary rights, should be addressed to the Office of the Publisher, The World Bank, 1818 H Street NW, Washington, DC 20433, USA, fax 202-522-2422, e-mail [email protected].

Contents
Summary 1
I. Recent Economic Development 7Real Sector 7Foreign Trade and External Sector 14Labor Market 21Public Finances and Debt 25Inflation, Monetary and Exchange Rate Policies 30Financial Sector 33
II. Prospects 43
III. Spotlights 51Spotlight I. Economic Impact of Climate Change in SEE with Lessons from
FYR Macedonia Green Growth Study 51Spotlight II. Insights into Migration in SEE6 55
Annex: Macroeconomic Indicators 63
SOUTH EAST EUROPE REGULAR ECONOMIC REPORT NO.7
Iv | CONTENTs

List of Figures
Figure 1: Real GDP Growth, 2012–14 7Figure 2: Quarterly Real GDP Growth, 2013–14 10Figure 3: Quarterly Industrial Production, 2013–14 10Figure BII.1: Exposure of economic activity and population to a once in a hundred
year flood in SEE6 13Figure 4: Current Account Balance, H1 2013–14 14Figure 5: Trade Balance, H1 2013–14 14Figure 6: Export Growth, H1 2013–14 15Figure 7: Import Growth, H1 2013–14 15Figure 8: Remittances, H1 2013–14 16Figure 9: Net FDI, H1 2013–14 16Figure 10: Current Account Financing, H1 2014 16Figure 11: Doing Business: Distance to Frontier 17Figure 12: Average SEE6 External Debt 18Figure 13: SEE6 External Debt by countries 18Figure 14: Employment in the SEE6, Q2 2008–Q2 2014 21Figure 15: Unemployment Rates in the SEE6, Q2 2008–Q2 2014 21Figure 16: Unemployment and GDP Growth, 1993–2011 22Figure 17: Labor Force Participation Rates in the SEE6, Q2 2014 22Figure 18: Doing Business - Rigidity of Employment, 2008–14 23Figure 19: Rigidity of Hours, 2008–14 23Figure 20: Doing Business - Difficulty of Hiring, 2008–14 23Figure 21: Difficulty of Redundancy, 2008–14 23Figure 22: Doing Business - Minimum Wage, 2008–14 24Figure 23: Notice Period for Redundancy, 2008–14 24Figure 24: Severance Pay for Redundancy, 2008–14 24Figure 25: Percent Change in Fiscal Deficit in January–September, 2013–14 25Figure 26: Fiscal Deficit, 2013–14 25Figure 27: Contribution to Change in Deficit, 2014 25Figure 28: Revenue, 2013–14 26Figure 29: Expenditure, 2013–14 26Figure 30: Public Capital Expenditures, 2008–13 27Figure 31: Trend in Public Debt, 2009–2014 28Figure 32: Public Debt, Q2 2014 28Figure 33: SEE6 Public Debt by Residency, 2009–Q2 2014 29
CONTENTs | v
COPING WITH FLOODS, STRENGTHENING GROWTH

Figure 34: Effective Interest Rates on Public Debt, 2007–13 29Figure 35: CPI Inflation 31Figure 36: Regional CPI Inflation Comparison 31Figure 37: Food Price Inflation 31Figure 38: Energy Price Inflation 31Figure 39: Official Policy Rates 32Figure 40: Real Broad Money Supply 32Figure 41: Non-performing Loans 33Figure 42: Credit Growth Rates 33Figure 43: Loan-to-Deposit Ratios 34Figure 44: Return on Assets (RoA) 34Figure 45: Liquidity Ratio 35Figure 46: Capital Adequacy Ratio 35Figure 47: Funding and Funding Costs for SEE6 36Figure 48: BIS Cross-Border Claims, 2013:Q2–2014:Q2 36Figure 49: Share of Employment in Agriculture, 2012 39Figure 50: Share of Individuals Living in Rural Areas 39Figure SI.1. Met and Unmet Demand for Irrigation Water, 2050 53Figure SI.2. Impact of Adaptation Scenarios on Agriculture, 2011–50 53Figure SII.1: Age distribution of emigrants to OECD countries as compared to
source country, 2005 55Figure SII.2: Education of emigrants and source country population in 2005, Albania 56Figure SII.3: Education of emigrants and source country population in 2005, Bosnia
and Herzegovina 56Figure SII.4: Education of emigrants and source country population in 2005, FYR Macedonia 57Figure SII.5: Education of emigrants and source country population in 2005, Serbia 57Figure SII.6: Proportion of Physicians Trained in the Country and Working Abroad:
SEE6 Countries, 1991–2004 57Figure SII.7: Population change due to natural increase and net migration, 2005–10 58Figure SII.8: Expected population change due to natural increase and net migration, 2025–30 58Figure SII.9: Male (left part) and female (right part) population by age group: source
country and emigrants to OECD, Albania 2005 59Figure SII.10: Male (left part) and female (right part) population by age group:
source country and emigrants to OECD, Serbia 2005 59Figure AI.1: Real GDP: Percentage Change since Pre-Crisis Peak 65Figure AI.2: Real GDP Growth Projections for 2015 65Figure AI.3: Unemployment Rate 66
SOUTH EAST EUROPE REGULAR ECONOMIC REPORT NO.7
vI | CONTENTs

Figure AI.4: Fiscal Balance 66Figure AI.5: Public Debt 67Figure AI.6: Export Growth 67Figure AI.7: Import Growth 68Figure AI.8: Current Account Balance 68Figure AI.9: Non-Performing Loans 69Figure AI.10: Ease of Doing Business 69
CONTENTs | vII
COPING WITH FLOODS, STRENGTHENING GROWTH

List of Tables
Southeast Europe Real Gross Domestic Product (GDP) Growth, 2013–15 1Table 1: Projections of Real GDP Growth in 2014 7Table BIII.1: Long-run steady state and speed of convergence for SEE6 19Table BIII.2: Long-run steady state and speed of convergence for BiH, FYR
Macedonia and Serbia 20Table IV.1: Developments in the Banking Sector, 2008 and 2013 Comparison 37Table 2. Real GDP Growth, 2013–15 43Table SII.1: Share of migrant stock in source region population, in percent 55Table AI.1: SEE6: Select Economic Indicators and Projections, 2012–14 63
List of Boxes
Box I: Global Economic Developments 8Box II. The Economic Impact of Weather-Related Shocks in SEE6 11Box III. Current Account Sustainability in the SEE6 Economies 18Box IV. Financing the SEE6 Banking System 36Box V: Potential Effects of the Ukraine Crisis on the SEE6 Economies 45Box VI: SEE6’s EU Accession Progress 48Box SII.I. A Medical Brain Drain? 57
SOUTH EAST EUROPE REGULAR ECONOMIC REPORT NO.7
vIII | CONTENTs


Recent Developments
The South East Europe (SEE6)’s economy is estimated to have stagnated in 2014 on the back of flood-induced contraction in Serbia and a sharp slowdown in Bosnia and Herzegovina and Montenegro.1 The regional economy grew 0.2 percent in 2014, insufficient to improve living standards or to make a dent in the region’s high unemployment rate. External demand for SEE6 exports was a key positive contributor to economic growth in 2014 as the region’s exports gained market share, despite the weak Eurozone performance and disappointing global recovery. Domestic demand remained subdued because of delayed or reduced public and private investments and weak consumption. Devastating floods in large parts of the region further weighed on the SEE6 economic activity in 2014.
The weak regional economic performance masks notable differences among the SEE6 countries. In 2014, the Serbian economy is estimated to have contracted by 2 percent—for a third time since the global crisis—and Bosnia and Herzegovina is stagnating. Economic growth rates in Kosovo and Montenegro are estimated to have moderated in 2014. Only Albania and FYR Macedonia showed signs of a more sustained recovery on the back of
1 The SEE6 includes Albania, Bosnia and Herzegovina, Kosovo, FYR Macedonia, Montenegro, and Serbia. The report also routinely refers to the EU11 and EU15 as comparators. The EU11 includes new member states excluding Cyprus and Malta. The EU15 includes the older member states, again excluding Cyprus and Malta.
increasing exports, particularly in the second half of the year.
The floods were the main culprit behind the weak domestic demand and the overall sluggish economic performance in SEE6. The floods in May 2014 are estimated to have cost Bosnia and Herzegovina around 15 percent of GDP in lost output and damages and Serbia around 4.7 percent of GDP. Damaged power generation facilities hurt businesses in Serbia and damaged crops harmed agricultural output in Bosnia and Herzegovina. Almost no segment of these two economies went unharmed. The significant impact of the recent weather shocks suggests that SEE6 countries are not well-prepared for increased weather variation.
Robust exports only partially offset the SEE6’s weak domestic demand, leaving external imbalances in vulnerability. Four SEE6 countries (except Albania and
summary
southeast Europe Real Gross Domestic Product (GDP) Growth, 2013–15
percent
2013 2014e 2015f
ALB 1.4 2.1 3.0
BIH 2.5 0.4 1.5
KOS 3.4 2.5 3.0
MKD 2.7 3.3 3.5
MNE 3.3 1.5 3.4
SRB 2.6 -2.0 -0.5
SEE6 2.5 0.2 1.3
Memo item: Eurozone -0.4 0.8 1.1
Source: National statistical offices and World Bank projections. Note: SEE6 is a weighted average.
sUMMARy | 1
COPING WITH FLOODS, STRENGTHENING GROWTH

Montenegro) saw increased exports in the first half of 2014. Serbia and FYR Macedonia had double digit export growth in the first half of 2014, driven by high value industrial products (cars and electrical machinery). Despite reasonable export performance and lower import oil prices in the second half of 2014, imports for reconstruction following the floods in the region increased) leading to widening current account deficits in the region. External debt of the SEE6 also rose by 3.5 percentage points of GDP in 2014 to an average of 68.9 percent of GDP.
The average fiscal deficit in SEE6 is estimated to have increased by 0.4 percent of GDP to 4.2 percent in 2014 due to faster growth in expenditures than revenues. Expenditures are projected to have increased as a share of GDP in Albania (partially due to payment of government arrears), Bosnia and Herzegovina and Serbia (partially due to post-flood reconstruction spending), but to have decreased somewhat in the other three SEE6 countries. Increased tax revenues in the year to September in all SEE6 countries (except Kosovo) were unable to offset the rise in public spending. The largest fiscal deficit increase in 2014 is expected in Bosnia and Herzegovina (from 1.9 in 2013 to 4.5 percent of GDP by end-2014). Serbia also is expected to have deteriorated its fiscal position (from 5.6 in 2013 to 7.9 percent of GDP by end-2014), and has remained the SEE6 country with the largest fiscal deficit.
Public debt is estimated to have risen by 3 percent of GDP in 2014, increasing average SEE6 debt levels to 52.3 percent of GDP. This hike represents a continuous increase since the onset of the global crisis: between 2009 and 2014, the average public debt-to-GDP ratio
in the SEE6 is estimated to have increased by almost 18 percent of GDP. Public debt levels are above 60 percent of GDP in three SEE6 countries (Albania, Montenegro and Serbia). Albeit at lower levels, public debt in Bosnia and Herzegovina and FYR Macedonia continued to increase and has exceeded 40 percent of GDP by end-2014. Kosovo still has a low level of public debt, but the recent upward trends raise concerns.
The 2015 Outlook
The SEE6 region as a whole is projected to grow 1.3 percent in 2015, supported by a slowly recovering external demand, especially in Europe, and stabilization of international energy prices at around current levels. In the base line scenario, external demand will remain a key driver of growth in support of SEE6 industrial activity and export growth. Domestic demand in SEE6 is likely to remain subdued amidst weak consumer and business confidence and despite lower oil prices and household and government efforts to rebuild after the recent floods. Confidence will be dampened by lingering political uncertainty, chronically high unemployment, weak business climate, and banking systems saddled with high nonperforming loans. SEE labor market performance is likely to worsen (or at best remain stagnant) as the 2014 growth slowdown in Serbia and Bosnia and Herzegovina will likely be reflected in labor market outcomes with some lag. In contrast, marginal improvements in the employment rate in the faster growing SEE6 can be expected. Fiscal consolidation efforts are set to continue in 2015 in SEE6, with the exception of Montenegro where the start of a highway construction project will
SOUTH EAST EUROPE REGULAR ECONOMIC REPORT NO.7
2 | sUMMARy

widen considerably the fiscal deficit. On the external side, the current account balances of the SEE6 are likely to stabilize at around current levels, as expected increases in external demand for SEE6 exports are largely offset by rising imports in support of domestic demand.
Growth is expected to be positive throughout the SEE6 with the exception of Serbia. Serbia is likely to remain in recession amidst weak domestic demand and difficult fiscal consolidation. Bosnia and Herzegovina is likely to start a gradual recovery. Albania, Kosovo, FYR Macedonia and Montenegro are expected to grow above 3 percent in 2015.
The SEE6 growth forecasts carry downside risks. The key risks include: (i) the effects of the ongoing and planned fiscal consolidation and privatization programs could adversely impact public support for reforms; (ii) the risk of deflation may continue to put downside pressures on growth; (iii) poor economic performance in the Eurozone would limit external demand for SEE exports and financing availability to SEE6 countries; (iv) given their strong ties with the EU and Russia, the SEE6 economies are vulnerable to the effects of potentially intensifying geopolitical tensions stemming from the Russia-Ukraine crisis; and (v) the region has shown high vulnerability to adverse weather conditions. On the positive side, low oil prices may help to boost growth and reduce current account deficits.
Structural challenges continue to hold back potential growth in SEE6. The functioning of the labor markets across the region is anemic with persistently high unemployment rates, low labor force participation rates, and sluggish formal job creation. Even though some
progress has been made in easing the burdens of the investment climate, there is still room for improvement. The public sector is large and inefficient in many countries in the region. For all countries, investment in improved, well-maintained, and/or upgraded capital stocks would help to replace the current obsolete infrastructure and help to boost economic potential, provided such investments are with positive economic returns and do not threaten the sustainability of public debt. Improved connectivity of the SEE6 region through physical and institutional linkages among the SEE6, to the EU, and to the rest of the world, will help competitive SEE6 firms reach new markets and foreign investors brought to the region. Advancement in the EU accession process represents an opportunity for the SEE6 to pursue a EU integration agenda also with a positive impact on potential growth. Economic growth in the near- and the medium-term in SEE6 can be supported through sound and well-prioritized economic policies that will tackle these structural impediments.
sUMMARy | 3
COPING WITH FLOODS, STRENGTHENING GROWTH


The SEE6 economic recovery faltered as weather shocks hit the region in 2014. The May 2014 floods devastated the economies of Bosnia and Herzegovina and Serbia, leading to estimated damages and losses totaling around 15 percent of GDP and 4.7 percent of GDP, respectively. These losses are comparable to the devastating floods in Thailand in 2011, which a Damage and Loss Assessment placed at around 14 percent of GDP.2 The Serbian economy is estimated to have contracted by 2.0 percent and the Bosnia and Herzegovinian economy is expected to have stagnated at 0.4 percent in 2014 despite some improvement in the second half of the year (Table 1). Adverse weather also weakened growth in Montenegro, reducing tourism and electricity exports. Exacerbated by a drop in manufacturing, these developments mean that the SEE6 is expected to barely escape stagnation in 2014, growing by a meager 0.2 percent, significantly below the 1.9 percent May forecast.3
However, average regional economic performance masks differences among the SEE6 countries. Albania and FYR Macedonia are not estimated to have experienced any
2 See World Bank 2011. Thai Flood 2011: Rapid Assessment for Resilient Recovery and Reconstruction Planning.
3 See World Bank. 2014. South East Europe Regular Economic Report No 6: Brittle Recovery. May 2014. Washington DC.
slowdown in their growth performance, unlike the rest of the SEE6. Both of these economies remained unaffected by the weather shocks. Furthermore, increasing tourism exports in Albania and FDI-related exports in FYR
I. Recent Economic Development
Real Sector
Figure 1: Real GDP Growth, 2012–14
percent
-3
ALB BIH KOS MKD MNE SRB SEE6
4
3
2
1
0
-1
-2
J 2012 J 2013 J 2014e
Source: National statistical offices and World Bank projections.
Table 1: Projections of Real GDP Growth in 2014
May 2014 January 2015
ALB 2.1 2.1
BIH 2.0 0.4
KOS 3.5 2.5
MKD 3.0 3.3
MNE 3.2 1.5
SRB 1.0 -2.0
SEE6 1.9 0.2
Source: World Bank projections.
I. RECENT ECONOMIC DEvELOPMENT | 7
COPING WITH FLOODS, STRENGTHENING GROWTH

Macedonia, coupled with strengthening domestic demand, are expected to have lifted growth in 2014. In contrast, growth rates in Kosovo and Montenegro are estimated to have moderated in 2014 relative to 2013, while Serbia is estimated to have fallen into recession and Bosnia and Herzegovina is facing stagnation in 2014.
In addition to the weather, three factors contributed to the faltering SEE6 regional growth prospects in 2014 both on the domestic and external fronts: (i) Public investments, which are a large
impetus to growth across the region, were delayed or cut in many countries. For example, planned investments were not executed in Kosovo and Albania. In the latter, public investments were cut also
as a part of broad fiscal consolidation program. Uncertainty around general elections in Bosnia and Herzegovina and Serbia caused some delays in investments. In Montenegro, not only has the start date of the initial works on a highway construction been postponed to 2015, but private investments were also lower than expected.
(ii) Slowdown in several advanced and emerging economies has reduced the global growth with consequences for SEE6 economic performance. Notably, this includes the inability of the Eurozone countries to bounce back, the slowdown of China, and the recession in Russia. Even though external demand for SEE6 exports had a positive impact on growth, its contribution was limited (Box I).
Box I: Global Economic Developments
The world economy is still struggling to gain momentum as many high-income countries continue to grapple with the legacies of the global financial crisis. Global growth picked up only marginally to 2.6 percent in 2014 from 2.5 percent in 2013. Growth in high income countries has increasingly diverged, with the United States gaining momentum while the Euro Area and Japan lagging behind. In the United States, apart from a temporary contraction at the beginning of 2014, growth has been above potential since mid-2013 and in the third quarter of 2014 reached its fastest pace since 2003. The recovery has been supported by highly accommodative monetary policy, which bolstered capital market valuations, and easing fiscal consolidation. Improving labor markets have been marked by robust job creation and gradually increasing wage growth. Housing market conditions have improved while declining oil prices are boosting real household incomes. With slack in the economy diminishing, the first hike in the federal funds rate is expected around mid-2015, but the tightening is likely to be gradual due to subdued inflation expectations. In the Euro Area, activity has been weaker than anticipated, especially in France, Germany, and Italy. Concerns about long-term prospects and the legacies of the crisis (especially impaired balance sheets and high unemployment) weigh on a fragile recovery and diminish expected growth benefits from sustained low oil prices. Bank recapitalization efforts and continued deleveraging could still constrain bank lending in some parts of the Euro Area, despite the successful completion of the European Central Bank’s (ECB) Asset Quality Review and the move to place the largest banks under single supervision. Financial fragmentation, high unemployment, structural rigidities, and unresolved fiscal challenges are likely to dampen the recovery. In Japan, at 0.2 percent, growth in 2014 fell significantly short of expectations as the
continued to next page
SOUTH EAST EUROPE REGULAR ECONOMIC REPORT NO.7
8 | I. RECENT ECONOMIC DEvELOPMENT

(iii) Falling oil prices toward the end of 2014 are expected to have had an upside effect on the SEE6 countries growth performance. As oil-importing countries, the SEE6 benefited from the decline in oil prices in 2014, with the exception of Albania due to its large oil exports.
The SEE6 regional economy started to slow down in the first half of 2014. Growth across the region had already decelerated to a rate of 1.4 percent in the first quarter of 2014 (year-
on-year) from 2.4 percent in the first quarter of 2013 (year-on-year) (Figure 2). In the second quarter of 2014, the economy of the region contracted by 0.03 percent (year-on-year). FYR Macedonia is the only country where growth picked up in the first half of 2014 due to increasing public investments and FDI-financed exports.4 Available data suggests that a regional recovery is likely to be pulled down
4 FYR Macedonia 2013 GDP figures have been revised down to 2.7 percent. The quarterly figures are yet to be revised.
economy struggled to recover from a sales tax increase in April 2014, and, until mid-2014, exports remained subdued despite a weak yen, reflecting soft global demand, the relocation of production facilities overseas, and rising cost of energy imports since the shutdown of nuclear reactors. While unemployment is low, labor force participation remains below pre-crisis levels, and real wage growth is subdued. In June 2014, the government announced a range of product and labor market reforms, broadly in line with OECD recommendations, and is expected to speed up their implementation after December 2014 elections. Growth in developing countries slipped to 4.4 percent in 2014. The slowdown in several large middle-income economies mainly reflects cyclical factors, domestic policy tightening, and political tensions. However, deeper, structural factors, including a trend slowdown in productivity, dampen growth prospects over the medium-term. Since the post-crisis rebound, output growth in the developing world has settled at a pace below that of the first decade of the 2000s. A sharp decline in oil and other commodity prices and softening growth, partly due to tighter monetary policies, is helping reduce inflation pressures. In low-income countries, growth remained robust on the back of rising public investment, robust capital inflows, good harvests, and improving security in a few conflict countries (e.g., Myanmar, Central African Republic, Mali). The moderation in global food and energy prices in 2014 contributed to a decline in inflation which was particularly substantial in Sub-Saharan Africa.
Benign financing conditions through much of 2014 have allowed developing countries to continue to tap international bond markets at a record pace even though financial markets became more turbulent later in the year. As major central banks have expressed their commitment to maintain exceptionally accommodative policies to support activity, markets have tended to interpret negative news as a reason for further monetary policy accommodation. As a result, corrections in equity and high-yield bond markets, in response to several outbreaks of geopolitical conflict or disease epidemics, were quickly recouped. Expectations of increasingly divergent monetary policies across major central banks have also triggered a broad-based appreciation of the U.S. dollar and renewed pressure on some developing-country currencies. Central and Eastern European currencies, closely tied to the euro and affected by geopolitical turmoil in the region, have depreciated substantially against the U.S. dollar, though not against the euro. A number of commodity exporters, particularly Russia and those in Latin America, have also seen renewed exchange rate pressures, reflecting the combined impact of a broad-based dollar strengthening, softening commodity prices, and domestic uncertainties.
continued from previous page
I. RECENT ECONOMIC DEvELOPMENT | 9
COPING WITH FLOODS, STRENGTHENING GROWTH

in the third quarter as the largest economy of the region, Serbia, contracted at a rate of 3.6 percent due to declining industrial and construction activity despite the rest of the countries showing signs of increased economic activity.
Weather shocks reduced the productive capacity in energy and agriculture in the SEE6 region. Agriculture was one of the main
sectors hit hard by the May 2014 floods. In Bosnia and Herzegovina, agricultural value added contracted by 10.9 percent in the second quarter of 2014 (year-on-year) and 10.2 percent in the third quarter of 2014 (year-on-year) while electricity value added declined by 12.6 percent (year-on-year) and 4.0 percent (year-on-year) over the same period.5 In Serbia, energy sector output between May and October
5 Agricultural value added includes also forestry and fishing whereas electricity value added includes also gas, steam, and air conditioning supply.
2014, after the floods, was 33 percent lower than in the same period of 2013. The energy sector accounts for 3.4 percent of GDP and about 15 percent of the total industrial output in Serbia. This decline, therefore, contributes to about one third of the overall projected 2 percent contraction in Serbia’s GDP in 2014. Agricultural production and exports are expected to feel the effects of the floods through the second half of the year.
Industrial production growth was negative in most countries. Overall, growth in industrial production had already decelerated in the first quarter of 2014 across all countries in the region except FYR Macedonia. In the subsequent two quarters, the situation got significantly worse in Montenegro and Serbia, where industrial production contracted by as much as 26 percent. Albania saw its manufacturing, construction, and transport services sectors experience large contractions in the first half of 2014 due partly to reduced public investments but Albanian industrial
Figure 2: Quarterly Real GDP Growth, 2013–14
Figure 3: Quarterly Industrial Production, 2013–14
percent change from the same quarter of the previous year percent change from the same quarter of the previous year
-4
-3
ALB BIH MKD MNE SRB SEE5
5
4
3
2
1
0
-2
-1
Q1 Q2 Q3 Q1 Q2 Q3 Q1 Q2 Q3 Q1 Q2 Q3 Q1 Q2 Q3 Q1 Q2 Q3-30
25
20
15
10
5
0
-5
-10
-15
-20
-25
ALB BIH MKD MNE SRB
Q1 Q2 Q3 Q1 Q2 Q3 Q1 Q2 Q3 Q1 Q2 Q3 Q1 Q2 Q3
J 2013 J 2014 J 2013 J 2014
Source: National statistical offices.Note: Q3 2013 SEE6 average does not include Montenegro since data is not yet available.
Source: National statistical offices.
SOUTH EAST EUROPE REGULAR ECONOMIC REPORT NO.7
10 | I. RECENT ECONOMIC DEvELOPMENT

production recovered somewhat in the third quarter (inching up by around 2.5 percent), in Bosnia and Herzegovina the contraction that started in the second quarter eased in the third quarter. Industrial production in FYR Macedonia continued to expand partly because of sustained external demand (Figure 3).
The SEE6 regional export performance had a mildly positive impact on growth in the first half of 2014. Serbia, FYR Macedonia and Kosovo had strong export growth in the first half of 2014. In Serbia and FYR Macedonia, export growth was driven by high value industrial products (cars and electrical machinery) demanded in the European market and produced by FDI-financed factories. Kosovo’s exports increased due to a broadening of its production base, but they still remained low as share of GDP (less than 20 percent of GDP, among the lowest in the world) and are concentrated on raw materials. Exports from these three countries accounted for more than
half of SEE6 total exports in 2014, driving the positive contribution of exports in overall SEE6 growth. Exports from Montenegro declined by 11.8 percent in the year to November compared to same period 2013, mostly due to a drop in electricity exports impacted by extreme weather conditions as well as an annual overhaul of a thermal power plant that lasted longer than foreseen.
Exports are expected to have positively contributed to economic growth in the second half of 2014. The effects are likely to be relatively large in Albania, where the rate of growth in the second half is expected to compensate for the weak performance in the first two quarters, leading to mild growth acceleration from 1.4 percent in 2013 to 2.1 percent in 2014. Montenegro is also expected to benefit from increasing tourism revenues, but they are likely to fall short of compensating for the weak growth performance in the first half of the year.
Box II. The Economic Impact of Weather-Related shocks in sEE6
The SEE6 region has been exposed to a number of extreme weather events over the last three years, which have taken their toll on economic growth. In February 2012, SEE6 was hit hard by a severe winter, prompting a state of emergency in some countries. Countries in SEE6 experienced to different extents: water, food, fuel and medicine shortages, power and telecommunications outages, avalanches, and transportation system shutdowns. Economic output was reduced as construction slowed more than usual during the winter, employees were unable to get to work and consumers did not shop. This was followed by a drought in the summer of 2012. Hydro-power plants generate around 15 percent electricity in SEE6 and some countries are especially reliant on this electricity source. Albania, Bosnia and Herzegovina and Montenegro in particular rely on hydro-power, which generates close to 100 percent of all electricity in Albania, around a third in Bosnia and Herzegovina and a half in Montenegro. The drought reduced electricity supply in an already energy-starved region, harming businesses and households. At the same time, the drought hit agricultural output in SEE6. Between them, the severe winter and summer drought helped to push SEE6 into a double-dip recession in 2012. Output in the region fell by 0.6 percent in 2012 and only Albania and Kosovo saw positive growth (SEE6 June 2013 edition of this report).
continued to next page
I. RECENT ECONOMIC DEvELOPMENT | 11
COPING WITH FLOODS, STRENGTHENING GROWTH

However, exports remain low as a share of GDP in SEE6 and below potential. Exports averaged around 38 percent of GDP in 2013 in SEE6 countries. This compares with over 60 percent in EU11 countries. Kosovo and Bosnia and Herzegovina perform particularly badly, with exports at around 20 and 30 percent of GDP, respectively. Recent analytical work suggests the region’s exports are considerably below potential, particularly to the world’s largest economic bloc on their doorstep, the EU. Albanian exports to the EU are estimated at 40 percent below potential, while those from
6 Bosnia and Herzegovina - Flood Emergency Recovery Project. World Bank. 2014.
other SEE6 countries are around 30 percent below potential.8
7 http://europa.ba/Download.aspx?id=1521&lang=EN and http://ec.europa.eu/enlargement/pdf/press_corner/floods/rna-executive-summary.pdf
8 See World Bank. 2014. South East Europe Regular Economic Report No 6: Brittle Recovery. May 2014. Washington DC for more detail.
In May 2014, Bosnia and Herzegovina and Serbia were hit hard by floods. The rain was the heaviest since records began 120 years ago. A large share of the population and land mass were adversely impacted by the floods, particularly in Bosnia and Herzegovina. In the latter, “[a]s of end-May 2014, 25 people had died, about 90,000 people had been evacuated, and about 1 million or one-fourth of the total population had been directly affected by the floods. The affected area covered more than one-third of the country’s territory, and the massive floods have caused over 3,000 landslides.”6
A Recovery and Needs Assessment estimated that the cumulative impact could be sufficient to put Bosnia and Herzegovina back into recession and to significantly reduce output in Serbia, increase poverty, and put pressure on public finances. The floods are estimated to have caused the equivalent of nearly 15 percent of GDP in damages (9.3 percent of GDP) and losses (5.6 percent) in 2014 in Bosnia and Herzegovina.7 Reconstruction costs could put pressure on public finances of both countries and increase CAD as reconstruction materials are imported. Bosnia and Herzegovinian agricultural exports also suffered due to significant crop destruction. In Serbia, the floods are estimated to have caused around €864 million in damages and €648 million in losses. This translates into, respectively, 2.7 percent of GDP in damages and 2 percent of GDP in losses in 2014. The hardest hit economic sectors were energy, mining, and agriculture but significant damages were also inflicted on transport infrastructure (roads, bridges and railways).
Bosnia and Herzegovina was hit by a second round of flooding in August 2014 and poor weather also harmed growth in Montenegro. Although it didn’t reach anywhere near the destruction levels of the May floods, rain in September in Bosnia and Herzegovina was enough to cause alarm and serve as a further warning of the vulnerability of the region to climactic shocks. Low levels of rainfall combined with poor summer weather in Montenegro reduced electricity generation and exports, including tourism, thus reducing economic growth.
continued from previous page
continued to next page
SOUTH EAST EUROPE REGULAR ECONOMIC REPORT NO.7
12 | I. RECENT ECONOMIC DEvELOPMENT

The impact of these recent climactic shocks shows the importance of building increased resilience to extreme weather events and climate change. Given the region’s profile and resulting exposure of economic activity to natural hazards, in FYR Macedonia, Bosnia and Herzegovina, and Serbia, exposure of GDP to floods is high enough to induce some level of fiscal stress and delayed recovery and reconstruction. The impact of less frequent events could be even more significant. Modelling by the World Bank Group suggests that a once in a 100-year flood could affect 18 percent or more of FYR Macedonia’s GDP, 14 percent or more of Bosnia and Herzegovina’s and 12 percent or more in Serbia over several years. The resulting public damage and losses could amount to 9, 4 and 5 percent of each country’s GDP, respectively. Large shares of the population would also be exposed to a once in a hundred year flood (Figure BII.1).
The recent floods in Bosnia and Herzegovina suggest that these may be conservative estimates. Climate change could make the region even more vulnerable, so preparing for the present and for the future should promote the mainstreaming of Disaster Risk Management (DRM) and adaptation into long-term development strategies.
Figure BII.1: Exposure of economic activity and population to a once in a hundred year flood in SEE6
percent
0
MKD BIH SRB MNE ALB KOS
20
18
16
14
12
10
8
6
4
2
18
1314
12
10
6
3
14
11
9
7
3
J Exposure of GDP to 100-year flood
J Exposure of population to 100-year flood
Source: World Bank projections.
continued from previous page
I. RECENT ECONOMIC DEvELOPMENT | 13
COPING WITH FLOODS, STRENGTHENING GROWTH

Current account deficits are expected to have widened slightly in 2014, as increasing exports failed to offset the increase in imports. The regional current account deficit (weighted average) increased from 8.0 percent of GDP in the first half of 2013 to 8.3 percent of GDP in the same period of 2014 as external balances deteriorated in Albania, Bosnia and Herzegovina, Kosovo, and Montenegro (Figure 4). In Bosnia and Herzegovina and Kosovo, the widening of the deficit was driven primarily by imports, which grew by an average of 5.7 percent in the first half of 2014 (year-on-year). Exports also increased in these countries over the same period, albeit by only 3.3 percent, and coupled with their low base fell short of compensating for the increase in imports (Figures 6, 7). In Albania and Montenegro a significant drop in exports was accompanied by a smaller fall in imports. In FYR Macedonia and Serbia,
current account balances slightly improved as export growth surpassed the increase in imports and trade deficits narrowed. Exports grew by 19.7 percent in the first half of 2014 in FYR Macedonia and by 11.3 percent in Serbia.
The factors behind increasing imports were mixed. In FYR Macedonia, rising imports reflected the firming up of the recovery and FDI related imports. In Bosnia and Herzegovina and Serbia, imports increased in response to the floods. Kosovo saw its imports increase due to increasing consumption. By contrast, imports continued to decline in Albania and Montenegro, albeit at a lower rate than in the previous year in the latter.
SEE6 exports continued to grow at a moderate pace. SEE6 exports grew by 9.5 percent in the first half of 2014 (year-on-year), slightly higher
Foreign Trade and External Sector
Figure 4: Current Account Balance, H1 2013–14
Figure 5: Trade Balance, H1 2013–14
percent of GDP percent of GDP
-40
5
0
-5
-10
-15
-20
-25
-30
-35
ALB BIH KOS MKD MNE SRB SEE6 EU15EU11
-40
5
0
-5
-10
-15
-20
-25
-30
-35
ALB SEE6BIH KOS MKD MNE SRB
J H1 2013 J H1 2014 J H1 2013 J H1 2014
Source: World Bank calculations based on the central banks, IMF WEO, and statistical offices.Note: EU11 and EU15 data are for Q1.
Source: World Bank calculations based on the central banks, IMF WEO, and statistical offices.
SOUTH EAST EUROPE REGULAR ECONOMIC REPORT NO.7
14 | I. RECENT ECONOMIC DEvELOPMENT

than the 9.1 percent recorded in the same period of 2013 (year-on-year) (Figure 6). This increase was driven by FYR Macedonia, Serbia, and to a lesser extent Kosovo and Bosnia and Herzegovina. In FYR Macedonia and Serbia, FDI-financed manufacturing exports continued to increase, albeit at a lower rate in Serbia. Mineral exports, in particular exports of lead and zinc ore and ferronickel, from Kosovo have picked up since August, mainly to China, despite the slowdown in China.
The EU became an even more significant export destination for SEE6 exports in 2014. The share of goods exports to the EU in total SEE6 exports increased from 62.4 percent in 2013 to 63.5 percent in the first half of 2014. By contrast, the share of intra-regional trade in total SEE6 exports decreased from 24.7 percent in 2013 to 23 percent in the first half of 2014. An exception to this trend is Kosovo’s exports to Serbia, which almost doubled in 2014 (though from a low base) due to improving trade relations between the two countries.
Disappointing growth performance in the Eurozone continues to limit remittance inflows. The contribution of remittances to financing of the trade deficit is significant across the SEE6. Remittances are particularly important for the economies of Albania, Bosnia and Herzegovina, and Kosovo, with the primary sources of remittance inflows being Greece, Italy, Switzerland, Austria and Germany. In the first half of 2014, remittances amounted to 7.8 percent of GDP (Figure 8), changing only marginally over the last two years and remaining significantly below the pre-crisis levels.
Net FDI flows only marginally declined. Net FDI flows to the SEE6 amounted to 4.4 percent of GDP in the first half of 2014, slightly down from 4.5 percent of GDP in 2013. Even though the regional average remained almost unchanged compared with the same period of 2013, country experiences were heterogeneous (Figure 9). Net FDI flows to Serbia and FYR Macedonia increased due to
Figure 6: Export Growth, H1 2013–14 Figure 7: Import Growth, H1 2013–14
percent percent
-10
25
20
15
10
5
0
-5
ALB SEE6BIH KOS MKD MNE SRB
-10
20
15
10
5
0
-5
ALB SEE6BIH KOS MKD MNE SRB
J H1 2013 J H1 2014 J H1 2013 J H1 2014
Source: World Bank calculations based on the central banks, IMF WEO, and statistical offices.
Source: World Bank calculations based on the central banks, IMF WEO, and statistical offices.
I. RECENT ECONOMIC DEvELOPMENT | 15
COPING WITH FLOODS, STRENGTHENING GROWTH

expanding production capacities in the existing FDI-financed plants and new FDI in the case of the latter. Meanwhile, the rest of the countries saw their FDI inflows fall. The decline was the most dramatic across the region in Kosovo due to increasing uncertainties around the post-election political crisis and the failure to privatize the Post and Telecommunications of Kosovo (PTK) in 2013.
Large current account deficits and limited capital inflows strained reserves. With current account deficits either in or approaching double digits across the region, financing the deficits is an important question for the region. The single most significant source of current account financing in the first half of 2014 was FDI (Figure 10). It financed over half of the current account deficit for the SEE6 as a whole, and over two thirds in FYR Macedonia and Serbia. However, FDI inflows remained far below those to the neighboring EU countries. For instance, FDI inflows to the EU11 were twice as much as those to the SEE6 between
2009 and 2013. The large net outflows of “other investment” were largely the result of meeting international interest payment obligations, pointing to potential issues of current account sustainability (SEE6 Box III).
The weak economic conditions in the Eurozone coupled with the generally poor investment climate in the region, is likely
Figure 8: Remittances, H1 2013–14 Figure 9: Net FDI, H1 2013–14
percent of GDP percent of GDP
ALB SEE6BIH KOS MKD MNE SRB
0
14
12
10
8
6
4
2
ALB SEE6BIH KOS MKD MNE SRB
0
12
10
8
6
4
2
J H1 2013 J H1 2014 Q H1 2007 J H1 2013 J H1 2014
Source: Central banks and IMF.Note: Data for FYR Macedonia include only workers remittances coming through official bank channels and reported as such, but not all private transfers that have sizable effect on financing the trade deficit. Narrow definition is used for Bosnia and Herzegovina.
Source: World Bank calculations based on central banks.
Figure 10: Current Account Financing, H1 2014
percent
ALB SEE6BIH KOS MKD MNE SRB
-150
250
200
150
100
50
0
-50
-100
J Direct investment J Portfolio investment J Other investment
J Reserve assets J Net errors and omissions
Source: World Bank calculations based on central banks.
SOUTH EAST EUROPE REGULAR ECONOMIC REPORT NO.7
16 | I. RECENT ECONOMIC DEvELOPMENT

to restrain the growth of FDI inflows. Many factors determine FDI inflows, and the weak Eurozone economy undoubtable reduces FDI in the region. However, the investment climate in the recipient countries is also a critical factor. FDI inflows are low despite the fact that SEE6 countries have good access to western EU markets thanks to their geographic proximity and trade agreements (Figure 11). The region is yet to maximize the benefits of this proximity. Even though the SEE6 countries have made progress in reforming their regulatory environments, the recent Doing Business report9 suggests that there are still areas in need of further improvements. “Dealing with Construction Permits,” “Enforcing Contracts,” and “Resolving Insolvency” in particular arise as the areas that are weaker than the others. The poor performance in these areas seems to be a reflection of the cumbersome bureaucracies, corruption, and weak legislative frameworks across the region.
9 See World Bank. 2015. Doing Business 2015 Report, Washington DC.
The 2013 decline in external debt was short-lived. The SEE6 external debt increased back to 68.5 percent in the first half of 2014 after falling by almost 3 percent of GDP in 2013 (Figures 12 and 13). Rising external public debt in Bosnia and Herzegovina and Serbia, by 3.9 and 4.4 percentage points respectively, was the source of the increase.10 Both Kosovo and Albania11 had a slight decline of external debt without much impact on the SEE6 region’s average. FYR Macedonian external debt increased later in the year by 7 percent of GDP due to a Eurobond issuance that is planned to be partly used to repay debt due in 2015. Models suggest that the stable level of CAD (its “steady state”) is unlikely to be sustainable in many SEE6 countries due to the increased external debt that it implies (SEE6 Box III).
10 Serbian external debt includes debt issuance after June 2014.11 It is worth noting that new data from the National Bank of Albania
reveal a larger private external debt than previously reported in our SEE6RER reports. This also had a slight impact in increasing the average regional external debt.
Figure 11: Doing Business: Distance to Frontier
100=Best, 2015
0
100
90
80
70
60
50
40
30
10
20
OverallStarting abusiness
Dealing withconstruction
permits
Gettingelectricity
Registeringproperty
Gettingcredit
Protectingminority investors
Payingtaxes
Tradingacross borders
Enforcingcontracts
Resolvinginsolvency
J SEE6 J BGR, HRV, ROM J Rest of EU11
Source: World Bank Doing Business Indicators (2015).
I. RECENT ECONOMIC DEvELOPMENT | 17
COPING WITH FLOODS, STRENGTHENING GROWTH

Figure 12: Average sEE6 External Debt Figure 13: sEE6 External Debt by countries
percent of GDP percent of GDP
0
80
70
60
50
40
30
20
10
2012 2013 H1 2014
32.7
68.5
32.2
65.4
35.2
68.9
ALB SEE6BIH KOS MKD MNE SRB
0
140
120
100
80
60
40
20
J External debt J o/w Gov. debt J 2012 J 2013 J H1 2014
Source: SEE6 central banks and Ministries of Finance (MoF). Source: SEE6 central banks and ministries of finance (MoF). Note: Data for 2014 represent the latest available and are not necessarily semiannual.
Box III. Current Account sustainability in the sEE6 Economies
Although there is not an absolute definition of current account sustainability, a country’s current account deficit (CAD) can be seen as sustainable as long as the ratio of foreign debt to GDP is not increasing and foreign investors are willing to finance it. The dominant approach to assessing current account sustainability in the literature is the intertemporal approach (Sachs 1981; Obsfeld and Rogoff 1994; Milesi-Ferretti and Razin 1996; IMF, 1998b; Carranza 2002), which suggests that current account balance is a consequence of forward-looking dynamic saving and investment decisions (Brissimis et al., 2010). Wu (2000) and Lau and Baharumshah (2005) operationalize this concept and suggest that a stationary current account to GDP ratio is consistent with an external debt to GDP ratio that never goes over certain limit and always reverts toward that limit. Wu (2000) finds a stationary current account to GDP ratio consistent with a finite external debt to GDP ratio for ten OECD countries. Lau and Baharumshah (2005) find a stationary current account to GDP ratio for three out of twelve Asian countries. Finding the ratio of current account to GDP to be either stationary or declining over time is a necessary, but not a sufficient, condition for current account sustainability. It is not sufficient since, many other factors have an effect on current account sustainability. In particular, a CAD to finance productive investment is not the same as one used to finance consumption and access to international financial markets matter. Still finding a ratio of current account to GDP that reverts back to a long-run level reduces the risk of a current account crisis. We test if the ratio of current account deficit to GDP is stationary for the SEE6. In estimating the rate of current account convergence to a steady state we follow the work of Jiandog and Shang-Jin (2007) and the economic literature on convergence calculation (Ball and Seridan, 2003; Hyvonen 2004).
Following Wu (2000) and Lau and Baharumshah (2005), we investigate whether the persistent current account deficit in SEE6 countries is sustainable. We argue that countries with potentially high current account deficits will experience a current account deficit decrease just by returning to
continued to next page
SOUTH EAST EUROPE REGULAR ECONOMIC REPORT NO.7
18 | I. RECENT ECONOMIC DEvELOPMENT

12 Equation (2) is actually the form of the Dickey-Fuller (DF) test for a unit root and if β =1 there is unit root.
some underlying long-run cross-country mean rate. These deficits will tend to decrease if their size were a consequence of the country’s initial performance because of transitory factors and/or poor policy performance. This convergence may occur as a consequence of the policy to join the EU, since we assume that SEE6 countries are aware that EU accession with high current account deficits is not possible.
We test the sustainability of the CAD using two different methods. The first method is ordinary least squares and the second method is panel regression. The first method is applied to each country’s data individually. The second is applied to the SEE6 countries as a group. The estimation procedure is based on the following steps:
1. First we calculate Xt which represents each country’s current account (ca) as a share of its GDP (gdp) in period (t):
Xt = cat / gdpt (1)
where t indexes the years from 2002 to 2013.
2. Second we test if Xt follows a unit root process by estimating:
∆Xt = α + β Xt-1 + et (2)
If β = 1 in equation (2), convergence is precluded by definition since the current account deficit would always be growing12. However, if beta is less than 1, then that is consistent with the current account converging toward a steady state. The closer the speed of convergence is to one in absolute value, the faster the speed of convergence.
The results suggest that the SEE6 taken together has a long-run steady state CAD of 9.8 percent of GDP and that it will converge toward this level, whether it is higher or lower than this in any given year (Table BIII.1). The CAD converges toward its long-run steady state at a rate of around 38 percent per year.
Table BIII.1: Long-run steady state and speed of convergence for sEE6
Estimation Yearly data
Long run steady state 9.8 percent
Speed of convergence 38 percent
continued to next page
continued from previous page
I. RECENT ECONOMIC DEvELOPMENT | 19
COPING WITH FLOODS, STRENGTHENING GROWTH

13 We applied panel unit root test to address the problem of the low power of standard unit roots tests. The results of panel unit root test suggest that we do reject the Ho of a common unit root process but we could not reject the Ho of an individual unit root process. This means that we had to test which of the SEE6 countries are suitable for this approach.
The data also allow us to model this separately for Bosnia and Herzegovina, FYR Macedonia and Serbia13. These countries have steady state CADs of 14, 7.9 and 14.1 percent respectively (Table BIII.2). Bosnia and Herzegovina, FYR Macedonia and Serbia all exhibit faster convergence tendencies than the SEE6 average however, with “speeds” of 77, 64 and 78 percent per year, respectively.
Table BIII.2: Long-run steady state and speed of convergence for BiH, FyR Macedonia and serbia
Estimation Bosnia and Herzegovina FYR Macedonia Serbia
Long run steady state 14.0 percent 7.9 percent 14.1 percent
Speed of convergence 77.0 percent 63.8 percent 78.5 percent
The estimated long-run steady state CAD does not seem likely to be sustainable over the medium to long term. The estimation suggests that each country in the SEE6 exhibits a long-run CAD that is far above the maximum of 5 percent of current account deficit to GDP ratio, which in vulnerability diagnostics is sometimes considered sustainable. Persistent current account deficits above 5% of GDP have generally been considered unsustainable in the long run, especially when the deficit is financed with short-term debt and decreases in foreign reserves (Milesi-Ferretti and Razin, 1996, Carranza 2002). In addition, the financing structure of the CAD should be considered. The long-run steady state rate for Bosnia and Herzegovina and Serbia is much higher than for other SEE6 countries. This estimation also provides a warning of a potentially unsustainable current account deficit in these countries.
continued from previous page
SOUTH EAST EUROPE REGULAR ECONOMIC REPORT NO.7
20 | I. RECENT ECONOMIC DEvELOPMENT

The recovery from the 2012 recession has had only a minor effect on the key labor market indicators in SEE6. Since then, the SEE6 region’s employment has increased somewhat, unemployment has slightly declined, and labor force participation rates in most of the economies have marginally improved (Figure 14). The number of employed across the region increased by 4 percent between Q2 2012 and Q2 2014. Positive growth rates have made a small dent in the persistently high unemployment rates, which fell from an average 24.1 percent in Q2 2012 to 22 percent in Q2 2014 (Figure 15). The labor force participation rate increased slightly as a result, from 49.1 percent to 50.3 percent over the same period.
Labor market performance varied across the economies of the region. FYR Macedonia has experienced improving labor market conditions since 2008. Meanwhile, the Montenegrin and
Serbian labor markets, which were heavily affected by the crisis, have seen some recovery in the last year with employment rates reaching pre-crisis levels in Montenegro. By contrast, in Bosnia and Herzegovina, the labor market has shown only minimal adjustment during the recovery period. In Albania, labor market conditions have deteriorated due to the growth slowdown in 2013. The recovery of the SEE6 economies, however, proved to be fragile and the growth faltered in the first half of 2014 due not only to floods in Bosnia and Herzegovina and Serbia but also to the weak growth prospects in advanced economies mainly in the Eurozone. The labor markets are likely to show the effects of the growth slowdown with
some lag and slow adoption of labor reforms in countries requiring it could constrain growth and unemployment reduction.
Labor Market
Figure 14: Employment in the sEE6, Q2 2008–Q2 2014
Figure 15: Unemployment Rates in the sEE6, Q2 2008–Q2 2014
index, Q2 2008=100 percent of labor force aged 15+
60
120
110
100
90
80
70
Q2
-08
Q4
-08
Q2
-09
Q2
-10
Q2
-11
Q2
-12
Q2
-13
Q2
-14
Q4
-09
Q4
-10
Q4
-11
Q4
-12
Q4
-13 0
40
35
30
25
20
15
10
5
ALB BIH MKD MNE SRB SEE5
▬ ALB ▬ BIH ▬ MKD ▬ MNE ▬ SRB ▬ SEE6 J Q2 2008 J Post-crisis peak-Q2 2008 Q Q2 2014
Source: World Bank calculations based on national statistical offices. Source: National statistical offices.
I. RECENT ECONOMIC DEvELOPMENT | 21
COPING WITH FLOODS, STRENGTHENING GROWTH
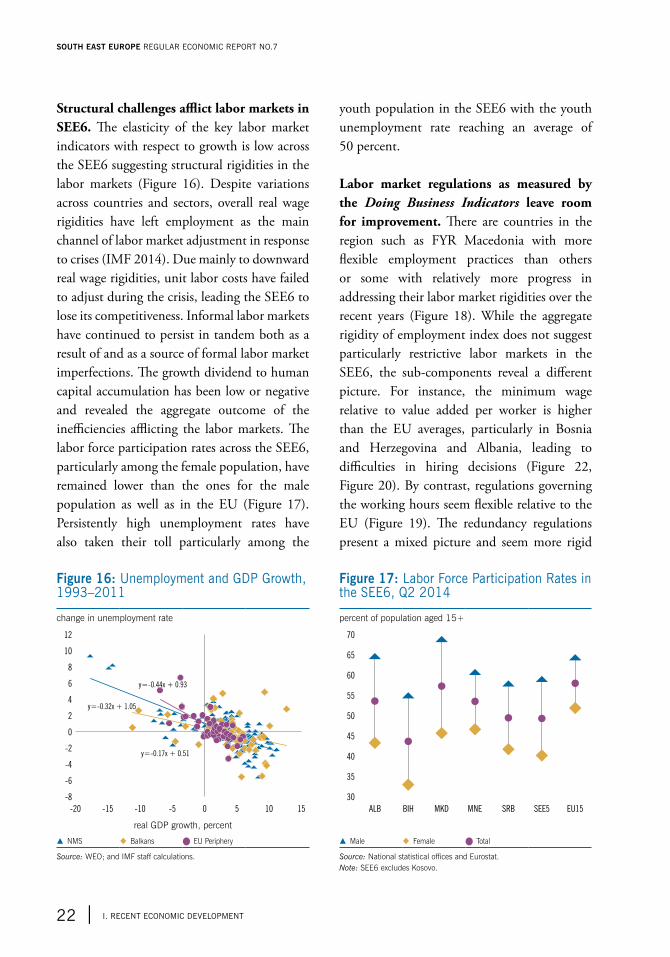
Structural challenges afflict labor markets in SEE6. The elasticity of the key labor market indicators with respect to growth is low across the SEE6 suggesting structural rigidities in the labor markets (Figure 16). Despite variations across countries and sectors, overall real wage rigidities have left employment as the main channel of labor market adjustment in response to crises (IMF 2014). Due mainly to downward real wage rigidities, unit labor costs have failed to adjust during the crisis, leading the SEE6 to lose its competitiveness. Informal labor markets have continued to persist in tandem both as a result of and as a source of formal labor market imperfections. The growth dividend to human capital accumulation has been low or negative and revealed the aggregate outcome of the inefficiencies afflicting the labor markets. The labor force participation rates across the SEE6, particularly among the female population, have remained lower than the ones for the male population as well as in the EU (Figure 17). Persistently high unemployment rates have also taken their toll particularly among the
youth population in the SEE6 with the youth unemployment rate reaching an average of 50 percent.
Labor market regulations as measured by the Doing Business Indicators leave room for improvement. There are countries in the region such as FYR Macedonia with more flexible employment practices than others or some with relatively more progress in addressing their labor market rigidities over the recent years (Figure 18). While the aggregate rigidity of employment index does not suggest particularly restrictive labor markets in the SEE6, the sub-components reveal a different picture. For instance, the minimum wage relative to value added per worker is higher than the EU averages, particularly in Bosnia and Herzegovina and Albania, leading to difficulties in hiring decisions (Figure 22, Figure 20). By contrast, regulations governing the working hours seem flexible relative to the EU (Figure 19). The redundancy regulations present a mixed picture and seem more rigid
Figure 16: Unemployment and GDP Growth, 1993–2011
Figure 17: Labor Force Participation Rates in the sEE6, Q2 2014
change in unemployment rate percent of population aged 15+
-8
12
10
8
6
4
2
0
-2
-4
-6
-20 -15 -10 -5 0 5 10 15
y=-0.44x + 0.93
y=-0.32x + 1.05
y=-0.17x + 0.51
30
70
65
60
55
50
45
40
35
ALB BIH MKD MNE SRB SEE5 EU15
real GDP growth, percent
S NMS � Balkans Q EU Periphery S Male � Female Q Total
Source: WEO; and IMF staff calculations. Source: National statistical offices and Eurostat.Note: SEE6 excludes Kosovo.
SOUTH EAST EUROPE REGULAR ECONOMIC REPORT NO.7
22 | I. RECENT ECONOMIC DEvELOPMENT

in Bosnia and Herzegovina and Kosovo than in the other economies of the region (Figure 21, Figure 23, Figure 24). Similarly, the costs of redundancy are higher in particular economies of the region than in others and in the EU. For instance, notice period and severance pay for redundancy dismissals are still high in Albania even though the latter is reduced significantly
over the recent years following the trend across the region.
Figure 18: Doing Business - Rigidity of Employment, 2008–14
Figure 19: Rigidity of Hours, 2008–14
0–100=rigid 0–100=rigid
0
45
40
35
30
25
20
15
10
5
ALB BIH KOS MKD MNE SRB SEE6 EU15EU11
0
45
40
35
30
25
20
15
10
5
ALB BIH KOS MKD MNE SRB SEE6 EU15EU11
J 2008 Q 2014 J 2008 Q 2014
Source: World Bank calculations based on Doing Business indicators (2008 and 2014).
Source: World Bank calculations based on Doing Business indicators (2008 and 2014).
Figure 20: Doing Business - Difficulty of Hiring, 2008–14
Figure 21: Difficulty of Redundancy, 2008–14
0–100=rigid 0–100=rigid
0
70
60
50
40
30
20
10
ALB BIH KOS MKD MNE SRB SEE6 EU15EU11
0
35
30
25
20
15
10
5
ALB BIH KOS MKD MNE SRB SEE6 EU15EU11
J 2008 Q 2014 J 2008 Q 2014
Source: World Bank calculations based on Doing Business indicators (2008 and 2014).
Source: World Bank calculations based on Doing Business indicators (2008 and 2014).
I. RECENT ECONOMIC DEvELOPMENT | 23
COPING WITH FLOODS, STRENGTHENING GROWTH

Figure 24: severance Pay for Redundancy, 2008–14
salary weeks
0
14
12
10
8
6
4
2
ALB BIH KOS MKD MNE SRB SEE6 EU15EU11
J 2008 Q 2014
Source: World Bank calculations based on Doing Business indicators (2008 and 2014).
Figure 22: Doing Business - Minimum Wage, 2008–14
Figure 23: Notice Period for Redundancy, 2008–14
ratio of minimum wage to value added per worker number of weeks
0
1.2
1.0
0.8
0.6
0.4
0.2
ALB BIH KOS MKD MNE SRB SEE6 EU15EU11
0
14
12
10
8
6
4
2
ALB BIH KOS MKD MNE SRB SEE6 EU15EU11
J 2008 Q 2014 J 2008 Q 2014
Source: World Bank calculations based on Doing Business indicators (2008 and 2014).
Source: World Bank calculations based on Doing Business indicators (2008 and 2014).
SOUTH EAST EUROPE REGULAR ECONOMIC REPORT NO.7
24 | I. RECENT ECONOMIC DEvELOPMENT

The average fiscal deficit in SEE6 is estimated to have increased by 0.4 percent of GDP to 4.2 percent in 2014 due to faster increase of expenditures than revenues. Expenditures
are projected to have increased as a share of GDP in Albania, Bosnia and Herzegovina and Serbia, but to have decreased somewhat in the other three SEE6 countries (Figure 29). Post-flood reconstruction will likely contribute to increased expenditures in Bosnia and Herzegovina. In Albania, the increase in government spending includes payment of government arrears of 2.5 percent of GDP. Increased tax revenues in the year to September in all SEE6 countries (except Kosovo) were unable to offset the rise in public spending (Figure 25 and 26). Revenues are expected to have risen by 0.8 percent of GDP on average to 34.6 percent in all SEE6 except Kosovo (Figure 28). One of the two Entities in Bosnia and Herzegovina (the Republika Srbska) increased social security contributions by 3 percentage points to pay for a solidarity fund intended for flood damage reconstruction, contributing to higher revenue. In Albania, higher tax revenues
Public Finances and Debt
Figure 25: Percent Change in Fiscal Deficit in January–september, 2013–14
contribution to percent change, year-on-year
-120
80
60
40
20
0
-20
-40
-60
-80
-100
ALB BIH MKD MNE SRB SEE5
J Personnel expenditures J Interest expenditures J Capital expenditures
J Other expenditures J Tax revenues J Grants
J Other revenues
Source: World Bank calculations based on Ministries of Finance.
Figure 26: Fiscal Deficit, 2013–14 Figure 27: Contribution to Change in Deficit, 2014
percent of GDP percent of GDP
0
9
8
7
6
5
4
3
2
1
ALB SEE6BIH KOS MKD MNE SRB
-4
4
3
2
1
0
-1
-2
-3
ALB SEE6BIH KOS MKD MNE SRB
J 2013 J 2014f J Revenue contribution J Expenditure contribution Q Increase in fiscal deficit
Source: Ministries of Finance and World Bank projections. Source: Ministries of Finance and World Bank calculations.
I. RECENT ECONOMIC DEvELOPMENT | 25
COPING WITH FLOODS, STRENGTHENING GROWTH
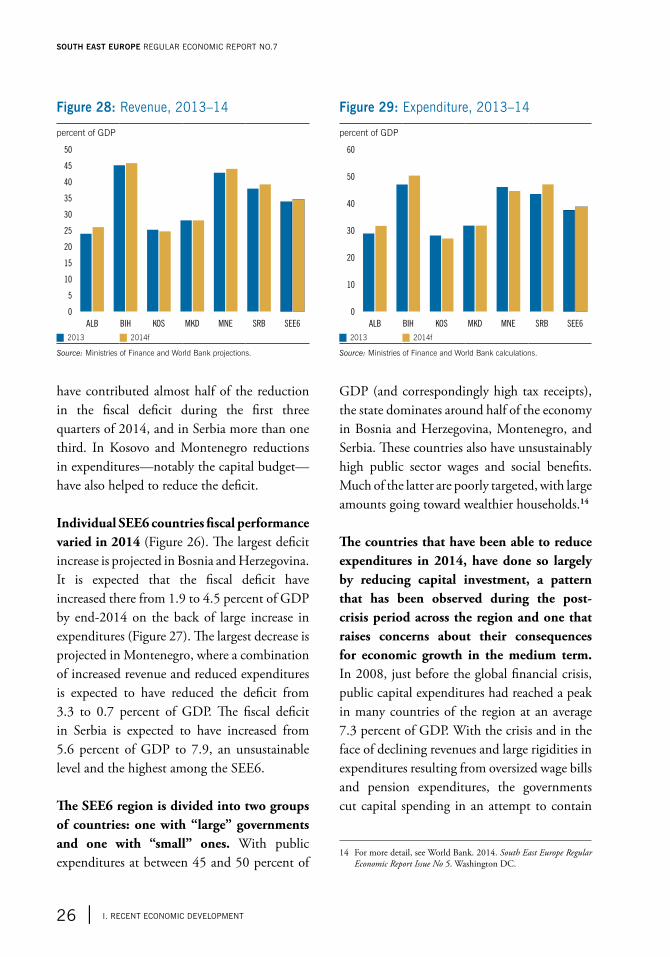
have contributed almost half of the reduction in the fiscal deficit during the first three quarters of 2014, and in Serbia more than one third. In Kosovo and Montenegro reductions in expenditures—notably the capital budget—have also helped to reduce the deficit.
Individual SEE6 countries fiscal performance varied in 2014 (Figure 26). The largest deficit increase is projected in Bosnia and Herzegovina. It is expected that the fiscal deficit have increased there from 1.9 to 4.5 percent of GDP by end-2014 on the back of large increase in expenditures (Figure 27). The largest decrease is projected in Montenegro, where a combination of increased revenue and reduced expenditures is expected to have reduced the deficit from 3.3 to 0.7 percent of GDP. The fiscal deficit in Serbia is expected to have increased from 5.6 percent of GDP to 7.9, an unsustainable level and the highest among the SEE6.
The SEE6 region is divided into two groups of countries: one with “large” governments and one with “small” ones. With public expenditures at between 45 and 50 percent of
GDP (and correspondingly high tax receipts), the state dominates around half of the economy in Bosnia and Herzegovina, Montenegro, and Serbia. These countries also have unsustainably high public sector wages and social benefits. Much of the latter are poorly targeted, with large amounts going toward wealthier households.14
The countries that have been able to reduce expenditures in 2014, have done so largely by reducing capital investment, a pattern that has been observed during the post-crisis period across the region and one that raises concerns about their consequences for economic growth in the medium term. In 2008, just before the global financial crisis, public capital expenditures had reached a peak in many countries of the region at an average 7.3 percent of GDP. With the crisis and in the face of declining revenues and large rigidities in expenditures resulting from oversized wage bills and pension expenditures, the governments cut capital spending in an attempt to contain
14 For more detail, see World Bank. 2014. South East Europe Regular Economic Report Issue No 5. Washington DC.
Figure 28: Revenue, 2013–14 Figure 29: Expenditure, 2013–14
percent of GDP percent of GDP
ALB SEE6BIH KOS MKD MNE SRB
0
50
45
40
35
30
25
20
15
10
5
ALB SEE6BIH KOS MKD MNE SRB
0
60
50
40
30
20
10
J 2013 J 2014f J 2013 J 2014f
Source: Ministries of Finance and World Bank projections. Source: Ministries of Finance and World Bank calculations.
SOUTH EAST EUROPE REGULAR ECONOMIC REPORT NO.7
26 | I. RECENT ECONOMIC DEvELOPMENT

the widening fiscal deficits (Figure 30). By 2013, the average public capital expenditure declined to 5.4 percent of GDP. The cuts were particularly significant in Albania and Montenegro. In the case of the latter, public capital spending declined to 4 percent of GDP on average. At 2.1 percent of GDP, Serbia had the lowest capital spending across SEE6 in 2013. Cuts in capital spending continued through 2014—with reductions reaching a high of 43 percent in nominal terms in Albania—with potential effects on short and long term growth prospects. Only Kosovo saw an increase in capital expenditure since 2008, but this was mainly consumed by a single, large, road investment and Kosovo’s, budget execution in 2014 remained weak partially due to a delay of over 5 months in establishing new government.
Even the existing level of capital investment does not always appear to be directed toward the areas with the highest economic returns. New highways attract investment in some countries, potentially crowding out other investments with higher rates of return,
while increasing public debt to concerning levels. For example, the recently constructed highway in Kosovo toward Durres in Albania may have crowded out other road projects with higher economic rates of return as well as road maintenance.15 In Montenegro, a new highway is estimated to cost around 25 percent of GDP, financed through external borrowing and sharply increasing fiscal deficits and public debt levels over the medium term. Moreover, the construction cost is expected to increase further due to taxes foregone after the ratification of the highway act that exempts the imports of construction material, equipment and other goods from customs and VAT. It also allows for PIT and social contributions exemption of non-national and non-resident employees for the income earned in Montenegro, and proposes 3-times lower fuel excise duty (€169 per ton).
Public debt is estimated to have risen by 3 percent of GDP in 2014, increasing average debt levels to 52.3 percent of GDP. This increase represents a continuous increase since the onset of the global crisis. By end-2014, the average public debt-to-GDP ratio in the SEE6 is estimated to have increased by almost 18 percent of GDP since 2009 as public finances have deteriorated significantly. In 2012 alone (when the SEE6 economies contracted by 0.6 percent and the average fiscal deficit reached 3.4 percent of GDP) the SEE6 public debt increased by 6.7 percent of GDP (primarily due to fiscal deficits but also reflecting poor growth performance). While the recovery in 2013 helped the governments to limit the increase in their debt levels, slow
15 World Bank. 2014. Kosovo Public Finance Review: Fiscal Policies for a Young Nation. Washington, DC.
Figure 30: Public Capital Expenditures, 2008–13
percent of GDP
BGR,HRV, ROM
Rest ofEU11SEE6
0
12
10
8
6
4
2
ALB BIH KOS MKD MNE SRB
J 2008 J 2013
Source: Ministries of Finance and Eurostat.
I. RECENT ECONOMIC DEvELOPMENT | 27
COPING WITH FLOODS, STRENGTHENING GROWTH

progress in fiscal consolidation was the primary factor behind debt accumulation in 2013–14. As a result, the average public debt-to-GDP ratio in SEE6 increased from 47.1 percent of GDP in 2012 to 49.3 percent of GDP in 2013, and to an estimated 52.3 percent of GDP in 2014. All of the countries of the region conform to this general trend at varying degrees with the exceptions of Albania and Kosovo. In Albania, the slowdown in economic activity and increasing public arrears increased the debt levels substantially in 2013. Kosovo has accumulated public debt at a fast pace after 2011 (Figure 31).
The current levels of public debt are particularly worrying in half of the economies of the region. The public debt-to-GDP ratios stand above the 60 percent threshold in Albania, Montenegro, and Serbia as of the second quarter of 2014 (Figure 32). In Bosnia and Herzegovina and FYR Macedonia public debt exceeded 40 percent of GDP. After the issuance of a EUR 500 million bond in July 2014, FYR Macedonia’s public debt climbed up to over 46 percent of GDP. Kosovo still has
a low level of public debt, but the recent trends raise concern about its future path, similarly in FYR Macedonia.
The domestic component of the public debt increased after 2011. Domestic debt as a share of GDP remained almost flat between 2009 and 2011 while external financing particularly from international donors increased (Figure 33). As a result, the share of domestic financing in total public debt declined from 42.1 percent in 2009 to 36.6 percent in 2011. As the governments started tapping domestic financing sources more after 2011, the share of domestic financing in total government financing increased to 39.2 percent in Q2 2014.
Public financial management systems are not yet fully developed in the SEE6. The current state of public financial management systems makes the overall public financial and debt management processes less transparent and vulnerable to hidden deficits and/or debt. Moreover, increasing levels of domestic financing, without effective oversight makes the economies vulnerable to cascading risks as
Figure 31: Trend in Public Debt, 2009–2014
Figure 32: Public Debt, Q2 2014
percent of GDP percent of GDP
0
80
70
60
50
40
30
20
10
ALB SEE6BIH KOS MKD MNE SRB
0
80
70
60
50
40
30
20
10
ALB SEE6BIH KOS MKD MNE SRB
J 2009 J 2012 J 2013 J 2014f J Publicly guaranteed debt J Public debt
Source: Ministries of Finance and World Bank projections. Source: Ministries of Finance.
SOUTH EAST EUROPE REGULAR ECONOMIC REPORT NO.7
28 | I. RECENT ECONOMIC DEvELOPMENT

the public and financial sector balance sheets are interconnected.
Future increases in interest rates would heighten the risk to fiscal sustainability, making improved management of public debt an important need for the economies in SEE6. While the average effective interest rate on the SEE6 public debt increased between 2008 and 2013, the country-specific experiences have been diverse (Figure 34). Albania, for instance, has benefited from falling interest rates after 2010. By contrast, Serbia and to a lesser extent Montenegro saw their interest rates increase very rapidly as they access international capital markets, among else. Increasing public debt combined with a volatile financial climate make it important to manage well debt portfolios. This includes monitoring potential liabilities (such as from State-Owned Enterprises) carefully, making informed choices on risks, and gaining market confidence by issuing clear Debt Management Strategies and auction calendars.
Overall, there is little or no fiscal space to help stimulate demand and boost short-term economic growth in SEE6. With high public debt in some countries, fast-rising public debt in others and three countries with public sectors larger than many western EU countries, there appears to be little scope for increased public expenditure to boost economic growth. Rather, further consolidation may be required and “smarter” spending on targeted and focused growth-enhancing projects (rather than, for example, poorly-targeted social benefits), will be required to achieve sustainable fiscal stances and increase growth potential.
Figure 33: sEE6 Public Debt by Residency, 2009–Q2 2014
Figure 34: Effective Interest Rates on Public Debt, 2007–13
percent of GDP 2007=100
2009 2010 2011 2012 2013 Q2 2014
0
60
50
40
30
20
10 20.523.3 25.7
29.4 30.0 30.8
14.914.3
14.8
17.619.5 19.8
2007 2008 2009 2010 2011 2013
50
225
200
175
150
125
100
75
2012
J Domestic J External ▬ ALB ▬ MKD ▬ MNE ▬ SRB ▬ SEE4
Source: World Bank calculations based on data from Ministries of Finance. Source: World Bank calculations based on data from Ministries of Finance.
I. RECENT ECONOMIC DEvELOPMENT | 29
COPING WITH FLOODS, STRENGTHENING GROWTH
Lower commodity import prices and output below potential have caused inflation to fall from 4.3 percent on average in 2013 to 0.9 percent in the first nine months of 2014. After a significant drop in 2013, average annual inflation reached 1.1 percent by September 2014. Falling international oil and food prices and the transmission of these to SEE6 countries drove the low inflation or disinflation in SEE6 throughout 2014. The highest contributions of food price declines to inflation were seen in Serbia, where almost 60 percent of the CPI fall since the beginning of 2013 can be explained by the disinflationary impact of food prices. Output gaps combined with slow aggregate demand have also helped to keep prices low.
Across the region, inflation developments were heterogeneous. Bosnia and Herzegovina fell into deflation in August 2013, with Montenegro and FYR Macedonia joining negative inflation territory in early 2014 (Figure 35). Consumer prices in Albania and Serbia, the only countries with monetary policy flexibility, decreased by September to 1.5 percent and 2.1 percent, respectively. The exception was Kosovo, which recorded a gradual rise in inflation, from 0.2 percent at the beginning of the year to 1.4 percent in September (with annual average of 0.6 in October). Despite the very low levels in SEE6, inflation is higher than in EU11 and EU15 countries (Figure 36).
The fall in international primary agricultural commodity prices combined with a low domestic demand mitigated the upward pressure on food prices from the May floods.
After almost a year of downward trend, food prices started to increase on an annual basis in the third quarter of 2014 and eventually turned positive in September (Figure 37). The opposite occurred for energy prices, which slumped due to base effect of last years’ rise in the regulated price of electricity and oil derivatives in FYR Macedonia and household electricity prices in Serbia (Figure 38). In Kosovo, regulated energy prices rose due to the country’s long-existing problems in meeting energy demand and especially after the explosion at the Kosovo A power plant in June 2014, which impacted domestic generation capacities.
In the context of low inflation and disinflation in SEE6 countries, the central banks in Albania and Serbia further eased monetary policy to lower liquidity pressures. In 2014, some national banks cut the key interest rates more than once. Central banks in Serbia and Albania cut their interest rates by 150 and 75 basis points, respectively, between January and November 2014 (Figure 39). Following the three cuts, in February, May and November, the key interest rate of the Bank of Albania stood at a record low of 2.25 percent in November. Serbia also reduced the official policy rate by 0.5 percentage points in May and by the same amount in June and November, to the level of 8 percent with real interest rate declining despite inflation moderation. Although central banks in Serbia and Albania do run flexible exchange rate regimes, their discretion is constrained by consideration of relatively large liabilities denominated in foreign currencies (around 70 percent in Serbia and 50 percent
Inflation, Monetary and Exchange Rate Policies
SOUTH EAST EUROPE REGULAR ECONOMIC REPORT NO.7
30 | I. RECENT ECONOMIC DEvELOPMENT

in Albania). The FYR Macedonian Monetary Policy Committee, upon assessing its monetary policy stance as adequate, kept its policy rate in 2014 unchanged. Countries that use the euro or peg their currencies to it, like Montenegro, Bosnia and Herzegovina and Kosovo, have not changed monetary policy in 2014 after reducing the reserve requirement rates in recent years. In Albania, the exchange rate against the
Euro has been stable, albeit in a free floating regime. Further easing of monetary policy, and a resulting decline in deposits and local currency securities’ interest rates could potentially lead to portfolio shifts in foreign currency holdings. Abrupt exchange rate changes could have a negative impact on the banking system, given the predominance of foreign currency lending in the bank’s portfolio structure.
Figure 35: CPI Inflation Figure 36: Regional CPI Inflation Comparison
percent, y-o-y percent, y-o-y
-5
15
10
5
0
Dec-
11
Dec-
12
Dec-
13
Mar -
12
Mar -
13
Mar -
14
Jun-1
2
Jun-1
3
Jun-1
4
Sep
-12
Sep
-13
Sep
-14
Dec-
12
Dec-
13
Mar-
13
Mar-
14
Jun-1
3
Jun-1
4
Sep
-13
Sep
-14
0
8
7
6
5
4
3
2
1
▬ ALB ▬ BIH ▬ KOS ▬ MKD ▬ MNE ▬ SRB ▬ SEE6 ▬ SEE6 ▬ EU11 ▬ EU15
Source: National statistical offices and World Bank staff calculations.Note: SEE6 is weighted average.
Source: National statistical offices and World Bank staff calculations.Note: Regional inflations are weighted averages.
Figure 37: Food Price Inflation Figure 38: Energy Price Inflation
percent, y-o-y percent, y-o-y
-5
20
15
10
5
0
Dec-
11
Dec-
12
Dec-
13
Mar -
12
Mar -
13
Mar -
14
Jun-1
2
Jun-1
3
Jun-1
4
Sep
-12
Sep
-13
Sep
-14
-10
-5
20
15
10
5
0
Dec-
11
Dec-
12
Dec-
13
Mar -
12
Mar-
13
Mar-
14
Jun-1
2
Jun-1
3
Jun-1
4
Sep
-12
Sep
-13
Sep
-14
▬ ALB ▬ BIH ▬ KOS ▬ MKD ▬ MNE ▬ SRB ▬ SEE6 ▬ ALB ▬ BIH ▬ KOS ▬ MKD ▬ MNE ▬ SRB ▬ SEE6
Source: National statistical offices and World Bank staff calculations.Note: SEE6 is weighted average.
Source: National statistical offices and World Bank staff calculations.Note: SEE6 is weighted average.
I. RECENT ECONOMIC DEvELOPMENT | 31
COPING WITH FLOODS, STRENGTHENING GROWTH

Still, this monetary stimulus did not accelerate credit growth, as low credit demand and portfolio quality concerns remained prevalent. To increase credit support to the corporate sector and lower its cost of borrowing, the National Bank of Serbia (NBS) unlocked a part of the banks’ credit potential by reducing foreign exchange reserve requirement ratios by 1 percentage point in November and by the same amount again in December (to 27 percent and 20 percent, depending on maturities). At the same time, the NBS raised the domestic currency share of foreign exchange required reserve allocations by 2 percentage points in November and additional 2 percentage points in December (from 32 percent and 24 percent to 36 percent and 28 percent), aiming to encourage banks to rely more on long-term and dinar sources of funding.
Figure 39: Official Policy Rates Figure 40: Real Broad Money supply
percent index, 2009:Q1=100
0
20
18
16
14
12
10
8
6
4
2
Jan-0
8
Jun-0
8
Nov-0
8
Apr-
09
Sep
-09
Feb
-10
Jul-
10
Dec-
10
May-
11
Oct
-11
Mar-
12
Aug-
12
Jan-1
3
Jun-1
3
Nov-1
3
Apr-
14
Sep
-14 85
145
135
125
115
105
95
Q1
-09
Q2
-14
Q3
-09
Q1
-10
Q1
-11
Q1
-12
Q1
-13
Q1
-14
Q3
-10
Q3
-11
Q3
-12
Q3
-13
▬ ALB ▬ MKD ▬ SRB ▬ Eurozone (ECB refinance rate) ▬ SEE6 ▬ EU11 ▬ EU15
Source: ECB, National statistical offices. Source: IMF IFS, ECB, Eurostat, National central banks.
SOUTH EAST EUROPE REGULAR ECONOMIC REPORT NO.7
32 | I. RECENT ECONOMIC DEvELOPMENT

By mid-2014, the average SEE6 non-performing loans (NPLs) increased to 16.7 percent of total loans, a level three times higher than the pre-crisis one. All of the SEE6 countries conformed to this rising trend in NPLs with the exception of Montenegro, where NPLs declined from a peak of 25 percent in early 2011 to 16.5 percent in October 2014 (Figure 41).16 By contrast, in the rest of the SEE6 countries, Albania and Serbia, for instance, with the highest NPLs across the region, NPLs changed only slightly relative to their crisis levels. In Serbia, the current level of NPLs is even higher than during the crisis despite a slight fall in the first half of 2014.
16 The decline came largely as a result of “bulk sales” of bad loans in 2011 and 2012.
High levels of NPLs among other supply- and demand-side factors have subdued credit growth. Tightening of the credit standards and further deterioration in parent-funding conditions has stressed the credit supply across the region, where foreign-owned banks play a dominant role.17 Furthermore, weak and fragile economic growth coupled with continued deleveraging reduced demand for credit. As a result, Serbia, Albania and Montenegro experienced credit contraction in the first half of 2014 while credit growth in Bosnia and Herzegovina and Kosovo remained slow at an average of 3–4 percent (Figure 42). FYR Macedonia was the only country that saw
17 A recent survey suggests that lending conditions in emerging European markets tightened in Q3 2014 after having slightly improved in Q2 2014. Institute of International Finance, Emerging Markets Bank Lending Conditions Survey - Q3 2014.
Financial Sector
Figure 41: Non-performing Loans Figure 42: Credit Growth Rates
percent of gross loans percent (year-on-year)
0
30
25
20
15
10
5
ALB BIH KOS MKD MNE SRB
-10
-5
20
15
10
5
0
2009 2010 2011 20132012 Jun-14
J Jun-13 J Jun-14 Q Peak since 2008 ▬ ALB ▬ BIH ▬ KOS ▬ MKD ▬ MNE ▬ SRB
S Pre crisis level (end 2007)
Source: National authorities and World Bank staff calculations. Source: National authorities and World Bank staff calculations.Note: Average growth rate for the period 2003–2005 for Albania and Serbia, and for the period 2004–2005 for FYR Macedonia and Montenegro. Due to the accounting harmonization with IFRS, data for Montenegro for 2010 onwards is not comparable.
I. RECENT ECONOMIC DEvELOPMENT | 33
COPING WITH FLOODS, STRENGTHENING GROWTH

a significant credit growth (driven by increased lending to the corporate sector) as the economy continued strengthening.
Falling loan-to-deposit ratios reflected the sluggish credit growth. Increasing deposits, which grew by 9 percent in the first half of 2014 (year-on-year) also contributed to the decline in average loan-to-deposit ratio in the SEE6, which was around 98 percent in mid-year. At 136 percent in September 2014, Serbia had the highest ratio in the region, underscoring the dependence on parent funding. Bosnia and Herzegovina and Montenegro also have loan-to-deposit ratios higher than 100, standing at 116 and 111 respectively in mid-2014 (Figure 43).
Profitability remained below pre-crisis levels. The overall return on assets (RoA) in SEE6 increased from 0.5 percent to almost 1 percent in mid-2014, but continues to underperform the pre-crisis levels (Figure 44). The reduced profitability is particularly significant in the FYR Macedonian and Serbian financial sectors, the latter plagued with the highest levels of
NPLs and loan-to-deposit ratio across the region and a recession.
Liquidity levels and capitalization do not raise immediate concerns. High levels of liquidity and capitalization in the SEE6 are a response to the volatility of financial flows and uncertainty about the funding from and potential exit of parent banks. Against this background, overall liquidity in the banking system, standing between 19 and 33 percent of the overall assets, seems adequate (Figure 45). Capital adequacy of the system reached an average of 17.2 percent in mid-2014 and is far above the legal requirements of 8–11 percent (depending on the country), which should be sufficient to absorb identified risks in the system (Figure 46). However, there are pockets of higher vulnerability among individual banks. In addition, growing NPLs and the resulting provisioning may erode some banks’ capital buffers in the future.
Key risks to the financial sector derive from slow NPL resolution and high dependence on parent banks. If not reduced, NPLs
Figure 43: Loan-to-Deposit Ratios Figure 44: Return on Assets (RoA)
percent percent, quarterly averages
0
180
160
140
120
100
80
60
40
20
ALB BIH KOS MKD MNE SRB ALB BIH KOS MKD MNE SRB
-3
-2
3
2
1
0
-1
J Jun-13 J Jun-14 Q Peak since 2006 J Dec-12 J Dec-13 J Q1-14 J Q2-14 Q Average (2006–08)
Source: National authorities and World Bank staff calculations. Source: National authorities and World Bank staff calculations.
SOUTH EAST EUROPE REGULAR ECONOMIC REPORT NO.7
34 | I. RECENT ECONOMIC DEvELOPMENT

will continue burdening banks’ balance sheets, undermining profits and capital, and suppressing banks’ interest in new lending and more broadly, banks’ ability to have a positive impact on economic growth. In addition, limited access to external financing, vulnerability of some banks and prolonged weakness in the euro area all pose risks to a sustained economic recovery.
Weaknesses in the legal system hinder the ability of banks to enforce collection against defaulted borrowers and the realization of collateral. There are several important obstacles to NPL resolution in the legal frameworks of most SEE6, including: (i) weaknesses in corporate and personal insolvency regime and creditors’ rights; (ii) legal ambiguity regarding the sale of NPLs, (iii) tax laws which discourage restructuring, write-off or sale of NPLs, and (iv) the absence of a sufficient legal framework for corporate out-of-court debt restructuring.
Foreign bank subsidiaries rely on parent bank support, which renders the system vulnerable
to external developments. Foreign banks from the Eurozone dominate the financial sectors in the SEE618 (SEE6 Box IV). With the exception of Serbia, the assets of the SEE6 banking sectors are approximately 90 percent foreign owned. Foreign funding to SEE6 continued to decline (Figure 47). In the first half of 2014, BIS reporting banks significantly reduced their cross-border exposure in the SEE6 financial sector by 0.6 percent of GDP, compared to a reduction of 0.45 in 2013 Q4. On a country level, there continued to be considerable divergences, with Bosnia and Herzegovina and Serbia showing the largest reductions (Figure 48).
18 Austrian Hypo Alpe Adria Bank agreed to sell its Balkan banking unit SEE6 holding to U.S. private equity firm Advent International and the EBRD, for an undisclosed amount. SEE6 holding, which owns 7 banks in Slovenia, Croatia, Serbia, Bosnia and Herzegovina and Montenegro, had €8.5bn in assets at end-June. Its book value was cut to €500mn in 2013. The sale must be approved by the Austrian government, Hypo’s former owner BayernLB as well as the EBRD and Advent.
Figure 45: Liquidity Ratio Figure 46: Capital Adequacy Ratio
percent percent, quarterly averages
0
45
40
35
30
25
20
15
10
5
Q1
-09
Q2
-14
Q3
-09
Q1
-10
Q1
-11
Q1
-12
Q1
-13
Q1
-14
Q3
-10
Q3
-11
Q3
-12
Q3
-13
25
20
15
10
5
0
ALB BIH KOS MKD MNE SRB
▬ ALB ▬ BIH ▬ MKD ▬ MNE ▬ SRB J Dec-12 J Dec-13 J Q1-14 J Q2-14 Q Average (2006–08)
Source: National authorities and World Bank staff calculations. Source: National authorities and World Bank staff calculations.Note: Data for Serbia for Average (2006–2008), quarterly, refers to 2008 only. Due to the accounting harmonization with IFRS, data for Montenegro is not comparable.
I. RECENT ECONOMIC DEvELOPMENT | 35
COPING WITH FLOODS, STRENGTHENING GROWTH

Figure 47: Funding and Funding Costs for sEE6
Figure 48: BIs Cross-Border Claims, 2013:Q2–2014:Q2
millions, Euro basis points change, percent of 2013 GDP, exchange-rate adjusted
-2,000
2,000
1,500
1,000
500
0
-500
-1,000
-1,500
0
1,000
900
800
700
600
500
400
300
200
100
Q1
-11
Q3
-11
Q2
-11
Q4
-11
Q1
-12
Q1
-13
Q1
-14
Q3
-12
Q3
-13
Q2
-12
Q2
-13
Q2
-14
Q4
-12
Q4
-13 -8
8
6
4
2
0
-2
-4
-6
ALB BIH MKD MNE SRB
J Change in BIS reporting banks external position vis-à-vis SEE6 J Q2-14 J Q1-14 J Q4-13 J Q3-13 J Q2-13 Q Total
▬ Parent Banks CDS spread ave., rhs ▬ SEE6 sovereign CDS spread, bps, rhs
Source: Bloomberg, Bank of International Settlements (BIS) and World Bank (WB) staff calculations.
Source: BIS Locational Banking Statistics and WB staff calculations.
Box IV. Financing the sEE6 Banking system
The pre-crisis banking model in SEE6 relied on a large foreign bank presence and high dependence on parent bank funding (except in FYR Macedonia). While financial sector development differed across SEE6 countries in the pre-crisis period of 2003–2008, some common trends can be identified including continued financial sector deepening and consolidation of the banking sectors as well as a shift towards privately-owned banking sectors with increased foreign ownership. Fueled by a benign global environment and ample lending supported by foreign parent banks’ funding and capital in subsidiaries, credit to the private sector grew at rates exceeding 30 percent between 2003 and 2005. As a consequence, banks’ loan-to-deposit ratios peaked at 120–170 percent in Bosnia and Herzegovina, Montenegro and Serbia.
The associated vulnerabilities of this model became clear during the global financial crisis when capital inflows came to a halt. As a result of the crisis, capital flows to SEE6 countries reversed and banks’ financing constraints became apparent, jeopardizing macro-financial stability. Between end-2008 and 2013, BIS-reporting banks reduced their cross-border exposure in the SEE6 financial sector by 2.8 percent of GDP. However, a traditional banking sector model, absence of riskier instruments as well as the launch of the Vienna Initiative, which aimed inter alia to prevent large-scale capital withdrawals from Eastern Europe and to ensure Eastern European subsidiary banks were sufficiently well capitalized, helped the financial systems in the region to weather the global crisis relatively well.
Post crisis trends suggest a shift in funding structures for SEE6 banks toward domestic deposit mobilization. Domestic deposits grew at an average of 9 percent of GDP between end 2008 and end 2013 (Table IV.1). This shift is also reflected in the average loan-to-deposit ratio continuing its generally moderate downward movement, now at around 98 percent. However, as foreign banks still own an average of 87 percent of banking sector assets, the SEE6 financial systems remain
continued to next page
SOUTH EAST EUROPE REGULAR ECONOMIC REPORT NO.7
36 | I. RECENT ECONOMIC DEvELOPMENT
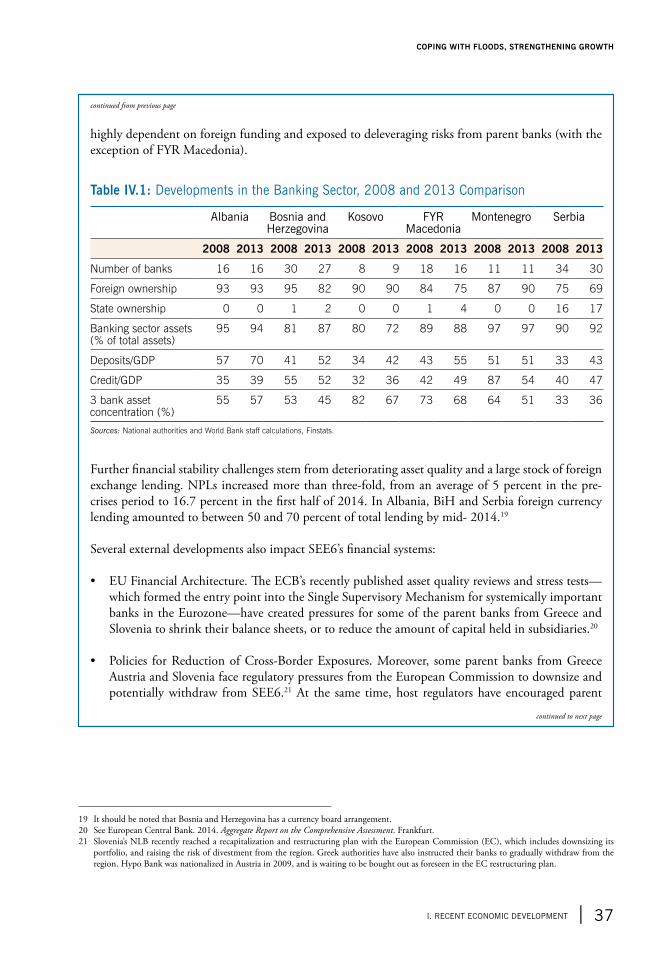
19 It should be noted that Bosnia and Herzegovina has a currency board arrangement.20 See European Central Bank. 2014. Aggregate Report on the Comprehensive Assessment. Frankfurt.21 Slovenia’s NLB recently reached a recapitalization and restructuring plan with the European Commission (EC), which includes downsizing its
portfolio, and raising the risk of divestment from the region. Greek authorities have also instructed their banks to gradually withdraw from the region. Hypo Bank was nationalized in Austria in 2009, and is waiting to be bought out as foreseen in the EC restructuring plan.
highly dependent on foreign funding and exposed to deleveraging risks from parent banks (with the exception of FYR Macedonia).
Table IV.1: Developments in the Banking sector, 2008 and 2013 Comparison
Albania Bosnia and Herzegovina
Kosovo FyR Macedonia
Montenegro serbia
2008 2013 2008 2013 2008 2013 2008 2013 2008 2013 2008 2013
Number of banks 16 16 30 27 8 9 18 16 11 11 34 30
Foreign ownership 93 93 95 82 90 90 84 75 87 90 75 69
State ownership 0 0 1 2 0 0 1 4 0 0 16 17
Banking sector assets (% of total assets)
95 94 81 87 80 72 89 88 97 97 90 92
Deposits/GDP 57 70 41 52 34 42 43 55 51 51 33 43
Credit/GDP 35 39 55 52 32 36 42 49 87 54 40 47
3 bank asset concentration (%)
55 57 53 45 82 67 73 68 64 51 33 36
Sources: National authorities and World Bank staff calculations, Finstats.
Further financial stability challenges stem from deteriorating asset quality and a large stock of foreign exchange lending. NPLs increased more than three-fold, from an average of 5 percent in the pre-crises period to 16.7 percent in the first half of 2014. In Albania, BiH and Serbia foreign currency lending amounted to between 50 and 70 percent of total lending by mid- 2014.19
Several external developments also impact SEE6’s financial systems:
• EU Financial Architecture. The ECB’s recently published asset quality reviews and stress tests—which formed the entry point into the Single Supervisory Mechanism for systemically important banks in the Eurozone—have created pressures for some of the parent banks from Greece and Slovenia to shrink their balance sheets, or to reduce the amount of capital held in subsidiaries.20
• Policies for Reduction of Cross-Border Exposures. Moreover, some parent banks from Greece Austria and Slovenia face regulatory pressures from the European Commission to downsize and potentially withdraw from SEE6.21 At the same time, host regulators have encouraged parent
continued from previous page
continued to next page
I. RECENT ECONOMIC DEvELOPMENT | 37
COPING WITH FLOODS, STRENGTHENING GROWTH

The recent floods have shown the importance of expanding insurance markets to protect homeowners and businesses against natural disasters. On average, in Bosnia and Herzegovina around 2 out of 100 homeowners are insured against natural disasters. 18 percent of those working (formally or informally) report working in the agricultural sector in SEE6, compared to around 9 percent in EU11 countries and 4 percent in EU15 countries (Figure 49). With over 40 percent in Albania and around 20 percent in both Bosnia and Herzegovina and Serbia working in the agricultural sector, the livelihoods of a large share of the population are vulnerable to weather shocks. Poorer households are particularly likely to work in agriculture and live in rural areas making them especially
22 For example the Austrian Central Bank (OeNB) introduced in the beginning of 2012 a series of capital, liquidity and resolution measures to strengthen the sustainability of the business model of Austrian banks and their subsidiaries.
vulnerable (Figure 50). On average, in SEE6, nearly three in every five individuals live in rural areas compared to two in every five better off households. The large losses and damages to agriculture from the recent floods totaled close to €200 million in Bosnia and Herzegovina alone. Around 17 percent of arable land was affected and a small number of rural residents bore the brunt (with losses of poultry reaching up to 80 percent in some villages).
Improvements in insurance systems and coverage could help to mitigate adverse impact of climate change in SEE6, and these improvements will likely support the poorer and rural population in particular. However, few of those who rely on agriculture for their livelihoods have insurance coverage. For example, in FYR Macedonia, just 4 percent of registered farmers insured their crops against weather related perils. In Kosovo, insurance companies represented just 3 percent of the total assets of the financial system in Q2,
bank groups to put in place more stringent limits on the funding credit lines of their SEE6 subsidiaries.22
• Global regulatory reforms. Basel III introduces new regulatory frameworks for capital and liquidity as well as capital surcharges for global systemically important financial institutions affecting the SEE6 region if implementation is ‘frontloaded’ by host countries.21
Fostering an orderly deleveraging process as well as rebalancing of the existing funding models is crucial for further financial sector development and economic growth in the region. Measures could focus on recalibrating banks’ business models, promoting savings mobilization through macroeconomic policies and developing regional capital markets. Underperforming bank profitability compared to pre-crisis levels as well as pockets of vulnerabilities among individual banks require continued focus on implementing bank recovery and resolution regimes. Building on the achievements of the Vienna Initiative, SEE6 countries should work to further strengthen cooperation with home country supervisory authorities to ensure ongoing financial stability as banking supervisors require more information about the risk profiles of parent banks and banking groups.
continued from previous page
SOUTH EAST EUROPE REGULAR ECONOMIC REPORT NO.7
38 | I. RECENT ECONOMIC DEvELOPMENT

2014, while in Bosnia and Herzegovina, they represented 5 percent of the total. The recent floods highlighted the importance of insurance cover in Bosnia and Herzegovina, with surveys indicating that in most areas of the country more people relied on savings or contributions from family members than on insurance.23
23 For example, in Tuzla and Banja Luka only one in ten firms and businesses impacted repaired damages using insurance payments and around four in ten relied on savings (rural areas were less likely to be able to rely on savings). In Banja Luka a quarter of those impacted repaired damages using payments from the family, highlighting the importance of remittances (domestic or international) for mitigating the impact of shocks and acting as a form of insurance.
Figure 49: share of Employment in Agriculture, 2012
Figure 50: share of Individuals Living in Rural Areas
percent percent
ALB BIH KOS MKD MNE SRB SEE6 EU15EU11
0
45
40
35
30
25
20
15
10
5
ALB EU11BIH KOS MKD MNE SRB
0
80
70
60
50
40
30
20
10
J Top 60 J Bottom 40 Q Bottom 20
Source: World Development Indicators.Note: Albania data from 2010 and Dutch data (in EU15) from 2011. According to the 2010 Agricultural Census, only 5 percent of agricultural employment is formal; therefore, the above number underestimates the agri employment.
Source: World Bank 2014, RER Special Topic: First Insights into Promoting Shared Prosperity in South East Europe.Note: The periods covered for each country are as follows: Albania (2012), Bosnia and Herzegovina (2007), Kosovo (2011), FYR Macedonia (2008), Montenegro (2011), Serbia (2010), EU11 (2010).
I. RECENT ECONOMIC DEvELOPMENT | 39
COPING WITH FLOODS, STRENGTHENING GROWTH


The SEE6 region as a whole is projected to grow by 1.3 percent in 2015, supported by a slowly recovering external demand, especially in Europe, and stabilization of international energy prices at around current levels. In the baseline scenario, external demand will remain a key driver of growth in support of SEE6 industrial activity and export growth. Domestic demand in SEE6 is likely to remain subdued amidst weak consumer and business confidence and despite lower oil prices and household and government efforts to rebuild after the recent floods. Confidence will be dampened by lingering political uncertainty, chronically high unemployment, weak business climate, and banking systems saddled with high NPLs. SEE labor market performance is likely to worsen (or at best remain stagnant) as the 2014 growth deceleration in Serbia and Bosnia and Herzegovina will likely be reflected in labor market outcomes with some lag. In contrast, marginal improvements in the employment rate in the faster growing SEE6 can be expected. Fiscal consolidation efforts are set to continue in 2015 in SEE6, with the exception of Montenegro where the start of a highway construction project will widen considerably the fiscal deficit. On the external side, the current account balances of the SEE6 are likely to stabilize at around current levels, as expected increases in external demand for SEE6 exports are largely offset by rising imports in support of domestic demand.
Table 2. Real GDP Growth, 2013–15
percent
2013 2014e 2015f
ALB 1.4 2.1 3.0
BIH 2.5 0.4 1.0
KSV 3.4 2.5 3.0
MKD 2.7 3.3 3.5
MNE 3.3 1.5 3.4
SRB 2.6 -2.0 -0.5
SEE6 2.5 0.2 1.3
Memo item: Eurozone -0.4 0.8 1.1
Source: World Bank estimates and projections.Note: SEE6 is a weighted average.
The 2015 SEE6’s GDP forecast of 1.3 percent is considerably lower than the World Bank Group (WBG) projection in May 2014. The previous projection was 2.7 percent growth in 2015, twice as high as the current one of 1.3. In addition, this is significantly lower than the WBG projections for other European transition economies, where growth in 2015 is expected at 2.8 percent.24 The SEE6 growth is likely to be held back by a weak recovery in Bosnia and Herzegovina and notably by another recession in Serbia. Serbia, the largest of the SEE6 economies, is headed toward a sizeable fiscal consolidation and major state-owned enterprise restructuring to bring its public debt to a sustainable level and this is likely to act as a drag on economic activity in 2015. Albania,
24 World Bank. 2015. Global Economic Prospects. (January 2015).
II. Prospects
II. PROsPECTs | 43
COPING WITH FLOODS, STRENGTHENING GROWTH

Kosovo, FYR Macedonia and Montenegro are expected to grow by over 3 percent in 2015, with economic growth reaching 3.8 percent in FYR Macedonia. Economic growth in these four countries is expected to accelerate on the back of stronger than current external demand, modest improvements in the labor market (declines in unemployment), and some momentum in construction, services, and tourism.
Potential output growth remains limited by structural challenges. The functioning of the labor markets across the region is anemic with persistently high unemployment rates, low labor force participation rates, and sluggish formal job creation. Even though some progress has been made in easing the burdens of the investment climate, there is still room for improvement. The public sector is large and inefficient in many countries in the region. For all countries, investment in improved, well-maintained, and/or upgraded capital stocks would help to replace the current obsolete infrastructure in the region and help to boost economic potential, provided such investments are with positive economic returns and do not threaten the sustainability of public debt. Improved connectivity of the SEE6 region through physical and institutional linkages within the countries, to the EU, and to the rest of the world, will help competitive SEE6 firms reach new markets and foreign investors brought to the region. Advancement in the EU accession process represents an opportunity for the SEE6 to pursue an EU integration agenda also with a positive impact on potential growth (Box VI).
Therefore, economic growth in the near- and the medium-term in SEE6 can be
supported through sound and well-prioritized economic policies to tackle these structural impediments. On the fiscal side, sustained reform effort is needed to address structural rigidities in the budgets of SEE6. Priorities include: changes in the composition of public expenditure toward productive investment and away from wages; public expenditure targeting and prioritization; arrears clearance; improvements in revenue collection; broadening of the tax base while reducing the labor tax wedge, among others. On the monetary policy side, with regional inflation at a low levels and still remaining output gaps in almost all SEE6 economies, some scope for short-term easing of monetary conditions exists, especially in those countries where deficits have begun to decline. However, caution needs to be exercised in the economies with flexible exchange rates to ensure that these do not come under pressure. The room for monetary policy easing is further limited, as policy rates are already low by historical standards and foreign-currency denominated debt is high. In terms of financial sector policies, addressing the high NPLs would be critical to ultimately restore the growth of credit and support entrepreneurship and job creation.
Structural challenges aside, there are several negative external and country-specific risks to the near term outlook of the SEE6 countries. These risks include:
(i) The effects of the ongoing and planned fiscal consolidation and privatization programs could adversely impact public support for reforms. The SEE6 economies are vulnerable to political instability, which may rise as a result of planned fiscal consolidations and/or privatizations and
SOUTH EAST EUROPE REGULAR ECONOMIC REPORT NO.7
44 | II. PROsPECTs

state-owned enterprise restructuring. (ii) The risk of deflation in SEE6 persists.
Weak economic recovery at home, low inflation in trading partners such as the EU, further fall in oil prices, as well as inflationary expectations may continue to put downside pressures on growth. Subdued aggregate demand growth suppressed by the presence of a
25 Includes Naftogaz.
consolidating fiscal policy will remain a strong disinflationary factor. Deflation will make difficult deleveraging in the highly-indebted public sector and in the private sector. Deflation will exacerbate slow recovery in investment and prolong low consumption. In addition, deflation will likely increase NPL, which will in turn exacerbate the vicious cycle of credit crunch, insufficient demand, and domestic recovery.
Box V: Potential Effects of the Ukraine Crisis on the sEE6 Economies
Russia’s annexation of Crimea in February 2014 triggered a political and economic crisis in Ukraine, with its GDP expected to contract by 8 percent and the consolidated fiscal deficit25 projected at 10.1 percent of GDP in 2014. The events raised strong reactions across the world. The U.S. and EU imposed sanctions, which, coupled with the overall uncertainty about the geopolitical developments, low oil prices and persistent structural weaknesses, brought the Russian economy to stagnation with the projected growth remaining at 0.4 percent in the medium term. The SEE6 economies are vulnerable to the effects of the crisis due to their strong ties with the EU and Russia.
Natural gas consumption is significant in two of the SEE6 countries, Bosnia and Herzegovina and Serbia, which import most of their natural gas from Russia through Ukraine. The possibility of a disruption of gas imports is a significant threat to energy security in these countries. Domestic natural gas production and storage capacities are limited in Bosnia and Herzegovina. Therefore, such a disruption is likely to have a larger effect on its economy than in Serbia, where domestic production and existing stocks can cover as much as half of Serbia’s annual natural gas consumption. A European Commission report finds that in the event of a disruption of gas imports from Russia, the availability of gas in Bosnia and Herzegovina can decline by as much as 80–100 percent in the matter of a few weeks at most. In Serbia, gas consumption is projected to remain unaffected for the first five months. Demand-side measures can reduce the effects; however, the absence of a complete market mechanism for gas distribution and technical inefficiencies in the distribution network are likely to make their implementation difficult.
The effects of the sanctions imposed against Russia can also permeate through the SEE6 countries. Montenegro’s aluminum trade with the Russian CEAC group was already suspended in 2013. There are between 5,000 and 7,000 Russians permanent residents in Montenegro. Russian citizens owned 32 percent of foreign companies in Montenegro in 2012. The flow of funds between Montenegro and Russia can be affected directly from the sanctions or through their effects on the Russian economic growth. A continued slowdown in Russia is likely to reduce also Montenegro’s tourism exports. In the first ten months of 2014, around 21 percent of all tourist arrivals and 27 percent of tourist overnight stays were from Russia.
continued to next page
II. PROsPECTs | 45
COPING WITH FLOODS, STRENGTHENING GROWTH

(iii) Slower than expected global (especially EU) economic growth could limit both external demand for SEE6 exports and external financing available to these countries. The positive growth forecasts for 2015 will require continued export-led growth to the SEE6’s largest market, the EU. A slower than expected recovery could reduce export to and investment (especially in the manufacturing sector) from the EU. With strong reliance on the European banking sector for financing needs, a slow recovery could also reduce financing availability. Further deleveraging remains a risk as some parent banks plan to further scale back their presence in SEE6 as a result of continued market and regulatory pressures. The European Central Bank’s recently published asset quality review of parent banks has important implications in SEE6 as parent banks from Greece and Slovenia failed the
recent asset quality review and stress test conducted by the European Central Bank (ECB)26. Moreover, some parent banks (such as Slovenia’s NLB, Greek and some Austrian banks) face regulatory pressures to downsize and potentially withdraw from the SEE6.
(iv) Geopolitical risks also dim the SEE6 growth prospects. Given their strong ties with the EU and Russia, the SEE6 economies are vulnerable to the effects of potentially intensifying geopolitical tensions stemming from the Russia-Ukraine crisis. Box V spells out the Ukraine crisis on the regional economies. There are potential effects which if realized would lead to lower growth and other adverse macro consequences for SEE6.
26 See European Central Bank. 2014. Aggregate Report on the Comprehensive Assessment. Frankfurt.
The SEE6 growth is also vulnerable to some second-order effects. For instance, the economies of Albania, Kosovo, FYR Macedonia, and Montenegro do not depend at all or significantly on consumption of natural gas. However, a disruption of natural gas supplies is likely to increase the regional demand for electricity, which would have implications on the domestic electricity and food prices. Moreover, the SEE6 economies are highly dependent on the EU markets as the EU is the main destination for the SEE6 goods and services exports. The EU imports 53 percent of its energy consumption and 66 percent of its natural gas. Around a quarter of EU gas consumption is imported from Russia and half of these imports are through Ukraine. A disruption of the Russian gas exports to the EU would particularly affect the Eastern Europe and the Baltics, and in turn the SEE6 through reduced external demand.
Overall, a prolonged crisis in Ukraine is projected to reduce the SEE6 growth in 2015 from 1.9 percent to 1.8 percent.
Note: The European Commission published the results of the stress test conducted to test the implications of the disruptions in the natural gas imports from Russia on the European energy security in October 2014. The test covers the EU countries, SEE6, Ukraine, Moldova, and Georgia. The report is available at http://ec.europa.eu/energy/stress_tests_en.htm.
continued from previous page
SOUTH EAST EUROPE REGULAR ECONOMIC REPORT NO.7
46 | II. PROsPECTs

(v) Adverse weather conditions have been shown to have significant negative impacts on economic growth prospects in the region. The region has been shown to be vulnerable to weather shocks, a problem that is likely to worsen over the medium to long term with climate change, affecting potential growth and public finances. Droughts impact heavily the region’s energy-generation capacity, poor weather impacts tourism exports, floods impact agriculture and severe winters reduce production and consumption. The latter may also impact public sector finances and the CAD as countries seek to reconstruct following damage and government revenues shrinks with reduced economic activity. Although the SEE6 has not yet experienced heatwaves as other areas of Europe did in 2014 and 2007, these may also reduce productivity and put pressure on the region’s health systems. Poorer households may be more vulnerable to many weather shocks than wealthier ones (e.g. health shocks or those impacting agriculture). Both mitigation and adaptation measures (e.g. by building flood defenses or weather-resistant infrastructure) should be considered to reduce the impact of such shocks on economic growth and poverty, as well as on the government’s public finances.
On the up side, sustained low oil prices could support higher economic growth in SEE6. All countries in the region import significant quantities of petroleum fuel, with Bosnia and Herzegovina and FYR Macedonia importing fuel worth around 10 percent of GDP. Net fuel imports are also high, at 5 to 6 percent of GDP on average over 2012–13. A further fall
in oil prices would therefore have significant impacts on the current account balance in all countries except Albania (which also has large oil exports, and could therefore suffer from the current low oil prices). Simulations suggest that a fall in the price of oil of around 40 percent during the whole of 2015 compared with average 2013 price could result in an average reduction in the current account deficit in SEE6 by around 2 percentage points compared to current forecasts. A sustained fall in oil prices would also likely have a beneficial impact on economic activity by reducing costs for firms and consumers, boosting economic growth.
The fall in oil prices does not come without downside risks, however. With VAT a significant source of revenue for the public purse, a fall in oil prices will likely translate into lower tax revenue. Some action may be warranted to shore up tax collections, for example by increasing excise duties. Governments may also consider taking alternative tax policy measures (e.g. fuel excises, tobacco taxes, carbon taxes) to finance reductions in other taxes, notably those on labor, to encourage increased employment. Finally, if low fuel prices pass through into lower inflation-expectations, non-fuel inflation could decline further, bringing its own risks.
II. PROsPECTs | 47
COPING WITH FLOODS, STRENGTHENING GROWTH

Box VI: sEE6’s EU Accession Progress
Four of the SEE6 countries are currently candidates for EU accession with only one of them in active accession negotiations. Montenegro was granted the EU candidate status in October 2010 and accession negotiations were opened in June 2012. The EU screening process in Montenegro was completed in May 2014. In the negotiation process so far, two chapters have been provisionally closed and sixteen chapters have been opened. Serbia became a candidate country in March 2012. The European Council decided to open accession negotiations with Serbia in June 2013, and held the 1st Intergovernmental Conference with Serbia in January 2014. By end-2014, 26 out of 35 chapters were screened, but none chapters were opened for negotiations yet due to lack of progress on the “Brussels agreement” between Serbia and Kosovo. FYR Macedonia has been a candidate since December 2005. Even though the Commission has recommended on several occasions the opening of accession negotiations since October 2009, the recommendation has not yet been endorsed by the European Council and negotiations postponed. Albania gained the EU candidate status in June 2014.
Two of the SEE6 countries are with a potential EU candidate status. Upon commitment to a reform agenda, the EU may also activate its SAA with Bosnia and Herzegovina in 2015. In July 2014, the EU and Kosovo chief negotiators initiated the Stabilisation and Association Agreement between the EU and Kosovo which is expected to be signed in 2015.
Source: European Commission, at ec.europa.eu
Potential EU Candidate CountriesBosnia and HerzegovinaKosovo
EU Candidate CountriesAlbaniaFYR MacedoniaOpened negotiation talks:MontenegroSerbia
EU Acceding Countries
SOUTH EAST EUROPE REGULAR ECONOMIC REPORT NO.7
48 | II. PROsPECTs


The climate is changing and not for the better in most parts of the world. Last year’s IPCC Fifth Assessment Report (AR5) noted that “[h]uman influence on the climate system is clear, and recent anthropogenic emissions of greenhouse gases are the highest in history. Recent climate changes have had widespread impacts on human and natural systems” while “[c]ontinued emission of greenhouse gases will cause further warming and long-lasting changes in all components of the climate system, increasing the likelihood of severe, pervasive and irreversible impacts for people and ecosystems. Limiting climate change would require substantial and sustained reductions in greenhouse gas emissions which, together with adaptation, can limit climate change risks.”28
A changing climate is expected to impose damages on economies in coming years, although Europe will suffer less than most regions. Those damages can come from extreme weather events: floods and storm surge, heat waves and wildfires, and sea level rise; and related events such as the spread of disease. The damage can come from reductions
27 This Spotlight is based on World Bank, 2014. FYR Macedonia: Green Growth Country Assessment. Washington DC.
28 IPCC, “Headline statements from the Summary for Policymakers”, November 5, 2014, Climate Change 2014 Synthesis Report.
in productivity driven by, for example, growing water scarcity. The damage can be directly to people, to their houses and possessions, or to infrastructure and capital. Estimates of global costs to world GDP in 2050 related to a changing climate generally do not exceed 2 percent. Europe is a region that will suffer less damage from a changing climate than much of the rest of the world. However, even Europe will not escape significant negative impacts, some of which are already materializing.29 The updated climate analysis of AR5 concluded that the frequency of heat waves has increased in large parts of Europe since 1950 as has the frequency or intensity of heavy precipitation events.30
Climate extremes in the SEE6 region are now and will in the future pose major risks to agricultural systems, energy and human health. The SEE6 are particularly exposed to the effects of extreme events, including heat,
29 First, the AR5 analysis provides an assessment of changes in extreme weather and the climate events that have occurred since 1950, then of human contribution to observed changes, and the likelihood of further changes through the 21st century.
30 IPCC, 2013: Summary for Policymakers. In: Climate Change 2013: The Physical Science Basis. Contribution of Working Group I to the Fifth Assessment Report of the Intergovernmental Panel on Climate Change [Stocker, T.F., D. Qin, G.-K. Plattner, M. Tignor, S.K. Allen, J. Boschung, A. Nauels, Y. Xia, V. Bex and P.M. Midgley (eds.)]. Cambridge University Press, Cambridge, United Kingdom and New York, NY, USA.
III. Spotlights
Spotlight I. Economic Impact of Climate Change in SEE with Lessons from FYR Macedonia Green Growth Study27
III. sPOTLIGHTs | 51
COPING WITH FLOODS, STRENGTHENING GROWTH

droughts, and flooding. Heat extremes will become the new norm for the SEE6, and the risk of drought is high. At the same time, projections suggest an increase in riverine flood risk, mainly in spring and winter, caused by more intense snow melt in spring and increased rainfall in the winter months (precipitation projections are, however, particularly uncertain). Since most crops are rain-fed, they are very vulnerable to projected climate change. Pasture yields and grassland ecosystems for livestock grazing may be affected by sustained drought and heat, and decline over large parts of the Western Balkans. Further, energy systems are vulnerable to extreme events and changes in river water temperatures. Changing seasonality of river flows can further undermine hydropower production, and most SEE6 countries depend on hydroelectric sources for at least one-fifth of their electricity production. Lastly, extreme climate events and the appearance of new disease vectors pose serious risks to human health. The seasonality of temperature-related mortality may shift from winter to summer across continental Europe. Further health risks are likely due to climate change resulting in favorable conditions for the insect vectors transmitting diseases, such as dengue fever and Chikungunya fever.31
A recent program of analytic work in FYR Macedonia illustrates how the economic impact of a changing climate and the best adaptation response to that change can be determined, within a broad integrated green growth assessment. Projected climate change will affect FYR Macedonia’s economy, mainly via a direct shock to agriculture and
31 World Bank, 2014. Turn Down the Heat: Confronting the New Climate Normal. Washington, DC.
associated spillovers on other sectors in the economy, and to a lesser extent due to losses caused by extreme weather events. The effect of climate change on FYR Macedonia’s water supply is estimated to be large and widespread, occurring as early as 2020 in most places in the country, but with larger reductions in mean annual volume of water through 2050 in rivers as temperature increases and rainfall declines. Changes in rainfall amounts as well as their temporal and spatial patterns will tend to reduce water availability across consuming sectors--agriculture, hydropower, thermoelectric cooling, and industrial and municipal demand--especially at times of peak demand. Growing water shortages will dampen crop yields and agricultural incomes. At the same time, as the country becomes drier and hotter, the risk of floods will diminish, but the risk of wildfires will increase.
Analysis of the water sector was aimed at assessing the impact of a changing climate on competing uses of water, in particular by the agriculture and power sectors. A series of models were applied, starting from Global Circulation Models, to water planning, water run-off, and an agricultural yield model. Competition for water between agriculture (especially as the climate warms and dries), the power sector (for hydropower, a critical element in a lower emissions electricity system, and for thermal cooling), and industrial and municipal uses will pose difficult tradeoffs for FYR Macedonian policymakers by 2020 unless efficiency in both demand and supply is bolstered. The growing scarcity of water can be addressed, first of all, by reducing inefficiencies through pricing and regulation of groundwater and through rehabilitation and maintenance of existing infrastructure. Growing seasonal
SOUTH EAST EUROPE REGULAR ECONOMIC REPORT NO.7
52 | III. sPOTLIGHTs

scarcity can be managed through investment in more storage (for irrigation and for hydropower), while overall shortages in future decades can be addressed through encouragement of water conservation. (See Figure SI.1 on how green actions help reduce demand-supply gaps for irrigation water). At the same time, an evolution in agriculture towards larger, more competitive, export-oriented farms will raise overall sector incomes while heightening resilience to a changing climate. Investment in basin-scale irrigation and drainage infrastructure (as noted above) will be critical to help water supply meet water demand. Even ambitious adaptation investments in agriculture are estimated to deliver benefits through 2050 that exceed costs four-fold. At the same time, land consolidation, switching to high value crops, and farmer education campaigns, along with other efficiency improvements, will raise agricultural
incomes and compensate for scarcer water. (See Figure SI.2 on how adaptation efforts in green scenarios lead to increased revenue and improved irrigation efficiency).
The infrastructure analysis developed a framework for decision-making about long-lived infrastructure assets despite uncertainty about future climate conditions. Weather patterns affect the reliability and quality of infrastructure services, and climate change is exacerbating these effects. Uncertainty about future climate compounds the challenge of making wise choices on infrastructure that is often long-lived and expensive. Planners need to decide whether to build infrastructure to be more resilient today or wait to see what happens and spend more on maintenance and rehabilitation (or replacement) later. Since it would be unaffordable to build all infrastructure today
Figure SI.1. Met and Unmet Demand for Irrigation Water, 2050
Figure SI.2. Impact of Adaptation scenarios on Agriculture, 2011–50
MCM by planning region additional agricultural revenues, US$
0
140
120
100
80
60
40
20
Vardar EasternSouth-western
South-eastern Pelagonia Polog
North-eastern Skopje
0
500
5,000
4,000
3,000
2,000
1,000
-200 0 200 400 600 800 1,000 1,200 1,400 1,600
10.3%Super Green
11.8% Green
13.4%
BAU
J Super Green J Green J BAU adaptation costs, US$ mln
Source: World Bank (2014), FYR Macedonia: A Green Growth Country Assessment.Notes: Super Green scenario is ambitious adaptation action, Green scenario is a modest adaptation, and BAU is the business-as-usual scenario. MCM is millions of cubic meters. The light shading is unmet irrigation demand while the dark is met demand.
Source: World Bank (2014), FYR Macedonia: A Green Growth Country Assessment.Notes: Costs are the present value over 2011 to 2050 of the flow of required additional expenditures (investment and O&M) compared to BAU. Revenues are the present value over 2011 to 2050 of the flow of the incremental sector revenues. Water demand-supply gap is the difference between water demand and supply (deficit), presented as percentage of demand. Size of bubble and numbers inside bubbles represent water demand-supply gap as percent of water demand.
III. sPOTLIGHTs | 53
COPING WITH FLOODS, STRENGTHENING GROWTH

to be resilient to all possible climate futures, ex ante adaptation should only be pursued where it makes financial sense. The methodology for infrastructure analysis combined cost-benefit analysis under uncertainty, climate-informed decision analysis, and robust decision-making. The analysis applies a cost-benefit approach over a range of climate scenarios to identify robust options and then identifying a subset of options likely to yield satisfactory results under a range of climate outcomes. For FYR Macedonia, the top priorities for infrastructure adaptation over the next decade include urban drainage systems, health and education facilities and municipal buildings.
An economy-wide macroeconomic assessment estimates the impact on growth and employment of packages of actions on climate action across sectors and provides advice on priorities for public investment. A dynamic general equilibrium model with detailed sectors simulated green scenarios against the baseline. Adaptation (and also mitigation) options were integrated into the model to allow analysis of the growth, employment, and fiscal implications of different combinations of green growth actions. Advice on public investment priorities emerges from the assessment. Climate investments pose costs upfront but provide benefits both now and later. Adaptation interventions (which protect tomorrow’s output from climate damage) are found to impose little costs in growth and employment in the short-term once sector results are integrated into a general equilibrium model. Under a ‘green’ climate action scenario, moderate adaptation measures in agriculture and water and incremental expenses in the climate-proofing of physical infrastructure would amount to the equivalent of around
0.1 percent of annual GDP. More ambitious climate adaptation action, under a ‘super-green’ scenario, would require water sector investments that reach one percent of GDP by 2015. Lastly, both moderate and ambitious climate action promise a medium- to long-term boost in the level of GDP by 2050.
SOUTH EAST EUROPE REGULAR ECONOMIC REPORT NO.7
54 | III. sPOTLIGHTs

In 2013, 232 million people—3.2 percent of the world’s population—lived outside their home country, a number that has increased by 80 million since 1990 (United Nations, 2013). Eastern and Southern Europe are among the top sending regions as measured by shares of emigrants in total source region population, with migrants accounting for roughly 8–10 percent of the region’s current population. During the 1990s and 2000s, Southern Europe had the largest shares of emigrants among all European regions and within the region that large number was mainly driven by SEE6 countries.
The equivalent of a quarter of the current population of SEE6 countries live outside their home countries. In 1990, the share of emigrants from SEE6 countries was twice as high as those of the remaining Southern European countries and roughly five times higher than those of the rest of the world (Table SII.1). Over the last two decades, SEE6 countries experienced a sharp increase in emigration and currently roughly 4.9 million people originating from SEE6 countries are counted as a migrants in another country—
that amounts to a quarter of the resident population.
Characteristics of migrants
Migrants tend to be of working age, reducing the size of the labor force in their home countries. The share of the age group 25–64 is larger among emigrants, whereas individuals aged 65 or older constitute a significantly larger part of the resident population than of emigrants (Figure SII.1). This results from of a combination of a higher likelihood of migration among younger people, an upward
32 For Bosnia and Herzegovina, data availability does not allow distinguishing between the two age categories 15–24 and 25–64 in the home country population. The two categories are combined to one (15–64).
Spotlight II. Insights into Migration in SEE6
Table SII.1: share of migrant stock in source region population, in percent
Source 1990 2000 2010 2013
SEE6 countries 13.2 22.7 24.2 25.4
Rest of Southern Europe
7.0 6.9 5.7 6.0
Rest of the World 2.7 2.6 3.0 3.0
Source: Own computations based on UN International Migrant Stocks (2013 Revision).
Figure SII.1: Age distribution of emigrants to OECD countries as compared to source country, 2005
age group shares in population (15+)
1.0
0.8
0.6
0.4
0.2
0
ALB
Emigr. Home
BIH
Emigr. Home
MKD
Emigr. Home
SRB
Emigr. Home
J 15–24 J 25–64 J 65+ J Unknown
Source: Age distribution of emigrants: OECD DIOC 2005/06 database; age distribution of source country population: Barro and Lee (2013) database (Albania and Serbia), IIASA-VID database (Lutz et al. 2007) (FYR Macedonia), WDI 2013 (Bosnia and Herzegovina.31
III. sPOTLIGHTs | 55
COPING WITH FLOODS, STRENGTHENING GROWTH

trend in emigration over the last decades and increased return migration after retirement, where in particular the latter can impose fiscal challenges to the countries.
Some SEE6 countries appear to suffer more from a “brain drain” than do others.
y On average, Albanian emigrants appear to be better educated than the resident population. Across all age groups, the share of secondary education attainment among emigrants is higher than for Albanian residents. This educational gap is even higher for tertiary education, indicating that a disproportionate share of high-skilled Albanians tend to emigrate (Figure SII.2).
y In Bosnia and Herzegovina, evidence for a brain drain is limited. Across all age groups, the shares of individuals with no, primary or incomplete secondary
education is higher for emigrants than for residents in Bosnia and Herzegovina. It appears that in particular individuals with secondary education are less likely to migrate. Individuals with some tertiary education, on the other hand, are marginally overrepresented in the population living in OECD countries (Figure SII.3).
y Similarly, education levels of FYR Macedonian emigrants are lower than those of the resident population (Figure SII.4).
y Education levels of Serbian emigrants do not differ considerably from those of the
33 Due to lack of appropriate data, Figure 3 (Bosnia and Herzegovina) has two shortcomings. First, the education of the three age groups of emigrants is compared to the education of the total labor force (ages 15+) in the population. For this reason, the three bars corresponding to the source country population are equal. Second, education data of the source country refers to the year 2009, that of emigrants to 2005/06.
Figure SII.2: Education of emigrants and source country population in 2005, Albania
Figure SII.3: Education of emigrants and source country population in 2005, Bosnia and Herzegovina32
education shares education shares
1.0
0.8
0.6
0.4
0.2
0
15–24
Emigr. ALB
25–64
Emigr. ALB
65+
Emigr. ALB
1.0
0.8
0.6
0.4
0.2
0
15–24
Emigr. BIH
25–64
Emigr. BIH
65+
Emigr. BIH
J Primary J Secondary J Tertiary J Unknown J Primary J Secondary J Tertiary J Unknown
Source: Own computations based on the following datasets. Education of emigrants: OECD DIOC 2005/06 database; education of source country population: Barro and Lee (2013) database (Albania and Serbia), IIASA-VID database (KC et al. 2010) (FYR Macedonia), WDI 2013 (Bosnia and Herzegovina).
Source: Own computations based on the following datasets. Education of emigrants: OECD DIOC 2005/06 database; education of source country population: Barro and Lee (2013) database (Albania and Serbia), IIASA-VID database (KC et al. 2010) (FYR Macedonia), WDI 2013 (Bosnia and Herzegovina).
SOUTH EAST EUROPE REGULAR ECONOMIC REPORT NO.7
56 | III. sPOTLIGHTs

resident population. Having completed secondary education appears to be slightly more frequent among Serbians living abroad (Figure SII.5).
Figure SII.4: Education of emigrants and source country population in 2005, FyR Macedonia
Figure SII.5: Education of emigrants and source country population in 2005, serbia
education shares education shares
1.0
0.8
0.6
0.4
0.2
0
15–24
Emigr. MKD
25–64
Emigr. MKD
65+
Emigr. MKD
1.0
0.8
0.6
0.4
0.2
0
15–24
Emigr. SRB
25–64
Emigr. SRB
65+
Emigr. SRB
J Primary J Secondary J Tertiary J Unknown J Primary J Secondary J Tertiary J Unknown
Source: Own computations based on the following datasets. Education of emigrants: OECD DIOC 2005/06 database; education of source country population: Barro and Lee (2013) database (Albania and Serbia), IIASA-VID database (KC et al. 2010) (FYR Macedonia), WDI 2013 (Bosnia and Herzegovina).
Source: Own computations based on the following datasets. Education of emigrants: OECD DIOC 2005/06 database; education of source country population: Barro and Lee (2013) database (Albania and Serbia), IIASA-VID database (KC et al. 2010) (FYR Macedonia), WDI 2013 (Bosnia and Herzegovina).
Box SII.I. A Medical Brain Drain?
The “medical brain drain” is impacting some SEE6 countries. The medical brain drain is defined as the proportion of physicians trained in a country and working abroad, and it can be used to approximate the pattern of general high-skilled emigration. With values below the worldwide average, Albania and FYR Macedonia show very little evidence for medical brain drain (Figure SII.6). In Serbia, medical brain drain rose sharply in the early 2000s, reaching a level of roughly twice the worldwide mean. Bosnia and Herzegovina shows steadily rising and above-average values for medical brain drain.
Figure SII.6: Proportion of Physicians Trained in the Country and Working Abroad: sEE6 Countries, 1991–2004
percent
1.5
1.0
0.5
0
1991 1993 1995 1997 1999 2001 20032004
▬ World ave. ▬ ALB ▬ BIH ▬ MKD ▬ SRB/MNE
Source: Docquier and Bhargava (2007).
III. sPOTLIGHTs | 57
COPING WITH FLOODS, STRENGTHENING GROWTH

Emigrants’ Occupation
Between 28 and 45 percent of high-skilled emigrants to OECD countries work in unskilled or blue-collar occupations. In Albania, skill-mismatches among emigrants appear to be particularly large. One quarter of tertiary educated emigrants works in blue-collar occupations, another 20 percent in unskilled occupations. On the other side of the spectrum, more than 50 percent of Serbian emigrants with tertiary education work in white-collar and 20 percent in pink-collar occupations.34
Impact on demographic structure in sending countries...The population is already shrinking in Bosnia, Albania and Serbia. Between 2005 and 2010, low or negative values of natural population growth (crude birth rates minus
34 Numbers based on OECD DIOC (2005/06) dataset. The translation of the ISCO-88 occupation codes into White-, Pink-, Blue-collar and Unskilled occupations is based on OECD (2002).
crude death rates) and negative net immigration rates caused the population to decline in Bosnia, Albania and Serbia. Only in Montenegro and FYR Macedonia was the natural increase high enough to compensate for emigration (Figure SII.7 and Figure SII.8).
The population is expected to shrink in all SEE6 countries. According to the UN Population Prospects (2012) population in the region is expected to decline further in the future. Albania, where birth rates are assumed to remain at a relatively high level and natural change is expected to turn negative only in 2040, is the only country in the region where population is projected to rise until 2035. The underlying assumptions are a decreasing natural change, and a slow-down of emigration.
Figure SII.7: Population change due to natural increase and net migration, 2005–10
Figure SII.8: Expected population change due to natural increase and net migration, 2025–30
countries sorted by population change countries sorted by population change
-10 -5 0 5 10
SRB
MNE
MKD
BIH
ALB
-10 -5 0 5 10
SRB
ALB
MNE
MKD
BIH
change in population, per 1,000s change in population, per 1,000s
J Natural increase J Net migration rate J Natural increase J Net migration rate
Source: UN World Population Prospects (2012). Source: UN World Population Prospects (2012).
SOUTH EAST EUROPE REGULAR ECONOMIC REPORT NO.7
58 | III. sPOTLIGHTs

…and if migrants returned to SEE6?
Return migration to SEE6 countries would increase the working age population and some countries would benefit from a skills boost. Figures SII.9 and SII.10 show for Albania and Serbia what would happen to the demographic structure of the population in the source countries if emigrants to OECD economies returned to their respective home countries. Assuming that an individual’s education decision is independent of the subsequent migration decision, the graphs illustrate the population structure by gender, broad age group and education, under the hypothetical assumption of no emigration in the past decades. Both countries appear to have lost more men to emigration than females, and the men who emigrated tend be better educated than females. The Albanian population would be considerably higher in
the absence of migration and a large share of well-educated individuals would enlarge the working age population bringing with them their human capital. For Serbia, the impact of the hypothetical situation of returning emigrants would have a smaller effect.
Figure SII.9: Male (left part) and female (right part) population by age group: source country and emigrants to OECD, Albania 2005
Figure SII.10: Male (left part) and female (right part) population by age group: source country and emigrants to OECD, serbia 2005
age age
1,200 0 1,200
15–24
65+
25–64
800 400 800400 3,000 0 3,000
15–24
65+
25–64
2,000 1,000 2,0001,000
population in 1,000s population in 1,000s
Albania: J Primary J Secondary J Tertiary Serbia: J Primary J Secondary J Tertiary
Emigrants: J Primary J Secondary J Tertiary Emigrants: J Primary J Secondary J Tertiary
Source: OECD DIOC 2005/06 database; age distribution and education of source country population: Barro and Lee (2013) database.
Source: OECD DIOC 2005/06 database; age distribution and education of source country population: Barro and Lee (2013) database.
III. sPOTLIGHTs | 59
COPING WITH FLOODS, STRENGTHENING GROWTH


Annex: Macroeconomic Indicators
Table AI.1: sEE6: select Economic Indicators and Projections, 2012–142013 2014e 2015f
Real GDP growth (percent)
Albania 1.4 2.1 3.0
Bosnia and Herzegovina 2.5 0.4 1.5
Kosovo 3.4 2.5 3.0
Macedonia, FYR 2.7 3.3 3.5
Montenegro 3.3 1.5 3.4
Serbia 2.6 -2.0 -0.5
SEE6 2.5 0.2 1.3
Fiscal deficit (percentage of GDP)
Albania 4.9 5.7 4.8
Bosnia and Herzegovina 1.9 4.5 2.7
Kosovo 2.9 2.3 2.0
Macedonia, FYR 3.9 3.9 3.4
Montenegro 3.3 0.7 5.3
Serbia 5.6 7.9 5.6
SEE6 3.8 4.2 4.0
Public debt with guarantees (percent of GDP)
Albania 70.0 70.9 70.6
Bosnia and Herzegovina 46.9 50.2 43.8
Kosovo 9.3 10.8 11.5
Macedonia, FYR 40.5 46.6 49.4
Montenegro 67.5 66.5 72.7
Serbia 61.4 68.6 75.4
SEE6 49.3 52.3 53.9
Consumer price inflation (percent, period average)
Albania 1.9 2.1 3.0
Bosnia and Herzegovina -0.1 -1.0 1.5
Kosovo 1.8 0.6 1.1
Macedonia, FYR 2.8 0.3 1.1
Montenegro 2.2 -0.2 2.0
Serbia 7.7 2.1 2.7
SEE6 4.2 1.1 2.2
ANNEx | 63
COPING WITH FLOODS, STRENGTHENING GROWTH

Table AI.1: sEE6: select Economic Indicators and Projections, 2012–142013 2014e 2015f
Unemployment rate (percent)
Albania 17.1 17.2 16.5
Bosnia and Herzegovina 27.5 27.5 27.0
Kosovo 30.0
Macedonia, FYR 29.0 27.9
Montenegro 19.5 19.4 18.9
Serbia 22.1 19.6 19.0
SEE6 23.5
Current account deficit (percent of GDP)
Albania 10.6 13.9 11.8
Bosnia and Herzegovina 5.4 9.7 8.6
Kosovo 6.4 8.6 6.8
Macedonia, FYR 1.8 1.0 4.0
Montenegro 14.6 15.3 16.3
Serbia 6.1 6.1 4.7
SEE6 6.5 7.8 7.0
External debt (percent of GDP)
Albania 34.3 36.7 42.0
Bosnia and Herzegovina 50.8 54.6 54.2
Kosovo 6.5 7.0 6.0
Macedonia, FYR 64.0 71.3 70.4
Montenegro 119.8 114.7 127.4
Serbia 78.3 77.0 75.0
SEE6 59.0 60.2 62.5
Source: National statistical offices, Ministries of Finance, Central Banks and World Bank projections.
SOUTH EAST EUROPE REGULAR ECONOMIC REPORT NO.7
64 | ANNEx

Figure AI.1: Real GDP: Percentage Change since Pre-Crisis Peak
percent change, 2008–14 real GDP index, 2002=100
-5 50 1510 20 25
SRB
ALB
MNE
MKD
BIH
KOS
BGR, HRV, ROM
Rest of EU11
EU15
SEE6
2002 2004 2006 2008 2010 2012 2014
100
170
160
150
140
130
120
110
▬ ALB ▬ KOS ▬ MNE ▬ MKD ▬ BIH ▬ SRB
Source: World Bank staff calculations and estimates based on national statistical offices.
Figure AI.2: Real GDP Growth Projections for 2015
percent percent
-1.0 0-0.5 1.00.5 1.5 4.0
SRB
ALB
MNE
MKD
BIH
KOS
BGR, HRV, ROM
Rest of EU11
EU15
SEE6
3.53.02.0 2.5 2003 2005 2007 2009 2011 2013 2015
-7.5
-5.0
12.5
10.0
7.5
5.0
2.5
0
-2.5
▬ MKD ▬ KOS ▬ MNE ▬ ALB ▬ BIH ▬ SRB
Source: World Bank staff calculations and estimates based on national statistical offices.
ANNEx | 65
COPING WITH FLOODS, STRENGTHENING GROWTH

Figure AI.3: Unemployment Rate
Q2 2014, percent of labor force percent of labor force
0 105 2015 25 35
SRB
ALB
MNE
MKD
BIH
SEE5
30
10
40
35
30
25
20
15
Q2
-08
Q4
-08
Q2
-09
Q2
-10
Q2
-11
Q2
-12
Q2
-13
Q2
-14
Q4
-09
Q4
-10
Q4
-11
Q4
-12
Q4
-13
▬ MKD ▬ BIH ▬ SRB ▬ MNE ▬ ALB
Source: World Bank staff calculations based on national statistical offices.
Figure AI.4: Fiscal Balance
estimated fiscal deficit in 2014, percent of GDP percent of GDP
0 32 54 6 8
SRB
ALB
MNE
MKD
BIH
SEE6
7
KOS
1
-7.5
10.0
7.5
5.0
2.5
0
-5.0
-2.5
2003 2005 2007 2009 2011 2013 2014
▬ SRB ▬ ALB ▬ BIH ▬ MKD ▬ KOS ▬ MNE
Source: World Bank staff estimates and Ministries of Finance.
SOUTH EAST EUROPE REGULAR ECONOMIC REPORT NO.7
66 | ANNEx

Figure AI.5: Public Debt
estimated public debt and guarantees in 2014, percent of GDP percent of GDP
0 3020 5040 60 80
SRB
ALB
MNE
MKD
BIH
SEE6
70
KOS
10 2003 2005 2007 2009 2011 2013 2014
0
80
70
60
50
40
30
20
10
▬ ALB ▬ SRB ▬ MNE ▬ BIH ▬ MKD ▬ KOS
Source: World Bank staff estimates and Ministries of Finance.
Figure AI.6: Export Growth
Q3–Q4 export growth in 2014, percent percent
0 1510 20 30
SRB
ALB
MNE
MKD
BIH
SEE6
25
KOS
5 2006 2007 2008 2009 2011 2013 2014
-40
50
40
30
20
10
0
-10
-20
-30
2010 2012
▬ MKD ▬ ALB ▬ KOS ▬ BIH ▬ MNE ▬ SRB
Source: World Bank staff estimates and Central banks.
ANNEx | 67
COPING WITH FLOODS, STRENGTHENING GROWTH

Figure AI.7: Import Growth
Q3–Q4 import growth in 2014, percent percent
-5.0 2.50 5.0 10
SRB
ALB
MNE
MKD
BIH
SEE6
7.5
KOS
-2.5 2006 2007 2008 2009 2011 2013 2014
-30
60
40
30
20
10
0
-10
-20
2010 2012
50
▬ SRB ▬ MNE ▬ MKD ▬ BIH ▬ ALB ▬ KOS
Source: World Bank staff estimates and Central banks.
Figure AI.8: Current Account Balance
2014, percent of GDP percent of GDP
-20 -5-10 0
SRB
ALB
MNE
MKD
BIH
SEE6
KOS
-15 2003 2005 2007 2009 2011 2013 2014
-60
20
10
0
-10
-20
-30
-40
-50
▬ MKD ▬ BIH ▬ KOS ▬ SRB ▬ ALB ▬ MNE
Source: World Bank staff calculations and estimates, Central banks.
SOUTH EAST EUROPE REGULAR ECONOMIC REPORT NO.7
68 | ANNEx

Figure AI.9: Non-Performing Loans
Q2 2014, percent of gross loans percent of total loans
SRB
ALB
MNE
MKD
BIH
SEE6
KOS
0 1510 20 255 2003 2005 2007 2009 2011 Q2-2014
25
20
15
10
5
0
▬ ALB ▬ SRB ▬ MNE ▬ BIH ▬ MKD ▬ KOS
Source: World Bank staff calculations and Central banks.
Figure AI.10: Ease of Doing Business
2015, proximity to frontier (best practice=100) proximity to frontier (best practice=100)
SRB
ALB
MNE
MKD
BIH
SEE6
KOS
40 60 6550 55 70 75 8045 2010 2011 2012 2013 2014 2015
80
75
70
65
60
50
55
▬ MKD ▬ MNE ▬ KOS ▬ SRB ▬ ALB ▬ BIH
Source: World Bank Doing Business Indicators (2015).
ANNEx | 69
COPING WITH FLOODS, STRENGTHENING GROWTH


View this report online:www.worldbank.org/eca/seerer
SOUTH EAST EUROPE Regular Economic Report
January 2015
No. 7
Coping with Floods,Strengthening Growth
South E
ast Europe R
egular Econom
ic Report
No.7
January 2015
BOSNIA AND HERZEGOVINA SERBIA
KOSOVOMONTENEGRO
FYR MACEDONIA
ALBANIA


