Copenhagen Business School - CBS Research Portal
95
Master Thesis 17.05.2016 Do Indian advanced market acquisitions from service and manufacturing firms create shareholder value? Author: Tim Niklas Palm MSc. Economics and Business Administration in International Business Copenhagen Business School STU incl. tables & figures: 170.827, pages 75 Supervisor: Aradhna Aggarwal Department of International Economics and Management Copenhagen Business School Copenhagen Business School
Transcript of Copenhagen Business School - CBS Research Portal

Master Thesis
17.05.2016
Do Indian advanced market acquisitions from service and manufacturing firms create shareholder
value?
Author: Tim Niklas Palm
MSc. Economics and Business Administration in International Business
Copenhagen Business School
STU incl. tables & figures: 170.827, pages 75
Supervisor: Aradhna Aggarwal
Department of International Economics and Management
Copenhagen Business School
Copenhagen Business School
1
Abstract
The liberalization in the 1990s and the resulting increased FDI activity allowed India to become
the world’s fastest growing major economy in 2016. However, India’s emergence as a source of
foreign direct investment outflows is impressive for its level of development. The sources are
Indian firms that increasingly acquire firms in OECD countries and therefore leapfrog the
conventional growth cycle. In this context, the understanding whether or why this inorganic mode
of expansion creates value for the acquiring firms and the country as a whole is limited.
This thesis argues that advanced market acquisitions allow to internalize resources that are time
consuming in developing and also difficult to trade through transactions. Thus, they constitute a
strategic path to value creation for the acquiring firm. Advanced product and factor markets and
a developed institutional environment ensure a high quality of the resource and therefore allow
for high synergies for firms from resource poor developing countries. In essence, service and
manufacturing firms are driving these outward flows from India. I argue that domestically demand
serving manufacturing firms create more value than export oriented service firms as they entered
the global market on a later stage and have a larger potential to upgrade their capabilities.
Subsequently, I suggest that firm motivations have an effect on these performance outcomes.
Asset-seeking firms that acquire advanced market firms allow for stronger complementariness to
the existing capabilities than market expanding or diversifying firms which are more mature in
terms of technology. Additionally, vertical integrating firms may allow for higher synergies due
to the creation of a global value chain network.
An event study of 72 advanced market acquisitions by listed Indian service and manufacturing
firms during the period of 2010 to 2015 support these predictions. The event study is carried out
using cumulative abnormal returns from different event windows surrounding the day of
announcement (0), (-3,+3), and (-5,+5). The results draw conclusive inference about the
efficiency of the Indian stock market but also indicate that the event window needs to be
lengthened in order to capture the whole momentum of an acquisition announcement in the
market.
This thesis contributes to the growing stream of research on the determinants of successful
acquisitions by emerging economy firms and proofs as a side note that resource dependent
explanations are also applicable to the emerging market context.

2
Preface
This thesis finishes my Master’s degree in International Business at Copenhagen Business School.
An exchange at the Indian Institute of Management Calcutta raised my interest for the researched
topic. CBS deserves my gratitude for allowing me to tackle this challenging area of research.
The process has been both challenging and educational. Collecting the necessary data from
Zephyr, Bloomberg, Yahoo finance and ThompsonOne Banker and applying the statistical
programs Excel and STATA turned out to be a very time consuming and demanding process.
However, the process has above all been rewarding and highly educational. It has been performed
with great devotion throughout the semester.
It is with great gratitude that I acknowledge my supervisor Professor Aradhna Aggarwal for her
guidance, good feedback and support throughout this study.

3
ABSTRACT ................................................................................................................................................ 1
PREFACE ................................................................................................................................................... 2
LIST OF ABBREVIATIONS .................................................................................................................... 5
LIST OF FIGURES .................................................................................................................................... 5
LIST OF TABLES ...................................................................................................................................... 5
1. INTRODUCTION ............................................................................................................................. 6
1.1 OVERALL CONTEXT ..................................................................................................................... 6 1.2 PROBLEM SPECIFICATION ............................................................................................................ 8 1.3 PURPOSE .................................................................................................................................... 10 1.4 DELIMITATION OF THE RESEARCH AREA .................................................................................... 11 1.5 STRUCTURE ............................................................................................................................... 12
2. INDIAN OFDI BACKGROUND ................................................................................................... 13
2.1 IDP AND THE INDIAN FDI FLOWS .............................................................................................. 13 2.2 INDIAN OVERSEA ACQUISITIONS AND THE INSTITUTIONAL CONTEXT ......................................... 17
3. LITERATURE REVIEW AND HYPOTHESIS DEVELOPMENT ........................................... 19
3.1 LITERATURE REVIEW ................................................................................................................. 19 3.2 ADVANCED MARKET HYPOTHESIS.............................................................................................. 21 3.3 INDUSTRY SECTOR HYPOTHESES ................................................................................................ 23 3.4 M&A FIRM MOTIVES HYPOTHESES ............................................................................................ 27
3.4.1 Non-Value creating strategies .......................................................................................... 28 3.4.2 Value creating strategies .................................................................................................. 29 3.4.3 Acquisition motives in the Indian context ......................................................................... 30 3.4.4 Motivation classification .................................................................................................. 31 3.4.5 Hypotheses about firm motivation .................................................................................... 36
3.5 EFFICIENT MARKET HYPOTHESIS................................................................................................ 40 3.5.1 Introduction to the efficient market hypothesis ................................................................ 40 3.5.2 Efficient market hypothesis and event studies .................................................................. 42
4 METHODOLOGY .......................................................................................................................... 44
4.1 RESEARCH DESIGN .................................................................................................................... 44 4.2 DATA COLLECTION .................................................................................................................... 48 4.3 EVENT STUDY METHODOLOGY................................................................................................... 50 4.4 FORMULAS OF THE EVENT STUDY .............................................................................................. 52 4.5 STATISTICAL TESTS .................................................................................................................... 54
5 EMPIRICAL FINDINGS ............................................................................................................... 56
5.1 ADVANCED MARKET HYPOTHESIS.............................................................................................. 56 5.2 INDUSTRY TYPE HYPOTHESES .................................................................................................... 60 5.3 MOTIVATION OF FIRMS HYPOTHESES ......................................................................................... 62
6 CONCLUDING REMARKS .......................................................................................................... 67
6.1 DISCUSSION AND THEORETICAL IMPLICATIONS ......................................................................... 67 6.2 LIMITATIONS AND FUTURE RESEARCH ...................................................................................... 73 6.3 CONCLUSION ............................................................................................................................. 75
REFERENCE LIST ................................................................................................................................. 78
APPENDIX I ............................................................................................................................................. 86
APPENDIX II ........................................................................................................................................... 88

4
APPENDIX III .......................................................................................................................................... 90
APPENDIX IV .......................................................................................................................................... 91
APPENDIX V ........................................................................................................................................... 94
5
List of Abbreviations
Abbreviation
AAR
CAR
DoA
EMH
FDI
IFDI
IPR
MNE
OFDI
OLI
Description
Average abnormal return
Cumulative abnormal return
Day of announcement
Efficient market hypothesis
Foreign direct investment
Inward foreign direct investment
intellectual property rights
Multinational enterprise
Outward foreign direct investment
Ownership, location, internalization
List of Figures Figure 1 FDI outward and inward flows and stock 16 Figure 2 Different stock market reactions to new information 42 Figure 3 Number of acquisitions per OECD country 50 Figure 4 Event study: estimation and event window 51 Figure 6 CAR 7-day event window advanced market acquisitions 58 Figure 7 CAR 11-day event window advanced market acquisitions 58 Figure 8 AAR 11-day window advanced market acquisitions 60 Figure 9 CAR firm motivation 64 Figure 10 AAR firm motivation 65
List of Tables Table 1 Evolution of Indian enterprises ..................................................................................................... 15 Table 2 Diversifying acquisitions ............................................................................................................... 33 Table 3 Asset/Technological seeking acquisitions ..................................................................................... 34 Table 4 Market expanding acquisitions ..................................................................................................... 35 Table 5 Vertical acquisitions ...................................................................................................................... 36 Table 6 Data collection results .................................................................................................................. 49 Table 7 Day of Announcement Advanced market acquisitions .................................................................. 56 Table 8 7-day event window advanced market acquisitions ...................................................................... 57 Table 9 11-day event window advanced market acquisition ...................................................................... 57 Table 10 Overview skewness table ............................................................................................................. 59 Table 11 Significance test across event windows for Manufacturing firms ............................................... 61 Table 12 Significance test across event windows for Service firms ........................................................... 61 Table 13 11-day event window comparison Manufacturing and Service firms.......................................... 62 Table 14 Day of Announcement firm motivations ...................................................................................... 63 Table 15 7-day event window firm motivations .......................................................................................... 63 Table 16 CAR 11-day window firm motivation .......................................................................................... 64
6
1. Introduction
1.1 Overall context
Globalization has led to a liberalization of trade policies and a removal of trade barriers across
the globe. Transaction costs decreased and the world witnessed a surge in economic activities
which resulted in increasing FDI. India, as an emerging economy has long time been standing at
the receiving end in terms of FDI. Soon after the liberalization of the economy in the 1990s a
reversal of investment flows could be observed and Indian firms were no longer limited to the
domestic environment.
It is suggested that the approach of Indian firms towards outward foreign direct investment has
changed over time. Primarily, Indian firms’ strategic rationale was cost reduction, operational
synergies and short-term goals by greenfield, joint-venture or acquisitions in less developed
countries. Nowadays, firms have a long-term strategic focus to obtain new technologies, brands,
and consumers by acquisitions. These acquisitions are the prevalent form of OFDI (Gregory &
McCorriston, 2005; Lawrence et al., 2010). India’s trend is notable given the lack of propensity
for firms based in other Asian countries such as Taiwan, South Korea, Japan and China, to use
acquisition as a mode of FDI, as compared to other modes, such as export, greenfield or joint
venture (Buckley et al., 2007).
While firms from these countries follow a market-seeking approach, it is suggested that Indian
firms follow an asset-seeking approach nowadays (Kumar, 2008). In fact, acquisitions allow to
leapfrog conventional growth cycles and provide easy and quick access to technology, knowledge
and customers in advanced markets. Unlike other transition economies, India is not burdened by
a legacy of strong governmental participation. Accordingly, the strategies of Indian firms are
likely to be growth and profit oriented and more comparable to those firms operating in mature
markets (Delios, Gaur & Kamal, 2009).
The motivation for writing this paper is multilayered. The fact that India has overtaken China as
world's fastest growing major economy, the large population base and the position India is taking
in the world economy makes it important to understand the growth strategies of these firms (Chan,
2015). From a macro-level perspective, the outcome of this study has severe economic
implications for a resource poor developing country like India. Firms that are investing abroad
are faced with serious degrees of risk diversion. The question arises whether advanced market
acquisitions stimulate or crowd out domestic investment. Advanced market acquisitions are
threatening the availability of scarce financial resources at home by allocating them abroad and
7
could potentially shift production activities to the target country. Thus, a value creating outcome
has severe implications for the Indian policy in promoting these acquisitions to sustain economic
growth (Dasgupta, 2015).
Upmarket strategies have specifically gained attention of the International business literature in
divulging and exploring the antecedents. However, research on performance of this specific type
of acquisition has been neglected. Intentionally, this thesis fills several literature gaps and
validates previous findings. Firstly, the efficiency of the Indian stock market is implicitly tested
with the event study approach. The purpose is to proof that advanced market acquisitions show a
significant short-term performance reaction to the announcement of an acquisition and therefore
also proof that the EMH holds in the Indian stock market. Secondly, I shed light on the
inconsistent findings in the literature whether advanced market acquisitions from emerging
market firms create value or not. Thirdly, I investigate if there are any sectoral differences of
service and manufacturing firms on the obtained performance outcomes as I suggest that Industry
type does play a moderating role in the Indian context. Lastly, I focus on the link between
announced M&A motivation and the successive performance. By intention, the different
motivation have a significant impact on the performance outcomes.
While the first two literature gaps need to be validated from earlier findings, the last two
mentioned literature gaps have not been researched yet. Therefore, the application of event study
methodology in order to tackle these gaps represents a unique feature in the literature.
I apply traditional resource based models in order to explain the reasons for competitive advantage
for Indian firms. Research on resource dependent explanations are based on analyses from
developed countries and it is therefore of interest if there are also applicable to an emerging market
like India. Indian acquisitions might be accompanied by different shareholder expectations or
management perspectives than developed country ones. In this regard, this study contributes to
the growing stream of research on determinants for value creating acquisitions by emerging
economy firms. However, the thesis takes a cautious approach towards hypothesis building.
The topic is of relevance for managers and investors in regards to the value creating effect of the
strategic motivation for the advanced market acquisition. Besides, insights to the efficiency of the
Indian stock market and the event study approach are also provided which further enriches the
International Business and Finance literature.
8
1.2 Problem Specification
While there is a large body of research about antecedents of internationalization of emerging
market firms that are investing in advanced markets, little has been written about they
performance in the overall context. Moreover, research has already been conducted on exports
and strategic alliances for emerging-economy firms, acquisitions by contrast are relatively
understudied (De Beule & Sels, 2016).
The few former existing studies on the oversea acquisition performance lack comprehensiveness
(De Beule & Sels, 2016; Gubbi et al., 2010). Firms with different backgrounds could have
different motivations to acquire overseas and no study has ever identified if there is any relation
in terms of industry background or motivation to performance. This thesis is attempting to fill
these gaps.
To incorporate the discussed ideas into a more exact language three research questions are
developed. According to Booth, Colomb and Williams (2003) one must consider at least three
elements in formulating a research question:
1. relation of the question to the topic,
2. the question/problem that needs to be answered/solved,
3. the significance of the research question for others/society.
Thus, this thesis addresses the following research questions:
Does an advanced market acquisition of an Indian firm create positive shareholder value?
Are there any sectoral differences in the performance outcomes?
Is the firm motivation affecting these outcomes?
The relation to the topic can be split into three parts: The advanced market acquisition, the
industrial background and the firm motivation in regards to the reaction of abnormal returns to
the announcement of an acquisition. All three parts are strongly linked to the main topic and
therefore fulfill the first element.
Secondly, the research question specifically needs to be answered and solved. Therefore, several
hypotheses are proposed and the methodology of the event study is applied in order to answer the
addressed questions. The second research questions points specifically at the difference in
between firms from the service and the manufacturing sector. During the course of the research
four different firm motivations are identified in order to address the third research question,
9
namely: Asset/Technology seeking firms, Market expanding firms, Diversifying firms and
Vertical acquiring firms.
The third step includes the overall significance for the society. The above addresses research
question should be considered as relevant for several readers, since it intuitively states several
hypotheses. Instinctively it addresses therefore foremost analysts, shareholders, managers, policy
makers and academics.
Shareholders can get valuable insights on which trading strategy to use, when the company
announces an oversea acquisition. The expected effect on the share price can potentially be
derived from the outcome of this study and thus the shareholder can trade accordingly. Since the
shareholder is owning a stock, he has a strong economic interest in estimating the effect of the
event correctly.
Similarly, the analyst can use the results in providing stock recommendations to his clients. Based
on the result of this study he could for instance recommend to buy shares of a firm that is
expanding in OECD countries if the stock reacts positively. If he would not recommend buying
the stock, he would otherwise be criticized.
The manager can use the results of the study in order to forecast the results of the decisions that
have been taken place and can adjust his rational behavior accordingly, since managers have a
different agenda than for instance stakeholders. In chapter three the reader will be provided with
reasons why managerial behavior oftentimes lead to non-value creating strategies. This study
therefore provides insights to him on what his action might result in. Thus, it contributes to the
learning curve of Indian multinationals.
Academics and the general international business literature benefit from the unique combination
of an event study on advanced market acquisitions with recent data. The combination with these
different purposes has not been developed previously in the literature.
Policy makers in India get insights about the importance of international exposure and experience
in generating value for the economy in general. Hence, new laws and a liberalized economy could
follow after obtaining a positive value effect. Overseas acquiring firms can be incentivized by
going abroad and thereby bring home high taxable income that benefit India as a whole.
10
1.3 Purpose
The phenomena of rising OFDI by acquisitions from emerging economies has important empirical
and theoretical implications. Therefore, the International Business literature has foremost focused
on the motives and determinants of cross-border merger and acquisition (Buckley et al., 2007;
Gammeltoft, 2008; Kalotay, 2008; Mathews, 2006; Rugman, 2008; Sauvant, 2005) and tried to
shed light on how existing theory can explain their internationalization. The outcome is that
existing theory needs to be extended and adjusted to the special characteristics of an emerging
market, since results were oftentimes inconclusive (Stucci, 2013).
While the volume of cross-border acquisition literature has increased by the time with various
findings that encompass international business strategy and finance, the literature lacks theoretical
integration and consistency. The reasoning and empirical findings for advanced market
acquisitions from developing countries remains fragmented and not synthesized (Du & Boateng,
2012). This thesis is reviewing studies that are existing on M&A performance in order to create
knowledge. Existing empirical evidence will serve as a source of comparison when the hypotheses
are investigated.
In his road map, Eisenhardt (1989) emphasized that the combination of quantitative and
qualitative data in emerging market is particularly useful in yielding relevant, novel and reliable
insights. Based on this, Macpherson and Jones (2010) suggested that the consolidation of
literature provides a basis to build theory in the area of interest, the thesis reviews past research
and builds its theoretical model and hypotheses on this approach. Thereby the review will reveal
the notable contributions of emerging economy firms and strengthens the understanding of the
performance of emerging market firm’s investment. The identified key issues in the extant
literature contribute to the development of hypotheses. The developed hypotheses are tested
around the efficient market hypothesis at a semi-strong degree, which is key for any event study
on financial data regardless of the event component. Finally, the outcomes of the regression
analysis of the event study allow us to assess on future research at the end of this thesis.
It is noteworthy to mention that this study takes a cautious approach towards the theoretical
development, since many papers in the existing literature adopted theories and models from the
west and put them into the Indian context. The sample is purposefully chosen in order to solve
the addressed research questions and will be further elaborated and justified in the methodology
in chapter 4.
11
1.4 Delimitation of the research area
India as a case country has been purposefully chosen especially because it provides many
challenges that are not tackled yet. As many other empirical research about India suffers from
limitations, this thesis does not compose an exception. When testing for market efficiency of the
India stock market, the restriction to a subset of the market as a whole emerged. The sample is
limited in investigating Indian firms in order to address the research questions. Firms that are
listed on the S&P BSE500 are only considered and those firms are dependent on the estimates
within this stock market. In total 72 mergers have been yielded after applying several restrictions
such as time period, acquisitions type or industry type which will later be mentioned in the
methodology part and therefore do not represent the whole market. The time period is chosen
from 2010 to 2015 as the author wants to describe the most recent developments for Indian
advanced market transactions.
Another limitation of the study is that the included event is only about abnormal returns, causing
the test for market efficiency to only account for this event. There are surely also other methods
to measure the impact of an advanced market acquisitions such as looking on the return on assets
or operating cash flow, yet they are not found to be valid across all contexts (Ray, 2009). I only
consider the short-term reaction to acquisition announcements since they are supposedly very
predictive, unbiased and less influential by other factors than long-term observations (Gubbi et
al., 2010).
Even though many financial and non-financial factors come into play in the value creation from
a transaction, this thesis is based on the neo-classical economic theory. Hence, the aim is solely
focussing on the measurement of potential synergies between merging companies. Apart from
that also behavioural or agency driven motives could play a role in influencing the shareholder
value. These motivations are presented in the firm motivation part in chapter 3.
Finally, this thesis is delimited to an in-depth mathematical focus in quantitative testing. The tests
which have been used in this study will be described at a later stage in this study but they will not
be statistically derived as this would be out of the scope of this work.
12
1.5 Structure
The purpose of the research is provided early in the study to facilitate a better comprehension of
the hypotheses. The remainder of this paper is developed through five chapters and is structured
as follows.
Section 2 provides the reader with background information about the Indian development path in
which acquisitions play a major role following the liberalization of the economy. The part is key
for the understanding of the Indian business environment and the increased FDI activities which
lead to a boost in the Indian economy nowadays. Further, light will be shed on the oversea
acquisitions in explaining their importance for the development of the Indian economy.
The third section starts with reviewing the sparse literature of advanced market acquisitions from
emerging markets and emphasizes the large research gaps that need to be filled. Based on previous
literature and the afore mentioned theories in section 2, the advanced market hypothesis is
developed. Subsequently, I discuss whether service or manufacturing firms perform better on the
stock market and propose two hypotheses with regards to this. The core of this paper relies in the
identification of firm motivations of advanced market acquiring firms. Hence, I develop
hypotheses around the four identified key motivations of firms and try to identify whether one
feature was driving the acquisition performance or not. Further, the theory of the applied event
study methodology is presented.
The fourth section deals with the methodological approach of this paper. The research design and
approach are explained in detail. Subsequently, the event study methodology is presented. In this
study, different formulas regarding the event study and the tests are applied therefore they are
elaborated and presented in this part and the Appendix I.
The next chapter is presenting the results which have been obtained from the regressions, tables,
graphs and tests. This part is of descriptive nature.
The final part deals with the explanations of the empirical findings and provides recommendations
about future research and deals with the shortcomings of this work. The overall outcome of this
paper is summarized in the conclusion part.
13
2. Indian OFDI background
In order to put the addressed topic into context a sound understanding of the Indian FDI
background becomes vital. India strikes with an unusual development path in terms of FDI as an
emerging economy therefore the reader is provided with solid background knowledge.
2.1 IDP and the Indian FDI flows
Emerging markets are in general characterized by a weak institutional environment, low cost
levels, low average incomes and low market efficiency (Fisman & Khanna, 2004; Hoskisson et
al., 2000; Xu & Meyer, 2012). Oftentimes the state still plays a major role in several sectors and
the society is experiencing high population growth and urbanization (Dymsza, 1984). Besides
that, infrastructural and institutional voids, corruption and internal divides lead to a high level of
business risk and hinder development (Khanna & Palepu, 1997).
Those characteristics are also applicable to India. Another feature India shares with emerging
markets, is the relative late internationalization stage of firms in a globalized world in comparison
to the advanced market counterparts. Hence, companies and countries often still lack
internationalization experience (Ramamurti, 2009).
Generally, International business literature has found out that Indian firms expanded overseas in
three phases. The crucial turning point of these phases represents the second wave of oversea
investment in the Indian economy. It has been accompanied with major liberalization in the Indian
economy and started in the 1990s. This wave was not only on a bigger scale, but was also
characterized by about 70 percent of investments in advanced markets (Ramamurti, 2009).
The Indian development is specific since the country has been faced with low income per capita
in 2005 and 2006, while experiencing strong OFDI in relation to inward foreign direct investment
IFDI. This circumstance is contradicting against the investment development path (IDP)
sequence. IDP is a dynamic version of Dunning’s (1977) ownership, location and internalization
(OLI) framework. OLI is a basic theoretical framework proposed by John Dunning that explains
the incentives for multinational enterprises (MNE) to go overseas, MNEs location choices and
decision choice between FDI and its alternatives, such as international trade, licensing and
outsourcing. Dunning and Lundan, (2008) suggest that the eclectic paradigm attributes the level
and structure of a firm’s foreign value-adding activities according to four different conditions:
14
Ownership specific advantages are referring to the competitive advantage of the firm
that is engaging in foreign direct investment. The likelihood of engaging in foreign direct
investment increases the greater the competitive advantage to other firms in the market
is. These possessions are for instance intangible assets such as trademarks, production
techniques, entrepreneurial skills, and returns to scale.
Location advantages are referring to country specific advantages that allow for value
adding activities of multinational enterprises. The country that meets the interests of the
firm’s ownership-specific advantages experiences a competitive advantage. These
location advantages can occur in various forms such as raw material, low wages and
special taxes or tariffs.
Internalization advantages refer to preferring own production over engaging in a
partnership or joint-venture agreement. The extent to which ownership specific
advantages are kept within the firm rather than being sold.
OLI advantages are referring, given the previous three conditions satisfied, to the extent
the firm believes that foreign production fulfill the long-term objectives of its
stakeholders.
While the eclectic Paradigm provides a basic framework for determining the entry mode of
internationalization, IDP describes the dynamic relationship between FDI and economic
development. The theoretical notion is that IFDI and OFDI positions are related to different stages
of development for countries (Dunning & Lundan, 2008). When a country increases its GDP per
capita, the investment patterns experience a systematic change.
The first stage is characterized by the possession of natural resources and the country capitalizes
on this possession by having a competitive advantage. At this stage IFDI is very small and is
mainly focused on the primary sector where cheap labor costs contribute to a booming
manufacturing sector in which simple consumer goods are supplied. OFDI does not play a role,
since ownership specific advantages are non-existing and the net FDI position is negative.
In the second stage the country experiences growing investments in value added activity. Due to
an increasing growth rate and increased market demand, market-seeking and asset-seeking
investments are attracted in terms of IFDI. OFDI emerges, but still lags behind levels of IFDI
since international operational experience has been gained but remains less important. In total,
the country still has a negative net FDI position.
The third stage is characterized by almost maturity of the economy, being led by innovation driven
growth. IFDI is important for ownership specific assets in which the country has a comparative
15
disadvantage. As far as the foreign firm develops its ownership specific advantage, the emergence
of a growing trend in OFDI occurs. Moreover, firms also start to engage in strategic asset-seeking
and efficiency-seeking apart from resource and market seeking MNE investments (Dunning &
Lundan, 2008).
In the fourth stage, the country’s OFDI is exceeding the IFDI and is being characterized as a net
outward investor. Ownership specific advantages are on a level with those of developed countries.
First phase (pre-1990s) Second phase (1990s) Third phase (2000-)
Ownership
advantages
Adapted and scaled-
down technologies
Cost-effective
processes
Managerial expertise,
low-cost production,
engineering ability
Motivations Market-seeking Trade supporting Strategic asset and
natural resource seeking
Sectors Low technology, light
engineering
IT services,
pharmaceuticals
Metal, pharmaceuticals,
auto
Magnitudes Small Moderate Large
Entry modes Greenfield Greenfield Acquisitions and
greenfield
Destinations Asia and African low-
income countries
Similar to exports Strategic resource and
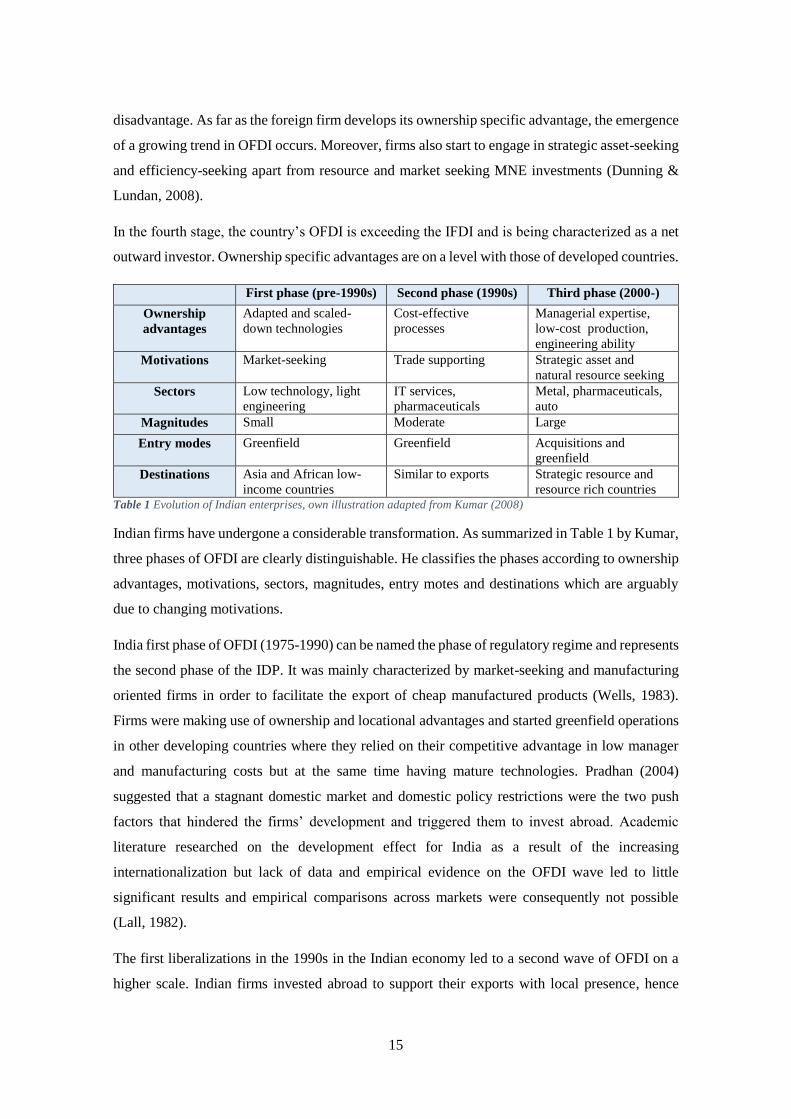
resource rich countries Table 1 Evolution of Indian enterprises, own illustration adapted from Kumar (2008)
Indian firms have undergone a considerable transformation. As summarized in Table 1 by Kumar,
three phases of OFDI are clearly distinguishable. He classifies the phases according to ownership
advantages, motivations, sectors, magnitudes, entry motes and destinations which are arguably
due to changing motivations.
India first phase of OFDI (1975-1990) can be named the phase of regulatory regime and represents
the second phase of the IDP. It was mainly characterized by market-seeking and manufacturing
oriented firms in order to facilitate the export of cheap manufactured products (Wells, 1983).
Firms were making use of ownership and locational advantages and started greenfield operations
in other developing countries where they relied on their competitive advantage in low manager
and manufacturing costs but at the same time having mature technologies. Pradhan (2004)
suggested that a stagnant domestic market and domestic policy restrictions were the two push
factors that hindered the firms’ development and triggered them to invest abroad. Academic
literature researched on the development effect for India as a result of the increasing
internationalization but lack of data and empirical evidence on the OFDI wave led to little
significant results and empirical comparisons across markets were consequently not possible
(Lall, 1982).
The first liberalizations in the 1990s in the Indian economy led to a second wave of OFDI on a
higher scale. Indian firms invested abroad to support their exports with local presence, hence
16
firms were concentrated in developed and developing countries where a market for Indian services
and products existed. However, according to Kumar (2008) India continued to maintain control
over most capital outflows out of prudential reasons. Thus, investments were mainly concentrated
in industries where Indian firms developed cost-effective processes as in IT software and
pharmaceuticals. Those industries served the global demand right from the start of the opening of
the economy. However, greenfield remained the preferred entry mode. This phase still refers to
second phase of the IDP sequence.
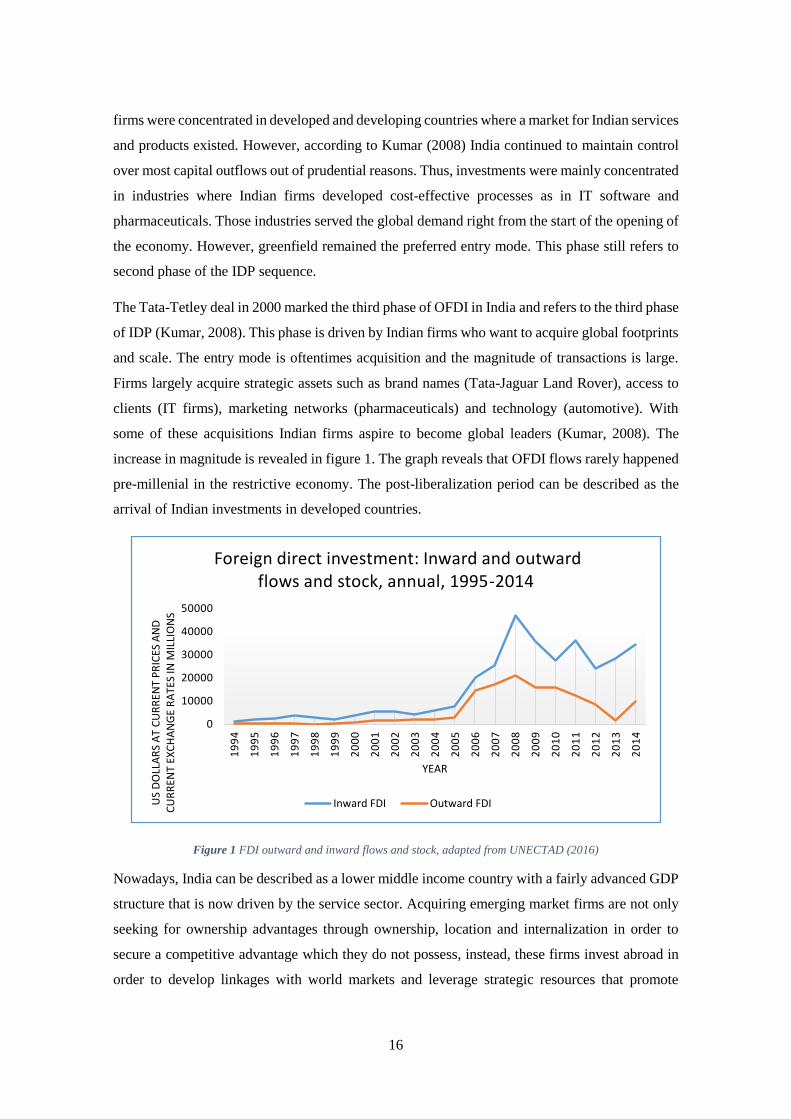
The Tata-Tetley deal in 2000 marked the third phase of OFDI in India and refers to the third phase
of IDP (Kumar, 2008). This phase is driven by Indian firms who want to acquire global footprints
and scale. The entry mode is oftentimes acquisition and the magnitude of transactions is large.
Firms largely acquire strategic assets such as brand names (Tata-Jaguar Land Rover), access to
clients (IT firms), marketing networks (pharmaceuticals) and technology (automotive). With
some of these acquisitions Indian firms aspire to become global leaders (Kumar, 2008). The
increase in magnitude is revealed in figure 1. The graph reveals that OFDI flows rarely happened
pre-millenial in the restrictive economy. The post-liberalization period can be described as the
arrival of Indian investments in developed countries.
Figure 1 FDI outward and inward flows and stock, adapted from UNECTAD (2016)
Nowadays, India can be described as a lower middle income country with a fairly advanced GDP
structure that is now driven by the service sector. Acquiring emerging market firms are not only
seeking for ownership advantages through ownership, location and internalization in order to
secure a competitive advantage which they do not possess, instead, these firms invest abroad in
order to develop linkages with world markets and leverage strategic resources that promote
0
10000
20000
30000
40000
50000
19
94
19
95
19
96
19
97
19
98
19
99
20
00
20
01
20
02
20
03
20
04
20
05
20
06
20
07
20
08
20
09
20
10
20
11
20
12
20
13
20
14
US
DO
LLA
RS
AT
CU
RR
ENT
PR
ICES
AN
D
CU
RR
ENT
EXC
HA
NG
E R
ATE
S IN
MIL
LIO
NS
YEAR
Foreign direct investment: Inward and outward flows and stock, annual, 1995-2014
Inward FDI Outward FDI
17
organizational learning (Mathews, 2006). In other words, Indian firms are using acquisitions not
to exploit their competitive advantage but to realize and augment potential competitive advantage.
To sum up, economic liberalization gave a massive stimulus to OFDI. As a result, some of the
stages of IDP have been skipped in India. Indian firms are anxious to escape the structures of
local markets and leapfrog the conventional growth cycle (Svetlicic, 2003).
2.2 Indian oversea acquisitions and the institutional context
Elaborating on the previously mentioned change of investment strategy of Indian firms, the
question arises why Indian firms mainly engage in overseas acquisitions nowadays.
Internationalization of emerging market firms differs a lot. More firms are internationalizing,
international acquisitions are more popular and destinations are more diverse. Moreover, firms in
the service sector emerged and asset-seeking investments became more important (Gammeltoft,
2008). Internationalization can take various forms such as export, licensing, franchising, strategic
alliances, joint ventures and wholly owned subsidiaries. The literature further splits wholly owned
subsidiaries into greenfield investments, which means establishing a wholly owned subsidiary on
new ground, and acquisitions. The latter is oftentimes also called brownfield investment and
involves acquiring an already established entity.
This thesis is dealing with acquisitions merely because they are driving India’s growth.
PricewaterhouseCoopers (2010) predicts that 2.200 Indian firms are likely to invest overseas until
2025. The number of those acquisitions is expected to rise above 90% of all acquisitions in the
upcoming years (Accenture, 2006). In the same context Indian firms will make a niche in high
value manufacturing sectors and business services (PricewaterhouseCoopers, 2010).
The traditional view on oversea acquisitions is the exploitation perspective, in which firms take
advantage of the rent-yielding ownership advantages in oversea markets. In contrast, recent
studies found out that oversea firms are triggered by gaining access and internalizing strategic
resources mainly in advanced markets. Shimizu et al. (2004) state that oversea acquisitions are
mainly used as a mode of entry, a dynamic learning process or a value creating strategy which
provide the firms with immediate access to new markets. Additionally, oversea acquisitions help
to overcome the liability of newness and foreignness.
In general, the key differentiator in between emerging market economies and advanced economies
is the institutional context. According to North (1990) formal rules, regulations and informal
norms and cultures which provide an operating framework for firms to work in represent the

18
institutional context. Specifically, the institutional context in emerging markets like India is
characterized by a lack of information intermediaries which should connect the buyer and the
seller in order to reduce information asymmetries. Consequently, the labour, product and financial
markets are not functioning as efficient as markets in developed economies. In addition, the
contract enforcement and regulatory regimes in emerging markets are also inefficient. Khanna
and Palepu (1997) refer to these phenomena as institutional voids.
Oliver (1997) and Peng (2003) claim that the institutional context in an economy has a significant
impact on the firm’s strategic choice. North (1990) emphasizes that it is necessary to understand
the institutional context of the firm’s particular embeddedness when discussing the firms’
strategic choices. Academic literature therefore discussed for instance India’s policy reforms in
the late 1990s and the effect on the firm’s strategic choices when the economy started to liberalize.
The outcome is that institutional constraints are much stronger in latecomer or transition
economies, especially because they are exposed to substantial influence of governments on the
firms’ strategic decisions (Deng, 2008).
Nowadays, government support has been a crucial factor in the successful internationalization of
Asian latecomer firms (Hoskisson et al., 2000). The government sets the environment for firms
to work in and can restrain or facilitate internationalization of firms through policy making.
Economic liberalization has ever since been considered as the driving force for growth. This is
proven by Zhang et al. (2011) who examine the influences of institutions on the likelihood of the
oversea merger and acquisitions completion rate with the outcome that home institutions have a
significant influence on this rate.
Adding up to this, frequent and large political and macro-economic shocks and instabilities in
emerging markets are the reasons for an increased exogenous uncertainty. Political and judicial
decisions may change overnight which results in an unexpected change of formal rules. Firms
deter in investing in places where external shocks cannot be foreseen. Thus, theories developed
in advanced economies are not fully applicable to an emerging market like India. Generally,
theoretical development in an emerging market is problematic. When crucial conceptual
differences between emerging and developed economies are not taken into account, the research
design may be miss-specified as it will be further discussed in the methodology part.
To sum it up, Indian firms use oversea acquisitions as a springboard to obtain the ownership
advantages they lack and benefit from better institutional protection which can be reflected in
better quality and protection of the acquired resource.
19
3. Literature Review and Hypothesis Development
3.1 Literature review
The short-term performance of acquiring firms has generally been extensively studied
empirically. This thesis is focusing predominantly on the impact on shareholder wealth of the
acquiring emerging-market firm that invests in advanced markets. Consequently, this literature
review has the main objective of reviewing the existent literature on this topic.
In general, there has been a number of studies that suggested that acquiring firms’ shareholder
wealth may decrease or increase (Andrade et .al, 2001; Berkovitch & Narayanan, 1993). Where
several studies have reported positive abnormal returns (Gubbi et al., 2010; Kohli & Mann, 2011),
many others also documented significant negative returns up to -5% for different sizes of event
windows (Beitel et al., 2004; Goergen and Renneboog, 2004). Generally, cross-border
acquisitions are not well-received and acquisitions in general do not create above abnormal
returns for the acquiring firms’ shareholders.
The hypothesized gains for advanced market acquisitions from emerging market firms are
actually challenged in a number of studies. In essence, authors emphasize the risk of liability of
foreignness or double-layered acculturation (Barkema, Bell, & Pennings, 1996; Eden & Miller,
2004). These risks hinder the realization of synergies and refer to the differences in the
institutional environments, business practices and customer tastes.
Accordingly, there are different suggestions about the implications of value enhancing
acquisitions. Moeller, Schlingemann, Stultz (2004) documented that small acquiring firms
experience significantly higher cumulative abnormal return than large firms. Subsequently,
different findings are also documented for the performance outcomes for domestic and oversea
acquisitions. Kale (2004) has conducted one of the first event studies in India using a sample of
698 acquisitions during the period of 1992 to 2002. He found out that acquired firms create
significantly more value than acquiring firms and multinational acquirers create greater value than
domestic ones. He concluded that multinational firms have greater and superior acquisition
experience and skills. In the early stages of internationalization firms have a tendency to
underestimate the complexities of an acquisition and are overconfident in obtaining synergies
from the target firm’s strategic assets. Thus, these firms need to develop the knowledge and
routines.
20
In a more recent study Kohli and Mann (2012) documented that cross-border acquisitions have
created significantly higher wealth gains than domestic ones in India for acquiring firm
shareholders. Further, they also reported that value creation has been significantly higher for
target firm shareholders in domestic acquisitions than in cross-border acquisitions.
To the best of my knowledge, in-depth research on the value creating effect of Indian advanced
market acquisitions on the shareholder wealth is non-existent. Previous Indian studies focused
merely on the question whether firms perform better domestically or overseas. The majority of
studies focused on developed financial markets. The results of cross-border acquisitions in
developed countries are not conclusive in the current literature.
Besides, many studies are industry specific or focused on very small sample sizes. Anand and
Singh (2008) focused for instance on the banking sector, whereas Rani, Yadav and Jain (2008)
investigated the pharmaceutical sector and results of Mann and Kohli (2009) yielded insignificant
results due to a small sample size.
Recently, Gubbi et al. (2010) and Kohli and Mann (2012) analyzed abnormal returns to the
announcement of an acquisition on a large sample size. Those studies have focused more on bid-
specific characteristics and have not been tested for robustness of the results by non-parametric
tests. While Kohli and Mann (2012) registered significantly higher value gains for cross-border
deals than domestic ones, Gubbi et al. (2010) even obtained significant results for Indian firms
investing in institutional advanced countries during the period of 2000 to 2007. In contrast, Aybar
and Ficici (2009) examined 58 advanced market acquisitions from emerging market firms during
the period of 1991 to 2004 and found empirical evidence for value destruction.
Approaches to the value creation of acquiring firms in India have also been conducted apart from
the event study methodology with a benchmark index. For instance, Singh et al. (2010) found
evidence of a decrease in economic value added and a decrease in the employed return on capital
and earnings per share following the years of the acquisition announcement in India. In this
context, Ahern (2009) reported that among market equity, prior returns, book-to-market, and
earnings-to-price ratios, the benchmark model produces the least biased results with the least
rejection errors. According to him, biases are introduced in event studies when the sample size is
too small and the sample size is selected after a common criterion.
Gubbi et al. (2010) followed Aherns suggestions and concluded that international acquisitions are
a way of strategic asset-seeking in order to facilitate organizational and strategic transformation
of the firm. This study attempts to validate the findings of Gubbi et al (2010) and goes beyond by
conducting an in-depth analysis on the determinants of superior performance.

21
3.2 Advanced market hypothesis
This study considers only advanced market acquisitions. Advanced markets are defined according
to an Organisation for Economic Co-operation and Development (OECD) definition. The OECD
lists 34 countries as being advanced (Appendix V). They produce almost 60% of the worlds goods
and services and have therefore been used as an indicator for economic development in earlier
research as well (Gubbi et al., 2010). I suggest that the market expectation of the acquisition
performance is positively correlated with institutional progress and higher economic performance
of the host country.
As previously discussed institutional advancement of advanced market firms can be one of the
main reasons for value creation of an emerging market firm acquisition in OECD countries. In
this context, advanced market acquisitions can also be considered as a mechanism for corporate
governance convergence. For instance, the firm Infosys in our sample is an exemplar of good
governance after inorganic expansion in advanced markets (Khanna & Palepu, 2004). Good
corporate governance is supposed to maximize shareholder value and acts as a means in replacing
the weak institutional environment in India. Corporate governance ensures the basic protection of
stakeholders’ interests or compliance. Thus, it enhances transparency and enforcement of rules
which shareholders should appreciate. According to a report of the International Federation of
Accountants (IFAC) good governance is integrated into all aspects of an organization such as
strategic planning, resource utilization, value creation, accountability, and assurance. Applying
those practices lead to sustainable performance (IFAC, 2012).
Dawar and Frost (1999) stated that during the post-liberalization era in India multinational
enterprises have been attracted by high-growth emerging economies like India in high numbers
owing to the less restrictive IFDI policy. These entries provided a lot of advantages over Indian
domestic firms in regards to advanced technology, substantial financial resources, seasoned
marketing and management skills. Consequently, the survival of Indian firms has been threatened
and firms were forced to renew themselves. The liberalization of the economy changed the rules
of the game because required resources and capabilities are different from those in the pre-reform
era. The underdeveloped factor market make the Indian firms look beyond the national border
and intangible assets are acquired in advanced markets. This results in an enhanced value creation
in the domestic stock market due to higher expectations in comparison to domestic transactions.
In light of this, prior research has focused on the resource-based view and internalization theory
in order to explain the reasons for cross-border mergers of Indian firms (Du & Boateng, 2012).
The resource-based view conceptualizes the firm as a bundle of resources (Penrose, 1959). If
22
these resources are valuable, non-substitutable, rare and inimitable, a source of competitive
advantage is created. In the International Business literature, the focus is on the acquisition of
capabilities (McEvily & Marcus, 2005). The acquiring firm achieves full control over the foreign
asset which adds up to the firm value. This is further supported by Nelson (2005) who suggests
that internalized untradeable, tacit and intangible know-how leads to strategic renewal. This asset-
exploitation perspective is the predominant theoretical view in the FDI literature and refers back
to the dynamic capability approach. It suggests that firms learn how to alter their resource
configurations in a dynamic environment. These configurations require that the firm is
restructuring by divesting, accumulating and acquiring resources (Karim & Mitchell, 2000). Due
to the tacit characteristic of some capabilities, it is impossible to acquire them through market
transactions. Therefore, advanced market acquisitions play a crucial role in expanding the firm’s
capabilities in regards to new management practices and key strategic resources.
The resource based view and the accompanying transaction cost economics theory will be more
important the more mature the market gets (Hoskisson et al., 2000). In the initial stages of market
emergence institutional theory is weak but plays a crucial role at further development stages. For
instance, in protecting the acquired asset from imitation. Due to weak institutional enforcement
of patent laws and low labour costs, Indian pharmaceutical firms became a global supplier of
generic drugs and secured their position with acquisitions in advanced markets. Nowadays, the
acquired R&D capabilities pay off because India restructured its Intellectual Protection Rights
(IPR) regime (Bedi, Bedi & Sooch, 2013).
This example also shows that the instant access to critical foreign resources such as R&D
capabilities allow firms not to walk through the cumbersome and time-consuming process of
internal growth (Vermeulen & Barkema, 2001; Deng, 2009). Thus, advanced market acquisitions
can leapfrog conventional growth cycles and let the firm grow faster. In light of this,
internationalizing firms in India are favoured over indigenous host country competitor
acquisitions since internalizing critical knowledge-based capabilities within the firm’s boundaries
results in a value enhancement in the stock market (Buckley & Casson, 1976; Hymer, 1976;
Makino et al., 2002; Yiu, Lau, & Bruton, 2007).
The strategic opportunities that advanced markets provide for emerging market firms from India
and the role of strategic renewal are benefitting the overall market expectations. Moreover, the
institutional setting and the advanced economy are promising factors for a higher quality of the
resource. In particular, OECD countries are characterized by higher-quality complementary
resources and a more developed institutional environment compared to emerging market
countries (Gubbi et al, 2010). This results in less business risks and more institutional protections

23
for investments. Since the target firm is competing in a more competitive environment with a
customer centric focus, it provides also a richer learning experience for the acquiring company.
Additionally, a new perspective has been brought up by Hope, Thomas and Vyas (2011). They
concluded that national pride drives a higher acquisition premium for shareholders of the
acquiring firm. Firms from emerging economies bid higher on average for targets than developed
market firms and the transaction itself exhibits characteristics of national pride beyond the
obvious business of the firm and therefore results in a higher premium (Hope et al. 2011). These
suggestions involve a high level of managerial hubris and should be regarded cautiously.
However, in the Indian context the Tata-Jaguar Land Rover deal supports this assumption.
To sum it up, advanced market acquisitions are a crucial lever for value creation. Indian firms
who are pursuing this mode of internationalization are likely to show positive market reaction if
the semi-efficient market hypothesis holds. Thus, the following hypothesis is tested:
Hypothesis 1: The cumulative abnormal returns related to the announcement of an advanced
market acquisition are significantly positive for Indian service and manufacturing firms.
Results of performance studies of cross-border acquisitions from emerging market firms are
mixed and inconclusive. While some experience value creation ( Moeller, Schlingemann et Stulz,
2004), other studies obtain value destructive results (Aybar & Ficici, 2009). In his study, Karnani
(2010) concludes that Indian firms do not create shareholder value because of too little integration,
agency problems, and easy capital. Furthermore, elaborating on why significance of his results
has failed, King et al. (2004) suggest that existing models have failed to clearly identify subgroups
of firms that do experience significant, positive return. In this context, I elaborate in the next
chapter whether there are any sectoral differences in the value creation of Indian acquiring firms.
3.3 Industry sector hypotheses
Dos Santos et al. (2008) suggests that there is a lack of evidence that cross-border acquisitions
destroy value but there is a significant diversification discount in the industrial diversification
subsample.
Following Dos Santos suggestions, this study is specifically dealing with service and
manufacturing firms. The sample provided an almost equal number of acquisitions in between
manufacturing firms (41) and service firms (31). The existent literature is so far inconclusive
24
whether foreign acquisitions have stronger effects on firm performance for shareholders of service
or of manufacturing firms. Generally, firms that are stemming from these different industries have
a different agenda. Without obtaining any significant results, former studies indicated that service
firms perform slightly better (Delios, Gaur & Kamal, 2009; Ray & Gubbi, 2009). Delios et al.
(2009) argue that firms in the manufacturing sector are generally expected to be older and are
facing more difficulties in transforming themselves in comparison to the dynamic service and
young service industry. However, both study results were insignificant and did not solely focus
on developed market deals.
Zhou (2016) found out that technological progress in manufacturing takes place more in the
direction of physical capital, whereas technological progress in the service factor happens more
in the direction of human capital. This is supported by Ray and Gubbi (2009) who claim that the
Indian nature of the service sector is human resource intensive. Therefore, I suggest that the
resistance to effectively integrate two firms comes from the human workforce. Post-acquisition
integration is therefore a bigger challenge for service firms than for manufacturing firms since
cultural distance has a large impact on the integration process. Furthermore, service firms need
market proximity because they are more marketing based. Therefore, they hope to acquire
marketing knowledge from the advanced market target firm. Having this knowledge will help to
overcome barriers, fosters more effective market responses and eases market acceptance. Hence
human integration becomes essential. Weber (1996) found that autonomy removal was positively
related to the performance of acquiring manufacturing firms but negatively related to the
performance of acquiring banks. He concluded that the negative effects of autonomy removal in
less human-intensive industries may be more than offset by the synergy gains received from the
higher level of integration through physical capital.
Moreover, research and development plays a critical role in the industry type suggested
differences. The Bengaluru-based company Infosys LTD which acquired three companies within
the observed time frame has noticed that it needs to acquire innovation in order to compete on an
eye-level with international firms. Sanchit Vir Gogia, chief analyst and CEO of advisory firm
Greyhound Research notes that “IT services companies have realised that it is not possible to
adapt to new demands from clients organically, so they are basically sourcing innovation through
these acquisitions” (Punit & Karnik, 2015). Specifically, IT companies like Tata Consultancy
Services, Infosys, Tech Mahindra and Wipro have been forced to change their business strategy
since clients demanded cost-cutting through automation and cloud. Hence, a new and even bigger
wave of inorganic growth is expected in 2016. According to Gogia: “there’s a lot more capabilities
25
that they need to have before becoming a serious player in new tech areas” (Punit & Karnik, 2015,
p.2).
Evidence suggest that especially sectors with high upstream capabilities such as research and
development, product development and design, experience a larger share of FDI by the way of
acquisition compared to others (Anand & Delios, 2002). However, the fact that these firms are
already adjusting their strategic direction according to the recent trends in the branch reflects their
technological advancement. According to Pradhan (2004) the ownership advantages of service
firms in IT and communication are based on advanced technologies. Thus, the technological gap
to advanced market firms is not visible, which leads to no or only little synergies in between the
merging firms
In 2001 IT firms accounted for 56% of the service OFDI share (Pradhan, 2003). I suggest that
service firms, in particular IT firms, are acquiring advanced market firms in order to secure
markets. Developed countries have contributed to the rapid rise of service firms in the Indian
economy (Pradhan, 2003). They have been the main source of growth and integration for Indian
software firms in the global market. The rise of the service firms has been relatively rapid in the
OFDI share. While manufacturing firms accounted for 85% and service firms for 4% of OFDI
share in 1987, the service firms raised their percentage to 38% and the manufacturing share
reduced its percentage to 58% in 2006 (Pradhan, 2008a). OFDI helped Indian software firms to
establish fully controlled branches. They acquired overseas in order to gain access and additional
intangible assets. The export oriented acquiring service firms serve the developed market demand
and have ever since been focused on global competition and upgrading their capabilities as
already mentioned in chapter 2. By now service firms have comparable strategic motivations to
advanced country firms. Manufacturing firms instead are still seeking to upgrade their
capabilities.
Another feature of the service industry in India is the tendency to engage in multiple acquisitions.
Punit and Karnik (2015) stated that Indian service firms are on an acquisition spree. This is likely
to be punished by the Indian stock market. I suggest that this behaviour could be reflected in
diminishing returns for the acquiring firms. To sum up, it is inconclusive whether service firms
are creating value or not. Hence, I suggest that:
Hypothesis 2a: Advanced market acquisitions of Indian service firms are creating neutral value
for shareholders.
Major acquisition intensive manufacturing industries have been automobile ancillaries, cement,
cosmetics and toiletries, steel pesticides and pharmaceuticals. Beena (2014) has found out that
26
competition post liberalization increased and led to numerous vertical mergers in the domestic
and international environment which increased the market power of acquiring firms. A large
number of manufacturing firms exploited advantages of size in bolstering their competitive
strengths. In this context, Chaudhuri et al. (2013) found out that FDI is significantly positive
impacted by market power concentration.
As mentioned earlier the change of competitiveness in the Indian business environment changed
not least because of advanced market multinational firms who engaged in Indian investments after
liberalization. In the industries in which MNCs were allowed to invest, the Indian firms also
needed to upgrade their capabilities in order to survive. The automotive sector for instance has
been among the first sectors to be liberalized, this sparked a competitive transformation as
multinational and domestic players entered the Indian market (Dhawan et al., 2012). However,
the Indian government did not allow IFDI in every sector in order to protect the domestic market
(Khanna et al., 2005).
In general, Indian manufacturing firms have been largely domestic market oriented compared to
Indian service firms who grew in accordance with the liberalization of the economy (Chaudhuri
et al., 2013). This resulted in large gaps in between those industries in terms of technological
competitiveness on a global level. Manufacturing firms are lagging behind service firms and were
additionally restricted in specific industries. Although manufacturing firms started earlier with
oversea investments and accounted for the majority of OFDI, their intention has always been to
serve the domestic demand.
In light of this the pharmaceutical industry represents an exception. Leading Indian
pharmaceutical firms like Ranbaxy’s or Dr. Reddy’s focus on frontier research activities
nowadays and invested heavily in innovation acquisitions in order to compete with global firms
on an eye level. Unlike China, India is focussing on niche sectors in the manufacturing industry.
However, it is generally argued that they experience sustainable growth by building up on their
large domestic markets (Bensidoun et al., 2008). Thus, only a fraction of manufacturing firms
competes with advanced market firms on an eye level so far. The gap in between advanced market
and emerging economy firms is considered larger in the manufacturing industry than in the service
industry. Hence, synergies are also expected to be larger which should result in significant
positive abnormal returns.
Manufacturing firms in India need to unlock the potential value themselves in order to grow.
Basically, there is no reason to switch the focus from the domestic to the global market unless
these firms build up the required capabilities. Manufacturing firms need to embrace global best
practices in operations while tailoring them to India’s unique environment. For example, a global
27
Indian mining and metals company set up aluminium smelter operations in India while at the
same time aiming at improving capital productivity. They acquired a European design supplier
and did the integration and commissioning in-house, thereby the smelter operations capital costs
were 50% below industry average which provided them with a domestic competitive advantage
(Chaudhuri et al., 2013).
Thus, Indian manufacturing firms are looking for management skills or technologies rather than
market expanding acquisitions that help them to increase operational efficiency and therefore lead
to stronger synergies. Additional measures by the government such as revoking product market
and ownership barriers, land market barriers, labour barriers and infrastructural barriers would
additionally help to unlock the large growth potential in the Indian manufacturing industry
(Chaudhuri et al., 2013).
Chaudhuri et al. (2013, p.3) claim: “The combination of rocketing domestic demand and the
multinationals’ desire to diversify their manufacturing footprint offers Indian product makers a
once-in-a-generation opportunity to emerge from the shadow of the country’s services sector.”
Out of this reasoning the market appreciates the acquisitions in advanced markets, hence I
suggest:
Hypothesis 2b: Advanced market acquisitions of Indian manufacturing firms are creating
significantly positive value for shareholders.
Classifying the firms according to the industry type might provide us with valuable insights about
the macro-economic impact of advanced market acquisitions, nevertheless it does not provide
managers with any knowledge concerning the performance outcome of the individual firm. In the
following we shall discuss motivational implications for the firm on a micro-level.
3.4 M&A firm motives hypotheses
As previously discussed, implications and theories developed in advanced markets may not lead
to accurate results in India and end up in biased findings and results when they are applied.
Consequently, the motives to merge in an emerging economy are also different from those in
advanced economies. There is a strong need for developing new models and theories and also for
testing old ones before predicting targets (Jucunda, 2013).

28
Due to the typical nature of the traditional business environment and the gradual transformation
of the emerging economies, Prashant Kale (2004, p.3) stated in 2004 that “there might be some
important differences in the value creation patterns in emerging market acquisitions as compared
to that typically observed in developed market acquisitions.” At first glance this chapter seems to
be overloaded. The author chose this approach deliberately. In this way the presentation of value
creating patterns and the classification of the firms provide the reader with sound and thorough
understanding of the developed hypotheses. In this regard, the focus is on firstly discussing
prevailing value- and non-value creating theories and then, identifying the different acquisition
motivations of the sample. Finally, based on a discussion of previous findings, several hypotheses
are developed.
The value creating strategies are referring to the neo-classical view and are coming from synergies
between the merged companies and the overall goal is to create economic value for the firm.
Included in this view are also long-term considerations concerning the strategic alignment of
acquisitions in regards to technological change or market protection. This thesis is only dealing
with the neo-classical view since it is measurable.
The non-value creating strategies are referring to two motivations. The agency driven
motivational view suggests that takeovers occur because they enhance the welfare of the managers
at the expense of the firm’s shareholders. Lastly, the behavioral driven motives suggest that
acquisition deals can be explained by inefficient management decisions which are referring to
cognitive and social factors such as herding and hubris.
3.4.1 Non-Value creating strategies
To start with, many acquisitions can be driven by other factors that are not related to value
enhancement. In this regard, the most widely known explanations for merger and acquisitions are
the managerialism hypothesis or agency driven view and the hybris theory which is belonging to
the behavioral driven motives (Roll, 1986).
According to Roll (1986) acquisitions occur because acquiring firm managers make mistakes by
evaluating the target firm. Hence, the takeover premium reflects a random error. Oftentimes
managers are overconfident in evaluating the targets asset and think that they would do better in
performing than the average acquirer. Roll takes the hybris hypothesis to the extreme by
predicting that there are no synergistic gains for the acquirer in takeover bids. The entire takeover
premium paid to the target firms is paid by the acquirer.

29
Seth et al. (2000) eased this hypothesis by presenting empirical evidence for finding little
synergistic gains. He explains that the rationale manager is eager and motivated to undertake
acquisitions if synergistic gains are provided. The problem that managers are facing is that the
valuation of the target firms might be erroneous and therefore expected synergistic gains are
positive. It results in overpayment by the acquirer which leads to a loss to the shareholders.
Another vital part of the behavioral driven motivations plays herding behavior. Herding behavior
refers to managers that rely solely on the information content and behavior of their predecessors.
Managers will continue to follow these predecessors until the loss exceeds the gain. This
reasoning implies that especially late movers are worse off.
In addition to the hybris and herding hypotheses, the managerialism or agency driven motive
suggests that managers overpay for takeovers on purpose. Their goal is to maximize their own
utility at the expense of the firm’s shareholders (Jensen, 1986). Their objectives can be of various
reasons. Managers might search for an increase in power, prestige, salaries or job security by
empire building (Baumol, 1962).
Since managerial salary is tied to the amount of assets controlled, they are looking for higher rates
of assets than profits which results in a profit constraint to the firm. This empire building
opportunistic behavior leads to the overpayment of target firms and consequently to no synergistic
gains among the firms. Value is already destructed prior to the acquisition. According to Seth et
al. (2002), there is a transfer of value from the combined entity to the managers of the acquiring
firm. Particularly, three types of managers show this opportunistic behavior:
Managers of firms with excess cash flows
Managers of firms in shrinking industries
Manager of firms in slow-growth industries with little investment opportunities (Mathur
et al., 1994).
3.4.2 Value creating strategies
The common argument in the literature on why acquisitions take place is that the combined value
of the firm is greater than the individual one. Value is created when the combined entity makes
the best use of firm’s assets and resources according to the Neo-classical view.
The literature suggests that additional or synergistic value especially takes place if operational
efficiency or other forms of financial gain can be derived. Those operating efficiencies are
referring back to acquisitions that have been undertaken with the purpose of achieving economies
of scale or scope by pooling functions and resources. Pooled technological and marketing
30
resources like R&D, marketing and management help to minimize redundant capacities, reduce
costs and enhance performance (Porter, 1980).
In addition to that, the combined entity may also experience financial gains. Due to the increased
size it has an easier access to capital. Moreover, due to little relatedness of the merging firms, the
variability and risk of cash flows are reduced. In result, it affects positively the ability and
capability of the firm to borrow money from capital markets and improves the overall firm
performance.
Studies have also proven that market power also serves as a contributor to value creation in
mergers and acquisitions (Eckbo, 1983). Following Seth’s dominant firm model (1990), prices
will increase as a result of an acquisition of a dominant firm because it reduces competition and
ensures the ability to control the market prices and the traded quantities. Especially in high-
technology markets small companies can benefit from acquisitions from larger firms by sharing
the R&D and operating costs and therefore improve their competitiveness in the market.
To sum up, the neo-classical view will serve as basis for the investigation in this thesis since it is
synergy materialization that is creating value in the short-run, therefore it is also possible to
measure in the market. Value destructive motivations are presented in order to provide the total
picture of motives for firms that are engaging in acquisitions.
3.4.3 Acquisition motives in the Indian context
The previous discussed value creating theories play a large role in assessing the Indian firm
motivation for acquiring advanced market firms. This chapter serves as an introductory chapter
to the firm motivation classification and further delimits the Indian specific context from the
Chinese one.
While the Neo-classical theory argues that firms are engaging in acquisitions because of potential
synergies, behavioral driven or agency driven motives allow for irrational behavior that cannot
be captured by publicly available information. In this context, hypotheses in regards to these two
motives cannot be derived but can potentially be discovered during the course of the research.
Traditionally, the motives for investing overseas are accessing new markets, resources or to
enhancing operational efficiency. The mentioned capabilities that these firms want to build up
range from technology and brand to managerial competences with a specific focus on premium
customers. Furthermore, Meyer (2015) emphasizes the importance of partner engagement with a
focus on financial advisors and R&D process management that shall help Indian firms to build up
the requested capabilities.
31
The Tata group for instance engaged in multiple European acquisitions of technologically
advanced but financially struggling businesses like Jaguar Land Rover and Tetley Tea. The aim
was neither to sell Indian products in the European market nor to increase operational efficiency.
Next to the financial motive of risk diversification, these acquisitions were mainly driven by
gaining managerial competences for acting in the global business world and the acquisition of
strategic assets. In fact, Tata gained know-how in the management of acquisition processes which
in turn led to benefits in the long-term creation of capabilities for the group as a whole (Meyer,
2015).
This observation is supported by KPMG who reported in 2010 that Indian acquisition in advanced
markets are somewhat particular in comparison to China. The report was based on primary data
by conducting interviews with the senior management of selected acquiring companies. The main
outcome is that Indian firm’s main objective is to learn new skills and capabilities from the target
whereas Chinese companies put a great emphasis on reducing costs and economies of scale.
Moreover, Indian acquirers take a slower, deliberate approach towards integration of operations
and want to align synergies slower in comparison to Chinese acquirers. In terms of organizational
structure, Indian acquiring firms consider their global business as one continuum with a tendency
of a regional specific structure, whereas Chinese firms have a high management autonomy with
specific operating hubs (KPMG, 2010).
Over 90% of the companies in India are family owned (PricewaterhouseCoopers, 2010). Family
owned businesses have a different agenda and relation to the business than a purely management
driven company. In this context, conglomerates are very typical in India. Unrelated diversifying
acquisitions in India are very common which can be explained by the empire building theory of
market power pursuing families with high-entrepreneurial skills (Sabarinath & Kailash, 2012).
3.4.4 Motivation classification
The data collection is essential in order to proof suggested hypotheses which are related to the
acquisition strategy since the goal is to obtain significant and explanatory results. Besides, it
becomes crucial to classify the firms attentively and finding the right balance in between publicly
available information which include company reports, press releases, notes etc. but also database
information like Zephyr and ThompsonOne Banker which provide information to SIC codes,
number of subsidiaries, etc.
32
However, the assumption needs to be made that strategic motivations are also influenced by
internal and non-publicly available factors. Categorizing the firms is a challenge. The author has
been confronted with little available information or little transparency to the published acquisition
announcements. The amount of information varies a lot in regards to the deals from the sample.
To the best of my knowledge and belief, the categorization of the deals incorporates all available
information and the suggestions are the best possible which can be obtained without inside
information.
In total 72 firms needed to be reviewed. Different sources have been used in order to counter-
check the provided information. Earlier attempts to classify firms used various approaches. Bower
(2001) summarized the classification dilemma as “finding some order in the chaos”. The first
attempts to classify firms according to the acquisition motivation have been in defining the SIC
code. Unluckily, there is strong inconsistency in SIC code classifications and the codes were also
not available for each Indian company. Hence, the classification approach in this thesis is
influenced by suggestions of Bower (2001) and refer to the Neo-classical theory. In total four
different categories have been identified:
1. Acquisitions to expand the market
2. Acquisitions to acquire assets/technology
3. Vertical acquisitions
4. Diversifying acquisitions.
It is noteworthy to mention that those motives are independent from the industry type and the
industry class. If several motives have been identified, the most outstanding has been selected by
reviewing and counter-checking different sources.
Diversifying acquisitions
With a diversifying acquisition an Indian firm purchases a controlling interest in another company
in order to expand its product and service offerings. The common literature argues that
diversification leads to reduced firm-specific risks. Managers believe they reduce the volatility
and risk of earnings and thereby create value. In the Indian context most of the owner bear all the
risk since the majority of firms is family owned. This explains also the multiple business,
conglomerate structure in India. After classifying the 72 firms according to their motives, 5 firms
disclosed that they diversified in order to reduce risks or grow faster (Table 2). All of these
diversifying acquisitions were also combined with financial motives. Amtek Auto for instance
bought the German car equipment manufacturer Kaiser GmbH out of insolvency.

33
Table 2 Diversifying acquisitions, own illustration
Acquisitions to acquire assets/technology
Wernerfelt (1985) argues that internalization of new resources and capabilities that are not
available in the home country is a crucial reason to acquire overseas. Emerging market firms are
acting in globalized and ever-changing context and usually lack proprietary technologies and
brands in comparison to their OECD counterparts (Dunning, 2008). In order to stay competitive
in a global market, the emerging market firms need to quickly upgrade their capabilities instead
of creating a time-consuming brand awareness and undertaking risky R&D investments (Pradhan,
2008a). Out of these reasons emerging market firms acquire “upmarket” in order to augment firm
skills and resources. Therefore, firms are classified according to the main purpose of acquiring
assets in terms of a global brand or technological skills. In total, the classification yielded 26 firm
(Table 3).
Acquirer Country Target Country Manuf. Service DoA
WPIL LTD IN MATHERS FOUNDRY LTD GB x 07.07.2011
LARSEN & TOUBRO LTD IN THALEST LTD GB x 04.04.2012
CROMPTON GREAVES LTD IN EMOTRON AB SE x 19.05.2011
PIRAMAL HEALTHCARE LTD IN DECISION RESOURCES LLC US x 16.05.2012
AMTEK AUTO LTD IN NEUMAYER TEKFOR HOLDING GMBHDE x 11.03.2013
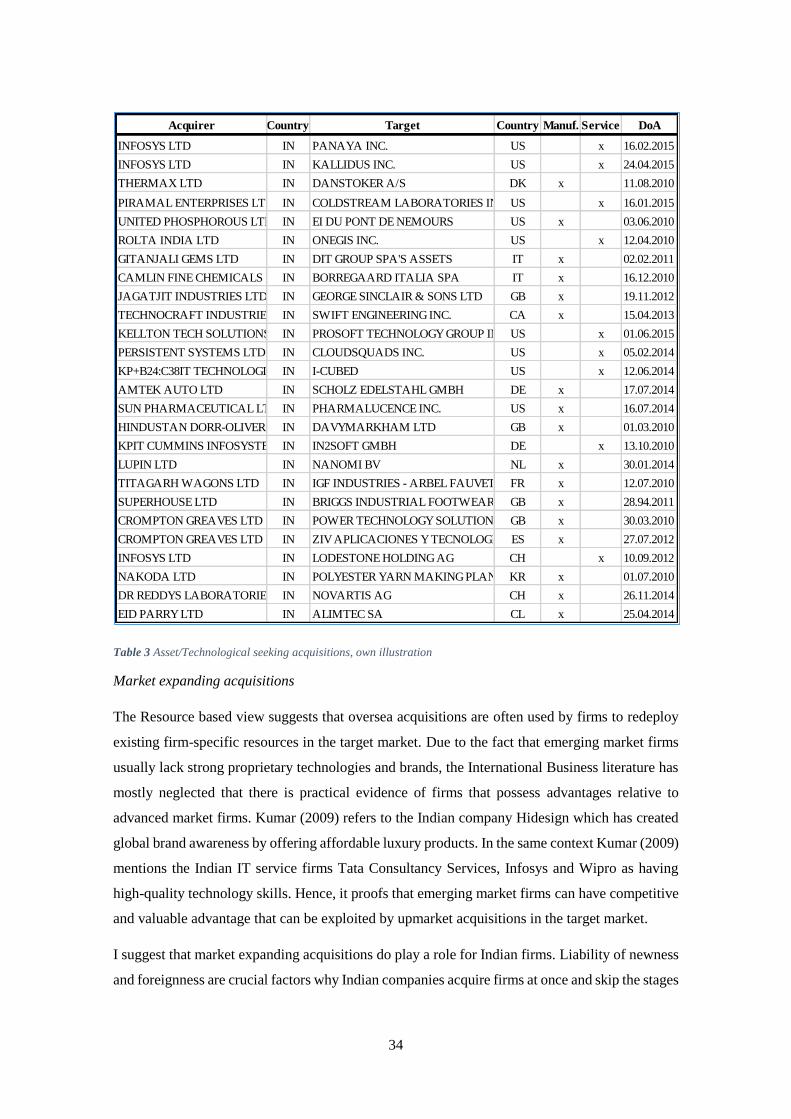
34
Table 3 Asset/Technological seeking acquisitions, own illustration
Market expanding acquisitions
The Resource based view suggests that oversea acquisitions are often used by firms to redeploy
existing firm-specific resources in the target market. Due to the fact that emerging market firms
usually lack strong proprietary technologies and brands, the International Business literature has
mostly neglected that there is practical evidence of firms that possess advantages relative to
advanced market firms. Kumar (2009) refers to the Indian company Hidesign which has created
global brand awareness by offering affordable luxury products. In the same context Kumar (2009)
mentions the Indian IT service firms Tata Consultancy Services, Infosys and Wipro as having
high-quality technology skills. Hence, it proofs that emerging market firms can have competitive
and valuable advantage that can be exploited by upmarket acquisitions in the target market.
I suggest that market expanding acquisitions do play a role for Indian firms. Liability of newness
and foreignness are crucial factors why Indian companies acquire firms at once and skip the stages
Acquirer Country Target Country Manuf. Service DoA
INFOSYS LTD IN PANAYA INC. US x 16.02.2015
INFOSYS LTD IN KALLIDUS INC. US x 24.04.2015
THERMAX LTD IN DANSTOKER A/S DK x 11.08.2010
PIRAMAL ENTERPRISES LTD IN COLDSTREAM LABORATORIES INC. US x 16.01.2015
UNITED PHOSPHOROUS LTD IN EI DU PONT DE NEMOURS US x 03.06.2010
ROLTA INDIA LTD IN ONEGIS INC. US x 12.04.2010
GITANJALI GEMS LTD IN DIT GROUP SPA'S ASSETS IT x 02.02.2011
CAMLIN FINE CHEMICALS LTDIN BORREGAARD ITALIA SPA IT x 16.12.2010
JAGATJIT INDUSTRIES LTD IN GEORGE SINCLAIR & SONS LTD GB x 19.11.2012
TECHNOCRAFT INDUSTRIES LTDIN SWIFT ENGINEERING INC. CA x 15.04.2013
KELLTON TECH SOLUTIONS LTDIN PROSOFT TECHNOLOGY GROUP INC.US x 01.06.2015
PERSISTENT SYSTEMS LTD IN CLOUDSQUADS INC. US x 05.02.2014
KP+B24:C38IT TECHNOLOGIES LTDIN I-CUBED US x 12.06.2014
AMTEK AUTO LTD IN SCHOLZ EDELSTAHL GMBH DE x 17.07.2014
SUN PHARMACEUTICAL LTD IN PHARMALUCENCE INC. US x 16.07.2014
HINDUSTAN DORR-OLIVER LTDIN DAVYMARKHAM LTD GB x 01.03.2010
KPIT CUMMINS INFOSYSTEMS LTDIN IN2SOFT GMBH DE x 13.10.2010
LUPIN LTD IN NANOMI BV NL x 30.01.2014
TITAGARH WAGONS LTD IN IGF INDUSTRIES - ARBEL FAUVET RAIL SAFR x 12.07.2010
SUPERHOUSE LTD IN BRIGGS INDUSTRIAL FOOTWEAR LTDGB x 28.94.2011
CROMPTON GREAVES LTD IN POWER TECHNOLOGY SOLUTIONS LTDGB x 30.03.2010
CROMPTON GREAVES LTD IN ZIV APLICACIONES Y TECNOLOGIA SLES x 27.07.2012
INFOSYS LTD IN LODESTONE HOLDING AG CH x 10.09.2012
NAKODA LTD IN POLYESTER YARN MAKING PLANT KR x 01.07.2010
DR REDDYS LABORATORIES LTDIN NOVARTIS AG CH x 26.11.2014
EID PARRY LTD IN ALIMTEC SA CL x 25.04.2014
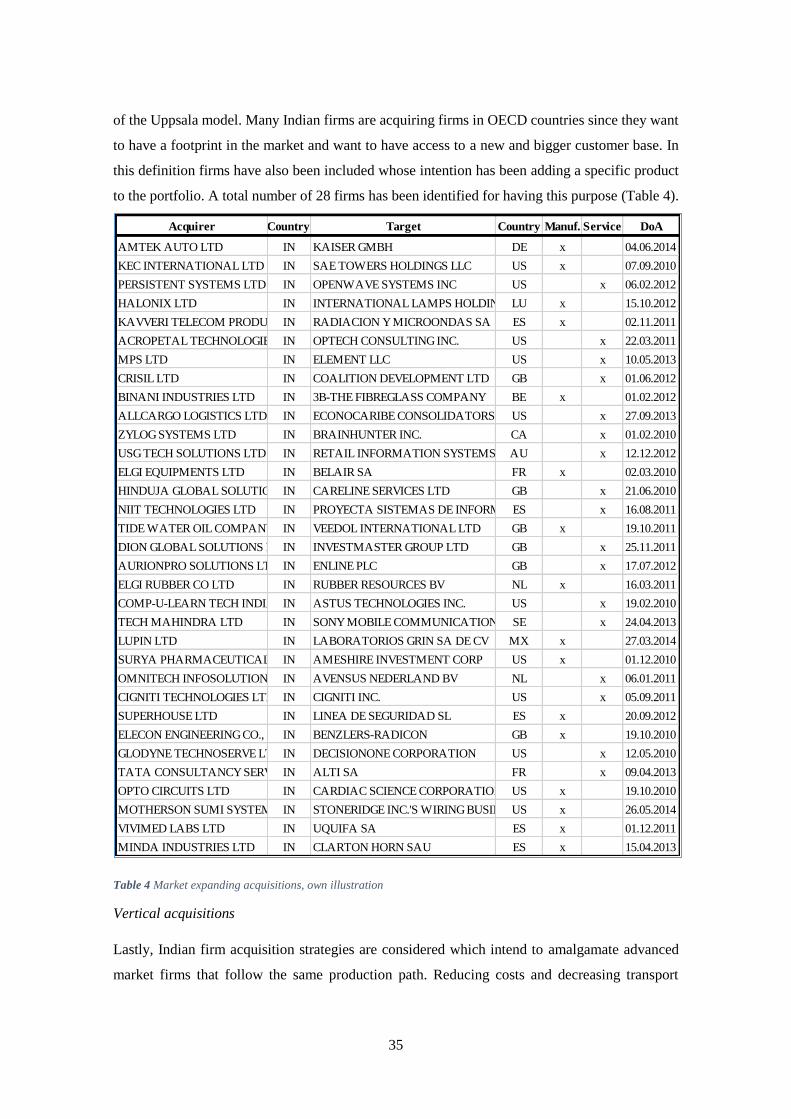
35
of the Uppsala model. Many Indian firms are acquiring firms in OECD countries since they want
to have a footprint in the market and want to have access to a new and bigger customer base. In
this definition firms have also been included whose intention has been adding a specific product
to the portfolio. A total number of 28 firms has been identified for having this purpose (Table 4).
Table 4 Market expanding acquisitions, own illustration
Vertical acquisitions
Lastly, Indian firm acquisition strategies are considered which intend to amalgamate advanced
market firms that follow the same production path. Reducing costs and decreasing transport
Acquirer Country Target Country Manuf. Service DoA
AMTEK AUTO LTD IN KAISER GMBH DE x 04.06.2014
KEC INTERNATIONAL LTD IN SAE TOWERS HOLDINGS LLC US x 07.09.2010
PERSISTENT SYSTEMS LTD IN OPENWAVE SYSTEMS INC US x 06.02.2012
HALONIX LTD IN INTERNATIONAL LAMPS HOLDING LU x 15.10.2012
KAVVERI TELECOM PRODUCTS LTDIN RADIACION Y MICROONDAS SA ES x 02.11.2011
ACROPETAL TECHNOLOGIES LTDIN OPTECH CONSULTING INC. US x 22.03.2011
MPS LTD IN ELEMENT LLC US x 10.05.2013
CRISIL LTD IN COALITION DEVELOPMENT LTD GB x 01.06.2012
BINANI INDUSTRIES LTD IN 3B-THE FIBREGLASS COMPANY BE x 01.02.2012
ALLCARGO LOGISTICS LTD IN ECONOCARIBE CONSOLIDATORS INC.US x 27.09.2013
ZYLOG SYSTEMS LTD IN BRAINHUNTER INC. CA x 01.02.2010
USG TECH SOLUTIONS LTD IN RETAIL INFORMATION SYSTEMS PTY LTDAU x 12.12.2012
ELGI EQUIPMENTS LTD IN BELAIR SA FR x 02.03.2010
HINDUJA GLOBAL SOLUTIONS LTDIN CARELINE SERVICES LTD GB x 21.06.2010
NIIT TECHNOLOGIES LTD IN PROYECTA SISTEMAS DE INFORMACION SAES x 16.08.2011
TIDE WATER OIL COMPANY LTDIN VEEDOL INTERNATIONAL LTD GB x 19.10.2011
DION GLOBAL SOLUTIONS LTDIN INVESTMASTER GROUP LTD GB x 25.11.2011
AURIONPRO SOLUTIONS LTD IN ENLINE PLC GB x 17.07.2012
ELGI RUBBER CO LTD IN RUBBER RESOURCES BV NL x 16.03.2011
COMP-U-LEARN TECH INDIA LTDIN ASTUS TECHNOLOGIES INC. US x 19.02.2010
TECH MAHINDRA LTD IN SONY MOBILE COMMUNICATIONS SE x 24.04.2013
LUPIN LTD IN LABORATORIOS GRIN SA DE CV MX x 27.03.2014
SURYA PHARMACEUTICAL LTDIN AMESHIRE INVESTMENT CORP US x 01.12.2010
OMNITECH INFOSOLUTIONS LTDIN AVENSUS NEDERLAND BV NL x 06.01.2011
CIGNITI TECHNOLOGIES LTD IN CIGNITI INC. US x 05.09.2011
SUPERHOUSE LTD IN LINEA DE SEGURIDAD SL ES x 20.09.2012
ELECON ENGINEERING CO., LTDIN BENZLERS-RADICON GB x 19.10.2010
GLODYNE TECHNOSERVE LTD IN DECISIONONE CORPORATION US x 12.05.2010
TATA CONSULTANCY SERVICES LTDIN ALTI SA FR x 09.04.2013
OPTO CIRCUITS LTD IN CARDIAC SCIENCE CORPORATION US x 19.10.2010
MOTHERSON SUMI SYSTEMS LTDIN STONERIDGE INC.'S WIRING BUSINESSUS x 26.05.2014
VIVIMED LABS LTD IN UQUIFA SA ES x 01.12.2011
MINDA INDUSTRIES LTD IN CLARTON HORN SAU ES x 15.04.2013

36
expenses are the most prominent reasons for engaging in vertical acquisitions. Indian companies
could consider the acquired firms as part of a global value chain. Market power also plays an
important role for this motivation, companies in adjacent stages of the industry chain could have
more market power than the companies at the stage of the Indian company. Thus, Indian
companies acquire vertically in order to boost competitiveness. Another reason would be to keep
the risk low in a segment that is unreliable or to exploit market power by raising market entry
barriers and allowing price discriminations. Eight firms have been identified that published these
intentions in the respective management summary or media (Table 5).
Table 5 Vertical acquisitions, own illustration
3.4.5 Hypotheses about firm motivation
According to Delios, Gaur and Kamal (2009) there are several possible means by which a
competition enhancing outcome can be created in an oversea acquisition. The first one is the
effective internalization and extension of the proprietary asset of the two parties involved. A
second means is the reconfiguration of resources of the target or acquiring firm in order to reduce
redundancies or to create value through an effective alignment of potential complementary
competencies in between the firms. The reconfiguration of resources with a focus on structuring
the acquiring and target firm’s resources on global level instead of a multi-local level represents
a third means. A fourth means would be an organizational learning influence that results in the
development of new competencies for competition in new markets, which rather represents a
long-term orientation.
Technology/asset seeking acquisitions
Keeping this reasoning in mind, I suggest that the asset-seeking approach offers more
opportunities in enhancing value in comparison to the expanding market approach. It is critical
for the Indian firm to assess its critical factors properly and develop or purchase the lacking ones
Acquirer Country Target Country Manuf. Service DoA
BANCO PRODUCTS LTD IN NEDERLANDSE RADIATEUREN FABRIEK BVNL x 22.02.2010
EID PARRY LTD IN US NUTRACEUTICALS LLC US x 11.10.2011
SRF LTD IN GLOBAL DUPONT DYMEL US x 31.12.2014
R SYSTEMS INTERNATIONAL LTDIN COMPUTARIS INTERNATIONAL LTDGB x 12.12.2010
PERSISTENT SYSTEMS LTD IN AGILENT TECHNOLOGIES FR x 26.05.2011
TECH MAHINDRA LTD IN LIGHTBRIDGE COMMUNICATIONS US x 20.11.2014
MPHASIS LTD IN WYDE CORPORATION US x 01.08.2011
CIGNITI TECHNOLOGIES LTD IN GALLOP SOLUTIONS INC. US x 29.05.2013
37
in order to change the competitive rules. As previously mentioned, Indian firms follow oftentimes
a long term strategic approach, which is for instance reflected by the acquisition of the British
based manufacturing firm Davy Markham by Hindustan Dorr-Oliver in the sample. After
acquiring the manufacturing capabilities, the Indian firm intends to set up the acquired
engineering design and manufacturing centers back in India and the finishing touches will be
handled at the UK facility. This move is not only highly cost-effective, but also restructures Davy
Markham by switching its focus on becoming a single engineering design company. In turn, the
acquired technological skills will provide Hindustan Dorr-Oliver with high-quality offerings for
its clients and expand its portfolio.
The most commonly known example of an Indian acquisitions is probably Tata Motors purchase
of Jaguar Land Rover in 2008. Tata Motors internationalization path was characterized by both
technology and brand seeking outward FDI. From the viewpoint of Tata Jaguar Land Rover has
been a technologically advanced but financially struggling company. This acquisition provided
the Tata group with managerial competencies in luxury brands and international acquisition
processes. Thus, the main objective is a long-term strategic goal that enhances the groups
competitiveness (Meyer, 2015). In this light, acquiring global brands as a strategic asset is
referring back to the reasoning of Hope and Vyas (2011). An outpouring of national pride drives
the shareholder value of the acquiring firm and therefore represents an additional reason for value
creation.
In line with my earlier proposed assumptions about manufacturing firms, both technological and
asset seeking acquisitions in advanced markets close the gap in between global competitors and
Indian firms and lead to strong synergistic gains for Indian firms. National pride of an advanced
market firm can additionally contribute to a value enhancement. Hence, I suggest:
Hypothesis 3a: Technological or asset seeking acquiring firms create significantly positive
abnormal return.
Expanding market acquisitions
Expanding market acquisitions are usually confronted with a mature domestic market and look
for opportunities to enter new segments and to gain new customers. A type of expanding market
acquisitions are firms who are having the intention of broadening the product line.
Firms that have this intention are aiming for the goal to bundle products with complementary
products from the advanced market firm or to offer a new product in order to reach a bigger
38
customer base. The initial intention is to seek for economies of scope and thereby decrease the
production costs in leveraging the number of offered products. Synergies arise from asset
complementary. However, the existing literature has not found any empirical evidence for an
increase in the share price by broadening the product line (Hoberg & Philips, 2010).
A typical example of a market expanding acquisition from the sample is described in the
following. The Indian electric power transmission tower manufacturer KEC International
acquired the US-based SAE Towers in 2010. The main intention was to leverage SAE Towers’
existing customer relations for KEC’s other business segments and thereby derive significant
operational synergies in procurement, administrative cost savings and marketing opportunities.
Market expanding acquisitions create value through local specialization, improved capacity
utilization and technical efficiency and improve the competitive standing of the company by
realizing scale economies. Recent studies show poor performances for firms that expand
geographically (Rossi &Volpin, 2004). Those firms are oftentimes confronted with the hubris
theory. Indian managers do not assess the acquisitions properly for a successful integration plan
and are overconfident in assuming that their deal might be different.
Additionally, in the Indian context, a sort of herd mentality has emerged. Indian service firms are
on an acquisition spree according to Punit and Karnik (2015). In the sample the shoe
manufacturing company Superhouse Ltd acquirers the Spanish-based company Linea de
seguridad in order to tap the Spanish speaking market and strengthens its portfolio in safety
footwear. Few months earlier Superhouse acquired a similar company in Great Britain. The main
intention is not to acquire the technology or brand, but to get access to a new customer base and
to widen the portfolio. A short sequence of acquisitions of firms following this strategy is another
proof for an ambitious growth motivation. This may also be reflected in diminishing abnormal
returns for investors following serial acquisitions, which is consistent with the findings of Karolyi
et al. (2015).
However, this thesis is investigating the abnormal returns from a synergistic point of view so we
cannot draw any robust conclusion about behavioral or agency driven motivations. I conclude out
of the mixed findings and the lack of supporting arguments:
Hypothesis 3b: Market expanding seeking acquiring firms create neutral value.
39
Diversifying acquisitions
There is little conventional wisdom to guide managers on how to diversify. Usually they are
confronted with synthesizing data, forecasting markets, rate-of-return calculations and
competitive assessments under time constraints. Thus, it makes diversifications risky. Especially
an oversea acquisition reinforces the uncertainty, since cultural and institutional distance are
additional factors involved in the deal. Indian firms have the financial strength due to the recently
gained access to the global financial markets but lack the managerial foresight and skills in coping
with diversifying acquisitions in advanced markets. The domestically gained diversifying
acquisition experience of Indian conglomerates represent a fallacy in that sense.
In the sample Ajay Piramal, owner of Piramal Healthcare, bought the US-based analytics
company Decision Resources. He justified this acquisition out of a naïve thinking. To take him
by his words: "Look at companies like Apple and Facebook. They have created so much value.
In a changing global society, knowledge-based companies are turning out to be value-creators”
(Sabarinath & Kailash, 2012). He builds up on India’s emergence as a low-cost hub and the
availability of scientists. However, the acquisition is not well thought through and might result in
no synergistic gains; neither for the acquirer nor for the target. The integration process is
cumbersome and the intention is not to look for synergies, but profits.
Firms that are following this strategy oftentimes move from a slower to a faster-growing business
(Walker, 2000) because intentionally the goal is to acquire under favorable financial conditions
while having potential for obtaining high revenue. The only advantage is therefore stemming from
economic synergies. In general, it is very difficult to value a company correctly and specifically
behavioral value destroying motivations can come into play as can be seen in the mentioned
example. For instance, managers get overconfident in valuing the target better than the market.
To sum it up, the disadvantages outweigh the advantages. Franco et al. (2012) support this
suggestion by stating that the negative relationship between shareholder value and diversification
is emphasized when firms diversify across unrelated industries, hence I suggest:
Hypothesis 3c: Diversifying acquiring firms destroy value for the shareholders of the firm.
Vertical acquiring firms
In contrast to that, many Indian companies realized that they need to vertically integrate advanced
market firms in order to improve efficiency and margins and ensure supplies. Usually this
approach can be seen in case of raw natural resources. Firms ensure that they have an
40
uninterrupted supply. Moreover, they decrease transaction costs by internalizing the coordination
of successive activities.
Additionally, vertical integration provides operational visibility and efficiency for the Indian firm.
In the globalized world nowadays many companies started to build up a global value chain
structure. Production facilities are for instance located in a different country than the sourcing
facilities for the raw material. I suggest that the advantage in comparison to the diversifying firm
acquisition lies in the integration process. Since a business relationship has already been
developed, there is a sense of familiarity which unfolds trust. Hence, the liability of newness and
foreignness are eased off.
Vertical integration can also lead to an extension of the production. If the firm acquires upstream,
it adds an important dimension. The acquisition reduces upstream competition and consecutively
raises prices for disintegrated downstream rivals (Beladi, Chakrabarti & Marjit, 2013). Synergies
that are arising from upstream and downstream acquisitions have also positive impact on the
financial performance by economizing on the resulting redundancies.
Following the previous mentioned reasoning, I suggest:
Hypothesis 3d: Vertical integrating acquiring firms are creating significantly positive value.
3.5 Efficient market hypothesis
It is key to understand the theory behind the applied research method event study methodology
since the efficient market hypothesis (EMH) needs to hold in order to make the method
meaningful. Thus, I start with presenting the concept behind the EMH and relate it in the second
section to the applied event study approach. However, the event study methodology itself is
explained in the methodology chapter.
3.5.1 Introduction to the efficient market hypothesis
Eugene Fama (1970) proposed in the efficient market hypothesis that an assets current price fully
reflect all available information The EMH suggests that asset prices only change when new
information is available. The reasoning behind is that asset prices occur randomly because new
information is unpredictable and therefore also price changes are. This behavior is in accordance

41
with the random walk in financial theory which states that stock market prices evolve according
to a random walk and thus cannot be predicted. As a result, investors do not have any chance of
predicting the stock performance. An announcement of an upcoming merger reflects new
information to the market, therefore the EMH is relevant in regards to predicting the effects of
new information.
In his work, Fama identified three different degrees of market efficiency based on the amount of
information which is reflected in the asset prices: weak form, semi-strong form and a strong form.
The weak form suggests that all prices of a stock are reflected in today’s stock price.
It is not possible to predict and beat the market since analysis and trends of historical
stock price movements is already reflected in the price (Bodie et al., 2009). Future
stock price movements are totally independent of historical price movements.
The semi-strong efficiency implies that all public information is calculated into a
stock’s current share price. Hence, historical prices and fundamental data like the
firm’s composition of the balance sheet and the firm’s product line are reflected in
the price (Bodie et al., 2009).
The last efficiency degree is called the strong efficiency. It contains even information
that is not publicly available. All information in the market whether public or private
is accounted for in the stock price. In consequence the investor could not get any
advantage out of the market behavior. According to Fama (1970) this type of market
efficiency is regarded as a benchmark.
In the real world, the market is neither fully efficient nor totally inefficient. It is a mixture of both,
wherein daily decision and events are not always reflected immediately into the market. If the
market would be efficient, prices would adjust immediately to new available information. If every
market participant believes in the efficiency of the market, no one would seek for extraordinary
profits but this behavior is the driving force that keeps the market wheel turning. Previous research
showed that stock price movements are not always consistent with the EMH. De Bondt and Thaler
(1990) claim that markets overreact to new events which causes prices to decrease or increase
beyond the true value prior returning to the equilibrium price. Further research conducted by
Bernard and Thomas (1989) support this suggestion by obtaining a delayed response from the
market. Prices do not immediately respond to new information as can be seen in the following
Figure 2.

42
Figure 2 Different stock market reactions to new Information, own illustration inspired by Fama (1991)
Research has proven that the EMH is consistent with findings from several markets. Fama himself
concluded that the “evidence in support of the efficient market model is extensive while
contradictory evidence is sparse” (Fama, 1970, p. 416). However, ambiguity rules in an emerging
market like India with regards to the financial imperatives.
3.5.2 Efficient market hypothesis and event studies
“Event studies are the cleanest evidence we have on efficiency” according to Fama (1991, p.
1602). Event studies examine the effect of an announcement of a merger on the share price as a
test of the semi-strong efficient market hypothesis. The EMH has had a crucial impact on the
event study methodology. Initially, the focus of event studies has been on the speed of
incorporation of information into the share price (Fama, 1970). Under the assumption of market
rationality, the effect of the event will be reflected immediately into the share price. Hence, the
literature has shifted its focus to measuring the effect of economic events like mergers, earning
announcements or stock repurchases.
By shifting the literatures focus, event studies have become an important part of financial
economics (Kothari & Warner, 2007). Over time the purpose of the event study has not changed
much, it is still the basic statistical format that measures the mean of the cumulative mean return
surrounding the day of the event.
Investors who are seeking to outperform the market by seeking for mispriced securities have a
hard time being successful, since prices reflect all available information. Hence, the informational
efficiency of markets is of interest for all the parties involved, from investors to other market
participants. Security prices determine the allocation of wealth for market participants according

43
to Kothari (2001) and therefore result in increasing interest that creates demand for empirical
research on market efficiency.
Since markets are assumed to be semi-efficient and only include publicly available information,
the market should show a significant reaction to the announcement of the merger because until
the day of announcement prices of securities are being adjusted. The event window is chosen in
order to test for leakage of information prior to the announcement as well as to adjust for time
lags in stock price reactions. The comprehensive event study methodology will be presented in
the next section.
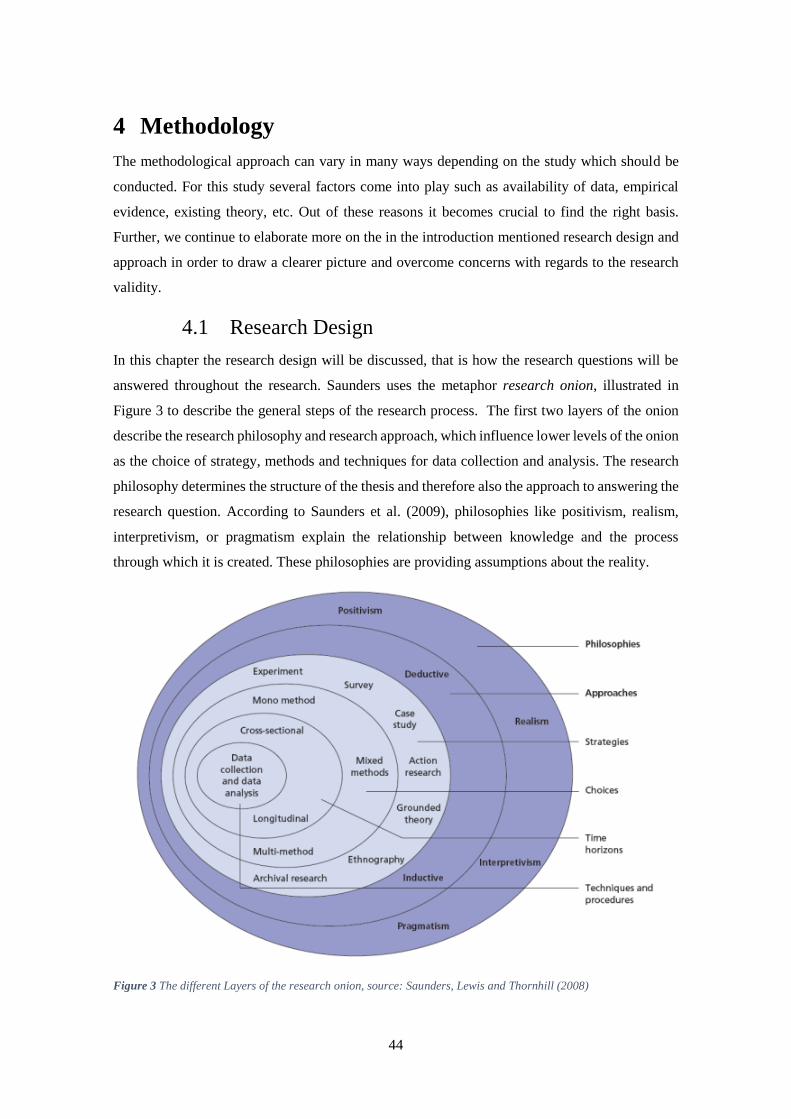
44
4 Methodology
The methodological approach can vary in many ways depending on the study which should be
conducted. For this study several factors come into play such as availability of data, empirical
evidence, existing theory, etc. Out of these reasons it becomes crucial to find the right basis.
Further, we continue to elaborate more on the in the introduction mentioned research design and
approach in order to draw a clearer picture and overcome concerns with regards to the research
validity.
4.1 Research Design
In this chapter the research design will be discussed, that is how the research questions will be
answered throughout the research. Saunders uses the metaphor research onion, illustrated in
Figure 3 to describe the general steps of the research process. The first two layers of the onion
describe the research philosophy and research approach, which influence lower levels of the onion
as the choice of strategy, methods and techniques for data collection and analysis. The research
philosophy determines the structure of the thesis and therefore also the approach to answering the
research question. According to Saunders et al. (2009), philosophies like positivism, realism,
interpretivism, or pragmatism explain the relationship between knowledge and the process
through which it is created. These philosophies are providing assumptions about the reality.
Figure 3 The different Layers of the research onion, source: Saunders, Lewis and Thornhill (2008)
45
Research philosophy
The defined research question in section 2 points to the question if advanced market acquisitions
create shareholder value for Indian companies at all. It is of quantitative nature. The questions of
particular performance according to industry type and acquisition motivation follow a scientific
approach to the creation of knowledge. The work falls predominantly into the philosophical
domain of positivism, which is very common in natural science and finance (Remenyi, Williams,
Money, & Swartz, 1998). Positivism requires the researcher to take a value-free and objective
stand and the research to be independent of institutions. The idea is that solely observable
phenomena, causality, and law-like generalizations contribute to the creation of knowledge
(Saunders, Lewis, & Thornhill, 2009). “The positivist looks for regularities and causal
relationships to understand and predict the social world” (Kuada, 2012, p. 73).
The data collection is typically grounded on large samples of measured, quantitative data and is
highly structured to allow a reproduction of the analysis (Gill & Johnson, 2002). This thesis
further assumes that people are rationale and want to maximize shareholder value by engaging in
an acquisition. Moreover, no behavioral engagement on the influence of prices or acquisitions is
expected. Lastly, the author takes a fully objective and unbiased stance, while analyzing the
results. Most commonly in the positivistic tradition, a research problem is investigated by testing
theoretically derived hypotheses on the specific situation. If the suggested hypothesis which has
been derived by former literature holds, the validity is enforced (Cooper and Schindler, 2003).
In contrast, realism philosophy thinks that there are social forces that influence people who are
not aware of being influenced by these forces. There exists a reality but there are also factors that
influence the reality of people. In this context some former studies have already looked upon the
performance results of Indian firms that are acquiring advanced market firms but many of them
have been unintentionally biased towards a specific outcome out of two reasons. Firstly, the social
pressure in society on publishing scientific papers with results in India is high, for instance, 42%
of fake single-journal publishers are based in India (Prasad, 2015). Secondly, public firms have
an interest in receiving good news about merger announcements as part of their value creating
strategy in order to justify it to stakeholders. Therefore, there is an overestimation bias in the
Indian firm landscape as well as in the official Indian institution statistics (Bhattacharya, 2015).
In this context, attention must be paid to the classification of the firm motivation. The author takes
a value free stance, yet the classifications are based on the authors assumption about reality.
46
Pragmatism fosters a mix or continuum of different methods and perspectives (objective and
subjective) as a means to answering the research question. Tashakkori and Teddlie (1998)
highlight the importance of engaging in research with a degree of flexibility, without being limited
to a specific method. Interpretivism stands in contrast to the positivism, as it stresses the
complexity of human interactions and the impossibility of deriving general laws from the
observation of large samples. This philosophy follows a purely qualitative approach. It is a
popular choice in research fields such as organizational behavior where in-depth interviews are
being conducted and analyzed (Saunders, Lewis, & Thornhill, 2009).
Naturally, the selected research philosophy for the thesis has its shortcoming in reducing the
complexity of human decision-making to the analysis of quantitative, transactional datasets. By
intention, the work disregards the experience and views of senior managers to keep a neutral stand
and to avoid any kind of bias. However, primary data would have been helpful in assessing the
motivation of the firm in the most proper way.
Research approach
The second layer of the research onion explains the role of existing academic theory in the study.
The author can follow a deductive and inductive approach or a mix of both of them. These
approaches are aiming at the creation of knowledge.
The deductive approach deals with forming hypotheses and deriving existing theories, that are
tested during the later stage of the paper. General theory should tell something about the specific
event. The deductive approach is oftentimes applied in research areas where pre-defined theories
are available and can be related to the researched topic. The author who is the creator of
knowledge takes the steps from theory to facts. In contrast to that, the inductive approach develops
theories based on data results which are a prerequisite for the development of the theory.
Knowledge is created by deriving general laws from individual cases.
Based on this, this paper takes neither a fully deductive nor inductive stance. A purely deductive
approach does not allow for flexibility and is too dependent on theory. Furthermore, it influences
the sampling and the operationalization of models that are built. There is a high risk that the
obtained results do not fit the reality which they are actually intending to describe (Arbnor &
Bjerke, 2008). Specifically, the classification of firm motivations is on a weak basis and induces
further discussions in the concluding remarks part. A combination of induction and deduction is
also suggested by Glaser and Strauss (1967) because suggested hypotheses are not only coming
from derived data but are systematically worked out in relation to the data during the course of
the research. This mixed approach is benefitting this thesis because the researched topic is
47
understudied. Few theories which are mainly developed in OECD countries do exist. Deriving
hypotheses on the impact of industry type or the motivational background on firm performance
is difficult, since only inconclusive results are existing (Advanced market acquisition) or no
research has been conducted on that field (Industry type, motivational background). In addition,
the chosen approach allows for freedom to adapt the focus of the analysis as the research
progresses in the final discussion and future research part. Overall, the mixed approach is
appropriate to gain new insights into an emerging research field such as event studies in emerging
markets since it allows to verify or falsify the suggested hypotheses and allows to derive a
statement to the economic validity but also provides the freedom to develop new hypotheses in
an untouched field of research.
Research strategies
The third layer of the research onion is dealing with various research strategies such as laboratory
experiments, surveys, in-depth interviews, case studies, grounded theories and archival research.
This thesis has chosen to apply the event study methodology in order to assess the performance
outcomes of advanced market acquisitions. Financial economists make frequently use of it by
specifying and testing interesting economic hypotheses (Kothari & Warner, 2007). It is of
quantitative nature and reflects a strong predictive validity in terms of value creation (Gubbi et
al., 2010). Furthermore, I conduct archival research by collecting data with regards to the firm
motivation classification. Thus, I follow Eisenhardts (1989) approach that the combination of
quantitative and qualitative data in emerging market is useful in yielding relevant, novel and
reliable results.
Research choices
This thesis takes a mixed method approach by using quantitative and qualitative research methods
in the process of the study. Data is collected and is afterwards analyzed with the event study
methodology. The quantitative research method dominates. However, by combining both types
of research on the firm classification, the limitations of each individual method is offset and gaps
of data can be filled and predicted.
Time horizons
The fifth layer requires the selection of a time horizon. There are only two time horizons: cross–
sectional, which is a short-term study, and longitudinal which is research carried out over a longer
period of time. This study is cross-sectional since it investigates the short-term effect of an
acquisition announcement on the return of the firm. In total, 72 firms are investigated over a short
event window.
48
Techniques and procedures
The nucleus of the research onion, the data collection and the analysis is dealt with in section 4.2
to 4.5
To sum up, the research design of this thesis consists of three core elements. Firstly, this thesis is
using a quantitative approach in which stock reactions to the announcement of acquisitions are
investigated and the performances are interpreted. Secondly, the thesis takes a value free
objectively stance which is solely based on facts of the reality where the social world is external.
Thirdly, this study uses a combination of deduction and induction since it provides flexibility
during the course of the research.
4.2 Data collection
Data for this research has been collected from several resources which are available at
Copenhagen Business School. Financial data to merger and acquisition announcements stems
from Zephyr, Thomson One Banker, Datastream and Bloomberg. Additionally, the author also
made use of reliable sources from the internet like Yahoo Finance and BSEIndia in order to
counter-check the provided data. The researcher was fortunate to get additional access through
the Indian Institute of Management Calcutta on further studies that are dealing with the topic.
However, obtaining and qualifying the data took some time in order to conduct the study. In total
72 Excel sheets have been created wherein stock prices and the respective benchmarks have been
adjusted and regressed for each firm.
The database has been collected in the following way before being supplied for this study. Since
the purpose of this study is to investigate the abnormal shareholder return, only listed acquiring
companies have been filtered. While this procedure precludes privately held and unlisted
acquiring firms, target firms are not affected in any way. The classification yielded 271.524 firms
as can be seen in Table 6. Further, the deal status is set as completed and the deal type is a full
acquisition. This means a 100% majority stake in the target firm, since the results are supposedly
more expressive. (Gubbi et al, 2010).
Afterwards, the period of the merging activities has been chosen, which is aimed at gathering the
most recent data and therefore considers the research window from January 1, 2010 until the end
of June 1, 2015. As the aim is to consider advanced market acquisition, I filtered for target firms
that are stemming from OECD countries. As mentioned earlier, they are classified as being
advanced and hence represent the “upper” market.
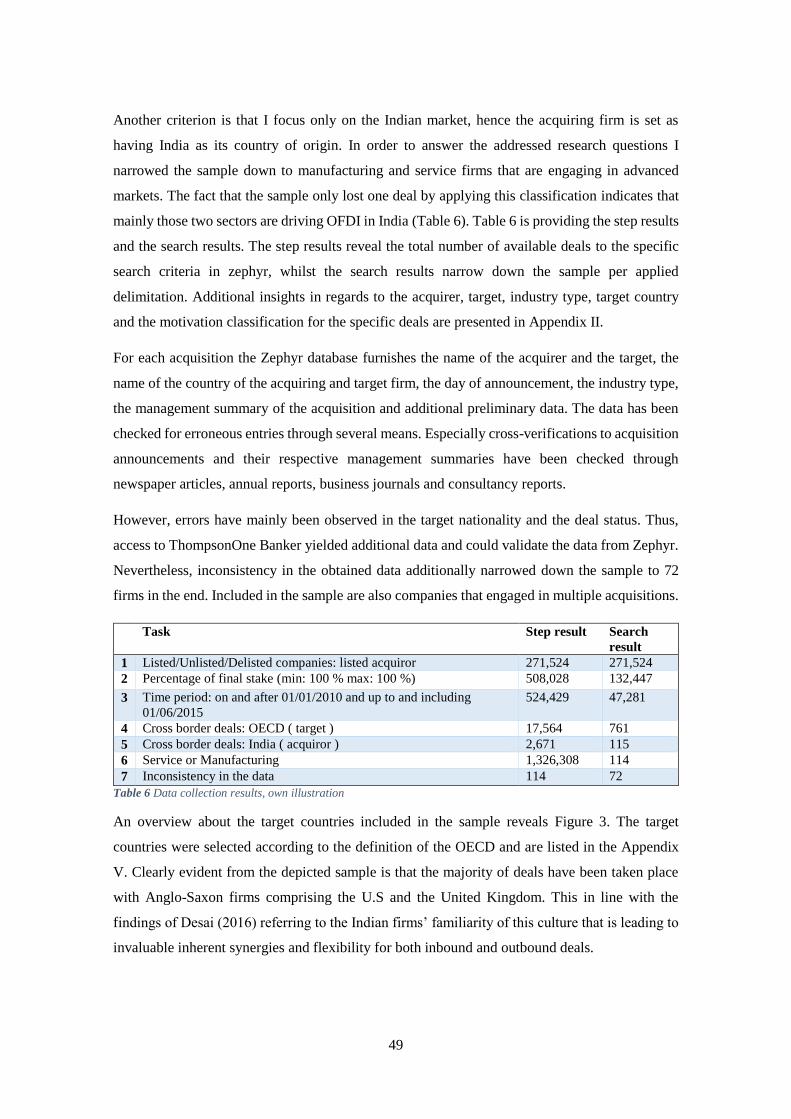
49
Another criterion is that I focus only on the Indian market, hence the acquiring firm is set as
having India as its country of origin. In order to answer the addressed research questions I
narrowed the sample down to manufacturing and service firms that are engaging in advanced
markets. The fact that the sample only lost one deal by applying this classification indicates that
mainly those two sectors are driving OFDI in India (Table 6). Table 6 is providing the step results
and the search results. The step results reveal the total number of available deals to the specific
search criteria in zephyr, whilst the search results narrow down the sample per applied
delimitation. Additional insights in regards to the acquirer, target, industry type, target country
and the motivation classification for the specific deals are presented in Appendix II.
For each acquisition the Zephyr database furnishes the name of the acquirer and the target, the
name of the country of the acquiring and target firm, the day of announcement, the industry type,
the management summary of the acquisition and additional preliminary data. The data has been
checked for erroneous entries through several means. Especially cross-verifications to acquisition
announcements and their respective management summaries have been checked through
newspaper articles, annual reports, business journals and consultancy reports.
However, errors have mainly been observed in the target nationality and the deal status. Thus,
access to ThompsonOne Banker yielded additional data and could validate the data from Zephyr.
Nevertheless, inconsistency in the obtained data additionally narrowed down the sample to 72
firms in the end. Included in the sample are also companies that engaged in multiple acquisitions.
Task Step result Search
result
1 Listed/Unlisted/Delisted companies: listed acquiror 271,524 271,524
2 Percentage of final stake (min: 100 % max: 100 %) 508,028 132,447
3 Time period: on and after 01/01/2010 and up to and including
01/06/2015
524,429 47,281
4 Cross border deals: OECD ( target ) 17,564 761
5 Cross border deals: India ( acquiror ) 2,671 115
6 Service or Manufacturing 1,326,308 114
7 Inconsistency in the data 114 72
Table 6 Data collection results, own illustration
An overview about the target countries included in the sample reveals Figure 3. The target
countries were selected according to the definition of the OECD and are listed in the Appendix
V. Clearly evident from the depicted sample is that the majority of deals have been taken place
with Anglo-Saxon firms comprising the U.S and the United Kingdom. This in line with the
findings of Desai (2016) referring to the Indian firms’ familiarity of this culture that is leading to
invaluable inherent synergies and flexibility for both inbound and outbound deals.
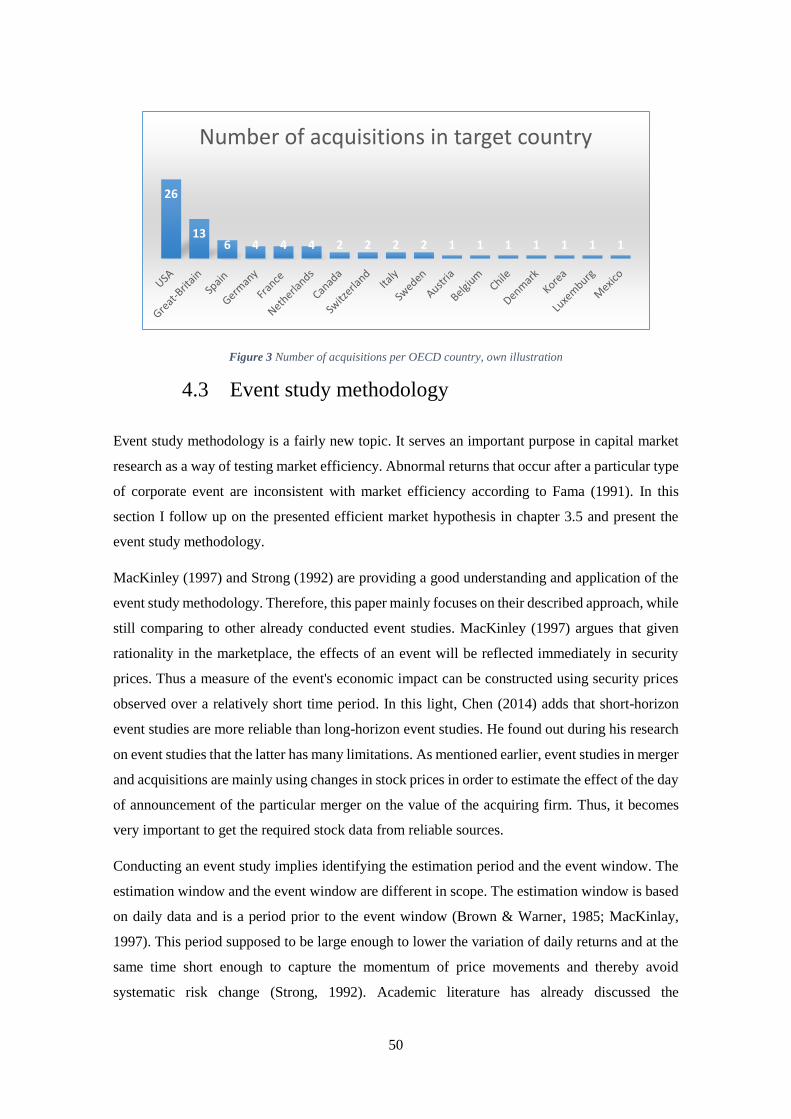
50
Figure 3 Number of acquisitions per OECD country, own illustration
4.3 Event study methodology
Event study methodology is a fairly new topic. It serves an important purpose in capital market
research as a way of testing market efficiency. Abnormal returns that occur after a particular type
of corporate event are inconsistent with market efficiency according to Fama (1991). In this
section I follow up on the presented efficient market hypothesis in chapter 3.5 and present the
event study methodology.
MacKinley (1997) and Strong (1992) are providing a good understanding and application of the
event study methodology. Therefore, this paper mainly focuses on their described approach, while
still comparing to other already conducted event studies. MacKinley (1997) argues that given
rationality in the marketplace, the effects of an event will be reflected immediately in security
prices. Thus a measure of the event's economic impact can be constructed using security prices
observed over a relatively short time period. In this light, Chen (2014) adds that short-horizon
event studies are more reliable than long-horizon event studies. He found out during his research
on event studies that the latter has many limitations. As mentioned earlier, event studies in merger
and acquisitions are mainly using changes in stock prices in order to estimate the effect of the day
of announcement of the particular merger on the value of the acquiring firm. Thus, it becomes
very important to get the required stock data from reliable sources.
Conducting an event study implies identifying the estimation period and the event window. The
estimation window and the event window are different in scope. The estimation window is based
on daily data and is a period prior to the event window (Brown & Warner, 1985; MacKinlay,
1997). This period supposed to be large enough to lower the variation of daily returns and at the
same time short enough to capture the momentum of price movements and thereby avoid
systematic risk change (Strong, 1992). Academic literature has already discussed the
26
136 4 4 4 2 2 2 2 1 1 1 1 1 1 1
Number of acquisitions in target country
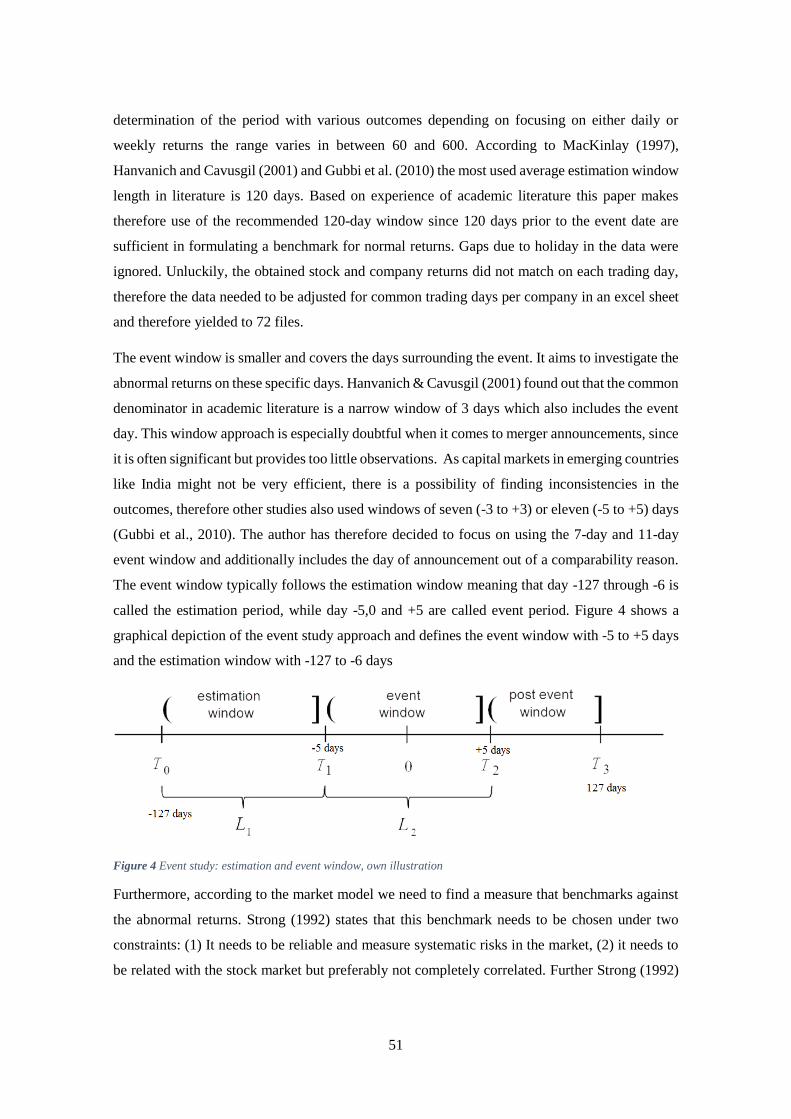
51
determination of the period with various outcomes depending on focusing on either daily or
weekly returns the range varies in between 60 and 600. According to MacKinlay (1997),
Hanvanich and Cavusgil (2001) and Gubbi et al. (2010) the most used average estimation window
length in literature is 120 days. Based on experience of academic literature this paper makes
therefore use of the recommended 120-day window since 120 days prior to the event date are
sufficient in formulating a benchmark for normal returns. Gaps due to holiday in the data were
ignored. Unluckily, the obtained stock and company returns did not match on each trading day,
therefore the data needed to be adjusted for common trading days per company in an excel sheet
and therefore yielded to 72 files.
The event window is smaller and covers the days surrounding the event. It aims to investigate the
abnormal returns on these specific days. Hanvanich & Cavusgil (2001) found out that the common
denominator in academic literature is a narrow window of 3 days which also includes the event
day. This window approach is especially doubtful when it comes to merger announcements, since
it is often significant but provides too little observations. As capital markets in emerging countries
like India might not be very efficient, there is a possibility of finding inconsistencies in the
outcomes, therefore other studies also used windows of seven (-3 to +3) or eleven (-5 to +5) days
(Gubbi et al., 2010). The author has therefore decided to focus on using the 7-day and 11-day
event window and additionally includes the day of announcement out of a comparability reason.
The event window typically follows the estimation window meaning that day -127 through -6 is
called the estimation period, while day -5,0 and +5 are called event period. Figure 4 shows a
graphical depiction of the event study approach and defines the event window with -5 to +5 days
and the estimation window with -127 to -6 days
Figure 4 Event study: estimation and event window, own illustration
Furthermore, according to the market model we need to find a measure that benchmarks against
the abnormal returns. Strong (1992) states that this benchmark needs to be chosen under two
constraints: (1) It needs to be reliable and measure systematic risks in the market, (2) it needs to
be related with the stock market but preferably not completely correlated. Further Strong (1992)
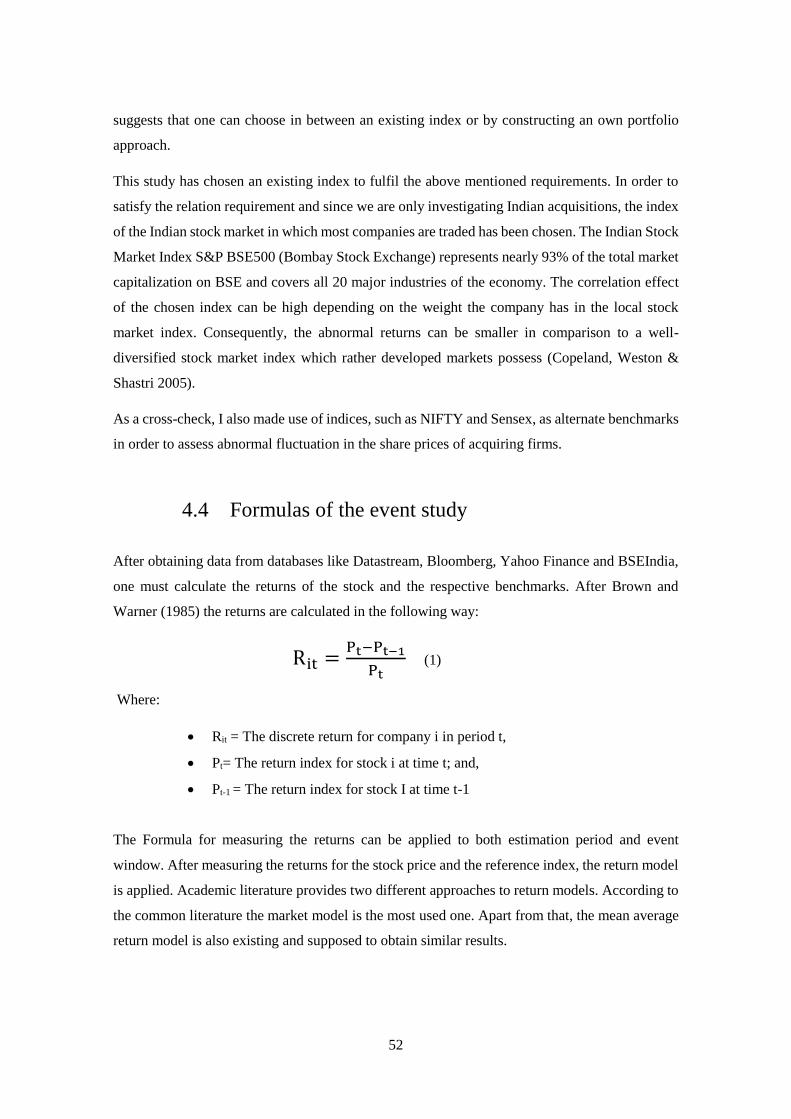
52
suggests that one can choose in between an existing index or by constructing an own portfolio
approach.
This study has chosen an existing index to fulfil the above mentioned requirements. In order to
satisfy the relation requirement and since we are only investigating Indian acquisitions, the index
of the Indian stock market in which most companies are traded has been chosen. The Indian Stock
Market Index S&P BSE500 (Bombay Stock Exchange) represents nearly 93% of the total market
capitalization on BSE and covers all 20 major industries of the economy. The correlation effect
of the chosen index can be high depending on the weight the company has in the local stock
market index. Consequently, the abnormal returns can be smaller in comparison to a well-
diversified stock market index which rather developed markets possess (Copeland, Weston &
Shastri 2005).
As a cross-check, I also made use of indices, such as NIFTY and Sensex, as alternate benchmarks
in order to assess abnormal fluctuation in the share prices of acquiring firms.
4.4 Formulas of the event study
After obtaining data from databases like Datastream, Bloomberg, Yahoo Finance and BSEIndia,
one must calculate the returns of the stock and the respective benchmarks. After Brown and
Warner (1985) the returns are calculated in the following way:
Rit =Pt−Pt−1
Pt (1)
Where:
Rit = The discrete return for company i in period t,
Pt= The return index for stock i at time t; and,
Pt-1 = The return index for stock I at time t-1
The Formula for measuring the returns can be applied to both estimation period and event
window. After measuring the returns for the stock price and the reference index, the return model
is applied. Academic literature provides two different approaches to return models. According to
the common literature the market model is the most used one. Apart from that, the mean average
return model is also existing and supposed to obtain similar results.

53
This paper is focusing on the most commonly used market model. As can be seen from Formula
2, the model contains a unique risk component (αi) and a systemic risk component (βi). These two
components explain the realized returns of the stock by the intercept with the Y-axis (α) and the
slope of the regression (β). The regression is estimated by using ordinary least squares (OLS).
After obtaining the returns from Formula 1, the realized returns of the stock are regressed against
the returns of the stock index using OLS. The two components α and β explain the realized returns
of the stock by the intercept with the Y-axis (α) and the slope of the regression (β).
Rit = β0 + β1X1 (2)
Where: Rit is the realized return of stock i at time t, β0 is the intercept with the Y-axis (α), and β1
is the slope of the individual variable (β). X1 is the variable itself (the market return).
In order to find the expected return, the output from the alpha and beta components from Formula
2 are used in combination with the realized returns of the market for each day in the event window
as can be seen in Formula 3.
E(Rit ) = αi + βiRmt (3)
Where: E (Rit) is the expected return on security i at time t,
Rmt is the realized return of the benchmark index at time t
Since the goal is to find the abnormal return, the results from Formula 1 and 3 can now be used
in order obtain the required return. As one can see in Formula 4, the expected return is subtracted
from the realized return.
εit = Rit − E(Rit) (4)
By combining Formula 3 and 4 one can convert it into a market model realized return Formula
that puts the realized returns into context.
Rit = αi + βiRmt + εit (5)
Where: Rit is the realized return on security I at time t, Rmt is the realized return of the benchmark
index at time t, εit is the error term which represents the abnormal return
The error term in Formula 5 represents the abnormal return which has already been calculated in
Formula 4. Therefore, the abnormal return is the difference in between expected and realized
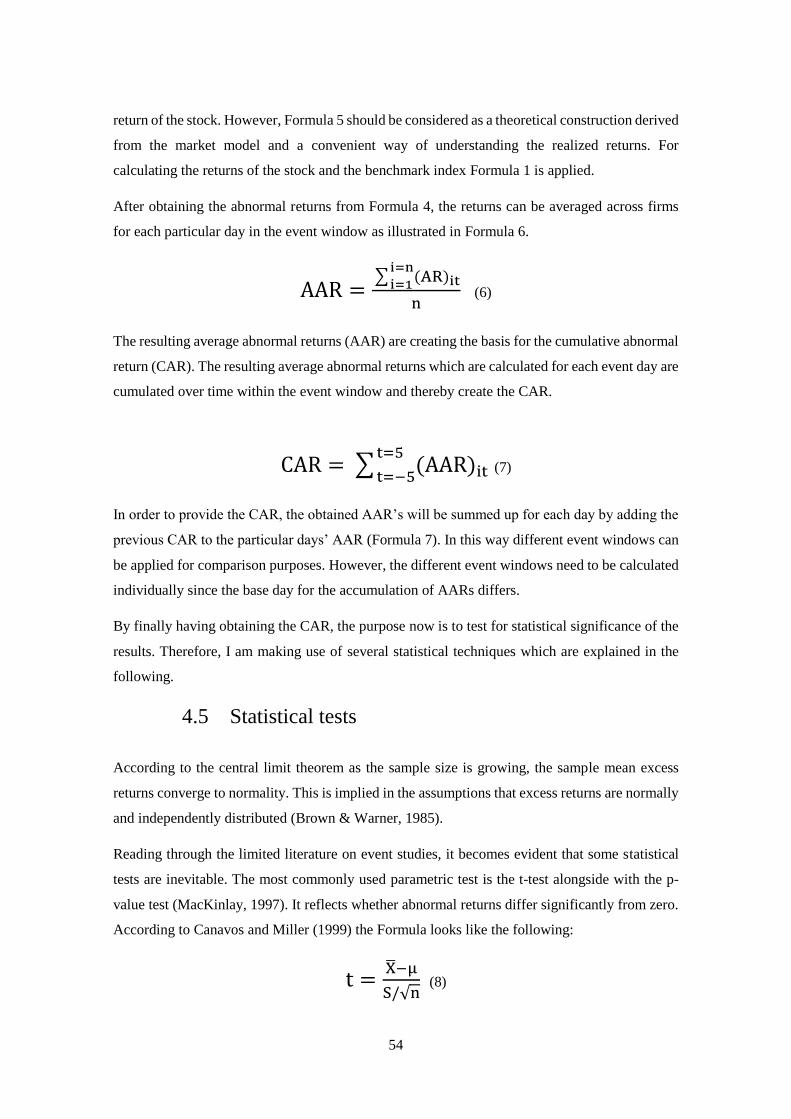
54
return of the stock. However, Formula 5 should be considered as a theoretical construction derived
from the market model and a convenient way of understanding the realized returns. For
calculating the returns of the stock and the benchmark index Formula 1 is applied.
After obtaining the abnormal returns from Formula 4, the returns can be averaged across firms
for each particular day in the event window as illustrated in Formula 6.
AAR =∑ (AR)it
i=n
i=1
n (6)
The resulting average abnormal returns (AAR) are creating the basis for the cumulative abnormal
return (CAR). The resulting average abnormal returns which are calculated for each event day are
cumulated over time within the event window and thereby create the CAR.
CAR = ∑ (AAR)itt=5
t=−5 (7)
In order to provide the CAR, the obtained AAR’s will be summed up for each day by adding the
previous CAR to the particular days’ AAR (Formula 7). In this way different event windows can
be applied for comparison purposes. However, the different event windows need to be calculated
individually since the base day for the accumulation of AARs differs.
By finally having obtaining the CAR, the purpose now is to test for statistical significance of the
results. Therefore, I am making use of several statistical techniques which are explained in the
following.
4.5 Statistical tests
According to the central limit theorem as the sample size is growing, the sample mean excess
returns converge to normality. This is implied in the assumptions that excess returns are normally
and independently distributed (Brown & Warner, 1985).
Reading through the limited literature on event studies, it becomes evident that some statistical
tests are inevitable. The most commonly used parametric test is the t-test alongside with the p-
value test (MacKinlay, 1997). It reflects whether abnormal returns differ significantly from zero.
According to Canavos and Miller (1999) the Formula looks like the following:
t =X̅−μ
S/√n (8)
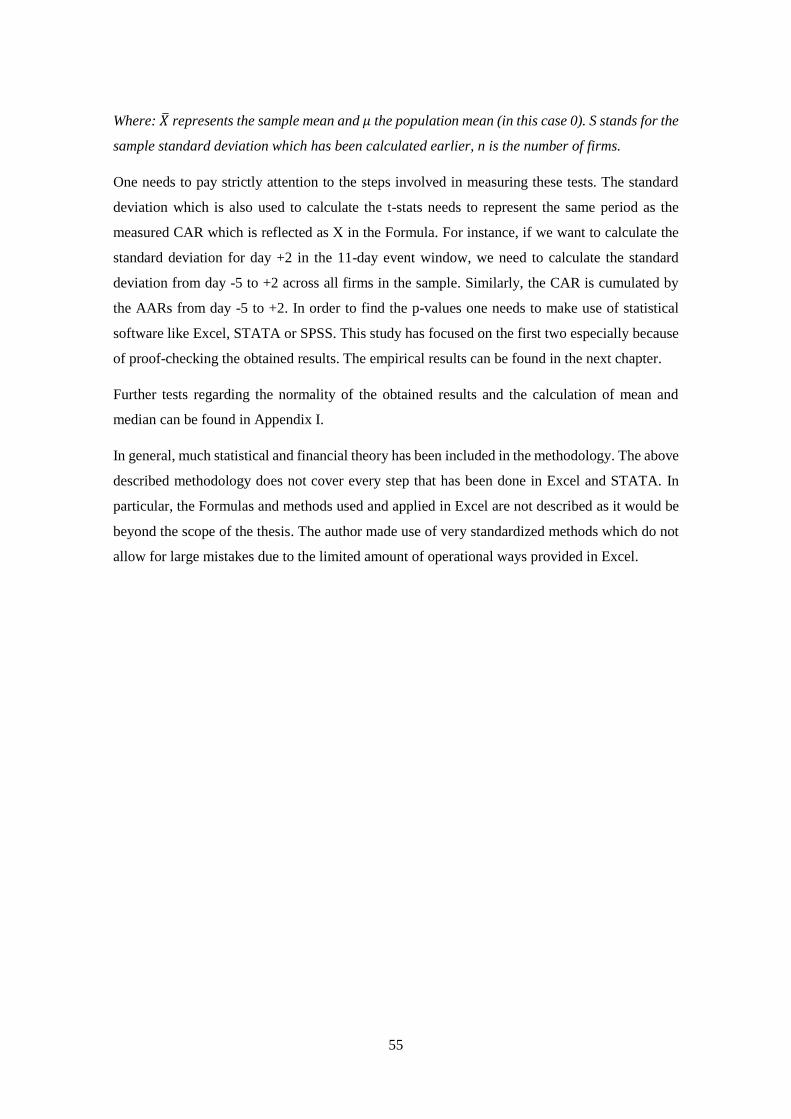
55
Where: �̅� represents the sample mean and 𝜇 the population mean (in this case 0). S stands for the
sample standard deviation which has been calculated earlier, n is the number of firms.
One needs to pay strictly attention to the steps involved in measuring these tests. The standard
deviation which is also used to calculate the t-stats needs to represent the same period as the
measured CAR which is reflected as X in the Formula. For instance, if we want to calculate the
standard deviation for day +2 in the 11-day event window, we need to calculate the standard
deviation from day -5 to +2 across all firms in the sample. Similarly, the CAR is cumulated by
the AARs from day -5 to +2. In order to find the p-values one needs to make use of statistical
software like Excel, STATA or SPSS. This study has focused on the first two especially because
of proof-checking the obtained results. The empirical results can be found in the next chapter.
Further tests regarding the normality of the obtained results and the calculation of mean and
median can be found in Appendix I.
In general, much statistical and financial theory has been included in the methodology. The above
described methodology does not cover every step that has been done in Excel and STATA. In
particular, the Formulas and methods used and applied in Excel are not described as it would be
beyond the scope of the thesis. The author made use of very standardized methods which do not
allow for large mistakes due to the limited amount of operational ways provided in Excel.
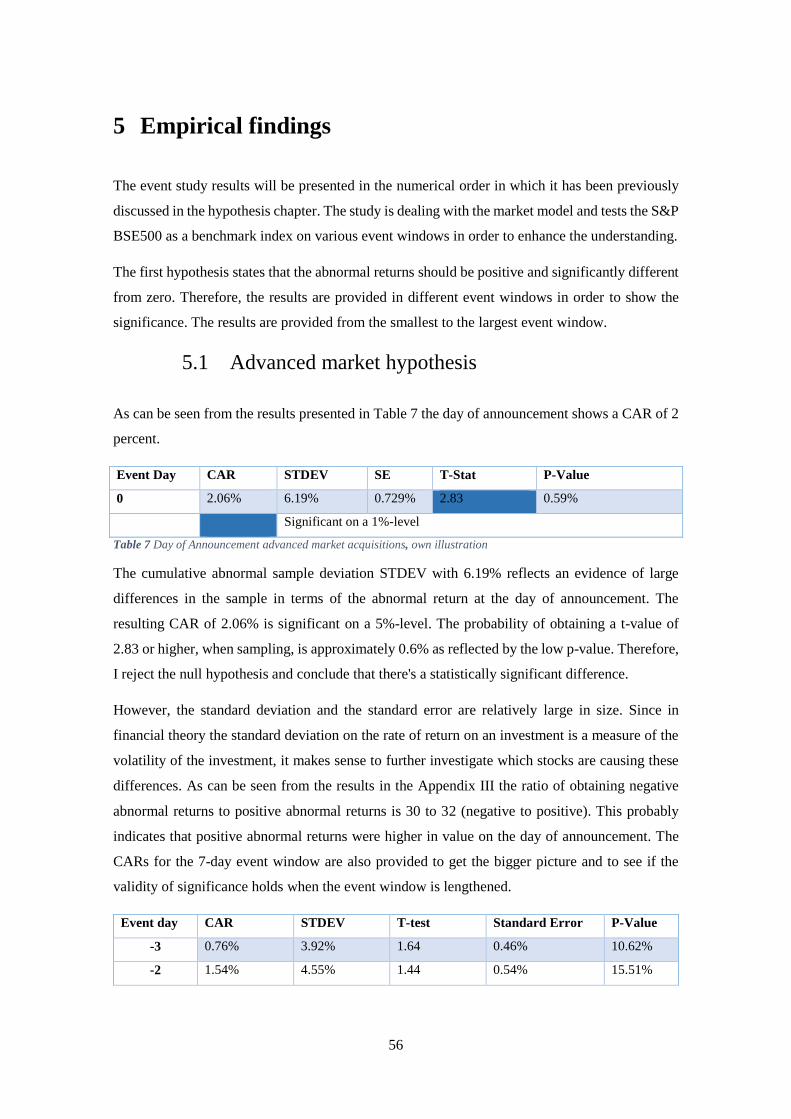
56
5 Empirical findings
The event study results will be presented in the numerical order in which it has been previously
discussed in the hypothesis chapter. The study is dealing with the market model and tests the S&P
BSE500 as a benchmark index on various event windows in order to enhance the understanding.
The first hypothesis states that the abnormal returns should be positive and significantly different
from zero. Therefore, the results are provided in different event windows in order to show the
significance. The results are provided from the smallest to the largest event window.
5.1 Advanced market hypothesis
As can be seen from the results presented in Table 7 the day of announcement shows a CAR of 2
percent.
Event Day CAR STDEV SE T-Stat P-Value
0 2.06% 6.19% 0.729% 2.83 0.59%
Significant on a 1%-level
Table 7 Day of Announcement advanced market acquisitions, own illustration
The cumulative abnormal sample deviation STDEV with 6.19% reflects an evidence of large
differences in the sample in terms of the abnormal return at the day of announcement. The
resulting CAR of 2.06% is significant on a 5%-level. The probability of obtaining a t-value of
2.83 or higher, when sampling, is approximately 0.6% as reflected by the low p-value. Therefore,
I reject the null hypothesis and conclude that there's a statistically significant difference.
However, the standard deviation and the standard error are relatively large in size. Since in
financial theory the standard deviation on the rate of return on an investment is a measure of the
volatility of the investment, it makes sense to further investigate which stocks are causing these
differences. As can be seen from the results in the Appendix III the ratio of obtaining negative
abnormal returns to positive abnormal returns is 30 to 32 (negative to positive). This probably
indicates that positive abnormal returns were higher in value on the day of announcement. The
CARs for the 7-day event window are also provided to get the bigger picture and to see if the
validity of significance holds when the event window is lengthened.
Event day CAR STDEV T-test Standard Error P-Value
-3 0.76% 3.92% 1.64 0.46% 10.62%
-2 1.54% 4.55% 1.44 0.54% 15.51%

57
-1 2.48% 5.04% 1.39 0.59% 16.82%
0 4.55% 5.37% 1.80 0.63% 7.64%
1 6.78% 5.60% 2.06 0.66% 4.35%
2 9.40% 6.02% 2.21 0.71% 3.05%
3 11.74% 6.43% 2.21 0.76% 3.01%
Significant on a 5%-level
Table 8 7-day event window advanced market acquisitions, own illustration
As can be seen in Table 8 the CAR is increasing by a large number following the day of
announcement. The day of announcement itself in the 7-day event window is not significant
anymore in comparison to the single day event window (Table 8). From the day of announcement
onwards, the abnormal returns are all significant. Since the abnormal returns before the day of
announcement and after the day of announcement are increasing, it provides a hint to prior leakage
of information or a lag of information. In order to account for these increases and to see if returns
are diminishing the event window is expanded to 11 days (Table 9).
Event day CAR STDEV T-Test Standard Error P-Value
-5 0.34% 2.26% 1.2752 0.27% 20.64%
-4 1.12% 2.78% 1.7001 0.33% 9.35%
-3 1.87% 3.20% 1.6542 0.38% 10.25%
-2 2.66% 3.77% 1.4963 0.44% 13.90%
-1 3.60% 4.28% 1.4262 0.50% 15.82%
0 5.66% 4.67% 1.7146 0.55% 9.08%
1 7.89% 4.97% 2.7854 0.59% 0.68%
2 10.52% 5.41% 2.0611 0.64% 4.29%
3 12.86% 5.84% 2.0768 0.69% 4.14%
4 14.86% 6.26% 2.0129 0.74% 4.79%
5 16.81% 6.72% 1.9299 0.79% 5.76%
Significant on a 5%-level
Table 9 11-day event window advanced market acquisition, own illustration
The trend of rising CARs is continuing and shows significant cumulative abnormal returns
following the day of announcement on a 5%-level. The CAR on the 7-day event window reaches
11.74%, while having a p-value of 3.01%. In contrast, the CAR on the 11-day window is having
a CAR of 16.81% with a p-value of 5.76%. Both numbers are having low p-values but only the
7-day window can claim to be statistically significant since it is below the 5% threshold. In order
to display the findings and to better understand both development paths of the CAR, the outcomes
are revealed in the following figures for both windows (Figure 5 & Figure 6).
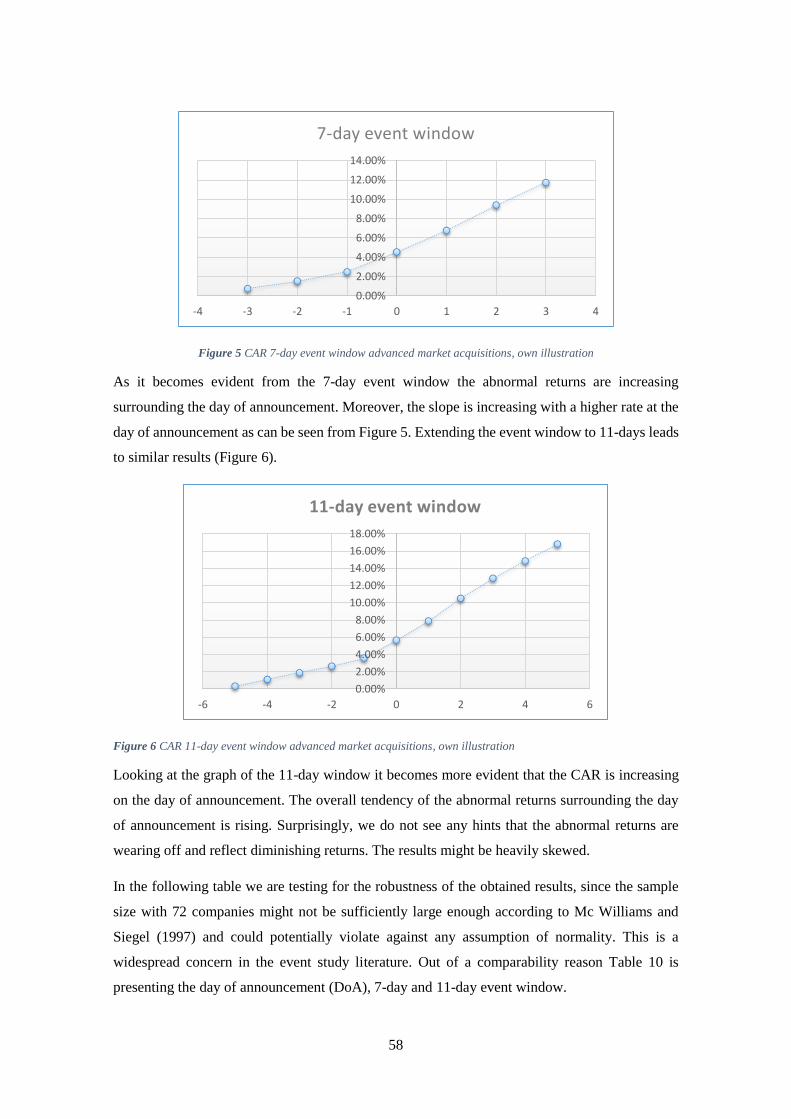
58
Figure 5 CAR 7-day event window advanced market acquisitions, own illustration
As it becomes evident from the 7-day event window the abnormal returns are increasing
surrounding the day of announcement. Moreover, the slope is increasing with a higher rate at the
day of announcement as can be seen from Figure 5. Extending the event window to 11-days leads
to similar results (Figure 6).
Figure 6 CAR 11-day event window advanced market acquisitions, own illustration
Looking at the graph of the 11-day window it becomes more evident that the CAR is increasing
on the day of announcement. The overall tendency of the abnormal returns surrounding the day
of announcement is rising. Surprisingly, we do not see any hints that the abnormal returns are
wearing off and reflect diminishing returns. The results might be heavily skewed.
In the following table we are testing for the robustness of the obtained results, since the sample
size with 72 companies might not be sufficiently large enough according to Mc Williams and
Siegel (1997) and could potentially violate against any assumption of normality. This is a
widespread concern in the event study literature. Out of a comparability reason Table 10 is
presenting the day of announcement (DoA), 7-day and 11-day event window.
0.00%
2.00%
4.00%
6.00%
8.00%
10.00%
12.00%
14.00%
-4 -3 -2 -1 0 1 2 3 4
7-day event window
0.00%
2.00%
4.00%
6.00%
8.00%
10.00%
12.00%
14.00%
16.00%
18.00%
-6 -4 -2 0 2 4 6
11-day event window
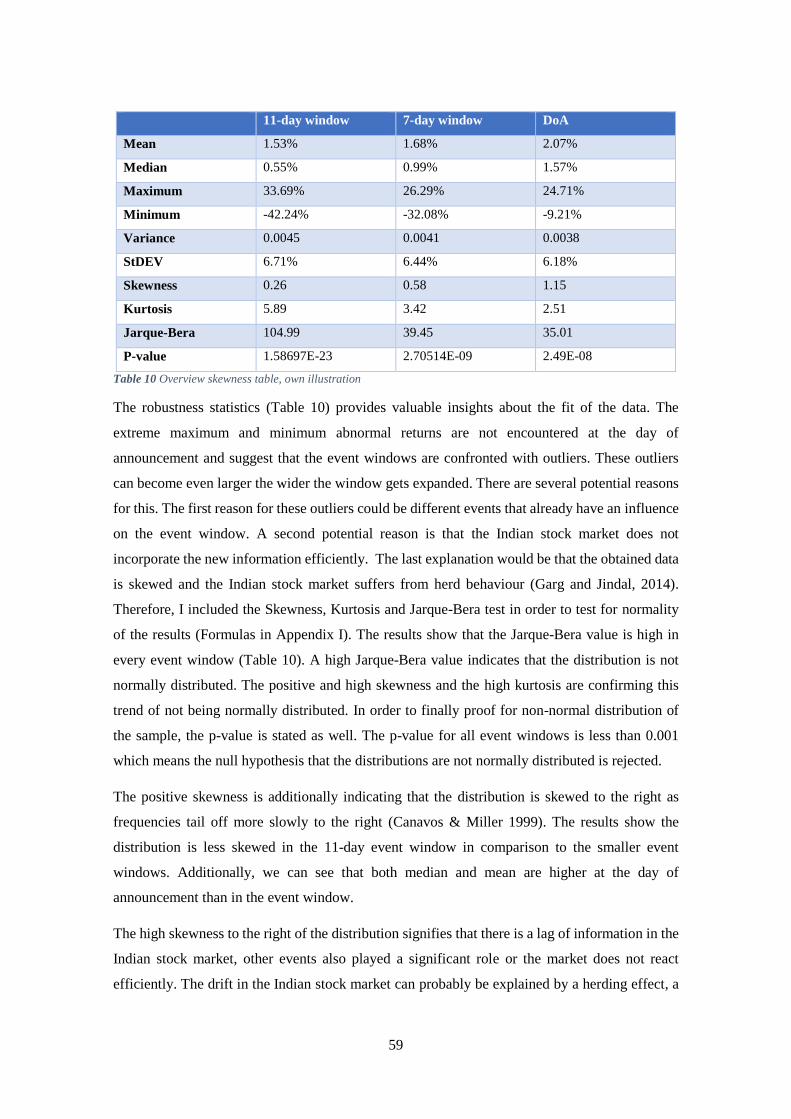
59
11-day window 7-day window DoA
Mean 1.53% 1.68% 2.07%
Median 0.55% 0.99% 1.57%
Maximum 33.69% 26.29% 24.71%
Minimum -42.24% -32.08% -9.21%
Variance 0.0045 0.0041 0.0038
StDEV 6.71% 6.44% 6.18%
Skewness 0.26 0.58 1.15
Kurtosis 5.89 3.42 2.51
Jarque-Bera 104.99 39.45 35.01
P-value 1.58697E-23 2.70514E-09 2.49E-08
Table 10 Overview skewness table, own illustration
The robustness statistics (Table 10) provides valuable insights about the fit of the data. The
extreme maximum and minimum abnormal returns are not encountered at the day of
announcement and suggest that the event windows are confronted with outliers. These outliers
can become even larger the wider the window gets expanded. There are several potential reasons
for this. The first reason for these outliers could be different events that already have an influence
on the event window. A second potential reason is that the Indian stock market does not
incorporate the new information efficiently. The last explanation would be that the obtained data
is skewed and the Indian stock market suffers from herd behaviour (Garg and Jindal, 2014).
Therefore, I included the Skewness, Kurtosis and Jarque-Bera test in order to test for normality
of the results (Formulas in Appendix I). The results show that the Jarque-Bera value is high in
every event window (Table 10). A high Jarque-Bera value indicates that the distribution is not
normally distributed. The positive and high skewness and the high kurtosis are confirming this
trend of not being normally distributed. In order to finally proof for non-normal distribution of
the sample, the p-value is stated as well. The p-value for all event windows is less than 0.001
which means the null hypothesis that the distributions are not normally distributed is rejected.
The positive skewness is additionally indicating that the distribution is skewed to the right as
frequencies tail off more slowly to the right (Canavos & Miller 1999). The results show the
distribution is less skewed in the 11-day event window in comparison to the smaller event
windows. Additionally, we can see that both median and mean are higher at the day of
announcement than in the event window.
The high skewness to the right of the distribution signifies that there is a lag of information in the
Indian stock market, other events also played a significant role or the market does not react
efficiently. The drift in the Indian stock market can probably be explained by a herding effect, a
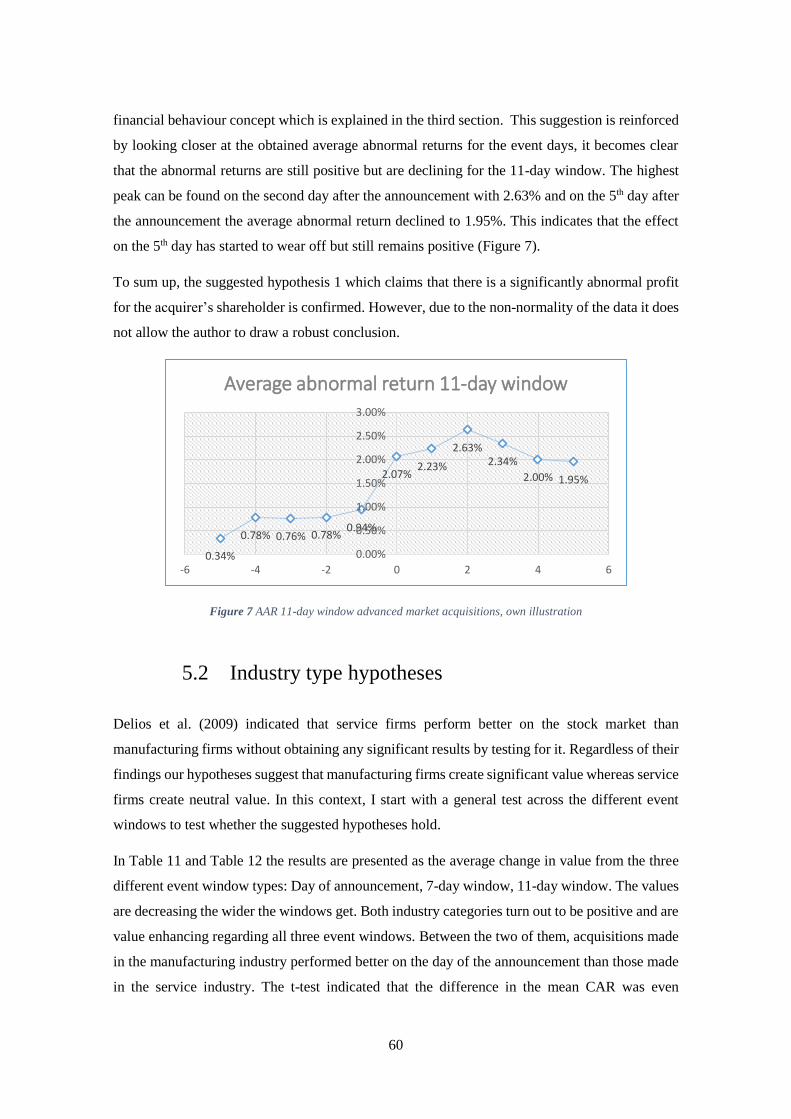
60
financial behaviour concept which is explained in the third section. This suggestion is reinforced
by looking closer at the obtained average abnormal returns for the event days, it becomes clear
that the abnormal returns are still positive but are declining for the 11-day window. The highest
peak can be found on the second day after the announcement with 2.63% and on the 5th day after
the announcement the average abnormal return declined to 1.95%. This indicates that the effect
on the 5th day has started to wear off but still remains positive (Figure 7).
To sum up, the suggested hypothesis 1 which claims that there is a significantly abnormal profit
for the acquirer’s shareholder is confirmed. However, due to the non-normality of the data it does
not allow the author to draw a robust conclusion.
Figure 7 AAR 11-day window advanced market acquisitions, own illustration
5.2 Industry type hypotheses
Delios et al. (2009) indicated that service firms perform better on the stock market than
manufacturing firms without obtaining any significant results by testing for it. Regardless of their
findings our hypotheses suggest that manufacturing firms create significant value whereas service
firms create neutral value. In this context, I start with a general test across the different event
windows to test whether the suggested hypotheses hold.
In Table 11 and Table 12 the results are presented as the average change in value from the three
different event window types: Day of announcement, 7-day window, 11-day window. The values
are decreasing the wider the windows get. Both industry categories turn out to be positive and are
value enhancing regarding all three event windows. Between the two of them, acquisitions made
in the manufacturing industry performed better on the day of the announcement than those made
in the service industry. The t-test indicated that the difference in the mean CAR was even
0.34%
0.78% 0.76% 0.78%0.94%
2.07%2.23%
2.63%2.34%
2.00% 1.95%
0.00%
0.50%
1.00%
1.50%
2.00%
2.50%
3.00%
-6 -4 -2 0 2 4 6
Average abnormal return 11-day window
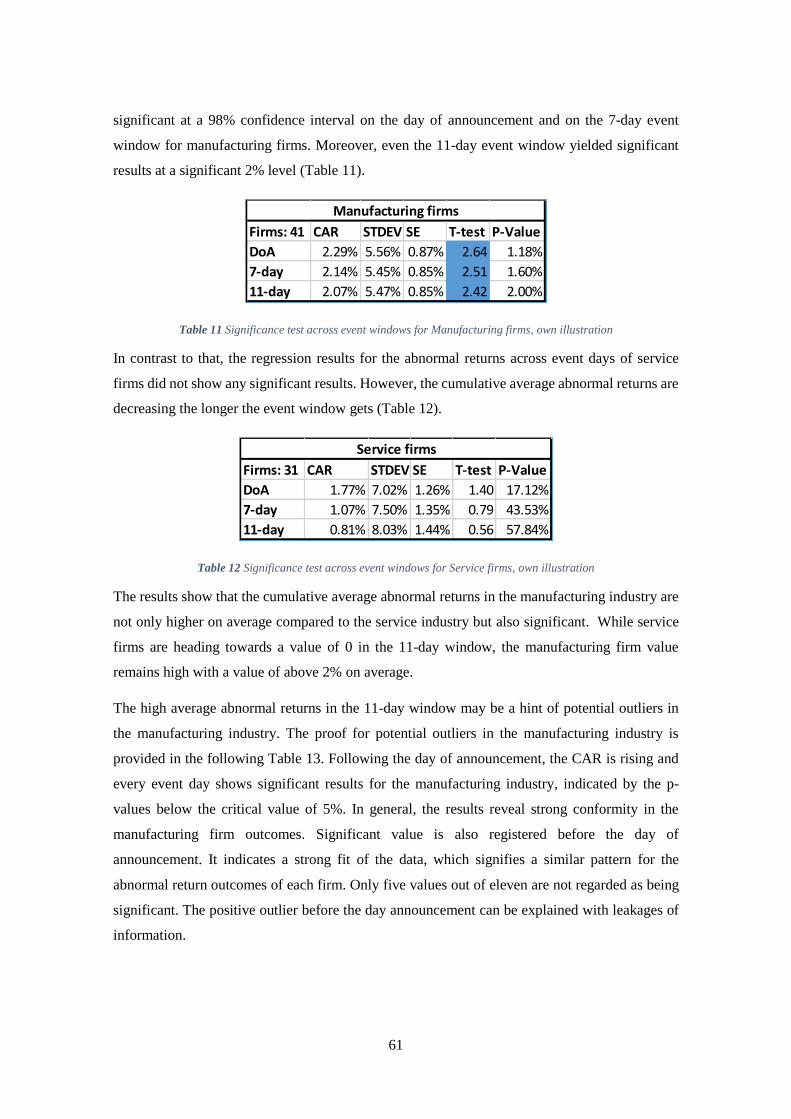
61
significant at a 98% confidence interval on the day of announcement and on the 7-day event
window for manufacturing firms. Moreover, even the 11-day event window yielded significant
results at a significant 2% level (Table 11).
Table 11 Significance test across event windows for Manufacturing firms, own illustration
In contrast to that, the regression results for the abnormal returns across event days of service
firms did not show any significant results. However, the cumulative average abnormal returns are
decreasing the longer the event window gets (Table 12).
Table 12 Significance test across event windows for Service firms, own illustration
The results show that the cumulative average abnormal returns in the manufacturing industry are
not only higher on average compared to the service industry but also significant. While service
firms are heading towards a value of 0 in the 11-day window, the manufacturing firm value
remains high with a value of above 2% on average.
The high average abnormal returns in the 11-day window may be a hint of potential outliers in
the manufacturing industry. The proof for potential outliers in the manufacturing industry is
provided in the following Table 13. Following the day of announcement, the CAR is rising and
every event day shows significant results for the manufacturing industry, indicated by the p-
values below the critical value of 5%. In general, the results reveal strong conformity in the
manufacturing firm outcomes. Significant value is also registered before the day of
announcement. It indicates a strong fit of the data, which signifies a similar pattern for the
abnormal return outcomes of each firm. Only five values out of eleven are not regarded as being
significant. The positive outlier before the day announcement can be explained with leakages of
information.
Firms: 41 CAR STDEV SE T-test P-Value
DoA 2.29% 5.56% 0.87% 2.64 1.18%
7-day 2.14% 5.45% 0.85% 2.51 1.60%
11-day 2.07% 5.47% 0.85% 2.42 2.00%
Manufacturing firms
Firms: 31 CAR STDEV SE T-test P-Value
DoA 1.77% 7.02% 1.26% 1.40 17.12%
7-day 1.07% 7.50% 1.35% 0.79 43.53%
11-day 0.81% 8.03% 1.44% 0.56 57.84%
Service firms
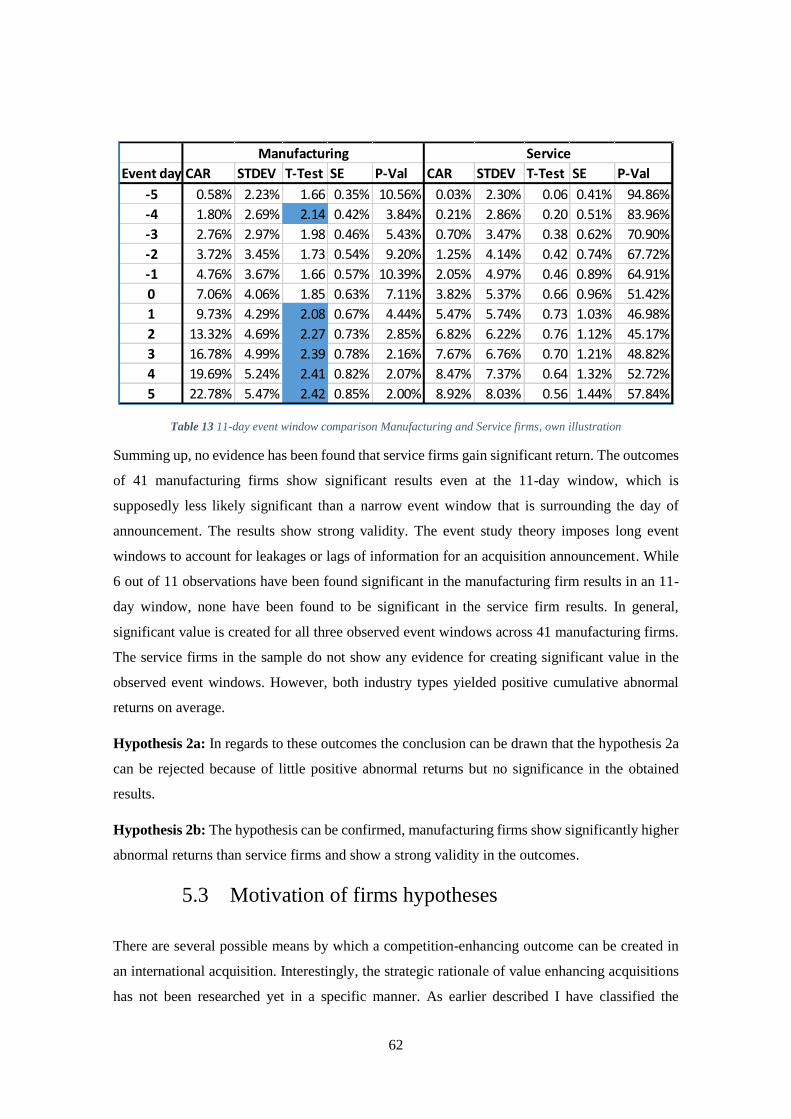
62
Table 13 11-day event window comparison Manufacturing and Service firms, own illustration
Summing up, no evidence has been found that service firms gain significant return. The outcomes
of 41 manufacturing firms show significant results even at the 11-day window, which is
supposedly less likely significant than a narrow event window that is surrounding the day of
announcement. The results show strong validity. The event study theory imposes long event
windows to account for leakages or lags of information for an acquisition announcement. While
6 out of 11 observations have been found significant in the manufacturing firm results in an 11-
day window, none have been found to be significant in the service firm results. In general,
significant value is created for all three observed event windows across 41 manufacturing firms.
The service firms in the sample do not show any evidence for creating significant value in the
observed event windows. However, both industry types yielded positive cumulative abnormal
returns on average.
Hypothesis 2a: In regards to these outcomes the conclusion can be drawn that the hypothesis 2a
can be rejected because of little positive abnormal returns but no significance in the obtained
results.
Hypothesis 2b: The hypothesis can be confirmed, manufacturing firms show significantly higher
abnormal returns than service firms and show a strong validity in the outcomes.
5.3 Motivation of firms hypotheses
There are several possible means by which a competition-enhancing outcome can be created in
an international acquisition. Interestingly, the strategic rationale of value enhancing acquisitions
has not been researched yet in a specific manner. As earlier described I have classified the
Event day CAR STDEV T-Test SE P-Val CAR STDEV T-Test SE P-Val
-5 0.58% 2.23% 1.66 0.35% 10.56% 0.03% 2.30% 0.06 0.41% 94.86%
-4 1.80% 2.69% 2.14 0.42% 3.84% 0.21% 2.86% 0.20 0.51% 83.96%
-3 2.76% 2.97% 1.98 0.46% 5.43% 0.70% 3.47% 0.38 0.62% 70.90%
-2 3.72% 3.45% 1.73 0.54% 9.20% 1.25% 4.14% 0.42 0.74% 67.72%
-1 4.76% 3.67% 1.66 0.57% 10.39% 2.05% 4.97% 0.46 0.89% 64.91%
0 7.06% 4.06% 1.85 0.63% 7.11% 3.82% 5.37% 0.66 0.96% 51.42%
1 9.73% 4.29% 2.08 0.67% 4.44% 5.47% 5.74% 0.73 1.03% 46.98%
2 13.32% 4.69% 2.27 0.73% 2.85% 6.82% 6.22% 0.76 1.12% 45.17%
3 16.78% 4.99% 2.39 0.78% 2.16% 7.67% 6.76% 0.70 1.21% 48.82%
4 19.69% 5.24% 2.41 0.82% 2.07% 8.47% 7.37% 0.64 1.32% 52.72%
5 22.78% 5.47% 2.42 0.85% 2.00% 8.92% 8.03% 0.56 1.44% 57.84%
Manufacturing Service
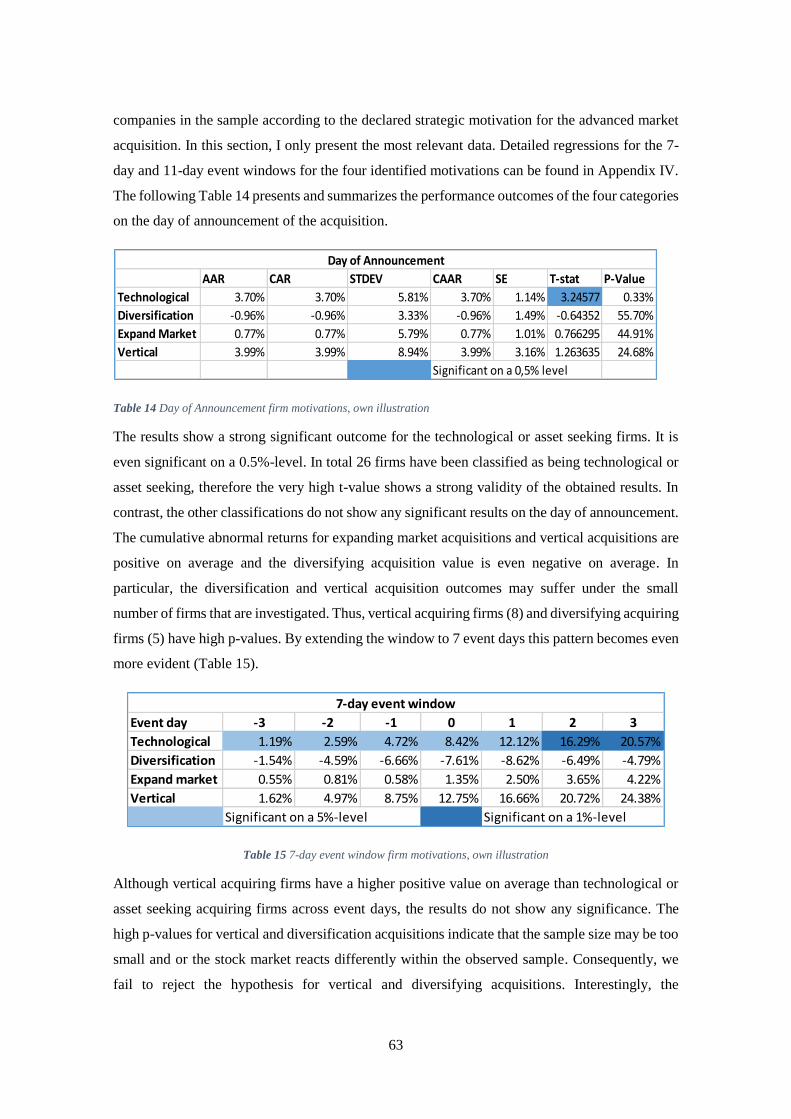
63
companies in the sample according to the declared strategic motivation for the advanced market
acquisition. In this section, I only present the most relevant data. Detailed regressions for the 7-
day and 11-day event windows for the four identified motivations can be found in Appendix IV.
The following Table 14 presents and summarizes the performance outcomes of the four categories
on the day of announcement of the acquisition.
Table 14 Day of Announcement firm motivations, own illustration
The results show a strong significant outcome for the technological or asset seeking firms. It is
even significant on a 0.5%-level. In total 26 firms have been classified as being technological or
asset seeking, therefore the very high t-value shows a strong validity of the obtained results. In
contrast, the other classifications do not show any significant results on the day of announcement.
The cumulative abnormal returns for expanding market acquisitions and vertical acquisitions are
positive on average and the diversifying acquisition value is even negative on average. In
particular, the diversification and vertical acquisition outcomes may suffer under the small
number of firms that are investigated. Thus, vertical acquiring firms (8) and diversifying acquiring
firms (5) have high p-values. By extending the window to 7 event days this pattern becomes even
more evident (Table 15).
Table 15 7-day event window firm motivations, own illustration
Although vertical acquiring firms have a higher positive value on average than technological or
asset seeking acquiring firms across event days, the results do not show any significance. The
high p-values for vertical and diversification acquisitions indicate that the sample size may be too
small and or the stock market reacts differently within the observed sample. Consequently, we
fail to reject the hypothesis for vertical and diversifying acquisitions. Interestingly, the
AAR CAR STDEV CAAR SE T-stat P-Value
Technological 3.70% 3.70% 5.81% 3.70% 1.14% 3.24577 0.33%
Diversification -0.96% -0.96% 3.33% -0.96% 1.49% -0.64352 55.70%
Expand Market 0.77% 0.77% 5.79% 0.77% 1.01% 0.766295 44.91%
Vertical 3.99% 3.99% 8.94% 3.99% 3.16% 1.263635 24.68%
Significant on a 0,5% level
Day of Announcement
Event day -3 -2 -1 0 1 2 3
Technological 1.19% 2.59% 4.72% 8.42% 12.12% 16.29% 20.57%
Diversification -1.54% -4.59% -6.66% -7.61% -8.62% -6.49% -4.79%
Expand market 0.55% 0.81% 0.58% 1.35% 2.50% 3.65% 4.22%
Vertical 1.62% 4.97% 8.75% 12.75% 16.66% 20.72% 24.38%
Significant on a 5%-level Significant on a 1%-level
7-day event window

64
diversifying acquiring firms obtain the most negative value on the day of announcement and the
day following the announcement. The expanding market acquiring firms indicate a slight value
enhancement following the day of announcement. Technological or asset seeking firms confirm
the previously suggested trend in the 7-day event window. Significant values can be observed on
each event day. In particular, the positive values on the 2nd and 3rd event day have a 99% chance
of being true (Table 15). In light of this, results for the 11-day window are also revealed in order
to confirm this trend and support the validity of the obtained results (Table 16).
Table 16 CAR 11-day window firm motivation, own illustration
The obtained results, confirm the earlier mentioned trend for technological or asset seeking firms.
Significant values are obtained for 8 out of 11 days of the event window. The strong validity of
the obtained results represents a rare feature in event study economics (Bruner, 2004). This is
further supported in the following figure. It depicts the path of CARs with regards to the firm
motivation.
Figure 8 CAR firm motivation, own illustration
Event day Vertical Expand Market Diversification Technological
-5 0.88% 0.15% 0.32% 0.41%
-4 1.85% 0.79% 0.06% 1.51%
-3 3.47% 1.34% -1.48% 2.70%
-2 6.82% 1.60% -4.53% 4.10%
-1 10.60% 1.37% -6.60% 6.23%
0 14.60% 2.14% -7.55% 9.93%
1 18.51% 3.29% -8.56% 13.63%
2 22.56% 4.44% -6.43% 17.79%
3 26.23% 5.01% -4.73% 22.08%
4 29.31% 5.44% -3.67% 25.93%
5 31.89% 5.86% -2.81% 29.84%
Significant on a 5% level
Cumulative abnormal return 11-day window
-20.00%
-10.00%
0.00%
10.00%
20.00%
30.00%
40.00%
-5 -4 -3 -2 -1 0 1 2 3 4 5
Cu
mu
lati
ve a
bn
orm
al r
eetu
rn
Event day
Firm Motivation
Vertical Expand Market Diversification Technological
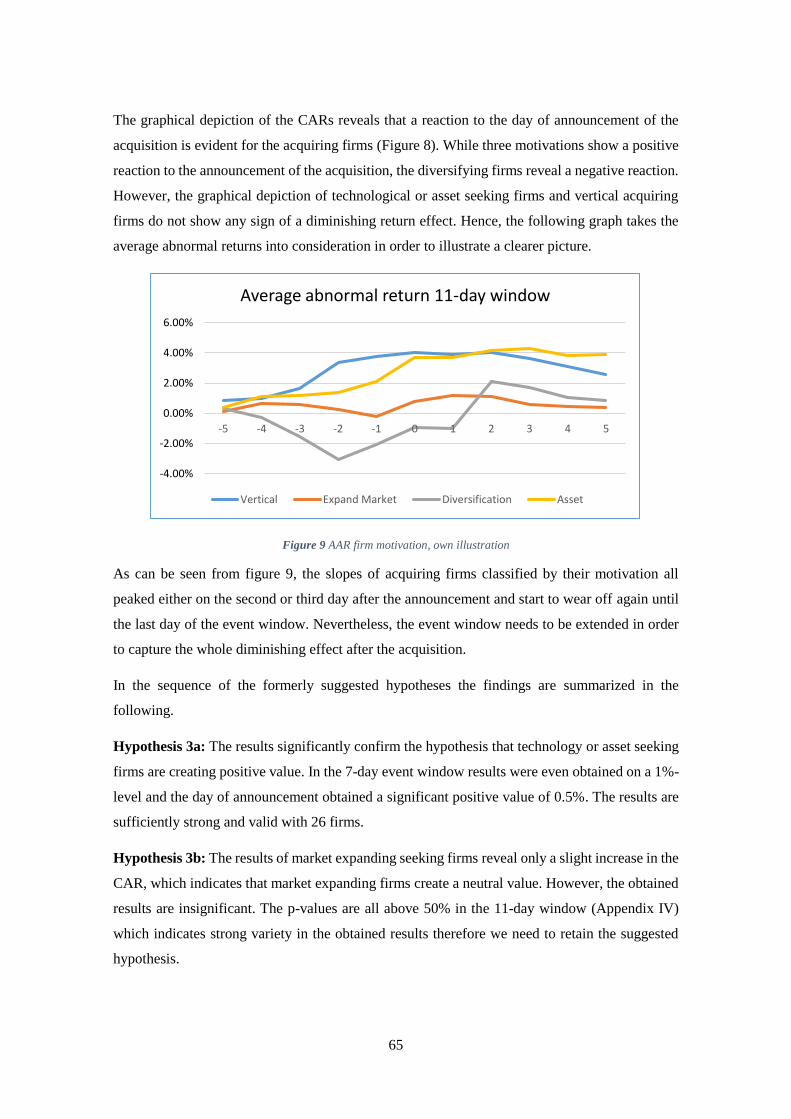
65
The graphical depiction of the CARs reveals that a reaction to the day of announcement of the
acquisition is evident for the acquiring firms (Figure 8). While three motivations show a positive
reaction to the announcement of the acquisition, the diversifying firms reveal a negative reaction.
However, the graphical depiction of technological or asset seeking firms and vertical acquiring
firms do not show any sign of a diminishing return effect. Hence, the following graph takes the
average abnormal returns into consideration in order to illustrate a clearer picture.
Figure 9 AAR firm motivation, own illustration
As can be seen from figure 9, the slopes of acquiring firms classified by their motivation all
peaked either on the second or third day after the announcement and start to wear off again until
the last day of the event window. Nevertheless, the event window needs to be extended in order
to capture the whole diminishing effect after the acquisition.
In the sequence of the formerly suggested hypotheses the findings are summarized in the
following.
Hypothesis 3a: The results significantly confirm the hypothesis that technology or asset seeking
firms are creating positive value. In the 7-day event window results were even obtained on a 1%-
level and the day of announcement obtained a significant positive value of 0.5%. The results are
sufficiently strong and valid with 26 firms.
Hypothesis 3b: The results of market expanding seeking firms reveal only a slight increase in the
CAR, which indicates that market expanding firms create a neutral value. However, the obtained
results are insignificant. The p-values are all above 50% in the 11-day window (Appendix IV)
which indicates strong variety in the obtained results therefore we need to retain the suggested
hypothesis.
-4.00%
-2.00%
0.00%
2.00%
4.00%
6.00%
-5 -4 -3 -2 -1 0 1 2 3 4 5
Average abnormal return 11-day window
Vertical Expand Market Diversification Asset
66
Hypothesis 3c: Indeed, indices for obtaining negative values and therefore experiencing a value
destruction for these firms have been found. Nonetheless, the results are insignificant. The
parametric t-test retains the null-hypothesis of negative or neutral abnormal return for the bidding
shareholders.
Hypothesis 3d: The suggested hypothesis that vertical acquisitions create significant positive
value needs to be retained. Despite the results reveal a strong positive market reaction to the
announcement of a merger, the values cannot claim to be statistically significant.
The obtained results are of descriptive nature and provide us with valuable insights about the
performance of the firms in our sample and the efficiency of the Indian stock market. The next
chapter is dealing with the interpretation of the obtained results.
67
6 Concluding remarks
This chapter discusses the presented result from the previous chapter in a theoretical context. The
implications about the proposed hypotheses will be discussed in depth and the learning points and
the summary of the implications which have been investigated by this study will be carried out.
This section is focused solely on the most relevant results. Further developed suggestions that are
out of the scope of this thesis are not considered, unless they deemed prudent.
6.1 Discussion and theoretical implications
R1: Does an advanced market acquisition of an Indian firm create positive shareholder
value?
H1: The cumulative abnormal returns related to the announcement of an advanced market
acquisition are significantly positive for Indian service and manufacturing firms.
This study tried to find out whether advanced market acquisitions by Indian firms were conducive
to shareholder value creation or not. Despite the fact that there has been a wave of advanced
market acquisitions from Indian firms (Accenture, 2008), little research with inconclusive results
has been conducted so far regarding this topic. In answering this research question, this study also
adds to the academic debate on the firm-specific advantages of firms from emerging markets, and
their role in the internationalization of these firms
On a macro-level, these oversea acquisitions imply a trade-off with domestic firm acquisitions
with severe developmental implications for India. Advanced market acquisitions are often
accompanied with serious degrees of leverage and risk factors at early stages of
internationalization of firms and therefore face dubious reputation in terms of value creation.
From an analysis of 72 firm acquisition by Indian firms between 2010 and 2015, evidence has
been found for a value enhancement following the day of announcement for the acquiring firm’s
shareholders. Institutional advancement of the host country of the target firm suggestively plays
a role in moderating the positive abnormal return for shareholders. While earlier findings have
obtained mixed results, I validate the findings of Gubbi et al. (2010) and conclude that value is
created.
Interestingly, the different event windows obtain different results in regards to the significance.
While the single DoA-window reveals a significantly positive outcome, the 7- and 11-day
windows obtain no significant results on the DoA. However, the three days after the

68
announcement have been significant and positive for both longitudinal event windows, therefore
I conclude that value is created.
A delayed market reaction where prices not immediately fully respond to new information is an
indication for inconsistency with the EMH (Bernard & Thomas, 1989). The drift in the obtained
results and the graphical depiction of the CARs urged the author to test for any violation of
normality.
The robustness test proofs that the sample data is skewed. The event study methodological
approach needs to be adjusted to the Indian specific context by prolonging the event window.
The applied 7-day and 11-day windows have been applied after reviewing suggestions of several
related studies. There is no common denominator in the event study literature, thus future studies
in that area needs to be conducted for the Indian market context. The problem which occurs by
extending the event window could be potential outliers that influence the value enhancing path.
Another explanation for the drift could be a herding behaviour in the Indian stock market.
Furthermore, the skewness of the data might also be due to the small sample size. Frain (2006)
has found out that the JB test is found to be lacking in power when the sample size is less than
50. The sample data includes 72 firms but literature regards this number still as being small in
order to apply the Jarque-bera test (Frain, 2006). Regardless of the applicability of the test, a
larger sample size might help to rule out any violation of non-normality in the Indian capital
market and probably leads to more significant results.
However, the suggested ability of the Indian market in drawing accurate inference about the
quality of corporate governance and quality of strategic decisions taken by the management is
revealed in the obtained positive results. Firms aim to become more competitive during the time
of institutional transition in India. Indian firms use strategic asset acquisitions as a strategic lever
which leads to a leverage effect for the country as a whole in terms of value creation. Advanced
market acquisitions allow for reconfiguration of resources and capabilities in the Indian firms and
therefore lead to strategic renewal of the company. Corporate governance convergence is an
additional factor that closes the institutional backlog.
I suggested that value creation of acquisitions is critically dependent on whether complementary
capabilities and resources are being acquired. In this context the quality of the resource in
advanced markets plays a crucial role. OECD country target firms offer a better variety and
quality of the resource than domestic Indian firms which have not been found to be significant in
terms of value creation (Gubbi et al., 2010). Moreover, they possess capabilities that emerging
market firms like India do not have in terms of management or technological skills. Therefore,
69
Indian firms overcome these shortcomings by advanced market acquisitions. The stock market
appreciates these acquisitions as it takes time to develop these resources and capabilities
internally. Further, the access to production technology, distribution channels and the acquisition
of global brands provides Indian companies with a competitive edge to domestic competitors and
can lead to an outpouring of national pride. However, it is overeager to generalize the finding for
every firm since firms in the sample supposedly have different agendas.
Previous research has not addressed the topic in this unique fashion yet. In general, the main
implication of obtaining positive value is that India’s manufacturing and service firms still lag
behind levels of advancement to OECD countries. This finding can also be reflected to other
emerging economies. The homogeneity in the institutional environment of Indian domestic
acquisitions lead to insignificant results for value creation in the recent literature. As mentioned
in the third section, the consensus is that acquirer shareholders generally loose in an acquisition.
Thus, managers can use the outcomes of this finding to justify advanced market acquisitions
markets for their shareholders.
Another finding from the first hypothesis is that the more the event window gets extended, the
less significant the results get in value which is documented in increasing p-values. This
observation is probably a result of value influencing outliers that some firms have due to different
events in the observed time frame. In fact, 30 out of 72 firms revealed negative abnormal returns
on average during the 11-day window (Appendix III). Thus, the obtained significant results for a
positive value creation for days following the day of announcement should gain strong validity.
However, there is strong inconsistency among the companies. This finding is referring back to
King et al. (2004) who claim that existing theory has failed to clearly identify subgroups. Hence,
it represents a shortcoming of the suggested hypothesis.
R2: Are there any sectoral differences in the performance outcomes?
H2a: Advanced market acquisitions of Indian service firms are creating neutral value for
shareholders.
Service firms did not show any significance in their results and only revealed little positive values
on average. Nonetheless, the intention that this industry is creating neutral value in advanced
market acquisitions is not completely off. Nowadays the service industry is the driving force of
the Indian economy not least because of the liberalization and the rapid transformation of Indian
service firms specifically in the Indian IT branch. These firms do not have the need to catch up
with their global competitors anymore since they already strategically renewed themselves and
compete on an eye level in the global market.

70
Many acquisitions are happening since Indian service firms follow a long-term strategic approach
and mainly invest in innovation or market expansion in order to secure their market position
(Gregory & McCorriston, 2005). Therefore, the market potentially punishes these serial
acquisitions with diminishing returns (Punit and Karnik, 2015). There are two sides of the same
coin. From the path dependency view, firms like to do things in which they have been previously
successful. From a learning curve perspective, firms reach a certain level on the learning curve
where the gains from learning are so small that they cannot outweigh the costs. Accordingly, the
shareholder value diminishes for acquiring service firms per acquisition announced.
OFDI in the Indian service sector is mainly driven by the IT industry. Nonetheless, other segments
within the service sector might still have a different agenda which could lead to the inconsistency
in the obtained results. Pradhan (2008) states that specifically the knowledge based IT software
and broadcasting industries are advanced. An additional reason why service firms perform less
well than manufacturing firms could be the general nature of being very human intensive. Due to
a complex post integration process, the market is reluctant to enhance the value of service firms.
H2b: Advanced market acquisitions of Indian manufacturing firms are creating significantly
positive value for shareholders.
In contrast, manufacturing firms are aiming for technological change and strategic renewal by
acquisitions. The market appreciates this synergistically aimed approach and the results support
that there is strong positive value reaction in all of the event windows. Advanced market
acquisitions of manufacturing firms in India are aiming at closing the technological gap in order
to enhance their domestic competitiveness and serve the domestic demand in the first place.
It is suggested that rocketing domestic demand and the manufacturing firms desire to diversify
internationally allow them to emerge out of the shadow of the service sector within the next 10
years (Dhawan et al., 2012). The manufacturing sector could become an engine of economic
prosperity for India by improving the productivity and bolstering the operations. Inorganic
acquisitions in advanced markets allow them to achieve this transformation.
From the chosen event windows, it can be inferred that the day of announcement shows the
highest positive values on average and obtains also the most significant t-values. The 11-day event
window table reveals that the market shows significant positive abnormal returns for
manufacturing firms even on the 5th day post the announcement day. Subsequently, the Indian
financial market draws conclusive inference about these acquisition. It can be even suggested that
the Indian market show signs of a herding behaviour after the announcement of an advanced
market acquisition. This behaviour calls for future research.
71
However, the findings contradict earlier insignificant findings from Delios et al. (2009) and Ray
(2009) and contribute to the literature in obtaining significant results. Both the research questions
and the hypothesis about manufacturing firms can be confirmed.
R3: Is the firm motivation affecting these outcomes?
H3a: Technological or asset seeking acquiring firms create significantly positive abnormal
return.
The findings complete the puzzle and confirm the explanation why manufacturing firms perform
significantly better than service firms. Acquisitions of assets or technologies leverage Indian firms
on a new competitive level and are closing the gaps to advanced market competitors. When Tata
bought Jaguar Land Rover, a wave of national pride has been recorded in India. Synergies are
realized by acquiring assets from developed factor and product markets and provide the Indian
firm with a richer learning experience. The asset seeking motivations are driven by the firm’s
exposure to foreign competition, their governance structure, and relevant financial and managerial
capabilities.
The findings show a strong validity and are almost significant across each event day during the
11-day event window and. This further enhances the validity. To sum up, value is created through
the effective internalization and extension of the proprietary assets of the target firm for the Indian
acquiring.
H3b: Market expanding seeking acquiring firms create neutral value.
Although, the results show insignificant results for the suggested hypothesis the intention is not
completely off. The graphical depiction of the average abnormal returns reveals only a slight
increase following the day of announcement. Spanning the 33 firms over an 11-day window only
5.83% cumulated shareholder value is created on average. Since firms who want to expand are
usually confronted with a mature domestic market, they do not seek for synergistic gains in the
first place but want to build up on scale and therefore perform less well than asset seeking firms.
Additional behavioural or agency driven motives could play a role. For instance, market power
striving conglomerate managers are prone to expand (Chaudhuri et al., 2013). Utilizing the target
firm’s customer base might add value but cannot outweigh the cost of the transaction. More
nuanced research needs to be conducted in this context. For instance, the location of the target
country could play a moderating role since different countries also act in different institutional
environments and have different customer bases.
72
H3c: Diversifying acquiring firms destroy value for the shareholders of the firm
The obtained negative abnormal returns support the suggestions by Franco et al. (2012) that the
negative relationship between shareholder value and diversification is emphasized when firms
diversify across unrelated industries. Nonetheless, they do not show any significance in the
obtained t-values. Admittedly, the observed sample is too small to derive any robust conclusion.
However, the CARs in the 7-day and 11-day event window peaked negatively at the day of
announcement and provide a strong hint for further research in that direction. Diversifying firms
only benefit from economic synergies. Due to the lack of experience in the targeted field of
business, managers are unable to accurately evaluate the target firm. From a critical point of view,
the sample only provided manufacturing firms who are having this purpose and potentially need
to be observed on a larger diversified scale. A potential reason for value destruction in the Indian
context could be the drive of family owned conglomerates to diversify on a global scale.
Therefore, they are driven by value destructive behavioural motives.
H3d: Vertical integrating acquiring firms are creating significantly positive value.
The findings show that vertical acquisition create even more positive abnormal returns than
technology or asset seeking firms, however, no significance in the results could be obtained across
different event windows again. Subsequently, the sample size with 8 firms has been small. The
assumption that Indian firms follow a global value chain strategy seems to be appreciated by the
market and needs to be further researched.
To sum up, the motivation of the firm seems to affect the outcome of the firm. The results show
positive value creation for technological or asset seeking acquiring firms. Surprisingly, negative
values could even be observed for diversifying acquiring firms but inconsistency due to small
sample sizes or other value affecting motivational theories led to insignificance of the classified
motivational drivers. Specifically, behavioural and agency driven motives might play a significant
role. However, the results support the earlier suggested hypotheses that advanced market
acquiring firms who have the intention of acquiring assets create positive value for shareholders.
General note
A basic assumption of this thesis is that the motives are based on neo-classical theory in which
the synergy motive is essential as it supposed to reflect the changes in the stock price. However,
it is unsure whether the motive is also not influenced by behavioral- or agency motives which are
not measurable. The results should be regarded carefully. The firm classification is the authors
assumption about reality. A biased classification would distort the results and leads to wrong

73
conclusions. Therefore, the author bases the motivations on empirical studies and sound economic
theories such as the neo-classical view.
On a more general level, the event study methodological approach in the Indian context is
applicable. The obtained abnormal returns are significant in different event windows. Noteworthy
to mention is that the significance level decreases the wider the event window is. The reason for
this are potential outliers in the observed period and the diminishing effect of the event itself.
During the course of the work it becomes clear that an extension of the event window is needed
or a shift of the event day window becomes necessary as the applied 11-day window does not
show strong signs of diminishing returns and is skewed. Therefore, it does not provide us with
robust results. For instance, a window that comprises the 3rd day before the announcement and
ends at the 9th day post the announcement day might account for these shortcomings.
In general, in all of the obtained significant result tables and graphs a certain pattern has been
observed. The extreme values have not been encountered on the day of announcement but
followed on the first day or the second day post the announcement. This might be specific to the
Indian market, which calls for future research. Further, the firm motivation for investing overseas
seems to play a moderating role abnormal returns can be negative (diversifying firms) or positive
(asset/technology seeking firms).
However, as I chose a mixed inductive and deductive approach, I presume that other
classifications might also play an important and significant role in comparison to the classified
firm motivations. Knowledge intensive sectors such as software or pharmaceutical are said to be
more value enhancing than others (Pradhan, 2008). Despite the results cannot confirm this
assumption, I identified that specifically technology intensive firms showed a strong positive
reaction on the day of announcement (Appendix III).
6.2 Limitations and Future Research
Referring back to the delimitation part in the introduction chapter, a few more limitations occurred
during the course of the work.
First, this thesis is an exploratory effort to unravel the performance outcomes of advanced market
acquisitions by firms from an emerging economy like India, a phenomenon that is new and
understudied. Despite this thesis has identified few sources for value creation, future research that
incorporates more fine grained classifications and a higher number of firms could explicate more
nuanced findings. For instance, the results in this study conclude that manufacturing firms create
significantly more value than service firms, however, it has become clear that there is a
74
discrepancy within the service sector. The knowledge based segment of the Indian economy such
as pharmaceuticals, software and broadcasting might account for disproportionately large value
creation across both sectors (Pradhan, 2008).
A second limitation is the choice of the dependent variable: abnormal returns to shareholders.
Generally, Kale et al. (2002) state that the short-run abnormal equity price reaction to acquisition
announcements is a reliable measure of the value consequences for an acquiring firm. However,
one of the shortcomings is that unlisted firms are excluded and therefore brings purposeful intent
of selection bias into the sample. Further, this approach supposes the response of the stock market
as a true assessment of the strategic decision of the firm. The intended objectives of the strategic
decision might be driven by behavioural or agency driven motives of the manager thus they can
lead to an erroneous market response. Due to the complexity and risks of advanced market
acquisitions, long-term performance is dependent on how the firms manage the post integration
process, specifically in culturally distant markets.
Third, there are few other systematic studies of motivation for and value consequences of oversea
acquiring firms from emerging economies to compare the findings with. While these studies
divulge the underlying drivers of FDI and explore the choice of the target market, they are not
talking about the economic impact of FDI in regards to value creation. Buckley et al. (2007) found
out that Chinese firms are market seeking, risk averse and short-term oriented, while I conclude
that Indian firm are mainly driven by strategic-asset/technology seeking considerations and have
a long-term strategic focus. Based on these different findings on motivations of outward FDI of
emerging economies, further comparative research across these markets that are encompassing
diverse institutional settings is needed.
A fourth limitation are the various strategic motives that are existing for internationalization of
Indian firms due to several reasons such as business group affiliation, ownership structure, nature
of industry, background, past strategies and legacy effect, entrepreneurial orientation and
aspiration of the leaders. Those temporal variations are needed to be teased out when testing the
models otherwise the relation between internationalization of Indian firms and performance
remain spurious. Attempts towards this direction are being made in this thesis but more
satisfactorily results would yield a more thorough and holistic approach which is collecting also
primary data. Additionally, a larger sample size would probably support the motivational
hypotheses that are proposed in this thesis and therefore call for future research.
In a more specific context, some limitations arose by specifying the researched sample. The
sample deals with the problem of confounding events for the firms Infosys, Piramal, Crompton
Greaves and Amtek. These firms which may affect the latter acquisitions in terms of investors’
75
expectations (Karolyi, 2015). Nonetheless, the author did not exclude these events in order to
reflect the whole time span of acquisitions between 2010 and 2015. Further, Ray and Gubbi
(2009) indicated that majority controlled service firms outperform manufacturing firms by
acquiring overseas. This study is limited to firms that have acquired 100% stake in the target
company since the results are supposedly more expressive. Comparable conclusion can only be
derived by applying an equal methodological approach.
From the event study point of view, the unique pattern that Indian firms peak on the first two days
post the announcement day need to be further elaborated. It remains ambiguous if the Indian stock
market reacts immediately to the issuance of new information. Further, it is unclear what is
causing this delay. This might be a hint for herding behaviour in the Indian stock market.
6.3 Conclusion
The key outcome of this study is that advanced market acquisitions from Indian firms do create
value. The positive value effect of these M&A stimulate the Indian economy and do not crowd-
out domestic investment but enhance domestic competitiveness. Indian firms strategically renew
themselves and make use of advanced product and factor markets that work implicitly as a
springboard for the development of the Indian economy. Institutional advancement of the target
firm’s country ensures a higher quality of the acquired resource. Complementary resources and
capabilities between the firms lead to value creation and acquiring firms do not have to grow the
resource internally.
The initial description of the historical evolution of OFDI in India revealed that the development
path of manufacturing and service sector has been different. While the former has been essentially
domestic market oriented due to the inward looking regime that India followed for several years,
services are export oriented and of relatively recent origin. This resulted in a technological gap.
Advanced market acquisitions help in bridging that gap. Thus, the large synergies for
manufacturing firms rewards the market with obtaining significantly positive abnormal returns
on the days surrounding the day of announcement of the merger. Manufacturing firms are on the
fast track in becoming the engine of the Indian economy within the next few years. Firms are
upgrading their technologies and capabilities and serve at the same time the increased domestic
demand. By doing so, they close the technological gap to the service firms and create value to
shareholders.
76
Firm motivation affects the performance outcomes of the acquiring firm. This finding completes
the puzzle of the earlier findings. Asset or technology seeking firms perform significantly better
than market expanding or diversifying firms. While negative values for diversifying firms show
that the market also punishes acquisitions, positive but insignificant values for vertical acquiring
firms indicate that the market appreciates the intention to create a global value chain network. In
line with prior argumentations, market expanding firms who are mainly characterized by service
firms do not create any significant value. However, future research on larger sample sizes needs
to be conducted in order to draw a valid conclusion concerning non-asset-seeking motivations.
The addressed research questions are examined by applying the event study approach. As capital
markets in emerging economies such as India might not be very efficient, there was a possibility
of finding inconsistencies in the outcome of the analysis. Accordingly, three different event
windows are applied. Surprisingly, they all provided validity of the obtained results and inferred
that the efficient market hypothesis holds and the market reacts. However, the highest abnormal
returns are encountered on the second day after the announcement and diminishing returns could
not be fully captured in the 11-day event window. This drift calls for future research.
The thesis is contributing to the growing stream of research on the determinants of successful
inorganic modes of internationalization in the form of acquisitions by emerging market firms.
Managerial implications are the identification of firm characteristics under which acquisitions
make sense as a path to superior performance. This is of relevance for various parties. For
managers, advanced market acquisitions provide an opportunity to enhance the competitiveness
of the firm since positive performance outcomes are a good indicator for a long-term success of
the company. For policy-makers, rapid growth in outward foreign direct investment post
liberalization and the merger wave which was beginning circa 2005 are attributable to the factors
implicit in the liberalization of the policy which resulted in greater access to financial markets
and enhanced competition. Hence, further liberalization leads to an empowerment of the
manufacturing industry and enhanced growth. Despite this thesis fills a gap in the literature, a
crucial outcome of this study is that a lot more fine-grained research is needed in order to identify
the sources of value creation for firms in the Indian context.
There are few points to keep in mind when reflecting this study. Firstly, the classification of the
acquisition strategies is influenced by the authors assumption about reality and the sample suffers
under a purposeful intent of self-selection bias. Secondly, the classification is based on the neo-
classical theory and does not take into account behavioral or agency theory. Thirdly, the event
study is based on the semi-strong market form which might not be true in the Indian context.
Lastly, the lack of relevant literature made it difficult to develop hypotheses. Thus, this thesis

77
takes a cautious approach in creating knowledge and can be understood as a starting point for
future studies.
78
Reference List Accenture. (2008, August 17). India goes global: How cross-border acquisitions are powering
growth. Retrieved from Accenture.com:
http://www.accenture.com/Global/Research_and_Insights/Policy_And_Corporate_Affai
rs/IndiaGoesGlobal.htm
Ahern, K. (2009). Sample selection and event study estimation. Journal of Empirical Finance,
16(3), 466-482.
Anand, J., & Delios, A. (2002). Absolute and relative resources as determinants of international
acquisitions. Strategic Management Journal, 23(2): 119-134.
Anand, M., & Singh, J. (2008). Impact of merger announcements on shareholders'wealth:
Evidence from Indian private sector bank. Vikalpa: The Journal for Decision Makers,
33(1), 35-54.
Andrade, G., Mitchell, M., & Stafford, E. (2001). New evidence and perspectives on mergers.
Journal of Economic Perspectives, 15: 103-120.
Arbnor, I., & Bjerke, B. (2009). Methodology for creating business knwoledge. Calif: Sage,
Thousand Oaks.
Aybar, B., & Ficici, A. (2009). Cross-border acquisitions and firm value: An analysis of
emerging-market multinationals. Journal of International Business Studies, 40(8):1317-
1338.
Barkema, H., Bell, J., & Pennings, J. (1996). Foreign entry, cultural barriers, and learning.
Strategic Management Journal, 17(2): 151–166.
Baumol, W. (1962). On the theory of the expansion of the firm . American Economic Review,
52(5): 1078-1087.
Bedi, N., Bedi, P., & Sooch, B. (2013). Patenting and R&D in Indian Pharmaceutical Industry:
Post-TRIPS Scenario. Journal of Intellectual Property rights, (18):105-110.
Beena, P. (2014). Mergers and Acquisitions: India under Globalisation. New Delhi: Routledge.
Beitel, P., Schiereck, D., & Wahrenburg, M. (2004). Explaining M&A success in European
banks. European Financial Management, 10(1):109-139.
Beladi, Chakrabati, & Marjit. (2013). Cross-border Mergers in Vertically Related Industries.
Bensidoun, I., Lemoine, F., & Ünal, D. (2008). The integration of China and India into the
world economy: a comparison. The European Journal of Comparative Economics , Vol.
6, n.1, pp. 131-155.
Berkovitch, E., & Narayanan, M. (1993). Motives for Takeovers: An Empirical Investigation.
The Journal of Financial and Quantitative Analysis, 28(3): 347-362.
Bernard, V. L., & Thomas, J. K. (1989). Earnings-Announcement Drift: Delayed Price
Response or Risk Premium? Journal of Accounting Research, 27: 1-36.
Bhattacharya, P. (2015, April 3). The truth behind India’s new GDP numbers. LiveMint.
79
Bodie, Z., Detemple, J., & Rindisbacher, M. (2009). Life-Cycle Finance and the Design of
Pension Plans . Annual Review of Financial Economics, 249-286.
Booth, W. C. (2003). The craft of research. Chicago: The University of Chicago Press.
Bower, J. (2001). Not all M&As Are Alike- and That Matters. Harvard Business Review, 79(3):
92-101.
Brown, S., & Warner, J. 1. (1985). Using daily stock returns: The case of event studies. Journal
of finance economics, 14: 3-31.
Bruner, R. F. (2004). Applied Mergers and Acquisitions. New Jersey: Wiley.
Buckley, P. J., Clegg, L. J., Cross, A. R., Liu, X., Voss, H., & Zheng, P. (2007). The
determinants of Chinese outward foreign direct investment. Journal of International
Business Studies, 38(4): 499-518.
Buckley, P., & Casson, M. (1976). The future of the multinational enterprise. London:
Macmillan.
Canavos, G., & Miller, D. (1999). An introduction to modern business statistics. Duxbury: 2nd
edition, Brooks/Cole Publishing Company.
Chan, S. P. (2015, November 30). India poised to become fastest growing large economy. The
Telegraph, p. 2.
Chaudhuri, B., Pyne, P., & Chowdury, A. (2013). Determinants of Manufacturing FDI in India:
A scetoral Analysis. The Journal of Industrial Statistics, 2(2): 217-231.
Chen, M. Y. (2014). 'I Just Did 400 Million Event Studies' – A Study of Market Model
Robustness and Deterioration in Times of Crisis. London: University of Cambridge;
London School of Economics & Political Science (LSE).
Cooper, D. R., & Schindler, P. S. (2003). Business Research Methods. New York, NY:
MCGraw-Hill.
Dasgupta, N. (2015). FDI Outflows and Domestic Investment: Substitutes or Complements?
Exploring the Indian Experience. Leveraging FDI for Sustainable Economic
Development in South Asia: Evidence, Challenges and Prospects (pp. 1-25).
Copenhagen: Asian Research Center.
Dawar, N., & Frost, T. (1999). Competing with giants: Survival strategies for local companies
in emerging markets. Harvard Business Review, 77(2): 119-132.
De Beule, F., & Sels, A. (2016). Do innovative emerging market cross-border acquirers create
more shareholder value? Evidence from India. International Business Review, 25: 604–
617.
De Bondt, W. F., & Thaler, R. H. (1990). Do Security Analysts Overreact. The American
Economic Review, 80(2): 52-57.
Delios, A., Gaur, A. S., & Kamal, S. (2009). International acquisitions and the globalization of
firms from India. In J. &. Chaisse, Expansion of Trade and FDI in Asia: Strategic and
Policy Challenges (p. 58). New York, NY: Rutledge.
80
Deng, P. (2009). Why do Chinese firms tend to acquire strategic assets in international
expansion? Journal of World Business, 44: 74–84.
Desai, N. (2016). Recent Learnings from Deal Making in India: Experience Sharing on Inbound
and Outbound Deals. London, United Kingdom: Nishit Desai Associates.
Dhawan, D., Swaroop, G., & Zainulbhai, A. (2012, March). Fulfilling the promise of India’s
manufacturing sector. Retrieved from McKinsey.com:
http://www.mckinsey.com/business-functions/operations/our-insights/fulfilling-the-
promise-of-indias-manufacturing-sector#0
Dos Santos, M. B., Errunza, V., & Miller, D. (n.d.). Does corporate international diversification
destroy value? evidence from cross-border mergers and acquisitions. Journal of
Banking & Finance, 32(12): 2716-2724.
Du, M., & Boateng, A. (2012). Cross-border Mergers & Acquisitions by Emerging Market
Firms: A Review And Future Direction. ACRN Journal of Entrepreneurship
Perspectives, 24-54.
Dunning, J. (1977). Trade, Location of Economic Activity and the MNE: A Search for an
Eclectic Approach. In B. Ohlin, P. Hesselborn, & P. Wijkman, The International
Allocation of Economic Activity. London: Macmillan.
Dunning, J., & Lundan, S. (2008). Institutions and the OLI paradigm of the multinational
enterprise. Asia Pacific Journal of Mangagement, 25:573–593.
Dymsza, W. (1984). Trends in multinational business and global environments: a perspective.
Journal of International Business Studies, 15(3): 25-46.
Eckbo, B. (1983). Horizontal mergers, collusion, and stockholder wealth. Journal of Financial
Economics, 11(4): 241-273.
Eden, L., & Miller, S. (2004). Distance matters: Liability of foreignness, institutional distance
and ownership strategy. In M. Hitt, & J. Cheng, Advances in International Management
(pp. 187-221). New York: Elsevier.
Eisenhardt, K. (1989). Building theories from case research. Acadey of Management Review,
14: 530-550.
Fama, E. (1970). Efficient Capital Markets: A Review of Theory and Empirical Work. Journal
of Finance, 25: 383-417.
Fama, E. (1991). Efficient Capital Markets: II. Journal of Finance, 46(5), 1575-1617.
Fisman, R., & Khanna, T. (2004). Facilitating development: the role of business groups. World
Development, 32(4): 609-628.
Frain, J. C. (2006). Small sample power of tests of tests of normality when the alternative is an
alpha-stable distribution. Mimeo.
Franco, F., Urcan, O., & Vasvari, F. (2012). The Value of Corporate Diversification: A Debt
Market Perspective.
Gammeltoft, P. (2008). Emerging multinationals: Outward FDI from the BRICS countries.
International Journal Technology and Globalization, 4(1): 5-22.
81
Garg, A., & Jindal, K. (2014). Herding Behavior in an Emerging Stock Market: Empirical
Evidence from India. The IUP Journal of Applied Finance, Vol. 20(2): 18-36 .
Gill, J., & Johnson, P. (2010). Research Methods for Managers. Southampton: Sage.
Glaser, B., & Strauss, A. (1967). The discovery of grounded theory: strategies for qualitative
research. New York: Aldine de Gruyter.
Goergen, M., & Renneboog, L. (2004). Shareholder wealth effects of European and domestic
cross-border takeover bids. European Financial Management, 10(1): 9-45.
Gregory, A., & McCorriston, S. (2005). Foreign acquisitions by UK limited companies: short-
and long-run performance. Journal of Accounting and Public Policy, 23(5): 351-379.
Gubbi, S., Aulakh, P., Ray, S., Sarkar, M., & Chittoor, R. (2010). Do international acquisitions
by emerging-economy firms create shareholder value= The Case of Indian firms.
Journal of International Business Studies, 41: 397-418.
Havanich, S., & Cavusgil, S. (2001). Stock market reactions to international joint venture
announcements: an event analysis. International Business Review, 10: 139-151.
Hoberg, G., & Phillips, G. (2010). Product Market Synergies and Competition in Mergers and
Acquisitions: A Text-Based Analysis. Review of Financial Studies, 23 (10): 3773-3811.
Hope, O. T., & Vyas, D. (2011). The cost of pride: Why do firms from developing countries bid
higher. Journal of International Business Studies, 42(1): 128-151.
Hoskisson, R. E., Eden, L., Lau, C., & Wright, M. (2000). Strategy in Emerging Economies.
The Academy of Management Journal, 43(3): 249-267.
Hymer, S. (1976). The international operations of national firms. Cambridge, MA: MIT Press.
IFAC. (2012). Integrating Overnance for Sustainable Success. New York: International
Federation of Accountants.
Jensen, M. (1986). Agency costs of free cash flow: Corporate finance and takeovers. American
Economic Review, 76(5): 323-329.
Jucunda, M. (2013). A review on prediction of Mergers and Acquisitions in the West: Statistical
Considerations and Emerging Issues For Research in India. Chennai: Vit University
Chennai Campus.
Kale, P. (2004). Acquisition Value Creation in Emerging Markets: An Empirical Study of
Acquisitions in India. Academy of Management Best Conference Paper, IM:H1.
Kalotay, K. (2008). Russian transnational and international investments paradigms. Research in
International Business and finance, 22(2): 85-107.
Karim, S., & Mitchell, W. (2000). Path-dependent and path-breaking change: reconfiguring
business resources following acquisitions in the U.S. medical sector, 1978–1995.
Strategic Management Journal, 21(10-11): 1061–1081.
Karnani, A. (2010). Dubious Value of International Acquisitions by Emerging Economy Firms:
The Case of Indian Firms. Ross School of Business Working Paper, 1-43.
82
Karolyi, A. G., Liao, R. C., & Loureiro, G. (2015, March 21). The Decreasing Returns of Serial
Acquirers around the World. Retrieved from editorialexpress.com:
https://editorialexpress.com/cgi-
bin/conference/download.cgi?db_name=AFA2016&paper_id=336
Khanna, T., & Palepu, K. (1997). Why focused strategies may be wrong for emerging markets.
Harvard Business Review, July/August: 41-51.
Khanna, T., & Palepu, K. (2004). Globalization and convergence in corporate governance:
evidence from Infosys and the Indian software Industry. journal of International
Business Studies , 35: 484-5.
Khanna, T., Palepu, K., & Sinha, S. (2005). Strategies that fit emerging markets. Harvard
Business Review, 83(6):63-74.
King, D. R., Dalton, D. R., Daily, C. M., & Covin, J. G. (2004). Meta-analyses of post-
acquisition performance: Indications of unidentified moderators. Strategic Management
Journal, 25(2): 187-200.
Kohli, R., & Mann, B. (2012). Analyzing determinants of value creation in domestic and cros--
border acquisitions in India. International Business Review, 21(6): 998-1016.
Kothari, S. (2001). Capital Markets Research in Acoounting. Journal of Accounting and
Economics, 31: 105-231.
Kothari, S., & Warner, J. (2007). Econometrics of Event Studies. Handbook of Corporate
Finance, Chapter 1.
KPMG. (2010). Emerging market acquisitions in developed economies. Mumbai: KPMG.
Kuada, J. (2012). Research Methodology: A Project guide for university students. Copenhagen:
Aalborg University.
Kumar, N. (2008). Internationalization of Indian Enterprises: Patterns, Strategies, Ownership
Advantages, and Implications. Asian Economic Policy Review, 3: 242–261.
Kumar, R. (2009). Post-merger corporate performance: an Indian perspective. Manag Res News
, 32(2):145–157.
Lall, S. (1982). The emergence of Third World multinationals: Indian joint ventures overseas.
World Development, Elsevier, 10(2): 127-146.
Lawrence, S., Locke, S., & Duppati, G. (2010). Emerging global giants: foreign investment by
Indian companies. APIRA International conference. Sydney, Australia: APIRA.
MacKinlay, A. (1997). Event studies in economics and finance. Journal of Economic literature,
35: 13-19.
Macpherson, A., & Jones, O. (2010). Editorial: Strategies for the development of International
Journal of Management Reviews. International Journal of Management Reviews, 12(2):
107-113.
Makino, S., Lau, C., & Yeh, R. (2002). Asset-exploitation versus asset-seeking: Implications for
locatin choice of foreign direct investment from newly industrialized economies.
Journal of International Business Studies, 33(3): 403-422.

83
Mann, B., & Kohli, R. (2009). Impact of mode of payment and insider ownership on target and
acquirer's announcement returns in India. Vikalpa: The Journal for Decision Makers,
34(4): 51-66.
Mathews, J. (2006). Dragon multinationals: New players in 21th century globalization. Asia
Pacific Journal of Management, 23(1): 5-27.
Mathur, I., Rangan, N., Chhachhi, I., & Sundaram, S. (1994). International Acquisitions in the
United States: Evidence from returns to foreign bidders. Managerial and Decision
Economics, 15(2): 107.
McEvily, B., & Marcus, A. (2005). Embedded ties and the acquisition of competitive
capabilities. Strategic Management Journal, 26(11): 1033–1055.
McWilliams, A., & Siegel, D. (1997). Event studies in management research: Theoretical and
empirical issues. Academy of Management Journal, 40(3): 626-657.
Meyer, K. E. (2015, February 24). India And China's New Motives For Foreign Investment.
Forbes Asia, p. 3.
Moeller, S., Schlingemann, F., & Stulz, R. (2004). Firm size and the gains from acquisitions.
Journal of Financial Economics, 73(2): 201-228.
Nelson, R. (2005). Technology, institutions and economic growth. Cambridge, MA: Harvard
University Press.
North, D. (1990). Institutions, Institutional Change and Economic Performance, Cambridge:.
Cambridge: Cambridge University Press.
OECD. (2006). Emerging multinationals: Who are they? What do they do? What is at stake?
Paris: OECD.
Oliver, C. (1997). Sustainable competitive advantage: Combining institutional and resource
based views,. Strategic Management Journal, 18(9): 697-713.
Peng, W. 2. (2003). Institutional Transition and Strategic choices. Academy of Management, 28:
275-298.
Penrose, E. (1959). The Theory of the Growth of the Firm. New York: Oxford University Press.
Porter, M. (1980). Competitive Strategy: Techniques for Analyzing Industries and Competitors.
New York: Free Press.
Pradhan, J. (2004). The determinants of Outward Foreign Direct Investment: A Firm-level
analysis of Indian Manufactuirng. Oxford Development Studies, 32(4).
Pradhan, J. (2006). Rise of Service Sector Outward Foreign Direct Investment from Indian
Economy: Trends, Patterns, and Implications. GITAM Journal of Management, 4(1):
70–97.
Pradhan, J. (2008a). Indian Multinationals in the World Economy: Implications for
Development. New Delhi: Bookwell.
Pradhan, J. (2008b). Overcoming Innovation Limits through Outward FDI: The Overseas
Acquisition Strategy of Indian Pharmaceutical Firms. Munich, Germany: University
Library of Munich.
84
Prasad, R. (2015, October 24). Fake journals: ‘Make in India’ gone wrong. The Hindu, p. 2.
PricewaterhouseCoopers. (2010). Emerging Multinationals: The rise of new multinational
companies from emerging economies. PWC.
Punit, I. S., & Karnik, M. (2015, December 30). Indian IT outsourcing companies have been on
an acquisition spree that will only increase in 2016. Quartz India, p. 2.
Ramamurti, R. (2009). What have we learned about emerging MNEs? In R. Ramamurti, & J.
Singh, Emerging Multinationals from Emerging Markets. Cambridge, U.K: Cambridge
University Press.
Rani, N., Yadav, S. S., & Jain, P. K. (2011). Impact of mergers and acquisitions on
shareholders' wealth in short-run: An empirical study of Indian pharmaceutical industry.
International Journal of Global Business and Competitiveness, 6(1): 40-52.
Ray, S. (2009). A Comment on "Revisiting the Internationalization - Performance Relationship:
Implications for Emerging Economy Firms. Calcutta: Indian Institute of Management
Calcutta.
Ray, S., & Gubbi, S. R. (2009). International acquisitions by Indian firms: Some observations
and implications for future research on emerging multinationals. Calcutta: Indian
Institute of Management Calcutta.
Remenyi, D., Williams, B., Money, A., & Swartz, E. (1998). Doing Research in Business and
Management: An Introduction to Process and Method. London: Sage.
Roll, R. (1986). The hubris hypothesis of corporate takeovers. Journal of Business , 59(2): 197-
216.
Rossi, S., & Volpin, P. (2004). Cross-country determinants of mergers and acquisitions. Journal
of Financial Economics , 277–304.
Rugman, A. (2008). How global are TNC's from emerging markets? In K. Sauvant, The rise of
transnational corporations from emerging markets. Threat or opportunity? (pp. 86-
106). Cheltenham, UK: Edward Elgar.
Sabarinath, M., & Kailash, B. (2012, June 4). Family-run conglomerates like Piramals, Birlas,
Mahindras foray into new-age businesses. Economic Times India.
Saunders, M., Lewis, P., & Thornhill, A. (2009). Research methods for Business Students.
London: Pearson.
Sauvant, K. (2005). New sources of FDI: The BRICs. Outward FDI from Brazil, Russia, India
and China. Journal of World Investment and Trade, 6(5): 639-709.
Seth, A. (1990). Value creation in acquisitions: A re-examination of performance issues,.
Strategic Management Journal, , 11: 99–115.
Seth, A., Song, K., & Pettit, R. (2000). Synergy, managerialism or hubris? An empirical
examination of motives for foreign acquisitions of US firms. Journal of International
Business Studies, 31(3): 387-405.
85
Seth, A., Song, K., & Pettit, R. (2002). Value creation and destruction in cross-border
acquisitions: An empirical analysis of foreign acquisitions of US firms. Strategic
Management Journal, 23(10): 921-940.
Shimizu, K., Hitt, M., Vaidyanath, D., & Pisano, V. (2004). Theoretical foundations of cross-
border mergers and acquisitions: A review of current research and recommendations for
the future. Journal of International Management, 10(3): 307-353.
Singh, P., Suri, P., & Sah, R. (2010). Economic value added in Indian cross border mergers.
International Journal of Business Research, 12(2): 160-164.
Strong, N. (1992). Modelling abnormal returns: A review article. Journal of Business, Finance
and Accounting , 19(4): 533-553.
Stucci, T. (2013). The Internationalization of Emerging Market Firms: A Context-Specify study.
Copenhagen Business School, 1-91.
Svetlicic, M. (2003). Theoretical Context of Outward Foreign Direct Investment from
Transition Economies. In M. Svetlicic, & M. Rojec, Facilitating Transition by
Internationalization: Outward Direct Investment from European Economies in
Transition (pp. 3-28). Aldershot: Ashgate.
Tashakkori, A., & Teddlie, C. (1998). Mixed methodology: combining qualitative and
quantitative approaches. California: Thousand Oaks, CA: Sage.
Vermeulen, F., & Barkema, H. (2001). Learning through acquisitions . Academy of
Management Journal, 44(3): 457-476.
Walker, M. (2000). Corporate Takeovers, Strategic Objectives, and Acquiring-firm Shareholder
Wealth. Financial Management (Wiley-Blackwell), 29(1): 53.
Weber, Y. (1996). Corporate culture fit and performance in mergers and acquisitions. Human
Relations, 49: 1181 - 1202.
Wells, L. (1983). The rise of Foreign Investment from Developing Countries. Cambridge: MIT
Press.
Wernerfeldt, B. (1995). The Resource-Based View of the Firm: Ten Years After. Strategic
Management Journal, 16(3): 171-174.
Xu, D., & Meyer, K. (2012). Linking theory and context: strategy research in emerging
economies after Wright et al. Journal of Management Studies, DOI: 10.1111/j.1467-
6486.2012.01051.x.
Yiu, D. W., Lau, C. M., & Bruton, G. D. (2007). International venturing by emerging economy
firms: The effects of firm capabilities, home country networks, and corporate
entrepreneurship. Journal of international Business Studies, 38(4): 519-540.
Zhang, J., Zhou, C., & Ebbers, H. (2011). Completion of Chinese overseas acquisitions:
Institutional perspectives and evidence. International Business Review, 20(2): 226-238.
Zhou, Z. (2016). The Development of Service Economy: A General Trend of the Changing
Economy in China. Heidelberg: Springer Verlag.

86
Appendix I
In this Appendix, the Formulas used in the statistical test section are further described. Among
the most commonly used t-test and p-value, other tests for the test of robustness are used for the
hypothesis if the obtained results create significant value. Moreover, in this appendix we also
include tests for standard statistical tests. Most of Formulas are adapted from Canavos and Miller
(1999).
Sample Mean
�̅� =∑ 𝑋𝑖
𝑖=𝑛𝑖=1
n
Where: �̅� is the sample mean from a group of observations and represents an estimate of the
population mean. n is the sample size and reflects the number of days in the event window
depending whether it is a cross-sectional or longitudinal measure.
Median
The median is dividing an ordered set into the half, it is the mid-value which is depicted from the
sample.
Sample Variance
𝑆2 =∑ (𝑋𝑖 − 𝑋)2𝑖=𝑛
𝑖=1
n − 1
Where: X is the previously calculated mean of the sample and Xi is the individual observation. n-
1 represents the degrees of freedom, which is deflected as the sample size less 1.
Sample Standard Deviation
The sample standard deviation can be described as the non-squared measure of the variance;
therefore, the root of the variance is calculated.
S = √𝑆2
Where: 𝑆2 is the sample variance
Central Limit Theorem
According to the Central Limit theorem a large enough sample size n, which is the distribution of
the sample mean, will approach a normal distribution. This is true for a sample of independent
random variables from any population distribution, as long as the population has a finite standard
deviation. Hence, with the following tests we are testing for the normality of the distribution as
mentioned earlier in the result chapter.
Skewness
With the skewness we are trying to identify whether the distribution is skewed to the left or right.
If the distribution is skewed to the left, the number will be negative. In contrast, a high positive

87
number indicates a skewness to the right and the frequencies tail off more slowly to the right.
Thus, a number close to 0 indicates a normal distribution. In short, the Formula looks like this:
skewness =∑(𝑋𝑖 − �̅�)3
(n − 1)𝑆3
Where: s is the sample standard deviation, ∑ means the sum of all obtained values and �̅�
represents the sample mean, n-1 still reflects the degrees of freedom.
I have calculated the results with Formulas in excel.
Kurtosis
The Kurtosis measures the fatness of the tails in the distributions. Usually, in a normal
distribution, the tails reflect a fatness of 3. Hence, oftentimes 3 is subtracted in order to get the
excess kurtosis.
μ4
𝑆4 or kurtosis =
∑(𝑋𝑖 − �̅�)4
(n − 1)𝑆4
Where: 𝜇4 is reflected the fourth moment about the mean and S4 is the square of the variance.
The kurtosis in this thesis has been calculated with excel.
Jarque-Bera
This test tests for the goodness of fit of the data. It uses the 3rd and the 4th moment about the mean
(skewness and kurtosis) in order to obtain the result.
JB =𝑛
6(𝑆2 +
1
4𝐾2)
Where: n reflects the sample size, S the skewness and K the kurtosis
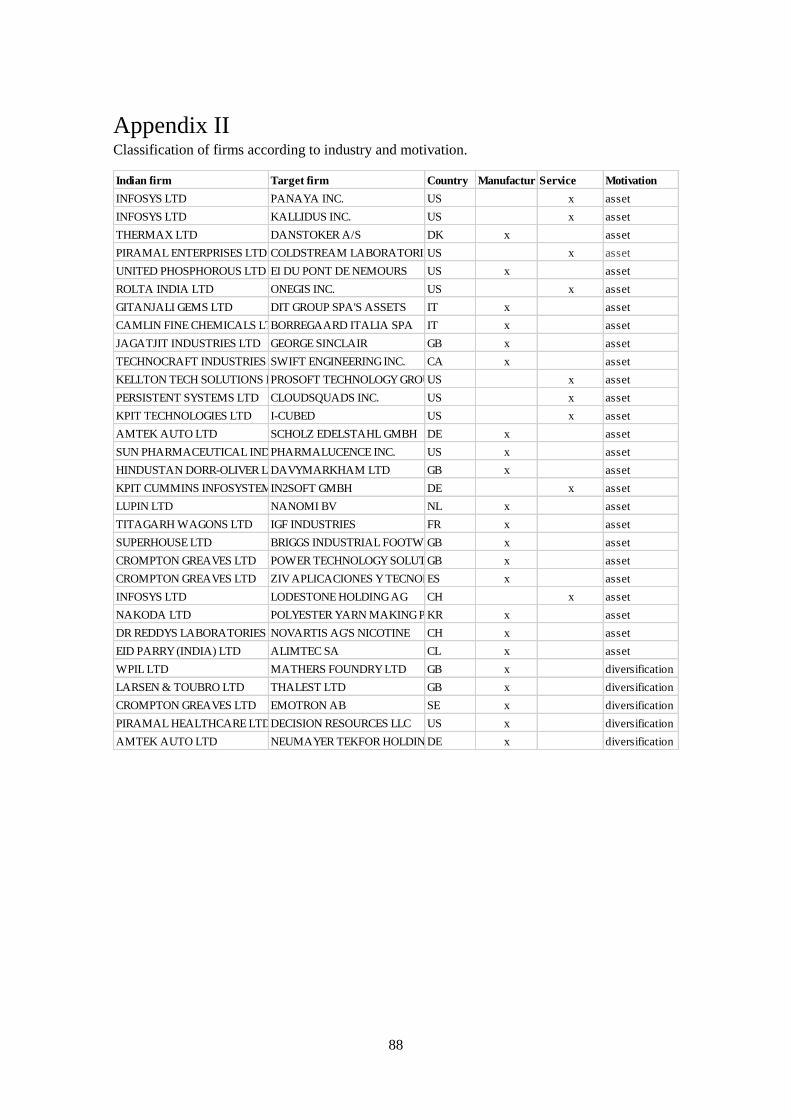
88
Appendix II Classification of firms according to industry and motivation.
Indian firm Target firm Country ManufacturingService Motivation
INFOSYS LTD PANAYA INC. US x asset
INFOSYS LTD KALLIDUS INC. US x asset
THERMAX LTD DANSTOKER A/S DK x asset
PIRAMAL ENTERPRISES LTD COLDSTREAM LABORATORIES US x asset
UNITED PHOSPHOROUS LTD EI DU PONT DE NEMOURS US x asset
ROLTA INDIA LTD ONEGIS INC. US x asset
GITANJALI GEMS LTD DIT GROUP SPA'S ASSETS IT x asset
CAMLIN FINE CHEMICALS LTDBORREGAARD ITALIA SPA IT x asset
JAGATJIT INDUSTRIES LTD GEORGE SINCLAIR GB x asset
TECHNOCRAFT INDUSTRIES (INDIA) LTDSWIFT ENGINEERING INC. CA x asset
KELLTON TECH SOLUTIONS LTDPROSOFT TECHNOLOGY GROUP INC.US x asset
PERSISTENT SYSTEMS LTD CLOUDSQUADS INC. US x asset
KPIT TECHNOLOGIES LTD I-CUBED US x asset
AMTEK AUTO LTD SCHOLZ EDELSTAHL GMBH DE x asset
SUN PHARMACEUTICAL INDUSTRIES LTDPHARMALUCENCE INC. US x asset
HINDUSTAN DORR-OLIVER LTDDAVYMARKHAM LTD GB x asset
KPIT CUMMINS INFOSYSTEMS LTDIN2SOFT GMBH DE x asset
LUPIN LTD NANOMI BV NL x asset
TITAGARH WAGONS LTD IGF INDUSTRIES FR x asset
SUPERHOUSE LTD BRIGGS INDUSTRIAL FOOTWEAR LTDGB x asset
CROMPTON GREAVES LTD POWER TECHNOLOGY SOLUTIONS LTDGB x asset
CROMPTON GREAVES LTD ZIV APLICACIONES Y TECNOLOGIA SLES x asset
INFOSYS LTD LODESTONE HOLDING AG CH x asset
NAKODA LTD POLYESTER YARN MAKING PLANTKR x asset
DR REDDYS LABORATORIES LTDNOVARTIS AG'S NICOTINE CH x asset
EID PARRY (INDIA) LTD ALIMTEC SA CL x asset
WPIL LTD MATHERS FOUNDRY LTD GB x diversification
LARSEN & TOUBRO LTD THALEST LTD GB x diversification
CROMPTON GREAVES LTD EMOTRON AB SE x diversification
PIRAMAL HEALTHCARE LTDDECISION RESOURCES LLC US x diversification
AMTEK AUTO LTD NEUMAYER TEKFOR HOLDING GMBHDE x diversification
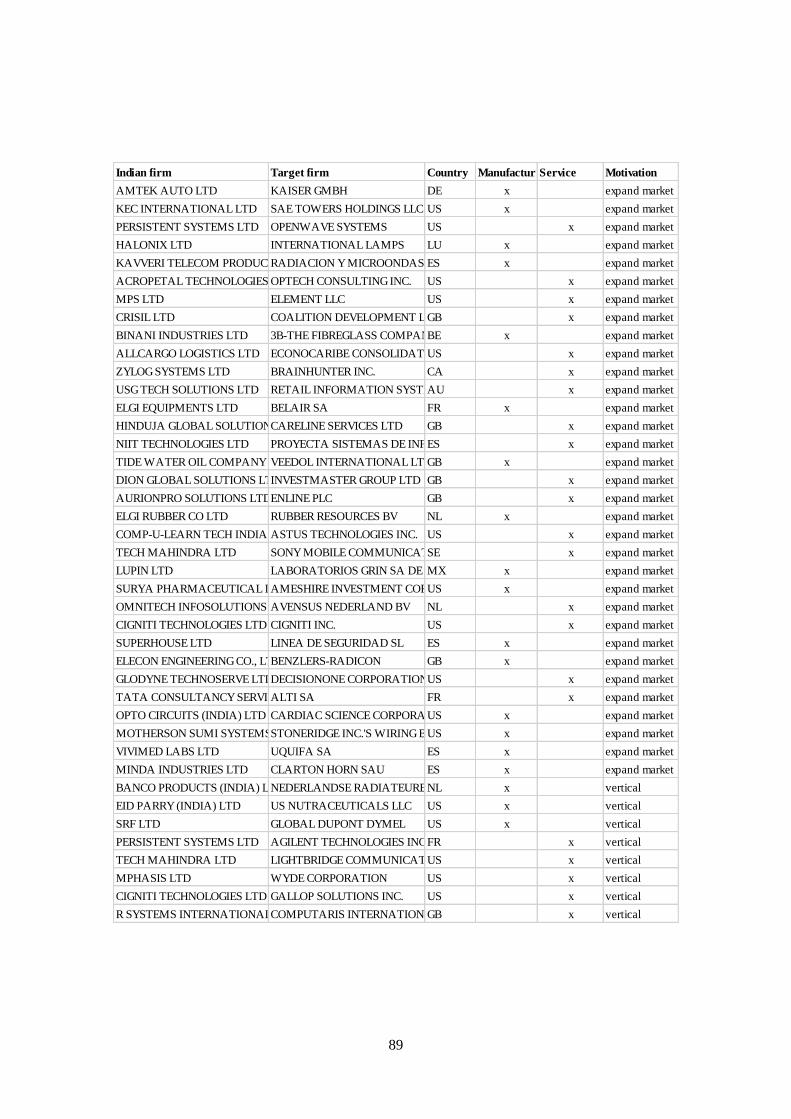
89
Indian firm Target firm Country ManufacturingService Motivation
AMTEK AUTO LTD KAISER GMBH DE x expand market
KEC INTERNATIONAL LTD SAE TOWERS HOLDINGS LLC US x expand market
PERSISTENT SYSTEMS LTD OPENWAVE SYSTEMS US x expand market
HALONIX LTD INTERNATIONAL LAMPS LU x expand market
KAVVERI TELECOM PRODUCTS LTDRADIACION Y MICROONDAS SAES x expand market
ACROPETAL TECHNOLOGIES LTDOPTECH CONSULTING INC. US x expand market
MPS LTD ELEMENT LLC US x expand market
CRISIL LTD COALITION DEVELOPMENT LTDGB x expand market
BINANI INDUSTRIES LTD 3B-THE FIBREGLASS COMPANYBE x expand market
ALLCARGO LOGISTICS LTD ECONOCARIBE CONSOLIDATORS INC.US x expand market
ZYLOG SYSTEMS LTD BRAINHUNTER INC. CA x expand market
USG TECH SOLUTIONS LTD RETAIL INFORMATION SYSTEMS AU x expand market
ELGI EQUIPMENTS LTD BELAIR SA FR x expand market
HINDUJA GLOBAL SOLUTIONS LTDCARELINE SERVICES LTD GB x expand market
NIIT TECHNOLOGIES LTD PROYECTA SISTEMAS DE INFORMACION SAES x expand market
TIDE WATER OIL COMPANY INDIA LTDVEEDOL INTERNATIONAL LTDGB x expand market
DION GLOBAL SOLUTIONS LTDINVESTMASTER GROUP LTD GB x expand market
AURIONPRO SOLUTIONS LTDENLINE PLC GB x expand market
ELGI RUBBER CO LTD RUBBER RESOURCES BV NL x expand market
COMP-U-LEARN TECH INDIA LTDASTUS TECHNOLOGIES INC. US x expand market
TECH MAHINDRA LTD SONY MOBILE COMMUNICATIONS LABSE x expand market
LUPIN LTD LABORATORIOS GRIN SA DE CVMX x expand market
SURYA PHARMACEUTICAL LTDAMESHIRE INVESTMENT CORPUS x expand market
OMNITECH INFOSOLUTIONS LTDAVENSUS NEDERLAND BV NL x expand market
CIGNITI TECHNOLOGIES LTD CIGNITI INC. US x expand market
SUPERHOUSE LTD LINEA DE SEGURIDAD SL ES x expand market
ELECON ENGINEERING CO., LTDBENZLERS-RADICON GB x expand market
GLODYNE TECHNOSERVE LTDDECISIONONE CORPORATIONUS x expand market
TATA CONSULTANCY SERVICES LTDALTI SA FR x expand market
OPTO CIRCUITS (INDIA) LTD CARDIAC SCIENCE CORPORATIONUS x expand market
MOTHERSON SUMI SYSTEMS LTDSTONERIDGE INC.'S WIRING BUSINESSUS x expand market
VIVIMED LABS LTD UQUIFA SA ES x expand market
MINDA INDUSTRIES LTD CLARTON HORN SAU ES x expand market
BANCO PRODUCTS (INDIA) LTDNEDERLANDSE RADIATEUREN FABRIEK BVNL x vertical
EID PARRY (INDIA) LTD US NUTRACEUTICALS LLC US x vertical
SRF LTD GLOBAL DUPONT DYMEL US x vertical
PERSISTENT SYSTEMS LTD AGILENT TECHNOLOGIES INC.FR x vertical
TECH MAHINDRA LTD LIGHTBRIDGE COMMUNICATIONSUS x vertical
MPHASIS LTD WYDE CORPORATION US x vertical
CIGNITI TECHNOLOGIES LTD GALLOP SOLUTIONS INC. US x vertical
R SYSTEMS INTERNATIONAL LTD+C54I64C55:C74COMPUTARIS INTERNATIONAL LTDGB x vertical
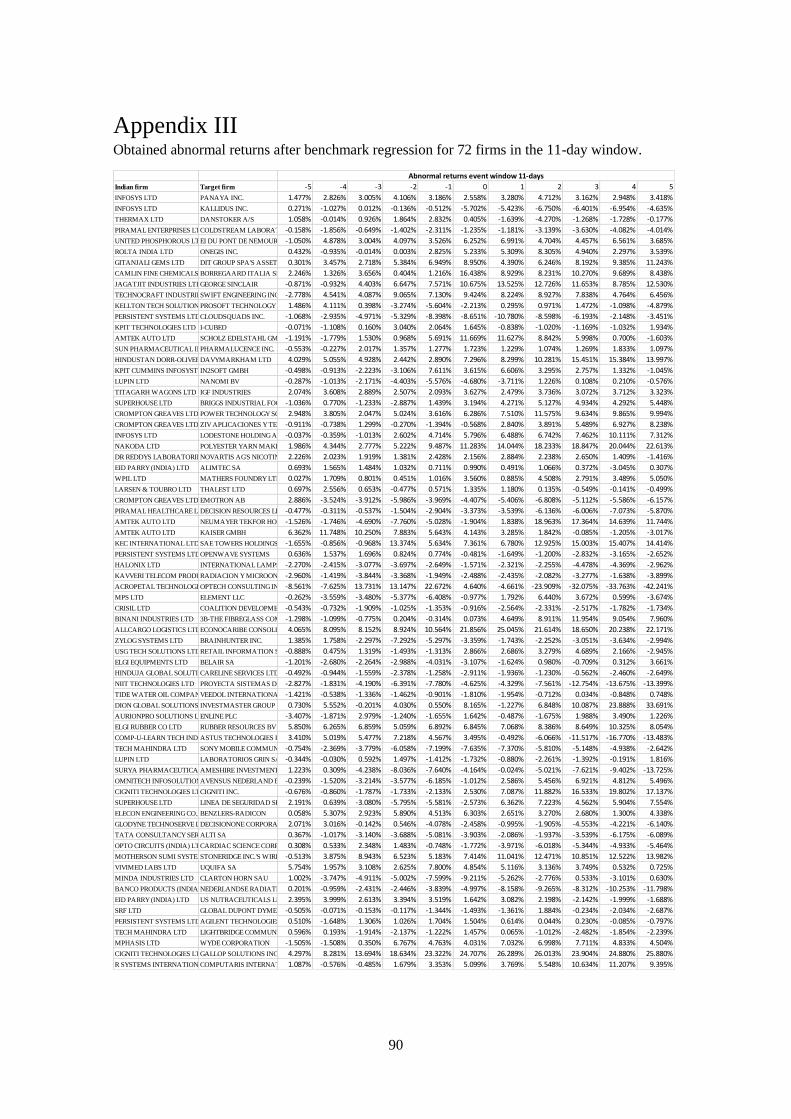
90
Appendix III Obtained abnormal returns after benchmark regression for 72 firms in the 11-day window.
Indian firm Target firm -5 -4 -3 -2 -1 0 1 2 3 4 5
INFOSYS LTD PANAYA INC. 1.477% 2.826% 3.005% 4.106% 3.186% 2.558% 3.280% 4.712% 3.162% 2.948% 3.418%
INFOSYS LTD KALLIDUS INC. 0.271% -1.027% 0.012% -0.136% -0.512% -5.702% -5.423% -6.750% -6.401% -6.954% -4.635%
THERMAX LTD DANSTOKER A/S 1.058% -0.014% 0.926% 1.864% 2.832% 0.405% -1.639% -4.270% -1.268% -1.728% -0.177%
PIRAMAL ENTERPRISES LTDCOLDSTREAM LABORATORIES -0.158% -1.856% -0.649% -1.402% -2.311% -1.235% -1.181% -3.139% -3.630% -4.082% -4.014%
UNITED PHOSPHOROUS LTDEI DU PONT DE NEMOURS -1.050% 4.878% 3.004% 4.097% 3.526% 6.252% 6.991% 4.704% 4.457% 6.561% 3.685%
ROLTA INDIA LTD ONEGIS INC. 0.432% -0.935% -0.014% 0.003% 2.825% 5.233% 5.309% 8.305% 4.940% 2.297% 3.539%
GITANJALI GEMS LTD DIT GROUP SPA'S ASSETS 0.301% 3.457% 2.718% 5.384% 6.949% 8.950% 4.390% 6.246% 8.192% 9.385% 11.243%
CAMLIN FINE CHEMICALS LTDBORREGAARD ITALIA SPA 2.246% 1.326% 3.656% 0.404% 1.216% 16.438% 8.929% 8.231% 10.270% 9.689% 8.438%
JAGATJIT INDUSTRIES LTDGEORGE SINCLAIR -0.871% -0.932% 4.403% 6.647% 7.571% 10.675% 13.525% 12.726% 11.653% 8.785% 12.530%
TECHNOCRAFT INDUSTRIES (INDIA) LTDSWIFT ENGINEERING INC. -2.778% 4.541% 4.087% 9.065% 7.130% 9.424% 8.224% 8.927% 7.838% 4.764% 6.456%
KELLTON TECH SOLUTIONS LTDPROSOFT TECHNOLOGY GROUP INC.1.486% 4.111% 0.398% -3.274% -5.604% -2.213% 0.295% 0.971% 1.472% -1.098% -4.879%
PERSISTENT SYSTEMS LTDCLOUDSQUADS INC. -1.068% -2.935% -4.971% -5.329% -8.398% -8.651% -10.780% -8.598% -6.193% -2.148% -3.451%
KPIT TECHNOLOGIES LTD I-CUBED -0.071% -1.108% 0.160% 3.040% 2.064% 1.645% -0.838% -1.020% -1.169% -1.032% 1.934%
AMTEK AUTO LTD SCHOLZ EDELSTAHL GMBH-1.191% -1.779% 1.530% 0.968% 5.691% 11.669% 11.627% 8.842% 5.998% 0.700% -1.603%
SUN PHARMACEUTICAL INDUSTRIES LTDPHARMALUCENCE INC. -0.553% -0.227% 2.017% 1.357% 1.277% 1.723% 1.229% 1.074% 1.269% 1.833% 1.097%
HINDUSTAN DORR-OLIVER LTDDAVYMARKHAM LTD 4.029% 5.055% 4.928% 2.442% 2.890% 7.296% 8.299% 10.281% 15.451% 15.384% 13.997%
KPIT CUMMINS INFOSYSTEMS LTDIN2SOFT GMBH -0.498% -0.913% -2.223% -3.106% 7.611% 3.615% 6.606% 3.295% 2.757% 1.332% -1.045%
LUPIN LTD NANOMI BV -0.287% -1.013% -2.171% -4.403% -5.576% -4.680% -3.711% 1.226% 0.108% 0.210% -0.576%
TITAGARH WAGONS LTD IGF INDUSTRIES 2.074% 3.608% 2.889% 2.507% 2.093% 3.627% 2.479% 3.736% 3.072% 3.712% 3.323%
SUPERHOUSE LTD BRIGGS INDUSTRIAL FOOTWEAR LTD-1.036% 0.770% -1.233% -2.887% 1.439% 3.194% 4.271% 5.127% 4.934% 4.292% 5.448%
CROMPTON GREAVES LTD POWER TECHNOLOGY SOLUTIONS LTD2.948% 3.805% 2.047% 5.024% 3.616% 6.286% 7.510% 11.575% 9.634% 9.865% 9.994%
CROMPTON GREAVES LTD ZIV APLICACIONES Y TECNOLOGIA SL-0.911% -0.738% 1.299% -0.270% -1.394% -0.568% 2.840% 3.891% 5.489% 6.927% 8.238%
INFOSYS LTD LODESTONE HOLDING AG -0.037% -0.359% -1.013% 2.602% 4.714% 5.796% 6.488% 6.742% 7.462% 10.111% 7.312%
NAKODA LTD POLYESTER YARN MAKING PLANT1.986% 4.344% 2.777% 5.222% 9.487% 11.283% 14.044% 18.233% 18.847% 20.044% 22.613%
DR REDDYS LABORATORIES LTDNOVARTIS AG'S NICOTINE 2.226% 2.023% 1.919% 1.381% 2.428% 2.156% 2.884% 2.238% 2.650% 1.409% -1.416%
EID PARRY (INDIA) LTD ALIMTEC SA 0.693% 1.565% 1.484% 1.032% 0.711% 0.990% 0.491% 1.066% 0.372% -3.045% 0.307%
WPIL LTD MATHERS FOUNDRY LTD 0.027% 1.709% 0.801% 0.451% 1.016% 3.560% 0.885% 4.508% 2.791% 3.489% 5.050%
LARSEN & TOUBRO LTD THALEST LTD 0.697% 2.556% 0.653% -0.477% 0.571% 1.335% 1.180% 0.135% -0.549% -0.141% -0.499%
CROMPTON GREAVES LTD EMOTRON AB 2.886% -3.524% -3.912% -5.986% -3.969% -4.407% -5.406% -6.808% -5.112% -5.586% -6.157%
PIRAMAL HEALTHCARE LTDDECISION RESOURCES LLC -0.477% -0.311% -0.537% -1.504% -2.904% -3.373% -3.539% -6.136% -6.006% -7.073% -5.870%
AMTEK AUTO LTD NEUMAYER TEKFOR HOLDING GMBH-1.526% -1.746% -4.690% -7.760% -5.028% -1.904% 1.838% 18.963% 17.364% 14.639% 11.744%
AMTEK AUTO LTD KAISER GMBH 6.362% 11.748% 10.250% 7.883% 5.643% 4.143% 3.285% 1.842% -0.085% -1.205% -3.017%
KEC INTERNATIONAL LTD SAE TOWERS HOLDINGS LLC-1.655% -0.856% -0.968% 13.374% 5.634% 7.361% 6.780% 12.925% 15.003% 15.407% 14.414%
PERSISTENT SYSTEMS LTDOPENWAVE SYSTEMS 0.636% 1.537% 1.696% 0.824% 0.774% -0.481% -1.649% -1.200% -2.832% -3.165% -2.652%
HALONIX LTD INTERNATIONAL LAMPS -2.270% -2.415% -3.077% -3.697% -2.649% -1.571% -2.321% -2.255% -4.478% -4.369% -2.962%
KAVVERI TELECOM PRODUCTS LTDRADIACION Y MICROONDAS SA-2.960% -1.419% -3.844% -3.368% -1.949% -2.488% -2.435% -2.082% -3.277% -1.638% -3.899%
ACROPETAL TECHNOLOGIES LTDOPTECH CONSULTING INC. -8.561% -7.625% 13.731% 13.147% 22.672% 4.640% -4.661% -23.909% -32.075% -33.763% -42.241%
MPS LTD ELEMENT LLC -0.262% -3.559% -3.480% -5.377% -6.408% -0.977% 1.792% 6.440% 3.672% 0.599% -3.674%
CRISIL LTD COALITION DEVELOPMENT LTD-0.543% -0.732% -1.909% -1.025% -1.353% -0.916% -2.564% -2.331% -2.517% -1.782% -1.734%
BINANI INDUSTRIES LTD 3B-THE FIBREGLASS COMPANY-1.298% -1.099% -0.775% 0.204% -0.314% 0.073% 4.649% 8.911% 11.954% 9.054% 7.960%
ALLCARGO LOGISTICS LTDECONOCARIBE CONSOLIDATORS INC.4.065% 8.095% 8.152% 8.924% 10.564% 21.856% 25.045% 21.614% 18.650% 20.238% 22.171%
ZYLOG SYSTEMS LTD BRAINHUNTER INC. 1.385% 1.758% -2.297% -7.292% -5.297% -3.359% -1.743% -2.252% -3.051% -3.634% -2.994%
USG TECH SOLUTIONS LTDRETAIL INFORMATION SYSTEMS -0.888% 0.475% 1.319% -1.493% -1.313% 2.866% 2.686% 3.279% 4.689% 2.166% -2.945%
ELGI EQUIPMENTS LTD BELAIR SA -1.201% -2.680% -2.264% -2.988% -4.031% -3.107% -1.624% 0.980% -0.709% 0.312% 3.661%
HINDUJA GLOBAL SOLUTIONS LTDCARELINE SERVICES LTD -0.492% -0.944% -1.559% -2.378% -1.258% -2.911% -1.936% -1.230% -0.562% -2.460% -2.649%
NIIT TECHNOLOGIES LTD PROYECTA SISTEMAS DE INFORMACION SA-2.827% -1.831% -4.190% -6.391% -7.780% -4.625% -4.329% -7.561% -12.754% -13.675% -13.399%
TIDE WATER OIL COMPANY INDIA LTDVEEDOL INTERNATIONAL LTD-1.421% -0.538% -1.336% -1.462% -0.901% -1.810% -1.954% -0.712% 0.034% -0.848% 0.748%
DION GLOBAL SOLUTIONS LTDINVESTMASTER GROUP LTD0.730% 5.552% -0.201% 4.030% 0.550% 8.165% -1.227% 6.848% 10.087% 23.888% 33.691%
AURIONPRO SOLUTIONS LTDENLINE PLC -3.407% -1.871% 2.979% -1.240% -1.655% 1.642% -0.487% -1.675% 1.988% 3.490% 1.226%
ELGI RUBBER CO LTD RUBBER RESOURCES BV 5.850% 6.265% 6.859% 5.059% 6.892% 6.845% 7.068% 8.386% 8.649% 10.325% 8.054%
COMP-U-LEARN TECH INDIA LTDASTUS TECHNOLOGIES INC.3.410% 5.019% 5.477% 7.218% 4.567% 3.495% -0.492% -6.066% -11.517% -16.770% -13.483%
TECH MAHINDRA LTD SONY MOBILE COMMUNICATIONS LAB-0.754% -2.369% -3.779% -6.058% -7.199% -7.635% -7.370% -5.810% -5.148% -4.938% -2.642%
LUPIN LTD LABORATORIOS GRIN SA DE CV-0.344% -0.030% 0.592% 1.497% -1.412% -1.732% -0.880% -2.261% -1.392% -0.191% 1.816%
SURYA PHARMACEUTICAL LTDAMESHIRE INVESTMENT CORP1.223% 0.309% -4.238% -8.036% -7.640% -4.164% -0.024% -5.021% -7.621% -9.402% -13.725%
OMNITECH INFOSOLUTIONS LTDAVENSUS NEDERLAND BV -0.239% -1.520% -3.214% -3.577% -6.185% -1.012% 2.586% 5.456% 6.921% 4.812% 5.496%
CIGNITI TECHNOLOGIES LTDCIGNITI INC. -0.676% -0.860% -1.787% -1.733% -2.133% 2.530% 7.087% 11.882% 16.533% 19.802% 17.137%
SUPERHOUSE LTD LINEA DE SEGURIDAD SL 2.191% 0.639% -3.080% -5.795% -5.581% -2.573% 6.362% 7.223% 4.562% 5.904% 7.554%
ELECON ENGINEERING CO., LTDBENZLERS-RADICON 0.058% 5.307% 2.923% 5.890% 4.513% 6.303% 2.651% 3.270% 2.680% 1.300% 4.338%
GLODYNE TECHNOSERVE LTDDECISIONONE CORPORATION2.071% 3.016% -0.142% 0.546% -4.078% -2.458% -0.995% -1.905% -4.553% -4.221% -6.140%
TATA CONSULTANCY SERVICES LTDALTI SA 0.367% -1.017% -3.140% -3.688% -5.081% -3.903% -2.086% -1.937% -3.539% -6.175% -6.089%
OPTO CIRCUITS (INDIA) LTDCARDIAC SCIENCE CORPORATION0.308% 0.533% 2.348% 1.483% -0.748% -1.772% -3.971% -6.018% -5.344% -4.933% -5.464%
MOTHERSON SUMI SYSTEMS LTDSTONERIDGE INC.'S WIRING BUSINESS-0.513% 3.875% 8.943% 6.523% 5.183% 7.414% 11.041% 12.471% 10.851% 12.522% 13.982%
VIVIMED LABS LTD UQUIFA SA 5.754% 1.957% 3.108% 2.625% 7.800% 4.854% 5.116% 3.136% 3.749% 0.532% 0.725%
MINDA INDUSTRIES LTD CLARTON HORN SAU 1.002% -3.747% -4.911% -5.002% -7.599% -9.211% -5.262% -2.776% 0.533% -3.101% 0.630%
BANCO PRODUCTS (INDIA) LTDNEDERLANDSE RADIATEUREN FABRIEK BV0.201% -0.959% -2.431% -2.446% -3.839% -4.997% -8.158% -9.265% -8.312% -10.253% -11.798%
EID PARRY (INDIA) LTD US NUTRACEUTICALS LLC 2.395% 3.999% 2.613% 3.394% 3.519% 1.642% 3.082% 2.198% -2.142% -1.999% -1.688%
SRF LTD GLOBAL DUPONT DYMEL -0.505% -0.071% -0.153% -0.117% -1.344% -1.493% -1.361% 1.884% -0.234% -2.034% -2.687%
PERSISTENT SYSTEMS LTDAGILENT TECHNOLOGIES INC.0.510% -1.648% 1.306% 1.026% 1.704% 1.504% 0.614% 0.044% 0.230% -0.085% -0.797%
TECH MAHINDRA LTD LIGHTBRIDGE COMMUNICATIONS0.596% 0.193% -1.914% -2.137% -1.222% 1.457% 0.065% -1.012% -2.482% -1.854% -2.239%
MPHASIS LTD WYDE CORPORATION -1.505% -1.508% 0.350% 6.767% 4.763% 4.031% 7.032% 6.998% 7.711% 4.833% 4.504%
CIGNITI TECHNOLOGIES LTDGALLOP SOLUTIONS INC. 4.297% 8.281% 13.694% 18.634% 23.322% 24.707% 26.289% 26.013% 23.904% 24.880% 25.880%
R SYSTEMS INTERNATIONAL LTD+C54I64C55:C74COMPUTARIS INTERNATIONAL LTD1.087% -0.576% -0.485% 1.679% 3.353% 5.099% 3.769% 5.548% 10.634% 11.207% 9.395%
Abnormal returns event window 11-days
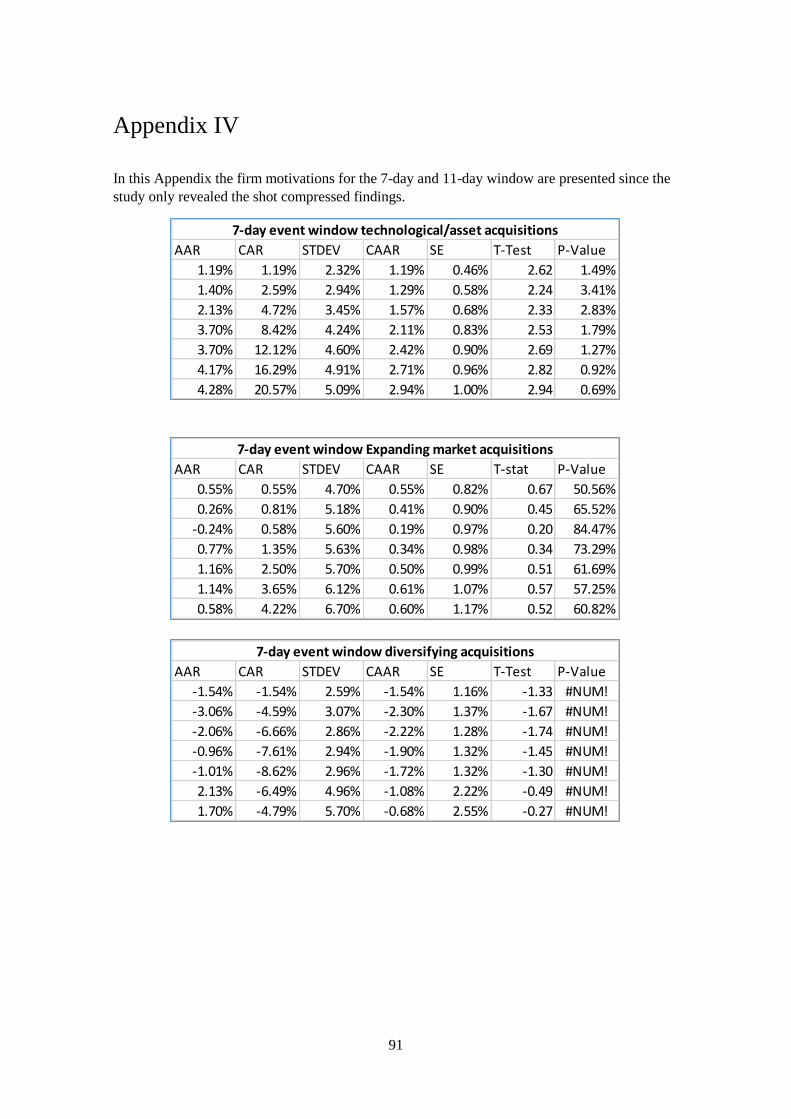
91
Appendix IV
In this Appendix the firm motivations for the 7-day and 11-day window are presented since the
study only revealed the shot compressed findings.
AAR CAR STDEV CAAR SE T-Test P-Value
1.19% 1.19% 2.32% 1.19% 0.46% 2.62 1.49%
1.40% 2.59% 2.94% 1.29% 0.58% 2.24 3.41%
2.13% 4.72% 3.45% 1.57% 0.68% 2.33 2.83%
3.70% 8.42% 4.24% 2.11% 0.83% 2.53 1.79%
3.70% 12.12% 4.60% 2.42% 0.90% 2.69 1.27%
4.17% 16.29% 4.91% 2.71% 0.96% 2.82 0.92%
4.28% 20.57% 5.09% 2.94% 1.00% 2.94 0.69%
7-day event window technological/asset acquisitions
AAR CAR STDEV CAAR SE T-stat P-Value
0.55% 0.55% 4.70% 0.55% 0.82% 0.67 50.56%
0.26% 0.81% 5.18% 0.41% 0.90% 0.45 65.52%
-0.24% 0.58% 5.60% 0.19% 0.97% 0.20 84.47%
0.77% 1.35% 5.63% 0.34% 0.98% 0.34 73.29%
1.16% 2.50% 5.70% 0.50% 0.99% 0.51 61.69%
1.14% 3.65% 6.12% 0.61% 1.07% 0.57 57.25%
0.58% 4.22% 6.70% 0.60% 1.17% 0.52 60.82%
7-day event window Expanding market acquisitions
AAR CAR STDEV CAAR SE T-Test P-Value
-1.54% -1.54% 2.59% -1.54% 1.16% -1.33 #NUM!
-3.06% -4.59% 3.07% -2.30% 1.37% -1.67 #NUM!
-2.06% -6.66% 2.86% -2.22% 1.28% -1.74 #NUM!
-0.96% -7.61% 2.94% -1.90% 1.32% -1.45 #NUM!
-1.01% -8.62% 2.96% -1.72% 1.32% -1.30 #NUM!
2.13% -6.49% 4.96% -1.08% 2.22% -0.49 #NUM!
1.70% -4.79% 5.70% -0.68% 2.55% -0.27 #NUM!
7-day event window diversifying acquisitions

92
AAR CAR STDEV CAAR SE T-stat P-Value
1.62% 1.62% 5.14% 1.62% 1.82% 0.89 40.16%
3.35% 4.97% 5.92% 2.49% 2.09% 1.19 27.38%
3.78% 8.75% 6.70% 2.92% 2.37% 1.23 25.76%
3.99% 12.75% 7.18% 3.19% 2.54% 1.26 24.96%
3.92% 16.66% 7.70% 3.33% 2.72% 1.22 26.04%
4.05% 20.72% 8.04% 3.45% 2.84% 1.22 26.37%
3.66% 24.38% 8.26% 3.48% 2.92% 1.19 27.19%
7-day event window vertical acquisitions
AAR CAR STDEV CAAR SE T-stat P-Value
0.15% 0.15% 2.89% 0.15% 0.50% 0.31 76.08%
0.64% 0.79% 3.37% 0.40% 0.59% 0.67 50.59%
0.55% 1.34% 3.84% 0.45% 0.67% 0.67 50.88%
0.26% 1.60% 4.35% 0.40% 0.76% 0.53 60.06%
-0.24% 1.37% 4.82% 0.27% 0.84% 0.33 74.67%
0.77% 2.14% 4.98% 0.36% 0.87% 0.41 68.37%
1.16% 3.29% 5.13% 0.47% 0.89% 0.53 60.20%
1.14% 4.44% 5.56% 0.55% 0.97% 0.57 57.06%
0.58% 5.01% 6.11% 0.56% 1.06% 0.52 60.40%
0.43% 5.44% 6.74% 0.54% 1.17% 0.46 64.60%
0.42% 5.86% 7.44% 0.53% 1.30% 0.41 68.35%
11-day window Expanding market acquisitions
AAR CAR STDEV CAAR SE T-Test P-Value
0.32% 0.32% 1.65% 0.32% 0.74% 0.44 68.52%
-0.26% 0.06% 2.01% 0.03% 0.90% 0.03 48.78%
-1.54% -1.48% 2.26% -0.49% 1.01% -0.49 #NUM!
-3.06% -4.53% 2.79% -1.13% 1.25% -0.91 #NUM!
-2.06% -6.60% 2.75% -1.32% 1.23% -1.07 #NUM!
-0.96% -7.55% 2.79% -1.26% 1.25% -1.01 #NUM!
-1.01% -8.56% 2.81% -1.22% 1.26% -0.97 #NUM!
2.13% -6.43% 4.41% -0.53% 1.97% -0.27 #NUM!
1.70% -4.73% 5.10% -0.53% 2.28% -0.23 #NUM!
1.07% -3.67% 5.45% -0.37% 2.44% -0.15 #NUM!
0.85% -2.81% 5.61% -0.26% 2.51% -0.10 #NUM!
11-day event window diversifying acquisitions
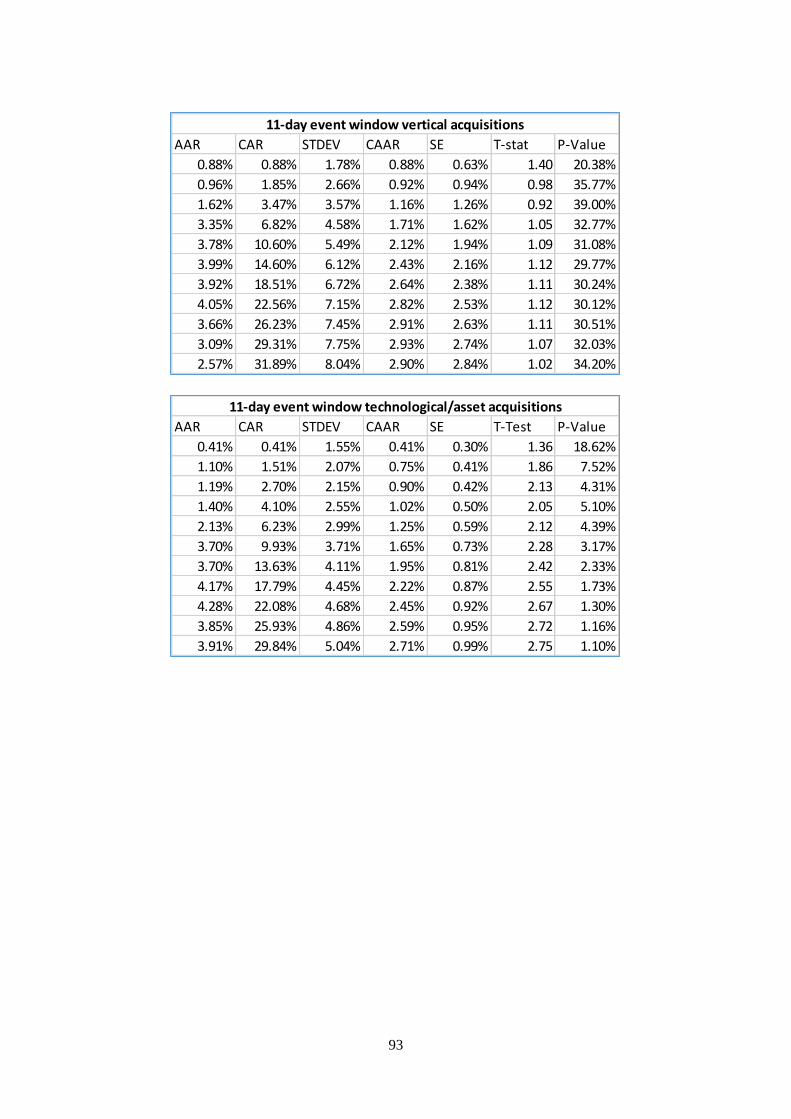
93
AAR CAR STDEV CAAR SE T-stat P-Value
0.88% 0.88% 1.78% 0.88% 0.63% 1.40 20.38%
0.96% 1.85% 2.66% 0.92% 0.94% 0.98 35.77%
1.62% 3.47% 3.57% 1.16% 1.26% 0.92 39.00%
3.35% 6.82% 4.58% 1.71% 1.62% 1.05 32.77%
3.78% 10.60% 5.49% 2.12% 1.94% 1.09 31.08%
3.99% 14.60% 6.12% 2.43% 2.16% 1.12 29.77%
3.92% 18.51% 6.72% 2.64% 2.38% 1.11 30.24%
4.05% 22.56% 7.15% 2.82% 2.53% 1.12 30.12%
3.66% 26.23% 7.45% 2.91% 2.63% 1.11 30.51%
3.09% 29.31% 7.75% 2.93% 2.74% 1.07 32.03%
2.57% 31.89% 8.04% 2.90% 2.84% 1.02 34.20%
11-day event window vertical acquisitions
AAR CAR STDEV CAAR SE T-Test P-Value
0.41% 0.41% 1.55% 0.41% 0.30% 1.36 18.62%
1.10% 1.51% 2.07% 0.75% 0.41% 1.86 7.52%
1.19% 2.70% 2.15% 0.90% 0.42% 2.13 4.31%
1.40% 4.10% 2.55% 1.02% 0.50% 2.05 5.10%
2.13% 6.23% 2.99% 1.25% 0.59% 2.12 4.39%
3.70% 9.93% 3.71% 1.65% 0.73% 2.28 3.17%
3.70% 13.63% 4.11% 1.95% 0.81% 2.42 2.33%
4.17% 17.79% 4.45% 2.22% 0.87% 2.55 1.73%
4.28% 22.08% 4.68% 2.45% 0.92% 2.67 1.30%
3.85% 25.93% 4.86% 2.59% 0.95% 2.72 1.16%
3.91% 29.84% 5.04% 2.71% 0.99% 2.75 1.10%
11-day event window technological/asset acquisitions
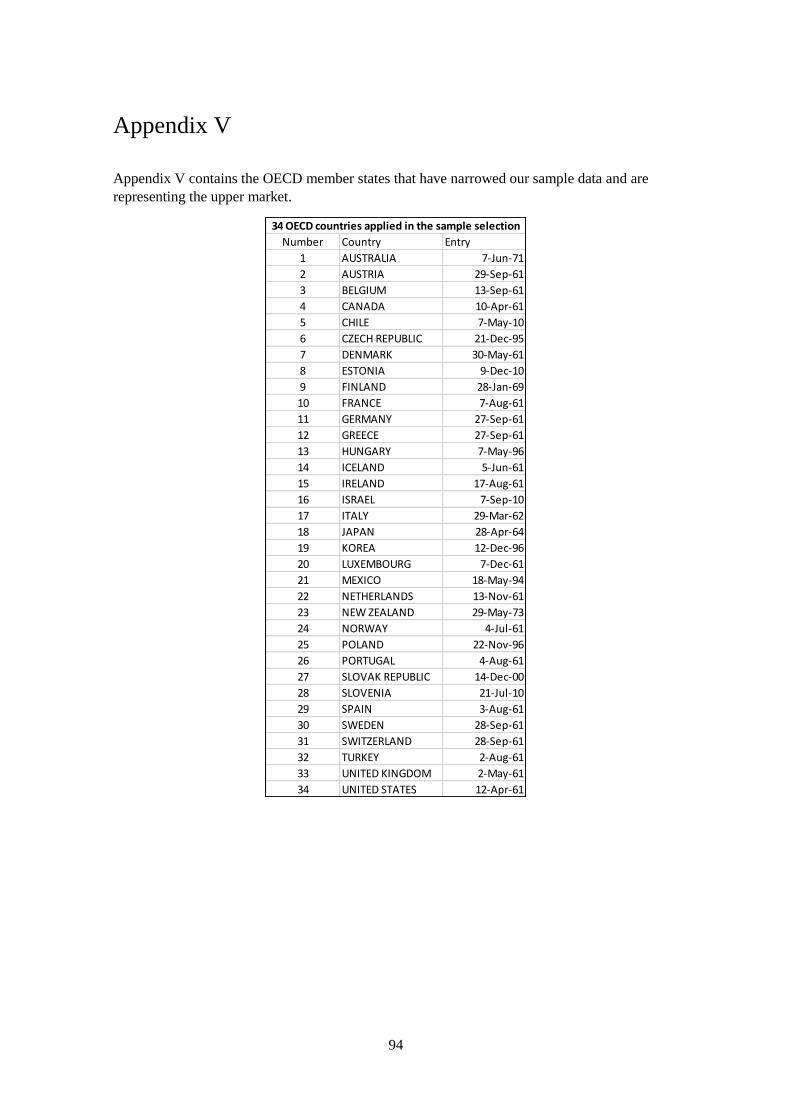
94
Appendix V
Appendix V contains the OECD member states that have narrowed our sample data and are
representing the upper market.
Number Country Entry
1 AUSTRALIA 7-Jun-71
2 AUSTRIA 29-Sep-61
3 BELGIUM 13-Sep-61
4 CANADA 10-Apr-61
5 CHILE 7-May-10
6 CZECH REPUBLIC 21-Dec-95
7 DENMARK 30-May-61
8 ESTONIA 9-Dec-10
9 FINLAND 28-Jan-69
10 FRANCE 7-Aug-61
11 GERMANY 27-Sep-61
12 GREECE 27-Sep-61
13 HUNGARY 7-May-96
14 ICELAND 5-Jun-61
15 IRELAND 17-Aug-61
16 ISRAEL 7-Sep-10
17 ITALY 29-Mar-62
18 JAPAN 28-Apr-64
19 KOREA 12-Dec-96
20 LUXEMBOURG 7-Dec-61
21 MEXICO 18-May-94
22 NETHERLANDS 13-Nov-61
23 NEW ZEALAND 29-May-73
24 NORWAY 4-Jul-61
25 POLAND 22-Nov-96
26 PORTUGAL 4-Aug-61
27 SLOVAK REPUBLIC 14-Dec-00
28 SLOVENIA 21-Jul-10
29 SPAIN 3-Aug-61
30 SWEDEN 28-Sep-61
31 SWITZERLAND 28-Sep-61
32 TURKEY 2-Aug-61
33 UNITED KINGDOM 2-May-61
34 UNITED STATES 12-Apr-61
34 OECD countries applied in the sample selection