Coordinative metabolism of glutamine carbon and nitrogen ... · Coordinative metabolism of...
14
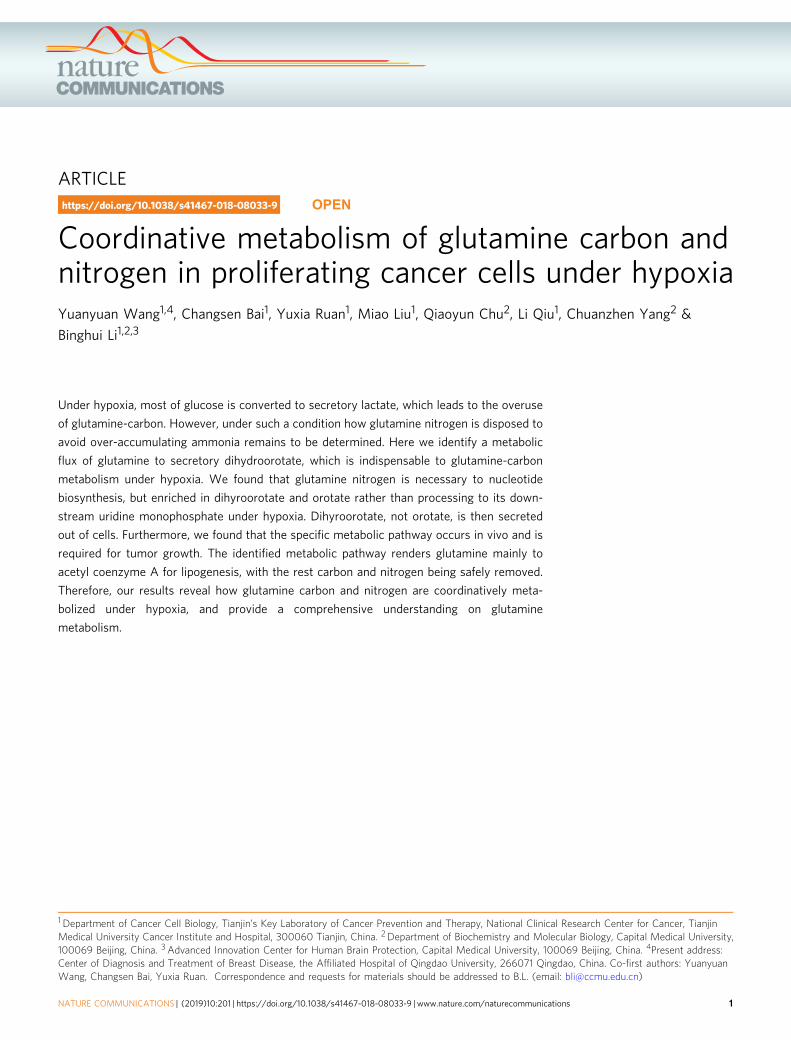
ARTICLE Coordinative metabolism of glutamine carbon and nitrogen in proliferating cancer cells under hypoxia Yuanyuan Wang 1,4 , Changsen Bai 1 , Yuxia Ruan 1 , Miao Liu 1 , Qiaoyun Chu 2 , Li Qiu 1 , Chuanzhen Yang 2 & Binghui Li 1,2,3 Under hypoxia, most of glucose is converted to secretory lactate, which leads to the overuse of glutamine-carbon. However, under such a condition how glutamine nitrogen is disposed to avoid over-accumulating ammonia remains to be determined. Here we identify a metabolic flux of glutamine to secretory dihydroorotate, which is indispensable to glutamine-carbon metabolism under hypoxia. We found that glutamine nitrogen is necessary to nucleotide biosynthesis, but enriched in dihyroorotate and orotate rather than processing to its down- stream uridine monophosphate under hypoxia. Dihyroorotate, not orotate, is then secreted out of cells. Furthermore, we found that the specific metabolic pathway occurs in vivo and is required for tumor growth. The identified metabolic pathway renders glutamine mainly to acetyl coenzyme A for lipogenesis, with the rest carbon and nitrogen being safely removed. Therefore, our results reveal how glutamine carbon and nitrogen are coordinatively meta- bolized under hypoxia, and provide a comprehensive understanding on glutamine metabolism. https://doi.org/10.1038/s41467-018-08033-9 OPEN 1 Department of Cancer Cell Biology, Tianjin’s Key Laboratory of Cancer Prevention and Therapy, National Clinical Research Center for Cancer, Tianjin Medical University Cancer Institute and Hospital, 300060 Tianjin, China. 2 Department of Biochemistry and Molecular Biology, Capital Medical University, 100069 Beijing, China. 3 Advanced Innovation Center for Human Brain Protection, Capital Medical University, 100069 Beijing, China. 4 Present address: Center of Diagnosis and Treatment of Breast Disease, the Affiliated Hospital of Qingdao University, 266071 Qingdao, China. Co-first authors: Yuanyuan Wang, Changsen Bai, Yuxia Ruan. Correspondence and requests for materials should be addressed to B.L. (email: [email protected]) NATURE COMMUNICATIONS | (2019)10:201 | https://doi.org/10.1038/s41467-018-08033-9 | www.nature.com/naturecommunications 1 1234567890():,;
Transcript of Coordinative metabolism of glutamine carbon and nitrogen ... · Coordinative metabolism of...
ARTICLE
Coordinative metabolism of glutamine carbon andnitrogen in proliferating cancer cells under hypoxiaYuanyuan Wang1,4, Changsen Bai1, Yuxia Ruan1, Miao Liu1, Qiaoyun Chu2, Li Qiu1, Chuanzhen Yang2 &
Binghui Li1,2,3
Under hypoxia, most of glucose is converted to secretory lactate, which leads to the overuse
of glutamine-carbon. However, under such a condition how glutamine nitrogen is disposed to
avoid over-accumulating ammonia remains to be determined. Here we identify a metabolic
flux of glutamine to secretory dihydroorotate, which is indispensable to glutamine-carbon
metabolism under hypoxia. We found that glutamine nitrogen is necessary to nucleotide
biosynthesis, but enriched in dihyroorotate and orotate rather than processing to its down-
stream uridine monophosphate under hypoxia. Dihyroorotate, not orotate, is then secreted
out of cells. Furthermore, we found that the specific metabolic pathway occurs in vivo and is
required for tumor growth. The identified metabolic pathway renders glutamine mainly to
acetyl coenzyme A for lipogenesis, with the rest carbon and nitrogen being safely removed.
Therefore, our results reveal how glutamine carbon and nitrogen are coordinatively meta-
bolized under hypoxia, and provide a comprehensive understanding on glutamine
metabolism.
https://doi.org/10.1038/s41467-018-08033-9 OPEN
1 Department of Cancer Cell Biology, Tianjin’s Key Laboratory of Cancer Prevention and Therapy, National Clinical Research Center for Cancer, TianjinMedical University Cancer Institute and Hospital, 300060 Tianjin, China. 2 Department of Biochemistry and Molecular Biology, Capital Medical University,100069 Beijing, China. 3 Advanced Innovation Center for Human Brain Protection, Capital Medical University, 100069 Beijing, China. 4Present address:Center of Diagnosis and Treatment of Breast Disease, the Affiliated Hospital of Qingdao University, 266071 Qingdao, China. Co-first authors: YuanyuanWang, Changsen Bai, Yuxia Ruan. Correspondence and requests for materials should be addressed to B.L. (email: [email protected])
NATURE COMMUNICATIONS | (2019) 10:201 | https://doi.org/10.1038/s41467-018-08033-9 | www.nature.com/naturecommunications 1
1234
5678
90():,;
Proliferating cancer cells comprehensively rewire theirmetabolism to sustain growth and survival in the harshconditions, such as hypoxia and nutrition deficiency1. Upon
the resurgence of research interest into cancer metabolism,aberrant glucose utilization has been centrally studied recently. Asa famous hallmark of cancers, aerobic glycolysis, termed theWarburg effect, is characterized by the increased metabolic flux ofglucose to secretory lactate2. This process leads to the lack ofcarbon source from glucose to make building bricks, especiallylipids, for cell proliferation. Therefore, the alternative carbonsource is required for cell growth. Second to glucose, glutamine,the most abundant amino acid in the human blood3, can serve asa ready source of carbon to support energy generation and bio-mass accumulation.
Glutamine plays a pleiotropic role in cellular functions4.Directly, glutamine can be incorporated to protein, and regulateprotein translation and trafficking5. Through catabolic transfor-mations, glutamine provides carbon and nitrogen for the bio-synthesis of non-essential amino acids5 and nucleotides6,7. Inaddition, glutamine can also forward fuel the citric acid cycle(CAC)8,9. Under hypoxia, the glutamine consumption in pro-liferating cells is elevated, and it preferentially provides carbon forfatty acid biosynthesis through reductive carboxylation10, bywhich glutamine-derived α-ketoglutarate is reduced to citric acidby isocitrate dehydrogenases with NADPH oxidizing to NADP+.
One glutamine contains five carbon atoms and two nitrogenatoms in the forms of amine and amide groups. When cells beginto addict to glutamine carbon, which usually happens on pro-liferating cancer cells under hypoxia4, how do they deal with thepotentially overflowed nitrogen? It has long been supposed thatglutamine offers α-ketoglutarate for cells by deamination throughglutaminase (GLS)11 and glutamate dehydrogenase (GLUD)9.Concomitantly with these processes, the increasing amount ofammonia is produced and could be toxic to cells12,13. Although arecent report showed that breast cancer cells could slightly recycleammonia to generate amino acids through GLUD14, GLUD-mediated conversion of ammonia and α-ketoglutarate to gluta-mate does not efficiently occur in most of cancer cells4,15. Toavoid over-accumulating ammonia, the best way for proliferatingcancer cells is to reduce its generation. Therefore, how glutaminenitrogen is coordinatively metabolized to avoid releasingammonia deserves to be further determined.
Different elements in a metabolite usually have differentmetabolic fates, thus their coordinative metabolism is critical tomaintain the metabolic homeostasis in cells. Once the changedmicroenvironment perturbs the homeostasis, re-building a newcoordinative metabolism is required. Here we show that hypoxiaalters glutamine metabolism and drives a new metabolic home-ostasis of its carbon and nitrogen.
ResultsRequirement of glutamine-nitrogen for cell survival. Glutamineis required for cell survival16–19, and its loss induced cell death(Supplementary Fig. 1a). Supplementation with nucleosides, butnot α-ketoglutarate and non-essential amino acids includingglutamate, significantly suppressed cell death in MCF-7, HeLa,and A549 cells induced by glutamine loss (SupplementaryFig. 1a–1c), supporting the well-established notion that glutamineis necessary for nucleotide biosynthesis6. In fact, glutamine can bepotentially synthesized from glutamate by glutamine synthetase(GS) (Supplementary Fig. 2a). However, glutamine deprivationled to a dramatic loss of cellular glutamine (about 5% of thecontrol) but showed no or less effect on other non-essentialamino acids and the intermediates in the CAC in MCF-7 andHeLa cells (Supplementary Fig. 2b, c). Notably, the culture
medium did not contain non-essential amino acids includingglutamate. It suggests that cells could synthesize glutamate fromα-ketoglutarate (Supplementary Fig. 2a). We then used thelabeled carbon source, 13C6-glucose, to culture MCF-7 and HeLacells, and the 13C tracing analysis showed that α-ketoglutarateand glutamate were substantially labeled by 13C even in thepresence of glutamine but the glucose-derived fraction sig-nificantly increased in the absence of glutamine (SupplementaryFig. 2d). Nonetheless, glutamine was not labeled at all in thepresence of glutamine but slightly labeled, when compared to α-ketoglutarate and glutamate, in the absence of glutamine (Sup-plementary Fig. 2d). These results suggest that glutamine cannotbe efficiently synthesized in cells even upon its scarcity, and itcould be attributed to the low level of GS. We then over-expressedGS in MCF-7 cells (Supplementary Fig. 1d), and found it dra-matically increased the labeling of glutamine, but not glutamateand α-ketoglutarate, by 13C6-glucose (Supplementary Fig. 2e). GSexpression also inhibited cell death and restored cell proliferationupon supplementation with glutamate, α-ketoglutarate or pyr-uvate in MCF-7, HeLa, and A549 cells in the absence of gluta-mine (Supplementary Fig. 1e). Conversely, GS knockdownsensitized cells to glutamine loss independently of supplementa-tion of nutrients (Supplementary Fig. 1f). These data suggest thatglutamine amide-nitrogen is indispensable to cell proliferation.When glutamine nitrogen is used, its carbon, if beyond biomassaccumulation, could be oxidized via the CAC. However, when thecellular requirement of glutamine carbon is increased in someconditions, such as under hypoxia, how do cells metabolicallydispose of the overflowed nitrogen?
Hypoxia increases glutamine uptake and decreases ammoniaproduction. Under hypoxia, glutamine was used as the majorcarbon source, especially for lipid biosynthesis (Fig. 1a)10. Indeed,we detected a significantly increased uptake of glutamine butdecreased excretion of glutamate in MCF-7, HeLa, and 4T1 cells(Fig. 1b and Supplementary Fig. 3a), suggesting an elevatedintracellular utilization of glutamine-carbon under hypoxia. Wethen traced the metabolic flux of U-13C-labeled glutamine.Consistent with the previous report10, the fraction of glutamine-derived acetyl-CoA m+ 2, the precursor of lipogenesis, was sig-nificantly enhanced (Fig. 1c). In addition, the increased enrich-ment of glutamine-13C in α-ketoglutarate, citrate, glutamate, andproline, downstream metabolites of glutamine, was also detected(Fig. 1d, e and Supplementary Figs. 4 and 5). These data suggestthe increased uptake of glutamine as the carbon source underhypoxia. Next, we tried to figure out the metabolic fate of glu-tamine nitrogen under hypoxia. Glutamine can be deaminatedand release its nitrogen as ammonia4 (Fig. 1a), thus we measuredthe ammonia in the culture medium. As showed in Fig. 1f, theproduction of ammonia was actually significantly decreased.Ammonia can be removed by forming urea in human body20,21,and we did not detect urea in the culture medium but measured adecreased level of intracellular urea (Fig. 1g). In addition, we alsodetected a decreased excretion of alanine, the potential ammoniacarrier21, in the medium (Supplementary Fig. 3b). Therefore,glutamine-nitrogen should be enriched in some other cellularmetabolites under hypoxia.
Accumulation of cellular nucleotide precursors under hypoxia.We then used HeLa and 4T1 cell lines as the models to screen thenitrogen metabolome including 226 nitrogen-contained metabo-lites. Hypoxia significantly (P < 0.05) increased six and decreased11 overlapped metabolites in both HeLa and 4T1 cells (Fig. 2a).Interestingly, five increased compounds, including dihydroor-otate, orotate, IMP, guanosine, and inosine, were involved in the
ARTICLE NATURE COMMUNICATIONS | https://doi.org/10.1038/s41467-018-08033-9
2 NATURE COMMUNICATIONS | (2019) 10:201 | https://doi.org/10.1038/s41467-018-08033-9 | www.nature.com/naturecommunications

nucleotide biosynthesis pathway (Fig. 2b). We verified again thatIMP, the precursor of AMP and GMP, significantly enhanced andcarbamoyl-Asp, dihydroorotate, and orotate, the precursors ofUMP, dramatically increased in HeLa, MCF-7, and 4T1 cellsunder hypoxia (Fig. 2c, d). Furthermore, we measured the cellularnucleotides and their derivatives in HeLa and MCF-7 cells underhypoxia. As shown in Fig. 2e, only the cellular GMP raised uponhypoxia. On the contrary, UMP and its derivatives, UDP, UTP,and CTP, even reduced under hypoxia (Fig. 2e), which was alsosupported by the metabolomic profiling that UTP and thymidinetriphosphate (dTTP), the other UMP derivative, were observed todecrease in the hypoxic cells (Fig. 2a).
Surprisingly, the metabolomic analysis showed that aspartate,the major precursor for carbamoyl-Asp, dihydroorotate, andorotate (Fig. 2b), significantly declined under hypoxia (Fig. 2a),which was confirmed again in MCF-7, HeLa, and 4T1 cells(Fig. 2d). We further measured the levels of cellular amino acidsin MCF-7 and HeLa cells under hypoxia and normoxia. Weobserved the increased cellular glutamine and glutamate in both
cell lines under hypoxia (Supplementary Fig. 6), which shouldresult from the increased uptake of glutamine (Fig. 1b).Intriguingly, our results in MCF-7 and HeLa cells clearlyindicated that only aspartate significantly decreased in both celllines (Supplementary Fig. 6). This could explain why accumulatedIMP (Fig. 2c) led to an increase in GMP but not in AMP (Fig. 2e),because the conversion of IMP to AMP required aspartateparticipation (Fig. 2b).
Taken together, these data indicate that hypoxia substantiallylead to the accumulation of cellular nucleotide precursors, inparticular pyrimidine precursors including carbamoyl-Asp,dihydroorotate, and orotate.
Glutamine-nitrogen is enriched in dihydroorotate and orotateunder hypoxia. Now we traced the assimilation of glutamine-nitrogen using amide-15N-labeled or amine-15N-labeled gluta-mine in HeLa and MCF-7 cells. Glutamine amine-15N can beassimilated into both purine and pyrimidine nucleotides with one
b
Rel
ativ
e up
take
(nor
mal
ized
by
cell.
h)
Gln
e
(Amide-N)
a
Glutamate
NH3
Amino acids
NH3
Glutamine
Asparaginenucleotides
α-Ketoglutarate(Carbon)
Citrate Ac-CoA
Glucose
Hypoxia
Normoxia
(Amine-N)
O O
NH3+
O–C
CC
CC
Lipid
HeLa
cMCF-7
**
d
**
**
UreaR
elat
ive
abun
danc
e
gfR
elat
ive
excr
etio
n(n
orm
aliz
ed b
y ce
ll.h)
NH3
4T1
HeLaMCF-7 4T1
HeLaMCF-7 4T1
0
0.4
0.8
1.2
1.6
0
40
60
80
100
20
0
0.4
0.8
1.2
0
0.4
0.8
1.2
0
40
60
80
100
20
0
40
60
80
100
20
0
40
60
80
100
20
0
40
60
80
100
20
0
40
60
80
100
20
**
****
**
0
40
60
80
100
20
0
40
60
80
100
20
0
40
60
80
100
20
Normoxia Hypoxia
m+0
m+2
Gln Glu Pro Gln Glu Pro Gln Glu Pro
m+0
m+2
m+0
m+2
α-KG
Citrat
e
MCF-7
HeLa
4T1
MCF-7
HeLa
MCF-7
HeLa
4T1
MCF-7
HeLa
4T1
α-KG
Citrat
eα-K
G
Citrat
e
H2N
(Amine-N)
(Amine-N)
(Amide-N)
(Amide-N)
13C
5-G
ln-d
eriv
edA
c-C
oA(%
)
Met
abol
ite c
arbo
n la
bele
dby
13C
5-G
ln (
%)
Met
abol
ite c
arbo
n la
bele
dby
13C
5-G
ln (
%)
****
***
*******
******
****
****
Fig. 1 Increased glutamine as the carbon source under hypoxia. a A schematic to show the metabolism of glutamine carbon and nitrogen. b Relativeglutamine uptake in MCF-7, HeLa, and 4T1 cells cultured under hypoxia and normoxia for 8 h. c Mass isotopomer analysis of acetyl-CoA in MCF-7, HeLa,and 4T1 cells cultured with the medium containing 1 mM of 13C5-glutamine under hypoxia and normoxia for 8 h. d, e The 13C5-labeled fraction ofmetabolites in MCF-7, HeLa, and 4T1 cells cultured with the medium containing 1 mM of 13C5-glutamine for 8 h under hypoxia or normoxia. f Relativeammonia excretion from MCF-7, HeLa, and 4T1 cells cultured under hypoxia and normoxia for 8 h. g Relative cellular urea in MCF-7, HeLa, and 4T1 cellscultured under hypoxia and normoxia for 8 h. All cultures were supplied with 10% dialyzed serum. Values are the means ± SEM of three independentexperiments. *p < 0.05; **p < 0.01 (Student’s t-test)
NATURE COMMUNICATIONS | https://doi.org/10.1038/s41467-018-08033-9 ARTICLE
NATURE COMMUNICATIONS | (2019) 10:201 | https://doi.org/10.1038/s41467-018-08033-9 | www.nature.com/naturecommunications 3

15N atom (m+ 1) in aspartate, dihydroorotate, orotate, UMP,and IMP (the precursor of purine nucleotides) (Fig. 3a andSupplementary Fig. 7). In contrast, glutamine amide-15N labeleddihydroorotate, orotate, and UMP with one 15N atom (m+ 1)and IMP with two 15N atoms (m+ 2) (Fig. 3a and SupplementaryFig. 8). The labeled fractions of dihydroorotate and orotate sig-nificantly increased under hypoxia (Fig. 3b, c), suggesting anenrichment of glutamine-nitrogen in dihydroorotate and orotateunder hypoxia. However, dihydroorotate and orotate inefficientlyprocessed to its downstream UMP, because cellular UMP was lesslabeled by glutamine-15N (Fig. 3b, c). The reduced labeled frac-tion of IMP was also reduced under hypoxia (Fig. 3b, c), sug-gesting a decrease in IMP biosynthesis, which possibly resultedfrom the slowed cell proliferation rate in view of the accumulationof cellular IMP (Fig. 2c).
Glutamine-amine-15N labeled non-essential amino acids, suchas glutamate, proline, asparagine, aspartate, and alanine (Fig. 3dand Supplementary Fig. 9). In contrast, glutamine-amide-15N
predominantly labeled asparagine in both MCF-7 and HeLa cells(Fig. 3e and Supplementary Fig. 10). In addition, glutamine-amide-15N also slightly labeled non-essential amino acids inMCF-7 breast cancer cells (Fig. 3e), consistent with a recentreport showing that breast cancer cells could metabolically recycleammonia released from glutamine-amide nitrogen14. However,almost all the 15N-labeled fraction of amino acids decreasedunder hypoxia (Fig. 3d, e). Taken together, these data suggest thatglutamine nitrogen is enriched in dihydroorotate and orotate butnot in amino acids under hypoxia.
Promotion of aspartate to pyrimidine precursors underhypoxia. Glutamine carbon can be potentially integrated intopyrimidine nucleotides after it has been converted to aspartatethrough the CAC-mediated oxidative pathway or α-ketoglutaratecarboxylation reductive pathway (Fig. 3a). The two pathwayscan be distinguished by determining the enrichment of 13C5-glutamine-derived 13C in acetyl-CoA, aspartate, citrate,
(s)-Dihydroorotic acidInosinic acid(IMP)Orotic acidGuanosineInosineS-AdenosylmethioninePhosphocreatineDeoxycarnitineBetaineL-MethioninePantothenic acidL-AcetylcarnitineUridine triphosphatePropionylcarnitineL-Aspartic acidThymidine triphosphatePutrescine
+5 (log2)
Hypoxia
#1 #2 #3 #4 #1 #2 #3 #4
HeLa 4T1
a
Rel
ativ
e m
etab
olite
abu
ndan
ce
HeLa
MCF-7
dMCF-7 4T1
Rel
ativ
e m
etab
olite
abun
danc
e
HeLa
Rel
ativ
e m
etab
olite
abun
danc
e
e
Carbamoyl phosphate+ Asp
Carbamoyl Asp
Dihydroorotic acid
Orotic acid
UMP
Glutamine-nitrogen
IMP
AMPGMP
CTP
b
Asp Gln
FumarateGlu
Rel
ativ
e m
etab
olite
abun
danc
e
40
120
200
00.51.01.5
00.51.01.5
00.51.01.5
20
6040
80
80
40
120
0
1
2
3
0
1
2
3
NormoxiaHypoxia
** * * **
–5
AMP
ATPGDP
GMP
GTPUM
PUDP
UTPCM
PCDP
CTPADP
AMP
Asp
Rel
ativ
e m
etab
olite
abun
danc
e
IMP
c
0
4
6
8
2
MCF-7
HeLa
4T1
Carba
moy
l-Asp
DHOA OAUM
PAsp
Carba
moy
l-Asp
DHOA OAUM
PAsp
Carba
moy
l-Asp
DHOA OAUM
P
ATPGDP
GMP
GTPUM
PUDP
UTPCM
PCDP
CTPADP
****** *
*
**
**
****
**
****
**
****
**
**
**
**
**
Fig. 2 Accumulation of cellular nucleotide precursors under hypoxia. a Heatmap of N-contained metabolites in HeLa and 4T1 cells significantly (p < 0.05)affected by hypoxia for 8 h. Cellular metabolites were measured by LC–MS-based metabolomics. b A schematic to show the metabolic assimilation ofglutamine-nitrogen to nucleotide biosynthesis. c Relative cellular IMP in MCF-7, HeLa, and 4T1 cells cultured under hypoxia and normoxia for 8 h.d Relative cellular aspartate, carbamoyl-aspartate, dihydroorotate, orotate, and UMP in MCF-7, HeLa, and 4T1 cells cultured under hypoxia and normoxiafor 8 h. e Relative cellular nucleotides in MCF-7 and HeLa cells cultured under hypoxia and normoxia for 8 h. All cultures were supplied with 10% dialyzedserum. Values are the means ± SEM of three independent experiments. *p < 0.05; **p < 0.01 (Student’s t-test)
ARTICLE NATURE COMMUNICATIONS | https://doi.org/10.1038/s41467-018-08033-9
4 NATURE COMMUNICATIONS | (2019) 10:201 | https://doi.org/10.1038/s41467-018-08033-9 | www.nature.com/naturecommunications

dihydroorotate, and orotate. Normally, glutamine-13C entered theCAC, and then was enriched in aspartate m+ 4 (Fig. 3f), citratem+ 4 (Supplementary Fig. 4), dihydroorotate m+ 4 and orotatem+ 4 (Fig. 3g, h). Under hypoxia, 13C5-glutamine-derived acetyl-CoA m+ 2 (Fig. 1c), aspartate m+ 3 (Fig. 3f) and citrate m+ 5(Supplementary Fig. 4), dihydroorotate m+ 3, and orotate m+ 3
(Fig. 3g, h) were generated via the reductive pathway. Finally,UMP m+ 3 was produced in both pathways (Fig. 3a and Sup-plementary Fig. 11). These results clearly showed that glutaminecarbon was integrated into acetyl-CoA (the precursor for lipidbiosynthesis) and aspartate-derived dihydroorotate and orotatethrough the reductive pathway under hypoxia. Moreover, the
a
Citrate
α-KGSuccinate
OAAAc-CoA
Glu
CO2
OAA
Ac-CoA
Asp
Lipid
Orotate/dihydroorotate
[13C5]-Gln
PRPP
R
UMP
R
CTPIMP
AMP
GMP
Asp
Carbamoyl-Pi
CO2
Asp
CAC12C15N-amide
Addition
HeLa
Am
ine-
15N
-Gln
-labe
led
amin
o ac
ids
(%)
d MCF-7
Am
ine-
15N
-Gln
-labe
led
met
abol
ite(%
of p
ool)
MCF-7
** **** **
****
** **** ** ** ** **
**
* *b HeLa
20
60
40
80
0
20
60
40
80
0
20
60
40
80
0
100
20
60
40
80
0
100
Normoxia Hypoxia
MCF-7 HeLae
Am
ide-
15N
-Gln
-labe
led
met
abol
ite(%
of p
ool)
MCF-7 HeLac
80
40
120
0
80
40
120
0
20
60
40
80
0
100
20
60
40
80
0
100
Labe
led
met
abol
ite fr
om 13
C5-
Gln
(%
of p
ool)
HeLa
MCF-7i
20
60
40
80
0
100
20
60
40
80
0
100
f MCF-7
Asp isotopomer
HeLa
20
60
40
80
0
100
20
60
40
80
0
100
DHOA isotopomer
MCF-7
HeLa
g
20
60
40
80
0
100
20
60
40
80
0
100
OA isotopomer
MCF-7
HeLa
h
20
60
40
80
0
100
20
60
40
80
0
100
13C
15N-amine14N
+
Am
ide-
15N
-Gln
-labe
led
amin
o ac
ids
(%)
13C
5-G
ln-la
bele
d m
etab
olite
(%
of p
ool)
DHOA OAUM
PIM
P
DHOA OAUM
PIM
P
DHOA OAUM
PIM
P
m+0
m+1
m+2
m+3
m+4
m+0
m+1
m+2
m+3
m+4
m+0
m+1
m+2
m+3
m+4
m+5
m+0
m+1
m+2
m+3
m+4
m+5 Asp
DHOA OAUM
P
Asp
DHOA OAUM
Pm
+0m
+1m
+2m
+3m
+4m
+5m
+0m
+1m
+2m
+3m
+4m
+5
DHOA OAUM
PIM
P
Gln Glu ProAsn Asp Ala Gln Glu Pro
Asn Asp Ala
Gln Glu ProAsn Asp AlaGln Glu Pro
Asn Asp Ala
**
**
**********
****
*
*
**
** ****
****
**
** ****
**
**
**** **
***
** ** **
NATURE COMMUNICATIONS | https://doi.org/10.1038/s41467-018-08033-9 ARTICLE
NATURE COMMUNICATIONS | (2019) 10:201 | https://doi.org/10.1038/s41467-018-08033-9 | www.nature.com/naturecommunications 5

fraction of glutamine-13C-labeled acetyl-CoA, dihydroorotate,and orotate significantly increased (Figs. 1c and 3i). These datasuggest that the biosyntheses of acetyl-CoA, dihydroorotate, andorotate from glutamine were urged by hypoxia.
However, aspartate, the direct precursor of dihydroorotate, wasless efficiently labeled by glutamine-13C under hypoxia (Fig. 3i).This most likely resulted from the multienzyme complexesinvolved in the pyrimidine biosynthesis where the newlysynthesized aspartate by cytosolic glutamic-oxaloacetic transami-nase 1 (GOT1) can be efficiently converted to dihydroorotate andorotate4,22. To test this speculation, we cultured HeLa and MCF-7cells with 13C4,15N-labeled aspartate, and traced the isotope-labeled intermediates in the pyrimidine biosynthesis. Both celllines substantially absorbed exogenous 13C4,15N-labeled aspartatem+ 5 (Fig. 4a, b), and we also detected the newly synthesized13C4-labeled aspartate m+ 4, 15N-labeled aspartate m+ 1 and15N-labeled glutamate m+ 1 (Fig. 4a, b). 13C4-aspartate m+ 4carried glutamine-derived amine nitrogen, while 15N-aspartatem+ 1 contained 13C4,15N-aspartate-derived amine nitrogenmediated by 15N-glutamate m+ 1 (Fig. 4c). Hypoxia increasedthe uptake and biosynthesis of aspartate (Fig. 4a, b). Interestingly,in the normal condition, aspartate inefficiently labeled dihy-droorotate, orotate, and UMP (Fig. 4a, b). However, hypoxiapromoted the labeling of dihydroorotate and orotate, but notUMP, by 13C4,15N-aspartate m+ 5 and 13C4-aspartate m+ 4. Inparticular, the newly synthesized 13C4-aspartate m+ 4 was moreefficiently incorporated into dihydroorotate and orotate than theabsorbed 13C4,15N-aspartate m+ 5. These data are consistentwith the notion of metabolic multienzyme complexes and supportthat hypoxia strongly boosts entry of aspartate to dihydroorotateand orotate, which possibly leads to the decreased cellularaspartate (Fig. 2d).
Association of glutamine-carbon metabolism with its nitrogenassimilation under hypoxia. To test whether the increasedmetabolic flux of glutamine to dihydroorotate and orotate isrequired for cell survival under hypoxia, we knockdowned theinvolved enzymes, such as GOT1, carbamoyl-phosphate synthe-tase 2, aspartate transcarbamylase (ATCase) and dihydroorotase(CAD) and dihydroorotate dehydrogenase (DHODH) (Fig. 5a),in MCF-7 and HeLa cells (Fig. 5b and Supplementary Fig. 12a).DHODH and CAD were the key enzymes involved in the bio-synthesis of pyrimidine nucleotides, thus knockdown of DHODHand CAD apparently suppressed proliferation of these cells evenin the normal condition (Fig. 5b and Supplementary Fig. 12a). Incontrast, GOT1 knockdown slightly affected cell proliferation(Fig. 5b and Supplementary Fig. 12a). However, knockdown ofCAD or GOT1 strongly, while DHODH knockdown marginally,sensitized cancer cells to hypoxia (Fig. 5b and SupplementaryFig. 12a). These results suggest that the biosynthesis of dihy-droorotate, not orotate, is indispensable to survival underhypoxia.
To survive hypoxia, cells could excrete the accumulatedmetabolites. Thus, we measured the excretion of carbamoylaspartate, dihydroorotate, and orotate in the culture medium. No
carbamoyl aspartate was detected under both hypoxia andnormoxia. However, we observed a significantly increasedamount of dihydroorotate, but not orotate, in hypoxic mediumof various cell lines, such as MCF-7, HeLa, A549, HCC-LM3,SGC-7901, and 4T1 (Fig. 5c), suggesting it could be an universalphenomenon responding to hypoxia. The overall conversion ofglutamine and dioxide carbon to acetyl-CoA and secretorydihydroorotate, not orotate, consumes electrons (SupplementaryFig. 13), which could remit hypoxia-induced electron accumula-tion. The reprogrammed metabolic pathway essentially rendersglutamine only to acetyl-CoA for lipogenesis under hypoxia, andglutamine-amide and glutamine-amine groups are incorporatedinto secretory dihydroorotate by CAD and GOT1. Theseobservations could explain why hypoxia increased the utilizationof glutamine-carbon but decreased the release of ammonia(Fig. 1). This speculation was further supported by the results thatknockdown of CAD or GOT1 enhanced the production ofammonia under hypoxia (Fig. 5d).
As expected, knockdown of CAD or GOT1 dramaticallysuppressed hypoxia-induced dihydroorotate and orotate (Fig. 5e,f). Meantime, their depletion was also found to reduce glutamine-derived α-ketoglutarate, citrate, and acetyl-CoA (Fig. 5g andSupplementary Fig. 12b, c). Moreover, supplementation withaspartate did not effectively restore the accumulation ofdihydroorotate and orotate even in cells with GOT1 depletion(Fig. 5e, f), although the absorbed aspartate can be used tosynthesize dihydroorotate and orotate under hypoxia (Fig. 4a, b).These data suggest that glutamine-carbon metabolism isassociated with its nitrogen assimilation to dihydroorotate. Tofurther confirm this speculation, we treated HeLa cells with α-ketoglutarate, the carbon form of glutamine. Our results showedthat α-ketoglutarate supplementation reduced glutamine uptake(Supplementary Fig. 12d), and almost completely scavenged theaccumulated cellular dihydroorotate and orotate (Fig. 5h, i) andsuppressed the excretion of dihydroorotate under hypoxia(Fig. 5j). Supplementation with uridine and/or α-ketoglutarateincreased proliferation rate of HeLa/shCAD and HeLa/shGOT1 cells in the normal condition (Supplementary Fig. 12e),but uridine alone did not while α-ketoglutarate alone or incombination with uridine substantially restored cell proliferationunder hypoxia (Fig. 5k). Taken together, our results suggest thatthe metabolism of glutamine-carbon is necessary to cell survivaland depends on the increased biosynthesis of dihydroorotateunder hypoxia.
Hypoxia-induced NADH accumulation promotes biosynthesisand excretion of dihydroorotate. Next, we investigated howhypoxia promoted the biosynthesis and excretion of dihydroor-otate. We measured the protein levels of related enzymes,including GOT1, CAD, DHODH, and uridine monophosphatesynthetase (UMPS) (Fig. 5e), as well as HIF-1α. As a typicalindicator, HIF-1α was indeed induced by hypoxia, but theexpression of these metabolic enzymes were not enhanced(Fig. 6a). CAD is the critical enzyme for the biosynthesis ofdihydroorotate, and can be activated by phosphorylation23,24.
Fig. 3 Metabolic flux of glutamine-nitrogen and glutamine-carbon in nucleoside biosynthesis. a A schematic to show the metabolism of isotope-labeledglutamine. b, c The 15N-labeled fraction of dihydroorotate, orotate, UMP, and IMP in MCF-7 and HeLa cells cultured with the medium containing 1 mM ofamine-15N-glutamine or amide-15N-glutamine for 8 h under hypoxia or normoxia. d, e The 15N-labeled fraction of amino acids in MCF-7 and HeLa cellscultured with the medium containing 1 mM of amine-15N-glutamine or amide-15N-glutamine for 8 h under hypoxia or normoxia. f–h Mass isotopomeranalysis of aspartate, dihydroorotate, and orotate in MCF-7 and HeLa cells cultured with the medium containing 1 mM of 13C5-glutamine for 8 h underhypoxia or normoxia. i The 13C5-labeled fraction of metabolites in MCF-7 and HeLa cells cultured with the medium containing 1 mM of 13C5-glutamine for8 h under hypoxia or normoxia. All cultures were supplied with 10% dialyzed serum. Values are the means ± SEM of three independent experiments. *p <0.05; **p < 0.01 (Student’s t-test)
ARTICLE NATURE COMMUNICATIONS | https://doi.org/10.1038/s41467-018-08033-9
6 NATURE COMMUNICATIONS | (2019) 10:201 | https://doi.org/10.1038/s41467-018-08033-9 | www.nature.com/naturecommunications

The level of phosphorylated CAD was increase in MCF-7 cells butdecreased in HeLa cells under hypoxia (Fig. 6a). These datasuggest that the hyper-biosynthesis of dihydroorotate most likelyis not mediated by hypoxia-regulated protein levels.
Hypoxia also disabled the mitochondrial electron transportchain (ETC) and induced the accumulation of electrons, such asNADH (Fig. 6b). Interestingly, mitochondrial dysfunction waspreviously reported to promote cells to use glutamine-carbon foracetyl-CoA through the reductive pathway25. Here, we confirmedthat the inhibition of the ETC by antimycin A-induced NADHaccumulation (Fig. 6b) and push glutamine-carbon into acetyl-CoA in HeLa, MCF-7, and 4T1 cells (Supplementary Fig. 14a),but it did not induce HIF-1α (Fig. 6c). We then used HeLa and4T1 cells to perform a targeted metabolomic analysis. Eighteenoverlapped nitrogen-contained metabolites in both HeLa and4T1 cells were significantly affected by antimycin A (Fig. 6d andSupplementary Fig. 14b), among which eight overlapped
metabolites, including increased dihydroorotate and decreasedaspartate and UTP, were also found to be significantly changed byhypoxia. In fact, the level of cellular aspartate was also previouslyobserved to reduce in cells with the ETC dysfunction26,27. Thetracing analysis showed that antimycin A, similar to hypoxia, alsopromoted metabolic flux of 13C5-glutamine to aspartate m+ 3and dihydroorotate m+ 3 through the reductive pathway(Supplementary Fig. 14c–14e). Importantly, the excretion ofdihydroorotate, not orotate, was detected in the culture mediumwith antimcyin A treatment (Fig. 6e).
Now, we tried to alleviate the electron accumulation in HeLacells under hypoxia using a pyruvate analog, α-ketobutyratethat can be reduced to excretory α-hydroxybutyrate by NADH-consuming lactate dehydrogenases and thus neutralize NADHaccumulation26. Our results showed that supplementation of α-ketobutyrate indeed decreased NADH/NAD+ ratio (Fig. 6f).Meantime, we also observed that α-ketobutyrate attenuated the
Asp
Asp
-13 C
4
Asp
-15 N
Asp
-15 N
,13 C
4
Asp
Asp
-13 C
4
Asp
-15 N
Asp
-15 N
,13 C
4
(m+
0)
Glu
(m+0
)
Glu
-15 N (m
+1)
Glu
(m+0
)
Glu
-15 N (m
+1)
(m+
1)
(m+
4)
(m+
5)
(m+
0)
(m+
1)
(m+
4)
(m+
5)
(m+
0)
(m+
1)
(m+
4)
(m+
5)
(m+
0)
(m+
1)
(m+
3)
(m+
4)
DHOA
OA
UMP
(m+
0)
(m+
1)
(m+
4)
(m+
5)
(m+
0)
(m+
1)
(m+
4)
(m+
5)
(m+
0)
(m+
1)
(m+
4)
(m+
5)
(m+
0)
(m+
1)
(m+
3)
(m+
4)
DHOA
OA
**
UMP
HeLaa b
Glu
OAA
Asp m+4
Asp m+5
Glu m+1
α-KG
GOT1
GOT1
α-KG
α-KG
OAA
Asp m+1
GlnCAD
CO2
Carbamoyl-Pi
DHOA
CAD
OA
DHODH
c
0
30
60
90
**
****
*
*
**
0
30
60
90
0
30
60
90
0
30
60
90
0
30
60
90
0
30
60
90
0
30
60
90
0
30
60
90
0
30
60
90
0
30
60
90
Normoxia
Hypoxia
Asp
-15N
,13C
4-de
rived
met
abol
ite (
%)
Asp
-15N
,13C
4-de
rived
met
abol
ite (
%)
Asp
-15N
,13C
4-de
rived
met
abol
ite (
%)
Asp
-15N
,13C
4-de
rived
met
abol
ite (
%)
13C12C15N14N
MCF-7
**
*
**
**
Fig. 4 Promotion of aspartate to pyrimidine precursors under hypoxia. a, b Mass isotopomer analysis of aspartate, glutamate, dihydroorotate, orotate, andUMP in MCF-7 and HeLa cells cultured with the medium containing 10mM of 13C4, 15N-aspartate for 8 h under hypoxia or normoxia. Values are the means± SEM of three independent experiments. *p < 0.05; **p < 0.01 (Student’s t-test). c A schematic to show the metabolic flux of 13C4, 15N-aspartate in thebiosynthesis of aspartate, glutamate, dihydroorotate, and orotate
NATURE COMMUNICATIONS | https://doi.org/10.1038/s41467-018-08033-9 ARTICLE
NATURE COMMUNICATIONS | (2019) 10:201 | https://doi.org/10.1038/s41467-018-08033-9 | www.nature.com/naturecommunications 7

Normoxia
Hypoxia
d
DMαKG
Control
Rel
ativ
e ab
unda
nce
of c
ellu
lar
DH
OA
Rel
ativ
e ab
unda
nce
of c
ellu
lar
OA
h i
shCAD#1
shScr
shGOT1#1
e
Rel
ativ
e ab
unda
nce
of c
ellu
lar
DH
OA
Normoxia Hypoxia
Norm
oxia
Hypox
ia
Norm
oxia
Hypox
ia
Norm
oxia
Hypox
ia
Norm
oxia
Hypox
ia
Rel
ativ
e ab
unda
nce
of c
ellu
lar
OA
Normoxia Hypoxia
f g
a
OA
Carbamoyl-Asp
DHODHDHOA
CAD
CAD
Gln Glu
UMP
Carbamoyl-PiCAD
Lipids
Ac-CoAOAA GOT1Asp
Citrate
UMPS
Hypoxia
c
Sec
retio
n in
med
ium
fg/(
cell.
h)
DH
OA
sec
retio
nin
med
ium
(fg
/cel
l.h)
j
#1
Fol
d ch
ange
in c
ell n
umbe
rin
3 d
ays
(log 2
)
Hypoxia
k
b
DHODH
CAD
GOT1
GAPDH
GAPDH
kDa4336243434336
0
1
2
3
4shS
cr
shScr
shCAD sh
GOTI
shScr
shCAD
shGOTI
shDHODH
02468
1012
MCF-7
HeLa
A549
HCC-LM
3
SCG7901
4T1
0
0.3
0.6
0.9
1.2
1.5 * * * * *
Normoxia
Hypoxia
0
10
20
30
40 Contl Asp Contl Asp
Contl AspContl Asp
0
10
20
30
0
10
20
30
0
20
40
60
0
10
20
30
0
4
8
12Con
tl
U DMαKG
U+DM
αKG
0
1
2
3
shCAD#1
shScr
shGOT1#1
Amide-N Amine-N
α-KG
β-actin
Fol
d ch
ange
in c
ell n
umbe
rin
3 d
ays
(log 2)
–2
–1
#2 #1 #2
#1 #2
#1 #2 #1 #2
#1 #2
–2 OA
DHOA OA
DHOA OA
DHOA OA
DHOA OA
DHOA OA
DHOA
13C
5-G
ln-d
eriv
edA
c-C
oA(%
)
–2
–1
Rel
ativ
e N
H3
excr
etio
n(N
orm
aliz
ed b
y ce
ll.h)
****
*** *
*** *
** ** **
**
**
****
**
***
Fig. 5 Association of glutamine-carbon metabolism with its nitrogen assimilation under hypoxia. a A schematic to show the metabolism of glutaminecarbon and nitrogen in the pyrimidine biosynthesis. b Proliferation of HeLa cells with or without knockdown of DHODH, CAD, and GOT1 cultured underhypoxia and normoxia for 3 days. Values are the means ± SEM of triplicate experiments. Western blot to validate the knockdown of DHODH, CAD, andGOT1. c Excretion of dihydroorotate and orotate to medium from cells cultured under hypoxia and normoxia for 8 h. d Relative ammonia excretion fromHeLa/shScramble, HeLa/shCAD, and HeLa/shGOT1 cells cultured under hypoxia and normoxia for 8 h. Values are the means ± SEM of triplicateexperiments. e, f Relative cellular dihydroorotate and orotate in HeLa/shScramble, HeLa/shCAD, and HeLa/shGOT1 cells cultured under hypoxia andnormoxia for 8 h in the presence or absence of 10 mM aspartate. gMass isotopomer analysis of acetyl-CoA in HeLa/shScramble, HeLa/shCAD, and HeLa/shGOT1 cells cultured with the medium containing 1 mM of 13C5-glutamine under hypoxia and normoxia for 8 h. h, i The relative abundance of cellulardihydroorotate and orotate in HeLa cells cultured under hypoxia and normoxia for 8 h in the presence or absence of 2 mM dimethyl α-ketoglutarate(DMαKG). j Excretion of dihydroorotate to medium from HeLa cells cultured under hypoxia and normoxia for 8 h in the presence or absence of 2 mMDMαKG. k Proliferation of HeLa/shScramble, HeLa/shCAD, and HeLa/shGOT1 cells cultured under hypoxia for 3 days in the presence or absence of100 μM uridine and/or 2 mM DMαKG. Values are the means ± SEM of triplicate experiments. All cultures were supplied with 10% dialyzed serum. Valuesare the means ± SEM of three independent experiments, if not specified. *p < 0.05; **p < 0.01 (Student’s t-test)
ARTICLE NATURE COMMUNICATIONS | https://doi.org/10.1038/s41467-018-08033-9
8 NATURE COMMUNICATIONS | (2019) 10:201 | https://doi.org/10.1038/s41467-018-08033-9 | www.nature.com/naturecommunications

excretion of dihydroorotate (Fig. 6g), reduced glutamine-derived acetyl-CoA m+ 2 (Fig. 6h), decreased the accumulationof cellular dihydroorotate (Fig. 6i) and orotate (SupplementaryFig. 14f), and restored cellular aspartate (SupplementaryFig. 14g) under hypoxia. In addition, α-ketobutyrate supplyalso enhanced ammonia production under hypoxia (Fig. 6j).Taken together, these data suggest that hypoxia-inducedNADH accumulation promotes the biosynthesis and excretionof dihydroorotate, and regulates the metabolism of glutamine-nitrogen.
CAD is a multi-domain enzyme and can be allostericallyinhibited by UTP or activated by phosphoribosyl pyrophosphate(PRPP)28. In fact, we also detected the increased level of cellularPRPP (Fig. 6k), in addition to the decreased cellular UTP underhypoxia (Fig. 2e). These factors possibly accounted for thepromotion of CAD activity by hypoxia. Interestingly, α-ketobutyrate also suppressed PRPP accumulation and reversedcellular UTP under hypoxia (Fig. 6k, l). NADH acts as thecoenzyme of many cellular transformations, and thus itsaccumulation could extensively influence these reactions and
NA
DH
/NA
D+ r
atio
Normoxia
Hypoxia
Antimycin A
d
Fol
d ch
ange
(lo
g 2)
HeLa 4T118 235
Ant A
Ant A
Control
DH
OA
sec
retio
nin
med
ium
(fg
/cel
l.h)
Rel
ativ
e ab
unda
nce
of c
ellu
lar
DH
OA
4T1HeLa
Sec
retio
n in
med
ium
fg/(
cell.
h)
Rel
ativ
e N
H3
excr
etio
n(n
orm
aliz
ed b
y ce
ll.h)
NA
DH
/NA
D+ r
atio
b
Rel
ativ
e ab
unda
nce
of c
ellu
lar
UT
P
Rel
ativ
e ab
unda
nce
of c
ellu
lar
PR
PP
Ant A 0 8 24
HeLa
48 0 8 24
4T1
48 h
Hypoxia 0 8 24 48 0 8 24 48 h
MCF-7 HeLaa
pCAD
DHODH
UMPS
CAD
GOT1
kDa
243
120
243
43
52
43
43
43
120
–4
–2
0
2
4
6
8
–6
–4
–2
0
2
4
6
8
–60
1
2
3
0
10
20
30
0
10
20
30
0
20
40
60
0
0.4
0.8
1.2
0
4
8
12
0
10
20
30
40
0
20
40
60
0
0.4
0.8
1.2
0
1.0
1.5
2.5
2.0
0.5
0
Norm
oxia
Hypox
ia
Norm
oxia
Hypox
ia
Norm
oxia
Hypox
ia
DHOA
DHOA
MCF-7
HeLa
4T1 Asp
UTP
DHOAAsp
UTP
OA
DHOAOA
DHOAOA
Norm
oxia
Hypox
ia
Norm
oxia
Hypox
ia
Norm
oxia
Hypox
ia
Norm
oxia
Hypox
ia
0.4
0.8
1.2
AKB
Control
13C
5-G
ln-d
eriv
edA
c-C
oA (
%)
********
***
*MCF-7
* ****
HIF-1α
β-Actin
HIF-1α
β-Actin
** ** **
c
e f g
h i j k l
Fig. 6 Hypoxia-induced NADH accumulation promotes biosynthesis and excretion of dihydroorotate. a Western blot of lysates from MCF-7 and HeLa cellscultured under hypoxia for different time as indicated. b NADH/NAD+ ratio in MCF-7, HeLa, and 4T1 cells cultured under hypoxia and normoxia for 2 h.Values are the means ± SEM of triplicate experiments. c Western blot of lysates from MCF-7 and 4T1 cells cultured under hypoxia for different time asindicated. d Targeted metabolomics of HeLa and 4T1 cells cultured under hypoxia or treated with antimycin A (1 μM) for 8 h. The relative abundance ofdihydroorotate, asparatate, and UTP were listed here. Values are the means ± SEM of four independent experiments. e Excretion of dihydroorotate andorotate to medium from cells treated with or without antimycin A for 8 h. f NADH/NAD+ ratio in HeLa cells cultured under hypoxia and normoxia for 2 h inthe presence or absence of 1 mM α-ketobutyrate. g Excretion of dihydroorotate to medium from HeLa cells cultured under hypoxia and normoxia for 8 h inthe presence or absence of 1 mM α-ketobutyrate. h Mass isotopomer analysis of acetyl-CoA in HeLa cells cultured with the medium containing 1 mM of13C5-glutamine under hypoxia and normoxia for 8 h in the presence or absence of 1 mM α-ketobutyrate. i The relative abundance of cellular dihydroorotatein HeLa cells cultured under hypoxia and normoxia for 8 h in the presence or absence of 1 mM α-ketobutyrate. j Relative ammonia excretion from HeLacells cultured under hypoxia and normoxia for 8 h in the presence or absence of 1 mM α-ketobutyrate. Values are the means ± SEM of triplicateexperiments. k, l The relative abundance of cellular PRPP and UMP in HeLa cells cultured under hypoxia and normoxia for 8 h in the presence or absence of1 mM α-ketobutyrate. All cultures were supplied with 10% dialyzed serum. Values are the means ± SEM of three independent experiments, if not specified.*p < 0.05; **p < 0.01 (Student’s t-test)
NATURE COMMUNICATIONS | https://doi.org/10.1038/s41467-018-08033-9 ARTICLE
NATURE COMMUNICATIONS | (2019) 10:201 | https://doi.org/10.1038/s41467-018-08033-9 | www.nature.com/naturecommunications 9

reprogram cellular metabolism. NADH accumulation most likelyindirectly activates CAD, given that CAD does not directlyemploy NADH and NAD+.
Increased dihydroorotate excretion in in vivo tumors. In viewof the in vivo hypoxic microenvironment of tumors, we thenmeasured the blood dihydroorotate and orotate in patients ofbreast cancer, lung cancer, gastric cancer, and liver cancer, as wellas healthy persons. However, cancer patients’ blood orotate, butnot dihydroorotate, was detected to significantly enhance com-pared to the healthy controls (Fig. 7a, b). Furthermore, wemeasured the levels of blood dihydroorotate and orotate inhealthy or HeLa-derived tumor-bearing nude mice, and bothmetabolites were found to significantly increase (Fig. 7c, d). Tofurther investigate whether orotate was directly released fromtumor or oxidized from dihydroorotate in blood, we admini-strated mice with intraperitoneal injection with amide-15N-labeled glutamine (Supplementary Fig. 15a). Dihydroorotate andorotate in the tumor tissue was rapidly labeled by 15N (Supple-mentary Fig. 15b). About 35% and 25% of blood dihydroorotatewas labeled by 15N at 1 and 2 h postinjection in tumor-bearingbut not in healthy mice (Fig. 7e and Supplementary 15c, d). Incontrast, only <10% of blood orotate was labeled in these mice,and a slightly increased labeled fraction of blood orotate wasobserved in tumor-bearing mice (Fig. 7f and SupplementaryFig. 15c, d). Similar results were also obtained from 4T1-derivedtumor-bearing mice (Supplementary Fig. 15e–15h). These datasuggest that the in vivo tumors could directly excrete dihy-droorotate that is somehow rapidly converted to orotate in blood(Fig. 7g). The amount of blood orotate was much greater thanthat of blood dihydroorotate in mice (Fig. 7c, d and
Supplementary Fig. 15e, f), so that the newly synthesized 15N-labeled orotate derived from dihydroorotate was largely diluted.
Both CAD and DHODH are indispensable to pyrimidinebiosynthesis, thus their inhibition by shRNA led to the similarlysuppressive effect on cell proliferation in the normal condition(Fig. 5b). It was not surprising that knockdown of CAD andDHODH repressed cell proliferation in a xenograft mouse model(Fig. 7h). However, we found that CAD knockdown suppressedthe in vivo tumor growth much more significantly than DHODHknockdown (Fig. 7h). This most likely resulted from the fact thatCAD, not DHODH was required for dihydroorotate biosynthesisand cell survival under hypoxia (Fig. 5a, b). Accordingly, higherlevels of CAD showed a positive correlation with a shorter overallsurvival time in patients of breast cancer, lung cancer, gastriccancer, and liver cancer (Supplementary Fig. 16a). In contrast, ahigh level of DHODH was only observed in patients of gastriccancer with a short overall survival time (Supplementary Fig. 16b).These data suggest that the increased biosynthesis of dihydroor-otate from glutamine is critical for the in vivo tumor growth.Compared with CAD, GOT1 seemed to be mainly required fordihydroorotate biosynthesis and cell proliferation under hypoxiabut less affected cell growth in the normal condition (Fig. 5b, e),which possibly resulted in a weaker inhibitory effect of GOT1knockdown on the in vivo cell growth (Fig. 7h).
DiscussionIn this study, we reveal a specific metabolic pathway that hypoxiapushes glutamine carbon and nitrogen via the reductive pathwayto dihydroorotate that are then expelled outside of cells ratherthan processing to their downstream UMP. This unique meta-bolic reprogramming probably has a vital physiological relevance.Proliferating cancer cells require glutamine carbon to generate
10
30
20
40
0
Ser
um O
A(n
g/m
l)
0
100
200
300
da ns
Ser
um D
HO
A(n
g/m
l)
10
20
0
Ser
um O
A(n
g/m
l)
b
0
20
40
60
Ser
um D
HO
A(n
g/m
l)
Labe
led
seru
m O
A fr
omam
ide-
15N
-Gln
(%
of p
ool)
0 h 1 h 2 h
Time
Healthy mouse
Tumor mouse
e f
0 h 1 h 2 h
Time
g
OADHOA
Gln Ac-CoA
DHOA OA
Blood
Tumor
h
Tum
or v
olum
e (m
m3 )
Time (day)
shScr
shGOT1#1shCAD#1
shDHODH#1
0
200
400
600
800
1000
0
20
40
60
0
20
40
60
**** **
Labe
led
serim
DH
OA
from
amid
e-15
N-G
ln (
% o
f poo
l)
7 11 15 19 23
****
Health
y (n
= 45
)
Health
y mou
se (n
= 9
)
Health
y mou
se (n
= 9
)
Tumor
mou
se (n
= 9
)
Tumor
mou
se (n
= 9
)
Breas
t can
cer (
n =
30)
Lung
canc
er (n
= 3
0)
Liver
canc
er (n
= 2
6)
Gastri
c can
cer (
n =
30)
Contro
l (n
= 49
)
Breas
t can
cer (
n =
48)
Lung
canc
er (n
= 5
0)
Liver
canc
er (n
= 5
0)
Gastri
c can
cer (
n =
50)
c
Fig. 7 Glutamine-derived dihydroorotate is required for tumor growth. a, b Serum dihydroorotate and orotate in healthy controls and cancer patients. c, dSerum dihydroorotate and orotate in healthy and HeLa-derived tumor-bearing nude mice. e, f The 15N-labeled fraction of blood dihydroorotate and orotatein healthy and HeLa-derived tumor-bearing nude mice intraperitoneally injected with 5mmol kg−1 of amide-15N-glutamine for 1 or 2 h. Values are themeans ± SEM of data from three mice. g Tumors directly excreted dihydroorotate that was oxidized to orotate in blood. h The in vivo tumor growth ofHeLa/shScramble, HeLa/shDHODH, HeLa/shCAD, and HeLa/shGOT1 cells. *p < 0.05; **p < 0.01 (Student’s t-test)
ARTICLE NATURE COMMUNICATIONS | https://doi.org/10.1038/s41467-018-08033-9
10 NATURE COMMUNICATIONS | (2019) 10:201 | https://doi.org/10.1038/s41467-018-08033-9 | www.nature.com/naturecommunications

acetyl-CoA for lipid synthesis under hypoxia. During this process,cells need to properly dispose of the concomitant “by-products”,nitrogen (ammonia/ammonium), and oxaloacetate that could notbe effectively catabolized under hypoxia, from glutamine. Theaccumulation of these “by-products”, particularly ammonia,could be toxic to cells12,13,21. The secretion of dihydroorotateperfectly scavenges both the rest nitrogen and carbon and rendersglutamine mainly to acetyl-CoA in cells. Hypoxia promotes theenrichment of glutamine-nitrogen in dihydroorotate on onehand, and suppresses the conversion of dihydroorotate to itsdownstream UMP on the other hand, which could lead to theaccumulation of dihydroorotate and promote its excretion.
The amide nitrogen of glutamine is most often used to syn-thesize asparagine and nucleotide, concomitantly with productionof glutamate29. Glutamate can be used for multiple purposes, butit can be readily synthesized through the transamination betweenα-ketoglutarate and other amino acids, thus it is dispensable tocancer cell proliferation. By contrast, the biosynthesis of gluta-mine from glutamate is inactive in cancer cells. Therefore, theamide-nitrogen of glutamine is necessary to cell growth. Nor-mally, when the amide-nitrogen of glutamine is used, the resul-tant glutamate, if beyond the metabolic requirement, could beexcreted out of cells or replenish the CAC after its transamina-tion. Once the metabolic assimilation of glutamine amide-nitrogen could not keep pace with that of glutamine carbon,cells need to get rid of the superfluous amide-nitrogen. Generally,glutamine is thought to liberate amide-nitrogen as ammonia andconverted to glutamate that can further produce α-ketoglutarateupon either deamination or transamination5,9,11. The accumu-lating ammonia should be safely removed. In mammalian cells,there are three enzymes accounting for ammonia assimila-tion30,31. GS synthesizes glutamine from glutamate and ammonia,and this process is essentially a reversion of glutamine deami-nation and thus does not play a real role in scavenging glutamine-derived ammonia. Carbamoyl phosphate synthetase I (CPSI)incorporates ammonia to urea, but we detected a decreased cel-lular level of urea in cancer cells under hypoxia (Fig. 1g). GLUDcan convert α-ketoglutarate and ammonia to glutamate whoseamine group could be further transferred to other amino acids.Unfortunately, GLUD-mediated ammonia assimilation ineffi-ciently or does not take place in cancer cells4,15, especially in thehypoxic condition (Fig. 3e). Therefore, proliferating cancer cellsdevelop the specific metabolic pathway to dispose of glutamineamide-nitrogen.
In mammalian cells, glutamine amide-nitrogen is used tosynthesize carbamoyl phosphate by carbamoylphosphate syn-thetase II (CPSII) domain of CAD protein, a trifunctional multi-domain enzyme. Carbamoyl phosphate then reacts with aspartateto generate carbamoylaspartate, which is catalyzed by ATCasedomain of CAD. The dihydroorotase (DHOase) domain of CADfurther synthesizes dihydroorotate from carbamoylaspartate.Although aspartate is the major precursor for pyrimidine bio-synthesis, it is seriously scarce in human blood and actuallycannot be efficiently absorbed even upon its supplementation27.Therefore, the cellular aspartate almost completely depends on itsbiosynthesis, and its amine-nitrogen is transferred from gluta-mate. In contrast, glutamine is the most abundant amino acid inhuman blood, and essentially it can provide directly amide-nitrogen and indirectly amine-nitrogen for nucleotide biosynth-esis. Overall, glutamine carbon and nitrogen could be readilycoordinatively catabolized without ammonia generation. Underhypoxia, proliferating cells increase the metabolic requirement forglutamine carbon to support lipogensis, and excrete overflowednitrogen and carbon as the form of dihydroorotate. Moreover,hypoxia-induced NADH accumulation, not the typical hypoxia-associated HIF1 signal pathway, is most likely the cause to drive
the metabolic reprogramming of glutamine. It can enhance thecellular allosteric activator PRPP and reduce the cellular allostericinhibitor UTP of CAD (Fig. 6k, l), and thus possibly indirectlyactivate CAD to promote biosynthesis of dihydroorotate fromglutamine-derived aspartate. This could provide a complementaryexplanation for the reduced cellular aspartate in the condition ofETC dysfunction, as previously reported26,27,32,33.
Dihydroorotate is somehow rapidly converted to orotate in theblood, as suggested in our current study (Fig. 7g). As a fact, ureacycle disorders can also lead to orotic aciduria, a symptom of anincreased urinary orotate34,35, supporting that the excretion ofdihydoorotate/orotate is an alternative pathway to dispose ofammonia. Our in vitro data showed that knockdown of CADenhanced ammonia excretion from cancer cells under hypoxia.Although the in vivo tumor cells often grow in a hypoxicmicroenvironment, whether their ammonia production will beaffected by CAD knockdown remains unclear due to the ineffi-cient tumor formation of cancer cells with shCAD. However, weindeed measure the increased level of blood dihydroorotate/oro-tate in cancer patients or tumor-bearing mice. It suggests that thespecific metabolic flux of glutamine to excretory dihydroorotate/orotate exists in vivo. Therefore, the blood dihydroorotate/orotatemay be a potential biomarker for cancer diagnosis, and theinvolved metabolic enzymes, such as CAD and GOT1, could bepotential targets for cancer treatments.
MethodsCell culture. MCF-7, A549, HeLa, HCC-LM3, SGC-7901, and 4T1 cells wereobtained from ATCC. All the cells were maintained in high glucose DMEM sup-plemented with 10% fetal bovine serum (BioInd, Israel) and 50 IU penicillin/streptomycin (Invitrogen, USA) in a humidified atmosphere with 5% CO2 at 37 °C.Hypoxia studies were carried out at 1% oxygen.
Cell imaging and cell death assay. 10 × 104 cells expressing GC3AI were grownin 12-well plates, and after the desired treatments, cells were then rapidly imagedwith an EVOS® FL digital inverted fluorescence microscope with ×10 objective lens.The filter sets for imaging were: GFP: Ex470/22, Em525/50. Cell death assay wasperformed as previous36,37, GFP-positive cells were counted as apoptosis. Fiverandom areas in each well were imaged, and each area contained more than onehundred of cells. Cell counting was performed with ImageJ software (1.47) byanalyzing these pictures.
Proliferation assay. Cells were plated in triplicate in 12-well plates at 5 × 10⁴ cellsper well in 1.5 ml. After days as indicated in experiments, wells were washed twicewith PBS buffer to remove dead cells, and then the entire contents of the well weretrypsinized. Cell number was determined using a hemocytometer. For each well,the fold change in cell number relative to Day0 was presented in a log2 scale.
NADH/NAD+ ratio assay. NADH/NAD+ ratio was done using the NAD/NADH-Glo™ Assay (Cat#G9072 from Promega, USA) according to the manualinstructions with modifications. Briefly, 105 cells per well were seeded in 12-wellplates for 24 h, and then were incubated with the treatment medium for the desiredperiod. Cells were quickly washed once with PBS, extracted with ice cold lysisbuffer (1% dodecyltrimethylammonium bromide (DTAB) in 0.2 N NaOH diluted1:1 with PBS), immediately frozen at −80 °C and thawed at room temperature. Tomeasure NADH, 150 μl of the samples was moved to wells of 48-well plates andincubated at 60 °C for 15 min, where basic conditions selectively degrade NAD+.To measure NAD+, another 150 μl of the samples was moved to wells of 48-wellplates containing 75 μl of 0.4 N HCl and incubated at 60 °C for 15 min, and theacidic conditions selectively degrade NADH. Following incubations, samples wereallowed to equilibrate to room temperature and then quenched by neutralizingwith 150 μl of HCl/Trizma solution (0.25 M Tris in 0.2 N HCl) (NADH mea-surement) or 75 μl of 0.5 M Tris base (NAD+ measurement). 50 μl of the neu-tralized samples was moved to wells of 96-well white luminometer plates (Cat#3925from CoStar, USA), and mixed with 50 μl of the newly prepared NAD/NADH-Glo™ Detection Reagent. The mixtures were gently shaken for 30 min at roomtemperature, and the luminescence was measured using a Synergy H1 HybridMulti-Mode reader (BioTek, USA).
Metabolite profiling and isotope tracing. LC/MS analyses were conducted on aTSQ Quantiva triple quadrupole mass spectrometer networked to a Dionex Ulti-Mate 3000 UPLC system (Thermo Fisher Scientific) at the Metabolomics Facility atTsinghua University Branch of China National Center for Protein Sciences
NATURE COMMUNICATIONS | https://doi.org/10.1038/s41467-018-08033-9 ARTICLE
NATURE COMMUNICATIONS | (2019) 10:201 | https://doi.org/10.1038/s41467-018-08033-9 | www.nature.com/naturecommunications 11

(Beijing, China). MRM mode was developed using chemical standards. Experi-ments were performed in medium containing 10% dialyzed FBS (Gibco). Mediumwas prepared to contain 100% of either the glucose, glutamine, or aspartate poollabeled with 13C or 15N and unlabeled other pool. DMEM lacking glucose, glu-tamine, and pyruvate was prepared from powder (Sigma), and then supplementedwith labeled-glucose or labeled-glutamine, as indicated in the experiments. All thereconstituted experimental media finally contained 10 mM glucose, 1 mM gluta-mine, and/or 10 mM aspartate if used. Cells were grown in 60-mm dishes until 80%confluent, then rinsed with PBS and cultured with 2 ml isotopes-containingmedium for 8 h in the conditions as indicated in the experiments. Cells were thenextracted by freeze-thawing three times in 0.5 ml 80% methanol (pre-chilled to−80 °C). Macromolecules and debris were removed by centrifugation at 14,000×gfor 20 min at 4–8 °C, and the metabolite-containing supernatants were dried undernitrogen gas. Dried samples were stored at −80 °C and then resuspended in 50 μl80% methanol and prepared for LC/MS analyses. 1 μl of each sample was injectedonto a Synergi Hydro-RP 100A 2.1 × 100 mm column (Phenomenex) for meta-bolite separation with column temperature at 35 °C. Mobile phases A and B were10 mM thiobarbituric acid in aqueous with pH 5 and 100% methanol, respectively.The chromatographic gradient was set for mobile phase B as follows: 0–3.5 min: 1%B; 3.5–22 min: from 1% to 70% B; 22–23 min: from 70% to 90% B; 23–25 min: 90%B; 25–30 min: 1% B. Data were acquired using positive/negative switching method.Spray voltages of 3.5 and 2.5 kV were applied for positive and negative modes,respectively. Q1 and Q3 resolution was set at 0.7 and 1 s of cycle time was used inthe method. MRM data were analyzed using Tracefinder (Thermo Fisher Scientific)to quantify metabolites for flux analysis. Retention times and mass fragmentationsignatures of all metabolites were validated using pure standards. Ion pairs withvarious isotope labels were derived based on precursors’ and fragments’ chemicalstructures. The abundance of each mass isotopomer was then mathematicallycorrected to eliminate natural abundance isotopes and finally converted into apercentage of the total pool.
For metabolite profiling experiments, cells were grown in 60-mm dishes until80% confluent, then rinsed with PBS and cultured with 2 ml DMEM containing10% dialyzed FBS for 8 h under normoxia or hypoxia or in the presence of 1 μMantimycin A. To determine the relative abundance of intracellular metabolitesacross samples, cells was extracted with 0.5 ml 80% pre-chilled methanol. Sampleswere prepared and analyzed as described in the above. The areas of the ion peaks ofinterest were corrected by cell number. Finally, the relative abundance ofmetabolites was compared with each other.
Targeted metabolomics. HeLa and 4T1 cells were grown in 60-mm dishes until80% confluent, then cultured under hypoxia (1% O2) or treated with antimycin A(1 μM) for 8 h. Samples were prepared as described in the section of “Metaboliteprofiling and isotope tracing”. Samples were randomized, in order to avoidmachine drift, and were blinded to the operator.
Analysis was performed on TSQ Quantiva Triple Quadrupole massspectrometer (Thermo, CA) with positive/negative ion switching at theMetabolomics Facility at Tsinghua University Branch of China National Center forProtein Sciences (Beijing, China). Mobile phase A is prepared by adding 2.376 mltributylamine and 0.858 ml acetic acid to HPLC-grade water, then adding HPLC-grade water to 1 l volume. Mobile phase B is HPLC-grade methanol. SynergiHydro-RP 100A column is used for targeted metabolites separation with columntemperature at 35 °C. The detailed mass spectrometer parameters are shown asfollows: spray voltage, 3.5 and 2.54 kV; sheath gas flow rate, 35 Arb; aux gas flowrate, 12 Arb; ion transfer tube temperature, 320 °C; Q1 and Q3 resolution, 0.7FWHM; and cycle time, 1 s. MRM data were analyzed using Tracefinder (ThermoFisher Scientific) to quantify metabolites.
Targeted metabolomics contained 340 ion transitions which were tuned usingchemical standards. This method focused on the central carbon metabolismincluding glycolysis, CAC, purine and pyrimidine metabolism, amino acidmetabolism, and related metabolites.
Metabolite uptake and excretion. Levels of analine, glutamate, glutamine, oro-tate, and dihydroorotate were determined using LC/MS. Conditioned medium wassampled after 8 h. 100 μl medium was extracted with 400 μl 100% pre-chilledmethanol with 10 ng ml−1 15N2-orotate as the internal standard. The mixture wascentrifuged at 14,000×g for 20 min at 4–8 °C, and the metabolite-containingsupernatants were dried under nitrogen gas. Dried samples were stored at −80 °Cand then resuspended in 50 μl 80% methanol and prepared for LC/MS analyses asdescribed in the section of “Metabolite profiling and isotope tracing”. The amountof orotate can be directly calculated by comparing the area of the ion peak oforotate to that of internal 15N2-orotate. Since no available dihydroorotate isotopewas used as the internal standard, medium dihydroorotate could not be directlyquantified. Therefore, 100 μl aliquots of control medium containing 0, 3.125, 6.25,12.5, 25, 50, 100, and 200 ng ml−1 dihydroorotate were in parallel prepared. Theareas of the ion peaks of dihydroorotate were corrected by those of the internal15N2-orotate. The amount of dihydroorotate can be calculated based on thestandard curve. The ion counts of medium glutamine corrected by internal 15N2-orotate were compared with each other, and the data were presented as the relativeuptake. The areas of the ion peaks of analine, glutamate, and glutamine werecorrected by those of the internal 15N2-orotate. The corrected ion peak area was
used to represent the amount of metabolite and data were presented as the relativeuptake or excretion to the control.
Ammonia in the medium was determined using the ammonia slides and theVITROS Chemistry Products Calibrator Kit 5 on an autoanalyzer (VITROS 5600Integrated System, Ortho-Clinical Diagnostics, United States). Briefly, a drop ofmedium sample was deposited on the slide and evenly distributed by the spreadinglayer to the underlying layers. Water and nonproteinaceous components travel tothe underlying buffered reagent layer, and the ammonium ions are converted togaseous ammonia. The semi-permeable membrane allows only ammonia to passthrough and prevents buffer or hydroxyl ions from reaching the indicator layer.After a fixed incubation period, the reflection density of the dye is measured usingthe white background of the spreading layer as a diffuse reflector.
Urea in the medium was measured using the autoanalyzer AU5800 (BeckmanCoulter, United States). This urea procedure is based on an adaptation of theenzymatic method of Talke and Schubert. In this method, urea is hydrolyzedenzymatically by urease to yield ammonia and carbon dioxide. The ammonia andα-ketoglutaric acid are converted to glutamate in a reaction catalyzed by L-GLUD.Simultaneously, a molar equivalent of reduced NADH is oxidized. Two moleculesof NADH are oxidized for each molecule of urea hydrolyzed. The rate of change inabsorbance at 340 nm, due to the disappearance of NADH, is directly proportionalto the urea concentration in the sample.
Aliquots of the medium without cells under the same conditions were used tomeasure the concentration of metabolites as the background control. The increasedor reduced amount of metabolite in the medium, normalized for area under thecurve, was the excretion or uptake of metabolite by a cell per hour.
The cell growth curve is fitted to an exponential equation:
y ¼ f tð Þ ¼ Ninitial � 2t=td
where N is cell number, t is time in hours, and td is the doubling time for cellproliferation. The area (S) under the curve can be obtained by an integral equation:
S ¼Z t1
0f tð Þ � dt ¼ Ninitial � t1 �
eln Nfinal=Ninitialð Þ � 1� �ln Nfinal=Ninitialð Þ
where Ninitial and Nfinal are the initial and final cell numbers that can beexperimentally determined, t1 is the treatment time. If Ninitial=Nfinal, S iscalculated using the following equation:
S ¼ Ninitial � t1
The metabolite consumption/excretion per cell per hour (R) is calculated by thefollowing equation:
R¼ Metabolite½ �final� Metabolite½ �initial� �
=S
The unit for R is mol per (cell h) or mol per cell per hr.
Serum metabolite assay. Blood samples were obtained from cancer patients withpathologic diagnosis at Tianjin Medical University Cancer Institute and Hospital.Informed consent was obtained from all patients according to the regulation of theInstitutional Review Boards of Tianjin Medical University Cancer Institute andHospital in agreement with Declaration of Helsinki.
Hundred microliters of serum was mixed with 400 μl 100% pre-chilledmethanol with 10 ng ml−1 15N2-orotate as the internal standard. After being kept at−80 °C for 2 h, the mixture was centrifuged at 14,000×g for 20 min at 4–8 °C. Fourhundred microliters of the metabolite-containing supernatant was transferred to1.5 EP tube and dried under vacuum conditions. Dried samples were stored at−80 °C and then resuspended in 50 μl 80% methanol. Two microliters of thesample was prepared for LC/MS analyses as described in the section of “Metaboliteprofiling and isotope tracing”. The amount of orotate can be directly calculated bycomparing the area of the ion peak of orotate to that of internal 15N2-orotate. Inaddition, 100 μl aliquots of water containing 0, 3.125, 6.25, 12.5, 25, 50, 100, or200 ng ml−1 dihydroorotate were prepared, like serum samples, as the standardcurve. The areas of the ion peaks of dihydroorotate were corrected by those of theinternal 15N2-orotate. The amount of dihydroorotate can be calculated based onthe standard curve.
Animal experiments. The animal protocol was approved by the Institute AnimalCare and Use Committee at Tianjin Medical University, in accordance with theprinciples and procedures outlined in the NIH Guide for the Care and Use ofLaboratory Animals. Female nude mice (4–5 weeks, 19–20 g) were purchased fromthe Experimental Animal Center of Nanjing Biomedical Research Institute atNanjing University. Mice were administered with a standard, housed and main-tained in pathogen-free house in a 12:12 h light–dark cycle. Temperature andhumidity were maintained at 24 ± 2 °C and 50 ± 5%, respectively.
5 × 10⁶ cells of HeLa/shScramble, HeLa/shDHODH#1, HeLa/shCAD#1, orHeLa/shGOT1#1 were injected subcutaneously into the groins of 5-week-old mice,and five mice were used for each cell line. After establishment of palpable tumors,
ARTICLE NATURE COMMUNICATIONS | https://doi.org/10.1038/s41467-018-08033-9
12 NATURE COMMUNICATIONS | (2019) 10:201 | https://doi.org/10.1038/s41467-018-08033-9 | www.nature.com/naturecommunications

tumor growth was measured every 3 days using digital calipers, and volumes werecalculated using the formula 1/2 × L ×W2. All of the mice were killed at the endand tumors were harvested and weighed.
For in vivo tracing studies, when HeLa/wt-derived tumors reached about500 mm3, six tumor-bearing mice, as well as six healthy mice, were injected withamide-15N-glutamine (5.0 mmoles kg−1) in 0.9% NaCl. Mice were sacrificed 2 and4 h post-injection. A control mouse was injected with an equivalent amount ofunlabeled glutamine and sacrificed 2 h after injection. Tumors were excised, flash-frozen, and powderized. Polar metabolites were extracted from 0.1 g tissue in 1 ml80% MeOH and profiled on LC/MS as described in the section of “Metaboliteprofiling and isotope tracing”. Blood of each mouse was collected from eyeball into1.5 ml EP tubes and centrifuged at 3000 rpm 10 min to separate plasma.Metabolites were extracted from plasma in 2:8 (v: v) plasma:MeOH and profiled onLC/MS as described in the section of “Serum metabolite assay”.
Western blot. After desired treatments as specified as indicated, cells were washedtwice with PBS and lysed in buffer (20 mM Tris–HCl, pH 7.5, 150 mM NaCl, 1 mMEDTA, 1% Triton X-100, 2.5 mM sodium pyrophosphate, 1 mM β-glycer-opho-sphate, 1 mM sodium vanadate, 1 mg ml−1 leupeptin, 1 mM phenylmethyl-sulfo-nylfluoride). Equal amounts of protein (30 μg) were loaded onto 10% SDS–PAGEgels. Western detection was carried out using a Li-Cor Odyssey image reader (Li-Cor, USA) (Supplementary Fig. 17). The goat anti-rabbit IgG (Cat#C30502-01) andgoat anti-mouse IgG (Cat#C30509-01) secondary antibodies were obtained fromLi-Cor (USA). The final concentration of the secondary antibodies used was 0.1 μgml−1 (1:10000 dilution). The primary antibodies against β-Actin (Cat#60008-1,1:5000 dilution), GOT1 (Cat#14886-1-AP, 1:1000 dilution), DHODH (Cat#14877-1-AP, 1:1000 dilution), HIF1α (Cat#20960-1-AP, 1:1000), and UMPS (Cat#14830-1-AP, 1:1000) were purchased from Proteintech (USA). Antibodies against CAD(Cat#sc-376072 from Santa Cruz, USA) and pCAD (Ser1859) (Cat#70307 fromCell Signaling Technology) were used with a dilution of 1:1000.
Gene construction and lentivirus production. All cDNAs were cloned into len-tiviral expression vectors, pCDH-puro-CMV or pCDH-Neo-CMV. The pLKO.1lentiviral RNAi expression system was used to construct lentiviral shRNA forgenes. The sequences of shRNA used in this study included the following:shScramble: CCTAAGGTTAAGTCGCCCTCG, shDHODH-#1: GTGAGAGTTCTGGGCCATAAA, shDHODH-#2: CGATGGGCTGATTGTTACGAA,shGOT1-#1: GCGTTGGTACAATGGAACAAA, shGOT1-#2: GCTAATGACAATAGCCTAAAT, shCAD-#1: CGAATCCAGAAGGAACGATTT, and shCAD-#2:GCTCCGAAAGATGGGATATAA. Viral packaging was done according to apreviously described protocol. Briefly, expression plasmids pCDH-CMV-cDNA,pCMV-dR8.91, and pCMV-VSV-G were co-transfected into 293T cells using thecalcium phosphate coprecipitation at 20:10:10 μg (for a 10-cm dish). The trans-fection medium containing calcium phosphate and plasmid mixture was replacedwith fresh complete medium after incubation for 5 h. Media containing virus wascollected 48 h after transfection and then concentrated using Virus ConcentratorKit (Biophay, China). The virus was resuspended in the appropriate amount ofcomplete growth medium and stored at −80 °C. Cancer cells were infected with theviruses at the titer of 100% infection in the presence of polybrene (10 μg ml−1) for48 h, and then cells were selected with puromycin or neomycin.
Statistics. Data are given as means ± SD. Statistical analyses were performed usingunpaired, two-tailed Student’s t-test for comparison between two groups. Asterisksin the figure indicated statistical significances (*p < 0.05; **p < 0.01).
Reporting summary. Further information on experimental design is available inthe Nature Research Reporting Summary linked to this Article.
Data availabilityThe data that support the findings of this study are available within the Article andits Supplementary Information or from the corresponding author upon reasonablerequest.
Received: 25 July 2018 Accepted: 11 December 2018
References1. Nakazawa, M. S., Keith, B. & Simon, M. C. Oxygen availability and metabolic
adaptations. Nat. Rev. Cancer 16, 663–673 (2016).2. Vander Heiden, M. G., Cantley, L. C. & Thompson, C. B. Understanding the
Warburg effect: the metabolic requirements of cell proliferation. Science 324,1029–1033 (2009).
3. Mayers, J. R. & Vander Heiden, M. G. Famine versus feast: understanding themetabolism of tumors in vivo. Trends Biochem. Sci. 40, 130–140 (2015).
4. Altman, B. J., Stine, Z. E. & Dang, C. V. From Krebs to clinic: glutaminemetabolism to cancer therapy. Nat. Rev. Cancer 16, 619–634 (2016).
5. Coloff, J. L. et al. Differential glutamate metabolism in proliferating andquiescent mammary epithelial cells. Cell Metab. 23, 867–880 (2016).
6. Lane, A. N. & Fan, T. W. Regulation of mammalian nucleotide metabolismand biosynthesis. Nucleic Acids Res. 43, 2466–2485 (2015).
7. Hosios, A. M. et al. Amino acids rather than glucose account for the majorityof cell mass in proliferating mammalian cells. Dev. Cell 36, 540–549 (2016).
8. DeBerardinis, R. J. et al. Beyond aerobic glycolysis: transformed cells canengage in glutamine metabolism that exceeds the requirement for protein andnucleotide synthesis. Proc. Natl Acad. Sci. USA 104, 19345–19350 (2007).
9. Moreadith, R. W. & Lehninger, A. L. The pathways of glutamate andglutamine oxidation by tumor cell mitochondria. Role of mitochondrial NAD(P)+-dependent malic enzyme. J. Biol. Chem. 259, 6215–6221 (1984).
10. Metallo, C. M. et al. Reductive glutamine metabolism by IDH1 mediateslipogenesis under hypoxia. Nature 481, 380–384 (2011).
11. Curthoys, N. P. & Watford, M. Regulation of glutaminase activity andglutamine metabolism. Annu Rev. Nutr. 15, 133–159 (1995).
12. Tapper, E. B., Jiang, Z. G. & Patwardhan, V. R. Refining the ammoniahypothesis: a physiology-driven approach to the treatment of hepaticencephalopathy. Mayo Clin. Proc. 90, 646–658 (2015).
13. Kappler, M. et al. Normoxic accumulation of HIF1alpha is associated withglutaminolysis. Clin. Oral Investig. 21, 211–224 (2017).
14. Spinelli, J. B. et al. Metabolic recycling of ammonia via glutamatedehydrogenase supports breast cancer biomass. Science 358, 941–946 (2017).
15. Yang, C. et al. Glioblastoma cells require glutamate dehydrogenase to surviveimpairments of glucose metabolism or Akt signaling. Cancer Res. 69,7986–7993 (2009).
16. Tran, T. Q. et al. Tumor-associated mutant p53 promotes cancer cell survivalupon glutamine deprivation through p21 induction. Oncogene 36, 1991–2001(2017).
17. Reid, M. A. et al. The B55alpha subunit of PP2A drives a p53-dependentmetabolic adaptation to glutamine deprivation. Mol. Cell 50, 200–211 (2013).
18. Qing, G. et al. ATF4 regulates MYC-mediated neuroblastoma cell death uponglutamine deprivation. Cancer Cell 22, 631–644 (2012).
19. Reid, M. A. et al. IKKbeta promotes metabolic adaptation to glutaminedeprivation via phosphorylation and inhibition of PFKFB3. Genes Dev. 30,1837–1851 (2016).
20. Stone, W. L. & Jaishankar, G. B. in Urea Cycle Disorders (eds Babak Abai,et al.) (StatPearls Publishing, Treasure Island, FL, 2018).
21. DeBerardinis, R. J. & Cheng, T. Q’s next: the diverse functions of glutamine inmetabolism, cell biology and cancer. Oncogene 29, 313–324 (2010).
22. Schmitt, D. L. & An, S. Spatial organization of metabolic enzyme complexes incells. Biochemistry 56, 3184–3196 (2017).
23. Ben-Sahra, I., Howell, J. J., Asara, J. M. & Manning, B. D. Stimulation of denovo pyrimidine synthesis by growth signaling through mTOR and S6K1.Science 339, 1323–1328 (2013).
24. Robitaille, A. M. et al. Quantitative phosphoproteomics reveal mTORC1activates de novo pyrimidine synthesis. Science 339, 1320–1323 (2013).
25. Mullen, A. R. et al. Reductive carboxylation supports growth in tumour cellswith defective mitochondria. Nature 481, 385–388 (2011).
26. Sullivan, L. B. et al. Supporting aspartate biosynthesis is an essential functionof respiration in proliferating cells. Cell 162, 552–563 (2015).
27. Birsoy, K. et al. An essential role of the mitochondrial electron transport chainin cell proliferation is to enable aspartate synthesis. Cell 162, 540–551 (2015).
28. Sigoillot, F. D., Evans, D. R. & Guy, H. I. Growth-dependent regulation ofmammalian pyrimidine biosynthesis by the protein kinase A and MAPKsignaling cascades. J. Biol. Chem. 277, 15745–15751 (2002).
29. Cluntun, A. A., Lukey, M. J., Cerione, R. A. & Locasale, J. W. Glutaminemetabolism in cancer: understanding the heterogeneity. Trends Cancer 3,169–180 (2017).
30. Adeva, M. M., Souto, G., Blanco, N. & Donapetry, C. Ammonium metabolismin humans. Metabolism 61, 1495–1511 (2012).
31. Morris, S. M. Jr. Regulation of enzymes of the urea cycle and argininemetabolism. Annu Rev. Nutr. 22, 87–105 (2002).
32. Garcia-Bermudez, J. et al. Aspartate is a limiting metabolite for cancer cellproliferation under hypoxia and in tumours. Nat. Cell Biol. 20, 775–781(2018).
33. Sullivan, L. B. et al. Aspartate is an endogenous metabolic limitation fortumour growth. Nat. Cell Biol. 20, 782–788 (2018).
34. Brosnan, M. E. & Brosnan, J. T. Orotic acid excretion and argininemetabolism. J. Nutr. 137, 1656S–1661S (2007).
35. Salerno, C. & Crifo, C. Diagnostic value of urinary orotic acid levels: applicableseparation methods. J. Chromatogr. B 781, 57–71 (2002).
36. Cui, Y. et al. Determination of glucose deficiency-induced cell death bymitochondrial ATP generation-driven proton homeostasis. J. Mol. Cell Biol. 9,395–408 (2017).
NATURE COMMUNICATIONS | https://doi.org/10.1038/s41467-018-08033-9 ARTICLE
NATURE COMMUNICATIONS | (2019) 10:201 | https://doi.org/10.1038/s41467-018-08033-9 | www.nature.com/naturecommunications 13

37. Zhang, J. et al. Visualization of caspase-3-like activity in cells using agenetically encoded fluorescent biosensor activated by protein cleavage. Nat.Commun. 4, 2157 (2013).
AcknowledgementsWe thank Dr. Ceshi Chen (Kunming Institute of Zoology, Chinese Academy of Sci-ences), Dr. Shimin Zhao (Fudan University), and Dr. Wei Du (University of Chicago,USA) for thoughtful discussion, and also thank Dr. Xiaohui Liu at the MetabolomicsFacility at Tsinghua University Branch of China National Center for Protein Sciences(Beijing, China) for technical help. This work was supported by Grants 81622037 and81672762 from Natural Science Foundation of China, and Start Grant from AdvancedInnovation Center for Human Brain Protection.
Author contributionsY.W., C.B., and Y.R. performed experiments to determine cell proliferation, cell death,and metabolite quantifications. Y.W., C.B., and M.L. prepared samples for LCMSquantification. Y.R., Q.C., and L.Q. created cell lines and performed some proliferationrate experiments. C.Y. provided some ideas. B.L. designed the study and wrote themanuscript.
Additional informationSupplementary Information accompanies this paper at https://doi.org/10.1038/s41467-018-08033-9.
Competing interests: The authors declare no competing interests.
Reprints and permission information is available online at http://npg.nature.com/reprintsandpermissions/
Journal peer review information: Nature Communications thanks the anonymousreviewers for their contribution to the peer review of this work. Peer reviewer reports areavailable.
Publisher’s note: Springer Nature remains neutral with regard to jurisdictional claims inpublished maps and institutional affiliations.
Open Access This article is licensed under a Creative Commons Attri-bution 4.0 International License, which permits use, sharing, adaptation,
distribution and reproduction in any medium or format, as long as you give appropriatecredit to the original author(s) and the source, provide a link to the Creative Commonslicense, and indicate if changes were made. The images or other third party material in thisarticle are included in the article’s Creative Commons license, unless indicated otherwise ina credit line to the material. If material is not included in the article’s Creative Commonslicense and your intended use is not permitted by statutory regulation or exceeds thepermitted use, you will need to obtain permission directly from the copyright holder. Toview a copy of this license, visit http://creativecommons.org/licenses/by/4.0/.
© The Author(s) 2019
ARTICLE NATURE COMMUNICATIONS | https://doi.org/10.1038/s41467-018-08033-9
14 NATURE COMMUNICATIONS | (2019) 10:201 | https://doi.org/10.1038/s41467-018-08033-9 | www.nature.com/naturecommunications