
Coordinated Multipoint Transmission in Femtocell …lib.tkk.fi/Dipl/2011/urn100461.pdfCoordinated...
72
Aalto University School of Electrical Engineering Department of Communications and Networking Coordinated Multipoint Transmission in Femtocell Systems UTKU ÖZTÜRK Thesis submitted in partial fulfillment of the requirements for the Degree of Master of Science in Radio Communications Espoo, May 2011 Supervisor: Prof. Jyri Hämäläinen Instructor: M.Sc. Zhong Zheng
Transcript of Coordinated Multipoint Transmission in Femtocell …lib.tkk.fi/Dipl/2011/urn100461.pdfCoordinated...

Aalto University
School of Electrical Engineering
Department of Communications and Networking
Coordinated Multipoint Transmission
in Femtocell Systems
UTKU ÖZTÜRK
Thesis submitted in partial fulfillment of the requirements for the Degree of Master of Science in
Radio Communications
Espoo, May 2011
Supervisor: Prof. Jyri Hämäläinen
Instructor: M.Sc. Zhong Zheng

ii
ABSTRACT
Author: Utku ÖZTÜRK
Thesis Title: Coordinated Multipoint Transmission in Femtocell Systems
Date: 30.05.2011 Number of Pages: 11 + 61
Faculty: School of Electrical Engineering
Department: Department of Communications and Networking
Supervisor: Prof. Jyri Hämäläinen, Aalto University
Instructor: M.Sc. Zhong Zheng, Aalto University
3GPP includes the LTE air interface specifications in various releases. Several interesting
features such as Home Enhanced Node-B (HeNB) known as femtocells and Coordinated
Multipoint Transmission (CoMP) have been introduced. According to the requirements,
Long Term Evolution is expected to provide higher data rates especially at cell edge.
In this thesis, a noteworthy implementation of Coordinated Multipoint Transmission is
proposed to fulfil the performance targets of 4G cellular networks. The coordination takes
place in a femtocell network for downlink in this study. The coordination enhances the
signal quality received at the user terminal resulting in an improvement in the indoor
coverage, cell capacity, lower CAPEX and enhanced network topology.
This thesis studies the positive and negative aspects of implementation of CoMP in
femtocell systems within LTE framework. The basic work done throughout this thesis is to
investigate the parameter configuration and performance evaluation of downlink base
station coordination in LTE femtocell scenario. 3GPP’s technical specifications are applied
for both macrocell and femtocell deployment. Parameter optimization and performance
evaluation are examined for the users in the femtocell from different perspectives.
Keyword: 3GPP, LTE, LTE Advanced, CoMP, Femtocell, Downlink, Throughput

iii
Acknowledgements
I would like to thank my supervisor Prof. Jyri Hämäläinen for giving me the opportunity to work on
CoMP. His attitude towards my study has always been very encouraging and making me feel
comfortable at all stages of my study. I believe this work would not be successful without his vast
understanding and harmony. I also would like to thank my instructor M.Sc. Zhong Zheng for his
invaluable guidance and patience on me from the beginning till the very end of my thesis work.
This thesis would not have existed if he had not been that constructive.
I am grateful to Melih Kandemir who enlightened me on coding and several other technical issues
when I encountered troubles. I also would like to express my gratitude to my friends spread
around the world for their encouragement and amusing conversations.
Yavuz Çetin, Baba Zula, Zaz, Jefferson Airplane, Radyo Babylon, bossa nova and afro beats kept me
more focused with their brilliant musical touches to my mind during the times I was working
alone. I would like to thank them and many other musicians for their existences.
The final and the strongest thanks go to my family. They have been and will be the sources of my
joy throughout my life. Nothing would be meaningful without their substantive help during my
different moods.
May, 2011
Espoo, FINLAND
Utku ÖZTÜRK

iv
Table of Contents
List of Acronyms .......................................................................................................................................... vi
List of Figures............................................................................................................................................... ix
List of Tables ................................................................................................................................................ xi
1. Introduction ......................................................................................................................................... 1
1.1. Problem Statement ...................................................................................................................... 1
1.2. Thesis Outline ............................................................................................................................... 2
2. LTE – Long Term Evolution ..................................................................................................................... 3
2.1. Evolution before LTE ..................................................................................................................... 3
2.2. Introduction to LTE ....................................................................................................................... 3
2.3. LTE System Performance .............................................................................................................. 5
2.4. LTE System Architecture ............................................................................................................... 6
2.5. LTE Multiple Access Technologies ................................................................................................. 8
2.5.1. OFDMA in Downlink .............................................................................................................. 8
2.5.2. SC-FDMA in Uplink ...............................................................................................................11
3. Femtocell Concept ..............................................................................................................................13
3.1. Introduction ................................................................................................................................13
3.2. The Need for Femtocells ..............................................................................................................14
3.3. Industry Activity ..........................................................................................................................15
3.4. Femtocell Architecture ................................................................................................................16
3.5. Interference ................................................................................................................................18
3.5.1. Co-layer interference ...........................................................................................................19
3.5.2. Cross-layer interference .......................................................................................................19
3.6. Spectrum Allocation ....................................................................................................................20
3.6.1. Orthogonal Channel Assignment ..........................................................................................20
3.6.2. Co-channel Assignment........................................................................................................21
4. CoMP – Coordinated MultiPoint Transmission ....................................................................................22
4.1. Introduction ................................................................................................................................22
4.2. Background .................................................................................................................................22
4.3. The CoMP Architecture ...............................................................................................................23
4.3.1. Centralized Architecture ......................................................................................................24

v
4.3.2. Distributed Architecture ......................................................................................................24
4.4. CoMP Schemes ............................................................................................................................25
4.4.1. CoMP Schemes in the Downlink ...........................................................................................25
4.4.2. CoMP Schemes in the Uplink ...............................................................................................29
5. System Simulator ................................................................................................................................30
5.1. Problem Foundation ....................................................................................................................30
5.2. Simulator Overview .....................................................................................................................30
5.3. Antenna Pattern ..........................................................................................................................35
5.4. Channel Model ............................................................................................................................36
5.4.1. Path Loss .............................................................................................................................36
5.4.2. Wall Attenuation .................................................................................................................37
5.4.3. Shadowing Model ................................................................................................................38
5.4.4. Fast Fading Model................................................................................................................38
5.5. Scheduling ...................................................................................................................................39
5.6. Throughput .................................................................................................................................39
5.7. The Description of the Algorithm for Coordination ......................................................................40
6. System Performance Analysis ..............................................................................................................42
6.1. Assessment Methodology............................................................................................................42
6.2. Simulation Results .......................................................................................................................43
6.2.1. Impact of FBS Penetration Rate ...........................................................................................43
6.2.2. Performance Evaluation for SINR Threshold Levels ..............................................................47
6.2.3. Comparison of CDF under different SINR thresholds and FBS ...............................................51
6.2.4. Performance of the Users in the Femtocell Network ............................................................52
6.2.5. Performance of the Worst Users in the Femtocell Network ..................................................53
6.2.6. Connectivity Performance ....................................................................................................54
6.2.7. Capacity Performance ..........................................................................................................55
7. Conclusion ..........................................................................................................................................57
Future Work ...............................................................................................................................................58
References ..................................................................................................................................................59

vi
List of Acronyms
1G First Generation
2G Second Generation
3G Third Generation
3GPP Third Generation Partnership Project
aGW Access Gateway
AMPS Advanced Mobile Phone Service
BS Base Station
CAPEX Capital Expense
CDF Cumulative Distribution Function
CDMA Code Division Multiple Access
CoMP Coordinated MultiPoint Transmission
CP Control Plane
CS/CB Coordinated Scheduling / Coordinated Beamforming
CSG Closed Subscriber Group
DFT Discrete Fourier Transform
DL Downlink
DSC Dynamic Cell Selection
eICIC Enhanced Intercell Interference Coordination
EPC Evolved Packet Core
E-UTRAN Evolved UMTS Terrestrial Radio Access Network
FAP Femtocell Access Point
FFT Fast Fourier Transform
GGSN Gateway GPRS Support Node
GPRS General Packet Radio Service

vii
GSM Global System for Mobile Telephony
HeNB Home Enhanced Node-B
HSDPS High Speed Downlink Packet Access
HSPA High Speed Packet Access
HSS Home Subscriber Service
HSUPS High Speed Uplink Packet Access
ICI Inter-carrier Interference
IFFT Inverse Fast Fourier Transform
IP Internet Protocol
ISD Inter Site Distance
ITU International Telecommunication Union
JP Joint Processing
JT Joint Transmission
LTE Long Term Evolution
LTE-A LTE - Advanced
MIMO Multiple Input Multiple Output
MME Mobility Management Entity
MSC Mobile Switching Centre
NMT Nordic Mobile Telephony
OFDM Orthogonal Frequency Division Multiplexing
OFDMA Orthogonal Frequency Division Multiple Access
OPEX Operational Expenses
PAPR Peak to Average Power Ratio
PCRF Policy and Charging Rules Function
PDN Public Data Network
PDSCH Physical Downlink Shared Channel
P-GW PDN Gateway
PL Path Loss

viii
PRB Physical Resource Block
PS Packet Switched
PUSCH Physical Uplink Shared Channel
QoS Quality of Service
RAN Radio Access Network
RN Relay Node
RNC Radio Network Controller
RR Round Robin
RTT Round Trip Time
SAE System Architecture Evolution
SC-FDMA Single Carrier – Frequency Division Multiple Access
SGSN Serving GPRS Support Node
S-GW Serving Gateway
SINR Signal to Interference plus Noise Ratio
SNR Signal to Noise Ratio
TDD Time Division Duplex
UE User Equipment
UL Uplink
UMTS Universal Mobile Telecommunication System
UPE User Plane Entity
WiMAX Worldwide Interoperability for Microwave Access
WLAN Wireless Local Area Network

ix
List of Figures
Figure 1. LTE Radio Access Network Architecture ........................................................................... 7
Figure 2. LTE/SAE Architecture ........................................................................................................ 8
Figure 3. OFDM Subcarrier Spectrum ............................................................................................. 9
Figure 4. OFDM Symbol Structure with Cyclic Prefix ....................................................................... 9
Figure 5. OFDMA Receiver and Transmitter Diagram .................................................................... 10
Figure 6. SC-FDMA Transmitter and Receiver Diagram ................................................................. 11
Figure 7. OFDMA vs. SC-FDMA ..................................................................................................... 12
Figure 8. Comparison of cell sizes of different technologies .......................................................... 14
Figure 9. Simplified diagram of LTE femtocell network architecture .............................................. 17
Figure 10. LTE Femtocells without HeNB Gateway ....................................................................... 17
Figure 11. GW aggregates both the control plane and the user plane traffic ................................ 18
Figure 12. Inter macrocell-femtocell and Inter femtocell interference.......................................... 19
Figure 13. (a) Cross-layer Interference (b) Co-layer interference .................................................. 20
Figure 14. Coordinated Multipoint Transmission in Downlink ....................................................... 23
Figure 15. Coordinated Scheduling / Beamforming Scheme .......................................................... 26
Figure 16. System model of two interfering users ........................................................................ 26
Figure 17. Joint processing techniques: (a) joint transmission and (b) dynamic cell selection ....... 27
Figure 18. CoMP Reception schemes ............................................................................................. 29
Figure 19. The macrocell base station layout ................................................................................. 31
Figure 20. HeNB an UE layout in a block ........................................................................................ 32
Figure 21. Horizontal Antenna Pattern Model ............................................................................... 35
Figure 22. Power Delay Profile of Extended Pedestrian Model ...................................................... 38
Figure 23. (a) PRBs' effect on signal power (b) PRBs' effect on interference .................................. 41
Figure 24. Femtocell base station layouts for penetration rates 1 and 0.5, respectively ................ 43
Figure 25. CDF of throughput for FBS comparison for all users ...................................................... 44
Figure 26. CDF of throughput for FBS comparison for the worst user ............................................ 46
Figure 27. Average Number of Assisting BSs vs. SINR Threshold levels .......................................... 48
Figure 28. CDF of throughput for SINR threshold comparison for all users .................................... 49

x
Figure 29. CDF of throughput for SINR threshold comparison for the worst user .......................... 50
Figure 30. CDF of throughput for SINR threshold – FBS rate combinations .................................... 52
Figure 31. Throughput comparison of median and 5%-ile users .................................................... 52
Figure 32. Throughput comparison of median and 5%-ile worst users ........................................... 53
Figure 33. Connectivity concern of the users in the system ........................................................... 54
Figure 34. Capacity concern of the users in the system ................................................................. 55

xi
List of Tables
Table 1. Physical Layer Parameters for Different Bandwidth ......................................................... 10
Table 2. Macrocell system assumptions ........................................................................................ 33
Table 3. HeNB system assumptions ............................................................................................... 34
Table 4. Parameter sets used in the study ..................................................................................... 43

1
1. Introduction
1.1. Problem Statement
The Third Generation Partnership Project known as 3GPP includes the LTE air interface
specifications in Releases 8 to 10. Several interesting features such as Home Enhanced Node-B
(HeNB), Self Organizing Network (SON) and Coordinated Multipoint Transmission (CoMP) have
been introduced. According to the requirements, Long Term Evolution - Advanced (LTE-A) is
expected to provide higher data rates especially at cell edge. The increase in the data rates can be
obtained by increasing the transmission power. However, it causes higher interference in the
network and shorter battery life in the terminals. Another solution is plan the cellular network
such that the cell size is smaller which in turn increase the signal power at the terminal. The
decrease in the cell size demands an increase in the number of base stations.
One of the most crucial improvements in cellular networks is the use of femtocell networks.
Femtocells provide an attractive solution to improve the signal strength at low costs. In addition,
the losses due to penetration through the walls are overcome by deploying femtocells where the
cell size is reduced. One of the purposes of this thesis is to discuss the positive and negative
aspects of the implementation of femtocell concept in LTE framework. It is important to note that
femtocell deployment with low power base stations require deep thinking about interference
mitigation. New base stations introduced by femtocell concept leads to inter-cell interference
throughout the network, when a high number of small base stations is deployed in the macrocell
in systems such as LTE.
CoMP arises as a good solution to increase the signal level in the user equipment. The
coordination of the base stations is an important means to increase the system capacity as well.
Therefore, the original macrocell base station network deployment is improved and thus,
improved performance is achieved. The main purpose of this thesis is to investigate the effects of
CoMP deployment in femtocell network within the LTE framework in downlink transmission. The
CoMP scheme approved by 3GPP for LTE is implemented and its performance evaluation is
investigated in this thesis.

2
1.2. Thesis Outline
Chapter 2 contains the literature review describing the 3GPP LTE features which focuses mainly on
the evolution to LTE, its architecture and MAC scheme. The multiple access technology used in
downlink is reviewed in detail.
Chapter 3 gives an overview on femtocell networks by describing the femtocell concept and
system architecture. The interference scenarios in femtocell networks are also covered.
The rationale behind Coordinative Multipoint Transmission is discussed as well as its system
architecture in Chapter 4. The most comprehensively studied subject in this chapter is the possible
transmission schemes in CoMP.
In Chapter 5, the model used in the simulator is described in detail. After giving an overview to the
system, the antenna patterns, channel model including path loss, wall attenuation and fading
environment are described. This chapter ends with the brief explanation of the algorithm
implemented for the coordination among the base stations.
Chapter 6 illustrates the simulation results with different system parameter configurations. Key
performance metrics are measured and analyzed.
The work conducted is briefly summarized and conclusions are drawn in Chapter 7. This chapter
closes with recommendations for further study to continue building upon the achievements of this
Master’s thesis.

3
2. LTE – Long Term Evolution
2.1. Evolution before LTE
The first experiments on mobile telephony were received in early 1980’s, when Nordic Mobile
Telephony (NMT) system was introduced in Nordic countries in 1981. Concurrently, the analogue
Advanced Mobile Phone Service (AMPS) was introduced in North America. These systems were
power thirsty systems; therefore, their mobility capabilities were quite limited. Besides supporting
voice communication, AMPS and NMT also had some supplementary services and they are known
as First Generation (1G) communication systems.
Together with the developments in digital communication technologies, foundation towards the
evolution of Second Generation (2G) mobile communication technologies started. Global System
for Mobile Telephony (GSM) was introduced as a milestone in wireless communication and it is still
a widely accepted 2G technology. In the second half of the 90’s, General Packet Radio Service
(GPRS) was commenced to GSM and other cellular technologies and evolved 2G systems under the
name 2,5G.
In order to obtain higher data rates, International Telecommunications Union (ITU) started at 90’s
the Universal Mobile Telecommunication Services (UMTS) which is referred to the Third
Generation (3G) mobile communication systems. The thrust for faster communication and better
efficiency accelerated the development of 3G systems to 3,5G systems like High Speed Packet
Access (HSPA). Since 1998, 3GPP has been responsible for the coordinated development of mobile
communication standards [1].
2.2. Introduction to LTE
Long Term Evolution (LTE) is the standardization process for mobile communication systems
towards 4G technologies. It is the latest commercially deployed standard for 3GPP technologies
which covers also GSM, GPRS, WCDMA and HSPA. The evolution towards LTE in principle began
with Release 98 specifying GSM and then continued with Release 99. Release 99 specifies UMTS
with CDMA air interface. The technology moved to all-IP network development in Release 4. UMTS

4
networks development moved to HSPA introduced in 2002 by Release 5 (HSDPA) and Release 6
(HSUPA). The improvements in mobile technologies went on by HSPA+ which is described in
Release 7 and together with Release 8, LTE was introduced in 2008.
The major advance in cellular technology is introduced by the 3GPP LTE which is designed to meet
the needs for high-speed data rate, low latency and optimization of packet traffic. The studies of
3GPP on mobile broadband communication systems evolution aim worthwhile leaps forward
regarding better user experience with reduced amounts of costs. LTE will amend more exigent
applications such as interactive TV, advanced games and professional services. Hence, the
deployment of LTE systems will offer several opportunities for both operators and vendors.
LTE and its successor technology LTE-A offer numerous benefits for users of different terminals,
including:
One of the most important objectives of LTE is to provide peak data rate of 100Mbps in
downlink (DL) and 50Mbps in uplink (UL). Moreover, the round trip times (RTT) is less than
10ms, implying LTE already approaches 4G requirements.
LTE network architecture has a number of features, such as self-configuration and self-
optimization, to help handling the data traffic and providing low cost operations which
simplifies the installation and management of next generation networks.
The elaborated use of scheduling algorithms and advanced multi-antenna methods
improves the data rates with a better use of resources.
The use of relay nodes (RN) and femtocells drastically increase the coverage providing
flexibility to the utilization of existing and new frequency bands.
Different bandwidths can be used depending upon the requirements which provide
bandwidth scalability.

5
LTE supports both Time Division Duplex (TDD) and Frequency Division Duplex (FDD). The
lack of simultaneous transmission in uplink and downlink in TDD causes the peak data rate
requirements not to be fulfilled. This problem is resolved by FDD.
Low latency capability is the outstanding feature in LTE systems. 5ms user plane latency is
required in one way. Control plane latency of 100ms is required from camped state to the
active state. The camped state corresponds to the state in which the terminal is introduced
to the network and the network knows which cell the terminal is in. However, no resources
are assigned to the terminal yet. This is also called as the idle state.
2.3. LTE System Performance
Spectrum Efficiency
According to the original design goals, LTE offers 3-4 times more spectral efficiency in downlink
than its preceding technology HSDPA announced in Release 6 and 2-3 times higher spectral
efficiency in the uplink compared to Release 6. The throughput of a system is closely related to the
spectral efficiency. Therefore, it was expected that LTE performs about 7 times better in downlink
(100Mbps) and 8 times better in uplink (50Mbps) than HSPA Release 6 specifications. Besides, the
average throughput of LTE in the uplink is 2-3 times better than Release 6 Enhanced Uplink at the
cell edge.
Mobility
Although the LTE system is optimized to operate at low mobility scenarios like 0-15 km/h, high
performances are also experienced from 15 km/h to 120 km/h. Connection is maintained up to
350 km/h.

6
Coverage
A cell having a 5 km of radius fulfil the performance aims mentioned above for mobility, spectrum
efficiency and throughput. Suitable network topologies allow the LTE systems operate up to a cell
range of 30 km. However, the system encounters minor quality degradations.
The overall purpose of LTE is to yield an outstanding high performance radio access which is able
to cope with high mobility cases. Besides, it is able to serve what its preceding technologies offer
in terms of capacity, mobility and coverage and it provides more.
2.4. LTE System Architecture
Together with radio access technology improvements, the core network is a part of this evolution
as well, which is known as System Architecture Evolution (SAE). SAE offers a number of key
advantages to 3GPP LTE architecture, which are namely: improved data capacity, all IP
architecture, reduced latency and reduced capital and operational expenditures (CAPEX & OPEX)
[2]. Thus, LTE evolves to a totally packet switched (PS) network architecture. To accomplish the
above mentioned points, the complexity of the system is reduced by decreasing the number of
network nodes encountered throughout the journey of a packet to the destination. This appears
to be a crucial part of the evolution because less number of nodes saves the system from several
processes on the protocols and costs faced during the tests.
The LTE Radio Access Network (RAN) architecture consists of several eNodeBs (evolved NodeB).
eNodeB is the base station which controls the radio resource management functions. As an
architectural evolution in LTE, eNodeBs are spread over the network coverage area; consequently,
the Radio Network Controller (RNC) of HSPA is removed from the architecture. Moreover, the
Serving GPRS Support Node (SGSN) and Gateway GPRS Support Node (GGSN) are replaced by SAE
Gateway (S-GW), resulting in smaller delays during the traffic flow.

7
Figure 1. LTE Radio Access Network Architecture [3]
The eNodeBs are connected to each other via the interface called X2 and to the S-GWs via S1
interface. Besides controlling resource management tasks such as radio bearer control, radio
admission control, radio mobility control; eNodeB executes transmission of paging messages,
scheduling and dynamic allocation of resources to user equipments (UE) for both uplink and
downlink. An Access Gateway (aGW) is the node above eNodeB. eNodeBs can be connected to
one or more aGWs in the radio network design. Furthermore, aGW is divided into two parts
considering their functionalities, Mobility Management Entity (MME) and User Plane Entity (UPE).
Soft handover is not supported in the LTE which, in return, simplifies the overall implantation.
The mobility management in LTE network and between other 3GPP radio technologies such as
GSM is handled by S-GW and Public Data Network (PDN) Gateway (P-GW). The task of S-GW is to
serve as local mobility anchor for the data bearers in order to perform inter-eNodeB handover
process. S-GW also manages inter-3GPP mobility, routes and forwards the packets. On the other
hand, P-GW is a mobility anchor point for non-3GPP technologies such as CDMA 2000 and WiMAX.
P-GW is also responsible for IP address allocation for the UE.

8
Figure 2. LTE/SAE Architecture [4]
The Mobility Management Entity (MME) is the control element for mobility handling and mobility
management in the idle state. MME also performs SAE Bearer and security control. PDN and MME
are connected. S11 interface connects MME and PDN.
The Policy and Charging Rules Function (PCRF) conducts charging policy and Quality of Service
(QoS) policies.
The Home Subscriber Service (HSS) is the equivalent element for Home Location Register (HLR) in
its preceding technology. HSS is the repository element for user subscription data and contains
information about the PDNs.
2.5. LTE Multiple Access Technologies
The new air interface technology of Release 8 is one of the most substantial features in LTE
compared to. LTE is designed to utilize Orthogonal Frequency Division Multiple Access (OFDMA) in
the downlink; whereas, SC-FDMA is chosen as the multiple access scheme in the uplink.
2.5.1. OFDMA in Downlink Orthogonal Frequency Division Multiple Access is chosen to be the transmission scheme in LTE
downlink. OFDMA derives from the multiplexing method called Orthogonal Frequency Division

9
Multiplexing (OFDM), which excels in frequency selective fading environments and is widely
deployed in the following wireless technologies WLAN, WiMAX and DVB broadcast technology.
Furthermore, OFDM meets the demands for spectrum flexibility and provides cost-efficient
solutions for carriers with high peak data rates. OFDM uses numerous closely spaced sub-carriers
in a certain frequency band. Thus, the bandwidth is utilized as efficient as possible. Due to the
orthogonality between the subcarriers, the adjacent subcarrier has zero value at the sampling
instant.
Figure 3. OFDM Subcarrier Spectrum [5]
The spacing of subcarriers helps eliminating inter-carrier interference (ICI). The spacing between
adjacent carriers is determined to be 15 kHz. However, the multipath phenomena leads to delay
spread in transmission and delayed duplicates of the signal which cause inter-symbol interference
(ISI). To avoid ISI, the transmitter introduces Cyclic Prefix (CP). The term CP refers to the prefixing
of a symbol with a repetition to the end. Therefore, the signal is introduced a guard interval.
Nevertheless, the extension of the symbol requires additional power and extra bandwidth.
Figure 4. OFDM Symbol Structure with Cyclic Prefix [6]

10
The OFDM signals are modulated by Inverse Fast Fourier Transform (IFFT) and demodulated by
Fast Fourier Transform (FFT). Each Physical Resource Block (PRB) consists of 12 subcarriers which
are modulated with traditional modulation schemes such as QPSK, 16QAM and 64QAM for both
uplink and downlink. Then, frequency domain signals are converted to time domain signals by
IFFT. Finally, cyclic prefix is added and the signal is sent to the medium. Similar procedures are
applied in the receiver side, but this time in the reverse order.
Figure 5. OFDMA Transmitter and Receiver Diagram [4]
Table 1. Physical Layer Parameters for Different Bandwidth [4]
OFDMA allows multiple users to transmit simultaneously on different subcarriers. Although
OFDMA offers several advantages in frequency selective fading environments, it’s sensitive to
frequency offsets and phase noise. Another crucial disadvantage is the complexity in dealing with
co-channel interference from nearby cells.

11
2.5.2. SC-FDMA in Uplink Single Carrier Frequency Division Multiple Access (SC-FDMA) offers more attractive solutions for
LTE uplink due to its low Peak-to-Average Power Ratio (PAPR) as an alternative to OFDMA, while
maintaining efficient spectrum utilization due to OFDM modulation. Although the gap between
the performances of OFDMA and SC-FDMA is not much, SC-FDMA is preferred over OFDMA due to
the fact that the transmitter power is of paramount importance in uplink for future wireless
communications.
The battery life is one of the key parameters affecting all mobile devices. Despite the great
improvements in battery life, mobile devices still need to use as low power as they can. High PAPR
signals have low energy efficiency and consume more power in power amplifier. Instead, they
have to use a transmission scheme which operates as constant power level as possible. As a result,
a hybrid format like SC-FDMA is used in LTE systems, which combines low PAPR with multipath
interference resilience and flexible subcarrier frequency allocation offered by OFDM [7].
The data is converted to frequency domain by Discrete Fourier Transform (DFT) in SC-FDMA. The
signal is converted to time domain by IFFT as in OFDM. Finally, CP is added periodically. The ISI
between the data blocks is hindered which reduces the implementation complexity.
Figure 6. SC-FDMA Transmitter and Receiver Diagram [4]

12
The main difference between OFDMA and SC-FDMA is the DFT processing before symbol to
subcarrier mapping. Each subcarrier in an SC-FDMA signal contains the entire transmitted
modulation symbol information owing to DFT spread input data stream mapping to the available
subcarriers. On contrary, each OFDMA subcarrier carries merely the information of that specific
modulation symbol [8].
The figures illustrating OFDMA and S-FDMA can be seen in Figure 7.
Figure 7. OFDMA vs. SC-FDMA [9]
13
3. Femtocell Concept
3.1. Introduction
The easiest way to increase the system capacity of a wireless link is to locate the transmitter and
receiver as close to each other as possible thus creating mutual benefits for both uplink and
downlink quality. In this context, the latest 3GPP releases defined several ways to increase the
system capacity such as distributed antennas, relays, etc. Besides these, another feasible
alternative is the use of femtocells which are also called Home Base Stations (HBS). Considering
the fact that more than 50% of the voice and data are carried out indoor [10], femtocells attract
the attention of the mobile operators and network service providers as less expensive solution.
Microcells and nanocells have been currently used to increase the coverage of indoors and subway
tunnels despite their high costs of installation. As a matter of fact, the CAPEX increases during the
planning, building and installing the equipments in the site and the OPEX is considerably high, due
to the rents of the places where the equipments are installed, the electricity bills and backhaul
costs. Femtocell concept is a method which decreases the expenses besides technical
improvements.
4G radio access technologies require high SINR levels in order to provide good system
performance. Although the current improvements in the radio access technologies perform well,
the users’ main problem is the insufficient indoor signal strength caused by the wall attenuation.
Hence this leads to poor coverage and poor data services claimed by the mobile operators. In
conventional networks, where macrocells are used, it is troublesome to improve the signal quality
together with the cell coverage of indoor areas. For high data rate services, a large number of high
cost macrocell base stations need to be deployed. However it seems almost impossible to find
sites for new base station areas where the population density is high.
The studies of 3GPP improved the capacity and cell coverage area and initiated a new network
element which was initially implemented in the existing cellular network architecture, Home
NodeB (HNB). HNB is declared by 3GPP Rel’8 specifications [11]. Presently, HNB term is often
associated with femtocell or Femto Home Access. Femtocell concept is not only an improvement
in the radio access technology perspective, but also a tool to combine fixed-line broadband access
with cellular network which operates at low power levels. The low-cost nature of this technology

14
offers significant amendments to the subscribers’ home access; meanwhile, enabling the
operators to address new markets [12].
Figure 8. Comparison of cell sizes of different technologies
In order to increase the quality of the wireless data services, one of the most effective solutions is
to reduce the cell size. Femtocells are small, low-cost base stations located in the small spaces
such as houses and offices. The maximum allowed transmit power is low compared to transmit
power of a macrocell base station. Thus, the subscribers’ demands of higher data rates with low
delays are granted by femtocell deployment. The operator may reduce the amount of traffic on
the expensive macrocell network and can focus on outdoor mobile users [13].
3.2. The Need for Femtocells
There are two major limitations for wireless communications: Range and capacity. The service
providers increase the coverage area by either deploying a macrocell while consuming high power,
or using smaller base stations that cover a smaller area but provide high data rates at lower power
levels. Femtocells appear to be an effective solution satisfying the coverage and data rate needs of
the operators in conjunction with inducing little upfront cost to the service provider. From a
financial point of view, femtocells offer low cost solutions to operators presenting an alternative
to high cost high power macrocell base station installations to provide the same Quality of Service
(QoS).
The three main reasons why current cellular systems need to implement femtocells are
summarized as follows [14]:

15
1. Coverage: Macrocells are inadequate when providing indoor coverage due to the signal
attenuation while penetrating the outer walls of the buildings. However, the signal
strength is good when there is small distance between the transmitter and the receiver.
2. Capacity: Since the coverage area of the femtocells is smaller than that of macrocells,
there is less number of users in the cells and each user has a larger share of radio
resources compared to the macrocellular networks.
3. Power: The macrocells handle a large number of users. When some users are passed
on to femtocell base stations which decreases the load of the macrocells. Hence the air
interface is maintained effectively for both outdoor and indoor users and the power
consumed at the macrocell is reduced.
3.3. Industry Activity
Femto Forum is a non-for-profit organization founded in 2007 to encourage the deployment of
femtocells worldwide. Service providers, mobile operators, hardware, software vendors and start-
ups are the associates of this community. Femto Forum has strong connections with other
industrial communities such as GSM Association, 3GPP, 3GPP2 and WiMax Forum. A brief
explanation of how and when the concept of femtocells started being in use is touched upon
below [15].
In 2002, Motorola evolved the world’s smallest full-function UMTS Femtocell Base station. In
2005, providers such as Samsung, Alcatel-Lucent, Airwalk, picoChip, etc. widely acknowledged the
idea of femtocells. Femtocell systems were demonstrated at the cellular industry 3GSM
conference in 2007. Sprint Nextel initiated a limited rollout of femtocells deployed by Samsung
which operate with any Sprint handset. Ericsson, NEC, Samsung, Nokia Siemens Networks,
Airvana, Qualcomm are the companies that have launched 3G femtocell base stations.
In conventional 2G and 3G systems, femtocells are implemented on top of existing cellular
networks. In WiMAX forum, service providers have started working on the requirements for
femtocells from perspective of network operators together with the improvements in 4G systems.

16
Several service providers are planning to introduce femtocells into their networks to improve the
throughput of the current users.
3.4. Femtocell Architecture
The current 3G architecture is hierarchical. It consists of the macrocell node connected to the
Radio Network Controller (RNC). The RNC is connected to tens to hundreds of base stations. The
RNC performs radio resource management and handovers between base stations and it is
connected to the Mobile Switching Center (MSC) and the Serving GPRS Support Node (SGSN), and
the Gateway GPRS Support node (GGSN). The MSC is connected to the Public Switched Telephone
Network (PSTN) and to several RNCs. The SGSN and GGSN support mobile data services, routing
protocols and security issues in a typical 3G system. Considering LTE case, the developments also
necessitates a reduction in the network architecture of femtocell systems.
The standardization of femtocells / Home NodeBs in LTE networks is conducted by 3GPP with TR
R3.020 Rel-8. Regarding the different demands of different operators, the initial Radio Access
Network (RAN) centric solution is evolved along with developments in LTE. The standardization
processes try to integrate femtocells into the Evolved Packet Core (EPC) infrastructure using the
same interfaces defined for macrocells; so that, either femtocells or macrocells is able to use the
same EPC. The LTE EPC is based on flat IP architecture and so are the femtocells’ and macrocells’
architecture and interface. New interfaces between LTE femtocells and EPC elements are
redundant.
The ultimate evolution of femtocell access network architecture is depicted in Figure 9. Simplified
diagram of LTE femtocell network architecture Depending on how a femtocell gateway is placed,
various ways of connecting HeNBs to the core network exist. From a logical point of view, the X2 is
a point-to-point interface between eNodeBs within E-UTRAN.

17
Figure 9. Simplified diagram of LTE femtocell network architecture
S1 interface connects LTE femtocells to the Mobility Management Entities (MME) and Serving
Gateways (S-GW) directly in case of absence of a femto gateway, assuming that MME and S-GW
have sufficient capacity to support large numbers of femto S1 interfaces as in Figure 10. LTE
Femtocells without HeNB Gateway
Figure 10. LTE Femtocells without HeNB Gateway [15]
In installations with a Control Plane (CP), the femto gateway only aggregates CP traffic from
multiple FAPs to the MME. In installations with a CP and User Plane (UP), the femtocell gateway

18
aggregates both CP traffic from femtocells to the MME and UP traffic from femtocells to the S-GW
[16] as depicted in Figure 11. GW aggregates both the control plane and the user plane traffic
Figure 11. GW aggregates both the control plane and the user plane traffic [15]
3.5. Interference
The femtocell concept can be established on a wide range of wireless technologies, so great
attention must be paid in selecting the most appropriate technology for a given scenario. LTE
femtocells do not have a dedicated frequency band in the spectrum, they are able to use all bands
defined by 3GPP. However, dedicated bands can mitigate interference towards macrocell users.
Regardless of the frequency bands they use in the spectrum, LTE femtocells provide high capacity
in smaller areas even at higher frequencies with very little upfront costs.
Whereas the cell sites are planned very carefully and frequencies are allocated to prevent
interference in macrocell networks; deploying femtocells require variant mitigation techniques
within a macrocell. The interference occurs in the six possible links; which are named as femto to
macro, macro to femto, and femto to femto (uplink and downlink); highly depends on whether
cells share spectrum and cause co-layer interference [16]. The interference in femtocell systems
can be categorized basically in two groups: Co-layer interference and cross-layer interference [17].
See Figure 13. (a) Cross-layer Interference (b) Co-layer interference

19
3.5.1. Co-layer interference Co-layer interference is caused by the undesired signals received at the femtocell and sent by
other femtocells. Due to the low isolation between the houses and apartments, co-layer
interference occurs primarily between neighbours. Using a dedicated channel narrows the
interference alternatives down to only femto-to-femto interference scenario. Low transmit power
of HeNBs play an important role in reducing the interference in femto-to-femto case. Downlink
interference may be high when the UE connected to the eNB at the macrocell edge is not in the
femtocell Closed Subscriber Group (CSG) list. The scope of this thesis is mostly interested in the
femtocell downlink interference to nearby femtocell UE which is model for co-layer interference.
All six interference scenarios have major roles in co-channel setups.
3.5.2. Cross-layer interference Cross-layer interference occurs when the aggressor and the victim systems belong to different
layers of the network in two-layer networks. For instance, the distortion caused by an active FAP –
femtocell layer- at the downlink of one or several macrocells –macrocell layer- is a clear case of
cross-layer interference. In this case, cross-layer interference may be heavy in both uplink and
downlink direction.
Figure 12. Inter macrocell-femtocell and Inter femtocell interference
The UE served by the FAP interferes in the uplink at the cell edge. This interference can be
mitigated by autonomous interference management schemes in order to enable uncoordinated
deployment without prior network planning. 3GPP autonomous interference mitigation traits,

20
such as macro-aware UE power capping and adaptive maximum output power control, help
ensure acceptable performance and deployment with a dedicated band. Enhanced inter-cell
interference coordination (eICIC) schemes are also being discusses by 3GPP.
(a) (b)
Figure 13. (a) Cross-layer Interference (b) Co-layer interference
3.6. Spectrum Allocation
OFDMA subchannels can be allocated in different aspects to avoid both co-layer and cross-layer
interference. Two of these approaches are explained below, namely, orthogonal channel
assignment and co-channel assignment.
3.6.1. Orthogonal Channel Assignment Orthogonal channel assignment is an effective approach to annihilate cross-layer interference. The
frequency spectrum is divided to two parts, one of which belonging to macrocell use and the other
belonging to femtocell use. Some companies support this approach by allocating a large fraction of
the spectrum to the macrocell users and acquiring additional spectrum to be exclusively used by
the femtocells. The spectrum allocation can be carried out by either statically or dynamically in
orthogonal channel assignment approach. Over the target geographic area, the traffic load and
user mobility are the main paradigms in deciding a static or a dynamic allocation. Although
orthogonal channel assignment is the optimal spectrum allocation approach to remove cross-layer
interference, it is less efficient in spectral use.
21
3.6.2. Co-channel Assignment Co-channel assignment is another approach to deal with interference which appears to be profitable
for operators. The subchannels are shared between macrocell layer and femtocell layer,
constituting in a more efficient use of spectrum in spite of being complicated for the
implementation.
The next step is to determine whether to use centralized or distributed approach. In order to
mitigate both co-layer and cross-layer interference in centralized approach, there is need for an
intelligent central unit to decide how to allocate the subchannels between neighbouring cells. The
information gathered from the femtocells and the users are processed in this central unit to figure
out the optimal solution for the network. However, this approach brings about complexity
problem when the number of users in large, which, in turn, slows down the operation.
In distributed approach, each cell manages its own subchannels enabling more self-organization.
This approach has two different sub-approaches, cooperative and non-cooperative depending on
whether there is information exchange between cells.
In a non-cooperative approach, each femtocell plans its own subchannels such that the throughput
and QoS is maximized for the users of the femtocell at issue. The effects of this allocation might
cause significant interference to the neighbouring cells as the allocation takes place independent
from the other users’ allocation considerations. Thus this method comes out to be an
opportunistic method which can also be regarded as a greedy method.
On the other hand, in a cooperative approach, each femtocell acquires the information of the
neighbouring femtocells and performs its spectrum allocation considering the interference caused
to the neighbours. Therefore, the average femtocell throughput and QoS is optimized. Both in
resource management and interference mitigation perspective, a co-operative approach is more
efficient, provided that it is implemented properly. The drawback of this approach is the additional
overhead and decision mechanisms taking place while gathering information about the
neighbouring cells.

22
4. CoMP – Coordinated MultiPoint Transmission
4.1. Introduction
Recently, the academic institutions and the industry have put great effort to improve the spectral
efficiency and data throughput of LTE systems. In many cases, the achievable cell spectral
efficiency is limited by the inter-cell interference. Therefore, Coordinated MultiPoint Transmission
(CoMP) was introduced in LTE-Advanced technology to relax performance limitations. This chapter
incites some of the reasons why this emerging field draws attention. It also outlines the
classification and the obstacles encountered in realizing CoMP schemes.
4.2. Background
The scarcity of spectrum for wireless communication systems has triggered the demand for
spectrally efficient communication systems. The performance of a communication system is
conventionally measured in terms of spectrum efficiency in bits/s/Hz/unit-area. In cellular
communication systems such as 3GPP Long Term Evolution, the inter-cell interference is one of
the major concerns that affects the data rates of the users at the cell-edge as well as the average
spectral efficiency of the cell.
The inter-cell interference can be dramatically reduced by increasing the frequency reuse factor
that determines the minimum distance between cells operating on the same frequency band.
Signal-to-Interference-plus-Noise-Ratio (SINR) improves significantly when high frequency reuse
factor is used in 2G cellular networks. But the bandwidth available to reuse these frequencies is
lower than the equivalent gain achieved by this SINR improvement [18]. Therefore, traditional
cellular systems suffer from poor spectral efficiency at a high reuse factor. As frequency reuse
factor is one in LTE networks, interference occurs among neighbouring cells, especially at the cell-
edge when the frequency reuse factor is 1 (one), as in LTE-Release 8. Network coordination results
in choosing the antennas from different base stations (BSs) in suitable ways such that the signal
power is increased and the effect of inter-cell interference is reduced. There can also be a
noteworthy increase in spectral efficiency attributed to the use of network coordination at high
Signal-to-Noise Ratio (SNR) [19]. Base station coordination improves the user experience at the

23
cell-edge, by exchanging the cell information among different base stations. Several advanced
technologies have been considered in LTE-A studies [20], see Figure 14.
Figure 14. Coordinated Multipoint Transmission in Downlink [20]
One convenient solution is Coordinated MultiPoint Transmission/Reception where the main focus
is on improving the cell-edge user performance through coordinated beamforming, coordinated
scheduling or joint processing. In order to study CoMP with field trials, projects like “EASY-C” have
been formed [21]; the goal is low latency, fairness and high spectral efficiency. Mentioned EASY-C
operates as one of the world’s largest test beds and distributed CoMP was demonstrated in
Dresden, Germany in June 2009. Other new European research projects have been initiated as
well in order to investigate further the use of CoMP in next generation wireless cellular systems.
4.3. The CoMP Architecture
Coordinated multipoint transmission and reception refers to transmission/reception of data
to/from user equipments located at multiple cells. CoMP coordinates base station antennae
deployed at a number of sites which are in feasible proximity to one another [3]. CoMP in LTE
Advanced context includes various possible coordinating schemes among access points. The 3GPP
Technical report on further advancements of E-UTRA physical layer aspects offers two major
categories in CoMP scheme which are namely Coordinated Scheduling/Beamforming (CS/CB) and
Joint Processing (JP) [22], which are explained in more detail in the following sections.

24
eNBs should be in coordination to reduce the inter-cell interference in the system for both uplink
and downlink. The LTE requires the information of radio resource allocation related to the
reference UE to be available at all base stations in coordination cluster. Therefore the latency of
the links should be very low so that the necessary coordination information can be exchanged in a
very short time frame. There are two kinds of architectures described in [23], each of which can be
combined with any of the transmission schemes mentioned above.
4.3.1. Centralized Architecture A central unit is required to gather the information of all the UEs in the area covered by the base
stations, eNBs in this case. This unit is also responsible for signal processing operations such as
precoding and user scheduling. Moreover, what is crucial in centralized approach is the
requirement of tight time synchronization among eNBs.
At FDD systems such as 4G femtocell network, the downlink channel is known by the UE so that
the UE can feed back the channel coherent or non-coherent indicators (CSI/CQI) in order to help
eNB.
The communication links between the central unit and the eNBs are the main challenges of this
architecture. The links have to support low latency data transmission and the protocols should be
well designed for information exchange.
4.3.2. Distributed Architecture Distributed architecture is another method to establish the coordination among eNBs, lessening
the requirements of centralized approach. Assuming that all eNBs are identical in terms of
scheduling and the channel information within the entire coordination set, cooperation does not
need the wireless communication links between the nodes any longer. Thereby, the signalling
protocol drawback and infrastructure load related to these links are minimized.
The process to be followed in a distributed CoMP system is described as follows. The channels
from all nodes are estimated by the users as is in centralized design. Then the scheduling is
independently executed after these estimations are sent back to the cooperating nodes. Since the

25
eNBs are identical in terms of scheduling, the same input parameters that will control the
cooperation algorithm produce the same output decisions and therefore the same UEs are
selected in the entire eNB cluster.
The main disadvantage of distributed architecture is the reduction in the efficiency of CoMP
algorithm when the eNBs are not cooperating via a wired backhaul. Another drawback can be
stated as the difficulty in error handling on different feedback links.
4.4. CoMP Schemes
As is mentioned in the previous section, 3GPP envisages different possible CoMP schemes in LTE
Advanced for both downlink and uplink. Various approaches exist with a diverse set of
cooperation level neglecting assumptions regarding to centralized or distributed architecture.
In the downlink, cooperative scheduling / beamforming and joint processing are the two CoMP
transmission techniques envisioned. In the first scheme, there is only one eNB transmitting data to
the UE; however, in the second scheme the UE receives data from two or more eNBs
simultaneously. In the uplink, coordinated scheduling is the only method presented.
The benefits of CoMP are expected to be worthwhile only when the SINR of the cell edge users is
low. However, the simulations have already shown that not only cell-edge user throughput is
increased, but the average cell throughput is also increased by CoMP techniques.
4.4.1. CoMP Schemes in the Downlink a) Coordinated Scheduling / Beamforming: In coordinated scheduling / beamforming
scheme, the data at the terminal is received from one of the base stations and
coordination takes place among a set of base stations in order to control and coordinate
the interference at the terminal. The coordinated scheduling is achieved by silencing the
base stations with critical interference towards the victim UE and only allows transmission
from serving BS. In other words, mobile station MS1 receives the intended data from only
one base station, say BS1; however, another base station, say BS2, selects its own UEs in

26
such a way that it causes little interference to the MS1. This method is known as an
interference mitigation method. See Figure 16. System model of two interfered users
Figure 15. Coordinated Scheduling / Beamforming Scheme [23]
The method can be described analytically in the following scenario [24]. Assume there exists two
mobile terminals, MS1 and MS2, and they are served by BS1 and BS2 respectively. The received
signals by MS1 and MS2 are denoted as Y1 and Y2. Hij is the channel gain from BSi to MSj and Wi is
the precoding matrix at BSi. Xi is the signal transmitted and Ni is the additive white noise.
Figure 16. System model of two interfered users [24]
Y1 = H11 W1 X1 + H21 W2 X2 + N1
Y2 = H12 W1 X1 + H22 W2 X2 + N2
According to the above equations, the SINR at each mobile terminal can be expressed as
= || ||
|| || +

27
= || ||
|| || +
where Pi is the transmitted power of Xi at BSi. When mobile terminals are close to each other, {H11,
H12} and {H21, H22} pairs are correlated. Hence, BS1 creates large inter-cell interference at MS2 and
vice versa. In coordinated scheduling and beamforming, SINRs at mobile terminals are improved
by modifying the precoding matrices, Wi. Briefly, this method is primarily used for reducing the
inter-cell interference instead of improving the signal power received at the terminal.
b) Joint Processing: As is described in [23] and [24], in Joint Processing (JP), multiple eNBs
are responsible for the joint transmission of the data for a particular UE to improve the
quality of the received signal and/or to cancel the interference for other terminals.
Different cells share the data intended for a particular UE and the data is jointly processed
at these cells. Hence, received signals are combined together at the mobile terminal
coherently or non-coherently.
JP is categorized into two subcategories which are namely, Joint Transmission (JT) and Dynamic Cell Selection (DSC). See Figure 17.
(a) (b)
Figure 17. Joint processing techniques: (a) joint transmission and (b) dynamic cell selection [23]

28
In DCS, a resource block of the Physical Downlink Shared Channel (PDSCH) is transmitted from one
cell among the coordinated cells. This unique cell is dynamically selected by fast scheduling at the
central base station, where the minimum path loss is considered. Meanwhile, the other cells do
not transmit the resource block so that they do not cause interference to the user. As a result, the
mobile terminal obtains the maximum received power and the interference from other users is
significantly mitigated.
On the other hand, in JT, multiple cells among a cluster of coordinated cells transmit the same
resource block of the PDSCH. JT is accomplished by codebook based precoding in order to reduce
overhead of the feedback signal. Basically, in addition to the precoding matrix at each cell, the
optimum precoding matrices for inter-cell coordination are chosen such that SINR is maximized at
the mobile terminal.
Mobile station 1, MS1, receives signals from three different cells, C1, C2 and C3 where three of them
form a CoMP cluster.
Y1 = H11 W1 X1 + H21 W2 X2 + H31 W3 X3 + N1
If each cell serves its own mobile user, the signals interfere with each other, so SINR1 can be
expressed as;
= || ||
|| || + || || +
In a CoMP joint processing system, the mobile user is served by three of the cells in the CoMP
cluster. Thus, X = X1 = X2 = X3 and consequently;
Y1 = (H11 W1 + H21 W2 + H31 W3)*X + N1
Then the SINR for MS1 is;
= || + + ||

29
It’s clear that SINR’1 is an upper-bound of SINR1 and CoMP induces an SINR gain compared to a
single cell operation [8]. Even though, cooperation of the cells has a positive impact on the user
SINR, it also has an important drawback. SINR1 is the result of a single cell operation; however,
SINR’1 is obtained under the assumption that three cells are serving one mobile terminal.
Therefore, mobile terminals under CoMP joint processing occupy more system resources than the
single cell ones. This is the most important cost of joint processing in CoMP.
4.4.2. CoMP Schemes in the Uplink In CoMP reception in uplink, the Physical Uplink Shared Channel (PUSCH) is received at multiple
base stations and scheduling is coordinated among these stations. Figure 5 depicts two methods
of CoMP reception, Interference Rejection Combining (IRC) and Coordinated Scheduling.
Figure 18. Reception schemes: (a) interference rejection combining (b) coordinated scheduling [20]
In IRC, multiple UE sets transmit the PUSCH simultaneously using same resource block. The
received PUSCHs at multiple cell sites are combined using mean squared error (MMSE) or Zero
forcing (CF) algorithm.
In the second method, CS, only one UE set transmits the PUSCH using a resource block and
coordinated scheduling among cells, thus increasing the power results in the received signal in
higher cell edge user throughput. It is to be noted that CoMP reception in the uplink does not
require significant change in the physical layer radio interface [20].

30
5. System Simulator
5.1. Problem Foundation
LTE network architecture is flexible in extending the network deployment with additional
infrastructures. The flat network architecture allows both coordinated and uncoordinated network
to be deployed in a feasible way.
The main purpose of the simulation is to investigate the influence of the coordination of the base
stations in a femtocell network. Considering the coordination of the base stations, the deployment
brings about some concerns regarding the throughput, spectral efficiency and UE performance.
This study enlightens the advantages and challenges of deploying coordinated base stations in a
femtocell network.
The coordination of the HeNBs brings about an increase in the received signal power at the UE.
However, the HeNB also creates interference to other UEs served by outside the coordination set..
Considering these facts, the SINR levels of the UEs are tried to be improved by using the suitable
coordination method.
Joint processing scheme is approved to be effective in increasing the UE downlink performance in
the uncoordinated femtocell deployment scenario. The frequency selective channel is well
integrated to the simulator to investigate the performance of the algorithm applied.
To have a better understanding of the simulation, the details of the simulator overview, antenna
pattern and channel conditions such as path loss model, wall attenuation model and fading
circumstances are explained in detail as well as scheduling and throughput calculation. The
algorithm implemented is explained after the description of the simulator.
5.2. Simulator Overview
A system level simulator is developed in MATLAB® for this study. The macrocellular networks
follow 3GPP simulation guideline and seven eNBs are deployed with an Inter Site Distance (ISD) of
500m. Each site contains 3 hexagonal sectors, thus forms a number of 21 cells network. Thus the
31
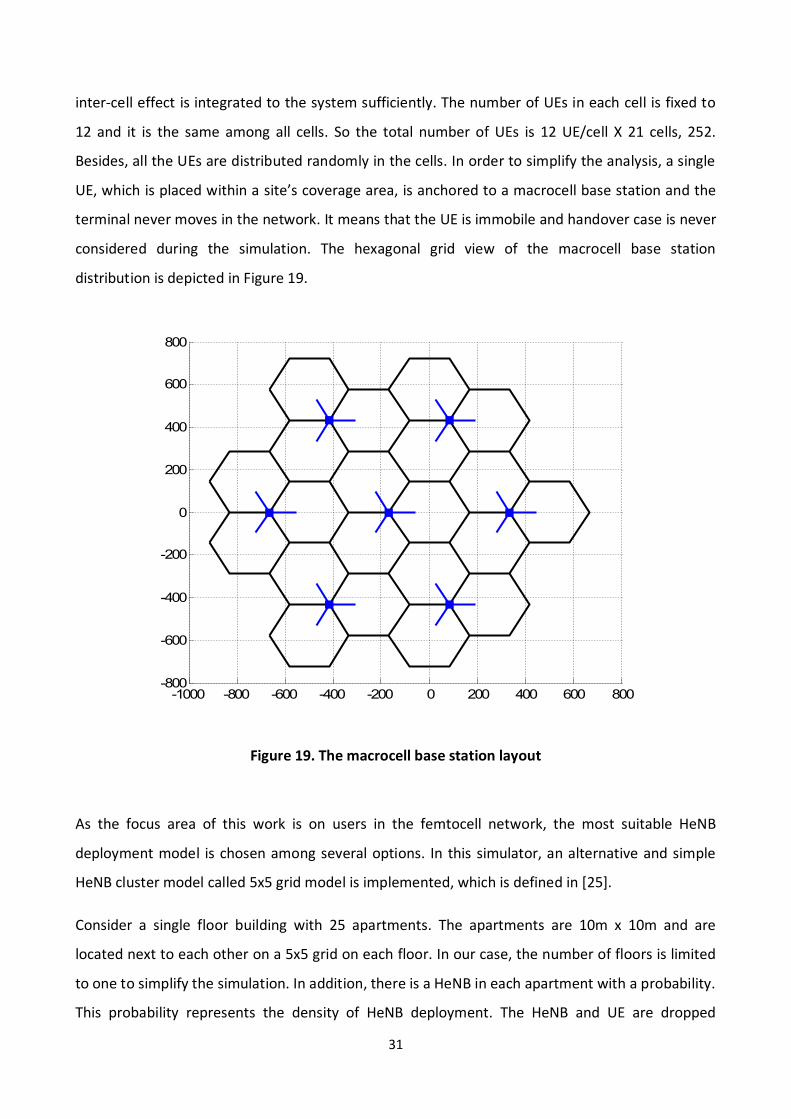
inter-cell effect is integrated to the system sufficiently. The number of UEs in each cell is fixed to
12 and it is the same among all cells. So the total number of UEs is 12 UE/cell X 21 cells, 252.
Besides, all the UEs are distributed randomly in the cells. In order to simplify the analysis, a single
UE, which is placed within a site’s coverage area, is anchored to a macrocell base station and the
terminal never moves in the network. It means that the UE is immobile and handover case is never
considered during the simulation. The hexagonal grid view of the macrocell base station
distribution is depicted in Figure 19.
Figure 19. The macrocell base station layout
As the focus area of this work is on users in the femtocell network, the most suitable HeNB
deployment model is chosen among several options. In this simulator, an alternative and simple
HeNB cluster model called 5x5 grid model is implemented, which is defined in [25].
Consider a single floor building with 25 apartments. The apartments are 10m x 10m and are
located next to each other on a 5x5 grid on each floor. In our case, the number of floors is limited
to one to simplify the simulation. In addition, there is a HeNB in each apartment with a probability.
This probability represents the density of HeNB deployment. The HeNB and UE are dropped
-1000 -800 -600 -400 -200 0 200 400 600 800-800
-600
-400
-200
0
200
400
600
800

32
randomly and uniformly in the apartment for the apartments having a HeNB. In Figure 20, the red
dots refer to UEs and black squares to HeNBs.
Figure 20. HeNB an UE layout in a block
Both slow and fast fading effects are considered in the simulations and different path loss models
are implemented within different environmental scenarios. The selection of serving base stations
is based on the downlink received power at the user equipment. Therefore, the user equipment
will be served by the base station with highest received power level. The received power at the UE
is the difference between the transmit power of the base station and the total loss in the
transmission link. The total loss in the transmission link refers to the path loss caused by the
distance between the transmitter and the receiver, the attenuation caused by the penetration
through the walls, the fading effects and the device gains. In the simulator, the base stations use
Round Robin (RR) scheduler to allocate physical resource blocks to the served UEs at each time
instance. More sophisticated scheduling algorithms utilize the time and the frequency domain
characteristics much better than RR in LTE scheduling. However, RR scheduling is applied since the
fundamental point of this study is not the packet scheduling.
0 5 10 15 20 25 30 35 40 45 500
5
10
15
20
25
30
35
40
45
50HBS layout (ground floor)

33
Several iterations are performed while locating the UEs randomly, to generalize the system
behaviour over an adequate number of samples. The analyses include the statistics of the UEs in a
femtocell block consisting of 25 apartments and a number of HeNBs and UEs depending on the
parameters used in the simulator. Thermal noise spectral density and interference are considered
in the calculation of SINR. Shannon’s formula is modified to compute the throughput and several
system performance metrics are investigated namely mean user throughput, throughput CDF and
median and 5% worst user throughput.
The simulations are performed under an interference limited scenario where ISD is 500m and
system bandwidth is 10 MHz. The parameters for both macrocell and femtocell systems,
implemented in the simulator are displayed in Table 2.
Table 2. Macrocell system assumptions
Macrocell Parameters
Parameter Assumption
Cellular Layout Hexagonal grid, 3 sectors per site, reuse 1.
Inter-site distance 500 m
Number sites 7 ( = 21 cells)
Carrier Frequency 2000 MHz
Distance-dependent path loss See Section 5.4.1
Shadowing standard deviation 8 dB (except among HeNBs)
Shadowing Correlation 0.5
Penetration Loss (assumes UEs are indoors) See Section 5.4.2
UE Noise Figure 7 dB
Total BS TX power (Ptotal) 46 dBm
Inter-cell Interference Modelling Explicit modelling (all cells occupied by UEs)
Antenna Bore-sight points toward flat side of cell (for 3-sector sites with fixed antenna patterns)
UE distribution
UEs dropped with uniform density within the indoors/outdoors macro coverage area, subject to
a minimum separation to macro and HeNBs. The probability of a macro UE being indoors should be a parameter, depending on the scenario being
investigated.
Fading model Correlation matrix based (See Section 5.4.4)

34
Table 3. HeNB system assumptions
HeNB Parameters Parameter Assumption
HeNB Frequency Channel Either same frequency and same bandwidth as macro layer
Number TX antennas HeNB 1 (baseline)
Number Rx antennas HeNB 2
HeNB antenna gain See Section 5.3
Exterior wall penetration loss 20 dB
Interior path loss model See Section 5.4.1
Interior to Exterior path loss model See Section 5.4.1
Exterior path loss model HeNB to UE See Section 5.4.1
Log-normal shadowing standard deviation 4 dB
Noise figure HeNB 8 dB
TX power HeNB 10 dBm
Carrier bandwidth 10 MHz

35
5.3. Antenna Pattern
The antenna pattern describes the sensitivity of the antenna as a function of direction. The
azimuth antenna gain used in the modelling procedure of the macrocell base station antennas is
defined as follows:
( ) = 12 ,
where
- is the 3dB beamwidth of the main lobe of the antenna
= 70 °
- is the front-to-back ratio of the antenna
= 20
- is the maximum gain level of the antenna
= 14
Figure 21 shows the horizontal antenna pattern for the azimuth antenna used in the macrocellular base station antenna.
Figure 21. Horizontal Antenna Pattern Model
The HeNB antenna is omni-directional which means that the sensitivity of the antenna is equal to all directions at all angles.
-150 -100 -50 0 50 100 150
-20
-15
-10
-5
0
Angle,°
Gai
n, d
B
Modelling of Horizontal Pattern

36
5.4. Channel Model
The wireless channels are utilized under different dynamic propagation circumstances. The
suitable propagation scenarios for different environments are mathematically defined by different
channel models. These channel models are formed by comprehensive studies on the behaviour of
the wave propagation under various propagation environments. Channel models are one of the
most important perspectives in a successful system design. The channel model includes mainly 3
topics during the simulation modelling of this thesis. These are path loss model, wall attenuation
model and fading models.
3GPP work group assesses proposals from various institutions and companies to yield more
accurate channel models. The channel models for different propagation scenarios used in this
study for urban deployment are taken from 3GPP technical studies [25].
5.4.1. Path Loss The following models have been used.
Macro BS to UE
UE is outside: Both the UE and BS are outdoors
( ) = 15.3 + 37.6 log ,
UE is inside an apartment: The UE is indoor but the BS is outdoor.
( ) = 15.3 + 37.6 log +
HeNB to UE
UE is inside the same apartment with HeNB: The path loss is modelled by free space loss,
penetration loss due to internal walls and floors.
( ) = 38.46 + 20 log +

37
UE is outside the apartment:
( ) = max(15.3 + 37.6 log , 38.46 + 20 log ) +
UE is inside a different apartment: In this study, only one outer wall parameter is used as
the number of blocks is limited to one.
( ) = max(15.3 + 37.6 log , 38.46 + 20 log ) +
5.4.2. Wall Attenuation The following models have been used.
UE is inside the same apartment as HeNB: The loss due to internal walls is modelled as a
log-linear value equal to 0.7dB/m. , is the distance inside the house.
= + 18.3 ( ) + 0.7 ,
UE is outside the apartment:
= + + 18.3 ( ) + 0.7 ,
UE is inside a different apartment: , , are the penetration losses of outdoor
walls for the two houses.
= + , + , + 18.3 ( ) + 0.7 ,
where
q: the number of walls separating apartments between UE and HeNB
n: the number of penetrated floors
R and d2D,indoor are in meters
Low: the penetration loss due to outer walls
Liw: the penetration loss due to inner walls

38
5.4.3. Shadowing Model All links apply log-normal shadowing model. The standard deviation is assumed to be 4dB for the
transmission links between a HeNB and a UE served by this base station. Otherwise, the standard
deviation is set to be 8dB for all other links in a typical urban environment throughout the entire
simulator where the carrier frequency is 2 GHz.
Shadowing fading is correlated between links from one UE to different macrocell base stations
with correlation indicated in Table 2. In the simulator, we assume no correlation between links
from one BS to multiple UEs.
5.4.4. Fast Fading Model Fast fading is an optional part to be modelled regarding the interference analysis methodology.
However; in this simulator, the multipath environment utilizes fast fading to have more accurate,
thus, realistic results.
The frequency correlation function is defined as the Fourier transform of the delay spread
envelope. Time dispersive multi-path fading can be modelled as a tapped delay line, generating
complex wideband channel impulse response in baseband link level simulations. In an extended
pedestrian model, the power delay profile for the multi-path fading can be depicted as follows
where the number of channels taps is set to be 7 [26].
Figure 22. Power Delay Profile of Extended Pedestrian Model
0 30 7090110 190 4100
0.2
0.4
0.6
0.8
1
Excess Tap Delay, ns
Rel
ativ
e P
ower
Power Delay Profile

39
Wideband channels are modelled as a group of narrowband channels with given correlation matrix
and each narrowband channel has Rayleigh fading for fast fading. Multipath fast fading for each
physical resource block is modelled as:
( , ) = ( , ) ( , ) … … … ( , ) = ( , ). = ( , ) ( , ) … … … ( , ) .
where ( , ) denotes the multipath fading coefficient from ith user to jth base station and they are
independent Gaussian distributed variables. Q is the Cholesky factorisation of the channel
correlation matrix R, which is the square root of the correlation coefficient values between two
signals [27].
5.5. Scheduling
In overall system performance evaluations in broadband wireless systems, scheduling algorithms
play a crucial role. Round Robin (RR) type scheduler is the baseline scheduler model in the
simulator. The most important feature of RR scheduling is being one of the fairest scheduling
algorithms. The data frame is divided into packets and each packet is transmitted without any kind
of priority. RR scheduler obviously provides simple and fair sharing of the transmission resources.
However, the main drawback of RR appears to be the loss in the throughput. RR does not consider
the channel conditions resulting in low data rates for the users in inadequate channel conditions.
5.6. Throughput
The throughput in the simulation is computed using the modified Shannon capacity formula.
= log 1 +
where
- W is the transmission bandwidth - Weff is the bandwidth efficiency - SINReff is the SINR efficiency
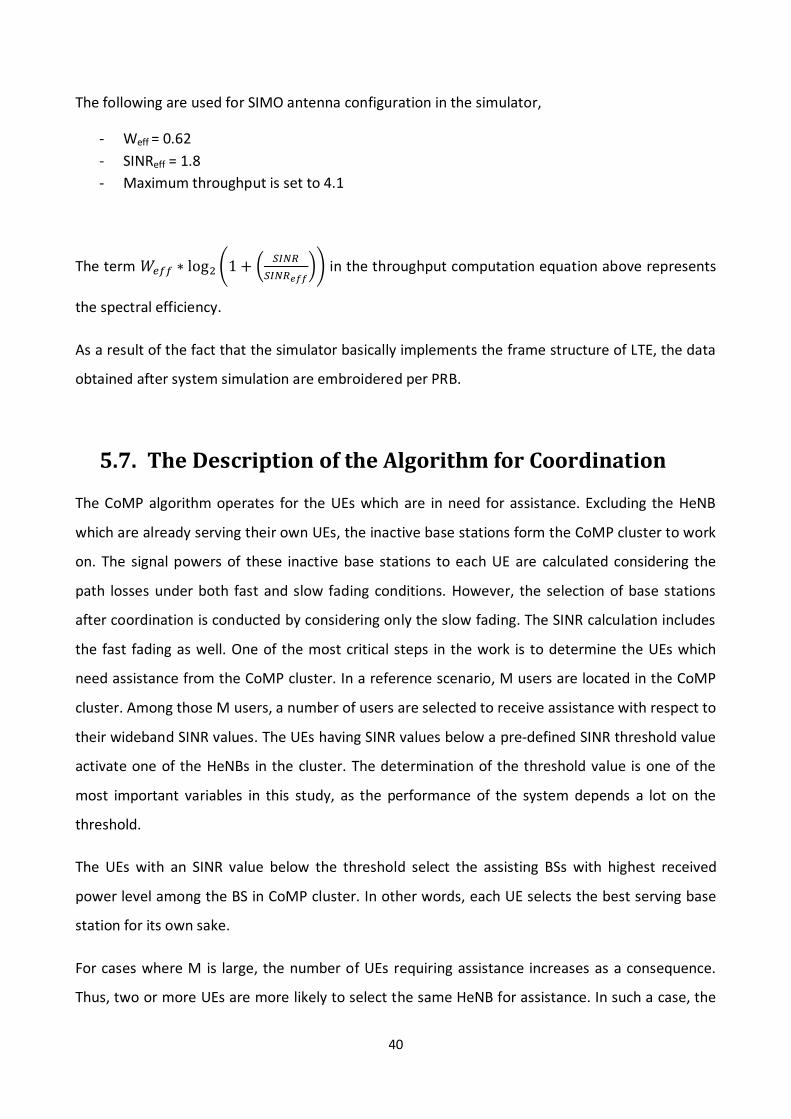
40
The following are used for SIMO antenna configuration in the simulator,
- Weff = 0.62 - SINReff = 1.8 - Maximum throughput is set to 4.1
The term log 1 + in the throughput computation equation above represents
the spectral efficiency.
As a result of the fact that the simulator basically implements the frame structure of LTE, the data
obtained after system simulation are embroidered per PRB.
5.7. The Description of the Algorithm for Coordination
The CoMP algorithm operates for the UEs which are in need for assistance. Excluding the HeNB
which are already serving their own UEs, the inactive base stations form the CoMP cluster to work
on. The signal powers of these inactive base stations to each UE are calculated considering the
path losses under both fast and slow fading conditions. However, the selection of base stations
after coordination is conducted by considering only the slow fading. The SINR calculation includes
the fast fading as well. One of the most critical steps in the work is to determine the UEs which
need assistance from the CoMP cluster. In a reference scenario, M users are located in the CoMP
cluster. Among those M users, a number of users are selected to receive assistance with respect to
their wideband SINR values. The UEs having SINR values below a pre-defined SINR threshold value
activate one of the HeNBs in the cluster. The determination of the threshold value is one of the
most important variables in this study, as the performance of the system depends a lot on the
threshold.
The UEs with an SINR value below the threshold select the assisting BSs with highest received
power level among the BS in CoMP cluster. In other words, each UE selects the best serving base
station for its own sake.
For cases where M is large, the number of UEs requiring assistance increases as a consequence.
Thus, two or more UEs are more likely to select the same HeNB for assistance. In such a case, the

41
UE with lower wideband SINR value is still assisted by the same HeNB; however, the other UE
chooses the second best serving base station as long as its available. If not, it selects the third best
and this procedure continues until it finds a suitable base station.
After base station reselection process is completed, physical resource block allocation for these
base stations take place. PRBs of the HeNB – UE channel are allocated such that Maximum Ratio
Combining (MRC) is born in mind to obtain higher levels of SINR. The resources of the recently
established HeNB – UE link are allocated such that they are the same as the PRBs of the HeNB – UE
link before coordination. The selection of PRBs is followed by the activation of the base station.
Thus, the signal power of each resource block is increased. As is depicted in Figure 23, the
resource blocks of recently activated lth HeNB for the lth UE is the same as the original resource
allocation of UE – HeNB before coordination (23a). On the other hand, the resource blocks cause
interference for the other UEs having PRBs at the same narrowband (23b).
Figure 23. (a) PRBs' effect on signal power (b) PRBs' effect on interference
As is mentioned above, the frequency band allocation in scheduling affects the performance of the
system significantly. After the resources are allocated, the signal power and interference at each
physical resource block is re-calculated. The analyses conducted throughout this study are based
on the comparison between the old SINR levels and the new SINR levels after coordination at each
PRB.

42
6. System Performance Analysis
In this chapter, the performance of CoMP in femtocell networks is investigated in terms of some
performance indicators mentioned in the next section. The fundamental parameters in the
simulator are the SINR threshold value and femtocell base station penetration (FBS) rate. The
performance evaluation is handled under ceteris paribus conditions where the effects of one
parameter at a time is analysed while the rest of the parameters remain constant.
SINR threshold denotes the value for the SINR levels of the UEs. Threshold is used to trigger
assistance from other inactive base stations among the CoMP cluster.
On the other hand, FBS rate will be determining the number of femtocell base stations in the
block. The more base stations are active, the more power is consumed; thus, the cost is increased
as well. However, there is a trade-off between the use of resources and the system performance.
In the reference case in the simulator, there are 4 UEs. All the simulations are analysed under this
assumption.
6.1. Assessment Methodology
Performance evaluation of various scenarios and various configurations is carried out for some key
performance indicators. The most significant of them are given as follows:
User Throughput is the throughput experienced by the user in downlink transmission.
5%-ile Throughput is the throughput at the 5%-ile point of the Cumulative Distribution
Function (CDF) of the user throughput. 5%-ile level indicates the statistical cell edge in the
system.
Median Throughput is the throughput at the 50%-ile point of CDF of the user throughput.
Median throughput is related to the average user experience.
In order to obtain the CDF of the throughput for different parameters, each parameter was run
over 10000 iterations in the simulator.

43
6.2. Simulation Results
The simulations of different SINR threshold values and femtocell base station penetration rates
provides insights into the performance of the coordination of the base stations in a femtocell
network within a macrocell network. The performance of UEs in the network with different set of
SINR threshold levels and FBS penetration rates are analysed. This section interprets the
simulation results from a holistic point of view and concludes with the improvement in the system
performance.
Table 4. Parameter sets used in the study
Parameters Value SINR Threshold SINR_thr = 0, 3, 5, 10, 15, 25 [dB]
FBS Penetration Rate FBS= 0.25, 0.50, 0.75, 1
In the reference scenario, the number of UEs is limited to four. These UEs are placed at the flats
where HeNBs exist. The throughputs of all users and the throughput of the worst user in the
simulation are the two main data during the analysis. The worst user is chosen as the user having
the least throughput among the other users.
6.2.1. Impact of FBS Penetration Rate FBS penetration rate denotes the ratio of the number of femtocell base stations to the number of
flats in the block. The simulations are conducted under various SINR threshold levels for
coordination. As is depicted in Figure 24, (24a) shows when FBS = 1 which means all the flats in the
block are equipped with HeNBs and (24b) shows half of the flats are equipped with HeNBs.
(a) (b)
Figure 24. Femtocell base station layouts for penetration rates 1 and 0.5, respectively
0 5 10 15 20 25 30 35 40 45 500
5
10
15
20
25
30
35
40
45
50HBS layout (ground floor)
0 5 10 15 20 25 30 35 40 45 500
5
10
15
20
25
30
35
40
45
50HBS layout (ground floor)

44
6.2.1.1. All Users Case
Figure 25 compares the throughputs of all the UEs within a femtocell network with respect to four
FBS penetration rates under various SINR threshold conditions.
(a) (b)
(c) (d)
Figure 25. CDF of throughput for FBS comparison for all users
0 2 4 6 8 10 12 14 16 180
0.1
0.2
0.3
0.4
0.5
0.6
0.7
0.8
0.9
1
Throughput,Mbps
CD
F
CDF vs Throughput with no assistance for all users
FBS=0.25FBS=0.50FBS=0.75FBS=1
0 2 4 6 8 10 12 14 160
0.1
0.2
0.3
0.4
0.5
0.6
0.7
0.8
0.9
1
Throughput,Mbps
CD
F
CDF vs Throughput at 3dB sinr threshold for all users
FBS=0.25FBS=0.50FBS=0.75FBS=1
0 2 4 6 8 10 12 14 160
0.1
0.2
0.3
0.4
0.5
0.6
0.7
0.8
0.9
1
Throughput,Mbps
CD
F
CDF vs Throughput at 10dB sinr threshold for all users
FBS=0.25FBS=0.50FBS=0.75FBS=1
0 2 4 6 8 10 12 14 160
0.1
0.2
0.3
0.4
0.5
0.6
0.7
0.8
0.9
1
Throughput,Mbps
CD
F
CDF vs Throughput at 25dB sinr threshold for all users
FBS=0.25FBS=0.50FBS=0.75FBS=1

45
Figure (25a) depicts the no assistance case when none of the UEs requires assistance from inactive
base stations. The CDF curves obtained for different FBS rates are almost the same meaning that
the users perform in a similar way since the users are served only by their own base stations. On
the other hand, Figures (25b), (25c) and (25d) demonstrate that the impacts of the changes in FBS
rate when the coordination takes place between base stations. As is seen from the figures, the
best performances are obtained for the FBS values equal to 0.75 and 1. The reason why the
number of HeNBs affects the system performance is that the large number of HeNBs means that
there exist close base stations to each user. The path loss encountered by the user with
inadequate SINR becomes less, which constitutes in higher power received at the terminal. Thus,
the SINR of the overall users is uplifted by increasing the opportunities of the users’ selecting a
better serving base station. Here it should be noted that a better serving station does not imply
the change of the base station of the UE as a handover process. It is the selection of a more
powerful base station as an assisting base station. This outcome is valid for the entire area of
interest which is 5%-ile and 50%-ile users. Under different threshold values, both the capacity,
which can be referred to 50%-ile users, and the connectivity, referred to 5%-ile users, slightly
increases as the femtocell base station penetration rate increases.
An interesting result can be extracted from the figures above about the conflict between FBS
penetration rates of 0.25 and 0.50. Although FBS values follow the general trend explained in the
previous paragraph, these two parameter values exchange each other’s roles when there is
assistance. This delicate result may be explained as follows. As is stated before, the number of
users is limited to four and the number of base stations is 7 when FBS is 0.25 which means there
are 3 inactive BSs for 4 UEs. In case all the users may need assistance, one of the users is not able
to receive extra power from a base station. Besides, the probability of the users’ selecting same
base stations increase, as the base station options are scarce. According to the algorithm
implemented, the user with the least SINR level has the priority to select the base station. The
other UE selects the second best serving base station. Thus, not all the UEs can receive the
strongest base station unlike the chances of other FBS rates. Thus, the intelligence used in the
algorithm cannot be applied properly due to the lack of base stations and one base station cannot
be activated even if it is needed. As one base station is missing, the inter-cell interference from
this is BS is eliminated naturally, which, in turn, pretends to have a better performance. This
delicate conflict endures throughout the entire simulations for the other figures. For SINR
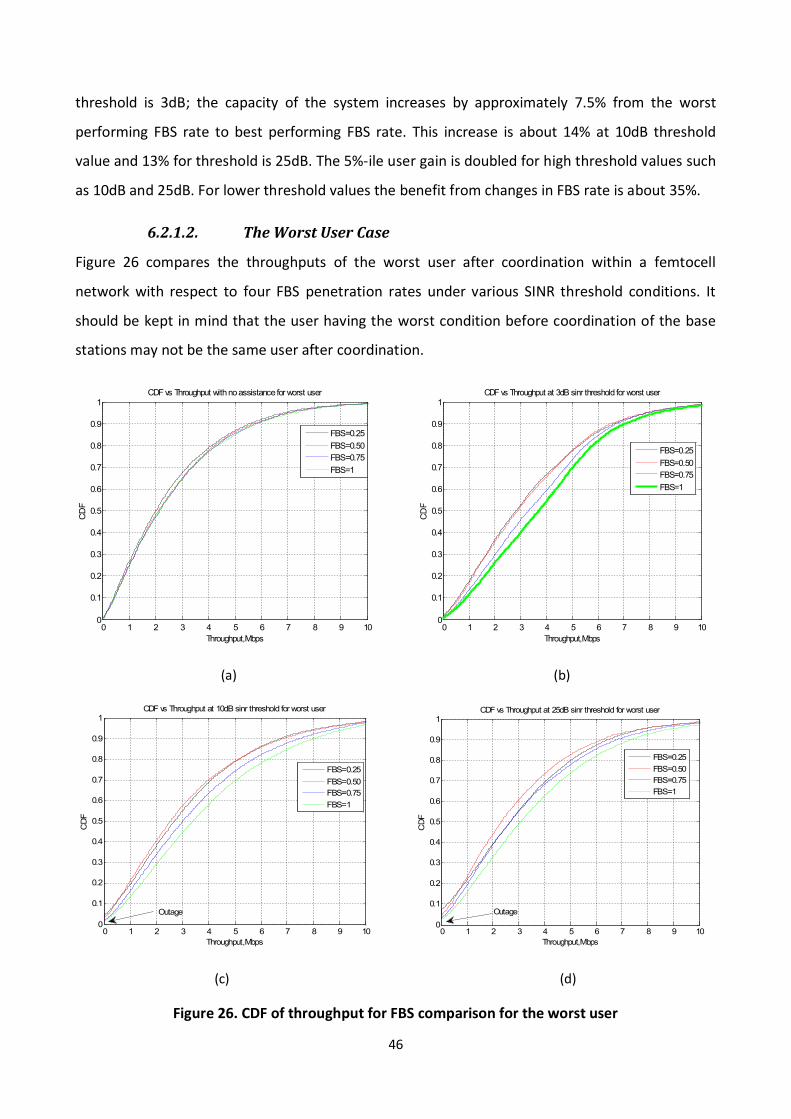
46
threshold is 3dB; the capacity of the system increases by approximately 7.5% from the worst
performing FBS rate to best performing FBS rate. This increase is about 14% at 10dB threshold
value and 13% for threshold is 25dB. The 5%-ile user gain is doubled for high threshold values such
as 10dB and 25dB. For lower threshold values the benefit from changes in FBS rate is about 35%.
6.2.1.2. The Worst User Case
Figure 26 compares the throughputs of the worst user after coordination within a femtocell
network with respect to four FBS penetration rates under various SINR threshold conditions. It
should be kept in mind that the user having the worst condition before coordination of the base
stations may not be the same user after coordination.
(a) (b)
(c) (d)
Figure 26. CDF of throughput for FBS comparison for the worst user
0 1 2 3 4 5 6 7 8 9 100
0.1
0.2
0.3
0.4
0.5
0.6
0.7
0.8
0.9
1
Throughput,Mbps
CD
F
CDF vs Throughput with no assistance for worst user
FBS=0.25FBS=0.50FBS=0.75FBS=1
0 1 2 3 4 5 6 7 8 9 100
0.1
0.2
0.3
0.4
0.5
0.6
0.7
0.8
0.9
1
Throughput,Mbps
CD
F
CDF vs Throughput at 3dB sinr threshold for worst user
FBS=0.25FBS=0.50FBS=0.75FBS=1
0 1 2 3 4 5 6 7 8 9 100
0.1
0.2
0.3
0.4
0.5
0.6
0.7
0.8
0.9
1
Throughput,Mbps
CD
F
CDF vs Throughput at 10dB sinr threshold for worst user
FBS=0.25FBS=0.50FBS=0.75FBS=1
Outage
0 1 2 3 4 5 6 7 8 9 100
0.1
0.2
0.3
0.4
0.5
0.6
0.7
0.8
0.9
1
Throughput,Mbps
CD
F
CDF vs Throughput at 25dB sinr threshold for worst user
FBS=0.25FBS=0.50FBS=0.75FBS=1
Outage

47
Figure (26a) illustrates the case where none of the UEs are assisted by additional base stations.
The CDF curves obtained by the simulation results exhibit similar behaviour as they exhibit for the
previous case for all users. As the assistance takes place for different values of SINR threshold, the
effects of FBS value alterations become more significant. The best performances for the users
having the worst conditions are acquired for higher FBS penetration rates like the case for all
users. The increase in the throughputs is caused by higher probabilities of selecting a stronger
base station with increasing FBS penetration rates as there are more femtocell base stations in the
network. One can observe that the advantages of this result are obvious regarding both
connectivity and capacity concerns.
Figures (26b), (26c) and (26d) show that the worst users may encounter outage, especially for high
SINR threshold values. CDF curves show that 2.5% of the worst users experience outage under
conditions where FBS is set to 1. The reason for the outage is that the existing physical resource
blocks of the UE-BS channel encounter severe interference from the activated CoMP base stations.
It can be observed that the percentage of the users in outage condition increase from 2.5% to
7.5% as FBS decreases to 0.25. Consequently, the connectivity of the worst users for low
penetration rates runs into danger. As a fact, less number of base stations is placed in the blocks
when penetration rate is small. Even though the SINR levels for the worst users is quite small
before coordination when the FBS is small, the other extra base stations cause much more
interference than the signal power gain obtained after coordination. Nonetheless, coordination
helps the users in bad condition even if just a bit considering the 5%-ile users.
The effects of coordination are more noteworthy for 50%-ile users. The improve in the throughput
of the worst user increases about 33% from the worst performing FBS penetration rate to the best
performing penetration rate which is 1.
6.2.2. Performance Evaluation for SINR Threshold Levels SINR threshold value denotes the threshold value at which the UEs require assistance from other
inactive femtocell base stations in the CoMP cluster. Among the 4 UEs located randomly at the
block, the UEs whose SINR levels are below the threshold level activate the best serving BS. It is
crucial to note that the number of UEs which are in need of the assistance from inactive BSs

48
increases, as the SINR threshold level is uplifted. The average number of base stations activated
after the coordination with respect to the SINR threshold value is depicted in Figure 27.
Figure 27. Average Number of Assisting BSs vs. SINR Threshold levels
As a matter of fact, no extra BSs are activated when there is no assistance and the number of extra
base stations converges to 4 as the threshold level increases. It should be kept in mind that this
number is limited to the number of the UEs located in the network. The active base stations play
an important role throughout this study. Because the more the BSs are, the more interference
there is in the system; whereas, the UEs receive assistance. The trade-off between the
interference and signal power is the main consideration considering the SINR threshold value.
6.2.2.1. All Users Case
Figure (28a) and (28b) compares the throughputs of all the UEs within a femtocell network with
respect to several SINR thresholds under two FBS penetration rates, 0.5 and 1.
No Assistance 0 3 5 10 15 20 250
0.5
1
1.5
2
2.5
3
3.5
4
SINR Threshold level, dB
Num
ber o
f BS
s
Average Number of Assisting BSs vs SINR Threshold levels

49
(a) (b)
Figure 28. CDF of throughput for SINR threshold comparison for all users
Figure (28a) illustrates the case when FBS = 0.5 and Figure (28b) the case when FBS = 1. The black
curves in both plots denote the CDF when there is no assistance gain which is regarded as the
initial circumstance. As is seen from the figures, the assistance gain is apparently obtained by the
coordination of the femtocell base stations in the CoMP cluster no matter which SINR threshold
value is set for the simulation. The performances of all the users in the area of study are increased.
The simulation results demonstrate that SINR threshold = 3dB outperforms other SINR threshold
configurations for 5%-ile users. Since the number of activated BSs increase by raising the threshold
value, these new BSs interfere more with the UEs in bad condition. Consequently, the interference
causes declines in the throughputs of the users in the system.
The coordination gain obtained for 5%-ile users under FBS = 0.5 is 1% for 25dB threshold value
which is quite negligible; however, the gain rises to 40% when threshold is 3dB. For FBS = 1, 25dB
threshold gain is 50%; moreover, the throughput of 5%-ile users almost double (90% gain) when
threshold is set to 3dB. Nonetheless, the outcomes change if 50%-ile users are in consideration.
Under two different FBS rates, 25dB threshold level outperforms 3db threshold. See Figures (28a)
and (28b) for investigation.
It is observed that higher threshold values perform better regarding capacity concerns. For low
threshold values, there is less number of base stations. Thus significant overall performance gain is
0 2 4 6 8 10 12 14 160
0.1
0.2
0.3
0.4
0.5
0.6
0.7
0.8
0.9
1
Throughput,Mbps
CD
F
CDF vs Throughput at FBS penetration rate: 0.5 for all users
No assistance3 dB10 dB15 dB25 dB
0 2 4 6 8 10 12 14 160
0.1
0.2
0.3
0.4
0.5
0.6
0.7
0.8
0.9
1
Throughput,Mbps
CD
F
CDF vs Throughput at FBS penetration rate: 1 for all users
No assistance3 dB10 dB15 dB25 dB

50
not obtained for median users for low threshold. Whereas, the capacity thrust is much more for
higher thresholds meaning more activated BSs. The interference does not affect the performance
of the overall users in the system in this scenario and the throughput improve is noteworthy for
high SINR threshold values such as 25dB.
6.2.2.2. The Worst User Case
Figure (29a) and (29b) compares the throughputs of the worst UE in the femtocell network
comparing several SINR thresholds under two FBS penetration rates, 0.5 and 1.
(a) (b)
Figure 29. CDF of throughput for SINR threshold comparison for the worst user
The similar setup in the plots is configured for the worst user as is for all user case. The reference
curve is chosen to be the black curve and the discussions are prosecuted with respect to this
curve. The figures illustrate that assistance improves the performance of the system in general.
What needs to be investigated thoroughly is the optimal value of the SINR threshold level to be set
in large-scale simulations. The worst user means the least throughput having user. The reasons
why its throughput is relatively lower than the others are the lack of signal power or the excessive
interference, or both at the same time. In this scenario, lower threshold values outperform the
higher ones. The rationale behind this is the excessive interference caused by the high number of
base stations activated after coordination when SINR threshold value is set at high values. For
0 1 2 3 4 5 6 7 8 9 100
0.1
0.2
0.3
0.4
0.5
0.6
0.7
0.8
0.9
1
Throughput,Mbps
CDF
CDF vs Throughput at FBS penetration rate: 0.5 for the worst user
No assistance3 dB10 dB15 dB25 dB
Outage
0 1 2 3 4 5 6 7 8 9 100
0.1
0.2
0.3
0.4
0.5
0.6
0.7
0.8
0.9
1
Throughput,Mbps
CDF
CDF vs Throughput at FBS penetration rate: 1 for the worst user
No assistance3 dB10 dB15 dB25 dB
Outage

51
instance, the mean number of activated base stations after coordination for 15dB threshold is 3.25
and it converges to 4 when threshold is 25dB. See Figure 27. As a result, it can be deduced that
low threshold values are more beneficial for both 50%-ile and 5%-ile users.
In particular, 5%-ile worst users show great improve in throughput performance-wise. For FBS = 1,
the improvement of the throughput is more than twice (115%) the no assistance case; however,
the improvement is up to 18%. For FBS = 0.5, 3dB threshold gain is 23%, on the other hand, there
is no gain when threshold is 25dB which is not suitable to general trend of CoMP performance. On
contrary, the throughput of the worst user drops 15%. As is mentioned before, high number of BSs
interferes considerably with the worst UE. Furthermore, the interference affects the users so
severe that some users may even disconnect from the network if FBS rate is lower than 0.5, for
instance 0.25. One can interpret here that interference is a very delicate issue to be considered
while planning the network for bad performing worst users. Median users increase their
performances up to 70% for 3dB threshold value provided that the FBS rate is high enough.
As a conclusion, the throughputs of the users improve as a general trend. But the effect of the
interference at the terminal becomes quite severe if the SINR threshold value exceeds a certain
level.
6.2.3. Comparison of CDF under different SINR thresholds and FBS Figures (30a) and (30b) show the overall comparison of the different threshold – FBS rate
combinations. These curves are extracted from the figures used before in this thesis. It is apparent
that lower threshold values perform better for 5%-ile users due to the relatively less effect of
interference at the terminals. As the threshold increases up to 25dB, the drawbacks may be severe
to the system as some of the users which are the worst ones in the simulator may drop from the
network as a result of high interference, especially for low FBS penetration rates. However,
capacity of all the users seems to decrease with low threshold levels. The 50%-ile users which
need assistance receive the strongest power from recently activated BSs. Thus their SINR levels
and their throughputs naturally increase. This rise depends on the number of the base stations
activated after coordination. At the same time the effect of interference should also be taken into
account in order to make a general judgement on the behaviour of the system on different SINR
threshold value. The effect of SINR threshold value is examined in the latter sections of this thesis.

52
(a) (b)
Figure 30. CDF of throughput for SINR threshold – FBS rate combinations
6.2.4. Performance of the Users in the Femtocell Network Figure 31 compares the throughput performances of all the users in the femtocell network with
respect to the capacity and connectivity concerns.
Figure 31. Throughput comparison of median and 5%-ile users
0 2000 4000 6000 8000 10000 12000 14000 160000
0.1
0.2
0.3
0.4
0.5
0.6
0.7
0.8
0.9
1
Throughput,kbps
CDF
of T
hrou
ghpu
t
Comparison of SINR Thresholds with FBS penetration rate for all users
No AssistanceSINR Thr=3dB @FBS=0.5SINR Thr=3dB @FBS=1SINR Thr=25dB @FBS=0.5SINR Thr=25dB @FBS=1
0 1000 2000 3000 4000 5000 6000 7000 8000 9000 10000
0.1
0.2
0.3
0.4
0.5
0.6
0.7
0.8
0.9
1
Throughput,kbps
CD
F of
Thr
ough
put
Comparison of SINR Thresholds with FBS penetration rate for the worst users
No AssistanceSINR Thr=3dB @FBS=0.5SINR Thr=3dB @FBS=1SINR Thr=25dB @FBS=0.5SINR Thr=25dB @FBS=1
700 800 900 1000 1100 1200 1300 1400 1500 16006000
6500
7000
7500
8000
8500Throughput Comparison for all users
Throughput for 5%-ile users, kbps
Thro
ughp
ut fo
r 50%
-ile
user
s, k
bps
FBS = 1FBS = 0.75FBS = 0.50FBS = 0.25
15dB
10dB15dB
25dB
25dB
3dB
0dB
25dB
3dB
3dB
0dB
0dB
5dB
5dB
15dB
10dB15dB 3dB
5dB
5dB10dB
0dB
10dB
No Assistance

53
As is seen in the bottom left corner of Figure 31, there is a locus when there is no assistance in the
network. If a certain threshold value is set in order to get the system begin coordination, the
significant increase in the throughputs of both 50 and 5%-ile users experience performance gains.
However, the SINR threshold level set for the coordination is quite high when the assistance
begins. The least performance gain obtained for the 5%-ile users after coordination is where the
threshold level is very high. The throughput values for 5%-ile users increase as the threshold value
decreases till it is around 10dB. Around this threshold level, both 50%-ile users and 5%-ile users
obtain the highest throughput values. If the threshold level keeps decreasing, the throughput
values of 5%-ile users keep increasing; however, the 50%-ile users experience performance drops.
The decrease in threshold means less number of new base stations. Therefore the bad performing
users confront less interference, resulting in more powerful SINR values. On the other hand, the
signal empowerments for the median users gradually decrease due to the drop in the number of
base stations.
The system designer should be careful while planning the network. As is seen from the figure
above, there is a trade-off between the capacity and the connectivity of the users in the femtocell
network. The connectivity of the system increases, while there is a decrease in the capacity as the
SINR threshold level moves from 10dB to lower thresholds.
6.2.5. Performance of the Worst Users in the Femtocell Network Figure 32 compares the throughput performances of the worst users in the femtocell network
with respect to the capacity and connectivity concerns.
Figure 32. Throughput comparison of median and 5%-ile worst users
0 100 200 300 400 500 6002000
2200
2400
2600
2800
3000
3200
3400
3600
3800Throughput Comparison for worst user
Throughput for 5%-ile users, kbps
Thro
ughp
ut fo
r the
50%
-ile
user
s, k
bps
FBS = 1FBS = 0.75FBS = 0.50FBS = 0.25
3dB10dB
15dB
25dB15dB
3dB5dB
0dB
5dB5dB
0dB3dBOutage
25dB
25dB
10dB15dB
10dB
No Assistance
0dB10dB 5dB0dB

54
It is depicted in Figure 32 that the performance of the 5%-ile worst users decreases significantly
for high SINR threshold values determined for the system. Furthermore, some users may even
drop when the threshold is uplifted to higher values due to the effects of the inter-cell
interference among the femtocell network. Moreover, some UEs, which need assistance, do not
receive adequate assistance from the base stations when the femtocell base station penetration
rate is low. In such scenarios, the SINR threshold levels are quite low to achieve gain.
The figure illustrates that the capacity of the worst users is maximum for threshold value around
3dB. Although the connectivity of worst users increases, their capacities decrease for lower
threshold values. In this case, the trade-off region is quite narrow, between 3dB and 0dB. It shows
that worst users are very sensitive to impacts of SINR threshold alterations. The connectivity of the
worst users increases about 15%; meanwhile, the capacity decrease is about 6% when the
threshold is moved from 3dB to 0dB.
6.2.6. Connectivity Performance Figure 33 investigates the connectivity of the users in the femtocell network under different SINR
threshold and FBS penetration rate combinations.
Figure 33. Connectivity concern of the users in the system
Figure 33 deals with the throughput comparison of the 5%-ile overall users and the worst users.
The locus where there is no assistance is located on the left hand side of the graph. When the
700 800 900 1000 1100 1200 1300 1400 1500 16000
100
200
300
400
500
600Throughput Comparison for 5 percentile
Throughput for all users, kbps
Thro
ughp
ut fo
r wor
st u
sers
, kbp
s
FBS = 1FBS = 0.75FBS = 0.50FBS = 0.25
0dB
3dB
3dB
10dB
15dB
25dB
25dB
15dB
15dB
10dB
10dB 25dB
5dBNo Assistance
10dB
5dB
3dB
0dB0dB
0dB5dB
5dB

55
coordination begins for high values of threshold, the worst users experience performance
degradation regarding connectivity. The drawbacks of interference for high thresholds are so
crucial that the performance drop experienced due to coordination is remarkable. Even though
the overall system connectivity increases, the worst users face serious throughput drops. They
even encounter outages for high SINR threshold levels. Whereas, it is seen that the connections of
all users and the worst user in the system are strengthened as the threshold value becomes lower.
One can also deduce that the throughput values of the users gradually increase as FBS penetration
rate increases provided that the simulations are run under the same threshold value.
The system should be designed such that the SINR threshold value to start coordination among
the femtocell base stations is very low in order to improve the connectivity for all the users as well
as the worst user in the femtocell network.
6.2.7. Capacity Performance Figure 34 investigates the capacity of the users in the femtocell network under different SINR
threshold and FBS penetration rate combinations.
Figure 34. Capacity concern of the users in the system
According to the outcomes of the previous sections of this study, the performance of the system is
improved when there is assistance when the number of femtocell base stations located in the
6000 6500 7000 7500 8000 85002000
2200
2400
2600
2800
3000
3200
3400
3600
3800Throughput Comparison for 50 percentile
Throughput for all users, kbps
Thro
ughp
ut fo
r wor
st u
sers
, kbp
s
FBS = 1FBS = 0.75FBS = 0.50FBS = 0.25
No Assistance
0dB
3dB
10dB
0dB
0dB
5dB
5dB
0dB 3dB
25dB
25dB
15dB
15dB
25dB
5dB
10dB
3dB
10dB25dB
10dB5dB

56
subject block is high. The same result is also deduced from Figure 34. However, the capacity
experiences variations as threshold parameter alters. The capacity of all the users including the
worst one increase until the threshold is lifted to 3dB. As the threshold level rises, the capacity of
the worst user exhibit an inversely proportional trend. This decline lasts until 10dB threshold
value. The radio designer must pay attention to the trade-off between the capacity of the worst
user and that of the overall users. Fortunately, the linear trend between 3dB and 10dB thresholds
makes the designers decision easier.
An interesting result obtained from Figure 34 is the capacity growth for both parties for increasing
values of threshold. This is not an expected outcome from the simulations. Therefore, the reason
of this trend is left for future studies. Yet, the radio designer would avoid using a high SINR
threshold value in order to avoid interference as is derived from previous analyses in this study.

57
7. Conclusion
Coordinated Multipoint Transmission (CoMP) in Femtocell Systems within LTE framework is
discussed in this thesis. One of the simplest ways of improving system performance is to enhance
the signal power. This goal can be achieved when serving base stations receive assistance from
other femtocell base stations using joint transmission downlink CoMP scheme. As the same
frequency bandwidth is used for femtocells and macrocells, the system is very sensitive to inter-
cell interference. The utilized CoMP scheme is introduced to improve the performance of the
femtocell users. The simulation setup is based on 3GPP Technical Specification Group reports.
The simulation is conducted under two fundamental parameter sets which are related to, SINR
threshold and femtocell base station penetration rate. SINR threshold indicates the SINR level
where users start requiring assistance. The users receiving lower SINRs than the threshold ask for
assistance from the network and one femtocell base station is activated to help the mobile
terminal receive a stronger signal. As the SINR threshold level increases, the number of femtocell
base stations which are activated in the coordination increases. Thus, the other users confront
more inter-cell interference. Therefore there is an optimal threshold level regarding different
aspects throughout the system design. Although the overall performance of the system increases
for 10dB threshold value, the performance of relatively bad performing users in the system face
severe interference from the other base stations. On the other hand, the users having the lowest
throughput values improve their performances at most when the threshold is at low levels such as
3dB.
The FBS penetration rate denotes the number of base stations located in the block where
femtocell study is conducted. The higher the FBS rate is, the more the number of FBSs are and the
closer theses base stations are to the user equipments. Thus, the signal transmitted from the
antenna suffers less from path loss and wall attenuation, resulting in a stronger signal at the
receiver. Keeping this in mind, the system performance increases as the FBS rate increases. More
femtocell base stations are deployed which increases the CAPEX of the system in this case. Yet, the
femtocell base stations cost less than 35$ now and this cost is reduced as the technology
improves. The extra burden for doubling the FBS penetration rate from 0.5 to 1 costs about 400$
which does not seem a very large amount, though.

58
The system designer should consider the trade off between the performances of the overall
system performance and the users in bad condition while selecting the appropriate system
parameters studied in this thesis. High threshold values raise the inter-cell interference effect.
Besides, the number of base stations activated for the coordination increases resulting in more
power consumption.
The performance of the femtocell network is improved by Coordinated Multipoint Transmission
and as is acknowledged from the results, the emerging femtocell applications present a challenge
to the system designer in order to minimize the cost while improving the system throughput.
Future Work
Due to the constraints on the duration of Master’s thesis work, a complete simulation
environment could not be developed. More comprehensive algorithm could be implemented in
the future. CoMP plays an important role in improving the system performance and, therefore,
this work can be extended such that the optimal parameters are determined for the CoMP and
further parameters can be analysed to optimize the system capacity. These parameters can be the
number of users located in the femtocell network, the HeNB transmit power and the number of
PRBs used for the HeNB – UE channel. Moreover, the conflict between the 0.25 and 0.5 FBS
penetration rates can be resolved by implementing more detailed algorithms.
In this study, the user equipments which are in need of the assistance of base stations could utilize
one femtocell base station in this implementation. For future developments, the number of
assisting base stations could be limited in other ways such as getting the UE obtain a certain SINR;
not to one base station.

59
References
[1] Erik Dahlman, Stefan Parkvall, Johan Sköld, and Per Beming, 3G Evolution: HSPA and LTE for
Mobile Broadband, Second Edition ed. Great Britain: Elsevier Ltd., 2008.
[2] LTE SAE System Architecture Evolution. [Online]. http://www.radio-
electronics.com/info/cellulartelecomms/lte-long-term-evolution/sae-system-architecture-
evolution-network.php
[3] v8.5.0 3GPP TS 36.300, "E-UTRA and E-UTRAN, Overall Description; Stage 2 (Release 8)," 2008.
[4] H. Holma and A. Toskala, WCDMA for UMTS: HSPA Evolution and LTE, 4th ed.: Wiley, 2007.
[5] Applying wireless to EtherNet/IP automation systems. [Online].
http://www.processonline.com.au/articles/37629-Applying-wireless-to-EtherNet-IP-
automation-systems-Part-1
[6] 3GPP TR 25.814 v7.1.0, "Physical Layer Aspects for Evolved UTRA, Release 7," September
2006.
[7] Hyung G. Myung, Junsung Lim, and David J. Goodman, "Single Carrier FDMA for Uplink
Wireless Transmission," IEEE Vehicular Magazine, vol. 1, no. 3, September 2006.
[8] C. Gessner, "UMTS Long Term Evolution LTE Technology Introduction," Rohde&Schwarz, 2007.
[9] 3GPP LTE - Long Term Evolution. [Online]. http://3gpplte-
longtermevolution.blogspot.com/2010/06/introduction-to-lte.html
[10] Picochip, "The Case For Home Base Stations," White Paper April 2007.
[11] 3GPP TS 25.467, "Technical Specification Group Radio Access Network; UTRAN architecture
for 3G Home Node B (HNB), Stage 2 (Release 8)," December 2008.
[12] L.T.W. Ho and L.G. Samuel H. Claussen, "An Overview of the Femtocell Concept," IEEE
Communications Magazine, vol. 13, no. 1, pp. 221-246, 2008.

60
[13] J.G. Andrews and A. Gatherer V. Chandrasekhar, "Femtocell Networks: A Survey,"
Communications Magazine, vol. 46, no. 9, pp. 59-67, September 2008.
[14] S. Carlaw, A. Giustina S.R. Saunders, Femtocells: Opportunities and Challenges for Business and
Technology.: John Wiley & Sons. Ltd, 2009.
[15] Femto Forum. [Online]. http://www.femtoforum.org
[16] "Improving 4G Coverage and Capacity Indoors and at Hotspots with LTE Femtocells," Nokia
Siemens Networks, White Paper 2011.
[17] D. Valcarce, A.D. Roche, G.J. Zhang L. Perez, "OFDMA femtocells: A Roadmap on Interference
Avoidance," IEEE Communications Magazine, vol. 47, no. 9, September 2009.
[18] S. Parkvall and D. Astely, "The Evolution of LTE towards IMT-Advanced," Journal of
Communications, vol. 4, no. 3, 2009.
[19] G. Foschini, and R. Valenzuela M. Karakayali, "Network Coordination for Spectrally Efficient
Communications in Cellular Systems," IEEE Wireless Communications, vol. 13, no. 4, 2006.
[20] "Coordinated Multi-Point Transmission in LTE-Advanced Downlink-Test System," Deutsche
Telekom and Fraunhofer Institute for Communications, Heinrich-Hertz Institute (HHI), Press
Report July 2009.
[21] J. Parikh and A. Basu, "LTE Advanced: The 4G Mobile Broadband Technology," International
Journal of Computer Applications, vol. 13, no. 5, pp. 17 - 21, January 2011.
[22] 3GPP TR 36.814 v0.4.0, "Further Advancements of E-UTRA Physical Layer Aspects, Release 9,"
February 2009.
[23] D.M.Gutierrez-Estevez, E.C. Reyes I. F. Akyildiz, "The Evolution to 4G Cellular Systems: LTE
Advanced," Physical Communication, vol. 3, no. 4, pp. 217 - 244, 2010.
[24] L. Liu, Y. Wang, C. Zhang, J. Cho, J.K. Han Y.H. Nam, "Cooperative Communication
Technologies for LTE-Advanced," in IEEE International Conference, Acoustics Speech and Signal

61
Processing, Dallas, TX, 2010, pp. 5610 - 5613.
[25] R4-092042 3GPP TSG RAN WG4, "Simulation Assumptions and Parameters for FDD HeNB RF
Requirements," 4-8 May 2009.
[26] 3GPP The Draf TS 36.101 v10.2.0, "UE Radio Transmission and Reception, Release 10,".
[27] P. Mogensen T. Klingenbrunn, "Modelling Frequency Correlation of Fast Fading in Frequency
Hopping GSM Link Simulations," in Vehicular Technology Conference, Amsterdam, NL, 1999,
pp. 2398 - 2402.


