Cooperative Employee Compensation
54
Cooperative Employee Compensation USDA Rural Development Business and Cooperative Services Research Report 228
-
Upload
nguyennhan -
Category
Documents
-
view
220 -
download
1
Transcript of Cooperative Employee Compensation

Cooperative Employee Compensation
USDA Rural Development
Business and Cooperative Services
Research Report 228
NON-DISCRIMINATION POLICY
The U.S. Department of Agriculture (USDA) prohibits discrimination against its customers, employees, and applicants for employment on the bases of race, color, national origin, age, disability, sex, gender identity, religion, reprisal, and where applicable, political beliefs, marital status, familial or parental status, sexual orientation, or all or part of an individual’s income is derived from any public assistance program, or protected genetic information in employment or in any program or activity conducted or funded by the Department. (Not all prohibited bases will apply to all programs and/or employment activities.)
To File a Program ComplaintIf you wish to file a Civil Rights program complaint of discrimination, complete the USDA Program Dis-crimination Complaint Form (PDF), found online at http://www.ascr.usda.gov/complaint_filing_cust.html, or at any USDA office, or call (866) 632-9992 to request the form. You may also write a letter containing all of the information requested in the form. Send your completed complaint form or letter to us by mail at U.S. Department of Agriculture, Director, Office of Adjudication, 1400 Independence Avenue, S.W., Wash-ington, D.C. 20250-9410, by fax (202) 690-7442 or email at [email protected]. Persons with DisabilitiesIndividuals who are deaf, hard of hearing or have speech disabilities and you wish to file either an EEO or program complaint please contact USDA through the Federal Relay Service at (800) 877-8339 or (800) 845-6136 (in Spanish).
Persons with disabilities who wish to file a program complaint, please see information above on how to contact us by mail directly or by email. If you require alternative means of communication for program information (e.g., Braille, large print, audiotape, etc.) please contact USDA’s TARGET Center at (202) 720-2600 (voice and TDD).
For any other information not pertaining to civil rights, please refer to the listing of the USDA Agencies and Offices for specific agency information.
Research Report 228 i
ABSTRACT
A 2011 survey of 2,285 U.S. farmer, rancher, and fishery cooperatives was used to update employee com-pensation studies conducted in 1993 and 1999. There were 553 respondents to the survey, or a 24- per-cent response rate. Five job categories were used in the survey, with questions on: number of employees; average salary; bonuses; benefits; perks; retirement; performance; and directors. Responses were further divided into nine sales sizes, seven employee sizes, and by State(s).
Keywords: cooperatives, compensation, benefits, bonus, retirement, performance, directors
COOPERATIVE EMPLOYEE COMPENSATIONE. Eldon EversullRural DevelopmentU.S. Department of AgricultureSTOP 32561400 Independence Ave., S.W.Washington, DC 20250 3256
www.rurdev.usda.gov/BCP_Coop_LibraryOfPubs.htm — for a complete listing of our publications.
Research Report 228April 2013

ii Cooperative Employee Compensation
PREFACE
This report updates 1993 and 1999 studies conducted by Rotan. Information from the 1999 study was com-pared and contrasted with this study. Employee compensation and benefits information are often requested by cooperatives, researchers, and human resources departments. All respondents were given a summary of the results in this report a month after survey analysis was completed.
With 553 respondents representing various cooperative sizes, types, and locations, a wide range of infor-mation on employee compensation and benefits was captured in this study. USDA depends on the response to its annual survey to develop a detailed and comprehensive set of statistics on cooperatives. The time and effort taken to provide information and the timeliness with which it is furnished are greatly appreciated.

Research Report 228 iii
CONTENTS
PageABSTRACT iPREFACE iiHIGHLIGHTS ivSURVEY RESULTS 1SURVEY RESULTS BY SIZE, EMPLOYEES, TYPE, AND LOCATION 11BIBLIOGRAPHY 17APPENDIX TABLES 18
iv Cooperative Employee Compensation
HIGHLIGHTS
Over 550 cooperatives provided information on compensation and benefits representing more than 37,000 employees in a 2011 survey of marketing, supply, and service cooperatives by USDA Rural Development’s Cooperative Programs. The survey found that most often management positions are filled from within the cooperative, while lower positions are filled by ads or recommendations. Performance of chief executive officers is measured by the board of directors, while net income or profits most often measures the perfor-mance of other workers. The survey found that:
n Average chief executive pay was $105,576, with a median pay of $90,000.n Job responsibilities are the leading factor for determining compensation for managers, while job
performance weighs heavily on lower level employees.n The same perks or benefits were offered in 2011 as in 1999, but the cost of many of these benefits
were now more often shared between the employee and cooperative. For instance, retirement benefits were a shared expense for around 80 percent of the respondents in 2011, compared to 66 percent in 1999.
n Many cooperatives still offer a defined benefit retirement. But the trend is a defined contribution or Individual Retirement Account (IRA)-based plans where the cooperative and employee share in funding the retirement plan.
n Average board of director’s size was eight people with a median of seven. Board compensation aver-aged $15,962, while median compensation was $4,574.
Research Report 228 1
Cooperative Employee CompensationE. Eldon Eversull
INTRODUCTION
As a whole, the agricultural economy did not under-go the general overall downturn that the U.S. econo-my experienced over the last several years. Employ-ment has remained strong, with cooperatives adding 7,000 employees (growth of 5.7 percent) between 2009 and 2010, and almost 2,000 employees be-tween 2010 and 2011 (growth of 1.5 percent). Even with U.S. unemployment rates around 8 percent, cooperatives need to offer competitive salaries to keep their workforce and attract new workers. The compensation they offer must be commensurate with employees’ skills and experience if they expect to attract and keep skilled employees.
Employee compensation is the largest expense item for most cooperatives. When expressed as a percent of total sales, employee compensation aver-ages 4 percent of total sales, and is almost half of all expenses for the average cooperative where total expenses are 8.6 percent of total sales. Higher-than-average employee expenses will have a great impact on profitability and thus are a constant management concern.
Compensation in this study mainly refers to sala-ries and benefits but can also include hourly wages and benefits. Salaries and wages are a direct form of compensation, while indirect compensation refers to benefits. Cooperatives and all employers need to offer a compensation package that is a proper mix of both direct (e.g., salaries) and indirect (benefits). Cooperatives are competing with other agricultural firms in their market area and employers in unre-lated fields to maintain and grow a competent work force.
There are also internal and external factors that need to be considered by cooperative employers. Internal factors that may influence salary and ben-efit packages offered are directly under the coopera-tive’s control and include, among other items, the number of employees, job descriptions/responsibili-ties, educational/occupational training, and flexible work hours. External factors that influence salary
and benefit packages are largely out of the coopera-tives control and include Federal and State govern-ment policies and regulations, the overall economy/unemployment rate, and competition for employees from other firms.
SURVEY RESULTS
Information for this report was obtained through the annual Rural Development survey of coopera-tives [See Ali, et al.]. The 2011 survey counted 2,285 farmer, rancher, and fishery cooperatives that employed 130,900 full-time employees. The annual survey included employee compensation questions similar to those used by Rotan in 1999.
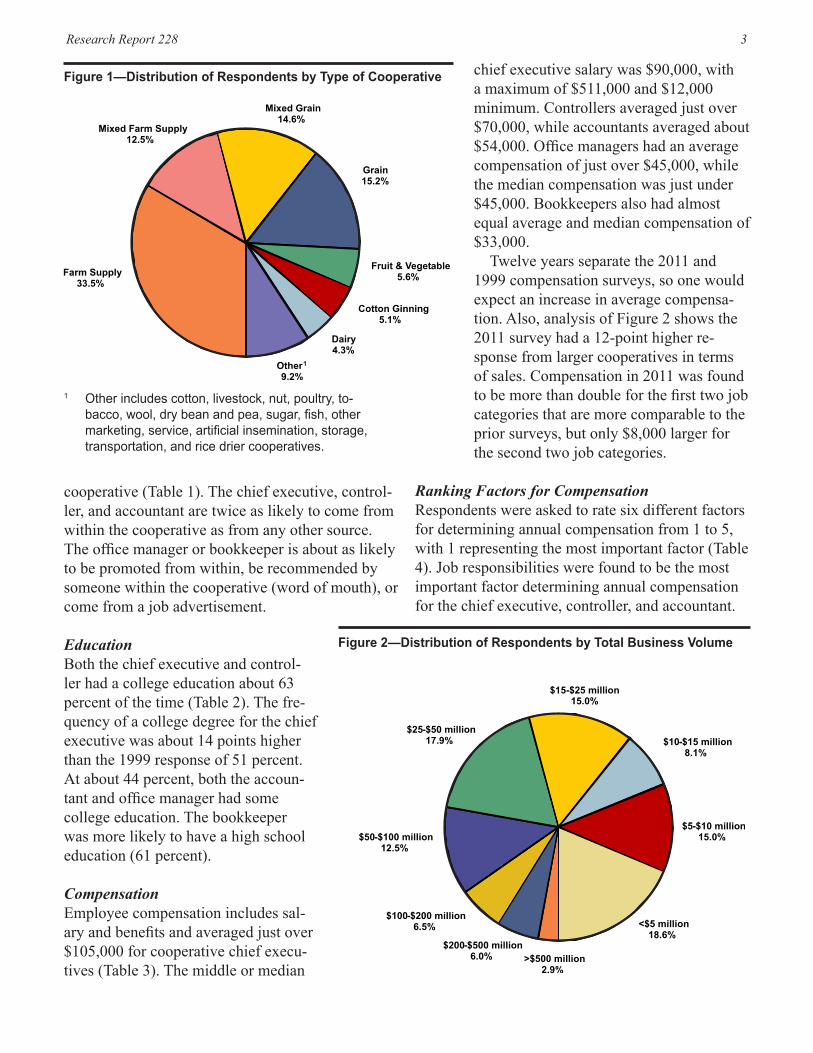
There were 553 usable employee compensation surveys returned by respondents. This represents about 45 percent of respondents to the annual survey. The vast majority of employee compensa-tion respondents (76 percent) were farm supply and grain and oilseed cooperatives (Figure 1). Compared with the 1999 study, there are 15 percent more farm supply cooperatives, 5 percent fewer grain and oilseed, 10 percent fewer fruit and veg-etable, 1 percent fewer dairy, and about 6 percent fewer “other “ cooperatives.
Nine sales size categories are used in this study, and they are: >$500 million in sales, $200 million to ≤ $500 million, $100 million to ≤ $200 million, $50 million to ≤ $100 million, $25 million to ≤ $50 million, $15 million to ≤ $25 million, $10 million to ≤ $15 million, $5 million to ≤ $10 million, and <$5 million (Figure 2). The sales size categories differ from 1999, where there were only four sales sizes: > $20 million in sales, $10 million to ≤ $20 million, $5 million to ≤ $10 million, and <$5 million. There were fewer respondents from small cooperatives in 2011 than in 1999 and many more respondents from large cooperatives. The comparative break down between 2011 and 1999 shows about 9 percent fewer respondents in 2011 with <$5 million in sales, 16 percent fewer with $5 million to ≤ $10 million, 2 percent more with $10 million to ≤ $20 million, and
2 Cooperative Employee Compensation
22 percent more respondents with over $20 million in sales.
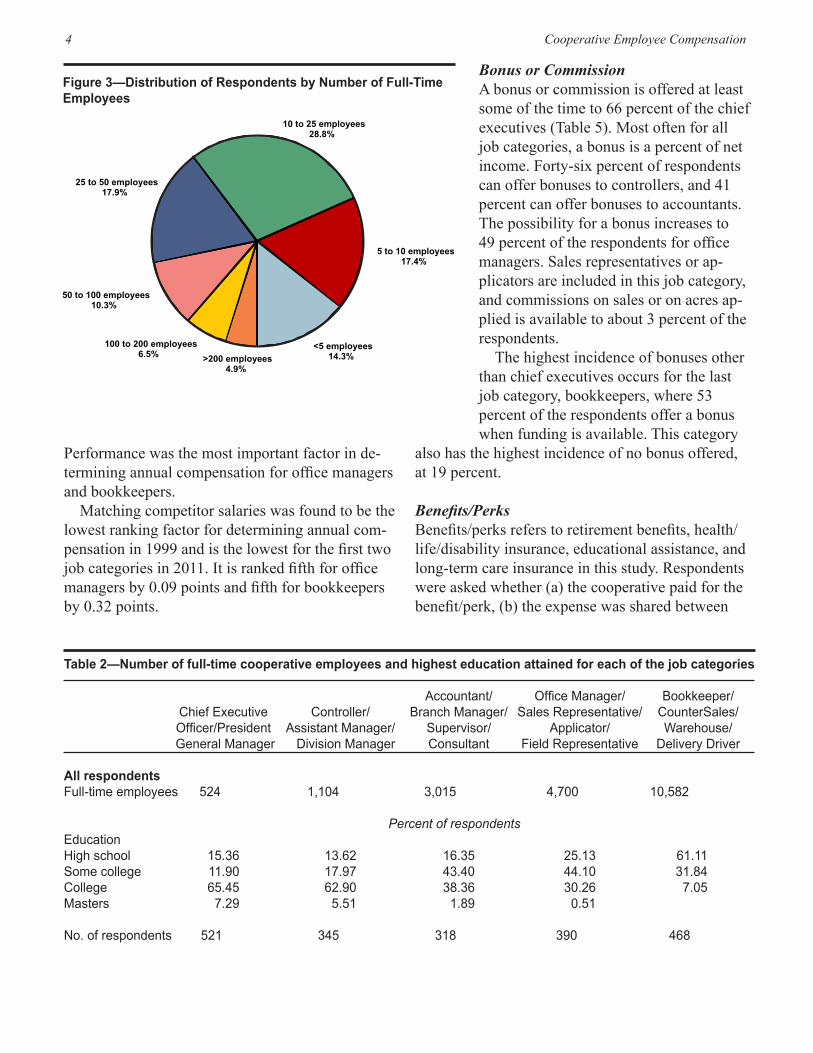
The survey information was also analyzed by number of cooperative full-time employees using seven employee ranges. The number of full-time employee ranges are: more than 200 employees, 100 employees to 200 employees, 50 employees to 100 employees, 25 employees to 50 employees, 10 employees to 25 employees, 5 employees to 10 employees, and fewer than 5 employees (Figure 3). No employee ranges were used in the 1999 study.
There were five broad job categories used in this study:
1. Chief executive officer (CEO)/president/gen-eral manager;
2. Controller/assistant manager/division man-ager;
3. Accountant/branch manager/supervisor/con-sultant;
4. Office manager/sales representative/applica-tor/field representative; and
5. Bookkeeper/counter sales/warehouse/delivery driver.
The first two job categories, chief executive and controller, are similar to the 1999 study, while categories 3-5 were expanded from division man-ager, field representative, or sales representative.
(Throughout the rest of this report, rather than listing the full job category, the five will generally be referred to by the first job classification in each category. So, category #1 will be CEO, #2 will be controller, and so on.) It was thought that by broad-ening the categories, the study would encompass more employees found at a typical cooperative. The survey was pretested on three cooperatives and fur-ther refined. In retrospect, broadening the categories may have made the information less comparable between cooperatives except for the first two cat-egories, chief executive and controller, because the broadened categories may contain a pay band that is too wide.
In addition, by broadening the job categories, non-salaried employees or hourly workers could be in some of the positions surveyed. This was noted on a number of surveys and probably explains the difference in number of employees between the an-nual survey and the employee compensation sur-vey, as only 54 percent were accounted for in this study (19,964/37,323). As in the 1999 survey, not all respondents answered for all jobs, and it appears that some salaries are for hourly and part-time and seasonal employees.
Source of EmployeesMost often, cooperative positions, except at non-management levels, are promotions from within the
Table 1—How employees in each category were found Accountant/ OfficeManager/ Bookkeeper/ ChiefExecutive Controller/ BranchManager/ SalesRepresentative/ CounterSales/ Officer/President AssistantManager/ Supervisor/ Applicator/ Warehouse/ GeneralManager DivisionManager Consultant FieldRepresentative DeliveryDriver
Percent of respondentsAllrespondents Alreadyinco-op 40.91 35.13 32.52 22.90 15.02Wordofmouth 17.53 16.77 15.03 21.45 23.40Ad 13.42 13.92 18.18 21.74 25.12Reference 15.15 14.24 11.19 13.04 10.34Ad/Wordofmouth 0.43 1.58 1.75 2.61 5.91Placementfirm 5.63 2.85 2.10 0.74Ad/Alreadyinco-op 3.16 3.85 2.32 1.97Media 1.52 1.90 2.10 1.74 2.96Other(combination) 5.41 10.44 13.29 14.20 14.53 No.ofrespondents 462 316 286 345 406
Research Report 228 3
cooperative (Table 1). The chief executive, control-ler, and accountant are twice as likely to come from within the cooperative as from any other source. The office manager or bookkeeper is about as likely to be promoted from within, be recommended by someone within the cooperative (word of mouth), or come from a job advertisement.
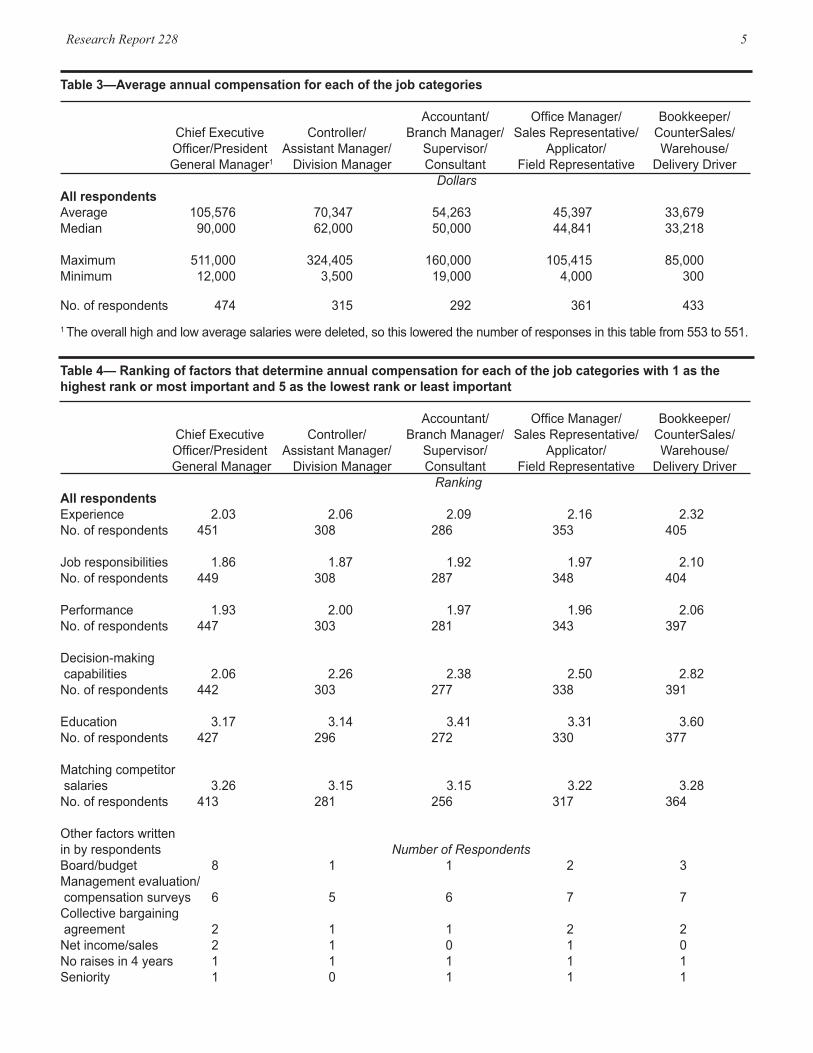
EducationBoth the chief executive and control-ler had a college education about 63 percent of the time (Table 2). The fre-quency of a college degree for the chief executive was about 14 points higher than the 1999 response of 51 percent. At about 44 percent, both the accoun-tant and office manager had some college education. The bookkeeper was more likely to have a high school education (61 percent).
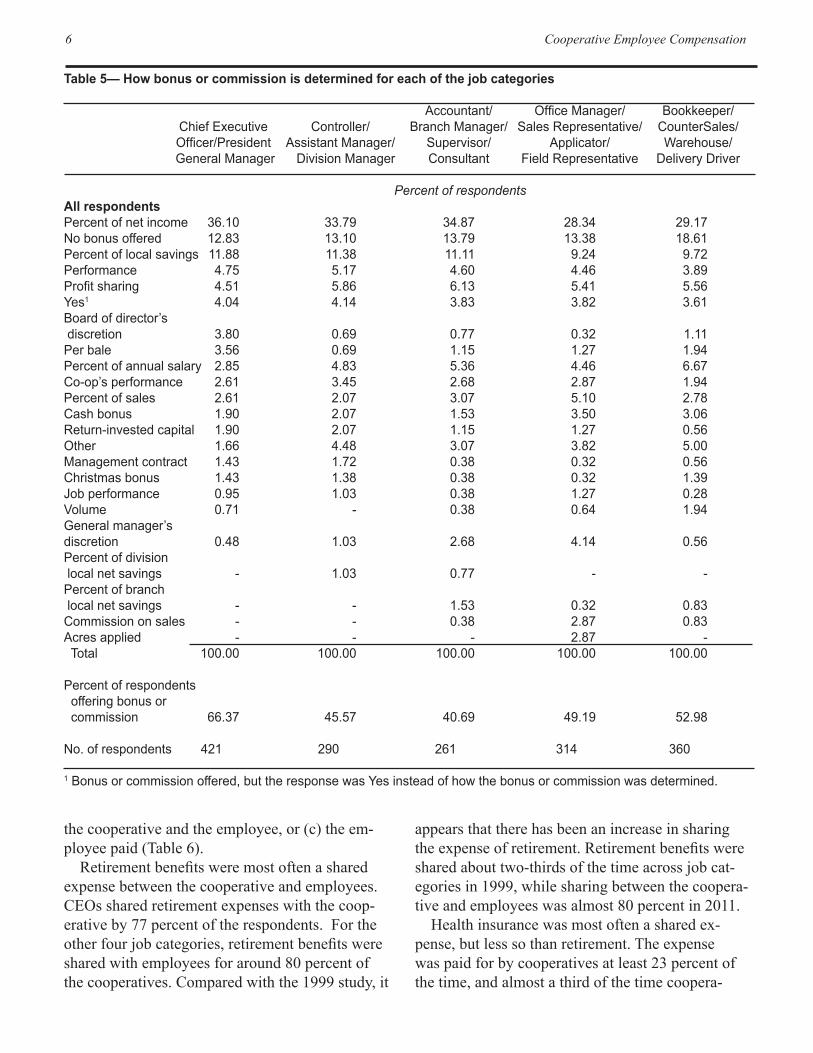
CompensationEmployee compensation includes sal-ary and benefits and averaged just over $105,000 for cooperative chief execu-tives (Table 3). The middle or median
chief executive salary was $90,000, with a maximum of $511,000 and $12,000 minimum. Controllers averaged just over $70,000, while accountants averaged about $54,000. Office managers had an average compensation of just over $45,000, while the median compensation was just under $45,000. Bookkeepers also had almost equal average and median compensation of $33,000.
Twelve years separate the 2011 and 1999 compensation surveys, so one would expect an increase in average compensa-tion. Also, analysis of Figure 2 shows the 2011 survey had a 12-point higher re-sponse from larger cooperatives in terms of sales. Compensation in 2011 was found to be more than double for the first two job categories that are more comparable to the prior surveys, but only $8,000 larger for the second two job categories.
Ranking Factors for CompensationRespondents were asked to rate six different factors for determining annual compensation from 1 to 5, with 1 representing the most important factor (Table 4). Job responsibilities were found to be the most important factor determining annual compensation for the chief executive, controller, and accountant.
Figure 1—Distribution of Respondents by Type of Cooperative
1 Otherincludescotton,livestock,nut,poultry,to-bacco,wool,drybeanandpea,sugar,fish,othermarketing,service,artificialinsemination,storage,transportation,andricedriercooperatives.
Figure 2—Distribution of Respondents by Total Business Volume
4 Cooperative Employee Compensation
Bonus or CommissionA bonus or commission is offered at least some of the time to 66 percent of the chief executives (Table 5). Most often for all job categories, a bonus is a percent of net income. Forty-six percent of respondents can offer bonuses to controllers, and 41 percent can offer bonuses to accountants. The possibility for a bonus increases to 49 percent of the respondents for office managers. Sales representatives or ap-plicators are included in this job category, and commissions on sales or on acres ap-plied is available to about 3 percent of the respondents.
The highest incidence of bonuses other than chief executives occurs for the last job category, bookkeepers, where 53 percent of the respondents offer a bonus when funding is available. This category
also has the highest incidence of no bonus offered, at 19 percent.
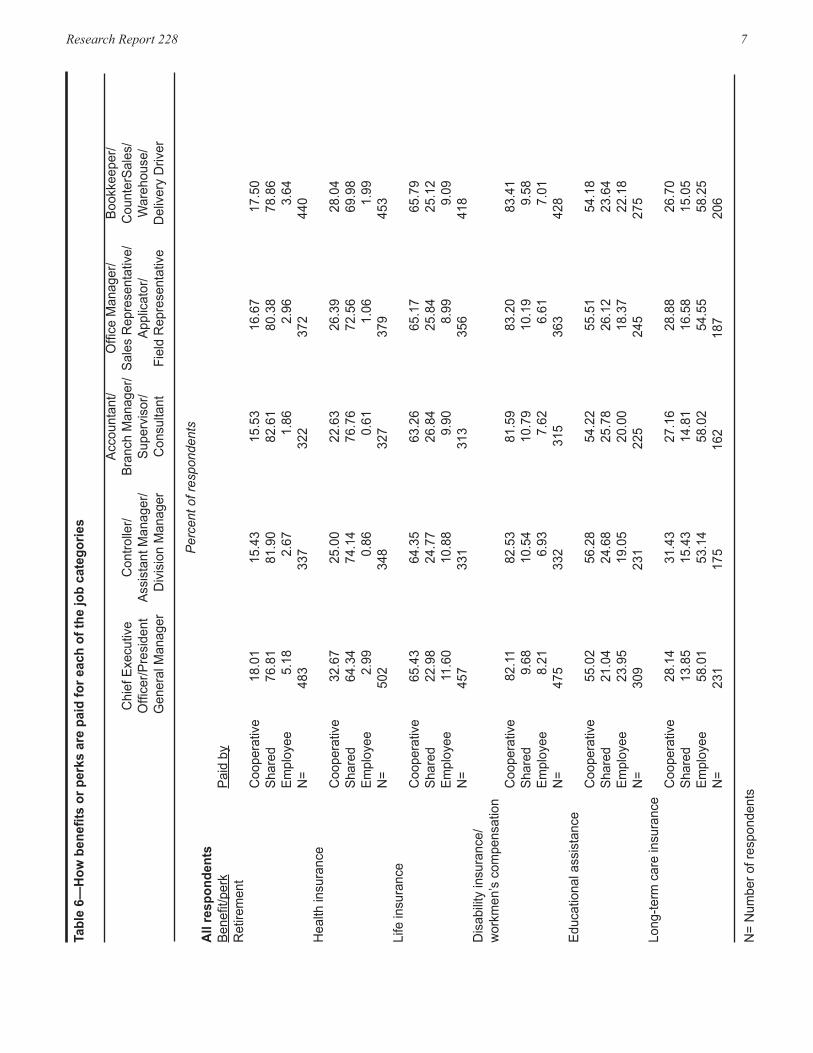
Benefits/Perks Benefits/perks refers to retirement benefits, health/life/disability insurance, educational assistance, and long-term care insurance in this study. Respondents were asked whether (a) the cooperative paid for the benefit/perk, (b) the expense was shared between
Performance was the most important factor in de-termining annual compensation for office managers and bookkeepers.
Matching competitor salaries was found to be the lowest ranking factor for determining annual com-pensation in 1999 and is the lowest for the first two job categories in 2011. It is ranked fifth for office managers by 0.09 points and fifth for bookkeepers by 0.32 points.
Figure 3—Distribution of Respondents by Number of Full-Time Employees
Table 2—Number of full-time cooperative employees and highest education attained for each of the job categories Accountant/ OfficeManager/ Bookkeeper/ ChiefExecutive Controller/ BranchManager/ SalesRepresentative/ CounterSales/ Officer/President AssistantManager/ Supervisor/ Applicator/ Warehouse/ GeneralManager DivisionManager Consultant FieldRepresentative DeliveryDriver
All respondents Full-timeemployees 524 1,104 3,015 4,700 10,582
Percent of respondentsEducation Highschool 15.36 13.62 16.35 25.13 61.11Somecollege 11.90 17.97 43.40 44.10 31.84College 65.45 62.90 38.36 30.26 7.05Masters 7.29 5.51 1.89 0.51 No.ofrespondents 521 345 318 390 468
Research Report 228 5
Table 3—Average annual compensation for each of the job categories Accountant/ OfficeManager/ Bookkeeper/ ChiefExecutive Controller/ BranchManager/ SalesRepresentative/ CounterSales/ Officer/President AssistantManager/ Supervisor/ Applicator/ Warehouse/ GeneralManager1 DivisionManager Consultant FieldRepresentative DeliveryDriver DollarsAll respondents Average 105,576 70,347 54,263 45,397 33,679Median 90,000 62,000 50,000 44,841 33,218 Maximum 511,000 324,405 160,000 105,415 85,000Minimum 12,000 3,500 19,000 4,000 300 No.ofrespondents 474 315 292 361 433 1Theoverallhighandlowaveragesalariesweredeleted,sothisloweredthenumberofresponsesinthistablefrom553to551.
Table 4— Ranking of factors that determine annual compensation for each of the job categories with 1 as the highest rank or most important and 5 as the lowest rank or least important Accountant/ OfficeManager/ Bookkeeper/ ChiefExecutive Controller/ BranchManager/ SalesRepresentative/ CounterSales/ Officer/President AssistantManager/ Supervisor/ Applicator/ Warehouse/ GeneralManager DivisionManager Consultant FieldRepresentative DeliveryDriver RankingAll respondents Experience 2.03 2.06 2.09 2.16 2.32No.ofrespondents 451 308 286 353 405
Jobresponsibilities 1.86 1.87 1.92 1.97 2.10No.ofrespondents 449 308 287 348 404
Performance 1.93 2.00 1.97 1.96 2.06No.ofrespondents 447 303 281 343 397
Decision-makingcapabilities 2.06 2.26 2.38 2.50 2.82No.ofrespondents 442 303 277 338 391
Education 3.17 3.14 3.41 3.31 3.60No.ofrespondents 427 296 272 330 377
Matchingcompetitorsalaries 3.26 3.15 3.15 3.22 3.28No.ofrespondents 413 281 256 317 364
OtherfactorswritteninbyrespondentsNumber of RespondentsBoard/budget 8 1 1 2 3Managementevaluation/compensationsurveys 6 5 6 7 7Collectivebargainingagreement 2 1 1 2 2Netincome/sales 2 1 0 1 0Noraisesin4years 1 1 1 1 1Seniority 1 0 1 1 1
6 Cooperative Employee Compensation
Table 5— How bonus or commission is determined for each of the job categories Accountant/ OfficeManager/ Bookkeeper/ ChiefExecutive Controller/ BranchManager/ SalesRepresentative/ CounterSales/ Officer/President AssistantManager/ Supervisor/ Applicator/ Warehouse/ GeneralManager DivisionManager Consultant FieldRepresentative DeliveryDriver
Percent of respondentsAll respondents Percentofnetincome 36.10 33.79 34.87 28.34 29.17Nobonusoffered 12.83 13.10 13.79 13.38 18.61Percentoflocalsavings 11.88 11.38 11.11 9.24 9.72Performance 4.75 5.17 4.60 4.46 3.89Profitsharing 4.51 5.86 6.13 5.41 5.56Yes1 4.04 4.14 3.83 3.82 3.61Boardofdirector’sdiscretion 3.80 0.69 0.77 0.32 1.11Perbale 3.56 0.69 1.15 1.27 1.94Percentofannualsalary 2.85 4.83 5.36 4.46 6.67Co-op’sperformance 2.61 3.45 2.68 2.87 1.94Percentofsales 2.61 2.07 3.07 5.10 2.78Cashbonus 1.90 2.07 1.53 3.50 3.06Return-investedcapital 1.90 2.07 1.15 1.27 0.56Other 1.66 4.48 3.07 3.82 5.00Managementcontract 1.43 1.72 0.38 0.32 0.56Christmasbonus 1.43 1.38 0.38 0.32 1.39Jobperformance 0.95 1.03 0.38 1.27 0.28Volume 0.71 - 0.38 0.64 1.94Generalmanager’sdiscretion 0.48 1.03 2.68 4.14 0.56Percentofdivisionlocalnetsavings - 1.03 0.77 - -Percentofbranchlocalnetsavings - - 1.53 0.32 0.83Commissiononsales - - 0.38 2.87 0.83Acresapplied - - - 2.87 -Total 100.00 100.00 100.00 100.00 100.00
Percentofrespondentsofferingbonusorcommission 66.37 45.57 40.69 49.19 52.98
No.ofrespondents 421 290 261 314 360
1Bonusorcommissionoffered,buttheresponsewasYesinsteadofhowthebonusorcommissionwasdetermined.
the cooperative and the employee, or (c) the em-ployee paid (Table 6).
Retirement benefits were most often a shared expense between the cooperative and employees. CEOs shared retirement expenses with the coop-erative by 77 percent of the respondents. For the other four job categories, retirement benefits were shared with employees for around 80 percent of the cooperatives. Compared with the 1999 study, it
appears that there has been an increase in sharing the expense of retirement. Retirement benefits were shared about two-thirds of the time across job cat-egories in 1999, while sharing between the coopera-tive and employees was almost 80 percent in 2011.
Health insurance was most often a shared ex-pense, but less so than retirement. The expense was paid for by cooperatives at least 23 percent of the time, and almost a third of the time coopera-
Research Report 228 7
Tabl
e 6—
How
ben
efits
or p
erks
are
pai
d fo
r eac
h of
the
job
cate
gorie
s
Accountant/
OfficeManager/
Bookkeeper/
ChiefExecutive
Controller/
BranchManager/Sa
lesRepresentative/
CounterSa
les/
Officer/P
resident
AssistantM
anager/
Supervisor/
Applicator/
Warehouse/
GeneralManagerDivisionManager
Consultant
FieldRepresentative
DeliveryDriver
Perc
ent o
f res
pond
ents
All
resp
onde
nts
Benefit/perk
Paidby
Retirement
Cooperative
18.01
15.43
15.53
16.67
17.50
Shared
76.81
81.90
82.61
80.38
78.86
Employee
5.18
2.67
1.86
2.96
3.64
N=
483
337
322
372
440
Healthinsurance
Cooperative
32.67
25.00
22.63
26.39
28.04
Shared
64.34
74.14
76.76
72.56
69.98
Employee
2.99
0.86
0.61
1.06
1.99
N=
502
348
327
379
453
Lifeinsurance
Cooperative
65.43
64.35
63.26
65.17
65.79
Shared
22.98
24.77
26.84
25.84
25.12
Employee
11.60
10.88
9.90
8.99
9.09
N=
457
331
313
356
418
Disabilityinsurance/
workm
en’scom
pensation
Cooperative
82.11
82.53
81.59
83.20
83.41
Shared
9.68
10.54
10.79
10.19
9.58
Employee
8.21
6.93
7.62
6.61
7.01
N=
475
332
315
363
428
Educationalassistance
Cooperative
55.02
56.28
54.22
55.51
54.18
Shared
21.04
24.68
25.78
26.12
23.64
Employee
23.95
19.05
20.00
18.37
22.18
N=
309
231
225
245
275
Long-termcareinsurance
Cooperative
28.14
31.43
27.16
28.88
26.70
Shared
13.85
15.43
14.81
16.58
15.05
Employee
58.01
53.14
58.02
54.55
58.25
N=
231
175
162
187
206
N=Num
berofrespondents
8 Cooperative Employee Compensation
Tabl
e 7—
Ben
efits
/per
ks o
ffere
d fo
r eac
h of
the
job
cate
gorie
s
Accountant/
OfficeManager/
Bookkeeper/
ChiefExecutive
Controller/
BranchManager/Sa
lesRepresentative/
CounterSa
les/
Officer/P
resident
AssistantM
anager/
Supervisor/
Applicator/
Warehouse/
GeneralManagerDivisionManager
Consultant
FieldRepresentative
DeliveryDriver
Perc
ent o
f res
pond
ents
All
resp
onde
nts
Paidvacation/holidays
Yes
96.96
99.15
99.08
98.47
98.31
No
3.04
0.85
0.92
1.53
1.69
N=
527
353
326
393
472
Paidsickleave
Yes
88.12
90.06
90.12
89.00
89.29
No
11.88
9.94
9.88
11.00
10.71
=522
352
324
391
467
Useofcooperativecar
Yes
59.42
35.26
40.19
34.46
13.82
ortruck
No
40.58
64.74
59.81
65.54
86.18
N=
515
346
321
383
456
Expenseaccount
Yes
42.83
29.53
25.87
23.82
9.87
No
57.17
70.47
74.13
76.18
90.13
N=
509
342
317
382
456
Paidtraining
Yes
77.00
83.43
85.35
79.95
72.19
No
23.00
16.57
14.65
20.05
27.81
N=
500
338
314
379
453
Mileageinprivatecar
Yes
63.40
70.18
69.72
65.96
59.29
No
36.60
29.82
30.28
34.04
40.71
N=
500
342
317
379
452
Flexibleworkhours
Yes
47.79
41.67
31.39
34.76
28.48
No
52.21
58.33
68.61
65.24
71.52
N=
498
336
309
374
446
Workaw
ayfrom
main
Yes
20.00
15.71
11.07
13.35
5.02
office(telew
ork)
No
80.00
84.29
88.93
86.65
94.98
N=
490
331
307
367
438
N=Num
berofrespondents
Research Report 228 9
tives paid for CEOs’ health insurance. In 1999, the cooperative paid for this expense between 41 and 50 percent of the time across job categories, about 20 points higher than in 2011.
Life insurance is paid by the cooperative for al-most all of the job categories about two-thirds of the time. Across job categories, only about 10 percent of the time is the cost of life insurance shouldered exclusively by employees. The payment of this benefit is very similar to the prior study, with the cooperative paying about two-thirds of the time and the employee paying a little under 10 percent of the time in 1999.
Disability insurance/workmen’s compensation should not have been combined as a benefit/perk. Disability insurance is a benefit, but workmen’s compensation is generally required and as such should be considered as a cost of doing business. Since the survey question incorrectly paired dis-ability insurance and workmen’s compensation, no further analysis of responses can be made.
Educational assistance was paid by the coop-erative at least 54 percent of the time over all job categories. There was just over a 2-point range in this response by cooperatives, from 54 percent to 56 percent paid over all job categories. Educational assistance was paid by the cooperative about two-thirds of the time in 1999, about 10 points higher than this study found.
Long-term care insurance is a relatively new ben-efit, so there is no comparison to the 1999 survey. The cooperative pays for this benefit between 27
Table 8—Retirement/pension plans offered
Definedbenefit DefinedcontributionorIRA-basedplans Cooperative Cooperative contribution contribution onsalary onsalaryRetirement/pensionplans Number Percent Number PercentAll respondents Definedbenefitplans Cooperativecontributions 58 8.09 DefinedbenefitanddefinedcontributionorIRA-basedplans Cooperativeonlycontributions 47 5.38 47 2.83Cooperativeandemployeecontributions 85 8.70 85 3.27 DefinedcontributionorIRA-basedplans Cooperativeonlycontributions 5 5.88Cooperativeandemployeecontributions 242 4.65
percent and 31 percent of the time across job cat-egories. Over half the time the employee pays for this benefit.
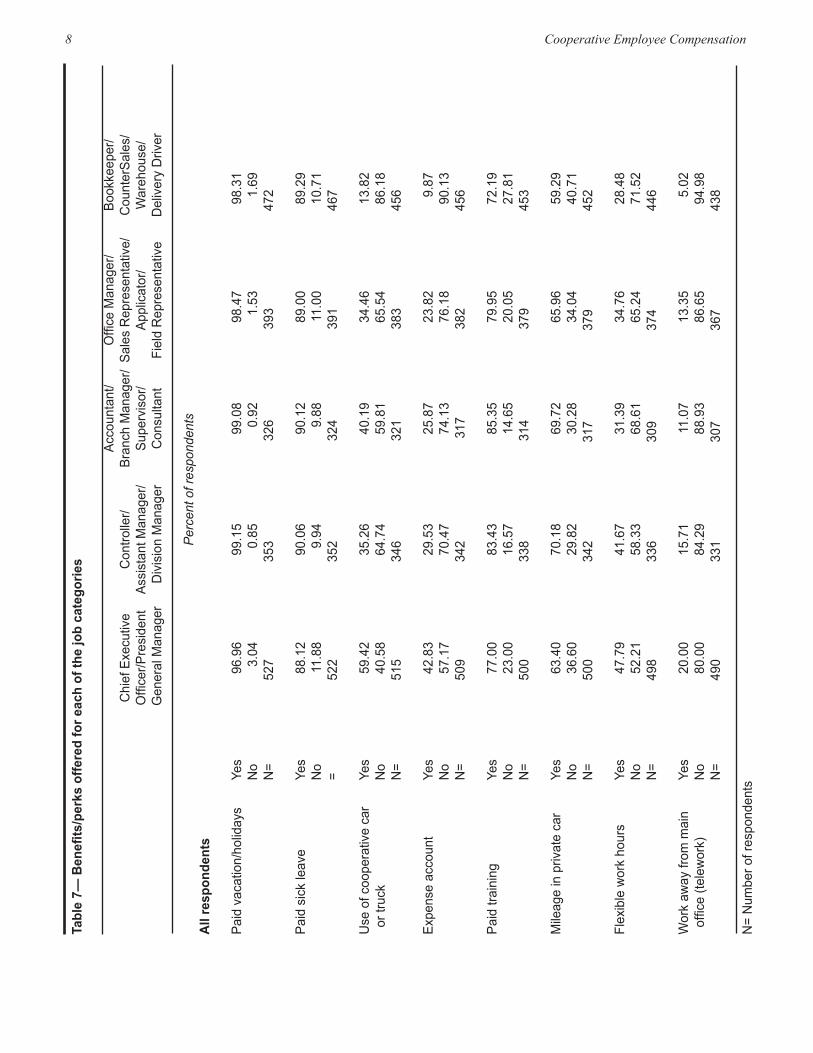
Other benefits or perks were also included in the survey, and they included paid vacation/holidays, paid sick leave, use of cooperative car or truck, ex-pense account, paid training, mileage in private car, flexible work hours, and work away from main of-fice (telework). The cooperatives were asked if they offered these benefits or perks. Flexible work hours and telework questions were new to this study.
Almost all of the cooperatives offered paid vacation/holidays in both 2011 and 1999 (Table 7). Around 90 percent of the cooperatives offered paid sick leave across all job categories in 2011, a couple of points lower than offered in 1999. Several co-operatives responding to this study stated that they offered personal time off in lieu of paid sick leave.
Use of car or truck was offered by cooperatives 59 percent of the time to CEOs, exactly the same response as in 1999. The other job categories were offered this benefit 40 percent or less of the time.
An expense account was offered by cooperatives to CEOs by about 43 percent of the respondents. Other job categories were offered an expense ac-count by less than 30 percent of the cooperatives.
Paid training was offered to CEOs by 77 percent of the respondents in 2011 and 78 percent of the cooperatives in 1999. The other job categories were offered paid training by at least 72 percent of the respondents.
Private car mileage compensation was offered to
10 Cooperative Employee Compensation
CEOs by 63 percent of the cooperatives, 10 points lower than in 1999. The other job categories were offered mileage in a private car by 59 percent to 70 percent of the respondents, similar to the 1999 find-ings.
About half of the cooperatives offered flexible work hours to CEOs. In other job categories, 42 percent of the cooperatives offered flexible work hours for controllers, with a low of 28 percent offer-ing them to bookkeepers. Telework was not offered by many cooperatives: between 80 percent and 95 percent of the cooperatives did not offer telework across job categories.
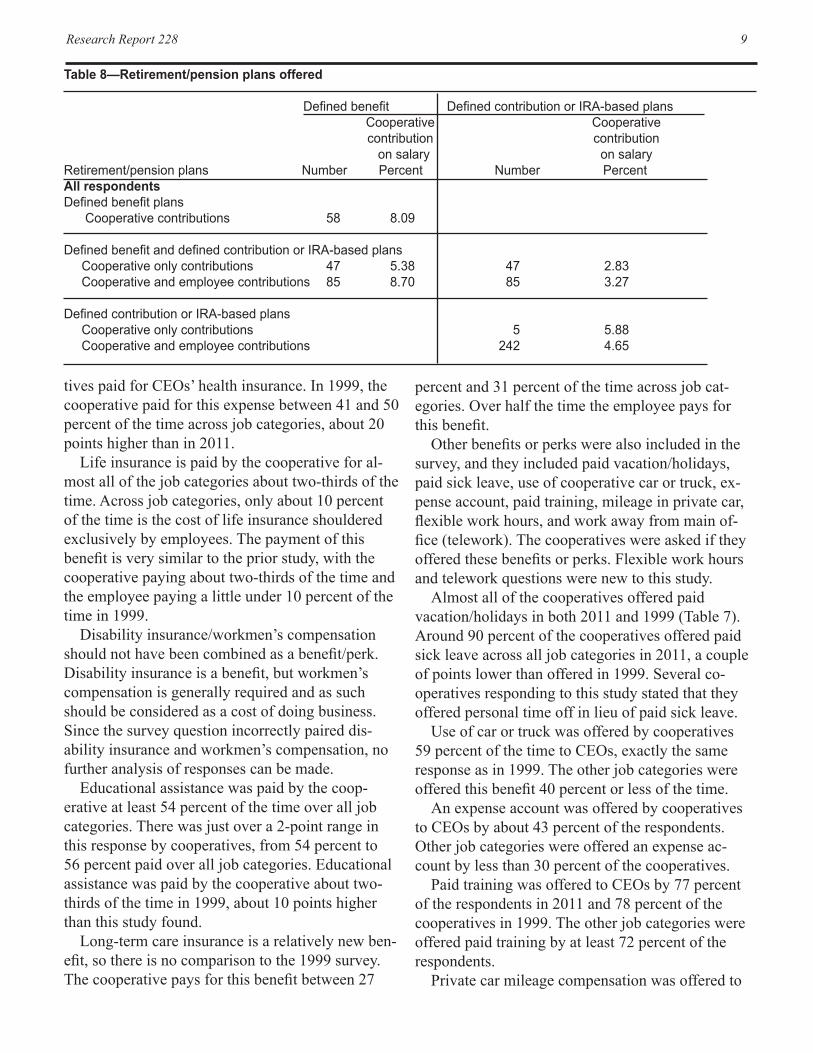
Retirement/Pension Plans Some form of retirement/pension plan was offered by 79 percent of the respondents to the survey. A defined benefit plan in which the cooperative alone contributed to the plan was offered by 58 coopera-tives (Table 8). The average contribution on em-ployee salaries was a little over 8 percent by these
Table 9— Performance measures used for determining annual salaries, by job categories Accountant/ OfficeManager/ Bookkeeper/ ChiefExecutive Controller/ BranchManager/ SalesRepresentative/ CounterSales/ Officer/President AssistantManager/ Supervisor/ Applicator/ Warehouse/ GeneralManager DivisionManager Consultant FieldRepresentative DeliveryDriver
Percent of respondentsAll respondents BoardOfDirectorsEvaluation 50.43 5.00 2.26 1.55 3.51NetIncome 25.79 23.75 19.00 14.73 17.89AnnualReviewByGeneralManager 0.00 30.42 23.08 17.44 15.79AnnualReviewByDepartmentManager 0.00 1.25 12.22 13.18 13.33AnnualReviewByBranchManager 0.00 0.00 0.00 1.55 2.11Sales 8.31 9.58 9.50 16.67 6.32LocalSavings 4.87 4.58 3.62 3.49 3.16DepartmentNetIncome 0.00 3.75 3.17 0.39 2.11PerBale 1.15 0.00 0.00 0.39 0.35ReturnOnInvestedCapital 2.29 1.67 0.90 0.00 0.00AccurateWork 1.72 9.17 14.03 20.54 22.81Other 5.44 10.83 12.22 10.08 12.63Total 100.00 100.00 100.00 100.00 100.00 N= 349 240 221 258 285
N=:Numberofrespondents
cooperatives.There were also combinations of defined ben-
efit and defined contribution plans provided by 47 cooperatives in which the cooperative funded the plans. Another 85 cooperatives had combinations of defined benefit and defined contribution plans in which the cooperative and employees both contrib-uted to the plans.
Defined contribution or IRA-based plans were of-fered by 247 cooperatives. Five cooperatives funded these plans alone, while 242 contributed almost 5 percent of employee salaries alongside employee contributions.
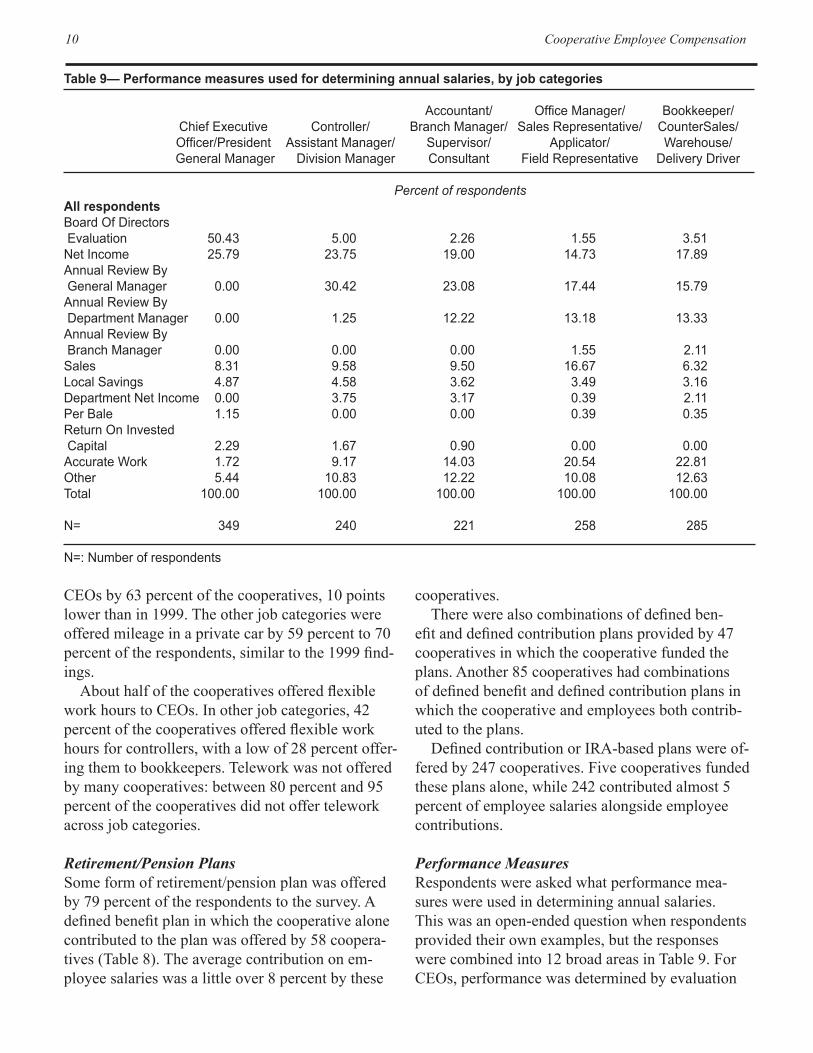
Performance MeasuresRespondents were asked what performance mea-sures were used in determining annual salaries. This was an open-ended question when respondents provided their own examples, but the responses were combined into 12 broad areas in Table 9. For CEOs, performance was determined by evaluation
Research Report 228 11
by the board of directors in over 50 percent of the responses. Net income (profit) was the next highest performance determinant at 26 percent.
For the other job categories, net income and an annual review by the CEO were important perfor-mance measures. For office managers and book-keepers, accurate work was the highest ranked performance measure.
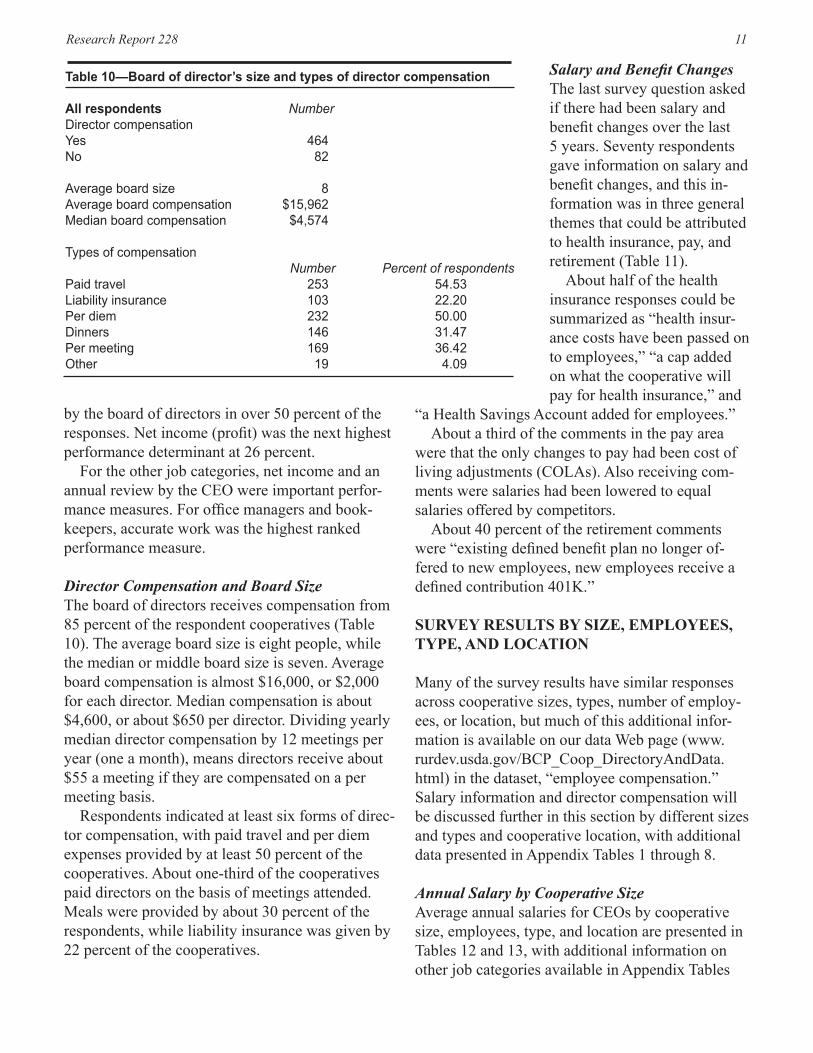
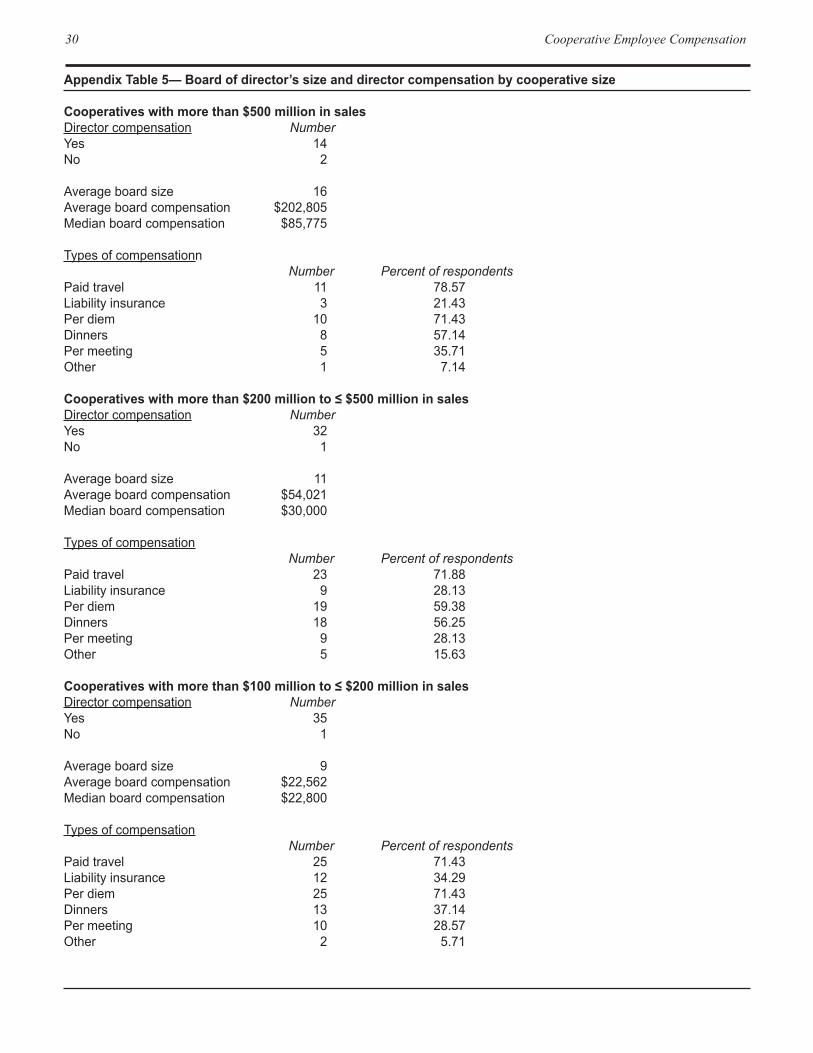
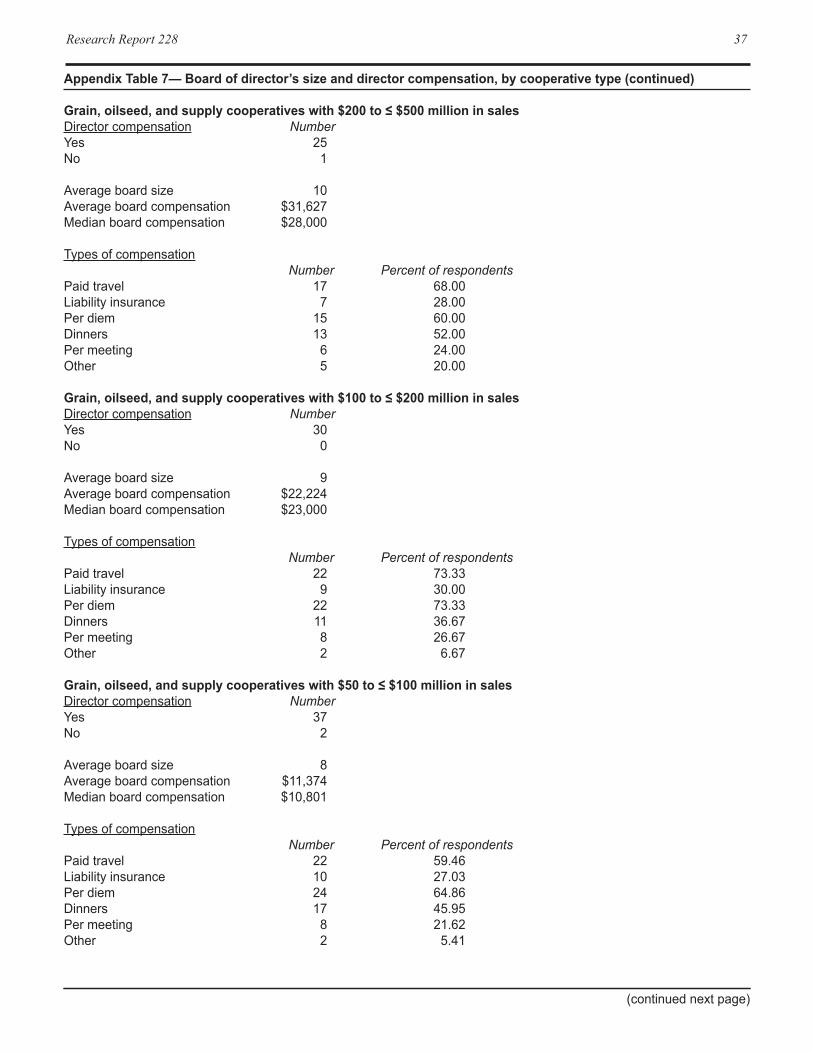
Director Compensation and Board SizeThe board of directors receives compensation from 85 percent of the respondent cooperatives (Table 10). The average board size is eight people, while the median or middle board size is seven. Average board compensation is almost $16,000, or $2,000 for each director. Median compensation is about $4,600, or about $650 per director. Dividing yearly median director compensation by 12 meetings per year (one a month), means directors receive about $55 a meeting if they are compensated on a per meeting basis.
Respondents indicated at least six forms of direc-tor compensation, with paid travel and per diem expenses provided by at least 50 percent of the cooperatives. About one-third of the cooperatives paid directors on the basis of meetings attended. Meals were provided by about 30 percent of the respondents, while liability insurance was given by 22 percent of the cooperatives.
Table 10—Board of director’s size and types of director compensation All respondents Number DirectorcompensationYes 464No 82 Averageboardsize 8Averageboardcompensation $15,962Medianboardcompensation $4,574 Typesofcompensation Number Percent of respondentsPaidtravel 253 54.53Liabilityinsurance 103 22.20Perdiem 232 50.00Dinners 146 31.47Permeeting 169 36.42Other 19 4.09
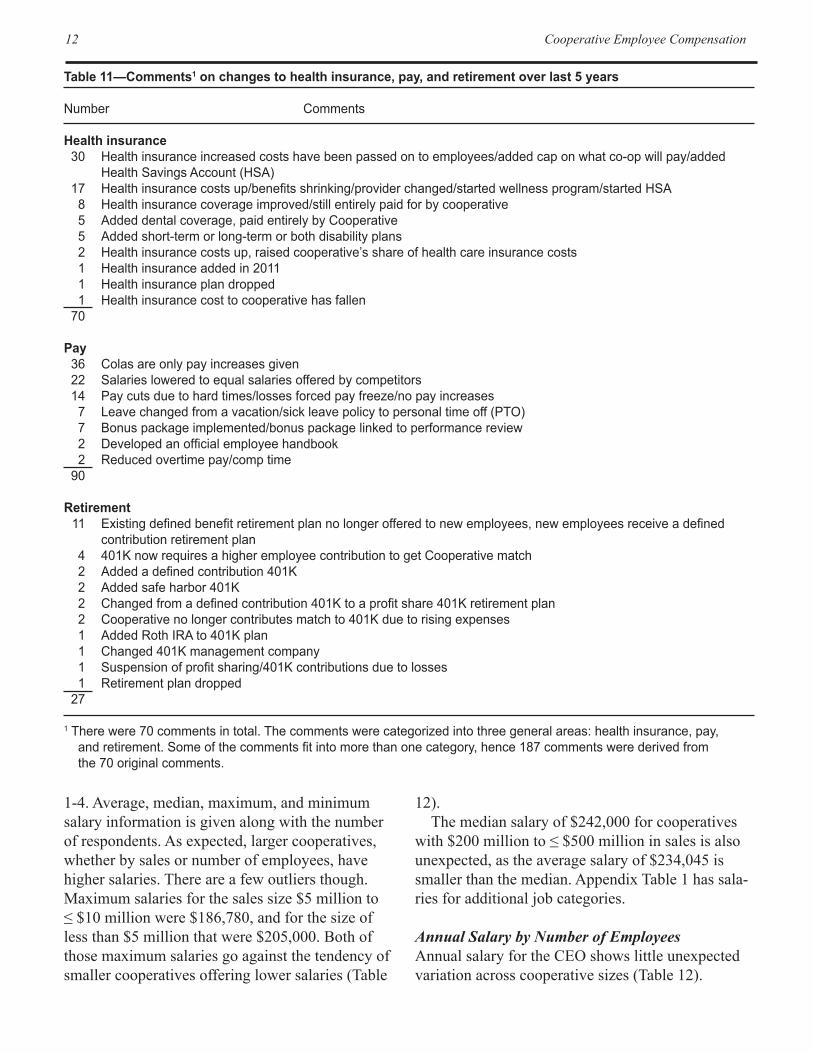
Salary and Benefit Changes The last survey question asked if there had been salary and benefit changes over the last 5 years. Seventy respondents gave information on salary and benefit changes, and this in-formation was in three general themes that could be attributed to health insurance, pay, and retirement (Table 11).
About half of the health insurance responses could be summarized as “health insur-ance costs have been passed on to employees,” “a cap added on what the cooperative will pay for health insurance,” and
“a Health Savings Account added for employees.”About a third of the comments in the pay area
were that the only changes to pay had been cost of living adjustments (COLAs). Also receiving com-ments were salaries had been lowered to equal salaries offered by competitors.
About 40 percent of the retirement comments were “existing defined benefit plan no longer of-fered to new employees, new employees receive a defined contribution 401K.”
SURVEY RESULTS BY SIZE, EMPLOYEES, TYPE, AND LOCATION
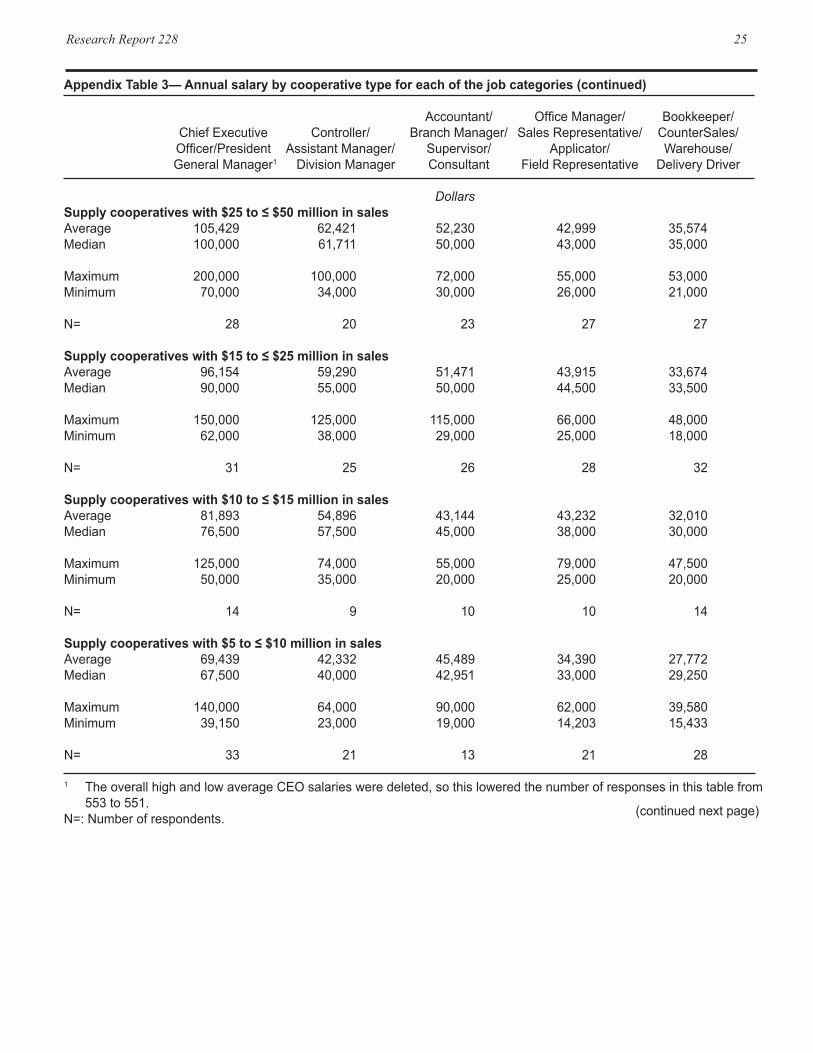
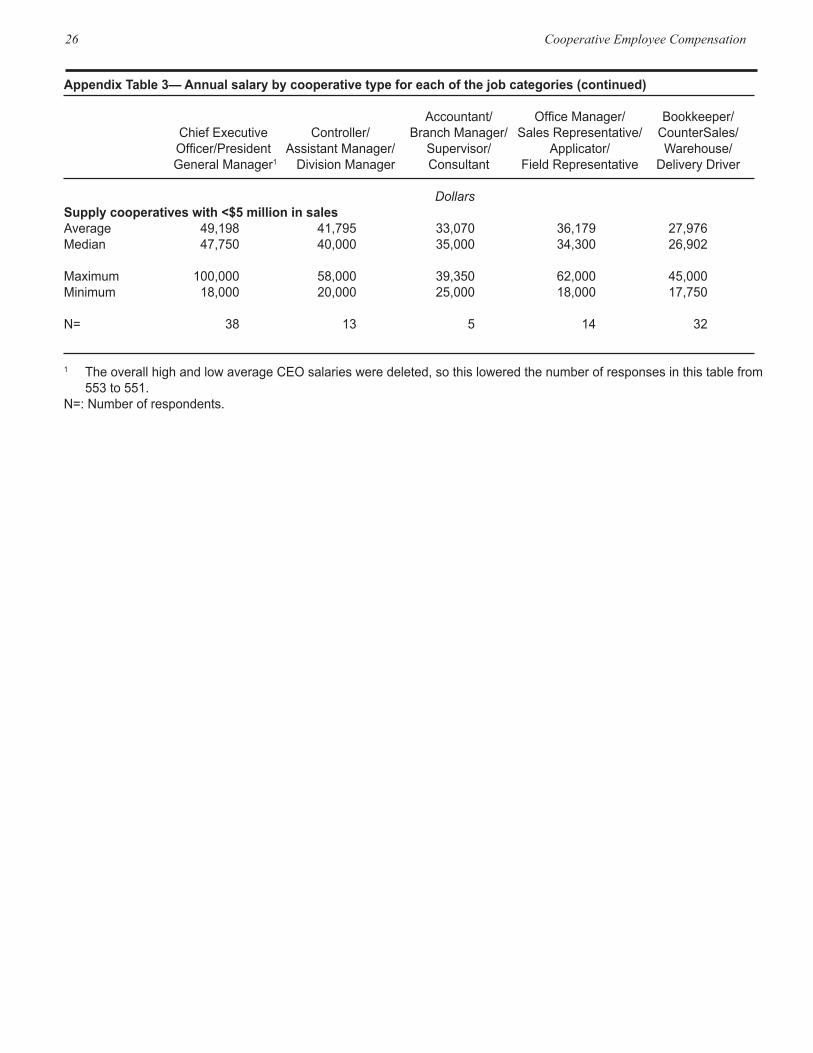
Many of the survey results have similar responses across cooperative sizes, types, number of employ-ees, or location, but much of this additional infor-mation is available on our data Web page (www.rurdev.usda.gov/BCP_Coop_DirectoryAndData.html) in the dataset, “employee compensation.” Salary information and director compensation will be discussed further in this section by different sizes and types and cooperative location, with additional data presented in Appendix Tables 1 through 8.
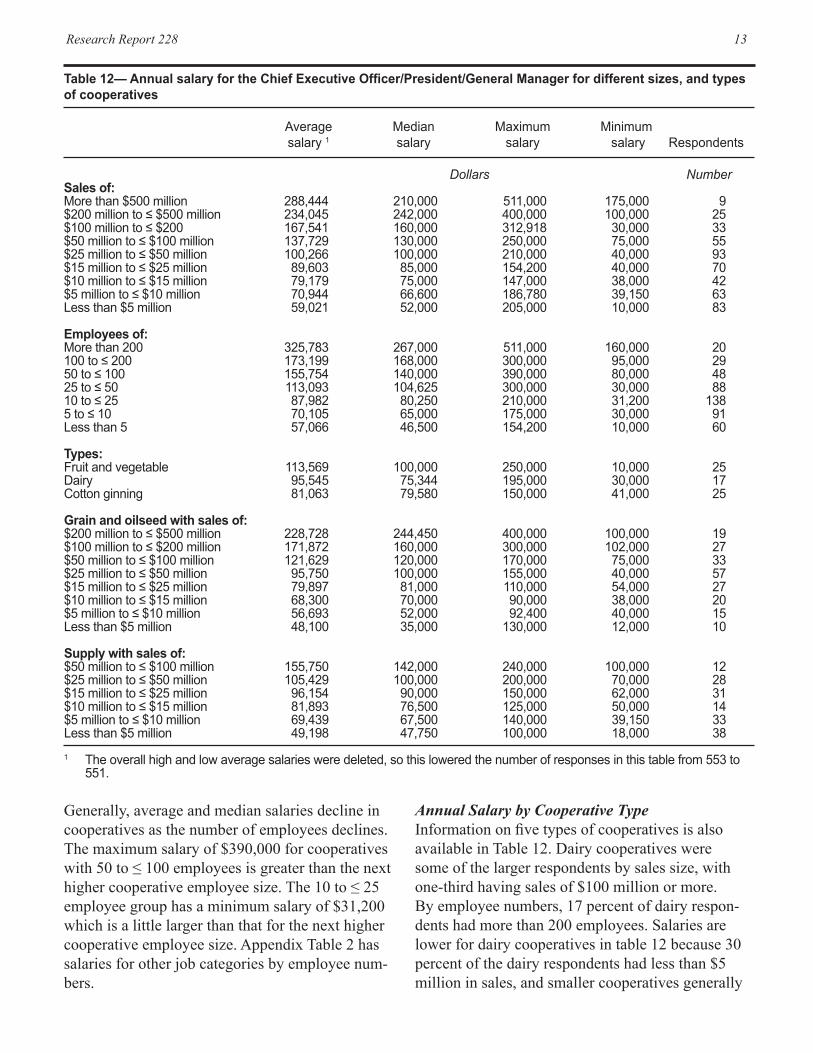
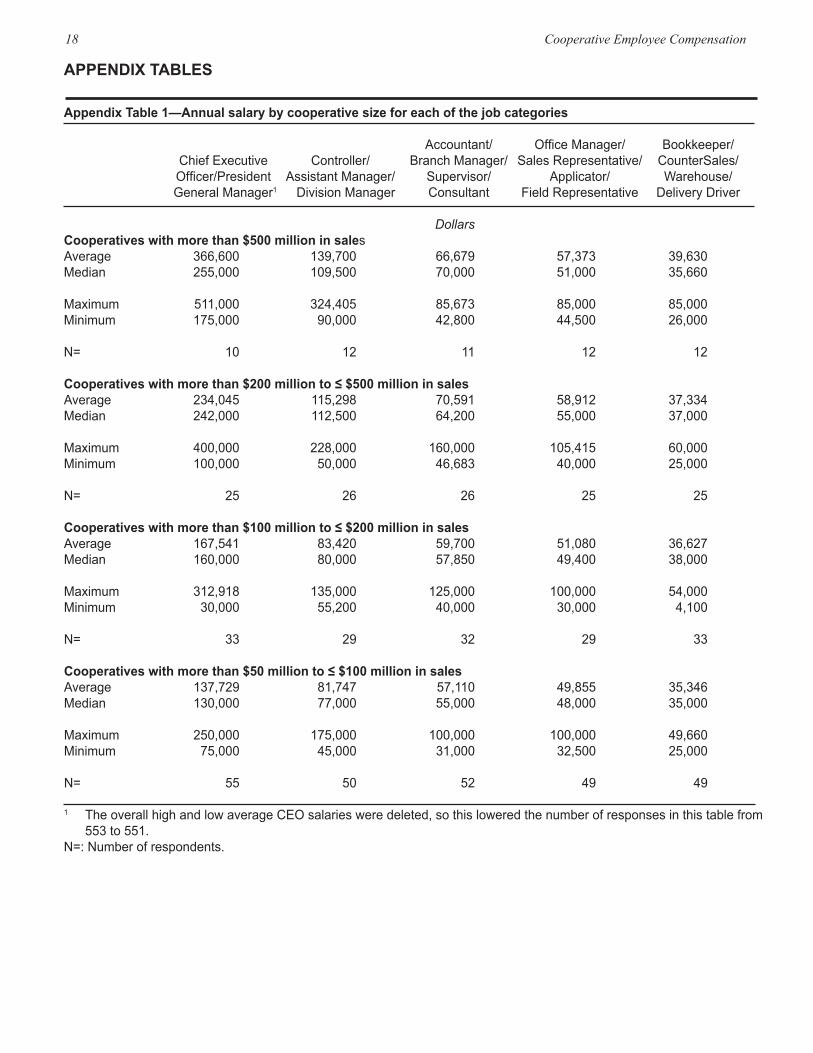
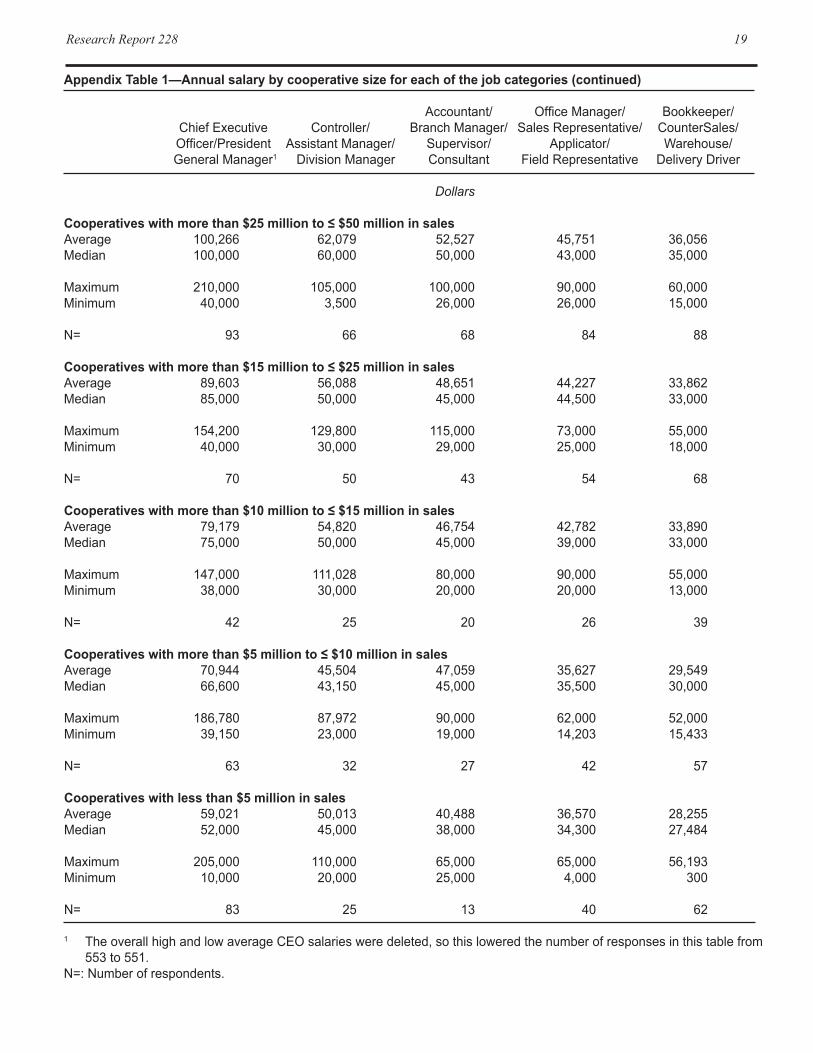
Annual Salary by Cooperative SizeAverage annual salaries for CEOs by cooperative size, employees, type, and location are presented in Tables 12 and 13, with additional information on other job categories available in Appendix Tables
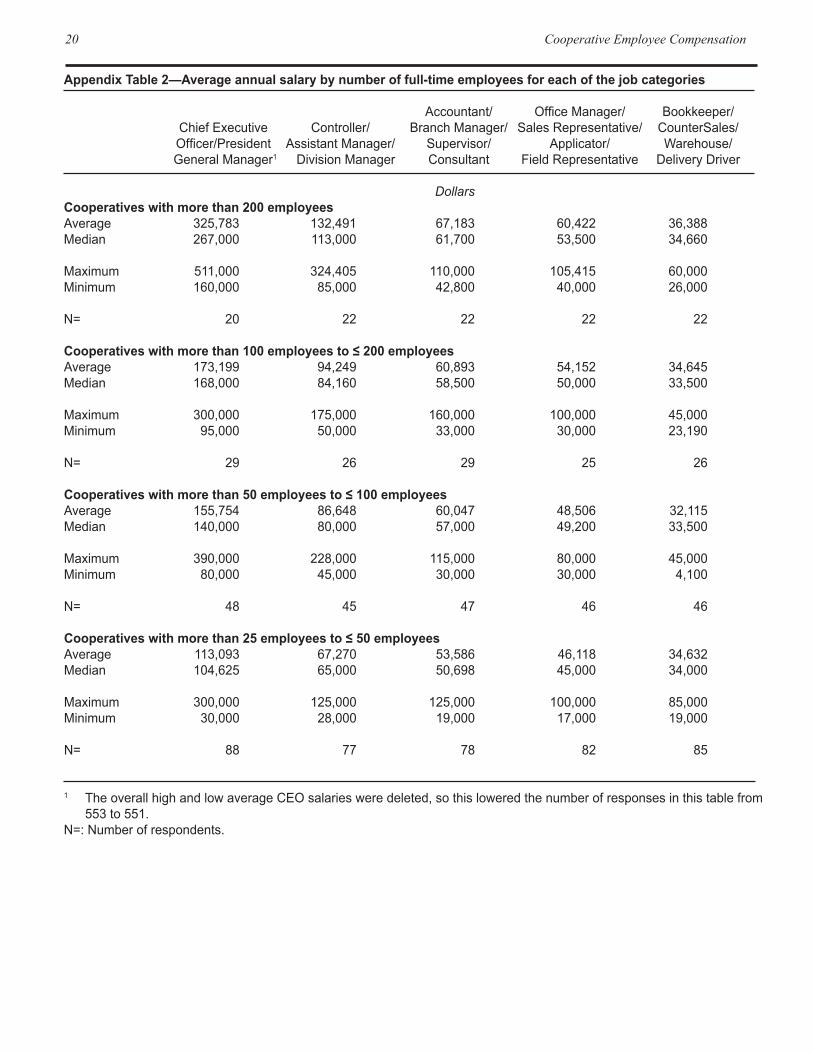
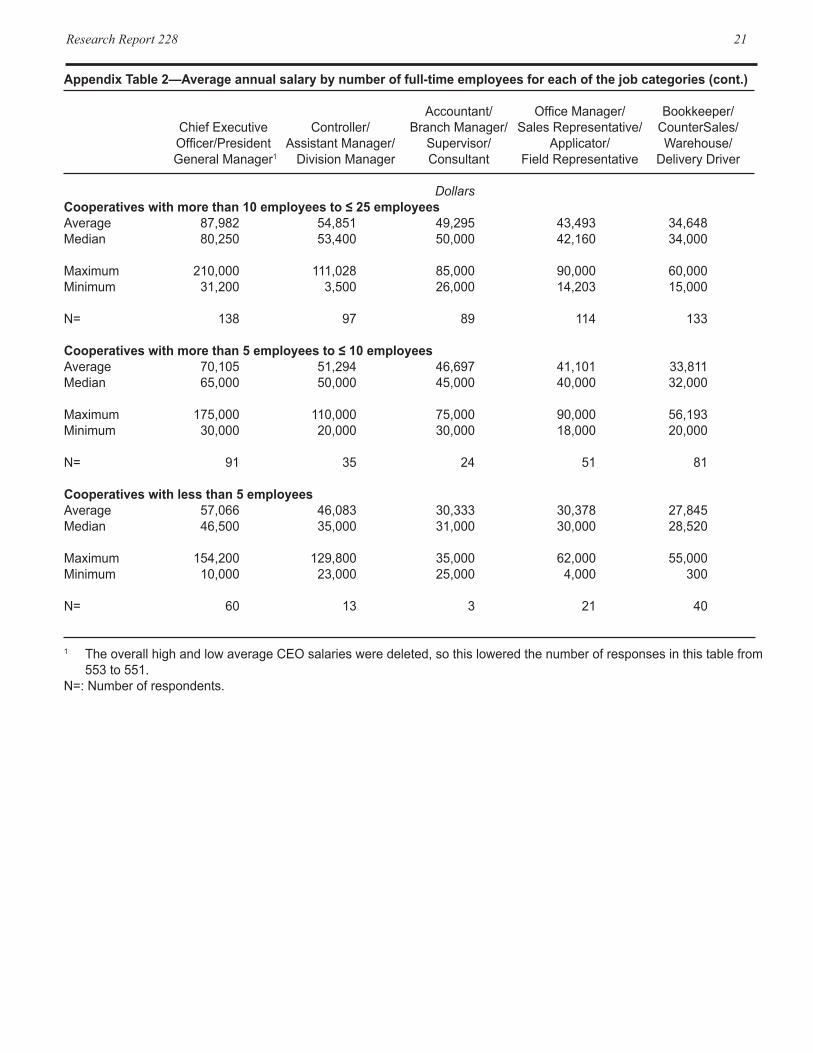
12 Cooperative Employee Compensation
1-4. Average, median, maximum, and minimum salary information is given along with the number of respondents. As expected, larger cooperatives, whether by sales or number of employees, have higher salaries. There are a few outliers though. Maximum salaries for the sales size $5 million to ≤ $10 million were $186,780, and for the size of less than $5 million that were $205,000. Both of those maximum salaries go against the tendency of smaller cooperatives offering lower salaries (Table
Table 11—Comments1 on changes to health insurance, pay, and retirement over last 5 years
Number Comments
Health insurance 30 Healthinsuranceincreasedcostshavebeenpassedontoemployees/addedcaponwhatco-opwillpay/added
HealthSavingsAccount(HSA) 17 Healthinsurancecostsup/benefitsshrinking/providerchanged/startedwellnessprogram/startedHSA 8 Healthinsurancecoverageimproved/stillentirelypaidforbycooperative 5 Addeddentalcoverage,paidentirelybyCooperative 5 Addedshort-termorlong-termorbothdisabilityplans 2 Healthinsurancecostsup,raisedcooperative’sshareofhealthcareinsurancecosts 1 Healthinsuranceaddedin2011 1 Healthinsuranceplandropped 1 Healthinsurancecosttocooperativehasfallen 70
Pay 36 Colasareonlypayincreasesgiven 22 Salariesloweredtoequalsalariesofferedbycompetitors 14 Paycutsduetohardtimes/lossesforcedpayfreeze/nopayincreases 7 Leavechangedfromavacation/sickleavepolicytopersonaltimeoff(PTO) 7 Bonuspackageimplemented/bonuspackagelinkedtoperformancereview 2 Developedanofficialemployeehandbook 2 Reducedovertimepay/comptime 90
Retirement 11 Existingdefinedbenefitretirementplannolongerofferedtonewemployees,newemployeesreceiveadefined
contributionretirementplan 4 401KnowrequiresahigheremployeecontributiontogetCooperativematch 2 Addedadefinedcontribution401K 2 Addedsafeharbor401K 2 Changedfromadefinedcontribution401Ktoaprofitshare401Kretirementplan 2 Cooperativenolongercontributesmatchto401Kduetorisingexpenses 1 AddedRothIRAto401Kplan 1 Changed401Kmanagementcompany 1 Suspensionofprofitsharing/401Kcontributionsduetolosses 1 Retirementplandropped 27
1Therewere70commentsintotal.Thecommentswerecategorizedintothreegeneralareas:healthinsurance,pay,andretirement.Someofthecommentsfitintomorethanonecategory,hence187commentswerederivedfromthe70originalcomments.
12). The median salary of $242,000 for cooperatives
with $200 million to ≤ $500 million in sales is also unexpected, as the average salary of $234,045 is smaller than the median. Appendix Table 1 has sala-ries for additional job categories.
Annual Salary by Number of EmployeesAnnual salary for the CEO shows little unexpected variation across cooperative sizes (Table 12).
Research Report 228 13
Table 12— Annual salary for the Chief Executive Officer/President/General Manager for different sizes, and types of cooperatives Average Median Maximum Minimum salary1 salary salary salary Respondents
Dollars NumberSales of: Morethan$500million 288,444 210,000 511,000 175,000 9$200millionto≤$500million 234,045 242,000 400,000 100,000 25$100millionto≤$200 167,541 160,000 312,918 30,000 33$50millionto≤$100million 137,729 130,000 250,000 75,000 55$25millionto≤$50million 100,266 100,000 210,000 40,000 93$15millionto≤$25million 89,603 85,000 154,200 40,000 70$10millionto≤$15million 79,179 75,000 147,000 38,000 42$5millionto≤$10million 70,944 66,600 186,780 39,150 63Lessthan$5million 59,021 52,000 205,000 10,000 83 Employees of: Morethan200 325,783 267,000 511,000 160,000 20100to≤200 173,199 168,000 300,000 95,000 2950to≤100 155,754 140,000 390,000 80,000 4825to≤50 113,093 104,625 300,000 30,000 8810to≤25 87,982 80,250 210,000 31,200 1385to≤10 70,105 65,000 175,000 30,000 91Lessthan5 57,066 46,500 154,200 10,000 60 Types: Fruitandvegetable 113,569 100,000 250,000 10,000 25Dairy 95,545 75,344 195,000 30,000 17Cottonginning 81,063 79,580 150,000 41,000 25 Grain and oilseed with sales of: $200millionto≤$500million 228,728 244,450 400,000 100,000 19$100millionto≤$200million 171,872 160,000 300,000 102,000 27$50millionto≤$100million 121,629 120,000 170,000 75,000 33$25millionto≤$50million 95,750 100,000 155,000 40,000 57$15millionto≤$25million 79,897 81,000 110,000 54,000 27$10millionto≤$15million 68,300 70,000 90,000 38,000 20$5millionto≤$10million 56,693 52,000 92,400 40,000 15Lessthan$5million 48,100 35,000 130,000 12,000 10 Supply with sales of: $50millionto≤$100million 155,750 142,000 240,000 100,000 12$25millionto≤$50million 105,429 100,000 200,000 70,000 28$15millionto≤$25million 96,154 90,000 150,000 62,000 31$10millionto≤$15million 81,893 76,500 125,000 50,000 14$5millionto≤$10million 69,439 67,500 140,000 39,150 33Lessthan$5million 49,198 47,750 100,000 18,000 38
1 Theoverallhighandlowaveragesalariesweredeleted,sothisloweredthenumberofresponsesinthistablefrom553to551.
Generally, average and median salaries decline in cooperatives as the number of employees declines. The maximum salary of $390,000 for cooperatives with 50 to ≤ 100 employees is greater than the next higher cooperative employee size. The 10 to ≤ 25 employee group has a minimum salary of $31,200 which is a little larger than that for the next higher cooperative employee size. Appendix Table 2 has salaries for other job categories by employee num-bers.
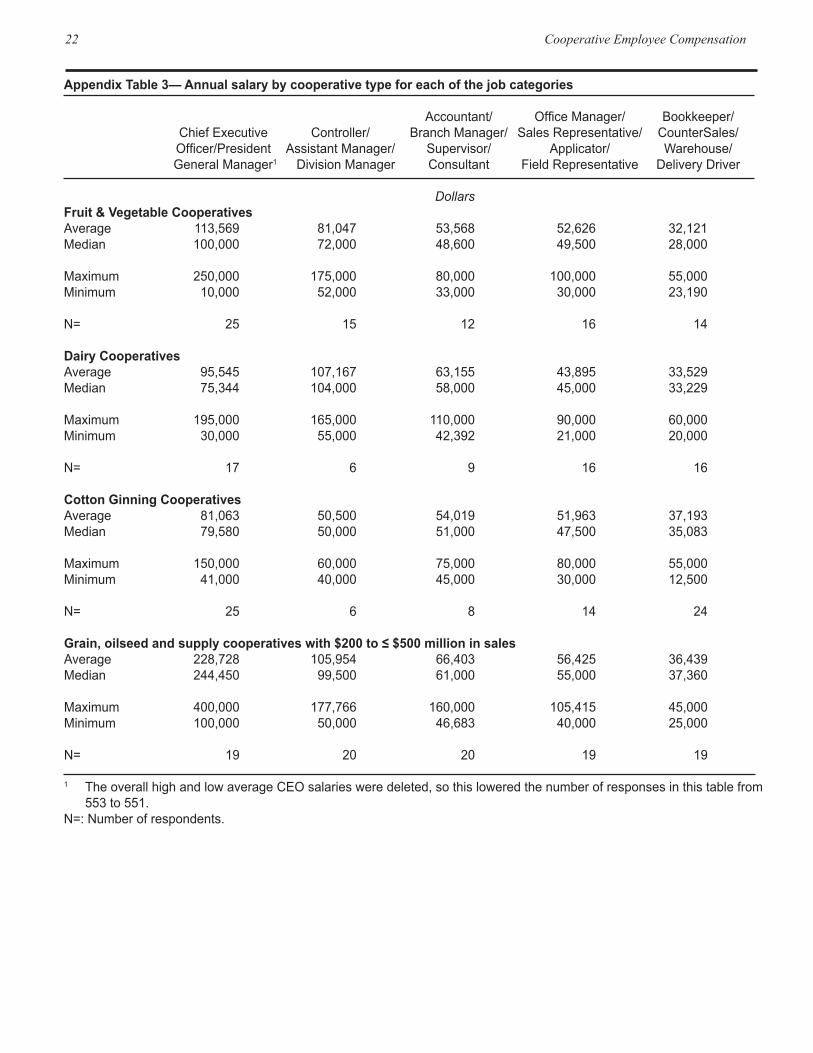
Annual Salary by Cooperative TypeInformation on five types of cooperatives is also available in Table 12. Dairy cooperatives were some of the larger respondents by sales size, with one-third having sales of $100 million or more. By employee numbers, 17 percent of dairy respon-dents had more than 200 employees. Salaries are lower for dairy cooperatives in table 12 because 30 percent of the dairy respondents had less than $5 million in sales, and smaller cooperatives generally
14 Cooperative Employee Compensation
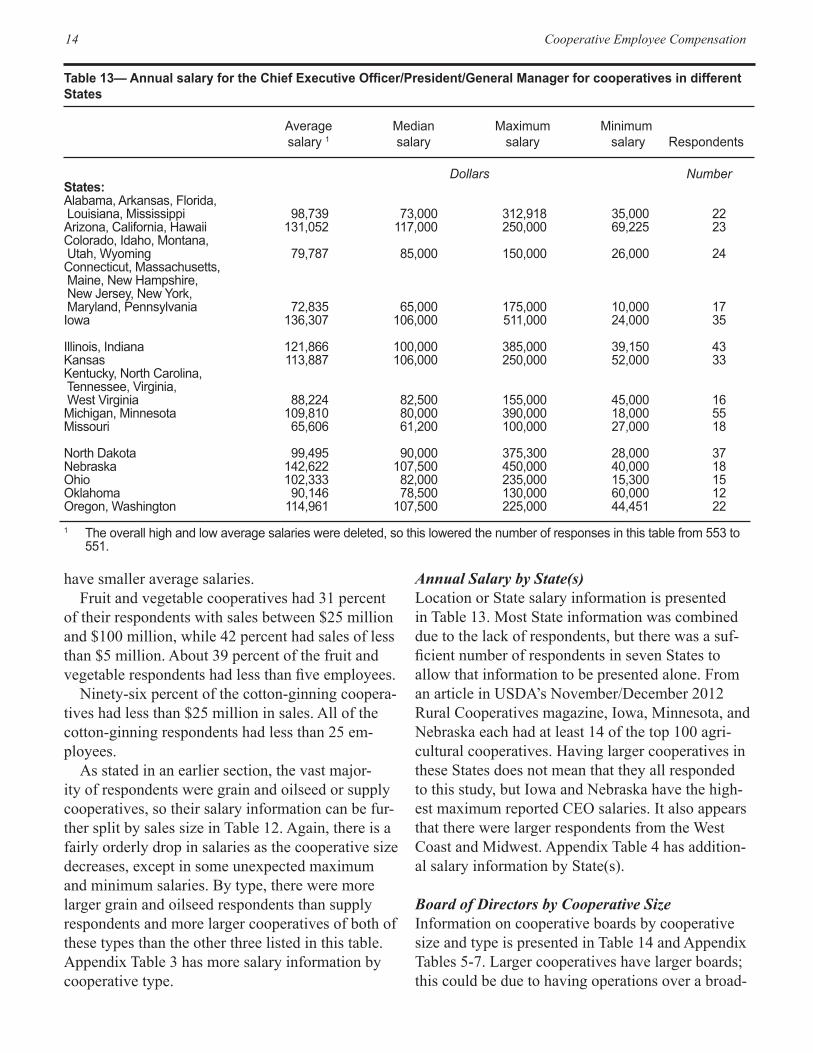
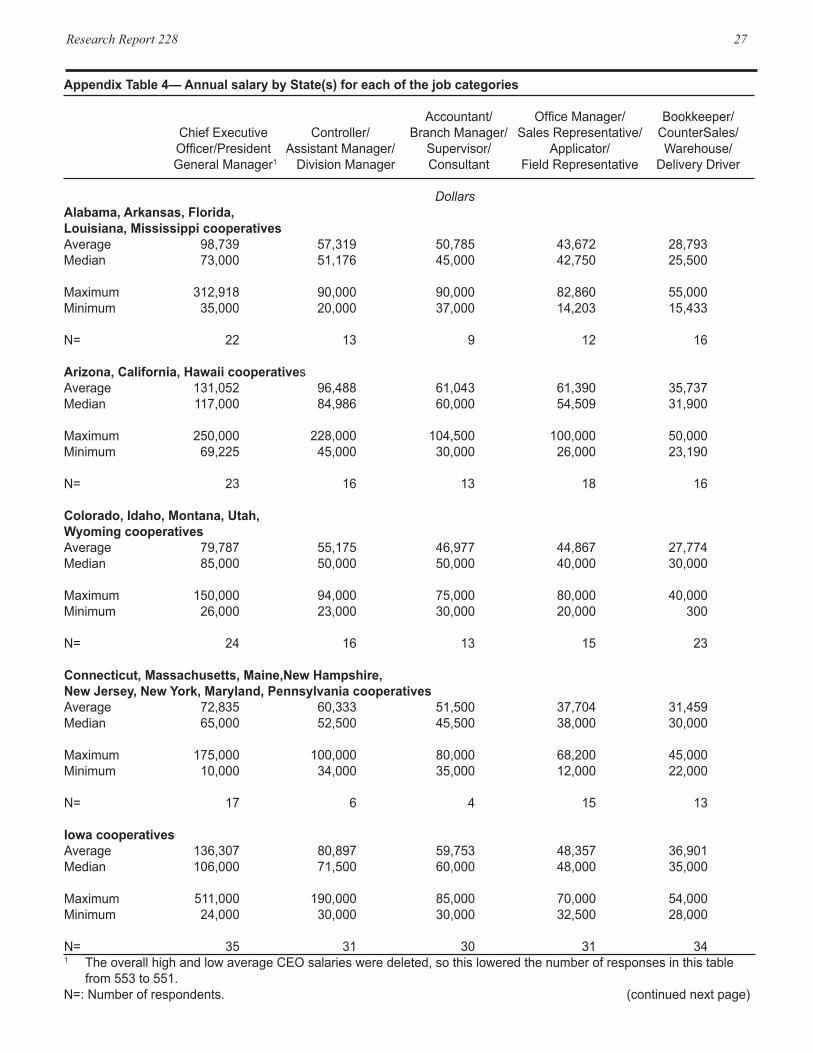
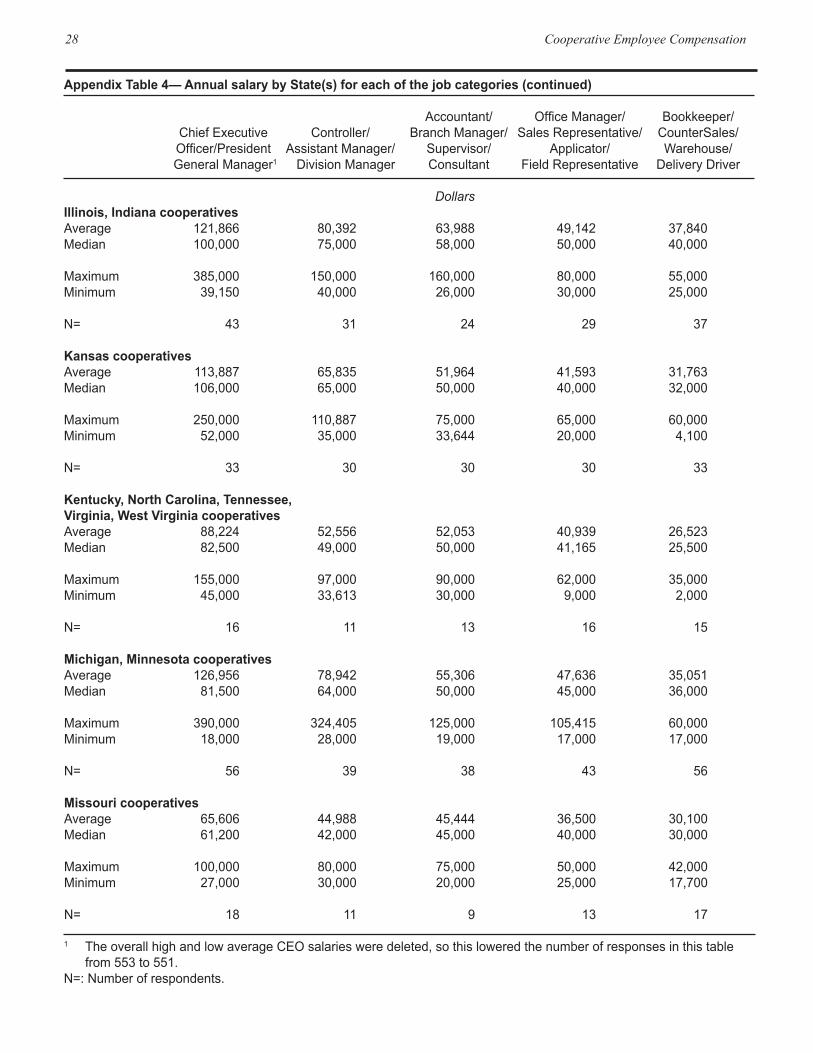
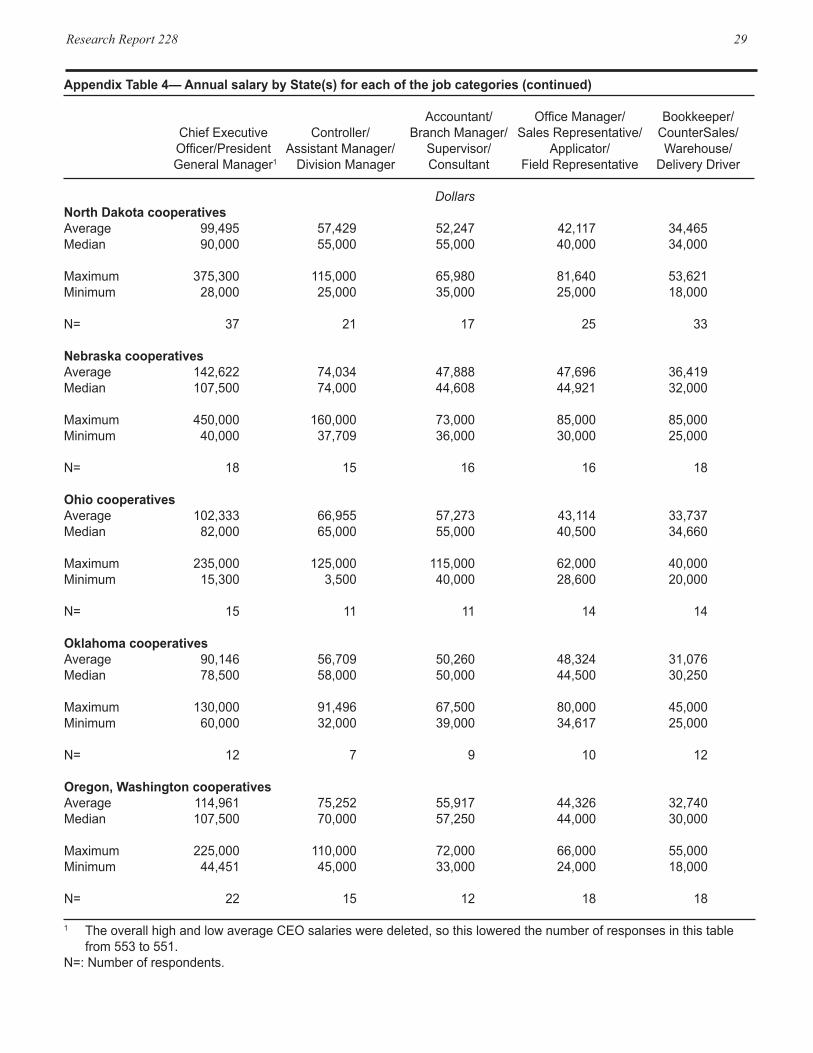
Annual Salary by State(s) Location or State salary information is presented in Table 13. Most State information was combined due to the lack of respondents, but there was a suf-ficient number of respondents in seven States to allow that information to be presented alone. From an article in USDA’s November/December 2012 Rural Cooperatives magazine, Iowa, Minnesota, and Nebraska each had at least 14 of the top 100 agri-cultural cooperatives. Having larger cooperatives in these States does not mean that they all responded to this study, but Iowa and Nebraska have the high-est maximum reported CEO salaries. It also appears that there were larger respondents from the West Coast and Midwest. Appendix Table 4 has addition-al salary information by State(s).
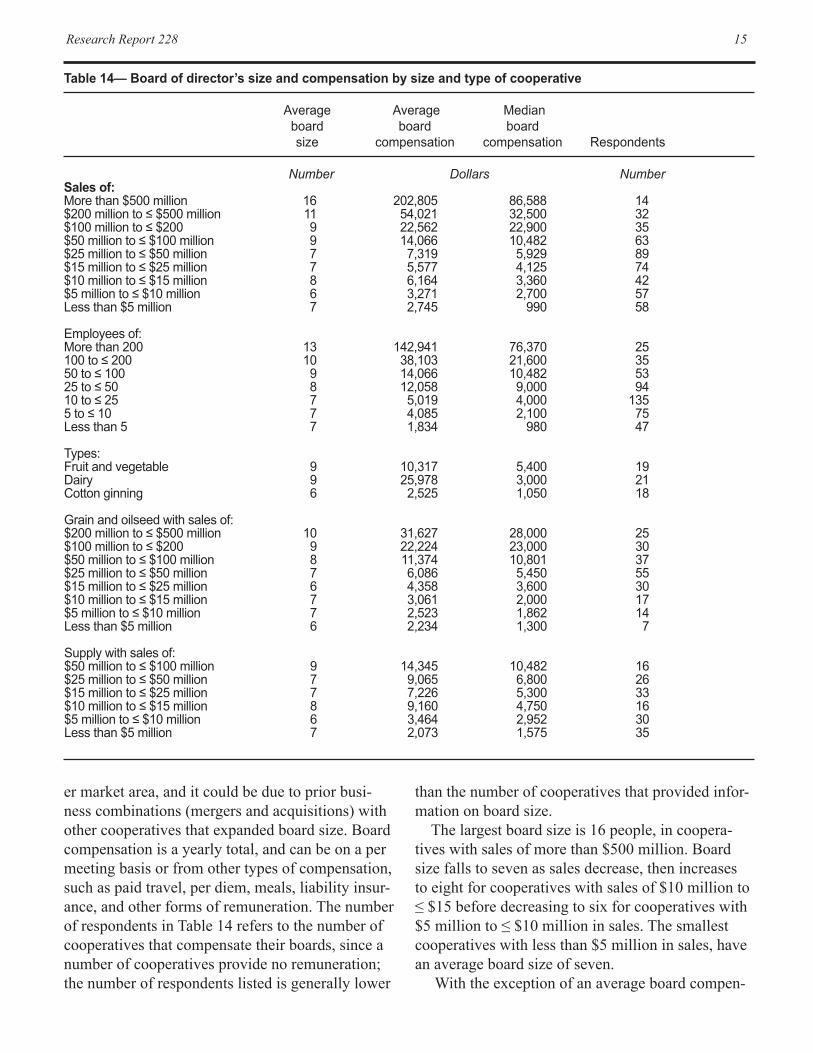
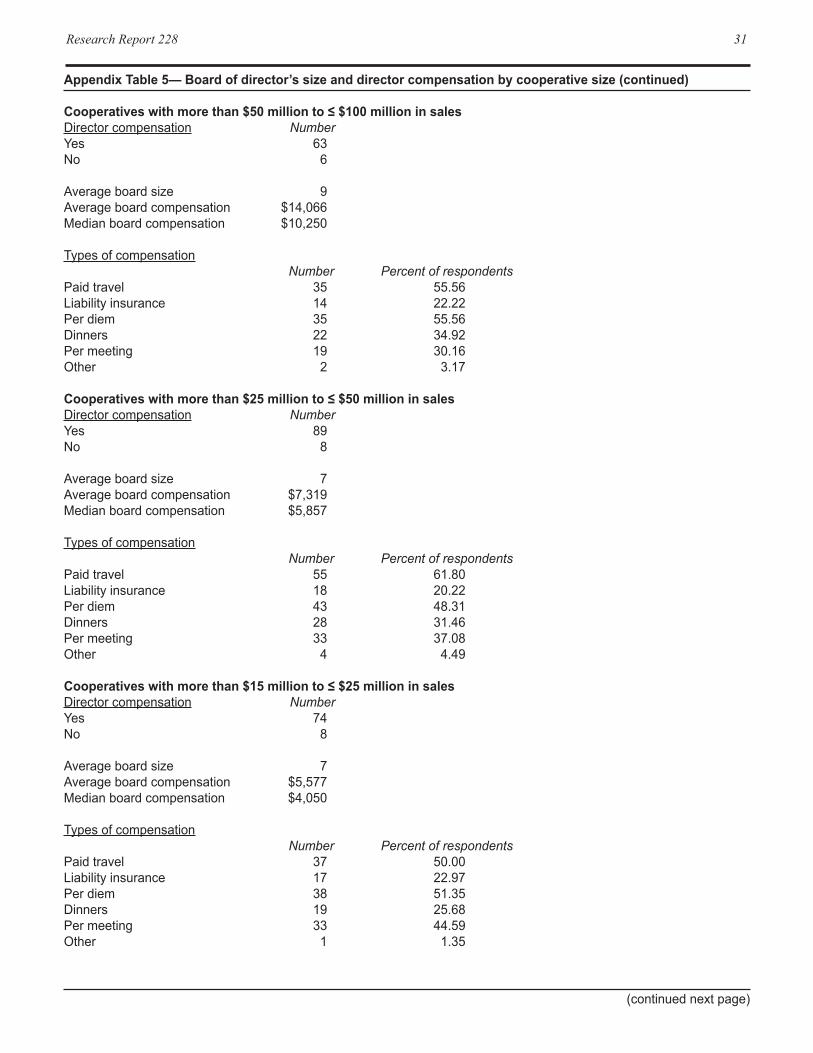
Board of Directors by Cooperative SizeInformation on cooperative boards by cooperative size and type is presented in Table 14 and Appendix Tables 5-7. Larger cooperatives have larger boards; this could be due to having operations over a broad-
have smaller average salaries. Fruit and vegetable cooperatives had 31 percent
of their respondents with sales between $25 million and $100 million, while 42 percent had sales of less than $5 million. About 39 percent of the fruit and vegetable respondents had less than five employees.
Ninety-six percent of the cotton-ginning coopera-tives had less than $25 million in sales. All of the cotton-ginning respondents had less than 25 em-ployees.
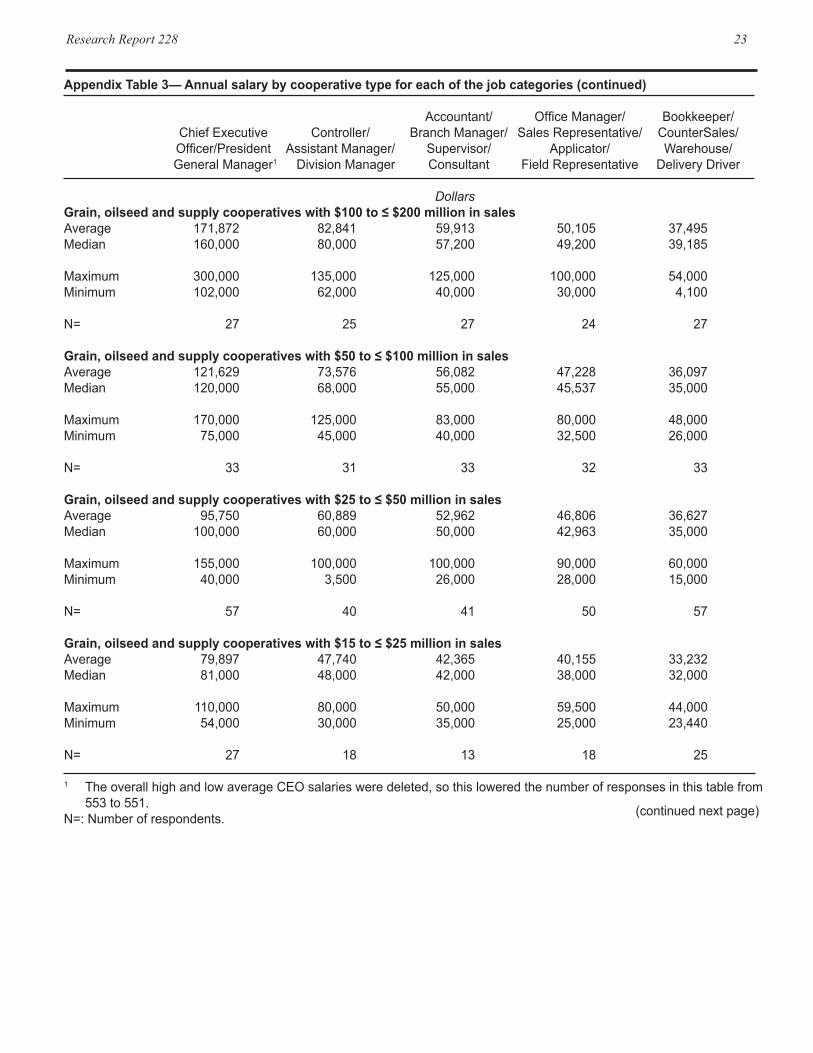
As stated in an earlier section, the vast major-ity of respondents were grain and oilseed or supply cooperatives, so their salary information can be fur-ther split by sales size in Table 12. Again, there is a fairly orderly drop in salaries as the cooperative size decreases, except in some unexpected maximum and minimum salaries. By type, there were more larger grain and oilseed respondents than supply respondents and more larger cooperatives of both of these types than the other three listed in this table. Appendix Table 3 has more salary information by cooperative type.
Table 13— Annual salary for the Chief Executive Officer/President/General Manager for cooperatives in different States Average Median Maximum Minimum salary1 salary salary salary Respondents
Dollars NumberStates: Alabama,Arkansas,Florida,Louisiana,Mississippi 98,739 73,000 312,918 35,000 22Arizona,California,Hawaii 131,052 117,000 250,000 69,225 23Colorado,Idaho,Montana,Utah,Wyoming 79,787 85,000 150,000 26,000 24Connecticut,Massachusetts,Maine,NewHampshire,NewJersey,NewYork,Maryland,Pennsylvania 72,835 65,000 175,000 10,000 17Iowa 136,307 106,000 511,000 24,000 35 Illinois,Indiana 121,866 100,000 385,000 39,150 43Kansas 113,887 106,000 250,000 52,000 33Kentucky,NorthCarolina,Tennessee,Virginia,WestVirginia 88,224 82,500 155,000 45,000 16Michigan,Minnesota 109,810 80,000 390,000 18,000 55Missouri 65,606 61,200 100,000 27,000 18 NorthDakota 99,495 90,000 375,300 28,000 37Nebraska 142,622 107,500 450,000 40,000 18Ohio 102,333 82,000 235,000 15,300 15Oklahoma 90,146 78,500 130,000 60,000 12Oregon,Washington 114,961 107,500 225,000 44,451 22
1 Theoverallhighandlowaveragesalariesweredeleted,sothisloweredthenumberofresponsesinthistablefrom553to551.
Research Report 228 15
er market area, and it could be due to prior busi-ness combinations (mergers and acquisitions) with other cooperatives that expanded board size. Board compensation is a yearly total, and can be on a per meeting basis or from other types of compensation, such as paid travel, per diem, meals, liability insur-ance, and other forms of remuneration. The number of respondents in Table 14 refers to the number of cooperatives that compensate their boards, since a number of cooperatives provide no remuneration; the number of respondents listed is generally lower
than the number of cooperatives that provided infor-mation on board size.
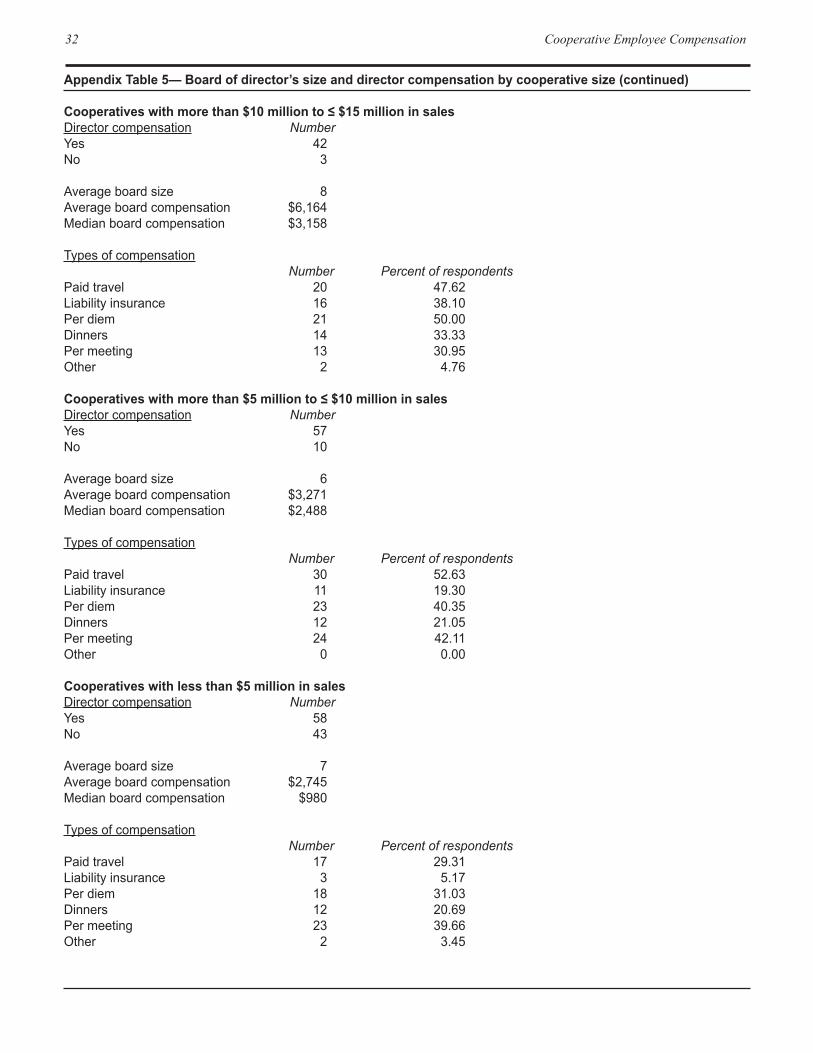
The largest board size is 16 people, in coopera-tives with sales of more than $500 million. Board size falls to seven as sales decrease, then increases to eight for cooperatives with sales of $10 million to ≤ $15 before decreasing to six for cooperatives with $5 million to ≤ $10 million in sales. The smallest cooperatives with less than $5 million in sales, have an average board size of seven.
With the exception of an average board compen-
Table 14— Board of director’s size and compensation by size and type of cooperative Average Average Median board board board size compensation compensation Respondents
Number Dollars NumberSales of: Morethan$500million 16 202,805 86,588 14$200millionto≤$500million 11 54,021 32,500 32$100millionto≤$200 9 22,562 22,900 35$50millionto≤$100million 9 14,066 10,482 63$25millionto≤$50million 7 7,319 5,929 89$15millionto≤$25million 7 5,577 4,125 74$10millionto≤$15million 8 6,164 3,360 42$5millionto≤$10million 6 3,271 2,700 57Lessthan$5million 7 2,745 990 58
Employeesof: Morethan200 13 142,941 76,370 25100to≤200 10 38,103 21,600 3550to≤100 9 14,066 10,482 5325to≤50 8 12,058 9,000 9410to≤25 7 5,019 4,000 1355to≤10 7 4,085 2,100 75Lessthan5 7 1,834 980 47
Types: Fruitandvegetable 9 10,317 5,400 19Dairy 9 25,978 3,000 21Cottonginning 6 2,525 1,050 18 Grainandoilseedwithsalesof: $200millionto≤$500million 10 31,627 28,000 25$100millionto≤$200 9 22,224 23,000 30$50millionto≤$100million 8 11,374 10,801 37$25millionto≤$50million 7 6,086 5,450 55$15millionto≤$25million 6 4,358 3,600 30$10millionto≤$15million 7 3,061 2,000 17$5millionto≤$10million 7 2,523 1,862 14Lessthan$5million 6 2,234 1,300 7 Supplywithsalesof: $50millionto≤$100million 9 14,345 10,482 16$25millionto≤$50million 7 9,065 6,800 26$15millionto≤$25million 7 7,226 5,300 33$10millionto≤$15million 8 9,160 4,750 16$5millionto≤$10million 6 3,464 2,952 30Lessthan$5million 7 2,073 1,575 35
16 Cooperative Employee Compensation
sation of $6,164 for cooperatives with sales of $10 million to ≤ $15 million, both average and median board compensation declines as cooperative sales decrease. Appendix Table 5 has additional informa-tion on board compensation by cooperative size.
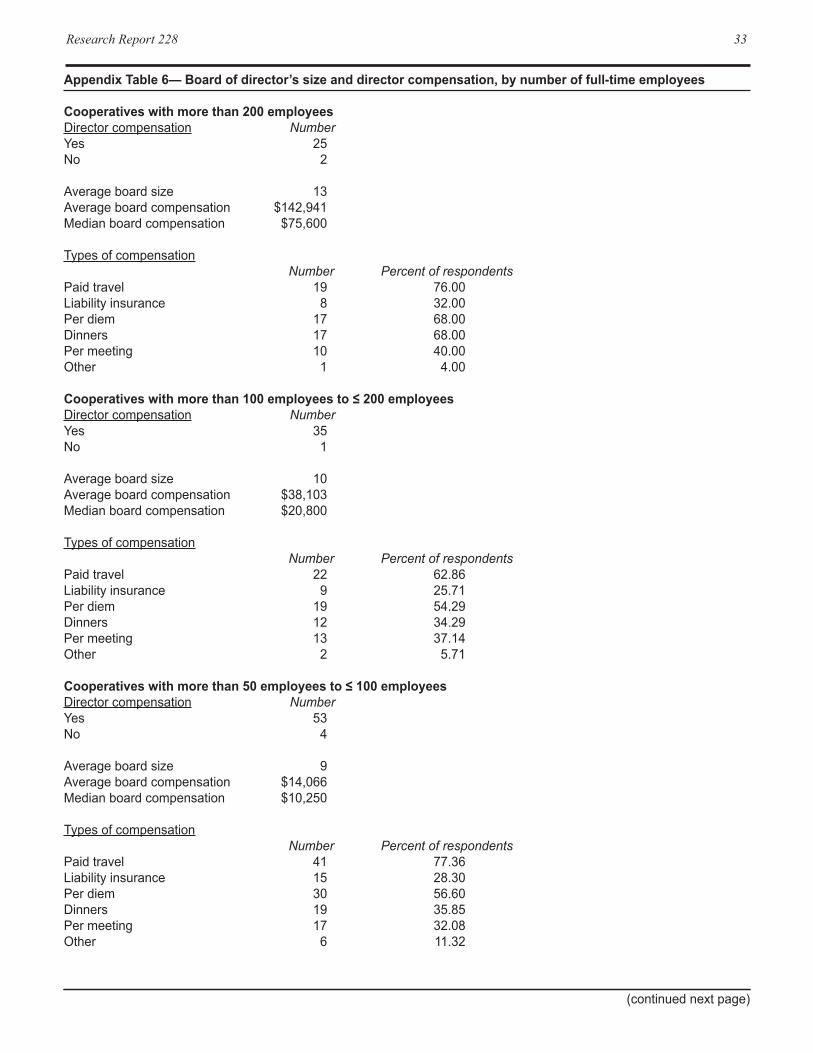
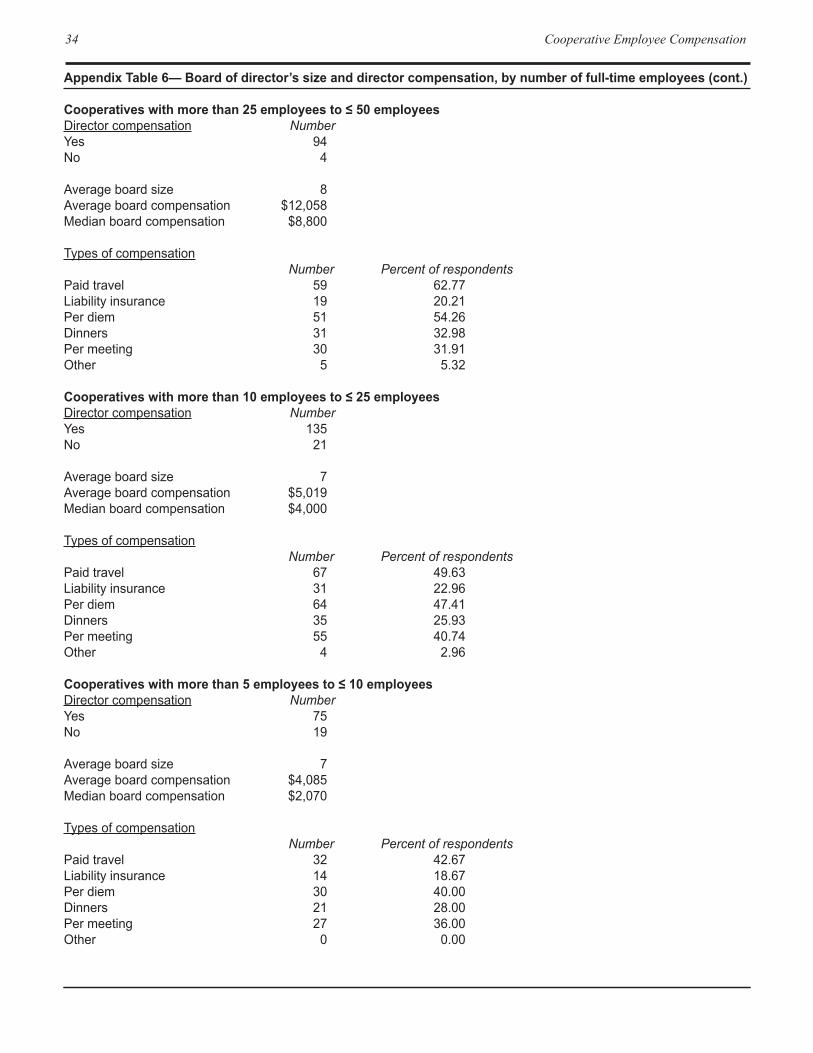
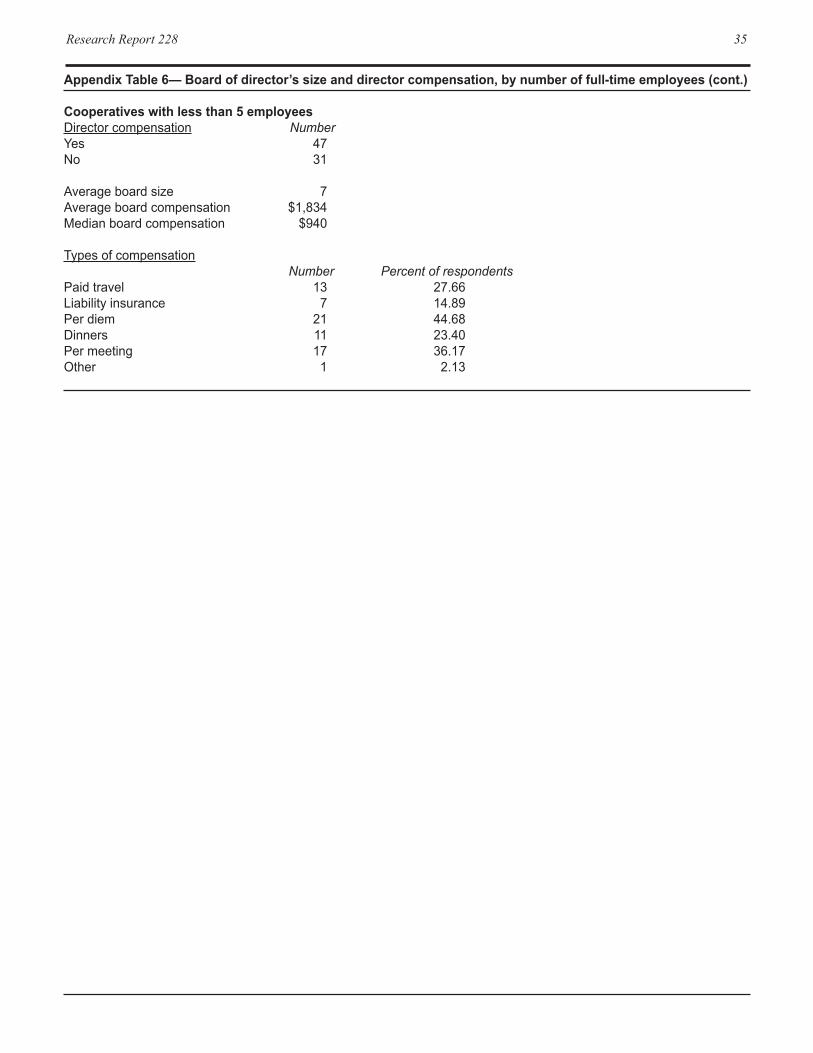
Board of Directors by Number of EmployeesBoard of director size and compensation by number of cooperative employees is presented in Table 14 and Appendix Table 6. Cooperatives with more than 200 employees have an average board size of 13, and the number of board members steadily declines to cooperatives with less than 5 employees, which have 7 on their boards. Average and median board compensation also is the highest for cooperatives with over 200 employees, and steadily declines as cooperatives have fewer employees.
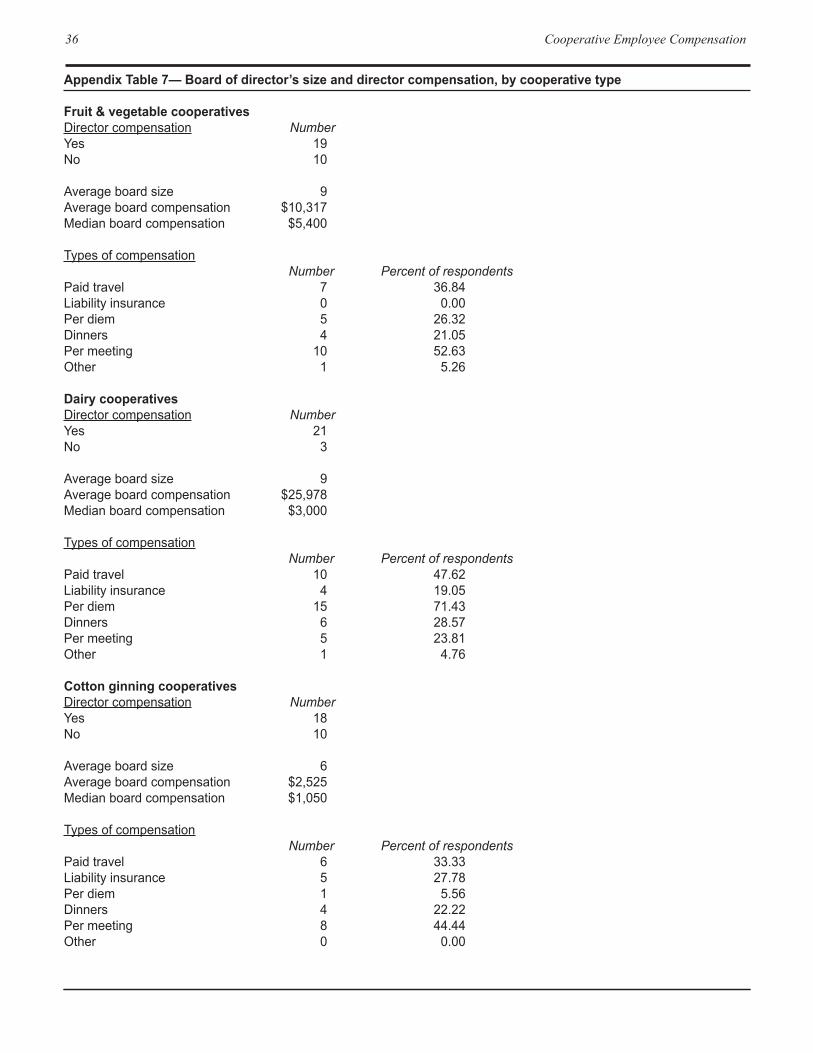
Board of Directors by Cooperative SizeFruit and vegetable and especially dairy respondent cooperatives appear to be larger in size compared to cotton ginning cooperatives when looking at aver-age board size and compensation (Table 14 and Appendix Table 7).
Larger grain and oilseed cooperatives have larger boards and higher compensation for their boards than smaller such cooperatives. This also holds true for supply cooperatives: their board compensation falls from an average of $14,345 for the largest cooperatives to $2,073 for the smallest, with the ex-ception of $10 million to ≤ $15 million respondents that have compensation of $9,160.
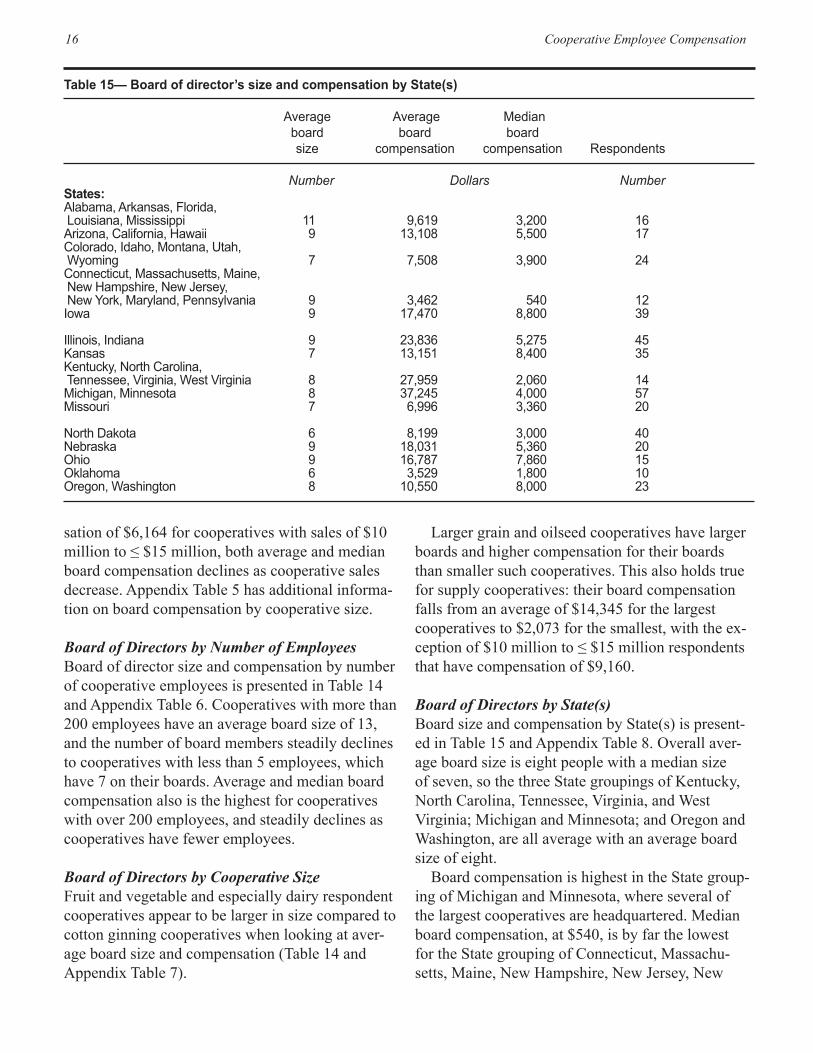
Board of Directors by State(s) Board size and compensation by State(s) is present-ed in Table 15 and Appendix Table 8. Overall aver-age board size is eight people with a median size of seven, so the three State groupings of Kentucky, North Carolina, Tennessee, Virginia, and West Virginia; Michigan and Minnesota; and Oregon and Washington, are all average with an average board size of eight.
Board compensation is highest in the State group-ing of Michigan and Minnesota, where several of the largest cooperatives are headquartered. Median board compensation, at $540, is by far the lowest for the State grouping of Connecticut, Massachu-setts, Maine, New Hampshire, New Jersey, New
Table 15— Board of director’s size and compensation by State(s) Average Average Median board board board size compensation compensation Respondents
Number Dollars NumberStates: Alabama,Arkansas,Florida,Louisiana,Mississippi 11 9,619 3,200 16Arizona,California,Hawaii 9 13,108 5,500 17Colorado,Idaho,Montana,Utah,Wyoming 7 7,508 3,900 24Connecticut,Massachusetts,Maine,NewHampshire,NewJersey,NewYork,Maryland,Pennsylvania 9 3,462 540 12Iowa 9 17,470 8,800 39 Illinois,Indiana 9 23,836 5,275 45Kansas 7 13,151 8,400 35Kentucky,NorthCarolina,Tennessee,Virginia,WestVirginia 8 27,959 2,060 14Michigan,Minnesota 8 37,245 4,000 57Missouri 7 6,996 3,360 20 NorthDakota 6 8,199 3,000 40Nebraska 9 18,031 5,360 20Ohio 9 16,787 7,860 15Oklahoma 6 3,529 1,800 10Oregon,Washington 8 10,550 8,000 23
Research Report 228 17
York, Maryland, and Pennsylvania. There were only 12 respondents in this grouping that includes 8 States, but if board compensation is considered on a per meeting basis, those board members would only receive $5 per meeting ($540/9 members/12 meet-ings per year).
BIBLIOGRAPHY
Ali, Sarah, Jacqueline E. Penn, and E. Eldon Ever-sull, Cooperative Statistics, 2011, U.S. Department of Agriculture, Rural Development, Service Report 72, October 2012.Rotan, Beverly L., Cooperative Employee Com-pensation, 1999, U.S. Department of Agriculture, Rural Business-Cooperative Service, RBS Research Report 189, October 2001.
18 Cooperative Employee Compensation
APPENDIX TABLES
Appendix Table 1—Annual salary by cooperative size for each of the job categories Accountant/ OfficeManager/ Bookkeeper/ ChiefExecutive Controller/ BranchManager/ SalesRepresentative/ CounterSales/ Officer/President AssistantManager/ Supervisor/ Applicator/ Warehouse/ GeneralManager1 DivisionManager Consultant FieldRepresentative DeliveryDriver
Dollars Cooperatives with more than $500 million in sales Average 366,600 139,700 66,679 57,373 39,630Median 255,000 109,500 70,000 51,000 35,660 Maximum 511,000 324,405 85,673 85,000 85,000Minimum 175,000 90,000 42,800 44,500 26,000 N= 10 12 11 12 12 Cooperatives with more than $200 million to ≤ $500 million in sales Average 234,045 115,298 70,591 58,912 37,334Median 242,000 112,500 64,200 55,000 37,000 Maximum 400,000 228,000 160,000 105,415 60,000Minimum 100,000 50,000 46,683 40,000 25,000 N= 25 26 26 25 25 Cooperatives with more than $100 million to ≤ $200 million in sales Average 167,541 83,420 59,700 51,080 36,627Median 160,000 80,000 57,850 49,400 38,000 Maximum 312,918 135,000 125,000 100,000 54,000Minimum 30,000 55,200 40,000 30,000 4,100 N= 33 29 32 29 33 Cooperatives with more than $50 million to ≤ $100 million in sales Average 137,729 81,747 57,110 49,855 35,346Median 130,000 77,000 55,000 48,000 35,000 Maximum 250,000 175,000 100,000 100,000 49,660Minimum 75,000 45,000 31,000 32,500 25,000 N= 55 50 52 49 49
1 TheoverallhighandlowaverageCEOsalariesweredeleted,sothisloweredthenumberofresponsesinthistablefrom553to551.
N=:Numberofrespondents.
Research Report 228 19
Appendix Table 1—Annual salary by cooperative size for each of the job categories (continued) Accountant/ OfficeManager/ Bookkeeper/ ChiefExecutive Controller/ BranchManager/ SalesRepresentative/ CounterSales/ Officer/President AssistantManager/ Supervisor/ Applicator/ Warehouse/ GeneralManager1 DivisionManager Consultant FieldRepresentative DeliveryDriver
Dollars
Cooperatives with more than $25 million to ≤ $50 million in sales Average 100,266 62,079 52,527 45,751 36,056Median 100,000 60,000 50,000 43,000 35,000 Maximum 210,000 105,000 100,000 90,000 60,000Minimum 40,000 3,500 26,000 26,000 15,000 N= 93 66 68 84 88 Cooperatives with more than $15 million to ≤ $25 million in sales Average 89,603 56,088 48,651 44,227 33,862Median 85,000 50,000 45,000 44,500 33,000 Maximum 154,200 129,800 115,000 73,000 55,000Minimum 40,000 30,000 29,000 25,000 18,000 N= 70 50 43 54 68 Cooperatives with more than $10 million to ≤ $15 million in sales Average 79,179 54,820 46,754 42,782 33,890Median 75,000 50,000 45,000 39,000 33,000 Maximum 147,000 111,028 80,000 90,000 55,000Minimum 38,000 30,000 20,000 20,000 13,000 N= 42 25 20 26 39 Cooperatives with more than $5 million to ≤ $10 million in sales Average 70,944 45,504 47,059 35,627 29,549Median 66,600 43,150 45,000 35,500 30,000 Maximum 186,780 87,972 90,000 62,000 52,000Minimum 39,150 23,000 19,000 14,203 15,433 N= 63 32 27 42 57 Cooperatives with less than $5 million in sales Average 59,021 50,013 40,488 36,570 28,255Median 52,000 45,000 38,000 34,300 27,484 Maximum 205,000 110,000 65,000 65,000 56,193Minimum 10,000 20,000 25,000 4,000 300 N= 83 25 13 40 62
1 TheoverallhighandlowaverageCEOsalariesweredeleted,sothisloweredthenumberofresponsesinthistablefrom553to551.
N=:Numberofrespondents.
20 Cooperative Employee Compensation
Appendix Table 2—Average annual salary by number of full-time employees for each of the job categories Accountant/ OfficeManager/ Bookkeeper/ ChiefExecutive Controller/ BranchManager/ SalesRepresentative/ CounterSales/ Officer/President AssistantManager/ Supervisor/ Applicator/ Warehouse/ GeneralManager1 DivisionManager Consultant FieldRepresentative DeliveryDriver
Dollars Cooperatives with more than 200 employees Average 325,783 132,491 67,183 60,422 36,388Median 267,000 113,000 61,700 53,500 34,660 Maximum 511,000 324,405 110,000 105,415 60,000Minimum 160,000 85,000 42,800 40,000 26,000 N= 20 22 22 22 22 Cooperatives with more than 100 employees to ≤ 200 employees Average 173,199 94,249 60,893 54,152 34,645Median 168,000 84,160 58,500 50,000 33,500 Maximum 300,000 175,000 160,000 100,000 45,000Minimum 95,000 50,000 33,000 30,000 23,190 N= 29 26 29 25 26 Cooperatives with more than 50 employees to ≤ 100 employees Average 155,754 86,648 60,047 48,506 32,115Median 140,000 80,000 57,000 49,200 33,500 Maximum 390,000 228,000 115,000 80,000 45,000Minimum 80,000 45,000 30,000 30,000 4,100 N= 48 45 47 46 46 Cooperatives with more than 25 employees to ≤ 50 employees Average 113,093 67,270 53,586 46,118 34,632Median 104,625 65,000 50,698 45,000 34,000 Maximum 300,000 125,000 125,000 100,000 85,000Minimum 30,000 28,000 19,000 17,000 19,000 N= 88 77 78 82 85
1 TheoverallhighandlowaverageCEOsalariesweredeleted,sothisloweredthenumberofresponsesinthistablefrom553to551.
N=:Numberofrespondents.
Research Report 228 21
Appendix Table 2—Average annual salary by number of full-time employees for each of the job categories (cont.) Accountant/ OfficeManager/ Bookkeeper/ ChiefExecutive Controller/ BranchManager/ SalesRepresentative/ CounterSales/ Officer/President AssistantManager/ Supervisor/ Applicator/ Warehouse/ GeneralManager1 DivisionManager Consultant FieldRepresentative DeliveryDriver
Dollars Cooperatives with more than 10 employees to ≤ 25 employees Average 87,982 54,851 49,295 43,493 34,648Median 80,250 53,400 50,000 42,160 34,000 Maximum 210,000 111,028 85,000 90,000 60,000Minimum 31,200 3,500 26,000 14,203 15,000 N= 138 97 89 114 133 Cooperatives with more than 5 employees to ≤ 10 employees Average 70,105 51,294 46,697 41,101 33,811Median 65,000 50,000 45,000 40,000 32,000 Maximum 175,000 110,000 75,000 90,000 56,193Minimum 30,000 20,000 30,000 18,000 20,000 N= 91 35 24 51 81 Cooperatives with less than 5 employees Average 57,066 46,083 30,333 30,378 27,845Median 46,500 35,000 31,000 30,000 28,520 Maximum 154,200 129,800 35,000 62,000 55,000Minimum 10,000 23,000 25,000 4,000 300 N= 60 13 3 21 40
1 TheoverallhighandlowaverageCEOsalariesweredeleted,sothisloweredthenumberofresponsesinthistablefrom553to551.
N=:Numberofrespondents.
22 Cooperative Employee Compensation
Appendix Table 3— Annual salary by cooperative type for each of the job categories Accountant/ OfficeManager/ Bookkeeper/ ChiefExecutive Controller/ BranchManager/ SalesRepresentative/ CounterSales/ Officer/President AssistantManager/ Supervisor/ Applicator/ Warehouse/ GeneralManager1 DivisionManager Consultant FieldRepresentative DeliveryDriver
Dollars Fruit & Vegetable Cooperatives Average 113,569 81,047 53,568 52,626 32,121Median 100,000 72,000 48,600 49,500 28,000 Maximum 250,000 175,000 80,000 100,000 55,000Minimum 10,000 52,000 33,000 30,000 23,190 N= 25 15 12 16 14 Dairy Cooperatives Average 95,545 107,167 63,155 43,895 33,529Median 75,344 104,000 58,000 45,000 33,229 Maximum 195,000 165,000 110,000 90,000 60,000Minimum 30,000 55,000 42,392 21,000 20,000 N= 17 6 9 16 16 Cotton Ginning Cooperatives Average 81,063 50,500 54,019 51,963 37,193Median 79,580 50,000 51,000 47,500 35,083 Maximum 150,000 60,000 75,000 80,000 55,000Minimum 41,000 40,000 45,000 30,000 12,500 N= 25 6 8 14 24 Grain, oilseed and supply cooperatives with $200 to ≤ $500 million in sales Average 228,728 105,954 66,403 56,425 36,439Median 244,450 99,500 61,000 55,000 37,360 Maximum 400,000 177,766 160,000 105,415 45,000Minimum 100,000 50,000 46,683 40,000 25,000 N= 19 20 20 19 19
1 TheoverallhighandlowaverageCEOsalariesweredeleted,sothisloweredthenumberofresponsesinthistablefrom553to551.
N=:Numberofrespondents.
Research Report 228 23
Appendix Table 3— Annual salary by cooperative type for each of the job categories (continued) Accountant/ OfficeManager/ Bookkeeper/ ChiefExecutive Controller/ BranchManager/ SalesRepresentative/ CounterSales/ Officer/President AssistantManager/ Supervisor/ Applicator/ Warehouse/ GeneralManager1 DivisionManager Consultant FieldRepresentative DeliveryDriver
Dollars Grain, oilseed and supply cooperatives with $100 to ≤ $200 million in salesAverage 171,872 82,841 59,913 50,105 37,495Median 160,000 80,000 57,200 49,200 39,185 Maximum 300,000 135,000 125,000 100,000 54,000Minimum 102,000 62,000 40,000 30,000 4,100 N= 27 25 27 24 27 Grain, oilseed and supply cooperatives with $50 to ≤ $100 million in salesAverage 121,629 73,576 56,082 47,228 36,097Median 120,000 68,000 55,000 45,537 35,000 Maximum 170,000 125,000 83,000 80,000 48,000Minimum 75,000 45,000 40,000 32,500 26,000 N= 33 31 33 32 33 Grain, oilseed and supply cooperatives with $25 to ≤ $50 million in salesAverage 95,750 60,889 52,962 46,806 36,627Median 100,000 60,000 50,000 42,963 35,000 Maximum 155,000 100,000 100,000 90,000 60,000Minimum 40,000 3,500 26,000 28,000 15,000 N= 57 40 41 50 57
Grain, oilseed and supply cooperatives with $15 to ≤ $25 million in salesAverage 79,897 47,740 42,365 40,155 33,232Median 81,000 48,000 42,000 38,000 32,000 Maximum 110,000 80,000 50,000 59,500 44,000Minimum 54,000 30,000 35,000 25,000 23,440 N= 27 18 13 18 25
1 TheoverallhighandlowaverageCEOsalariesweredeleted,sothisloweredthenumberofresponsesinthistablefrom553to551.
N=:Numberofrespondents. (continuednextpage)

24 Cooperative Employee Compensation
Appendix Table 3— Annual salary by cooperative type for each of the job categories (continued) Accountant/ OfficeManager/ Bookkeeper/ ChiefExecutive Controller/ BranchManager/ SalesRepresentative/ CounterSales/ Officer/President AssistantManager/ Supervisor/ Applicator/ Warehouse/ GeneralManager1 DivisionManager Consultant FieldRepresentative DeliveryDriver
Dollars Grain, oilseed and supply cooperatives with $10 to ≤ $15 million in salesAverage 68,300 48,031 40,571 41,923 33,379Median 70,000 49,000 40,000 38,000 32,968 Maximum 90,000 67,000 58,000 90,000 55,000Minimum 38,000 30,000 27,000 20,000 20,000 N= 20 13 7 13 18 Grain, oilseed and supply cooperatives with $5 to ≤ $10 million in salesAverage 56,693 48,171 42,635 33,335 28,424Median 52,000 42,000 39,500 31,680 28,000 Maximum 92,400 79,200 58,080 48,000 35,000Minimum 40,000 34,000 31,000 24,000 20,000 N= 15 7 8 11 15 Grain, oilseed and supply cooperatives with <$5 million in salesAverage 48,100 49,667 46,333 25,200 22,633Median 35,000 36,000 41,000 30,000 22,000 Maximum 130,000 80,000 60,000 32,000 30,000Minimum 12,000 33,000 38,000 4,000 17,000 N= 10 3 3 5 9
Supply cooperatives with $50 to ≤ $100 million in salesAverage 155,750 92,333 57,082 50,050 34,060Median 142,000 89,000 50,000 50,000 32,000 Maximum 240,000 150,000 100,000 75,000 49,660Minimum 100,000 55,000 31,000 35,000 25,000 N= 12 12 11 10 11
1 TheoverallhighandlowaverageCEOsalariesweredeleted,sothisloweredthenumberofresponsesinthistablefrom553to551.
N=:Numberofrespondents.
Research Report 228 25
Appendix Table 3— Annual salary by cooperative type for each of the job categories (continued) Accountant/ OfficeManager/ Bookkeeper/ ChiefExecutive Controller/ BranchManager/ SalesRepresentative/ CounterSales/ Officer/President AssistantManager/ Supervisor/ Applicator/ Warehouse/ GeneralManager1 DivisionManager Consultant FieldRepresentative DeliveryDriver
Dollars Supply cooperatives with $25 to ≤ $50 million in salesAverage 105,429 62,421 52,230 42,999 35,574Median 100,000 61,711 50,000 43,000 35,000 Maximum 200,000 100,000 72,000 55,000 53,000Minimum 70,000 34,000 30,000 26,000 21,000 N= 28 20 23 27 27 Supply cooperatives with $15 to ≤ $25 million in salesAverage 96,154 59,290 51,471 43,915 33,674Median 90,000 55,000 50,000 44,500 33,500 Maximum 150,000 125,000 115,000 66,000 48,000Minimum 62,000 38,000 29,000 25,000 18,000 N= 31 25 26 28 32 Supply cooperatives with $10 to ≤ $15 million in salesAverage 81,893 54,896 43,144 43,232 32,010Median 76,500 57,500 45,000 38,000 30,000 Maximum 125,000 74,000 55,000 79,000 47,500Minimum 50,000 35,000 20,000 25,000 20,000 N= 14 9 10 10 14
Supply cooperatives with $5 to ≤ $10 million in salesAverage 69,439 42,332 45,489 34,390 27,772Median 67,500 40,000 42,951 33,000 29,250 Maximum 140,000 64,000 90,000 62,000 39,580Minimum 39,150 23,000 19,000 14,203 15,433 N= 33 21 13 21 28
1 TheoverallhighandlowaverageCEOsalariesweredeleted,sothisloweredthenumberofresponsesinthistablefrom553to551.
N=:Numberofrespondents. (continuednextpage)
26 Cooperative Employee Compensation
Appendix Table 3— Annual salary by cooperative type for each of the job categories (continued) Accountant/ OfficeManager/ Bookkeeper/ ChiefExecutive Controller/ BranchManager/ SalesRepresentative/ CounterSales/ Officer/President AssistantManager/ Supervisor/ Applicator/ Warehouse/ GeneralManager1 DivisionManager Consultant FieldRepresentative DeliveryDriver
Dollars Supply cooperatives with <$5 million in salesAverage 49,198 41,795 33,070 36,179 27,976Median 47,750 40,000 35,000 34,300 26,902 Maximum 100,000 58,000 39,350 62,000 45,000Minimum 18,000 20,000 25,000 18,000 17,750 N= 38 13 5 14 32
1 TheoverallhighandlowaverageCEOsalariesweredeleted,sothisloweredthenumberofresponsesinthistablefrom553to551.
N=:Numberofrespondents.
Research Report 228 27
Appendix Table 4— Annual salary by State(s) for each of the job categories Accountant/ OfficeManager/ Bookkeeper/ ChiefExecutive Controller/ BranchManager/ SalesRepresentative/ CounterSales/ Officer/President AssistantManager/ Supervisor/ Applicator/ Warehouse/ GeneralManager1 DivisionManager Consultant FieldRepresentative DeliveryDriver
Dollars Alabama, Arkansas, Florida, Louisiana, Mississippi cooperatives Average 98,739 57,319 50,785 43,672 28,793Median 73,000 51,176 45,000 42,750 25,500 Maximum 312,918 90,000 90,000 82,860 55,000Minimum 35,000 20,000 37,000 14,203 15,433 N= 22 13 9 12 16 Arizona, California, Hawaii cooperatives Average 131,052 96,488 61,043 61,390 35,737Median 117,000 84,986 60,000 54,509 31,900 Maximum 250,000 228,000 104,500 100,000 50,000Minimum 69,225 45,000 30,000 26,000 23,190 N= 23 16 13 18 16 Colorado, Idaho, Montana, Utah,Wyoming cooperatives Average 79,787 55,175 46,977 44,867 27,774Median 85,000 50,000 50,000 40,000 30,000 Maximum 150,000 94,000 75,000 80,000 40,000Minimum 26,000 23,000 30,000 20,000 300 N= 24 16 13 15 23 Connecticut, Massachusetts, Maine,New Hampshire, New Jersey, New York, Maryland, Pennsylvania cooperatives Average 72,835 60,333 51,500 37,704 31,459Median 65,000 52,500 45,500 38,000 30,000 Maximum 175,000 100,000 80,000 68,200 45,000Minimum 10,000 34,000 35,000 12,000 22,000 N= 17 6 4 15 13
Iowa cooperatives Average 136,307 80,897 59,753 48,357 36,901Median 106,000 71,500 60,000 48,000 35,000 Maximum 511,000 190,000 85,000 70,000 54,000Minimum 24,000 30,000 30,000 32,500 28,000 N= 35 31 30 31 341 TheoverallhighandlowaverageCEOsalariesweredeleted,sothisloweredthenumberofresponsesinthistable from553to551.N=:Numberofrespondents. (continuednextpage)
28 Cooperative Employee Compensation
Appendix Table 4— Annual salary by State(s) for each of the job categories (continued) Accountant/ OfficeManager/ Bookkeeper/ ChiefExecutive Controller/ BranchManager/ SalesRepresentative/ CounterSales/ Officer/President AssistantManager/ Supervisor/ Applicator/ Warehouse/ GeneralManager1 DivisionManager Consultant FieldRepresentative DeliveryDriver
Dollars Illinois, Indiana cooperatives Average 121,866 80,392 63,988 49,142 37,840Median 100,000 75,000 58,000 50,000 40,000 Maximum 385,000 150,000 160,000 80,000 55,000Minimum 39,150 40,000 26,000 30,000 25,000 N= 43 31 24 29 37 Kansas cooperatives Average 113,887 65,835 51,964 41,593 31,763Median 106,000 65,000 50,000 40,000 32,000 Maximum 250,000 110,887 75,000 65,000 60,000Minimum 52,000 35,000 33,644 20,000 4,100 N= 33 30 30 30 33 Kentucky, North Carolina, Tennessee,Virginia, West Virginia cooperatives Average 88,224 52,556 52,053 40,939 26,523Median 82,500 49,000 50,000 41,165 25,500 Maximum 155,000 97,000 90,000 62,000 35,000Minimum 45,000 33,613 30,000 9,000 2,000 N= 16 11 13 16 15 Michigan, Minnesota cooperatives Average 126,956 78,942 55,306 47,636 35,051Median 81,500 64,000 50,000 45,000 36,000 Maximum 390,000 324,405 125,000 105,415 60,000Minimum 18,000 28,000 19,000 17,000 17,000 N= 56 39 38 43 56
Missouri cooperatives Average 65,606 44,988 45,444 36,500 30,100Median 61,200 42,000 45,000 40,000 30,000 Maximum 100,000 80,000 75,000 50,000 42,000Minimum 27,000 30,000 20,000 25,000 17,700 N= 18 11 9 13 17
1 TheoverallhighandlowaverageCEOsalariesweredeleted,sothisloweredthenumberofresponsesinthistable from553to551.N=:Numberofrespondents.
Research Report 228 29
Appendix Table 4— Annual salary by State(s) for each of the job categories (continued) Accountant/ OfficeManager/ Bookkeeper/ ChiefExecutive Controller/ BranchManager/ SalesRepresentative/ CounterSales/ Officer/President AssistantManager/ Supervisor/ Applicator/ Warehouse/ GeneralManager1 DivisionManager Consultant FieldRepresentative DeliveryDriver
Dollars North Dakota cooperatives Average 99,495 57,429 52,247 42,117 34,465Median 90,000 55,000 55,000 40,000 34,000 Maximum 375,300 115,000 65,980 81,640 53,621Minimum 28,000 25,000 35,000 25,000 18,000 N= 37 21 17 25 33 Nebraska cooperatives Average 142,622 74,034 47,888 47,696 36,419Median 107,500 74,000 44,608 44,921 32,000 Maximum 450,000 160,000 73,000 85,000 85,000Minimum 40,000 37,709 36,000 30,000 25,000 N= 18 15 16 16 18 Ohio cooperatives Average 102,333 66,955 57,273 43,114 33,737Median 82,000 65,000 55,000 40,500 34,660 Maximum 235,000 125,000 115,000 62,000 40,000Minimum 15,300 3,500 40,000 28,600 20,000 N= 15 11 11 14 14
Oklahoma cooperatives Average 90,146 56,709 50,260 48,324 31,076Median 78,500 58,000 50,000 44,500 30,250 Maximum 130,000 91,496 67,500 80,000 45,000Minimum 60,000 32,000 39,000 34,617 25,000 N= 12 7 9 10 12 Oregon, Washington cooperatives Average 114,961 75,252 55,917 44,326 32,740Median 107,500 70,000 57,250 44,000 30,000 Maximum 225,000 110,000 72,000 66,000 55,000Minimum 44,451 45,000 33,000 24,000 18,000 N= 22 15 12 18 18
1 TheoverallhighandlowaverageCEOsalariesweredeleted,sothisloweredthenumberofresponsesinthistable from553to551.N=:Numberofrespondents.
30 Cooperative Employee Compensation
Appendix Table 5— Board of director’s size and director compensation by cooperative size Cooperatives with more than $500 million in sales Directorcompensation NumberYes 14No 2 Averageboardsize 16Averageboardcompensation $202,805Medianboardcompensation $85,775 Typesofcompensationn Number Percent of respondentsPaidtravel 11 78.57Liabilityinsurance 3 21.43Perdiem 10 71.43Dinners 8 57.14Permeeting 5 35.71Other 1 7.14
Cooperatives with more than $200 million to ≤ $500 million in sales Directorcompensation NumberYes 32No 1 Averageboardsize 11Averageboardcompensation $54,021Medianboardcompensation $30,000 Typesofcompensation Number Percent of respondentsPaidtravel 23 71.88Liabilityinsurance 9 28.13Perdiem 19 59.38Dinners 18 56.25Permeeting 9 28.13Other 5 15.63
Cooperatives with more than $100 million to ≤ $200 million in sales Directorcompensation NumberYes 35No 1 Averageboardsize 9Averageboardcompensation $22,562Medianboardcompensation $22,800 Typesofcompensation Number Percent of respondentsPaidtravel 25 71.43Liabilityinsurance 12 34.29Perdiem 25 71.43Dinners 13 37.14Permeeting 10 28.57Other 2 5.71
Research Report 228 31
Appendix Table 5— Board of director’s size and director compensation by cooperative size (continued) Cooperatives with more than $50 million to ≤ $100 million in sales Directorcompensation NumberYes 63No 6 Averageboardsize 9Averageboardcompensation $14,066Medianboardcompensation $10,250 Typesofcompensation Number Percent of respondentsPaidtravel 35 55.56Liabilityinsurance 14 22.22Perdiem 35 55.56Dinners 22 34.92Permeeting 19 30.16Other 2 3.17
Cooperatives with more than $25 million to ≤ $50 million in sales Directorcompensation NumberYes 89No 8 Averageboardsize 7Averageboardcompensation $7,319Medianboardcompensation $5,857 Typesofcompensation Number Percent of respondentsPaidtravel 55 61.80Liabilityinsurance 18 20.22Perdiem 43 48.31Dinners 28 31.46Permeeting 33 37.08Other 4 4.49
Cooperatives with more than $15 million to ≤ $25 million in sales Directorcompensation NumberYes 74No 8 Averageboardsize 7Averageboardcompensation $5,577Medianboardcompensation $4,050 Typesofcompensation Number Percent of respondentsPaidtravel 37 50.00Liabilityinsurance 17 22.97Perdiem 38 51.35Dinners 19 25.68Permeeting 33 44.59Other 1 1.35
(continuednextpage)
32 Cooperative Employee Compensation
Appendix Table 5— Board of director’s size and director compensation by cooperative size (continued) Cooperatives with more than $10 million to ≤ $15 million in sales Directorcompensation NumberYes 42No 3 Averageboardsize 8Averageboardcompensation $6,164Medianboardcompensation $3,158 Typesofcompensation Number Percent of respondentsPaidtravel 20 47.62Liabilityinsurance 16 38.10Perdiem 21 50.00Dinners 14 33.33Permeeting 13 30.95Other 2 4.76
Cooperatives with more than $5 million to ≤ $10 million in sales Directorcompensation NumberYes 57No 10 Averageboardsize 6Averageboardcompensation $3,271Medianboardcompensation $2,488 Typesofcompensation Number Percent of respondentsPaidtravel 30 52.63Liabilityinsurance 11 19.30Perdiem 23 40.35Dinners 12 21.05Permeeting 24 42.11Other 0 0.00
Cooperatives with less than $5 million in sales Directorcompensation NumberYes 58No 43 Averageboardsize 7Averageboardcompensation $2,745Medianboardcompensation $980 Typesofcompensation Number Percent of respondentsPaidtravel 17 29.31Liabilityinsurance 3 5.17Perdiem 18 31.03Dinners 12 20.69Permeeting 23 39.66Other 2 3.45
Research Report 228 33
Appendix Table 6— Board of director’s size and director compensation, by number of full-time employees Cooperatives with more than 200 employees Directorcompensation NumberYes 25No 2 Averageboardsize 13Averageboardcompensation $142,941Medianboardcompensation $75,600 Typesofcompensation Number Percent of respondentsPaidtravel 19 76.00Liabilityinsurance 8 32.00Perdiem 17 68.00Dinners 17 68.00Permeeting 10 40.00Other 1 4.00
Cooperatives with more than 100 employees to ≤ 200 employees Directorcompensation NumberYes 35No 1 Averageboardsize 10Averageboardcompensation $38,103Medianboardcompensation $20,800 Typesofcompensation Number Percent of respondentsPaidtravel 22 62.86Liabilityinsurance 9 25.71Perdiem 19 54.29Dinners 12 34.29Permeeting 13 37.14Other 2 5.71
Cooperatives with more than 50 employees to ≤ 100 employees Directorcompensation NumberYes 53No 4 Averageboardsize 9Averageboardcompensation $14,066Medianboardcompensation $10,250 Typesofcompensation Number Percent of respondentsPaidtravel 41 77.36Liabilityinsurance 15 28.30Perdiem 30 56.60Dinners 19 35.85Permeeting 17 32.08Other 6 11.32
(continuednextpage)
34 Cooperative Employee Compensation
Appendix Table 6— Board of director’s size and director compensation, by number of full-time employees (cont.) Cooperatives with more than 25 employees to ≤ 50 employees Directorcompensation NumberYes 94No 4 Averageboardsize 8Averageboardcompensation $12,058Medianboardcompensation $8,800 Typesofcompensation Number Percent of respondentsPaidtravel 59 62.77Liabilityinsurance 19 20.21Perdiem 51 54.26Dinners 31 32.98Permeeting 30 31.91Other 5 5.32 Cooperatives with more than 10 employees to ≤ 25 employees Directorcompensation NumberYes 135No 21 Averageboardsize 7Averageboardcompensation $5,019Medianboardcompensation $4,000 Typesofcompensation Number Percent of respondentsPaidtravel 67 49.63Liabilityinsurance 31 22.96Perdiem 64 47.41Dinners 35 25.93Permeeting 55 40.74Other 4 2.96 Cooperatives with more than 5 employees to ≤ 10 employees Directorcompensation NumberYes 75No 19 Averageboardsize 7Averageboardcompensation $4,085Medianboardcompensation $2,070 Typesofcompensation Number Percent of respondentsPaidtravel 32 42.67Liabilityinsurance 14 18.67Perdiem 30 40.00Dinners 21 28.00Permeeting 27 36.00Other 0 0.00
Research Report 228 35
Appendix Table 6— Board of director’s size and director compensation, by number of full-time employees (cont.) Cooperatives with less than 5 employees Directorcompensation NumberYes 47No 31 Averageboardsize 7Averageboardcompensation $1,834Medianboardcompensation $940 Typesofcompensation Number Percent of respondentsPaidtravel 13 27.66Liabilityinsurance 7 14.89Perdiem 21 44.68Dinners 11 23.40Permeeting 17 36.17Other 1 2.13
36 Cooperative Employee Compensation
Appendix Table 7— Board of director’s size and director compensation, by cooperative type
Fruit & vegetable cooperatives Directorcompensation NumberYes 19 No 10 Averageboardsize 9 Averageboardcompensation $10,317 Medianboardcompensation $5,400 Typesofcompensation Number Percent of respondentsPaidtravel 7 36.84Liabilityinsurance 0 0.00Perdiem 5 26.32Dinners 4 21.05Permeeting 10 52.63Other 1 5.26 Dairy cooperatives Directorcompensation NumberYes 21 No 3 Averageboardsize 9 Averageboardcompensation $25,978 Medianboardcompensation $3,000 Typesofcompensation Number Percent of respondentsPaidtravel 10 47.62Liabilityinsurance 4 19.05Perdiem 15 71.43Dinners 6 28.57Permeeting 5 23.81Other 1 4.76 Cotton ginning cooperatives Directorcompensation NumberYes 18 No 10 Averageboardsize 6 Averageboardcompensation $2,525 Medianboardcompensation $1,050 Typesofcompensation Number Percent of respondentsPaidtravel 6 33.33Liabilityinsurance 5 27.78Perdiem 1 5.56Dinners 4 22.22Permeeting 8 44.44Other 0 0.00
Research Report 228 37
Appendix Table 7— Board of director’s size and director compensation, by cooperative type (continued) Grain, oilseed, and supply cooperatives with $200 to ≤ $500 million in sales Directorcompensation NumberYes 25No 1 Averageboardsize 10Averageboardcompensation $31,627Medianboardcompensation $28,000 Typesofcompensation Number Percent of respondentsPaidtravel 17 68.00Liabilityinsurance 7 28.00Perdiem 15 60.00Dinners 13 52.00Permeeting 6 24.00Other 5 20.00 Grain, oilseed, and supply cooperatives with $100 to ≤ $200 million in sales Directorcompensation NumberYes 30No 0 Averageboardsize 9Averageboardcompensation $22,224Medianboardcompensation $23,000 Typesofcompensation Number Percent of respondentsPaidtravel 22 73.33Liabilityinsurance 9 30.00Perdiem 22 73.33Dinners 11 36.67Permeeting 8 26.67Other 2 6.67 Grain, oilseed, and supply cooperatives with $50 to ≤ $100 million in sales Directorcompensation NumberYes 37No 2 Averageboardsize 8Averageboardcompensation $11,374Medianboardcompensation $10,801 Typesofcompensation Number Percent of respondentsPaidtravel 22 59.46Liabilityinsurance 10 27.03Perdiem 24 64.86Dinners 17 45.95Permeeting 8 21.62Other 2 5.41
(continuednextpage)
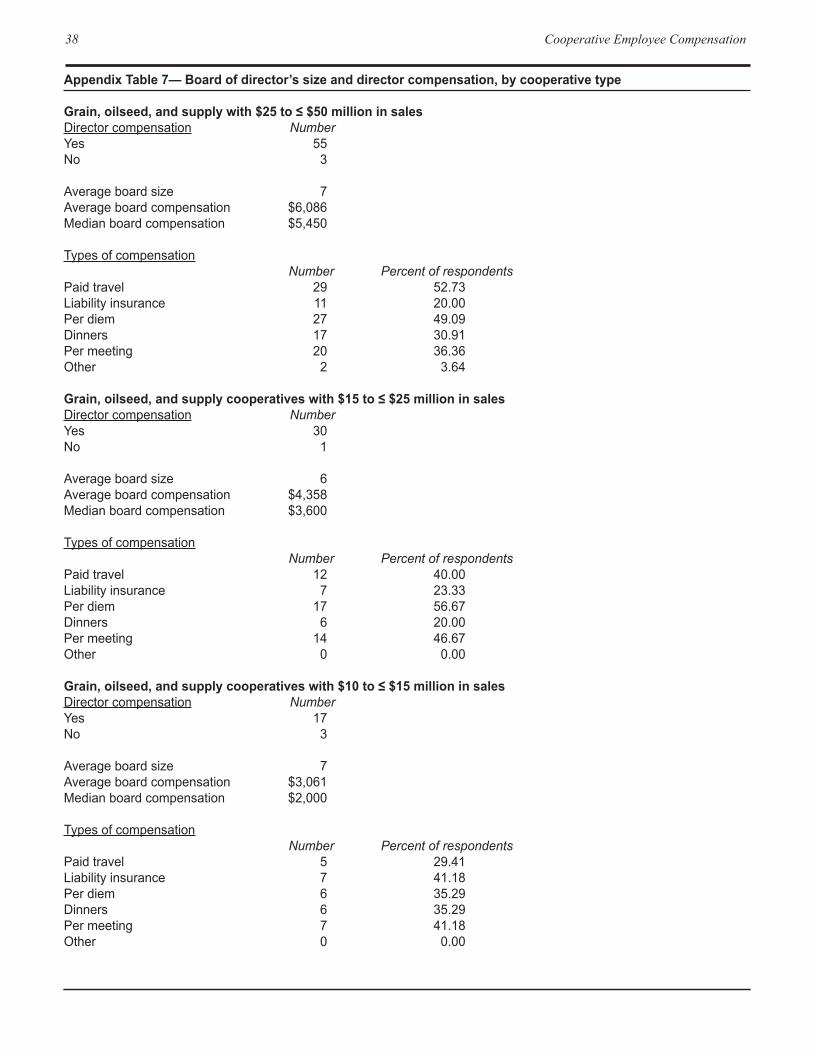
38 Cooperative Employee Compensation
Appendix Table 7— Board of director’s size and director compensation, by cooperative type
Grain, oilseed, and supply with $25 to ≤ $50 million in sales Directorcompensation NumberYes 55No 3 Averageboardsize 7Averageboardcompensation $6,086Medianboardcompensation $5,450 Typesofcompensation Number Percent of respondentsPaidtravel 29 52.73Liabilityinsurance 11 20.00Perdiem 27 49.09Dinners 17 30.91Permeeting 20 36.36Other 2 3.64 Grain, oilseed, and supply cooperatives with $15 to ≤ $25 million in sales Directorcompensation NumberYes 30No 1 Averageboardsize 6Averageboardcompensation $4,358Medianboardcompensation $3,600 Typesofcompensation Number Percent of respondentsPaidtravel 12 40.00Liabilityinsurance 7 23.33Perdiem 17 56.67Dinners 6 20.00Permeeting 14 46.67Other 0 0.00 Grain, oilseed, and supply cooperatives with $10 to ≤ $15 million in sales Directorcompensation NumberYes 17No 3 Averageboardsize 7Averageboardcompensation $3,061Medianboardcompensation $2,000 Typesofcompensation Number Percent of respondentsPaidtravel 5 29.41Liabilityinsurance 7 41.18Perdiem 6 35.29Dinners 6 35.29Permeeting 7 41.18Other 0 0.00
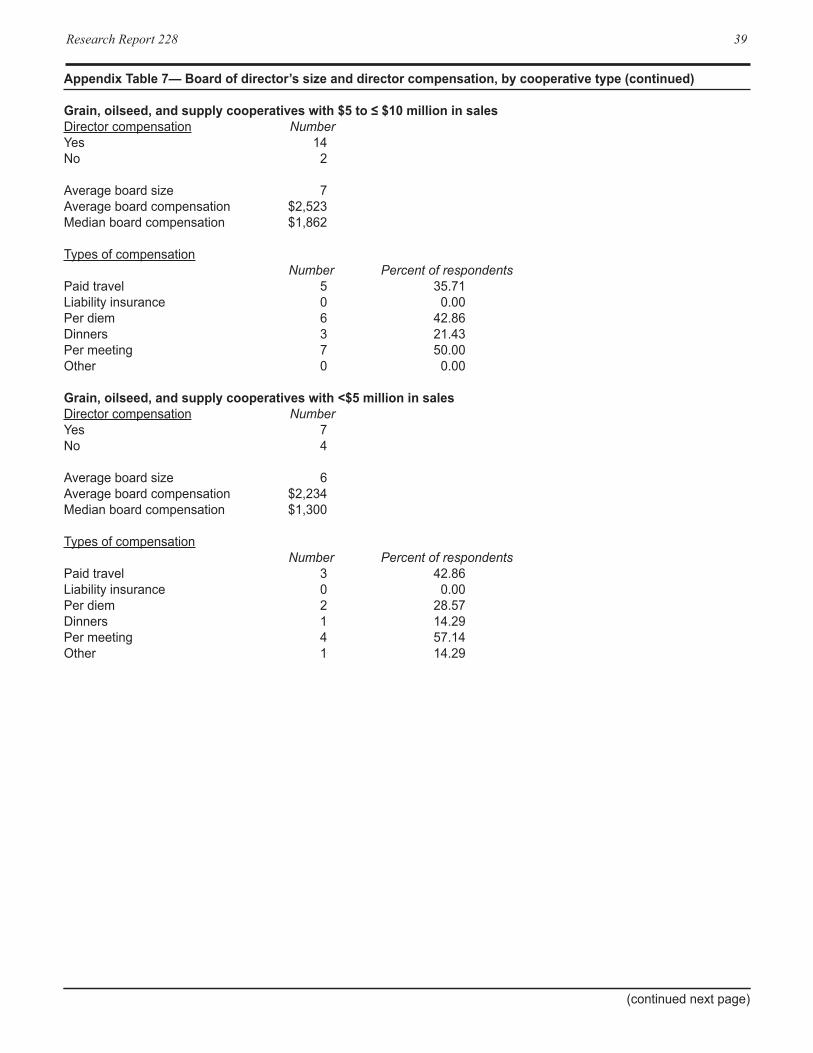
Research Report 228 39
Appendix Table 7— Board of director’s size and director compensation, by cooperative type (continued) Grain, oilseed, and supply cooperatives with $5 to ≤ $10 million in sales Directorcompensation NumberYes 14No 2 Averageboardsize 7Averageboardcompensation $2,523Medianboardcompensation $1,862 Typesofcompensation Number Percent of respondentsPaidtravel 5 35.71Liabilityinsurance 0 0.00Perdiem 6 42.86Dinners 3 21.43Permeeting 7 50.00Other 0 0.00 Grain, oilseed, and supply cooperatives with <$5 million in sales Directorcompensation NumberYes 7No 4 Averageboardsize 6Averageboardcompensation $2,234Medianboardcompensation $1,300 Typesofcompensation Number Percent of respondentsPaidtravel 3 42.86Liabilityinsurance 0 0.00Perdiem 2 28.57Dinners 1 14.29Permeeting 4 57.14Other 1 14.29
(continuednextpage)
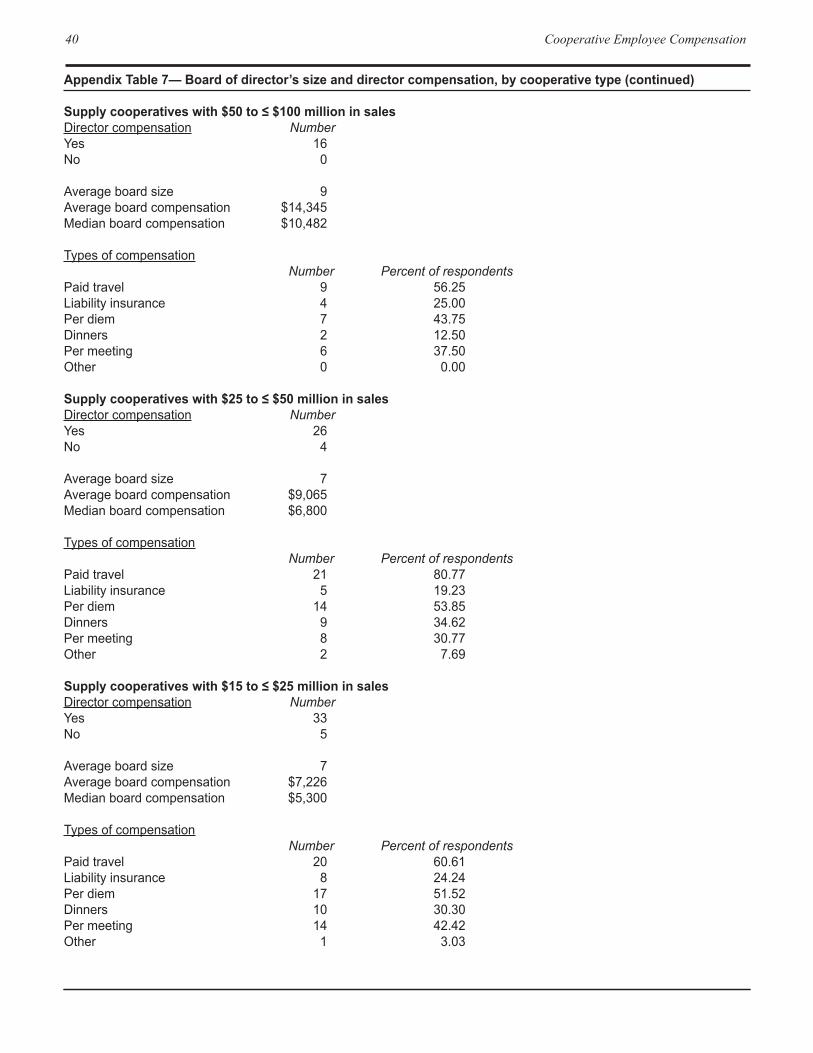
40 Cooperative Employee Compensation
Appendix Table 7— Board of director’s size and director compensation, by cooperative type (continued) Supply cooperatives with $50 to ≤ $100 million in sales Directorcompensation NumberYes 16No 0 Averageboardsize 9Averageboardcompensation $14,345Medianboardcompensation $10,482 Typesofcompensation Number Percent of respondentsPaidtravel 9 56.25Liabilityinsurance 4 25.00Perdiem 7 43.75Dinners 2 12.50Permeeting 6 37.50Other 0 0.00 Supply cooperatives with $25 to ≤ $50 million in sales Directorcompensation NumberYes 26No 4 Averageboardsize 7Averageboardcompensation $9,065Medianboardcompensation $6,800 Typesofcompensation Number Percent of respondentsPaidtravel 21 80.77Liabilityinsurance 5 19.23Perdiem 14 53.85Dinners 9 34.62Permeeting 8 30.77Other 2 7.69 Supply cooperatives with $15 to ≤ $25 million in sales Directorcompensation NumberYes 33No 5 Averageboardsize 7Averageboardcompensation $7,226Medianboardcompensation $5,300 Typesofcompensation Number Percent of respondentsPaidtravel 20 60.61Liabilityinsurance 8 24.24Perdiem 17 51.52Dinners 10 30.30Permeeting 14 42.42Other 1 3.03
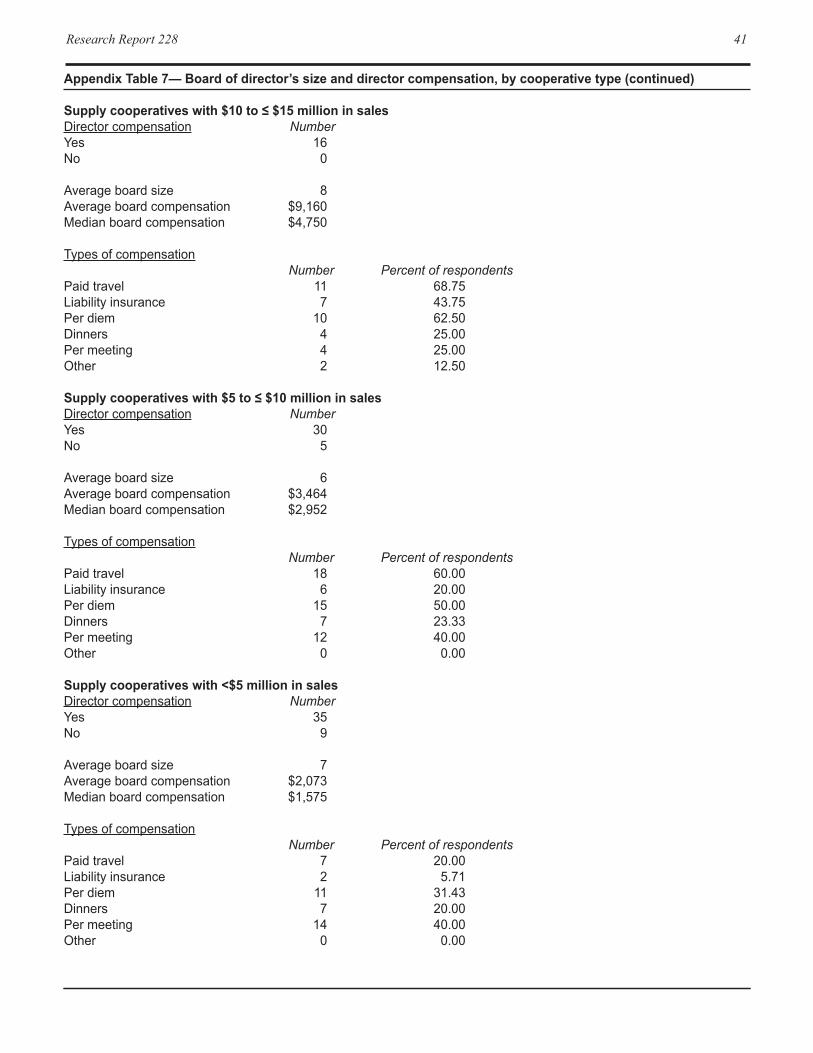
Research Report 228 41
Appendix Table 7— Board of director’s size and director compensation, by cooperative type (continued) Supply cooperatives with $10 to ≤ $15 million in sales Directorcompensation NumberYes 16No 0 Averageboardsize 8Averageboardcompensation $9,160Medianboardcompensation $4,750 Typesofcompensation Number Percent of respondentsPaidtravel 11 68.75Liabilityinsurance 7 43.75Perdiem 10 62.50Dinners 4 25.00Permeeting 4 25.00Other 2 12.50 Supply cooperatives with $5 to ≤ $10 million in sales Directorcompensation NumberYes 30No 5 Averageboardsize 6Averageboardcompensation $3,464Medianboardcompensation $2,952 Typesofcompensation Number Percent of respondentsPaidtravel 18 60.00Liabilityinsurance 6 20.00Perdiem 15 50.00Dinners 7 23.33Permeeting 12 40.00Other 0 0.00 Supply cooperatives with <$5 million in sales Directorcompensation NumberYes 35No 9 Averageboardsize 7Averageboardcompensation $2,073Medianboardcompensation $1,575 Typesofcompensation Number Percent of respondentsPaidtravel 7 20.00Liabilityinsurance 2 5.71Perdiem 11 31.43Dinners 7 20.00Permeeting 14 40.00Other 0 0.00
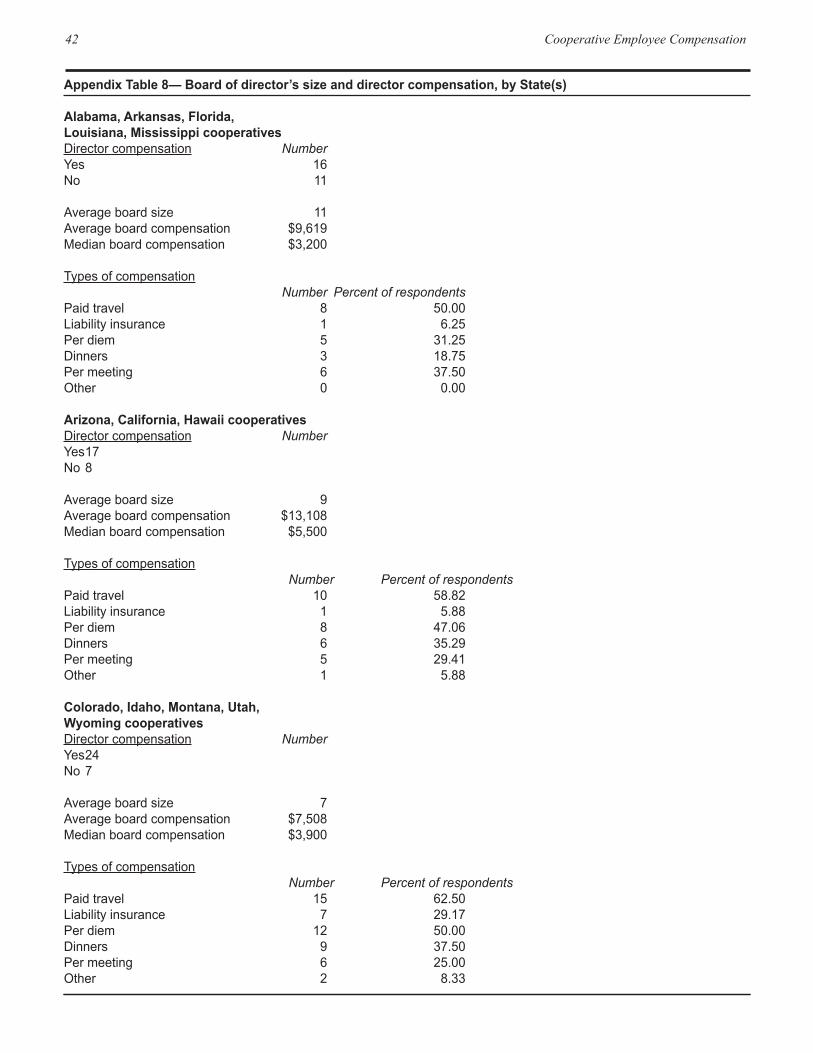
42 Cooperative Employee Compensation
Appendix Table 8— Board of director’s size and director compensation, by State(s) Alabama, Arkansas, Florida, Louisiana, Mississippi cooperatives Directorcompensation Number Yes 16No 11 Averageboardsize 11Averageboardcompensation $9,619Medianboardcompensation $3,200 Typesofcompensation Number Percent of respondentsPaidtravel 8 50.00Liabilityinsurance 1 6.25Perdiem 5 31.25Dinners 3 18.75Permeeting 6 37.50Other 0 0.00 Arizona, California, Hawaii cooperatives Directorcompensation Number Yes17No8 Averageboardsize 9Averageboardcompensation $13,108Medianboardcompensation $5,500 Typesofcompensation Number Percent of respondentsPaidtravel 10 58.82Liabilityinsurance 1 5.88Perdiem 8 47.06Dinners 6 35.29Permeeting 5 29.41Other 1 5.88 Colorado, Idaho, Montana, Utah,Wyoming cooperatives Directorcompensation Number Yes24No7 Averageboardsize 7Averageboardcompensation $7,508Medianboardcompensation $3,900 Typesofcompensation Number Percent of respondentsPaidtravel 15 62.50Liabilityinsurance 7 29.17Perdiem 12 50.00Dinners 9 37.50Permeeting 6 25.00Other 2 8.33
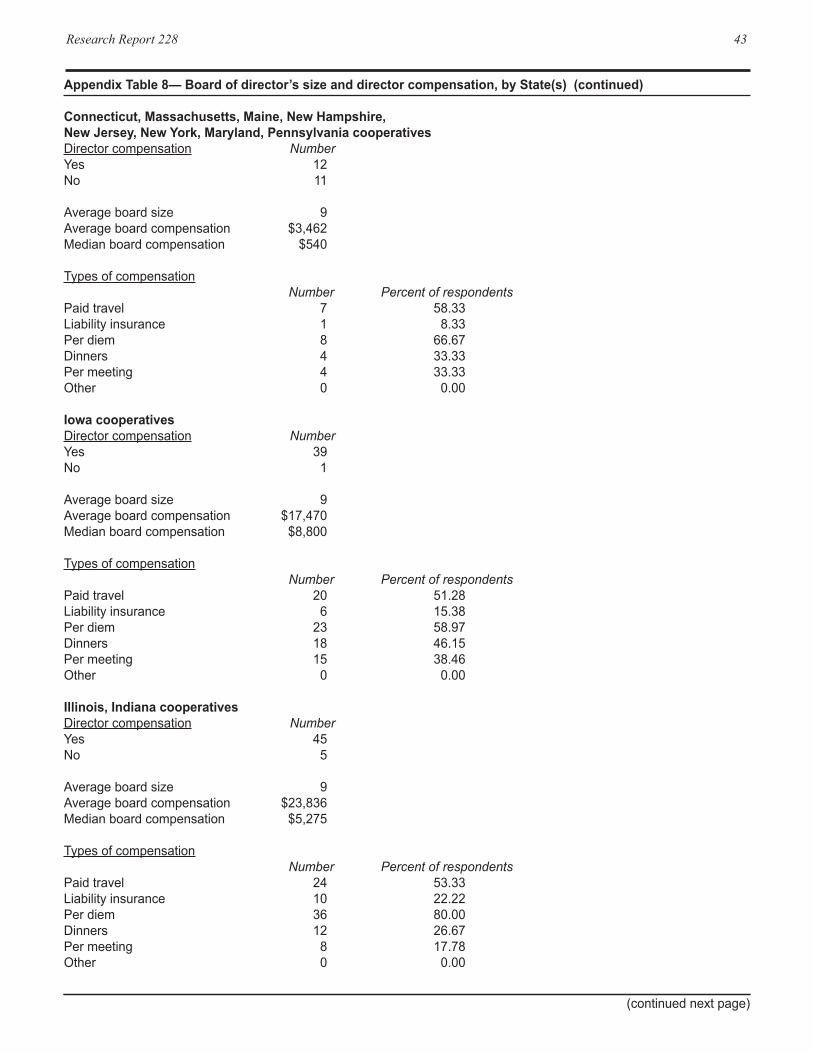
Research Report 228 43
Appendix Table 8— Board of director’s size and director compensation, by State(s) (continued) Connecticut, Massachusetts, Maine, New Hampshire, New Jersey, New York, Maryland, Pennsylvania cooperatives Directorcompensation NumberYes 12No 11 Averageboardsize 9Averageboardcompensation $3,462Medianboardcompensation $540 Typesofcompensation Number Percent of respondentsPaidtravel 7 58.33Liabilityinsurance 1 8.33Perdiem 8 66.67Dinners 4 33.33Permeeting 4 33.33Other 0 0.00 Iowa cooperatives Directorcompensation NumberYes 39No 1 Averageboardsize 9Averageboardcompensation $17,470Medianboardcompensation $8,800 Typesofcompensation Number Percent of respondentsPaidtravel 20 51.28Liabilityinsurance 6 15.38Perdiem 23 58.97Dinners 18 46.15Permeeting 15 38.46Other 0 0.00 Illinois, Indiana cooperatives Directorcompensation NumberYes 45No 5 Averageboardsize 9Averageboardcompensation $23,836Medianboardcompensation $5,275 Typesofcompensation Number Percent of respondentsPaidtravel 24 53.33Liabilityinsurance 10 22.22Perdiem 36 80.00Dinners 12 26.67Permeeting 8 17.78Other 0 0.00
(continuednextpage)
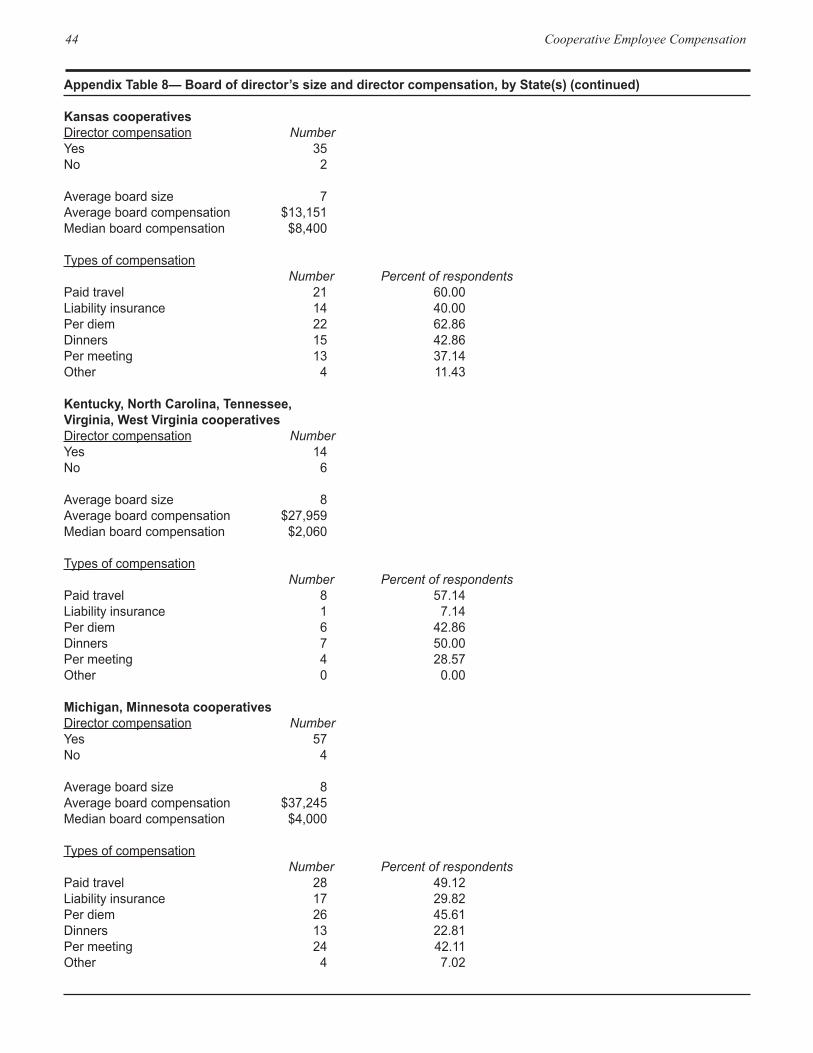
44 Cooperative Employee Compensation
Appendix Table 8— Board of director’s size and director compensation, by State(s) (continued) Kansas cooperatives Directorcompensation NumberYes 35No 2 Averageboardsize 7Averageboardcompensation $13,151Medianboardcompensation $8,400 Typesofcompensation Number Percent of respondentsPaidtravel 21 60.00Liabilityinsurance 14 40.00Perdiem 22 62.86Dinners 15 42.86Permeeting 13 37.14Other 4 11.43 Kentucky, North Carolina, Tennessee,Virginia, West Virginia cooperatives Directorcompensation NumberYes 14No 6 Averageboardsize 8Averageboardcompensation $27,959Medianboardcompensation $2,060 Typesofcompensation Number Percent of respondentsPaidtravel 8 57.14Liabilityinsurance 1 7.14Perdiem 6 42.86Dinners 7 50.00Permeeting 4 28.57Other 0 0.00 Michigan, Minnesota cooperatives Directorcompensation NumberYes 57No 4 Averageboardsize 8Averageboardcompensation $37,245Medianboardcompensation $4,000 Typesofcompensation Number Percent of respondentsPaidtravel 28 49.12Liabilityinsurance 17 29.82Perdiem 26 45.61Dinners 13 22.81Permeeting 24 42.11Other 4 7.02
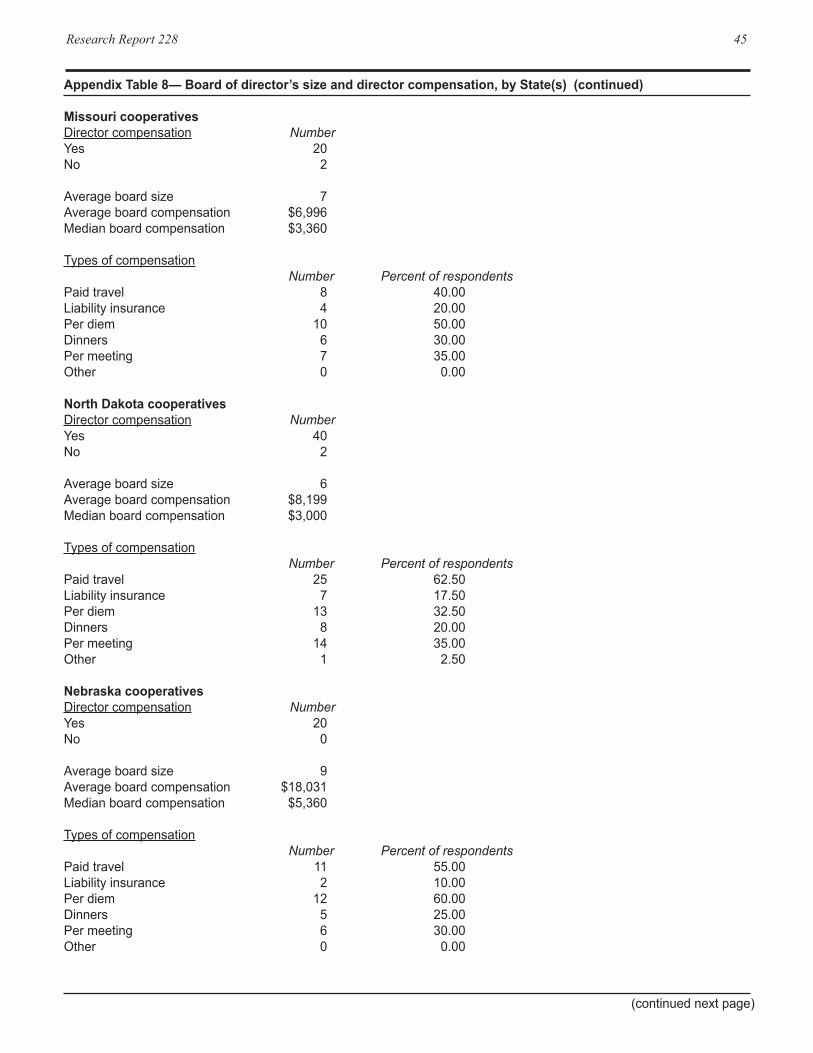
Research Report 228 45
Appendix Table 8— Board of director’s size and director compensation, by State(s) (continued) Missouri cooperatives Directorcompensation NumberYes 20No 2 Averageboardsize 7Averageboardcompensation $6,996Medianboardcompensation $3,360 Typesofcompensation Number Percent of respondentsPaidtravel 8 40.00Liabilityinsurance 4 20.00Perdiem 10 50.00Dinners 6 30.00Permeeting 7 35.00Other 0 0.00 North Dakota cooperatives Directorcompensation NumberYes 40No 2 Averageboardsize 6Averageboardcompensation $8,199Medianboardcompensation $3,000 Typesofcompensation Number Percent of respondentsPaidtravel 25 62.50Liabilityinsurance 7 17.50Perdiem 13 32.50Dinners 8 20.00Permeeting 14 35.00Other 1 2.50 Nebraska cooperatives Directorcompensation NumberYes 20No 0 Averageboardsize 9Averageboardcompensation $18,031Medianboardcompensation $5,360 Typesofcompensation Number Percent of respondentsPaidtravel 11 55.00Liabilityinsurance 2 10.00Perdiem 12 60.00Dinners 5 25.00Permeeting 6 30.00Other 0 0.00
(continuednextpage)
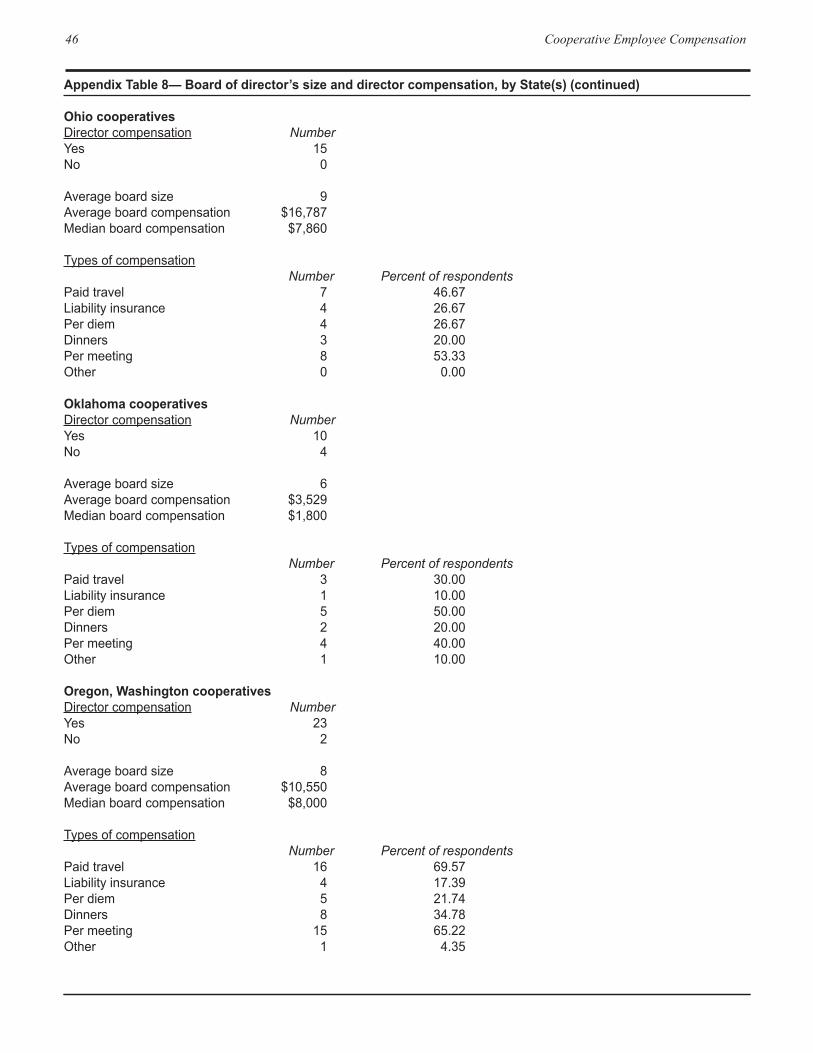
46 Cooperative Employee Compensation
Appendix Table 8— Board of director’s size and director compensation, by State(s) (continued) Ohio cooperatives Directorcompensation NumberYes 15No 0 Averageboardsize 9Averageboardcompensation $16,787Medianboardcompensation $7,860 Typesofcompensation Number Percent of respondentsPaidtravel 7 46.67Liabilityinsurance 4 26.67Perdiem 4 26.67Dinners 3 20.00Permeeting 8 53.33Other 0 0.00 Oklahoma cooperatives Directorcompensation NumberYes 10No 4 Averageboardsize 6Averageboardcompensation $3,529Medianboardcompensation $1,800 Typesofcompensation Number Percent of respondentsPaidtravel 3 30.00Liabilityinsurance 1 10.00Perdiem 5 50.00Dinners 2 20.00Permeeting 4 40.00Other 1 10.00 Oregon, Washington cooperatives Directorcompensation NumberYes 23No 2 Averageboardsize 8Averageboardcompensation $10,550Medianboardcompensation $8,000 Typesofcompensation Number Percent of respondentsPaidtravel 16 69.57Liabilityinsurance 4 17.39Perdiem 5 21.74Dinners 8 34.78Permeeting 15 65.22Other 1 4.35

Research Report 228 47

48 Cooperative Employee Compensation