Cooper HERNIS Global Update Agent Seminar Bankok 2012 Cooper... · Turnover/Employees Based in...
33
Cooper HERNIS Global Update Agent Seminar – Bankok 2012 Bjørn Fossestøl, Marketing Director 13 th March, 2012
Transcript of Cooper HERNIS Global Update Agent Seminar Bankok 2012 Cooper... · Turnover/Employees Based in...
Cooper HERNIS Global Update
Agent Seminar – Bankok 2012
Bjørn Fossestøl, Marketing Director
13th March, 2012

2
Agenda
Cooper Industries
Cooper HERNIS overview
Cooper HERNIS 2011
Cooper HERNIS budget 2012
Global Market Outlook
Cooper Industries
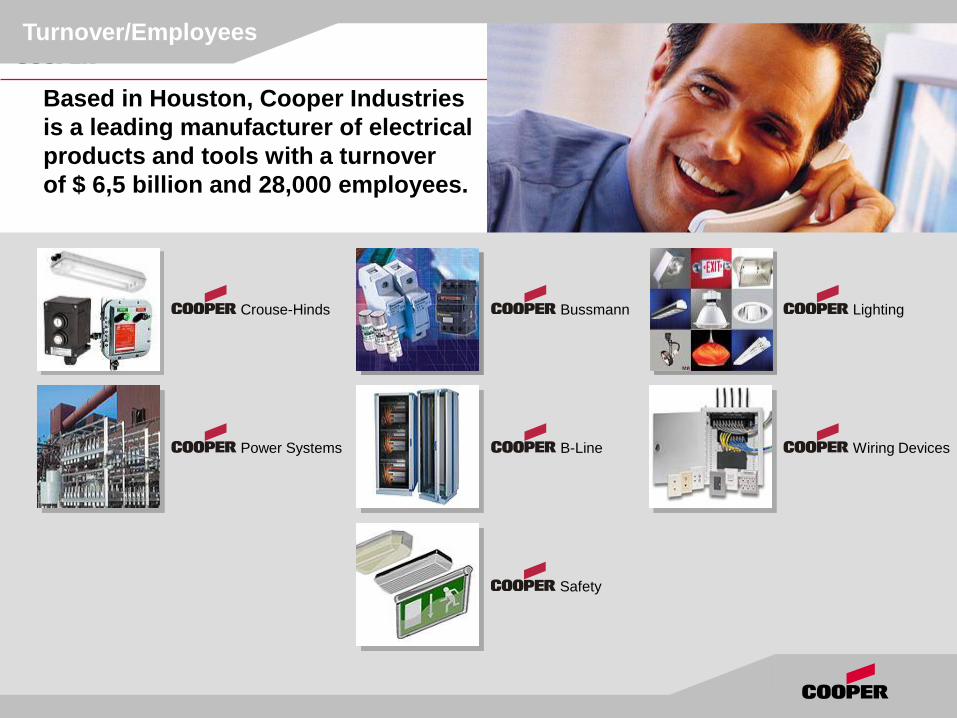
Turnover/Employees
Based in Houston, Cooper Industries
is a leading manufacturer of electrical
products and tools with a turnover
of $ 6,5 billion and 28,000 employees.
Crouse-Hinds Bussmann Lighting
Power Systems B-Line Wiring Devices
Safety
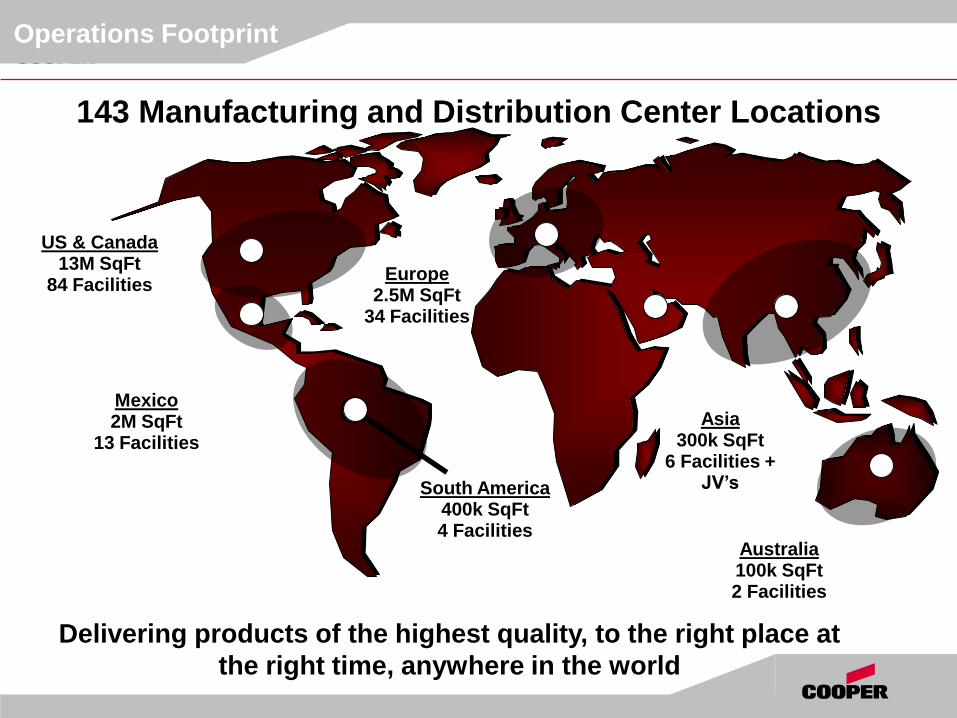
Delivering products of the highest quality, to the right place at
the right time, anywhere in the world
South America 400k SqFt 4 Facilities
US & Canada 13M SqFt
84 Facilities
Mexico 2M SqFt
13 Facilities
Australia 100k SqFt 2 Facilities
Europe 2.5M SqFt
34 Facilities
Asia 300k SqFt
6 Facilities + JV’s
143 Manufacturing and Distribution Center Locations
Operations Footprint
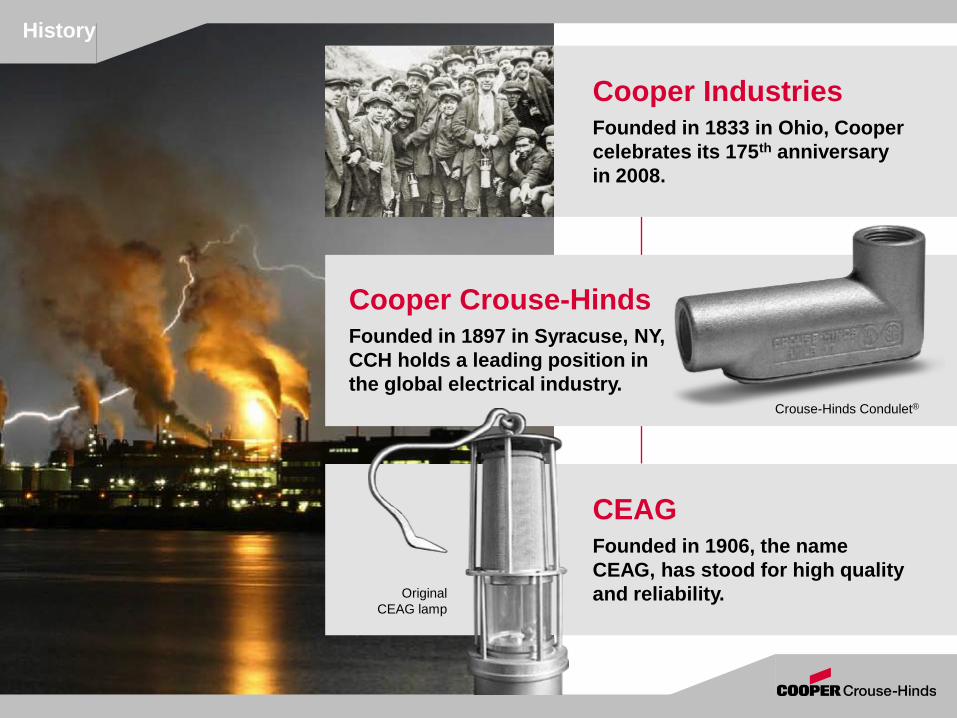
History
Cooper Industries Founded in 1833 in Ohio, Cooper
celebrates its 175th anniversary
in 2008.
Cooper Crouse-Hinds Founded in 1897 in Syracuse, NY,
CCH holds a leading position in
the global electrical industry.
CEAG Founded in 1906, the name
CEAG, has stood for high quality
and reliability.
Crouse-Hinds Condulet®
Original
CEAG lamp
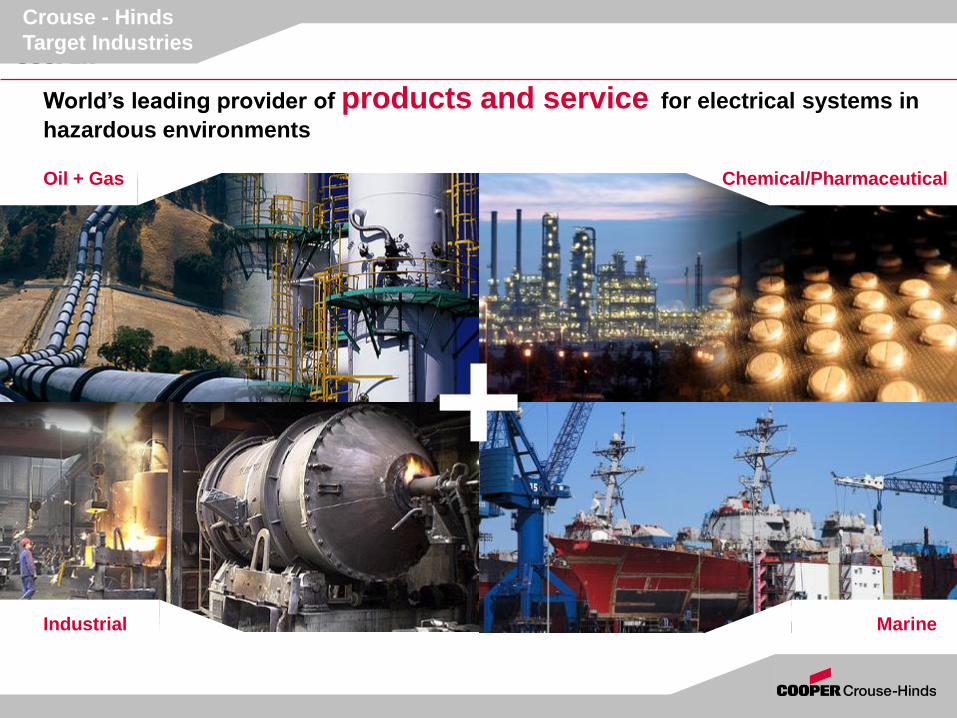
Oil + Gas
Marine
Chemical/Pharmaceutical
Crouse - Hinds
Target Industries
World’s leading provider of products and service for electrical systems in
hazardous environments
Industrial

CSA Canadian
Certification
ATEX Certification for
the European Union
UL Certification for
United States
NEC North
American
Certification
CEPEL Brazilian
Certification
IEC and IECEx International Certification
Gost Russian
Certification
GB Certification
for China
Overview
One Standard All Continents –
World’s leading manufacturer of explosion-
protected products to NEC and IEC standards!
Cooper Crouse-Hinds
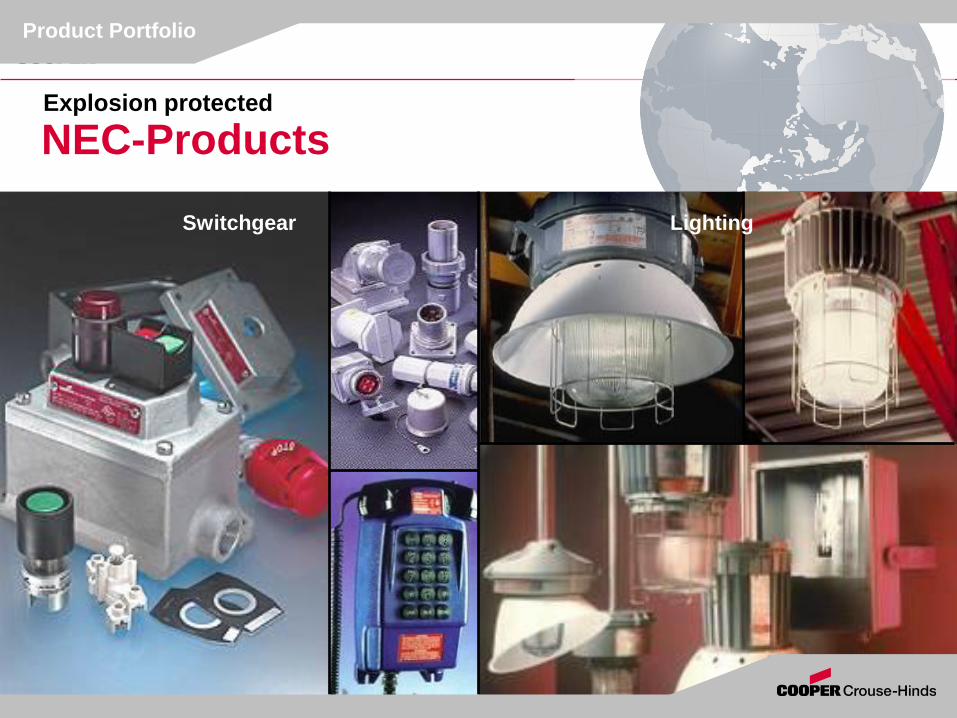
Switchgear
NEC-Products Explosion protected
Product Portfolio
Lighting
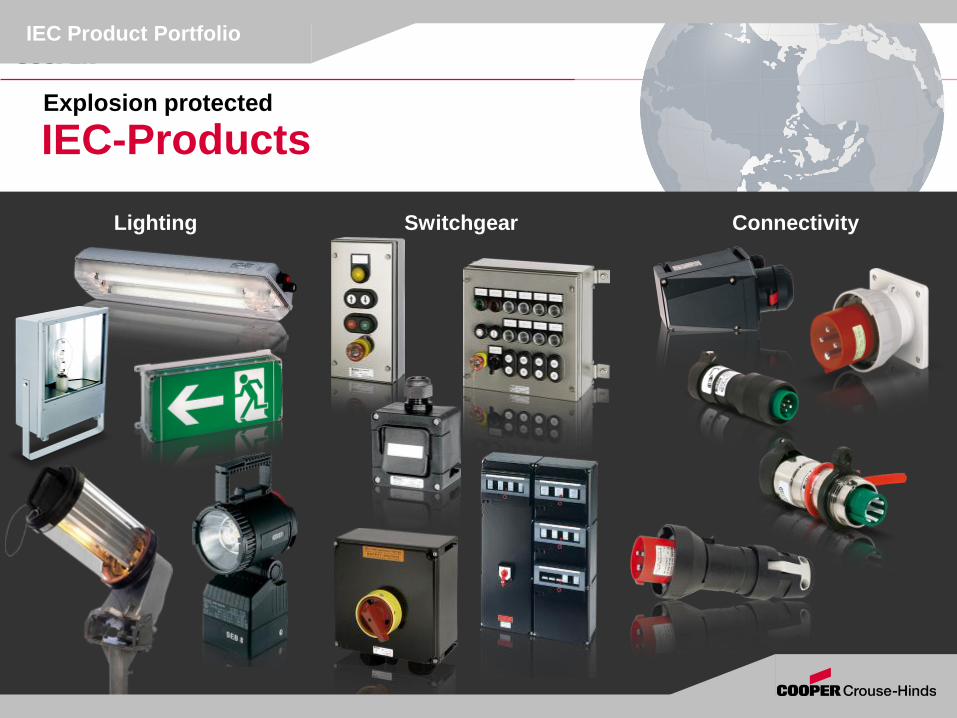
Lighting Switchgear Connectivity
IEC Product Portfolio
IEC-Products Explosion protected
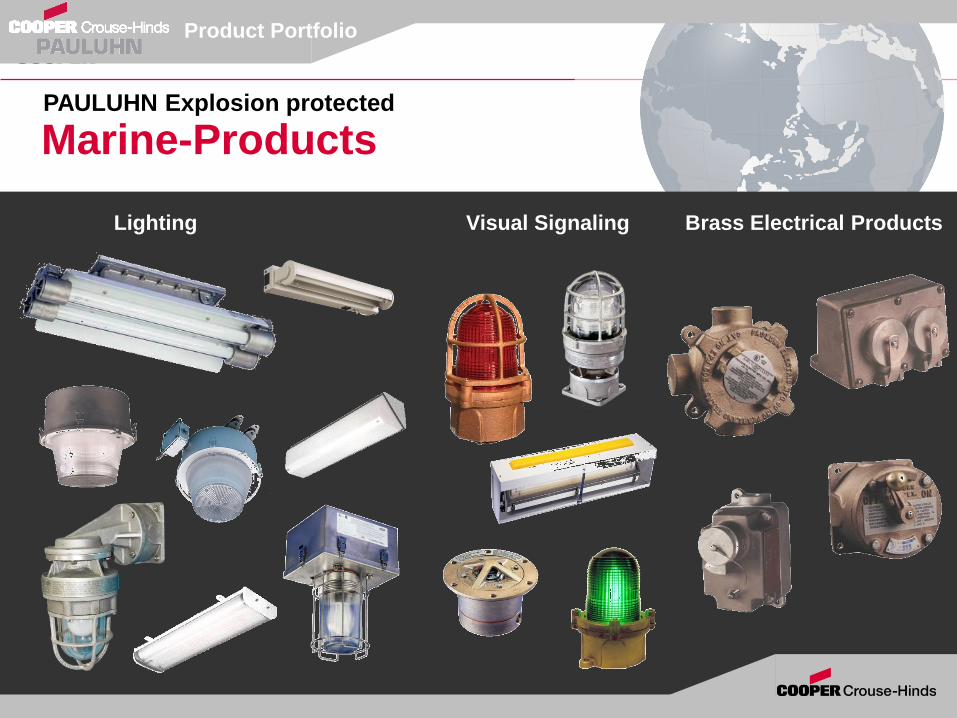
Lighting Visual Signaling Brass Electrical Products
Product Portfolio
Marine-Products PAULUHN Explosion protected
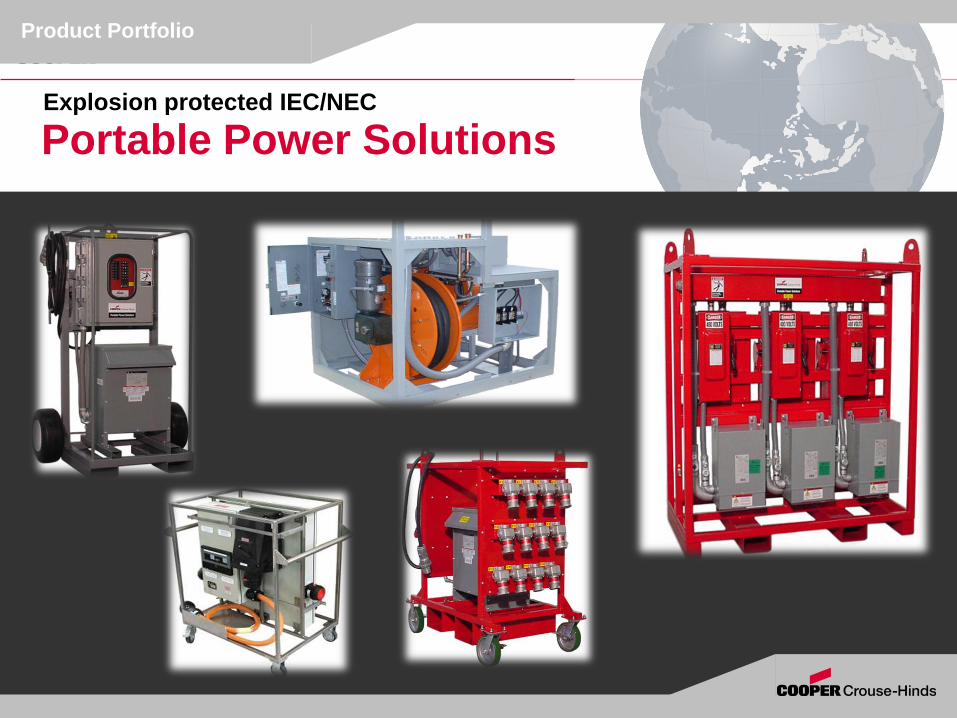
Portable Power Solutions Explosion protected IEC/NEC
Product Portfolio
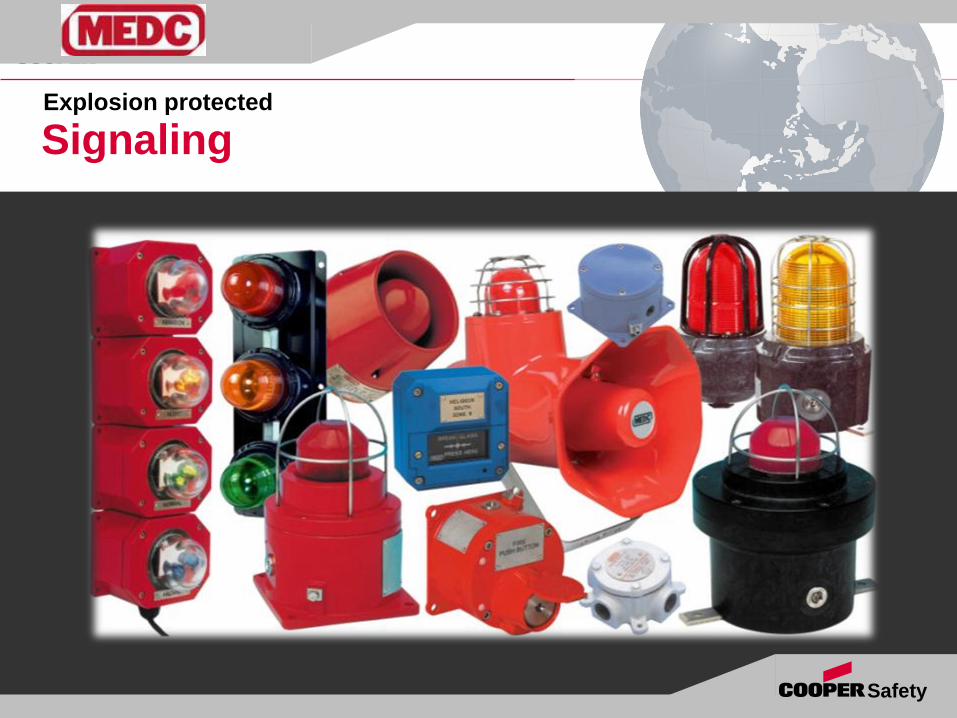
Signaling Explosion protected
Safety

CCTV Solutions World leader in Explosion protected
Safety
Cooper HERNIS
Overview
15
HERNIS Head office location
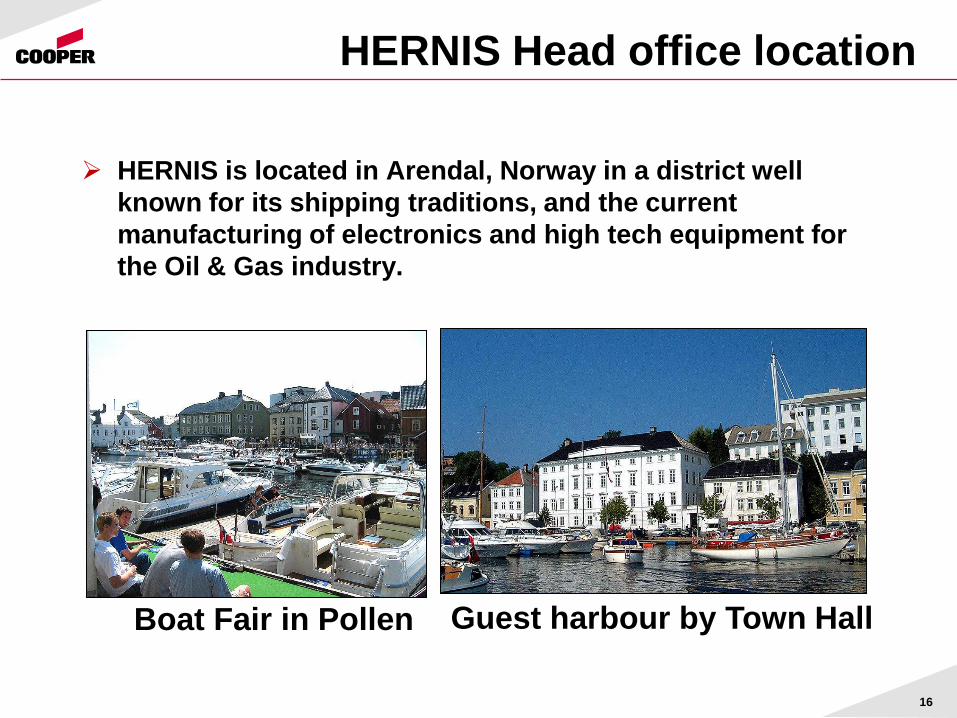
HERNIS is located in Arendal, Norway in a district well
known for its shipping traditions, and the current
manufacturing of electronics and high tech equipment for
the Oil & Gas industry.
Guest harbour by Town Hall Boat Fair in Pollen
16
17
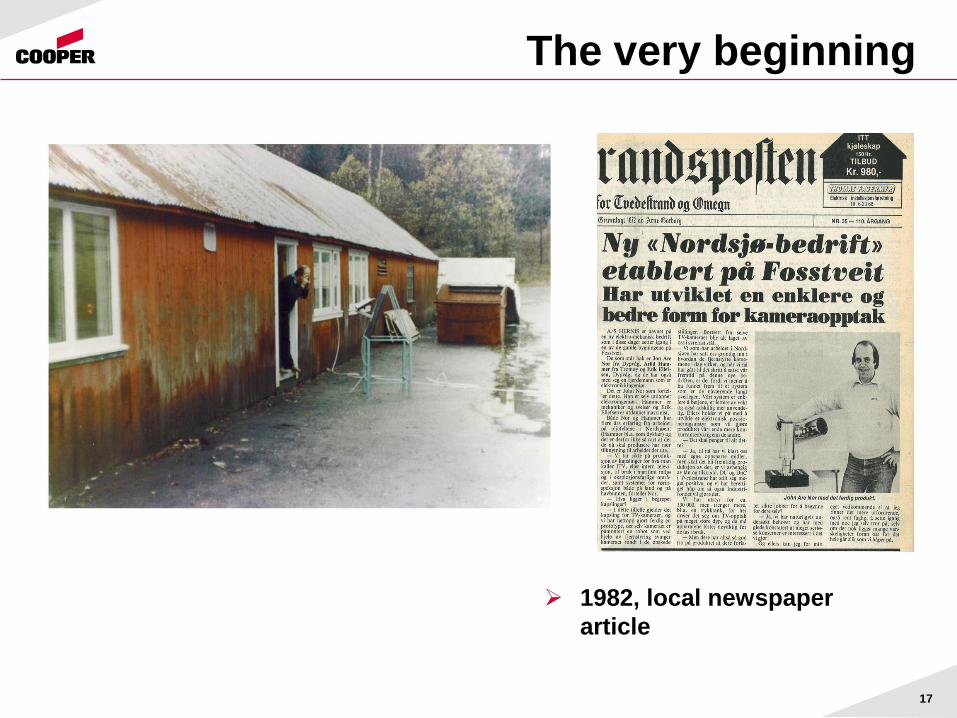
The very beginning
1982, local newspaper
article
18
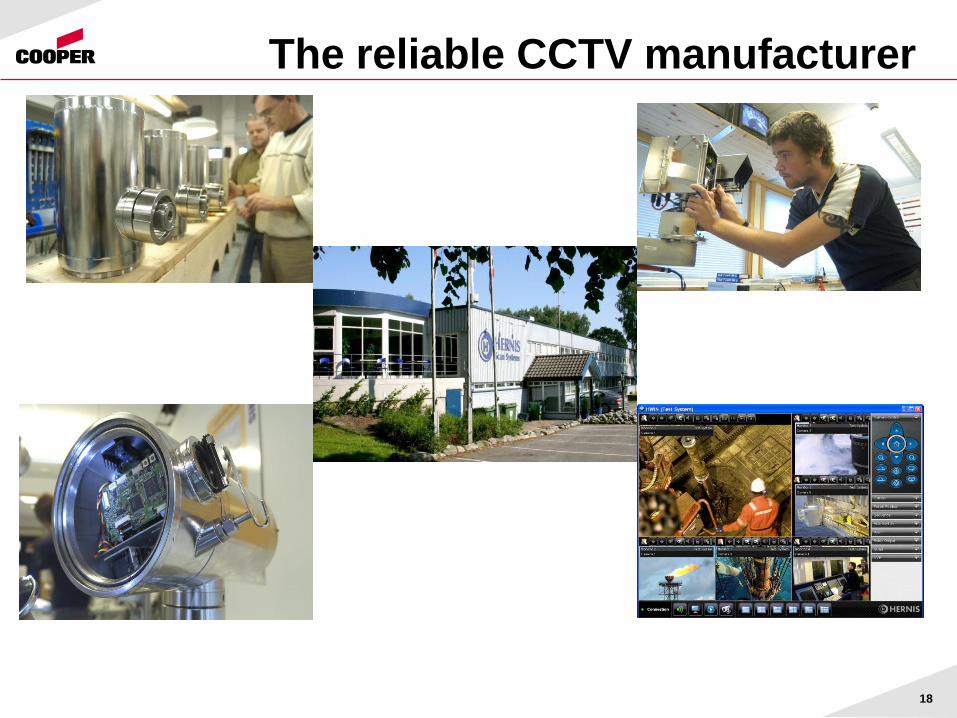
The reliable CCTV manufacturer
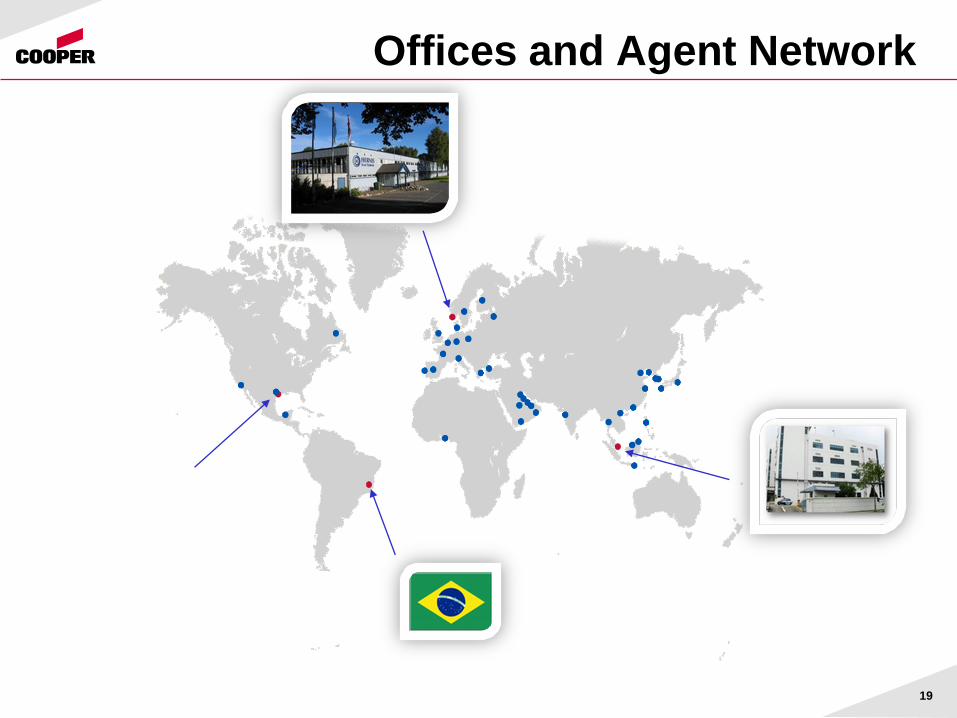
Offices and Agent Network
19
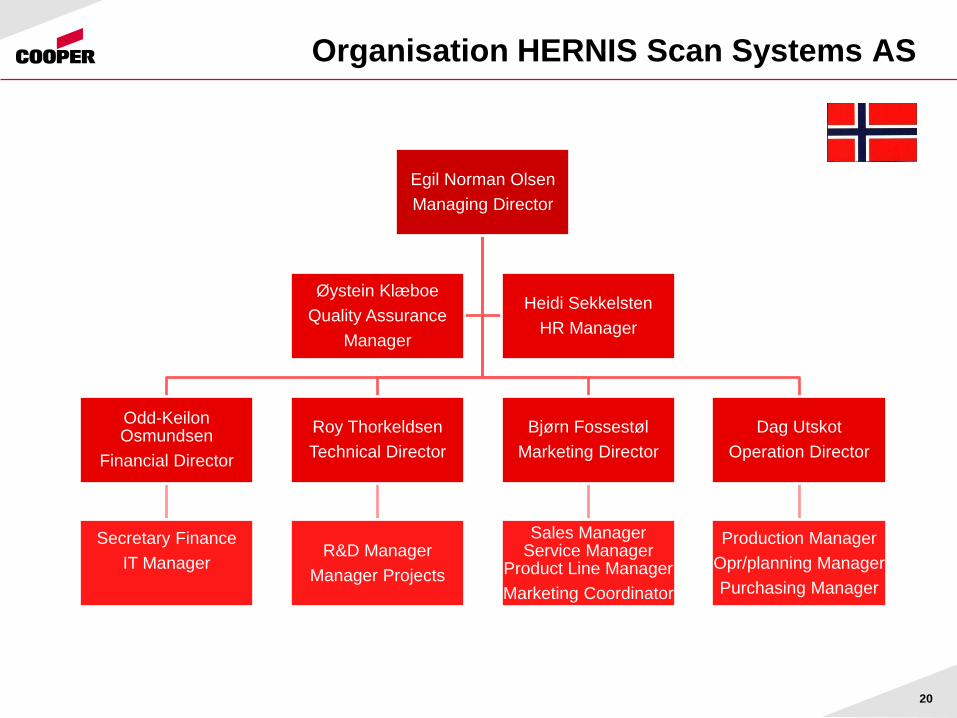
Organisation HERNIS Scan Systems AS
Egil Norman Olsen
Managing Director
Odd-Keilon Osmundsen
Financial Director
Secretary Finance
IT Manager
Roy Thorkeldsen
Technical Director
R&D Manager
Manager Projects
Bjørn Fossestøl
Marketing Director
Sales Manager Service Manager
Product Line Manager
Marketing Coordinator
Dag Utskot
Operation Director
Production Manager
Opr/planning Manager
Purchasing Manager
Øystein Klæboe
Quality Assurance
Manager
Heidi Sekkelsten
HR Manager
20
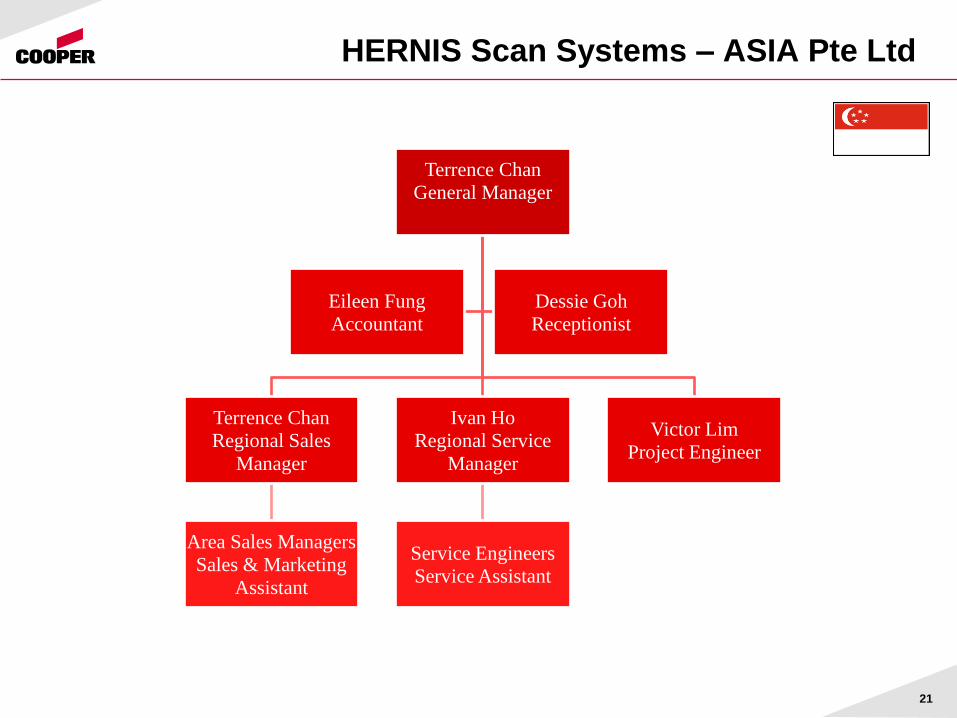
HERNIS Scan Systems – ASIA Pte Ltd
Terrence Chan
General Manager
Terrence Chan
Regional Sales
Manager
Area Sales Managers
Sales & Marketing
Assistant
Ivan Ho
Regional Service
Manager
Service Engineers
Service Assistant
Victor Lim
Project Engineer
Eileen Fung
Accountant
Dessie Goh
Receptionist
21

Organisation HERNIS Scan Systems –US Inc.
Micheal Weston
General Manager
Charlene Bellows
Office Coordinator
Kevin Clark
Sales / Technical
Support
22

Cooper HERNIS
“Numbers”
23
24
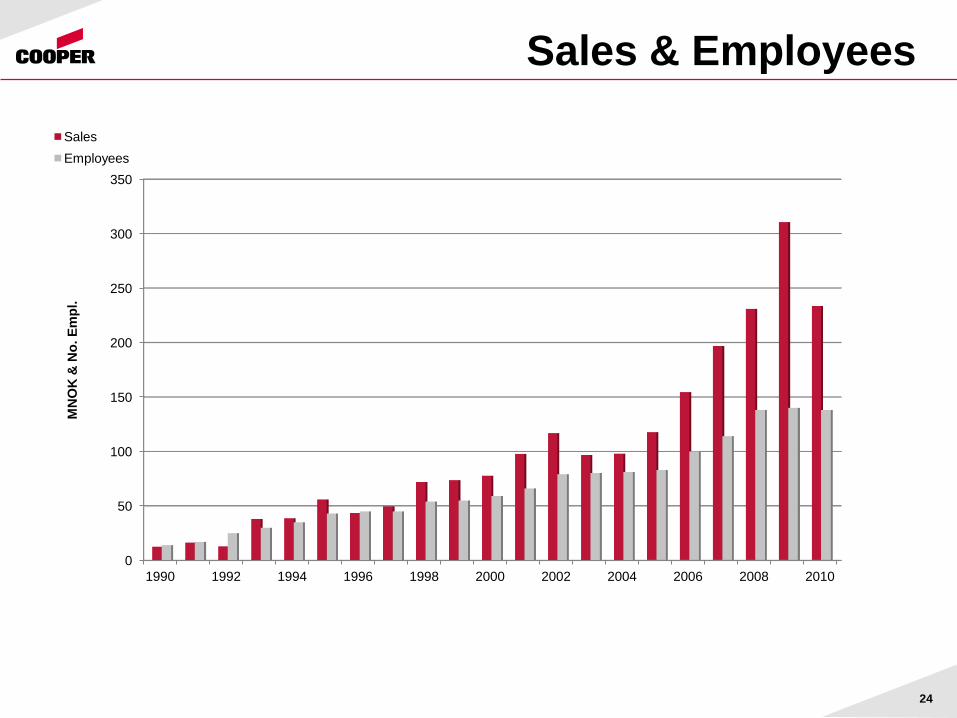
Sales & Employees
0
50
100
150
200
250
300
350
1990 1992 1994 1996 1998 2000 2002 2004 2006 2008 2010
MN
OK
& N
o. E
mp
l.
Sales
Employees
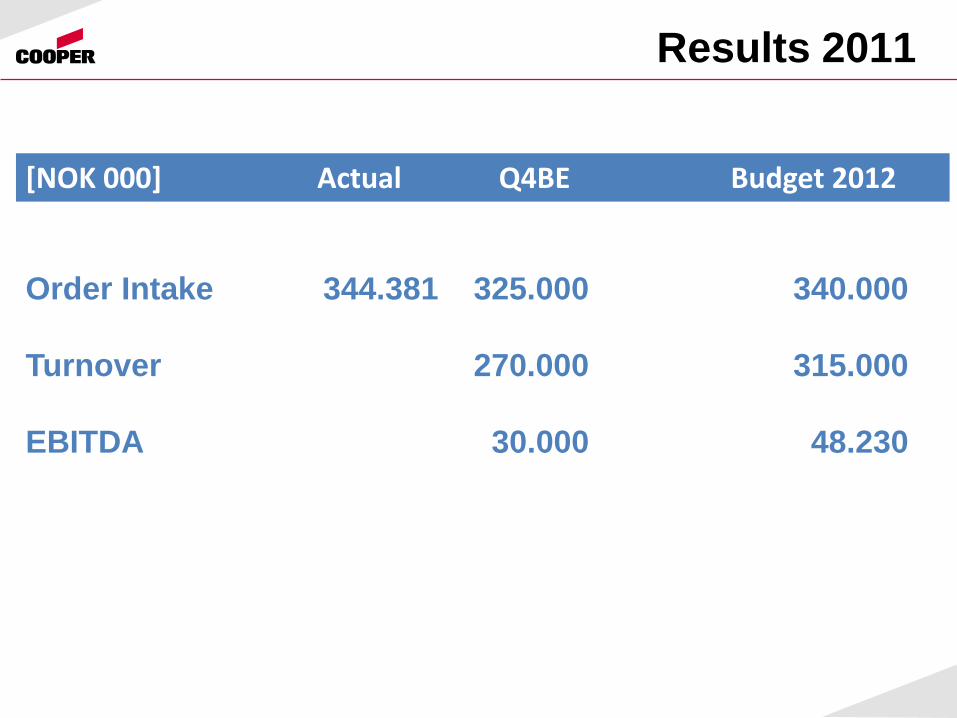
Results 2011
Order Intake 344.381 325.000 340.000
Turnover 270.000 315.000
EBITDA 30.000 48.230
[NOK 000] Actual Q4BE Budget 2012
Market Outlook
26
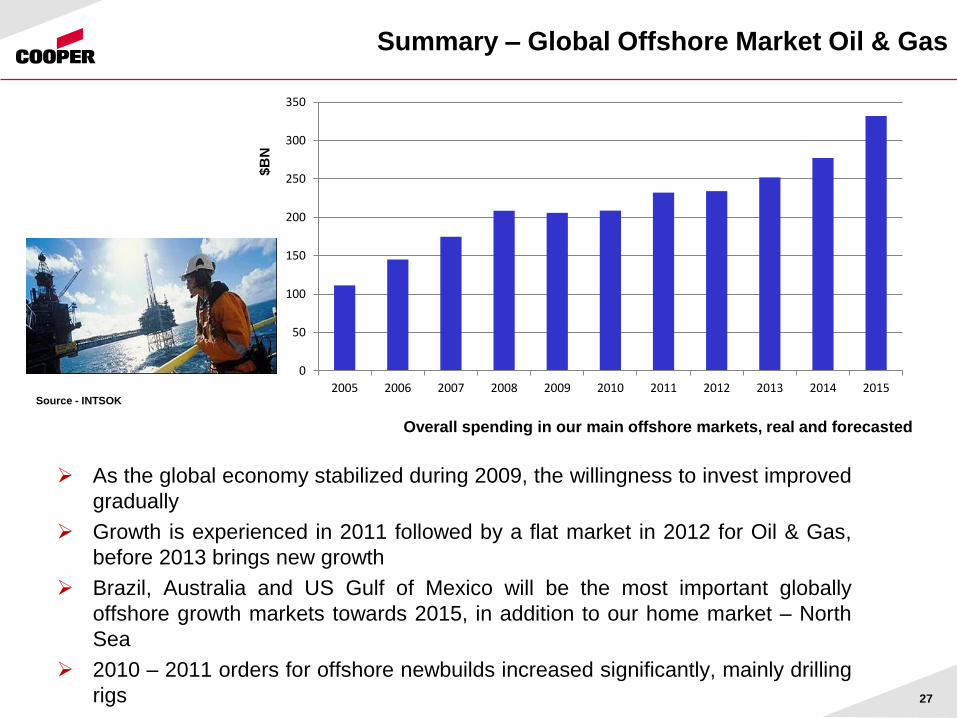
As the global economy stabilized during 2009, the willingness to invest improved
gradually
Growth is experienced in 2011 followed by a flat market in 2012 for Oil & Gas,
before 2013 brings new growth
Brazil, Australia and US Gulf of Mexico will be the most important globally
offshore growth markets towards 2015, in addition to our home market – North
Sea
2010 – 2011 orders for offshore newbuilds increased significantly, mainly drilling
rigs
Overall spending in our main offshore markets, real and forecasted
0
50
100
150
200
250
300
350
2005 2006 2007 2008 2009 2010 2011 2012 2013 2014 2015
Summary – Global Offshore Market Oil & Gas
$B
N
Source - INTSOK
27
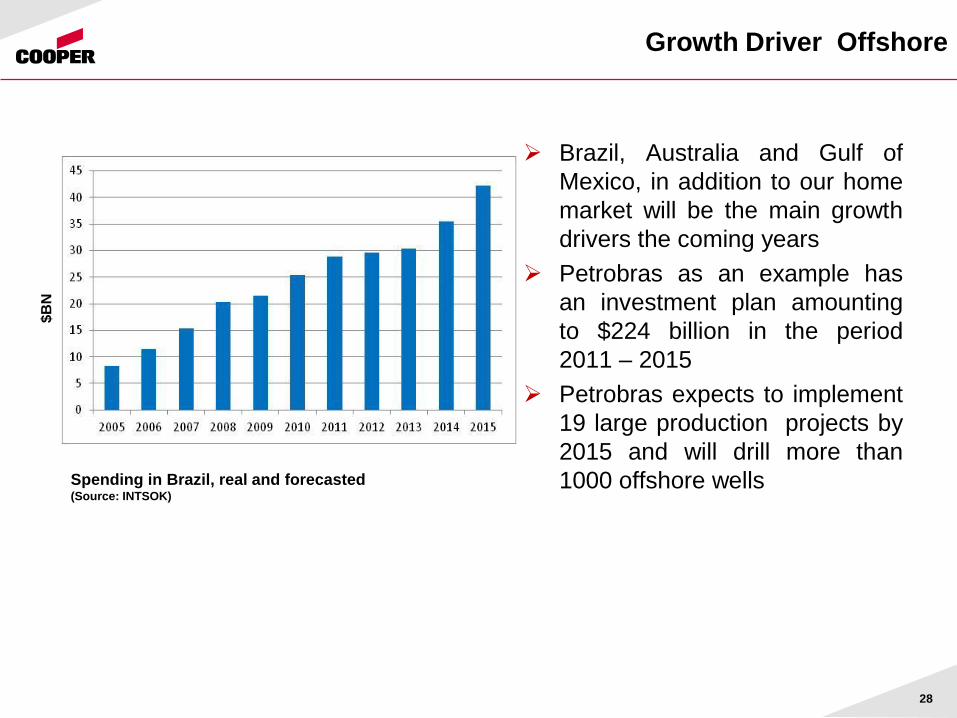
Growth Driver Offshore
Brazil, Australia and Gulf of
Mexico, in addition to our home
market will be the main growth
drivers the coming years
Petrobras as an example has
an investment plan amounting
to $224 billion in the period
2011 – 2015
Petrobras expects to implement
19 large production projects by
2015 and will drill more than
1000 offshore wells
Spending in Brazil, real and forecasted (Source: INTSOK)
$B
N
28
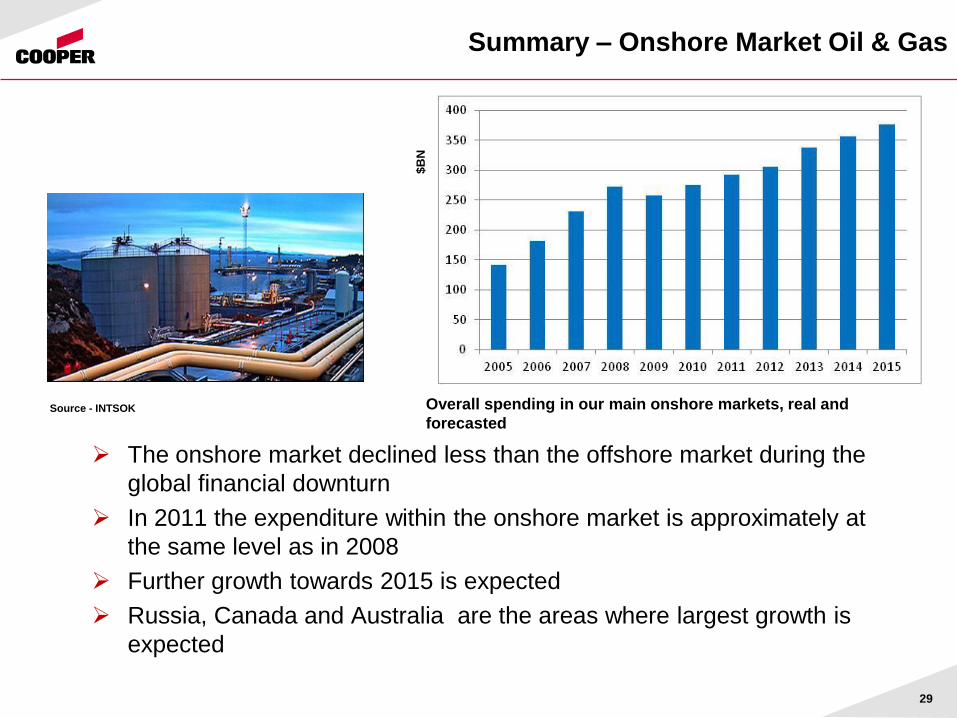
Summary – Onshore Market Oil & Gas
The onshore market declined less than the offshore market during the
global financial downturn
In 2011 the expenditure within the onshore market is approximately at
the same level as in 2008
Further growth towards 2015 is expected
Russia, Canada and Australia are the areas where largest growth is
expected
Overall spending in our main onshore markets, real and
forecasted
$B
N
Source - INTSOK
29

Growth Driver Onshore
The Middle East onshore
market going forward is
forecasted to be relatively flat
The growth opportunity in this
area is to increase our market
share
The Canada onshore market is
forecasted to grow by 50 % in
the next four years, mostly
stemming from oil sand
development
Spending Middle East – Onshore, real and forecasted
$B
N
Spending Canada – Onshore, real and forecasted
$B
N
Source - INTSOK
Source - INTSOK 30
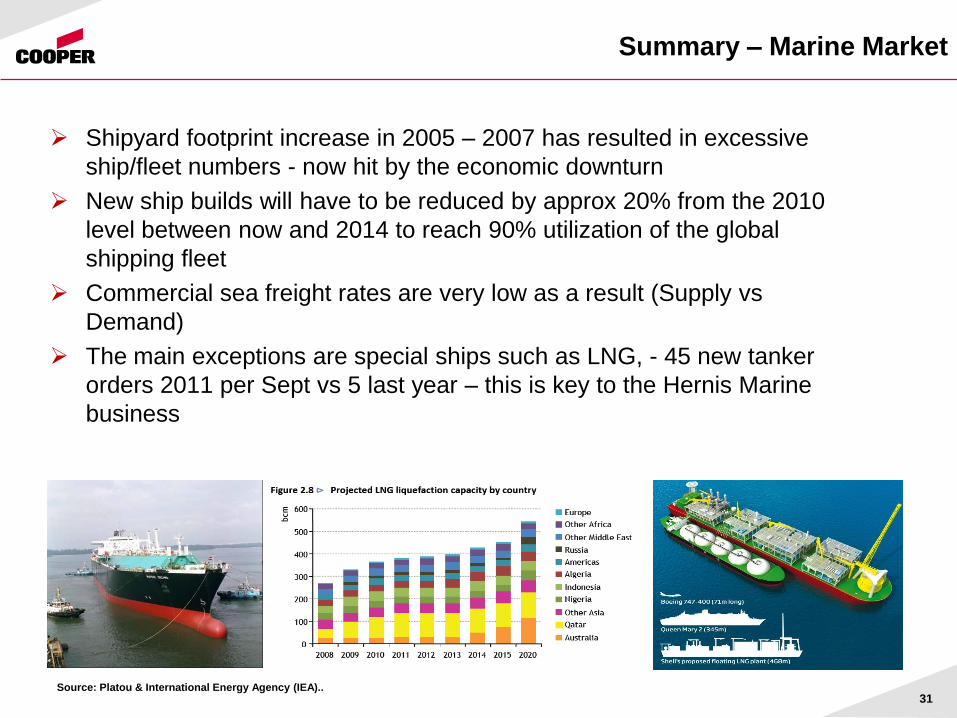
Summary – Marine Market
Shipyard footprint increase in 2005 – 2007 has resulted in excessive
ship/fleet numbers - now hit by the economic downturn
New ship builds will have to be reduced by approx 20% from the 2010
level between now and 2014 to reach 90% utilization of the global
shipping fleet
Commercial sea freight rates are very low as a result (Supply vs
Demand)
The main exceptions are special ships such as LNG, - 45 new tanker
orders 2011 per Sept vs 5 last year – this is key to the Hernis Marine
business
Source: Platou & International Energy Agency (IEA).. 31
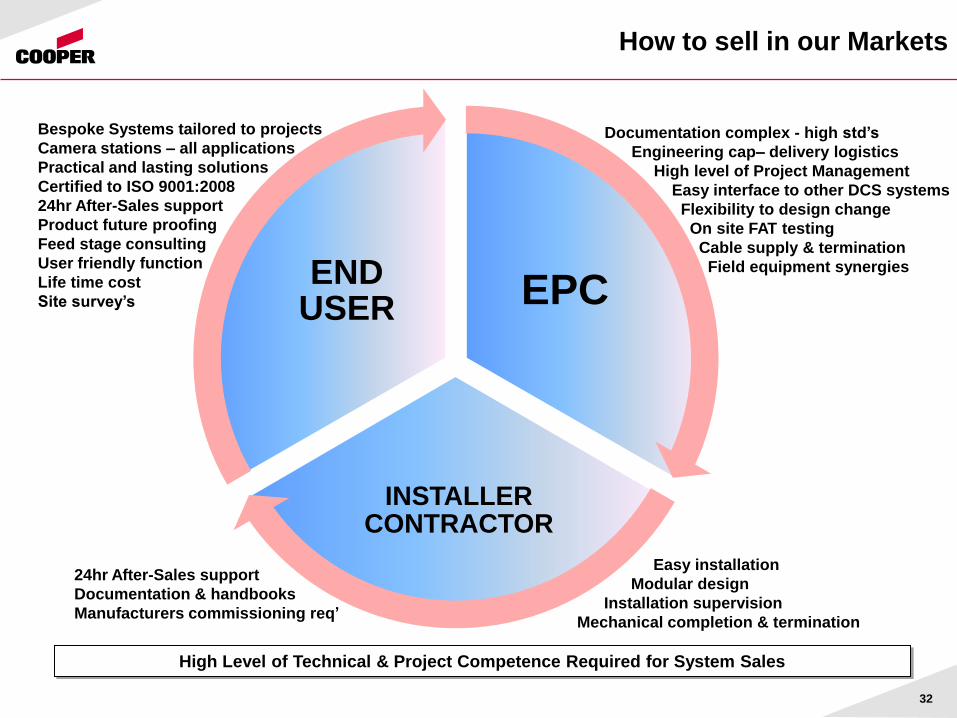
How to sell in our Markets
High Level of Technical & Project Competence Required for System Sales
EPC
INSTALLER CONTRACTOR
END USER
Bespoke Systems tailored to projects
Camera stations – all applications
Practical and lasting solutions
Certified to ISO 9001:2008
24hr After-Sales support
Product future proofing
Feed stage consulting
User friendly function
Life time cost
Site survey’s
Documentation complex - high std’s
Engineering cap– delivery logistics
High level of Project Management
Easy interface to other DCS systems
Flexibility to design change
On site FAT testing
Cable supply & termination
Field equipment synergies
Easy installation
Modular design
Installation supervision
Mechanical completion & termination
24hr After-Sales support
Documentation & handbooks
Manufacturers commissioning req’
32
Thank You for Your Attention!
33