Coolerado 5 Ton RTU Performance: Western Cooling Challenge ... · Coolerado RTU air flow schematic...
15
NREL is a national laboratory of the U.S. Department of Energy, Office of Energy Efficiency & Renewable Energy, operated by the Alliance for Sustainable Energy, LLC. Contract No. DE-AC36-08GO28308 Coolerado 5 Ton RTU Performance: Western Cooling Challenge Results Eric Kozubal and Steven Slayzak Revised November 2010 Technical Report NREL/TP-5500-46524 November 2010
Transcript of Coolerado 5 Ton RTU Performance: Western Cooling Challenge ... · Coolerado RTU air flow schematic...

NREL is a national laboratory of the U.S. Department of Energy, Office of Energy Efficiency & Renewable Energy, operated by the Alliance for Sustainable Energy, LLC.
Contract No. DE-AC36-08GO28308
Coolerado 5 Ton RTU Performance: Western Cooling Challenge Results Eric Kozubal and Steven Slayzak
Revised November 2010
Technical Report NREL/TP-5500-46524 November 2010

ERRATA SHEET NREL REPORT/PROJECT NUMBER: TP-550-46524
TITLE: Coolerado 5 Ton RTU Performance: Western Cooling Challenge Results
AUTHORS: Erik Kozubal and Steven Slayzak
ORIGINAL PUBLICATION DATE: September 2009
DATE OF CORRECTIONS: November 2010
• Figure 5 and Figure 6 on page six were updated to show corrected values.
• Table 2 on page 7 was updated to show surrogate annual conditions.
• All tables in the appendices on page 8 were updated to show values of surrogate
annual conditions where appropriate.
• Throughout the report, the term credited was inserted to modify terms such as
ventilation and cooling to align with Western Cooling Challenge definitions.

NREL is a national laboratory of the U.S. Department of Energy, Office of Energy Efficiency & Renewable Energy, operated by the Alliance for Sustainable Energy, LLC.
National Renewable Energy Laboratory 1617 Cole Boulevard Golden, Colorado 80401 303-275-3000 • www.nrel.gov
Contract No. DE-AC36-08GO28308
Coolerado 5 Ton RTU Performance: Western Cooling Challenge Results Eric Kozubal and Steven Slayzak
Revised November 2010
Prepared under Task No. BEC71308
Technical Report NREL/TP-5500-46524 November 2010

NOTICE
This report was prepared as an account of work sponsored by an agency of the United States government. Neither the United States government nor any agency thereof, nor any of their employees, makes any warranty, express or implied, or assumes any legal liability or responsibility for the accuracy, completeness, or usefulness of any information, apparatus, product, or process disclosed, or represents that its use would not infringe privately owned rights. Reference herein to any specific commercial product, process, or service by trade name, trademark, manufacturer, or otherwise does not necessarily constitute or imply its endorsement, recommendation, or favoring by the United States government or any agency thereof. The views and opinions of authors expressed herein do not necessarily state or reflect those of the United States government or any agency thereof.
Available electronically at http://www.osti.gov/bridge
Available for a processing fee to U.S. Department of Energy and its contractors, in paper, from:
U.S. Department of Energy Office of Scientific and Technical Information
P.O. Box 62 Oak Ridge, TN 37831-0062 phone: 865.576.8401 fax: 865.576.5728 email: mailto:[email protected]
Available for sale to the public, in paper, from:
U.S. Department of Commerce National Technical Information Service 5285 Port Royal Road Springfield, VA 22161 phone: 800.553.6847 fax: 703.605.6900 email: [email protected] online ordering: http://www.ntis.gov/help/ordermethods.aspx
Cover Photos: (left to right) PIX 16416, PIX 17423, PIX 16560, PIX 17613, PIX 17436, PIX 17721
Printed on paper containing at least 50% wastepaper, including 10% post consumer waste.

iii
Acronyms DX direct expansion
EA exhaust air
EER energy efficiency ratio
HVAC heating, ventilation, and air-conditioning
NREL National Renewable Energy Laboratory
OA outside air
RA return air
RTU rooftop unit
SA supply air
SHR sensible heat ratio
w.c. water column
WCC Western Cooling Challenge
WCEC Western Cooling Efficiency Center

iv
Contents Acronyms ....................................................................................................................................... iii
1 Introduction ............................................................................................................................. 1
2 Unit Description and Test Method .......................................................................................... 1
3 Results ..................................................................................................................................... 4
Appendix – Measured Data Tables ................................................................................................. 8
Figures Figure 1. The prototype RTU and the unit being tested at the NREL HVAC laboratory ............. 1
Figure 2. Coolerado RTU air flow schematic ................................................................................ 2
Figure 3. Psychrometric chart of RTU performance at nominal peak conditions .......................... 4
Figure 4. Psychrometric chart of RTU performance at surrogate annual conditions ..................... 5
Figure 5. Data used to interpolate surrogate annual EER performance .......................................... 6
Figure 6. Data used to interpolate surrogate annual water use/evaporation performance .............. 6
Tables Table 1. WCC Psychrometric Conditions ...................................................................................... 3
Table 2. Western Cooling Challenge Summary ............................................................................ 7

1
1 Introduction The National Renewable Energy Laboratory (NREL) is tasked, through funding from the U.S. Department of Energy Office of Building Technology, to evaluate the performance of advanced cooling concepts that meet or exceed the performance criteria developed by the Western Cooling Efficiency Center (WCEC) (http://wcec.ucdavis.edu/). The WCEC has developed a set of criteria for test conditions, minimum energy, and water use performance for prototype cooling equipment. The WCEC has identified these conditions as indicative of western state climates. These criteria, named the Western Cooling Challenge (WCC), have been set forth as a challenge to manufacturers to improve the state-of-the-art space cooling products. NREL is to verify these criteria through laboratory testing at its heating, ventilation, and air-conditioning (HVAC) test facility (www.nrel.gov/dtet/lab_capabilities.html) in Golden, Colorado, which is uniquely suited to accurately measure the cooling performance, energy, and water use of advanced cooling systems. The facility provides flexibility to test prototype equipment and develop subsequent test methodology. Data are analyzed and reported to reflect performance at sea level elevation.
This report is intended for individuals with technical understanding of cooling technologies for buildings.
2 Unit Description and Test Method NREL tested a prototype rooftop unit (RTU) manufactured by the Coolerado Corporation (see Figure 1). The unit, an advanced ultra-cooler that uses the patented “M-cycle” process, is a hybrid indirect evaporative cooling and refrigeration direct expansion (DX) system. An airflow schematic of the RTU is shown in Figure 2. Return air (RA) and outdoor air (OA) are brought into the unit and cooled by an indirect evaporative media. Between 43% and 46% of this air is used as an indirect evaporative cooling stream. The balance is then passed through a refrigerant evaporator coil and supplied to the space by a high-efficiency fan. The exhaust air from the evaporative process is generally cooler than the ambient air and is therefore used for the heat sink air flow going through the refrigerant condenser coil. OA and exhaust air (EA) flow rates were matched during testing. The RA and supply air (SA) flow rates are also equal, thus there is no make-up air (to the space) supplied by the unit. The mode of operation can be described as recirculation and ventilation air cooling with no makeup air.
Figure 1. The prototype RTU and the unit being tested at the NREL HVAC laboratory

2
The unit brings in OA and mixes it with RA to create a fresh air rate shown in equations (1) and (2). (1) [cfm] (2)
The nominal cooling capacity is given by equation (3) when tested at peak conditions. This number should not be confused with the total credited cooling defined later in equation (11). Rather, this number is used as a baseline to determine ventilation cooling capacity and a nominal specific cooling rate in cfm/ton. The cfm/ton calculation is also used to determine the static pressure imposed during the test, which is set at 0.7 in. w.c. at 350 cfm/ton. (See the WCC test specification for further details.) Capacity mSA 31.5 hSA [Btu/h] (3)
The RTU utilizes a high ventilation rate to provide air to the evaporative process. The specification states that ventilation cooling credit is limited to a specified OA flow. The nominal cooling capacity is used to determine the credited ventilation cooling and is calculated with equation (4). VV ,C 0.01 Capacity [cfm] (4)
Given the constraint: VV ,C VV
Figure 2. Coolerado RTU air flow schematic
Return Air (RA)
Supply Air (SA)
Outdoor Air (OA)
Evaporative Exhaust Air Exhaust Air
(EA)
Condensing Coil
DX Evaporator Coil
DX Condenser Coil
Indirect Evaporative Cooling Cores
3
The unit was given a single air flow at the OA inlet location. The RA and OA were psychrometrically mixed at the test facility rather than inside the RTU. Cooling capacity at the WCC test conditions is calculated with equations (5–13).
Space (Recirculation) Air Cooling: Total Space Cooling mSA hRA hSA [Btu/h] (5) Sensible Space Cooling mSA C TRA TSA [Btu/h] (6) Latent Space Cooling Total Space CoolingSensible Space Cooling [Btu/h] (7)
Credited Ventilation Air Cooling: Total Credited Ventilation Cooling mOA,ChOA hRA [Btu/h] (8) Sensible Credited Ventilation Cooling mOA,CC TOA TRA [Btu/h] (9) Latent Credited Ventilation CoolingTotal Credited Ventilation CoolingSensible Credited Ventilation Cooling [Btu/h] (10)
Credited Cooling: Total Credited Cooling Total Space CoolingTotal Credited Ventilation Cooling [Btu/h] (11) Sensible Credited Cooling Sensible Space CoolingSensible Credited Ventilation Cooling [Btu/h] (12) Latent Credited Cooling Latent Space CoolingLatent Credited Ventilation Cooling [Btu/h] (13)
Testing was done at nominal peak and surrogate annual conditions. The psychrometric conditions for the cooling challenge are shown in Table 1. RA conditions apply to the peak and annual tests.
Table 1. WCC Psychrometric Conditions
Tdb Twb Unit
Nominal Peak OA Conditions 105 73 °F
Surrogate Annual OA Conditions 90 64 °F
RA Conditions 78 64 °F
The unit has three primary modes of operation that are labeled as stages 0 to 2. Stage 2 has a higher OA fraction to provide additional air to the condensing coil.
• Stage 0: Indirect evaporative cooling only, with 43% OA fraction.
• Stage 1: Indirect evaporative cooling + low stage DX cooling, with 43% OA fraction.
• Stage 2: Indirect evaporative cooling + high stage DX cooling, with 46% OA fraction.

4
See the WCEC Web site (http://wcec.ucdavis.edu/) to view the complete WCC test specifications.
3 Results The following graphs illustrate the cooling process of the Coolerado RTU on a psychrometric chart for all cooling stages. Figure 3 and Figure 4 show the mixed air and SA conditions at WCC nominal peak and surrogate annual conditions, respectively. The figures show the progression of cooling capacity and supply conditions as the unit ramps up from stage 0 to stage 2. At nominal peak conditions, the RTU provides space cooling with a sensible heat ratio (SHR) between 0.92 and 1.25. Stage 2 is used to rate the system at nominal peak conditions.
Figure 3. Psychrometric chart of RTU performance at nominal peak conditions (Shown at 0 ft elevation. S0, S1, and S2 denote stages 0, 1, and 2, respectively)
At surrogate annual test conditions, the RTU provides space cooling with an SHR between 0.68 and 0.81. The large dehumidification capacity is primarily due to the large OA flow provided by the unit. For surrogate annual conditions, only stages 0 and 1 are used to rate the system.
0
20
40
60
80
100
120
40 50 60 70 80 90 100 110
ω(g
rain
s/lb
)
Dry Bulb Temperature (°F)
SHR = 0.92SHR = 1.05SHR = 1.25WCC RAWCC PeakMixed Air Inlet - S0Mixed Air Inlet - S1Mixed Air Inlet - S2Supply Air - S0Supply Air - S1Supply Air - S2

5
Figure 4. Psychrometric chart of RTU performance at surrogate annual conditions
(Shown at 0 ft elevation. S0, S1, and S2 denote stages 0, 1, and 2, respectively) Figure 5 shows the interpolation of cooling and power at surrogate annual conditions using stages 0 and 1. These data are used to estimate annual cooling performance, assuming that the average building load over a cooling season uses 80% of the measured sensible credited capacity at peak conditions. The interpolated credited capacity and power use are then used to calculate the surrogate annual energy efficiency ratios (EER). The same approach is used for water use. Total water use and water evaporation (in gallons per hour) are interpolated to 80% of the sensible credited capacity (see Figure 6). This number is then used with the surrogate annual credited cooling capacity to determine gallons per credited sensible ton·h.
0
20
40
60
80
100
120
40 50 60 70 80 90 100 110
ω(g
rain
s/lb
)
Dry Bulb Temperature (°F)
SHR = 0.68SHR = 0.76SHR = 0.81WCC RAWCC Surrogate AnnualMixed Air Inlet - S0Mixed Air Inlet - S1Mixed Air Inlet - S2Supply Air - S0Supply Air - S1Supply Air - S2

6
Figure 5. Data used to interpolate surrogate annual EER performance
Figure 6. Data used to interpolate surrogate annual water use/evaporation performance
The nominal capacity given by equation (3) for determining credited ventilation rate was calculated to be 60.5 kBtu/h. From this, the credited ventilation rate was then taken to be 600 cfm. The actual ventilation rate was measured to be approximately 800 cfm. The static pressure applied to the unit was 0.7 in. w.c.
The calculated performance of the Coolerado RTU is shown in Table 2. Comparing the calculated performance below to the WCC specifications, the unit meets and exceeds all minimum thermodynamic and water use requirements of the challenge.
0.0
1.0
2.0
3.0
0
25
50
75
40% 50% 60% 70% 80% 90% 100%
Pow
er (k
W)
Coo
ling
(kBt
u/h)
Percent of Sensible Credited Cooling at Full Capacity Operation for WCC Peak Conditons (%)
Cooling and Power Use Interpolation Used forSurrogate Annual EER Calculation
Credited Cooling
Sensible Credited Cooling
Power
Linear (Credited Cooling)
Linear (Sensible Credited Cooling)Linear (Power)
0
2
4
6
8
10
40% 50% 60% 70% 80% 90% 100%
Wat
er F
low
(gph
)
Percent of Sensible Credited Cooling at Full Capacity Operation for WCC Peak Conditons (%)
Water UseWater EvaporationLinear (Water Use)Linear (Water Evaporation)

7
Table 2. Western Cooling Challenge Summary
Specification Performance Units
Peak Conditions (105°F/73°F)
Total Credited Cooling 36–360 61.7 kBtu/h
Sensible Credited Cooling – 56.9 kBtu/h
Power – 2.84 kW
Credited EER – 21.7 Btu/Wh
Sensible Credited EER ≥14.0 20.1 Btu/Wh
Outlet Humidity ≤0.0092 0.00917 –
* Water Use – 1.83 gal/ton·h (sensible credited)
Water Evaporation – 1.50 gal/ton·h (sensible credited)
Surrogate Annual Conditions (90°F/64°F)
Total Credited Cooling – 47.7 kBtu/h
Sensible Credited Cooling – 45.6 kBtu/h
Mean Power – 1.64 kW
Credited EER – 29.1 Btu/Wh
Sensible Credited EER ≥17.0 27.8 Btu/Wh
* Water Use ≤4.0 1.84 gal/ton·h (sensible credited)
Water Evaporation – 1.50 gal/ton·h (sensible credited)
* NREL cannot verify through laboratory testing the unit’s ability to withstand scaling caused by water evaporation. The measurements are made available in terms of water use and evaporation in the laboratory. Water use will vary in practice because of system adjustments for water quality.

8
Appendix – Measured Data Tables
Stage Air FlowOA-
RA, Mixed Air
FlowSA Air
FlowEA OA Mass Fraction
TOA-RA Mixed
TSA TEA ωOA-RA
Mixed ωSA
– scfm scfm scfm % °F °F °F grains/lb grains/lb
Peak Conditions
0 3357 1822 1437 43% 89.6 71.5 76.5 68.8 68.8 1 3354 1834 1422 42% 89.4 60.5 93.4 68.5 67.9 2 3542 1810 1624 46% 90.4 58.4 96.8 67.9 64.2
Surrogate Annual Conditions
0 3444 1827 1482 43% 83.2 67.5 72.0 58.4 58.4 1 3383 1826 1451 43% 83.2 56.7 88.3 58.1 58.6 2 3591 1806 1660 46% 83.6 54.2 91.1 57.4 55.0
Stage Water Use Water
Evaporation Unit Power Total Space Cooling
Sensible Space Cooling
Latent Space Cooling
– gal/sensible- ton·h
gal/sensible- ton·h kW kBtu/h kBtu/h kBtu/h
Peak Conditions
0 3.17 2.52 0.75 10.44 13.06 -2.62 1 1.82 1.43 2.01 33.78 35.45 -1.67 2 1.83 1.50 2.84 42.28 39.19 3.09
Surrogate Annual Conditions
0 2.93 2.32 0.74 31.28 21.21 10.07 1 1.64 1.35 1.93 53.32 42.96 10.36 2 1.65 1.38 2.70 62.17 47.40 14.77
Stage
Total Credited Ventilation
Cooling
Sensible Credited
Ventilation Cooling
Latent Credited
Ventilation Cooling
Total Credited Cooling
Sensible Credited Cooling
Latent Credited Cooling
Credited EER
Sensible Credited
EER
– kBtu/h kBtu/h kBtu/h kBtu/h kBtu/h kBtu/h Btu/Wh Btu/Wh
Peak Conditions
0 18.95 17.37 1.57 29.39 30.43 -1.04 39.4 40.8 1 19.30 17.69 1.61 53.08 53.14 -0.06 26.4 26.4 2 19.39 17.75 1.63 61.67 56.95 4.72 21.7 20.1
Surrogate Annual Conditions
0 –0.23 7.78 -8.02 31.05 28.99 2.06 41.9 39.1 1 –0.24 7.93 -8.17 53.09 50.89 2.20 27.5 26.4 2 –0.24 7.96 -8.20 61.93 55.36 6.57 22.9 20.5
F1147-E(10/2008)
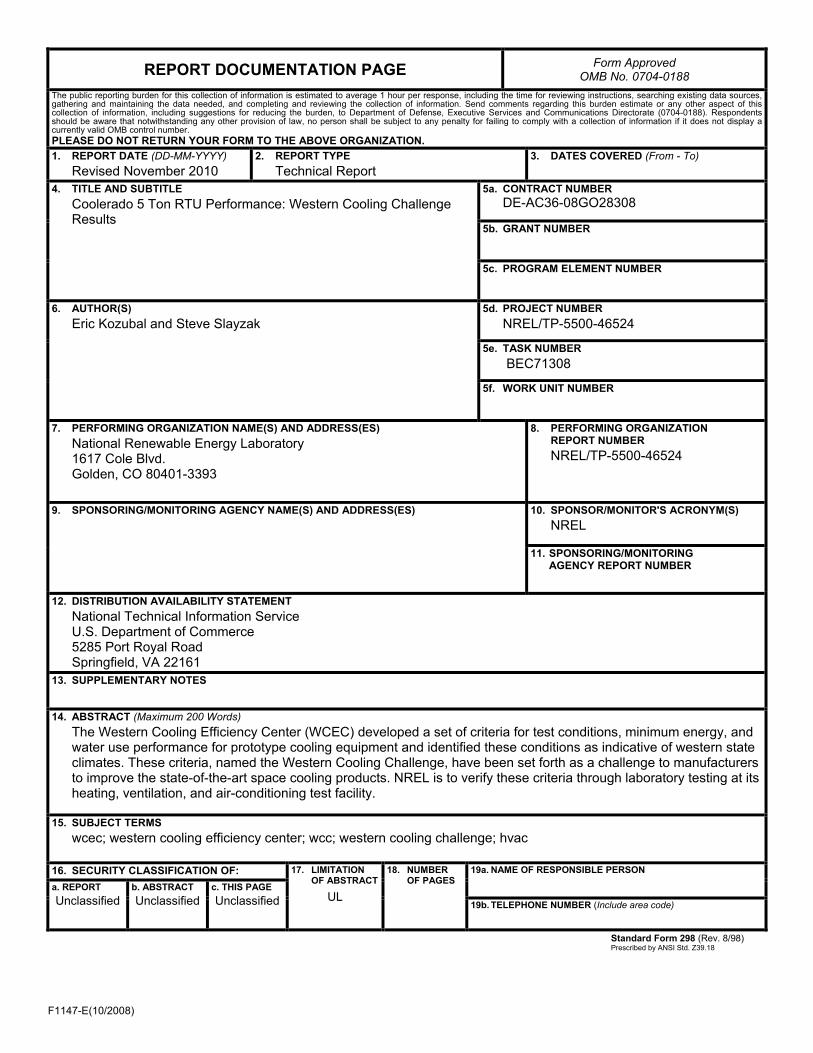
REPORT DOCUMENTATION PAGE Form Approved OMB No. 0704-0188
The public reporting burden for this collection of information is estimated to average 1 hour per response, including the time for reviewing instructions, searching existing data sources, gathering and maintaining the data needed, and completing and reviewing the collection of information. Send comments regarding this burden estimate or any other aspect of this collection of information, including suggestions for reducing the burden, to Department of Defense, Executive Services and Communications Directorate (0704-0188). Respondents should be aware that notwithstanding any other provision of law, no person shall be subject to any penalty for failing to comply with a collection of information if it does not display a currently valid OMB control number. PLEASE DO NOT RETURN YOUR FORM TO THE ABOVE ORGANIZATION. 1. REPORT DATE (DD-MM-YYYY)
Revised November 2010 2. REPORT TYPE
Technical Report 3. DATES COVERED (From - To)
4. TITLE AND SUBTITLE
Coolerado 5 Ton RTU Performance: Western Cooling Challenge Results
5a. CONTRACT NUMBER DE-AC36-08GO28308
5b. GRANT NUMBER
5c. PROGRAM ELEMENT NUMBER
6. AUTHOR(S) Eric Kozubal and Steve Slayzak
5d. PROJECT NUMBER NREL/TP-5500-46524
5e. TASK NUMBER BEC71308
5f. WORK UNIT NUMBER
7. PERFORMING ORGANIZATION NAME(S) AND ADDRESS(ES) National Renewable Energy Laboratory 1617 Cole Blvd. Golden, CO 80401-3393
8. PERFORMING ORGANIZATION REPORT NUMBER NREL/TP-5500-46524
9. SPONSORING/MONITORING AGENCY NAME(S) AND ADDRESS(ES)
10. SPONSOR/MONITOR'S ACRONYM(S) NREL
11. SPONSORING/MONITORING AGENCY REPORT NUMBER
12. DISTRIBUTION AVAILABILITY STATEMENT National Technical Information Service U.S. Department of Commerce 5285 Port Royal Road Springfield, VA 22161
13. SUPPLEMENTARY NOTES
14. ABSTRACT (Maximum 200 Words) The Western Cooling Efficiency Center (WCEC) developed a set of criteria for test conditions, minimum energy, and water use performance for prototype cooling equipment and identified these conditions as indicative of western state climates. These criteria, named the Western Cooling Challenge, have been set forth as a challenge to manufacturers to improve the state-of-the-art space cooling products. NREL is to verify these criteria through laboratory testing at its heating, ventilation, and air-conditioning test facility.
15. SUBJECT TERMS wcec; western cooling efficiency center; wcc; western cooling challenge; hvac
16. SECURITY CLASSIFICATION OF: 17. LIMITATION OF ABSTRACT
UL
18. NUMBER OF PAGES
19a. NAME OF RESPONSIBLE PERSON a. REPORT
Unclassified b. ABSTRACT Unclassified
c. THIS PAGE Unclassified 19b. TELEPHONE NUMBER (Include area code)
Standard Form 298 (Rev. 8/98) Prescribed by ANSI Std. Z39.18


![Air Ki.docxm e\,n\-r, maih0,n]t0,m[p,zeumo57s-5].nsyrmy\s.,oe-rtu,\ntrywzeply-](https://static.fdocuments.net/doc/165x107/55cf9c38550346d033a91288/air-kidocxm-en-r-maih0nt0mpzeumo57s-5nsyrmysoe-rtuntrywzeply-.jpg)