Cool to be Smart or Smart to be Cool? Understanding Peer … · Ali-Bob, Natalia Baclini, Cameron...
38
Review of Economic Studies (2018) 01, 0–?? 0034-6527/18/00000000$02.00 c 2018 The Review of Economic Studies Limited 1 Cool to be Smart or Smart to be Cool? Understanding Peer Pressure in Education LEONARDO BURSZTYN University of Chicago and NBER GEORGY EGOROV Kellogg School of Management, Northwestern University and NBER ROBERT JENSEN Wharton School, University of Pennsylvania and NBER First version received October 2017; final version accepted January 2018 (Eds.) We model and test two school-based peer cultures: one that stigmatizes effort and one that rewards ability. The model shows that either may reduce participation in educational activities when peers can observe participation and performance. We design a field experi- ment that allows us to test for, and differentiate between, these two concerns. We find that peer pressure reduces takeup of an SAT prep package virtually identically across two very different high school settings. However, the effects arise from very distinct mechanisms: a desire to hide effort in one setting and a desire to hide low ability in the other. Key words: Peer pressure, Education, Field experiment, Signaling. JEL Codes: I21, I24, D83, C93 1. INTRODUCTION Most people care, to at least some degree, about their social image or what others think about them. 1 Such concerns are often highly pronounced among adolescents, who may care deeply about establishing an image or identity, and whose behavior may accordingly be heavily influenced by a desire to shape how they are viewed by their 1. We would like to thank the editor, Nicola Gennaioli, and four anonymous referees for valuable comments. We would also like to thank Alex Frankel, Roland Fryer, Emir Kamenica, John List, Gautam Rao, Dmitry Taubinsky, Noam Yuchtman, and seminar participants at the Advances with Field Experiments conference, Columbia, Harvard, MIT, NBER Summer Institute (Children/Labor Studies and Political Economy), Northwestern, Stanford GSB, UC Berkeley, UC Davis, UCSD, the University of Chicago, the University of Zurich, WashU, and the World Bank for feedback and suggestions. Ahmed Ali-Bob, Natalia Baclini, Cameron Burch, Diego De La Peza, Stefano Fiorin, Misha Galashin, Vasily Korovkin, Shelby McNabb, Matthew Miller, Aakaash Rao, and Benjamin Smith provided excellent research assistance. Our study was approved by the UCLA Institutional Review Board and the Los Angeles Unified School District Committee on External Research Review. The experiment reported in this study can be found in the AEA RCT Registry (#0000975). 1. The idea that a desire to shape one’s social image or signal one’s type may affect behavior is at the core of the concepts of signaling in economics (Spence 1973), impression management or self-presentation in sociology (Goffman 1959) and the role of “situation” in social psychology (Lewin 1936, Ross and Nisbett 1991). Concerns about image or social pressure also appear in the literature on norms (B´ enabou and Tirole 2011, Acemoglu and Jackson 2017), status goods (Veblen 1899, Frank 1985, Leibenstein 1950, Bagwell and Bernheim 1996), identity (Akerlof and Kranton 2000, 2010), conformity (Bernheim 1994), and pro-social behavior (B´ enabou and Tirole 2006). 1
Transcript of Cool to be Smart or Smart to be Cool? Understanding Peer … · Ali-Bob, Natalia Baclini, Cameron...

Review of Economic Studies (2018) 01, 0–?? 0034-6527/18/00000000$02.00
c© 2018 The Review of Economic Studies Limited
1
Cool to be Smart or Smart to be Cool?Understanding Peer Pressure in Education
LEONARDO BURSZTYN
University of Chicago and NBER
GEORGY EGOROV
Kellogg School of Management, Northwestern University and NBER
ROBERT JENSEN
Wharton School, University of Pennsylvania and NBER
First version received October 2017; final version accepted January 2018 (Eds.)
We model and test two school-based peer cultures: one that stigmatizes effort and onethat rewards ability. The model shows that either may reduce participation in educationalactivities when peers can observe participation and performance. We design a field experi-ment that allows us to test for, and differentiate between, these two concerns. We find thatpeer pressure reduces takeup of an SAT prep package virtually identically across two verydifferent high school settings. However, the effects arise from very distinct mechanisms: adesire to hide effort in one setting and a desire to hide low ability in the other.
Key words: Peer pressure, Education, Field experiment, Signaling.
JEL Codes: I21, I24, D83, C93
1. INTRODUCTION
Most people care, to at least some degree, about their social image or what othersthink about them.1 Such concerns are often highly pronounced among adolescents, whomay care deeply about establishing an image or identity, and whose behavior mayaccordingly be heavily influenced by a desire to shape how they are viewed by their
1. We would like to thank the editor, Nicola Gennaioli, and four anonymous referees for valuablecomments. We would also like to thank Alex Frankel, Roland Fryer, Emir Kamenica, John List,Gautam Rao, Dmitry Taubinsky, Noam Yuchtman, and seminar participants at the Advances with FieldExperiments conference, Columbia, Harvard, MIT, NBER Summer Institute (Children/Labor Studiesand Political Economy), Northwestern, Stanford GSB, UC Berkeley, UC Davis, UCSD, the Universityof Chicago, the University of Zurich, WashU, and the World Bank for feedback and suggestions. AhmedAli-Bob, Natalia Baclini, Cameron Burch, Diego De La Peza, Stefano Fiorin, Misha Galashin, VasilyKorovkin, Shelby McNabb, Matthew Miller, Aakaash Rao, and Benjamin Smith provided excellentresearch assistance. Our study was approved by the UCLA Institutional Review Board and the LosAngeles Unified School District Committee on External Research Review. The experiment reported inthis study can be found in the AEA RCT Registry (#0000975).
1. The idea that a desire to shape one’s social image or signal one’s type may affect behavioris at the core of the concepts of signaling in economics (Spence 1973), impression management orself-presentation in sociology (Goffman 1959) and the role of “situation” in social psychology (Lewin1936, Ross and Nisbett 1991). Concerns about image or social pressure also appear in the literature onnorms (Benabou and Tirole 2011, Acemoglu and Jackson 2017), status goods (Veblen 1899, Frank 1985,Leibenstein 1950, Bagwell and Bernheim 1996), identity (Akerlof and Kranton 2000, 2010), conformity(Bernheim 1994), and pro-social behavior (Benabou and Tirole 2006).
1

2 REVIEW OF ECONOMIC STUDIES
peers.2 Yet behavior during this period of life, such as in relation to schooling, can alsohave significant, long-lasting and potentially irreversible consequences. It is thereforeimportant to understand whether, and why, schooling choices are influenced by concernsover social image. For example, Coleman (1961) argued that some peer “societies” inwhich teens find themselves may adversely influence educational investments. Morerecently, Bursztyn and Jensen (2015) find that schooling investments, including bothtakeup of a free SAT prep course and effort exerted in practicing for a high-stakes highschool exit exam, are greatly, and negatively, affected when those behaviors are observableto peers.3
Despite these suggestions of potentially powerful negative effects of image concerns,little is known about exactly what image students are concerned with in relation toschooling decisions. In other words, when students make educational choices that mayappear to harm their long-run opportunities, what in particular are they trying tosignal to their peers? Bursztyn and Jensen (2015) for example simply document thatobservability affects behavior; they are unable to provide any insights into the underlyingmechanism(s). Yet understanding this underlying motivation is likely to yield importantinsights both for understanding the root causes of educational underachievement and fordesigning corrective policy strategies. In this paper, we model two underlying mechanismsfor negative peer pressure effects and provide a field test that allows us to us todifferentiate them.
Negative peer pressure in education is often explained by the presence of a socialstigma associated with the takeup of educational activities. A prominent rationalizationof this stigma is given by the “Acting White” framework by Austen-Smith and Fryer(2005).4 In their model, students have both a social type and an economic type. Inchoosing how much educational effort to exert, they face the problem of simultaneouslysignaling to two audiences: peers and firms. Peers like students who are high social types,while firms want to hire high economic types. As in the classic signaling model of Spence(1973), the psychic cost of studying is assumed to be lower for high economic types.However, if studying is also costlier for high social types (e.g., the opportunity cost isgreater), in the “Acting White” equilibrium students reduce their educational effort toavoid sending the signal to peers that they are a low social type. More broadly, the“Acting White” hypothesis suggests that minority students may face punishment frompeers for exerting effort because it signals that they are weakly attached to the group(Fordham and Ogbu 1986, Austen-Smith and Fryer 2005, Fryer 2007, Fryer and Torelli2010). Thus for example, when the returns in the labor market are low relative to thereturns to group membership, students over some range of underlying ability may decidethat signaling group loyalty is more important when choosing educational effort, i.e., itis “smart to be cool.” And beyond this specific model, it is certainly possible, and in factpopular perceptions would even suggest it is likely, that many students may be motivatedmore broadly by a desire to signal a favorable social type to their peers.
2. Lavecchia, Liu and Oreopoulos (2015) discuss the neuroscience and psychology literature ondevelopment in children and adolescents.
3. The exception is honors classes, where students taking both honors and non-honors classes aremore likely to sign up for the SAT course when their honors peers will observe the decision.
4. Despite the name “Acting White” and motivation that is often drawn from the experiencesof minority students, their framework could apply to any setting where individuals wish to be popularamong peers. For the purposes of this paper, we follow Austen-Smith and Fryer (2005) and use the term“Acting White” to refer to any mechanism where participation in educational activities is stigmatized,while remaining agnostic on whether considerations of race or ethnicity play a role in our experiment.

BURSZTYN ET AL. UNDERSTANDING PEER PRESSURE 3
But what if there is also stigma associated with performance (or, rather,underperformance) in educational activities? In other words, what if peers also likehigh economic types?5 Being thought of as smart, or at least, not being thought ofas unintelligent, may be directly important for utility, or it may be that in some settings,signaling a high economic type to peers has present or future returns. Building on thisobservation, we consider an alternative form of peer social concern in education, namelya concern with revealing low ability when high ability is rewarded by peers, i.e., when it is“cool to be smart.” Many actions that students can undertake may reveal their ability oreconomic type to their peers, such as participating in a class discussion, raising a hand toanswer a question posed by the teacher or to ask a question to clarify material, workingon a group project, or joining a study group. Some students, such as those with lowerability, may then choose not to undertake such actions for fear of revealing their ability.6
More generally, reducing educational effort allows such students to portray themselvesto peers as high social types rather than low economic types. Thus, this social imageconcern results in negative peer pressure effects that on the surface may look exactly likethe “Acting White” hypothesis.
We present a model that incorporates both of these concerns, where students mayvalue either attribute: social type or economic type. The model generates predictionsabout how both mechanisms may influence educational investment behavior, as well ashow the two can be differentiated empirically (or at least, how we can infer which ofthe two is dominant if both are present). In doing so, we build on a much simplifiedversion of Austen-Smith and Fryer (2005), where students have a two-dimensional type(social and economic) and want to signal their social type to their peers. We show thatthe motive to signal either of the two components (social or economic) is sufficient toresult in negative peer pressure, and thus both stories are potentially consistent withthe empirically observed phenomenon, namely that some students may not undertakeimportant educational efforts or investments when they are observable to peers.7 Wefurther show that augmenting the model with a particularly designed lottery yieldsdiffering predictions based on whether concerns for signaling social type or concernsfor signaling economic type prevail in a particular setting.
We test the model using a field experiment in Los Angeles public high schools. Weoffer students free access to a commercially available SAT prep package that includes anonline app, a diagnostic test, and one-on-one tutoring. The core of our test builds onBursztyn and Jensen (2015) in varying at the individual level whether students believethe decision to sign up (and here, the diagnostic test score) will potentially be revealed toclassmates. If students behave differently when they believe their decision will be revealedto peers, it indicates the presence of peer social concerns.
To distinguish between the two proposed mechanisms, we add a lottery and varythe likelihood that students who sign up will win the free SAT package. Assume thatwith probability p, a student who signs up for the lottery will win the package and getthe benefit associated with it. When the decision is public, others will also learn that thestudent signed up. And if they win, their diagnostic test will also be public, which will
5. In Austen-Smith and Fryer (2005), peers are assumed not to care about the individual’seconomic type (as firms are assumed not to care about their social type).
6. Alternatively, as we show below, students may seek opportunities that allow them to signalhigh ability without the risk of actually revealing their true ability. For example, a student may raisetheir hand in class when the teacher asks a question, but only when many others have also raised theirhands, so the likelihood of being called on is low.
7. In Austen-Smith and Fryer (2005), students care about signaling only their social type to theirpeers, and thus, only one mechanism of peer pressure is present in their model.

4 REVIEW OF ECONOMIC STUDIES
reveal their ability to others. If effort is stigmatized, signup rates should increase in pwhen the decision is public.8 In effect, if students face a large social cost just for signingup, they will be more likely to sign up and incur this cost when they have a greaterchance of winning the lottery and receiving the benefit of the package. By contrast,if fear of revealing ability is present, then signup rates should decrease in p when thesignup decision is public. The intuition is that students with low ability can sign upfor the package, which allows them to pool with the high ability types, with very littlerisk of being revealed to be a low ability type (since the diagnostic test score is onlyrevealed if the student wins the package). Thus when the decision to sign up is public,the differential response to p, whether signup increases or decreases in p, allows us todistinguish which of the two motives is present (or, which of the two dominates, sinceboth may apply).
We implement this experiment in three Los Angeles high schools. The choice ofschools was guided by the theory, field work and previous literature, and then pre-registered. We chose one smart-to-be-cool school where we expected effort stigmatizationwas likely to be more important (a lower achieving school with a high share of minoritystudents) and two cool-to-be-smart schools where we expected signaling high ability wasmore likely to be important (higher achieving schools with lower minority shares). Wealso provide subsequent survey evidence confirming that these two types of schools doindeed differ in ways that our model and tests are intended to highlight. Students in cool-to-be smart schools are much more likely to agree that being seen as smart is importantfor being popular in their school. The difference is large, about 40% of the standarddeviation in responses, and statistically significant. Students in cool-to-be-smart schoolsare also more likely to say that if classmates become more popular because they arestudying hard, it is because other students admire hard workers or smart people. Thus,although we view our choice-based test as the ideal approach for identifying peer schoolculture, additional survey validation supports our inference.
Overall, we find that signup rates are lower in all schools when the decision (andpotentially the diagnostic test score) will be revealed to classmates. In fact, the effectsare virtually identical in the two types of schools. On their own, these results could bebeen taken as evidence of the “Acting White” hypothesis, and we might then concludethat this phenomenon was more widespread than we might have believed, even occurringin schools that have a much lower share of minority students. Alternatively, we may havebeen tempted to conclude that the “Acting White” hypothesis was not in fact about“Acting White,” but something different altogether. However, our experimental designallows us to differentiate the two different underlying motivations driving this negativepeer pressure. In the school we pre-registered as a likely smart-to-be-cool school, whendecisions are public, signup rates are indeed higher when p is greater, consistent with agreater concern over revealing effort (signup rates are unaffected by p when the decisionis private). By contrast, signup rates are lower when p is greater in the schools we pre-registered as likely cool-to-be-smart schools when the decision is public, consistent witha greater concern over revealing ability (again, private signup rates are unaffected by p).9
And strikingly, in the cool-to-be-smart schools, when the decision is public the likelihoodof signup declines primarily for students with lower grades when the chance of winning
8. The model predicts that p will have no effect on signup when decisions are private, since thereare no costs associated with signing up or winning when everything is private.
9. Even cutting across schools, if we examine classrooms where students report a greater concernover whether others think they are smart, we see similar patterns.

BURSZTYN ET AL. UNDERSTANDING PEER PRESSURE 5
the package is high rather than low;10 this result is further evidence of the proposedmechanism, since such students are most likely to have low scores revealed throughthe diagnostic test.11 Further consistent with these effects being driven by peer socialconcerns, in both types of schools we see the biggest effects among students who say it isimportant to be popular (these are the students who will have the highest concern abouthow others perceive them). Thus, we find strong support for the model, and evidence ofboth types of concerns.
Although our primary goal is to uncover the mechanisms behind peer pressure, wealso find that students in the public treatment in both types of schools, having been lesslikely to sign up for the SAT prep package, are significantly less likely to have taken theSAT as of our last follow up survey.12 These results suggest that peer pressure concernsmay be strong, since students were willing to give up a lot in order to not reveal effortor ability (the SAT package we offered normally costs a little over $100 dollars (which isparticularly large for these lower income households) and the median reported expectedscore gain among all students offered the package was about 100-120 points). They alsosuggest the potential consequences of peer pressure may be significant.
Although, as noted, Bursztyn and Jensen (2015) also documented peer pressureusing the choice of whether to accept an SAT prep package, the present paper differs inseveral important ways, including a model and a new mechanism, a theory-based test forthe two mechanisms, a modified experimental design, and a broader study setting. Thesedifferences lead to several significant contributions. The first contribution is empirical. Weprovide new results on peer social pressure that notably differ from the previous literature.For example, motivated by the “Acting White” hypothesis, most previous work on thistopic, including Bursztyn and Jensen (2015), focused almost exclusively on low-incomeand minority settings. We show that negative peer pressure in important educationalchoices is more common and widespread than previously considered by documentingits existence in middle-income schools with lower minority shares. Additionally, wedocument that two very distinct mechanisms are at play in these two settings. Althoughthe results in Bursztyn and Jensen (2015) are potentially consistent with an “ActingWhite” mechanism, that paper could not, and indeed did not, take a stand on theunderlying mechanism. Here, we find that while in the low income school the phenomenonis something akin to the “Acting White” mechanism, in the higher income schools it isour other mechanism, fear of revealing low ability.
We contribute to theory by modeling (and later empirically verifying) a new channelof peer pressure, where peers reward ability or economic type.13 We believe that this
10. Although grades are an outcome variable, not an innate attribute, they are likely to becorrelated with ability. Further, grades will play an important role in college admissions, which willaffect future earnings, and thus they are a reasonable proxy for a student’s economic type.
11. The same pattern does not hold when the signup decision is private, nor in the smart-to-be-coolschool where we predicted that this mechanism is less likely to be present.
12. However, these are only self-reports. Further, our last follow up was near the end of the academicyear, and many students will take the SAT in their senior year. Thus, we may only be capturing thatstudents take it sooner, or perhaps more times, rather than whether they will ever take it. However, bothof these outcomes may still be potentially valuable for the student. Separately, we verify that access tothe course has effects on test-taking behavior by comparing these outcomes among students randomlyassigned to the low and high probability of winning the package, as well by comparing lottery winnersand losers.
13. Note also in particular the contrast to Spence’s (1973) model of signaling, where the desire tosignal ability (to employers) leads to greater human capital investments. Our model suggests the desireto signal ability (to peers) leads some individuals to reduce human capital investments. Related, in thecontext of social learning, Chandrasekhar et al. (2016) consider whether some agents may be reluctantto ask questions or otherwise seek information from others because doing so may signal low skill.
6 REVIEW OF ECONOMIC STUDIES
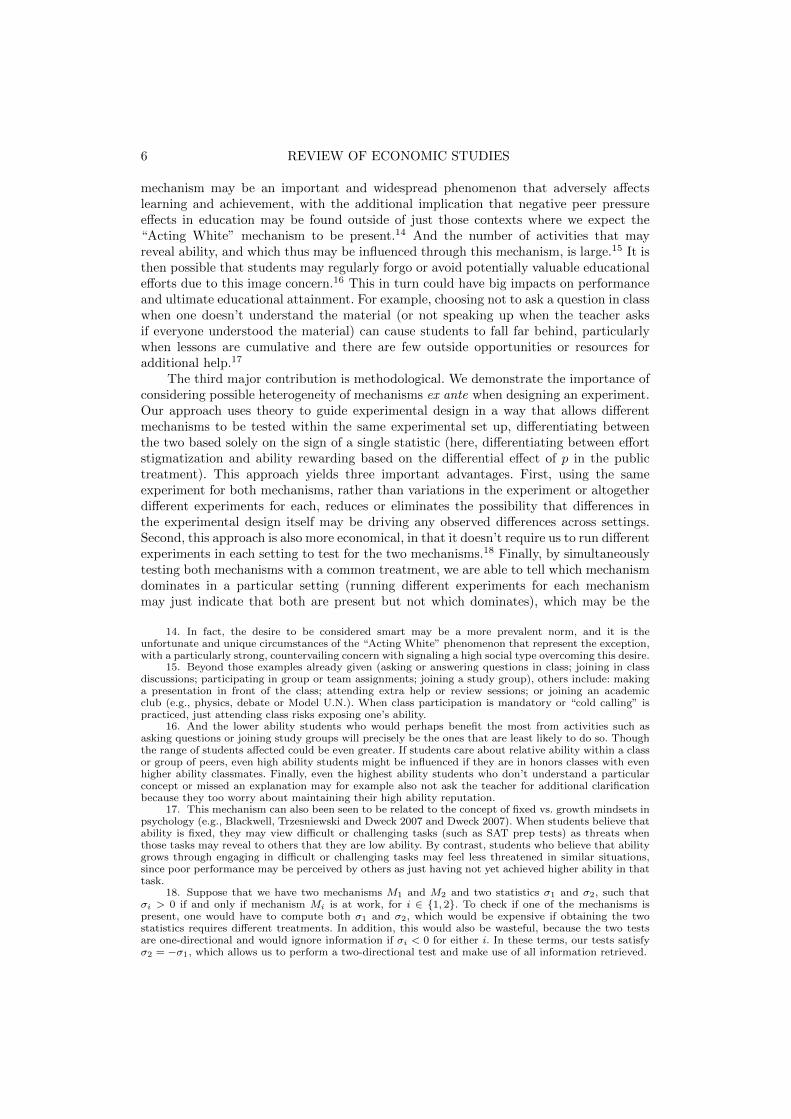
mechanism may be an important and widespread phenomenon that adversely affectslearning and achievement, with the additional implication that negative peer pressureeffects in education may be found outside of just those contexts where we expect the“Acting White” mechanism to be present.14 And the number of activities that mayreveal ability, and which thus may be influenced through this mechanism, is large.15 It isthen possible that students may regularly forgo or avoid potentially valuable educationalefforts due to this image concern.16 This in turn could have big impacts on performanceand ultimate educational attainment. For example, choosing not to ask a question in classwhen one doesn’t understand the material (or not speaking up when the teacher asksif everyone understood the material) can cause students to fall far behind, particularlywhen lessons are cumulative and there are few outside opportunities or resources foradditional help.17
The third major contribution is methodological. We demonstrate the importance ofconsidering possible heterogeneity of mechanisms ex ante when designing an experiment.Our approach uses theory to guide experimental design in a way that allows differentmechanisms to be tested within the same experimental set up, differentiating betweenthe two based solely on the sign of a single statistic (here, differentiating between effortstigmatization and ability rewarding based on the differential effect of p in the publictreatment). This approach yields three important advantages. First, using the sameexperiment for both mechanisms, rather than variations in the experiment or altogetherdifferent experiments for each, reduces or eliminates the possibility that differences inthe experimental design itself may be driving any observed differences across settings.Second, this approach is also more economical, in that it doesn’t require us to run differentexperiments in each setting to test for the two mechanisms.18 Finally, by simultaneouslytesting both mechanisms with a common treatment, we are able to tell which mechanismdominates in a particular setting (running different experiments for each mechanismmay just indicate that both are present but not which dominates), which may be the
14. In fact, the desire to be considered smart may be a more prevalent norm, and it is theunfortunate and unique circumstances of the “Acting White” phenomenon that represent the exception,with a particularly strong, countervailing concern with signaling a high social type overcoming this desire.
15. Beyond those examples already given (asking or answering questions in class; joining in classdiscussions; participating in group or team assignments; joining a study group), others include: makinga presentation in front of the class; attending extra help or review sessions; or joining an academicclub (e.g., physics, debate or Model U.N.). When class participation is mandatory or “cold calling” ispracticed, just attending class risks exposing one’s ability.
16. And the lower ability students who would perhaps benefit the most from activities such asasking questions or joining study groups will precisely be the ones that are least likely to do so. Thoughthe range of students affected could be even greater. If students care about relative ability within a classor group of peers, even high ability students might be influenced if they are in honors classes with evenhigher ability classmates. Finally, even the highest ability students who don’t understand a particularconcept or missed an explanation may for example also not ask the teacher for additional clarificationbecause they too worry about maintaining their high ability reputation.
17. This mechanism can also been seen to be related to the concept of fixed vs. growth mindsets inpsychology (e.g., Blackwell, Trzesniewski and Dweck 2007 and Dweck 2007). When students believe thatability is fixed, they may view difficult or challenging tasks (such as SAT prep tests) as threats whenthose tasks may reveal to others that they are low ability. By contrast, students who believe that abilitygrows through engaging in difficult or challenging tasks may feel less threatened in similar situations,since poor performance may be perceived by others as just having not yet achieved higher ability in thattask.
18. Suppose that we have two mechanisms M1 and M2 and two statistics σ1 and σ2, such thatσi > 0 if and only if mechanism Mi is at work, for i ∈ {1, 2}. To check if one of the mechanisms ispresent, one would have to compute both σ1 and σ2, which would be expensive if obtaining the twostatistics requires different treatments. In addition, this would also be wasteful, because the two testsare one-directional and would ignore information if σi < 0 for either i. In these terms, our tests satisfyσ2 = −σ1, which allows us to perform a two-directional test and make use of all information retrieved.

BURSZTYN ET AL. UNDERSTANDING PEER PRESSURE 7
most relevant factor for policy design. Related, for studies interested in understandingdifferent cultural settings, whether school-based or otherwise, this choice-based approachoffers a strategy for identifying or revealing underlying cultural factors without the needfor subjective appraisals or direct elicitation from respondents. More generally, there aremany behaviors that may be driven by multiple, differing signaling cultures, for which asimilar methodological approach could prove valuable.
In this way, our paper also relates to a number of recent studies using fieldexperiments to separate the role of different potential mechanisms behind economicphenomenon (e.g., Karlan and Zinman 2009, DellaVigna et al. 2012, and Bursztyn etal., 2014). Unlike previous studies, however, our experiment explicitly departs fromdifferent settings where the dominant mechanism is expected to be different: it is preciselyour goal to show that similar results can be explained by very different channels indifferent settings. Again, considering the potential heterogeneity of environments whendesigning mechanism experiments linked to theory could have important implicationswhen considering generalizing a set of findings. For example, consider our basic findingof nearly identical effects of public signup (pooling the signup rates across levels of p) inthe two types of schools. In the absence of a more precisely constructed test, includingthe one in Bursztyn and Jensen (2015), one might have erroneously inferred that thesame mechanism applied in both settings (or, again, that perhaps the ‘Acting White”mechanism was incorrect).
As a final contribution, the present paper can add to policy debates. For example, weshow that there is a need to focus on the effects of negative peer social pressure on schoolbehaviors even in higher income or low minority share settings. And beyond just providinga way to diagnose the underlying problem, documenting the existence of two differentmechanisms and showing that they apply in different settings is important because thetwo mechanisms suggest very different implications for a wide range of school policiesand practices, such as information and marketing campaigns, grade privacy, honorsrecognition and programs, paying students for inputs or good grades and whether certainschool activities should be mandatory. We discuss these implications further in Section5. The mechanism at play should be part of the policy debate, which again highlightsthe importance of designing experiments to understand heterogeneity of mechanisms.
Our paper contributes to several related literatures. First, we contribute to theliterature attempting to understand the barriers to educational achievement. Under bothmechanisms we model, and empirically in both types of schools we examine, studentsare willing to pass up on potentially valuable opportunities just because of concernsabout how their peers will perceive them. Our paper also contributes to the literature onpeer effects in education by identifying two underlying mechanisms behind such effects(Sacerdote 2001, Zimmerman 2003, Carrell, Fullerton, and West 2009, Duflo, Dupas, andKremer 2011, and Carrel, Sacerdote, and West 2013). A related literature focuses morebroadly on the role of schools and neighborhoods in influencing educational performanceand attainment (Oreopoulos 2003, Jacob 2004, Kling, Liebman, and Katz 2007, Dobbieand Fryer 2011, Fryer and Katz 2013). Our two student peer cultures provide potentialunderlying mechanisms for such effects.
Outside of the educational context, our paper contributes to other literatures as well.Since the seminal work by Spence (1973), there has been a large theoretical literature onsocial signaling. Recently, a number of empirical studies have provided evidence of theimportance of social signaling in a variety of settings, such as effort and performancein the workplace, social learning, voting, political campaign contributions, prosocialbehavior, financial decisions and conspicuous consumption (e.g., Ashraf, Bandiera and

8 REVIEW OF ECONOMIC STUDIES
Jack 2014, Ashraf, Bandiera and Lee 2014, Ariely et al. 2009, Bursztyn et al. 2014,Chandrasekhar et al. 2016, Charles et al. 2009, DellaVigna, List and Malmendier2012, DellaVigna et al. 2017, Mas and Moretti 2009 and Perez-Truglia and Cruces2017; see Bursztyn and Jensen 2017 for a review). We contribute to this literature byexperimentally disentangling different underlying social signaling motivations.
The remainder of this paper proceeds as follows. In the next section, we present thetheoretical framework that incorporates the two types of peer concerns and generatespredictions on how they will influence educational investments, and how the twomechanisms can be distinguished from each other. Section 3 discusses the experimentaldesign and the connection to the theory. Section 4 presents the results and considersalternative explanations. Section 5 discusses the policy implications of these results andconcludes.
2. THEORETICAL FRAMEWORK
The model below is a simplified and modified version of Austen-Smith and Fryer (2005),adapted for the purposes of describing the two mechanisms (as opposed to a single“Acting White” mechanism) and for designing a test to differentiate the two. One notabledifference is the payoffs from education. In Austen-Smith and Fryer (2005), ability is notobserved, and firms pay wages based on both education and inferred ability, the latter ofwhich is assumed to be greater for those choosing higher levels of education because effort(in our setting, described as the takeup of educational activities) is increasing in ability(as in Spence, 1973). Thus, higher takeup of educational activities is a signal of higherability, and if takeup is not stigmatized (students are not treated differently dependingon peers’ inference of their social type), all students would study more. By contrast, wetreat economic ability as also being judged by peers just like social type, and takeup ofeducational activities is assumed to help reveal true ability (to peers).19 We show thatthis alone can make students reduce educational effort in order to avoid revealing thatthey are low economic types.
In what follows, we first present a simple model of signaling social skills, thenaugment it to get a model of signaling economic skills. We then introduce a generalmodel that includes a parameter p that can be used to differentiate the two cases.
2.1. Simple model of “signaling social skills”
There is a continuum of students. They have an opportunity to participate in a certaineducational activity that delivers benefit b > 0, but requires time. The opportunity costof time is student’s private information, and we denote it by ci. We follow Austen-Smithand Fryer (2005) in assuming that this opportunity cost of time reflects the student’s‘social type’. Specifically, there are two social types, low and high, so that ci = l for lowsocial types and ci = h for high social types with l < h; in this way, we save on notationby having ci denote the social type, ci ∈ {l, h}. We denote the share of low social typesby q: Pr (ci = l) = q. In what follows, we assume that l < b < h, so low social types havea positive net benefit b− l > 0 from the educational activity, and high social types havea negative net benefit b − h < 0 from this activity. To save on notation, we normalizel = 0, so the net benefit of low social types equals b.
19. Thus, our model of education is not a pure ‘signaling’ model. For this reason, we will not needto address multiple equilibria and refinements, which are common in signaling models.

BURSZTYN ET AL. UNDERSTANDING PEER PRESSURE 9
Students care about their peers’ perception of their social type; we use λs to denotethe incremental benefit of being seen as a high social type as opposed to low one. Thestudents thus get additional utility λsPr−i (ci = h | Info), where the latter factor reflectsthe probability that the peers put on student i being high social type conditional on Info,which denotes the history of the student’s actions that are common knowledge (publichistory). If we let si ∈ {0, 1} be the student’s decision to sign up for the educationalactivity (si = 1 if the student signs up and si = 0 otherwise), then a student i solves
maxsi∈{0,1}
(b− ci) si + λsPr−i (ci = h | Info) . (2.1)
In what follows, we distinguish between two settings: private and public. In theprivate setting, a student’s decision is not observed by peers, so Info = {∅} (emptypublic history) regardless of the student’s choice. In the public setting, the decision isobserved by the peers, and thus Info = si.
This model is easy to analyze. In the private setting, the second term in (??) isa constant unaffected by si, and student i maximizes (b− ci) si. The student thereforechooses si = 1 if and only if b − ci > 0, i.e., only if ci = l. Consequently, the share ofstudents who sign up is q, and all those that do sign up are low social types, whereashigh social types do not sign up.
In the public setting, high social types (students with ci = h) do not sign up either(the proof of the proposition below fills in the details). Suppose that share r of studentswith ci = l sign up. If so, the payoff of an individual student from signing up is b− ci (inthis case, peers know that the student is a low social type); the payoff from not signing upequals, by Bayes’ formula, λs
1−qq(1−r)+1−q = λs
1−q1−qr . Solving for r, we obtain the following
proposition.
Proposition 1. (Signaling social type) In the private setting, only students withpositive net benefit (low opportunity cost ci = l) sign up, so the share of students whosign up equals q. In the public setting, the share of students who sign up equals q if λs ≤ b;equals 1− λs
b (1− q) ∈ (0, q) if λs ∈(b, b
1−q
), and equals zero if λs ≥ b
1−q .
In other words, signup in the public setting is weakly lower than signup in the privatesetting, and strictly lower if λs is high enough (λs > b).20
2.2. Simple model of “signaling economic skills”
Consider the same model, but assume now that each student also has ability ai (‘economictype’). Suppose that ability is uniformly distributed on [0, 1] for students with eithervalue of ci.
21 Suppose that students do not get stigmatized or rewarded for being high
20. Notice that while we assumed that the reputation cost of signing up does not depend on theprobability p, in equilibrium, it is endogenously higher if p is high. Indeed, for a high p, many low socialtypes (ci = l) sign up (Proposition ??), which means that signing up signals that one has ci = l for sure,while not signing up is a strong signal that ci = h, which leads to a high reputational gap. In contrast, ifp is low, then only a few low social types sign up, and not signing up provides little information, and theposterior is close to the prior, which implies that the reputational gap is smaller. We believe that this(less reputational consequences for a less consequential decision) is a realistic feature that, interestingly,arises in our model endogenously.
21. We follow Austen-Smith and Fryer (2005), who also adopt this assumption for simplicity. Ingeneral, there is no reason to believe that the distributions are the same or, more generally, that abilityand social skills are uncorrelated. Furthermore, the correlation may have either sign. Students with ahigh opportunity cost (i.e., high social type) may also have low ability because they have never invested

10 REVIEW OF ECONOMIC STUDIES
or low social type, so λs = 0; however, they get rewarded for their perceived ability, withcoefficient λe that reflects the incremental benefit of being seen as the best economic typerelative to being seen as the worst one. In addition, assume that in the public setting,signing up reveals not only the fact of signing up si, but also the student’s ability ai(again, peers learn about a student’s ability when they answer or ask a question inclass, during participation in study group or similar activities). The student’s problem istherefore
maxsi∈{0,1}
(b− ci) si + λeEi (E−i (a | Info) | ai) ; (2.2)
here, Info = {∅} in the private setting and Info = (si, ai) in the public setting. In whatfollows, we assume that h � 0, specifically, that h > b + λe; this ensures that studentswith high opportunity costs do not sign up just to reveal their high ability, which wouldlead to positive peer effects, whereas our focus is on negative peer effects.
In this version of the model, the private setting is unchanged: a student signs up ifand only if ci = l. In the public setting, among students with ci = l, smarter studentssign up, as they are more interested in revealing their economic type. More precisely,students with ai close to 1 always sign up. If λe ≤ 2b, then even a student with ci = land ai = 0 prefers to sign up: indeed, in such an equilibrium, by signing up this studentreveals his low economic type but gets the benefit b; if he does not sign up, he pools withhigh social types, who on average have ability 1
2 . For λe > 2b, the equilibrium takes theform of a cutoff: students with ai ≥ t sign up and students with ai < t do not. The cutofft may be found from the following indifference condition:
b+ λet = h
(1− q
1− q + qt
1
2+
qt
1− q + qt
t
2
).
Solving for t, we obtain the following proposition.
Proposition 2. (Signaling economic type) Suppose h is sufficiently high, specificallyh > b + λe. In the private setting, the share of students who sign up equals q. In thepublic setting, the share of students who sign up equals q if λe ≤ 2b; and it equals
1 +bq
λe−
√1− q +
b2q2
λ2e< q
for λe > 2b.
In other words, the share of students who sign up in the private and public settingsis identical for low λe, while the share is lower in the public setting for λe above a certainthreshold.
2.3. Introducing a lottery to separate the two mechanisms
We now consider a joint model of signaling social and economic skills. As before, we useλs and λe to denote the intensities of student’s concerns over their peers’ perceptions of
in this ability, which would imply negative correlation between ability and social type. Alternatively, highability students may be already very well prepared for the SAT, and their opportunity cost of studyingfurther to obtain the same benefit is high; this would imply positive correlation between ability and socialtype. We prefer to remain agnostic about the true correlation and adopt the independence assumptionfor convenience. We note, however, that the results would remain unchanged for low or moderate levelsof correlation, because the baseline results are not knife-edge.

BURSZTYN ET AL. UNDERSTANDING PEER PRESSURE 11
their social and economic types, respectively. In this Section, they both may be positive.Furthermore, we now assume that a student who chose si = 1 (signed up) gets toparticipate in the educational activity with probability p ∈ (0, 1) (formally, there isa random variable wi ∈ {0, 1} that is drawn independently of (ai, ci) and such thatPr (wi = 1) = p). Technically, this means that with probability p, the student gets thebenefit b and pays the opportunity cost ci (and reveals his ability ai in the public setting);with complementary probability 1− p, he neither gets the benefit nor pays the cost, andin the public setting only si is revealed, but not ai.
The student of type (ai, ci) therefore solves
maxsi∈{0,1}
p (b− ci) si + λsPr−i (ci = h | Info) + λeEi (E−i (a | Info) | ai) . (2.3)
Here, Info = {∅} in the private setting. In the public setting, Info is a vector(si = 0,∅,∅) if the student did not sign up, a vector (si = 1, wi = 0,∅) if the studentsigned up but lost the lottery, or a vector (si = 1, wi = 1, ai) if the student signed up andwon the lottery, in which case his ability ai is also revealed.
The result in the private setting is identical to the previous cases: the share ofstudents who sign up is q. In the public setting, high social types (ci = h) do not signup, and the strategies of low social types satisfy a single-crossing condition: if a student iwith ability ai (and ci = l) signs up, then so does a student j with ability aj > ai. Thus,there is a threshold t such that students with ai > t sign up and those with ai < t donot. For a student with type (ai, ci = l), the expected utility if he signs up equals22
Usi=1 (ai, ci) = pb+ λe
(pai + (1− p) 1 + t
2
),
and the expected utility if he does not equals
Usi=0 (ai, ci) = λs1− q
1− q + qt+ λe
(t
2
qt
1− q + qt+
1
2
1− q1− q + qt
);
notice that the latter does not depend on the student’s type. An interior thresholdt ∈ (0, 1) corresponds to an equilibrium if and only if Usi=1 (ai, ci) = Usi=1 (ai, ci) forai = t.
We thus have the following proposition.
Proposition 3. (Characterization of equilibrium) Suppose h > b+ λs + λe. Thenthere is a unique23 equilibrium that satisfies the D1 criterion.24 In the private setting,the share of students who sign up equals q. In the public setting, the share of studentswho sign up equals q if and only if pb ≥ λs + pλe
2 . If pb ≤ (1− q)λs − λe
2 , then nobody
signs up, and for pb ∈((1− q)λs − λe
2 , λs + pλe
2
), the share of students who sign up is
22. In a putative equilibrium where nobody signs up, this is only true for properly chosen out-of-equilibrium beliefs. Proposition ?? shows that this holds in any equilibrium that satisfies the D1 criterion(Cho and Kreps, 1987).
23. Up to behavior of marginal types that may be indifferent; these types have measure zero.24. Without this requirement, there may be additional equilibria, such as one where nobody signs
up, and a student who signs up would be believed to have ci = l and, unless proven otherwise, ai = 0.This equilibrium fails the D1 criterion because the student that gains the most from deviation has ai = 1,as there is a positive probability that this high ai will be revealed. In this signaling game, the receiver isnonstrategic, but one can easily adapt Cho and Kreps (1987) to this case by assuming that it is strategicand has a unique best response that gives the sender (student) the assumed payoff.
12 REVIEW OF ECONOMIC STUDIES
given by
1 + p
2p+qb
λe−
√(1 + p
2p+qb
λe
)2
− q(
1
p+
2b
λe+
2λs (1− q)λe
)∈ (0, q) .
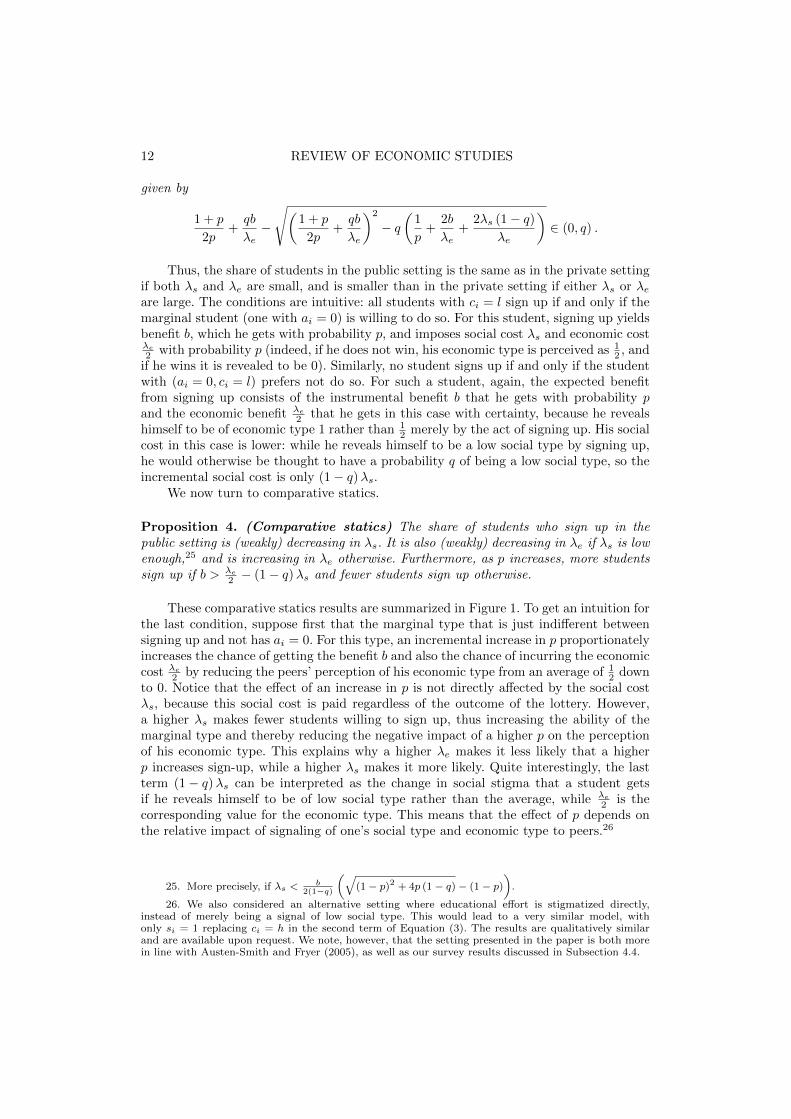
Thus, the share of students in the public setting is the same as in the private settingif both λs and λe are small, and is smaller than in the private setting if either λs or λeare large. The conditions are intuitive: all students with ci = l sign up if and only if themarginal student (one with ai = 0) is willing to do so. For this student, signing up yieldsbenefit b, which he gets with probability p, and imposes social cost λs and economic costλe
2 with probability p (indeed, if he does not win, his economic type is perceived as 12 , and
if he wins it is revealed to be 0). Similarly, no student signs up if and only if the studentwith (ai = 0, ci = l) prefers not do so. For such a student, again, the expected benefitfrom signing up consists of the instrumental benefit b that he gets with probability pand the economic benefit λe
2 that he gets in this case with certainty, because he revealshimself to be of economic type 1 rather than 1
2 merely by the act of signing up. His socialcost in this case is lower: while he reveals himself to be a low social type by signing up,he would otherwise be thought to have a probability q of being a low social type, so theincremental social cost is only (1− q)λs.
We now turn to comparative statics.
Proposition 4. (Comparative statics) The share of students who sign up in thepublic setting is (weakly) decreasing in λs. It is also (weakly) decreasing in λe if λs is lowenough,25 and is increasing in λe otherwise. Furthermore, as p increases, more studentssign up if b > λe
2 − (1− q)λs and fewer students sign up otherwise.
These comparative statics results are summarized in Figure 1. To get an intuition forthe last condition, suppose first that the marginal type that is just indifferent betweensigning up and not has ai = 0. For this type, an incremental increase in p proportionatelyincreases the chance of getting the benefit b and also the chance of incurring the economiccost λe
2 by reducing the peers’ perception of his economic type from an average of 12 down
to 0. Notice that the effect of an increase in p is not directly affected by the social costλs, because this social cost is paid regardless of the outcome of the lottery. However,a higher λs makes fewer students willing to sign up, thus increasing the ability of themarginal type and thereby reducing the negative impact of a higher p on the perceptionof his economic type. This explains why a higher λe makes it less likely that a higherp increases sign-up, while a higher λs makes it more likely. Quite interestingly, the lastterm (1− q)λs can be interpreted as the change in social stigma that a student getsif he reveals himself to be of low social type rather than the average, while λe
2 is thecorresponding value for the economic type. This means that the effect of p depends onthe relative impact of signaling of one’s social type and economic type to peers.26
25. More precisely, if λs <b
2(1−q)
(√(1− p)2 + 4p (1− q)− (1− p)
).
26. We also considered an alternative setting where educational effort is stigmatized directly,instead of merely being a signal of low social type. This would lead to a very similar model, withonly si = 1 replacing ci = h in the second term of Equation (3). The results are qualitatively similarand are available upon request. We note, however, that the setting presented in the paper is both morein line with Austen-Smith and Fryer (2005), as well as our survey results discussed in Subsection 4.4.

BURSZTYN ET AL. UNDERSTANDING PEER PRESSURE 13
Figure 1
3. EXPERIMENTAL DESIGN AND CONNECTION WITH THEORY
3.1. Experimental Design
We conducted our experiment in three public high schools in two areas of Los Angeles,between December 2015 and February 2016. We focused on 11th grade classrooms, sincethis is when students typically begin preparing for the SAT. In the first school, 97% ofstudents are Hispanic/Latino, 74% are eligible for free or reduced-price meals and themedian income in the school’s ZIP code is about $44,000. Approximately 59% of seniorstake the SAT, with an average score of around 1,200. Our sample contains 257 studentsfrom this school. By contrast, averaging across the second and third schools, 33% ofstudents are Hispanic/Latino, 41% are white, 41% are eligible for free or reduced-pricemeals and the median income is about $66,000. Approximately 69% of seniors in theseschools take the SAT, and the average score is around 1,500. We have 254 students fromthese two schools in our sample.
In a sample of 138 LAUSD high schools, the first school is just above the 50thpercentile in the distribution of schools by the share of students eligible for free orreduced-price meals, while the second and third schools are both below the 5th percentile.In terms of the share of non-white students, the first school stands around the 70thpercentile of the distribution, while the second and third schools are both below the 5thpercentile.
Within each school, we coordinated the day and periods of our visits with principalsand school counselors. On the selected dates and times, we chose a selection of classes,across a range of subjects, restricting to non-honors classes. Within each school, thechosen classes were from the same period or from adjacent periods with no overlap ofstudents. Neither students nor teachers were informed about the purpose of our visit.For the three schools together, our sample includes 511 students, across 17 classrooms.
Based on our priors and field work, we chose, and pre-registered, these particularschools for testing our model because we expected effort stigmatization to dominate in thefirst school (the smart-to-be-cool school) and ability rewarding to dominate in the other

14 REVIEW OF ECONOMIC STUDIES
two (the cool-to-be-smart schools).27 Though ultimately our experiment is specificallydesigned to test whether this is the case, we can provide some preliminary evidence thatsupports our priors. After our experiment was complete, we asked students to fill out asurvey (this, and all other survey forms, are provided in the Supplemental Appendix)that included the following item: “To be popular in my school it is important that peoplethink I am smart.” (1: strongly disagree ... 5: strongly agree). In the smart-to-be-coolschool, the mean response was a 2.39. By contrast, the mean was 2.90 in the cool-to-be-smart schools. This mean difference is statistically significant at the 1 percent level.Further, we can reject the null that the two distributions are equal at the 1 percentlevel using a discrete bootstrapped version of the Kolmogorov-Smirnov test with 10,000repetitions. Finally, we also note that this difference is quite large in magnitude; the 0.5mean difference is equal to about 40% of the standard deviation for the pooled sampleof students.
As in Bursztyn and Jensen (2015), the core of our experiment involved offeringstudents the opportunity to sign up for complimentary access to an SAT preparationpackage. Students were handed a form at their desks that included the following:
“[Company Name] is offering a chance to win an SAT prep package intended toimprove your chances of being accepted and receiving financial aid at a collegeyou like. The package includes:
• Premium access to the popular [App Name] test prep app for one year;
• Diagnostic test and personalized assessment of your performance and areas ofstrength and weakness;
• One hour session with a professional SAT prep tutor, tailored to your diagnostictest.
This package is valued at over $100, but will be provided completely free.”
Thus, students were told the value of the SAT preparatory package was over $100and they appear to have highly valued it. Beyond the very high signup rates, as shownbelow, students appeared to believe the package could have a big impact on their testscores. Though the form did not mention any specific expected impact on test scores,when asked on the second survey form, the median expected point gain reported by allstudents in school 1 (not just those who signed up) was 100 (with an average of 426).
27. It is beyond the scope of the present paper to model or test the origin or evolution of peercultures and why they may differ across schools. However, we can offer some intuition, beyond referenceto the Acting White literature, that guided the field work. When students have more limited mobility andfewer labor market opportunities with higher human capital requirements, it might be more important tosignal social type, since one is likely to keep the same group of friends after high school and derive valuefrom maintaining membership in a network with them. Moreover, group loyalty might be particularlyimportant among groups formed by ethnic minorities (Berman 2000, Gans 1962, Lee and Warren 1991,and Ausubel 1977). By contrast, in settings where students are more likely to go to college or havehigher mobility, concerns about maintaining membership in a network of high school friends may beless significant. Alternatively, signaling a higher economic type might be more valuable for futureopportunities within a network when most peers will go on to high paying jobs with high humancapital requirements. Finally, different school cultures may arise due to historical patterns of accessand opportunity. In higher achieving schools with better funding and wealthier and more educatedparents, a higher share of students may have traditionally gone to college, so doing well in school andpreparing for college is the norm. By contrast, in lower achieving or lower income schools, studentsmay have historically faced many barriers to accessing college, so students working hard to do well andplanning for college may be in a small minority.

BURSZTYN ET AL. UNDERSTANDING PEER PRESSURE 15
In schools 2 and 3, the median was 123 (with an average of 338). Thus, forgoing signup,just due to peer social image concerns, represents a real perceived cost to students.28
Within this offer, we used a 2x2 design, cross-randomizing: (i) the probability ofwinning the package conditional on signing up during the experiment, and (ii) whetherstudents were told that the other students in the room would observe their signup decisionand diagnostic test score. Accordingly, the signup form continued as follows:
“If you choose to sign up, your name will be entered into a lottery where youhave a 25% [75%] chance of winning the package.
Both your decision to sign up and your diagnostic test score will be kept com-pletely private from everyone, including [except] the other students in the room.
Would you like to sign up for a chance to win the SAT prep package?”
We refer to the forms containing the 25% chance of winning the lottery as the Lowprobability condition, and those with the 75% chance as the High probability condition.Forms with the word “including” are the Private condition, and those with the word“except” are the Public condition. The forms, shown in the Supplemental Appendix,were otherwise completely identical for the various treatment groups.
Forms with the differing treatments were pre-sorted in an alternating pattern andhanded out to students consecutively in their seats.29 By varying treatment statusamong students within classrooms, our design ensures that students in the variousgroups otherwise experience the very same classroom, teacher and overall experimentalenvironment.
Students were instructed to hold their questions and refrain from communicatingwith anyone until after all of the forms had been collected by our team. Thus, studentscould not coordinate on their signup decisions or observe what other students werechoosing. Further, because students could not communicate with each other, and becausethe forms looked nearly identical at a glance, they would not have been aware that otherswere being given different privacy assurances or a different likelihood of winning thelottery.
After the first form was collected, we distributed a second form containing additionalquestions, discussed in more detail below, followed by assent and consent forms.30
28. Unfortunately, we cannot determine how accurate these estimates are. We are unaware of anyconvincing causal evidence for how much this, or any other SAT prep service, can raise scores. However,in field work we found that 100 points appears to be a commonly held belief about the effect of test prepservices. And a report from the National Association for College Admissions Counseling (Briggs 2009)notes that most prep companies typically claim gains of 100 points (or above). So the expected gainsamong our sample of students seems to be in line with conventional wisdom (whether correct or not).
29. The nature of our experiment, which required handing out forms with varying treatmentassignments in the classroom, precluded us from assigning treatment to each student based on a purerandom draw. However, what is most important for our analysis is that the assignment procedure usedshould result in treatment groups that are similar in expectation, which we verify below. The fact thatstudents may be sitting near friends (in classrooms where students are free to choose where to sit), orthose with the same last name and thus potentially related or of a similar ethnicity (when seats areassigned alphabetically) should not in itself affect our test, since students filled out the forms withoutcommunicating with each other.
30. As originally distributed, the second form in the first school did not include a small numberof questions that were added before visits to the second and third schools. The research team thereforerevisited the first school again in February 2016 and collected answers to these additional questions. Wewere able to survey over 86% of the students from the original sample in that school. Treatments arestill balanced for the sample that was surveyed during the second visit (see Appendix Table A.1).
16 REVIEW OF ECONOMIC STUDIES
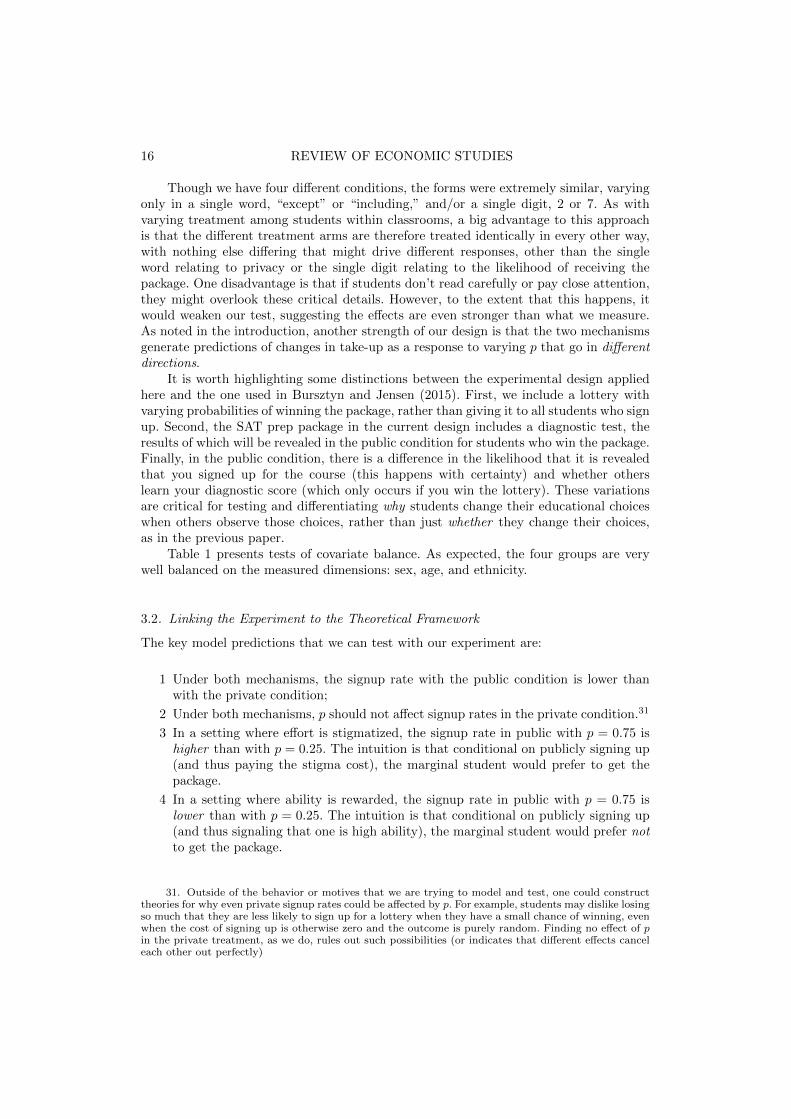
Though we have four different conditions, the forms were extremely similar, varyingonly in a single word, “except” or “including,” and/or a single digit, 2 or 7. As withvarying treatment among students within classrooms, a big advantage to this approachis that the different treatment arms are therefore treated identically in every other way,with nothing else differing that might drive different responses, other than the singleword relating to privacy or the single digit relating to the likelihood of receiving thepackage. One disadvantage is that if students don’t read carefully or pay close attention,they might overlook these critical details. However, to the extent that this happens, itwould weaken our test, suggesting the effects are even stronger than what we measure.As noted in the introduction, another strength of our design is that the two mechanismsgenerate predictions of changes in take-up as a response to varying p that go in differentdirections.
It is worth highlighting some distinctions between the experimental design appliedhere and the one used in Bursztyn and Jensen (2015). First, we include a lottery withvarying probabilities of winning the package, rather than giving it to all students who signup. Second, the SAT prep package in the current design includes a diagnostic test, theresults of which will be revealed in the public condition for students who win the package.Finally, in the public condition, there is a difference in the likelihood that it is revealedthat you signed up for the course (this happens with certainty) and whether otherslearn your diagnostic score (which only occurs if you win the lottery). These variationsare critical for testing and differentiating why students change their educational choiceswhen others observe those choices, rather than just whether they change their choices,as in the previous paper.
Table 1 presents tests of covariate balance. As expected, the four groups are verywell balanced on the measured dimensions: sex, age, and ethnicity.
3.2. Linking the Experiment to the Theoretical Framework
The key model predictions that we can test with our experiment are:
1 Under both mechanisms, the signup rate with the public condition is lower thanwith the private condition;
2 Under both mechanisms, p should not affect signup rates in the private condition.31
3 In a setting where effort is stigmatized, the signup rate in public with p = 0.75 ishigher than with p = 0.25. The intuition is that conditional on publicly signing up(and thus paying the stigma cost), the marginal student would prefer to get thepackage.
4 In a setting where ability is rewarded, the signup rate in public with p = 0.75 islower than with p = 0.25. The intuition is that conditional on publicly signing up(and thus signaling that one is high ability), the marginal student would prefer notto get the package.
31. Outside of the behavior or motives that we are trying to model and test, one could constructtheories for why even private signup rates could be affected by p. For example, students may dislike losingso much that they are less likely to sign up for a lottery when they have a small chance of winning, evenwhen the cost of signing up is otherwise zero and the outcome is purely random. Finding no effect of pin the private treatment, as we do, rules out such possibilities (or indicates that different effects canceleach other out perfectly)
BURSZTYN ET AL. UNDERSTANDING PEER PRESSURE 17
Thus, it is precisely the differential response to p in the public condition (along with,as we will show, a lack of any effect of p in the private condition) that allows us to isolateand test two very different underlying mechanisms with our single experiment.
As noted in the introduction, we consider it a strength of our design, and apotentially valuable methodological insight for other field experiments, that the sameexact treatment can yield a test for both mechanisms. Other approaches, such asdesigning different experiments or treatments to test for the two mechanisms separately,raise the possibility that differences in outcomes are not just due to different mechanisms,but other differences between the two experiments. Further, this approach is more efficientand cost-effective, using all of the available information. In addition, using the sameexperiment in all settings enables a choice based revelation of which motive is dominantin a particular setting. And knowing which mechanism dominates in a particular settingis also likely to be important for policy design.32
4. RESULTS
4.1. Main Results
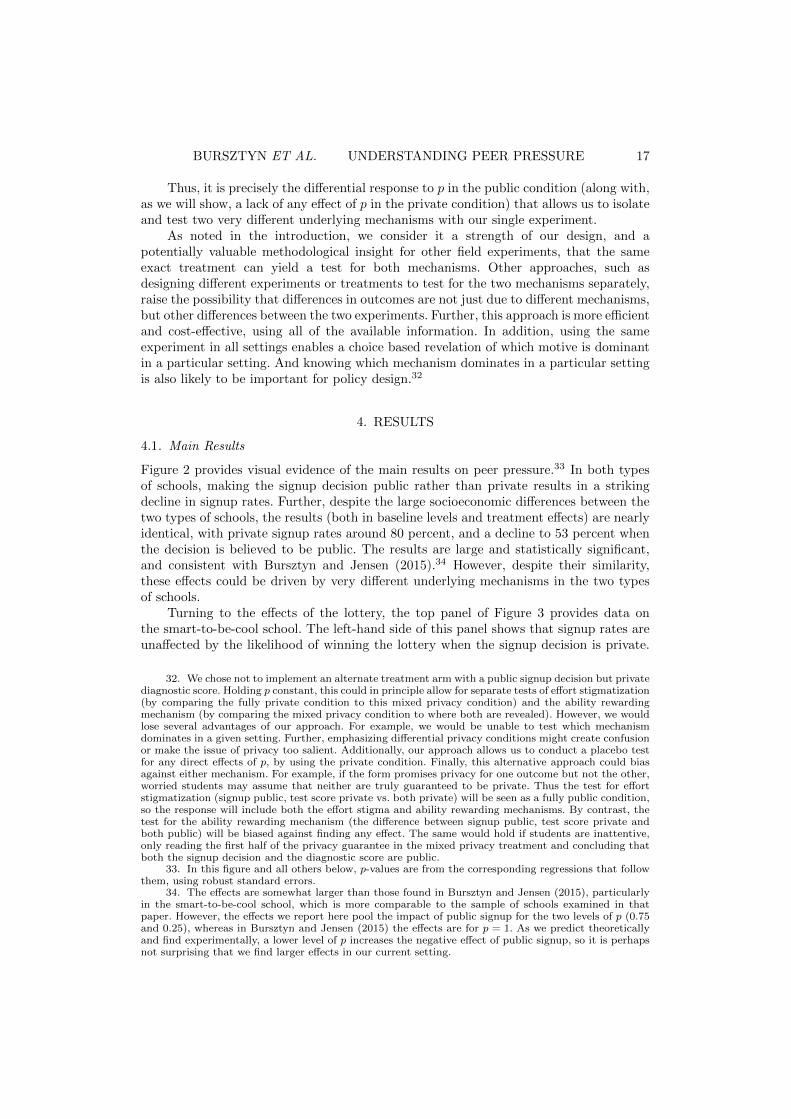
Figure 2 provides visual evidence of the main results on peer pressure.33 In both typesof schools, making the signup decision public rather than private results in a strikingdecline in signup rates. Further, despite the large socioeconomic differences between thetwo types of schools, the results (both in baseline levels and treatment effects) are nearlyidentical, with private signup rates around 80 percent, and a decline to 53 percent whenthe decision is believed to be public. The results are large and statistically significant,and consistent with Bursztyn and Jensen (2015).34 However, despite their similarity,these effects could be driven by very different underlying mechanisms in the two typesof schools.
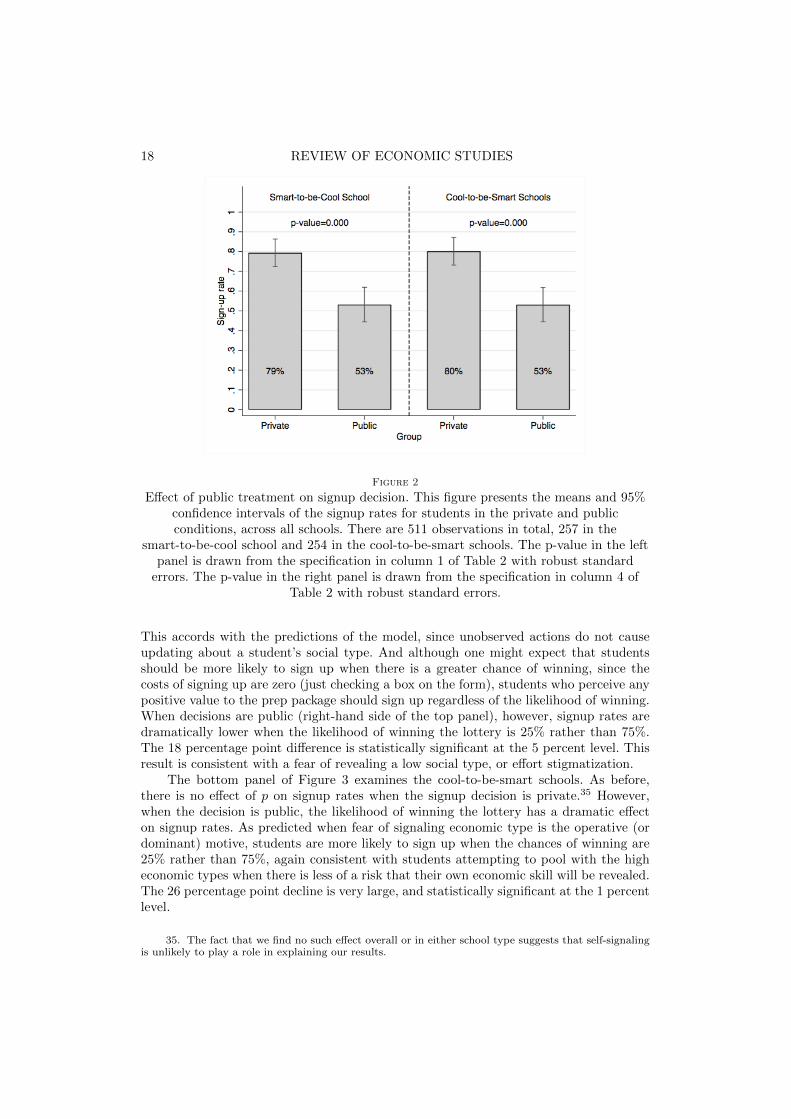
Turning to the effects of the lottery, the top panel of Figure 3 provides data onthe smart-to-be-cool school. The left-hand side of this panel shows that signup rates areunaffected by the likelihood of winning the lottery when the signup decision is private.
32. We chose not to implement an alternate treatment arm with a public signup decision but privatediagnostic score. Holding p constant, this could in principle allow for separate tests of effort stigmatization(by comparing the fully private condition to this mixed privacy condition) and the ability rewardingmechanism (by comparing the mixed privacy condition to where both are revealed). However, we wouldlose several advantages of our approach. For example, we would be unable to test which mechanismdominates in a given setting. Further, emphasizing differential privacy conditions might create confusionor make the issue of privacy too salient. Additionally, our approach allows us to conduct a placebo testfor any direct effects of p, by using the private condition. Finally, this alternative approach could biasagainst either mechanism. For example, if the form promises privacy for one outcome but not the other,worried students may assume that neither are truly guaranteed to be private. Thus the test for effortstigmatization (signup public, test score private vs. both private) will be seen as a fully public condition,so the response will include both the effort stigma and ability rewarding mechanisms. By contrast, thetest for the ability rewarding mechanism (the difference between signup public, test score private andboth public) will be biased against finding any effect. The same would hold if students are inattentive,only reading the first half of the privacy guarantee in the mixed privacy treatment and concluding thatboth the signup decision and the diagnostic score are public.
33. In this figure and all others below, p-values are from the corresponding regressions that followthem, using robust standard errors.
34. The effects are somewhat larger than those found in Bursztyn and Jensen (2015), particularlyin the smart-to-be-cool school, which is more comparable to the sample of schools examined in thatpaper. However, the effects we report here pool the impact of public signup for the two levels of p (0.75and 0.25), whereas in Bursztyn and Jensen (2015) the effects are for p = 1. As we predict theoreticallyand find experimentally, a lower level of p increases the negative effect of public signup, so it is perhapsnot surprising that we find larger effects in our current setting.
18 REVIEW OF ECONOMIC STUDIES
Figure 2
Effect of public treatment on signup decision. This figure presents the means and 95%confidence intervals of the signup rates for students in the private and publicconditions, across all schools. There are 511 observations in total, 257 in the
smart-to-be-cool school and 254 in the cool-to-be-smart schools. The p-value in the leftpanel is drawn from the specification in column 1 of Table 2 with robust standard
errors. The p-value in the right panel is drawn from the specification in column 4 ofTable 2 with robust standard errors.
This accords with the predictions of the model, since unobserved actions do not causeupdating about a student’s social type. And although one might expect that studentsshould be more likely to sign up when there is a greater chance of winning, since thecosts of signing up are zero (just checking a box on the form), students who perceive anypositive value to the prep package should sign up regardless of the likelihood of winning.When decisions are public (right-hand side of the top panel), however, signup rates aredramatically lower when the likelihood of winning the lottery is 25% rather than 75%.The 18 percentage point difference is statistically significant at the 5 percent level. Thisresult is consistent with a fear of revealing a low social type, or effort stigmatization.
The bottom panel of Figure 3 examines the cool-to-be-smart schools. As before,there is no effect of p on signup rates when the signup decision is private.35 However,when the decision is public, the likelihood of winning the lottery has a dramatic effecton signup rates. As predicted when fear of signaling economic type is the operative (ordominant) motive, students are more likely to sign up when the chances of winning are25% rather than 75%, again consistent with students attempting to pool with the higheconomic types when there is less of a risk that their own economic skill will be revealed.The 26 percentage point decline is very large, and statistically significant at the 1 percentlevel.
35. The fact that we find no such effect overall or in either school type suggests that self-signalingis unlikely to play a role in explaining our results.

BURSZTYN ET AL. UNDERSTANDING PEER PRESSURE 19
Figure 3
Effect of public treatment and probability of winning the SAT prep package on signupdecision. Notes: Panel A presents the means and 95% confidence intervals of the signup
rates for students across four conditions or the smart-to-be-cool school: private/lowprobability (N=66), private/high probability (N=65), public/low probability (N=63),and public/high probability (N=63. There are 257 observations in total. The p-valuesare drawn from the specification in column 1 of Table 3 with robust standard errors.
Panel B presents the means and 95% confidence intervals of the signup rates forstudents across four conditions: private/low probability (N=62), private/high
probability (N=64), public/low probability (N=65), and public/high probability(N=63), for the cool-to-be-smart schools. The p-values are drawn from the specification
in column 4 of Table 3 with robust standard errors.
Together, Figures 2 and 3 paint a compelling picture. Based on Figure 2, we findthat making decisions public lowers signup in both types of school. However, the complete
20 REVIEW OF ECONOMIC STUDIES
opposite response to p in the public condition in the two types of schools in Figure 3shows that the underlying mechanisms in the two are very different.
We can confirm this visual evidence with regressions. To replicate Figure 2, weregress an indicator for whether individual i in school s chose to sign up for the preppackage (Signup) on an indicator for whether they were offered the public or privatetreatment (Public), separately for the two types of schools:36
Signupi,j = β0 + β1Publici,j + εi,j , j ∈ {smart to be cool, cool to be smart}, (4.4)
where β1 is the coefficient of interest, namely the estimated effect of making the signupdecision public. In additional specifications, we add other covariates (age and dummiesfor sex and Hispanic) as well as surveyor and classroom fixed effects; the latter furtherisolate the within-classroom variation in the public vs. private condition across students.These results, shown in Table 2, capture the overall effects of making signup public ratherthan private in the two types of schools. In this table and all tables below, in addition top-values from robust standard errors, for relevant coefficients and tests we also presentp-values from wild cluster bootstrap standard errors (where we cluster at the classroomlevel) and permutation tests.37 Ultimately, the three methods yield similar conclusionsin almost all cases (though we point out the few cases where they do not).
To replicate Figure 3, we add to the previous equation a dummy for whether theindividual faced a 0.25 (i.e., low) probability of winning the lottery to get the SAT preppackage (Low probability) and the interaction of the public treatment with the dummyon facing a low probability (Public×Low probability), also separately for the two typesof schools:
Signupi,j = β0 + β1Publici,j + β2Low probabilityi,j + β3Public× Low probabilityi,j + εi,j ,
j ∈ {smart to be cool, cool to be smart},(4.5)
where β2 + β3 measures the difference in signups under the public treatment in the lowvs. high probability lottery conditions. In additional specifications, we again add othercovariates, as well as surveyor and classroom fixed effects. These results are presented inTable 3.
The regression results are very much consistent with what was revealed in thefigures. Table 2 shows that making the decision public reduces signup in both typesof schools, with point estimates of about 0.25 – 0.27. All of the results are significant atthe one percent level, and are robust to including individual covariates and classroomand surveyor fixed effects.38 Table 3 shows that when the decision to sign up is public,the lottery with the lower likelihood of winning the SAT package decreases signup inthe smart-to-be-cool school (first three columns), but increases it in the cool-to-be-smartschools (last three columns). And again, the results are all significant and robust to the
36. For ease of interpretation and readability, we present separate regressions. Pooling both schooltypes and using interactions yields similar conclusions (similarly for other regressions below where wesplit the sample).
37. We use wild cluster bootstrap standard errors because of the small number of clusters (Cameron,Gelbach and Miller 2008). We use permutation tests due to small sample sizes, particularly in analysesthat split the sample into subgroups.
38. The one exception is the coefficient for the smart-to-be-cool school when individual covariatesare added and the wild cluster bootstrap standard errors are used, where the p-value is 0.017.

BURSZTYN ET AL. UNDERSTANDING PEER PRESSURE 21
inclusion of individual covariates or the classroom and surveyor fixed effects (though ina handful of cases, the p-values approach or reach 0.10)
4.2. Further Evidence of the Cool to be Smart Mechanism: Heterogeneity by Grades
The model in Section 2 also makes a direct prediction about how student ability, ai,should affect signup under our proposed cool-to-be-smart mechanism (the smart-to-be-cool mechanism does not depend on ai). If indeed students are trying to signal that theyare high ability in the cool-to-be-smart schools, then a higher probability of revealingthe diagnostic test score should be more likely to dissuade low-performing students fromsigning up for the package in comparison to high-performing students. The intuition issimple: if students know their own ability, those with lower grades will be more afraidof disclosing information about their ability, which will happen if they win the packageand their diagnostic test score is revealed. This fear is less likely to affect students withhigher grades.
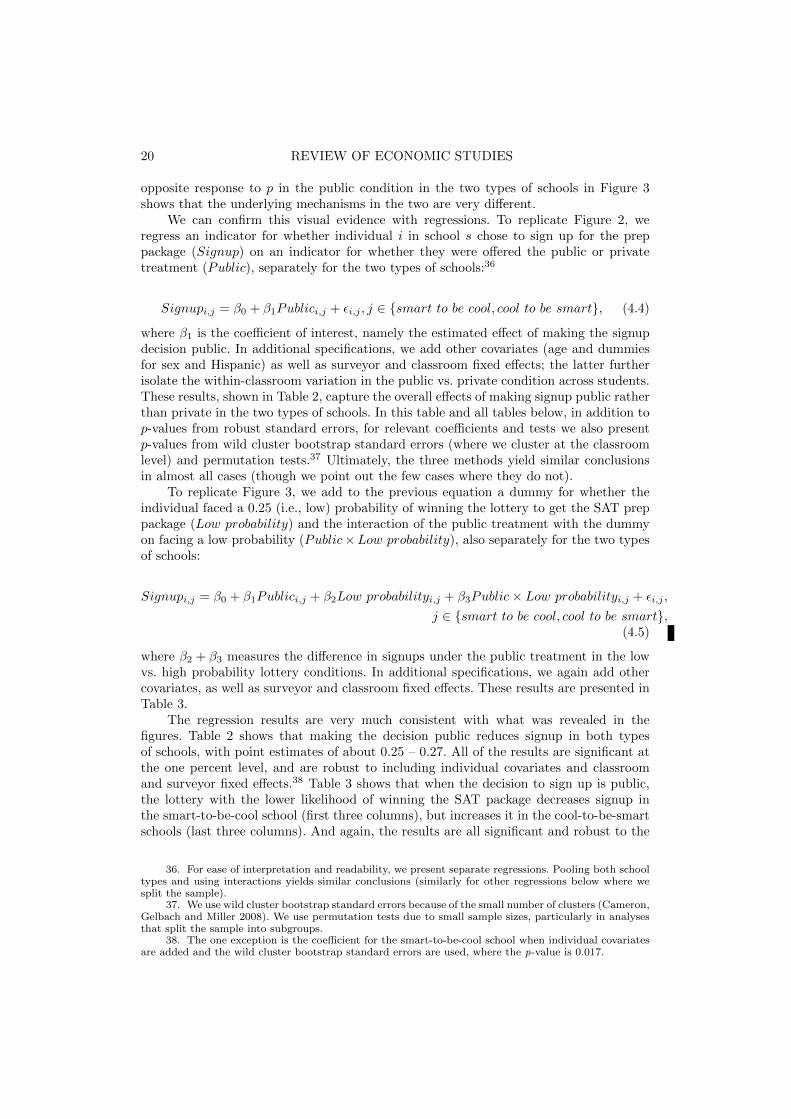
We can test this prediction directly. In the form following the signup decision, wecollected self-reported information about students’ grades, which are a good proxy for ai.Students were asked: “In general, how are your grades?” and were given five options tochoose one from: “a) Mostly A’s; b) Mostly A’s and B’s; c) Mostly B’s and C’s; d) MostlyC’s and D’s; e) Mostly D’s and F’s.” In the cool-to-be-smart schools, 49% of studentspicked options a) or b). We therefore split the sample between those who picked one ofthese two options and those who picked one of the remaining three options, thus gettingas close as possible to a median split.
In the top panel of Figure 4, we restrict the sample to the public condition in thecool-to-be-smart schools. The figure displays the effect of changing the probability ofwinning the lottery on the signup rates, splitting the sample between students below(left-hand side) and above (right-hand side) the median in terms of their grades. Asexpected by the theory, for students with grades below the median, there is a substantialdrop in the signup rate when the probability of getting the package – and thus revealingthe diagnostic test score – goes up. The signup rate under p = 0.25 is 67% and the signuprate under p = 0.75 is 22% (the p-value of the difference is 0.000). For students withgrades above the median, we observe a considerably smaller decrease in signup rates whenthe probability is higher: from 66% to 51% (p=0.243). The drop in signup for studentsbelow the median is significantly larger than for those above the median (p=0.074). Thedifference in the responses of the two groups is large and striking, and consistent withour proposed mechanism.
Under the proposed mechanism, p is not expected in the private condition to have adifferential effect on the signup rate by the ability level of the student. The bottom panelof Figure 4 confirms this prediction. We find no effect of p for either students above orbelow the median in terms of grades: signup rates are all around 80%. Table 4 reproducesthe results of Figure 4 in regression form and confirms the conclusions from the visualevidence.39
39. We regress Signupi,j = β0 +β1High probabilityi,j +β2High probabilityi,j ×Low Gradesi,j +β3Low probabilityi,j ×Low Gradesi,j + εi,j , j ∈ {public, private}. In this regression, β3−β2−β1 is thedifference in singup rates between high and low probability for students with grades below the median,and β3 − β2 is the same difference minus the corresponding difference for students with above mediangrades.
22 REVIEW OF ECONOMIC STUDIES
Figure 4
Signup rates: split by grades – Cool-to-be-Smart schools. Notes: Panel A presents themeans and 95% confidence intervals of the signup rates for students in the public
condition in the cool-to-be-smart schools, separately for students with typical gradesbelow or above the median. The dummy on whether grades are below the median is
constructed by collapsing the answers to the question, “In general, how are yourgrades?” to two categories. Answers “Mostly A’s” and “Mostly A’s and B’s” were
coded as grades above the median. Answers “Mostly B’s and C’s”, “Mostly C’s andD’s” and “Mostly D’s and F’s” were coded as grades below the median. There are 60observations in the left panel and 67 in the right panel. The p-values are drawn from
the specification in column 1 of Table 4 with robust standard errors. Panel B replicatesthe analysis for the private condition in the same schools. There are 68 observations inthe left panel and 58 in the right panel. The p-values are drawn from the specification
in column 4 of Table 4 with robust standard errors.

BURSZTYN ET AL. UNDERSTANDING PEER PRESSURE 23
Figure 5
Signup rates: split by grades – Smart-to-be-Cool schools. Notes: Panel A presents themeans and 95% confidence intervals of the signup rates for students in the public
condition in the smart-to-be-cool school, separately for students with typical gradesbelow or above the median. The dummy on whether grades are below the median is
constructed by collapsing the answers to the question, “In general, how are yourgrades?” to two categories. Answers “Mostly A’s” and “Mostly A’s and B’s” were
coded as grades above the median. Answers “Mostly B’s and C’s”, “Mostly C’s andD’s” and “Mostly D’s and F’s” were coded as grades below the median. There are 86observations in the left panel and 39 in the right panel. The p-values are drawn from
the specification in column 1 of Table 5 with robust standard errors. Panel B replicatesthe analysis for the private condition in the same schools. There are 98 observations inthe left panel and 33 in the right panel. The p-values are drawn from the specification
in column 4 of Table 5 with robust standard errors

24 REVIEW OF ECONOMIC STUDIES
Figure 5 shows that the same pattern does not hold in the smart-to-be-cool school.40
Comparing low vs. high grade students, we cannot reject that p has the same effect onsignup in both the private and public conditions.41 Table 5 again confirms the visualevidence with corresponding regressions.
4.3. Additional Heterogeneity
The model in Section 2 provides additional testable predictions. Our motivatinghypothesis is that students who care about what others think of them will behave inways intended to signal either their economic or social skills. Implicit in this approach isthat all students care about what others think of them. However, some may care morethan others. In the context of our model, we would predict that the share of studentswho sign up under the public treatment should be decreasing in λs in smart-to-be-coolschools and in λe in cool-to-be-smart schools.
Although we do not have a perfect measure of the λ’s, or a student’s true underlyingconcern, in the survey we handed out after the signup forms had been returned, weasked students how important it was for them to be popular. They were given the choiceof answering on a 1 to 5 scale (from “Not important” to “Very important”). Figure 6splits the sample as close to the median as possible, between those who most think itis important (responses 3 to 5) and those who think it is less important (responses 1and 2). The top and bottom panels show that as predicted, those who think it is moreimportant to be popular reduce their signup rates dramatically (34 percentage points inthe smart-to-be-cool school (left-hand side of the top panel) and 43 percentage pointsin the cool-to-be-smart schools (left-hand side of the bottom panel), both significant atthe 1 percent level) when the decision is public compared to those who think it is lessimportant (right-hand side of both panels). The latter group still reduces signup whenthe decision is public, but the differences are much smaller, and even for this group somestill rank the importance of being popular as 2 out of 5, meaning they still care to someextent. Regressions in Table 6 confirm these results.42
Though we chose one school where we expected social type to dominate studentconcerns and two where we expected economic type to dominate, there may be variationwithin schools as well. As noted above, our survey also asked students whether beingconsidered smart is important for being popular in their school. Figure 7 therefore splitsstudents according to whether their classroom average response to whether being viewedas smart is important for being popular is above or below the median for the 17 classroomspooled across the three schools (responses of 3, 4 or 5 vs. 1 or 2). This allows us toboth explore heterogeneity in the response as predicted by the model and helps validatewhether the difference across the two different kinds of schools is likely driven by thedifferent peer concerns rather than other differences across these schools. However, we
40. It is more difficult to attain a median split in the smart-to-be-cool school, (we come closestusing the same criterion as in the cool-to-be-smart schools, with 28% of students reporting either mostlyA’s or mostly A’s and B’s).
41. A higher p is associated with a statistically significant increase in signup in the public treatmentfor students with below median grades. However, we cannot reject that the effect is the same for studentswith above median grades. And note that in both cases, a higher p is associated with an increase insignup, the opposite of our cool-to-be-smart mechanism. Again, when signup is public, students in smart-to-be-cool schools are only willing to incur the stigma costs of signing up when the expected payoff isgreater, and this effect appears to be independent of grades.
42. We regress Signupi,j = β0 + β1Important to be Populari,j + β2Publici,j ×Important to be Populari,j + β3Publici,j × Not Important to be Populari,j + εi,j , j ∈{cool to be smart, smart to be cool}.
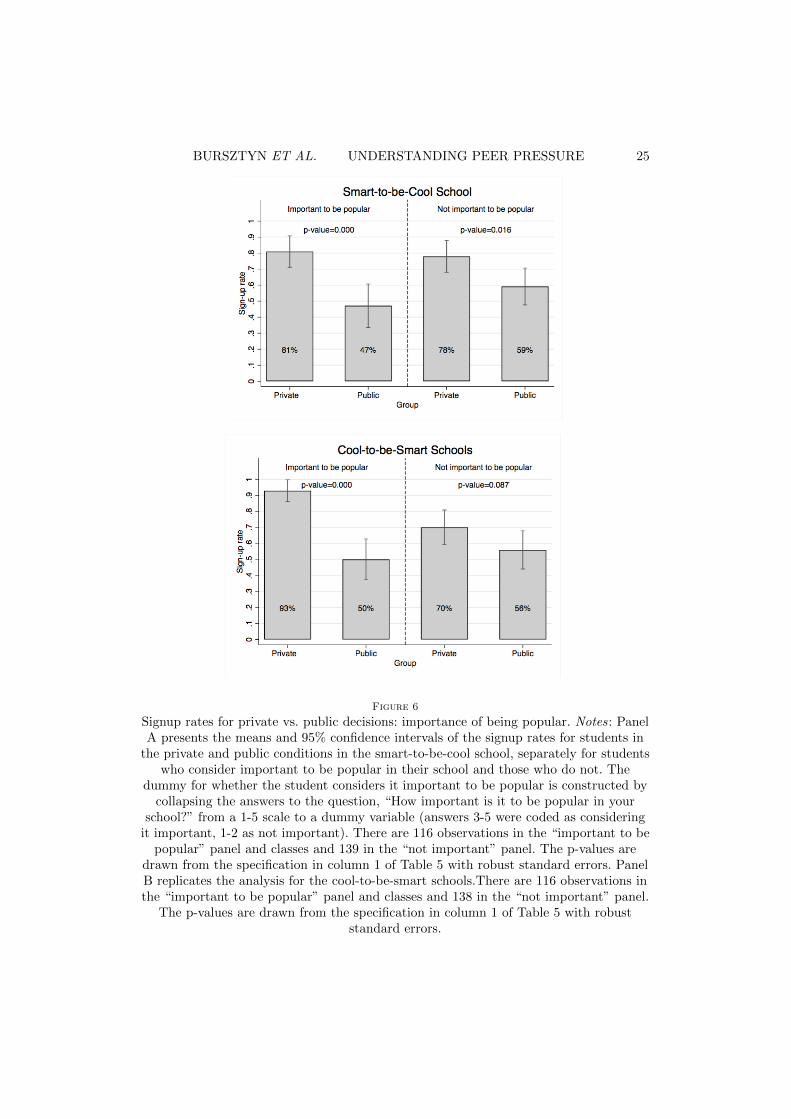
BURSZTYN ET AL. UNDERSTANDING PEER PRESSURE 25
Figure 6
Signup rates for private vs. public decisions: importance of being popular. Notes: PanelA presents the means and 95% confidence intervals of the signup rates for students in
the private and public conditions in the smart-to-be-cool school, separately for studentswho consider important to be popular in their school and those who do not. The
dummy for whether the student considers it important to be popular is constructed bycollapsing the answers to the question, “How important is it to be popular in your
school?” from a 1-5 scale to a dummy variable (answers 3-5 were coded as consideringit important, 1-2 as not important). There are 116 observations in the “important to be
popular” panel and classes and 139 in the “not important” panel. The p-values aredrawn from the specification in column 1 of Table 5 with robust standard errors. PanelB replicates the analysis for the cool-to-be-smart schools.There are 116 observations inthe “important to be popular” panel and classes and 138 in the “not important” panel.
The p-values are drawn from the specification in column 1 of Table 5 with robuststandard errors.

26 REVIEW OF ECONOMIC STUDIES
Figure 7
Effect of public treatment and probability of winning the SAT prep package on signupdecision – split by classrooms above vs. below median in opinion on importance of
being considered smart to be popular. Notes: We split classrooms across all schools bytheir average 1-5 answer to the statement “To be popular in my school it is importantthat people think I am smart.” Panel A restricts the sample to classrooms below themedian, and presents the means and 95% confidence intervals of the signup rates for
students across four conditions: private/low probability (N=70), private/highprobability (N=69), public/low probability (N=65), and public/high probability(N=62). There are 266 observations in total. The p-values are drawn from the
specification in column 1 of Table 6 with robust standard errors. Panel B restricts thesample to classrooms above the median, and presents the means and 95% confidence
intervals of the signup rates for students across four conditions: private/low probability(N=58), private/high probability (N=60), public/low probability (N=63), and
public/high probability (N=64). There are 245 observations in total. The p-values aredrawn from the specification in column 4 of Table 6 with robust standard errors.

BURSZTYN ET AL. UNDERSTANDING PEER PRESSURE 27
should note that almost all of the classrooms above the median in their response to thisquestion are from the two cool-to-be-smart schools and almost all those below are fromthe smart-to-be-cool school (in itself, this observations validates our choice of schools asreflecting the two different types of peer concerns, economic and social).
Using this approach to split our sample into those who care about revealing economictype vs. not, both Figure 7 and the corresponding regression results in Table 7 confirmthe main results above. Students in classrooms with a greater concern about economictype are less likely to sign up in the public treatment when the likelihood of winningthe SAT package is high and the reverse for students in classrooms with less concern foreconomic type 43
4.4. Additional Survey Evidence of Mechanisms
Smart to be Cool. As described in the theoretical framework, and following the modelin Austen-Smith and Fryer (2005), we hypothesize that the social cost associated withdisplaying effort, such as studying, may be driven in part by the fact that this displayreveals that the student has a low opportunity cost of studying, which in turn signalsa low social type. Exerting effort might also indicate that the student intends to go tocollege and perhaps eventually leave the community, which may make them less valuableto the majority of peers who are likely to remain. Though we cannot directly measurewhich particular underlying factor drives the stigma associated with effort, we collectedadditional evidence during a follow-up visit to all three schools between May and June2016.44 As displayed in the follow-up survey form in the Supplemental Appendix, weasked the following question: “Suppose a classmate becomes less popular because he/sheis studying too hard. Why do you think this would happen?” Students were asked topick one option among the following: “a) Because other students don’t like hard workers;b) Because other students now think he/she is not a fun person to spend time with;c) Because other students now think he/she is less likely to be around in the future;d) Other reason (open ended); e) Don’t know.” In the smart-to-be-cool school, 37% ofstudents picked option b). Option a) was picked by 7% of students, and option c) wasonly mentioned by 2% of students. Though only suggestive, these results suggest thatthere is indeed an update in peers’ perception of a student’s social type stemming froma decision to study harder. The low number of students choosing option a) also suggeststhat there is no direct stigma coming from effort per se. It is worth noting that the mostcommon reasons given under “Other reason” in the smart-to-be-cool school were relatedto the student now being too busy to spend time with their friends (9% of students). Inthe cool-to-be-smart schools, where our evidence indicates that effort stigma is not themain driver of negative peer pressure, the evidence from the follow-up survey suggeststhat students seem to understand the mechanisms that would underlay that type ofchannel if it were present in their school: the numbers are very similar to those from thesmart-to-be-cool school (8% picking option a), 36% choosing b), and 4% mentioning c)).
43. We can also explore the model’s prediction that, all else equal, a higher b increases sign-up.Using expected test score gains as a rough proxy for perceived b, and trimming outliers (those with anexpected gain of 1,000 points or more), we find that a one standard deviation increase in expected scoregains increases the sign-up probability by 6 percentage points (p = 0.013). However, we view this resultas suggestive, rather than causal. Further, the expected score increase is only a proxy for b; the true bwould also incorporate the expected likelihood of applying to a college, the expected gain from collegeand other factors, which may well be higher for students who are better prepared and who estimate thescore gain to be low.
44. We were able to survey 77% of students from the original sample.

28 REVIEW OF ECONOMIC STUDIES
Cool to be Smart. As an additional approach to provide suggestive evidence of theproposed mechanism, in the follow up survey we asked the following question: “Nowsuppose a classmate becomes more popular because he/she is studying too hard. Whydo you think this would happen?” Students were asked to pick one option from among thefollowing: “a) Because other students admire hard workers; b) Because other studentsnow think he/she is a smart person and they admire smart people; c) Because otherstudents now think they can get help in their studying from him/her; d) Other reason:(open ended); e) Don’t know.” In the cool-to-be-smart schools, 58% of students pickedeither options a) or b) (29% for each option), and 21% picked option c). In the smart-to-be-cool school, 17% picked option a), 20% chose b), and 30% chose option c. Thesenumbers are again merely suggestive, but they are consistent with the hypothesis of aculture that supports hard work and being smart in the cool-to-be-smart schools.
4.5. Further Evaluating the Stakes: Impact on the Likelihood of Taking the SAT
The main objective of our paper is to test for mechanisms underlying negative peerpressure. For this purpose, the signup decision is the appropriate outcome to examine.However, as an additional way to evaluate the stakes of that decision, we revisitedthe three schools between late May and early June 2016, right before the end of theacademic year. Students were asked to report whether they had already taken the SAT(or the ACT, though the vast majority choose the SAT), their score (if they alreadyhad one), whether they were planning to take one of the exams, and if so, when. Ourgoal is to assess whether the SAT prep package we offered had an impact on actualor anticipated college entrance exam taking. It is important to note however that inanalyzing these outcomes, the effective assignment to different treatments is likely to beweakened due to contamination of the treatment groups, since students in the differenttreatments are likely to have discussed the offer with each other after our team left theclassroom.45 Additionally, once students can communicate, other types of peer effectscould be triggered, such as social learning.
In Table 8, we present the effects on longer-term outcomes. In panel A, we restrictour sample to students in the private condition, across all schools. As discussed earlier,we observe similar signup rates in the private condition across the two levels of p. Infact, we also observe a similar selection of students that sign up in the private conditionacross the two levels of p. Individual characteristics are balanced for students who signup in the private condition for p = 0.75 and p = 0.25 (results available upon request). Wecan therefore examine the reduced-form impact of p (the probability of winning the SATpackage) in the private condition on longer-term outcomes. In the first three columns ofPanel A, we analyze the effect of a higher p on the probability that a student reported tohave already taken the SAT (or ACT) by the time of our follow-up visit. We find evidenceof a marginally significant, positive effect of over 10 percentage points. This amounts toa 40–50% increase in the probability of signup in the low probability group. A sizableshare of students take the SAT on the first June test date, which was a few days after ourvisit. We therefore create another dummy variable for whether the student has alreadytaken the SAT or plans to take it on that date, which is the last SAT exam date during
45. This contamination would bias estimates towards zero, suggesting if anything that our resultsare an underestimate of the true effect.

BURSZTYN ET AL. UNDERSTANDING PEER PRESSURE 29
the academic year. Here we also find significant increases in that likelihood for studentsassigned to the higher probability of getting the prep package.46
In Panel B, we examine the same outcomes, but focus instead of the effect of theprivate condition compared to the public: by how much are these outcomes changed whenthe effects of peer pressure are turned off during the signup stage? This comparison wouldbe relevant for evaluating the reduced-form effects of a policy that made signup private.For the outcomes in columns 1–3, we observe an increase of about 8 percentage points (ora 30% increase) in the probability of reporting to have already taken a college admissionstest by the time of the visit. For the second outcome (columns 4–6), we also observe alarge and significant increase.
Finally, in Panel C, we restrict our sample to those students who signed up for thelottery in the private condition, and compare the SAT-taking behavior of lottery winnersand losers. Here again we find very large and statistically significant effects. Lotterywinners are 15 to 17 percentage points more likely to have taken the SAT by the timeof our return visit, a gain of 60–70% relative to lottery losers. The point estimates areslightly smaller, though still fairly large (13 percentage points) when we also includestudents who report planning to take the SAT instead of just those who report havingalready taken it (the percent gains are also now smaller relative to the (increased) meanfor lottery losers, though they are still over 30%).
These results suggest that our intervention may have had longer-term effects, andagain, that peer pressure may have significant impacts on important investment behaviorsor outcomes. However, in addition to the caveats mentioned above regarding loss ofexperimental control, we interpret our findings with extra caution. Students can stilltake the SAT at a later date, so our measured effect might just have been an increasedlikelihood of taking the test earlier (or, perhaps an indicator of taking it more times ratherthan ever taking it). Further, the outcome is self-reported and there may be a greatersocial-desirability bias in reporting for students who chose to take the prep package orfor those who won the lottery and gained access to it.
4.6. Empirical Challenges and Alternative Explanations
The evidence presented above suggests that in all three schools, social image concernsdiscourage students from engaging in educational effort, at least in the form of preparingfor the SAT (and, possibly, taking it). Further, we argue that the differential effects ofp in the smart-to-be-cool and cool-to-be-smart schools allows us to identify the effortstigmatization mechanism in the former, and the ability rewarding mechanism in thelatter. We also show that other results support the conclusion of our two mechanisms.In this section, we consider several empirical challenges and alternative explanations forour results.
A. Prior information about ability and social type Our tests of these two mechanismsis predicated on the assumption that students continue to take actions, even into the 11thgrade, that attempt to hide or signal something about their ability or social type. Whileone might argue that if that were not the case, we should not expect the results we
46. Unfortunately, we can’t use test scores as an outcome. First, several students who had alreadytaken a college admissions test did not report their scores, either because they had not received them yetor because they chose not to report them. As a result, we end up with too few observations. Moreover,regressions using test scores would either be conditional on the student having already taken the test(thus implying differential selection across treatments) or would bundle the intensive and extensivemargins, making it difficult to isolate the intensive margin effect.

30 REVIEW OF ECONOMIC STUDIES
observe, an alternative interpretation is that some other factor may be responsible forour results.
However, we find it quite reasonable that students still have only a very noisy signalof each other’s abilities or social types. First, there is considerable student turnover inschools.47 Thus, many students regularly start over with a blank slate and must newlyestablish their social and economic type to their new peers. Even those students who donot move may face a considerable influx of new classroom peers every year, for whomthey have to newly establish their reputation. And beyond mobility across schools, theremay be turnover in classmates within the school. In many high schools, students takedifferent classes with different groups of students (for example, because the same coursemay be offered during different periods of the day, plus students have some choice ofwhat courses to take, and because from year-to-year and sometimes even within years,students move back and forth between remedial, regular and honors sections for differentsubjects). Thus, students may regularly find themselves in a classroom with studentsthey have not been with before and therefore feel a need to regularly re-establish theirreputation.
Second, even with a fixed set of peers, there may be secular, group-level changes thatnecessitate renewed or ongoing signaling. For example, as students get older, the rangeand scale of social opportunities generally increases. Accordingly, norms about social typemay change or become more salient, as may the average level of student concern aboutsocial type. Alternatively, as students get closer to graduation and/or college, normsregarding economic type may change or at least become more salient.
Beyond that, individual students may change over time. Student performance, usedby peers to infer ability, may fluctuate over time for reasons such as material becomingmore difficult with school progression (e.g, algebra in 9th grade vs. calculus in 11th), meanreversion, or difficulties in a student’s home or personal life.48 Similarly, adolescenceis a period in which personality, priorities, interests and behavior can change quitedramatically. A student’s true social type, or the social type they want to be perceivedas, may vary over time, requiring renewed signaling.
Finally, regarding ability specifically, the grouping of students into remedial, regularand honors classes provides some rough information on ability, but more fine graineddetail may not be known within these classes (and it may be relative ability within aclass type that is rewarded). For example, a student in a regular class could possibly bea borderline remedial student or a borderline honors student. Plus, when grades are keptprivate, as they are in U.S. high schools, and where students are able to avoid situationsin which ability may be revealed and can in fact potentially deceive others (e.g., lyingabout their grades or saying that they found a difficult exam to be easy), students mayonly have a noisy signal of each other’s ability.
47. Most states do not track turnover, but the available evidence suggests that the rates are high. AGAO report found that over 90% of students switched schools (for reasons other than grade promotion)at least once between kindergarten and 8th grade, with nearly 2/3 having switched two or more times(GAO 2010). For Rhode Island, which does collect data on turnover, in several school districts (includingProvidence, the largest), over 25% of high school students changed schools during the 2014-15 academicyear alone (Providence Journal 2016). Annual turnover rates like these repeated over many years couldlead to considerable changes in one’s classmates. For example, a report for Washington D.C. finds thatof 123 students graduating from one high school, only 27 (22%) were in that school at any point duringtheir freshman year (Washington Post 2015).
48. Related, people may just forget over time; a signal of high ability revealed in 9th grade maynot be sufficient to sustain a reputation of high ability without additional reinforcement.
BURSZTYN ET AL. UNDERSTANDING PEER PRESSURE 31
Thus overall, between changes in peer group composition, group level changes,changes in individual students, and the possibility that people forget over time, theremay always be a need for constant signaling to reinforce or re-establish one’s image orreputation. In fact, we believe that the very importance and broader relevance of themechanisms we consider is precisely the possibility that, given how many behaviors mayreveal ability or social type, students may regularly alter their behavior with respect toimportant decisions that may influence learning or educational outcomes.
B. Signing up signals low income. An alternative explanation for the finding thatsignup is lower when the decision is public is that signup may signal coming from a poorhousehold, which may itself be stigmatized. For example, wealthier students may notneed the free course we offered because they have other, more expensive prep optionsavailable to them.
However, for the smart-to-be-cool school, the median annual income is only $44,000,which is quite low. Further, nearly three-quarters of students are eligible for free orreduced-price meals. In a setting where the vast majority of students are low income, itseems unlikely that a norm of stigmatizing others who are low income would take hold.49
Even in the cool-to-be-smart schools, the median income is only $66,000, whichis still not very high. But more importantly, if this alternative motive held in theseschools, we would expect that in the public condition, where signup is always revealed,the likelihood of signup should be greater when the probability of winning the lotteryis higher (students would be labeled as poor, and thus incur the stigma cost, just forsigning up; they should be more willing to incur this cost when the expected benefit isgreater). However, this is the opposite of what we observe in these schools.
C. Preference for privacy. A general preference for privacy could also cause studentsto be less likely to sign up when the decision to do so is public. However, our test is drivenby the response of signup to varying the likelihood of winning the lottery (where signupitself is revealed in the public treatment regardless of whether the student wins), whichwould be harder for a general preference for privacy to explain.50 Further, using a similarexperiment, Bursztyn and Jensen (2015) find that making signup public can increase ordecrease signup, depending on which peers a student is with at the time of signup andthus to whom their decision will be revealed; this suggests less of a general concernover privacy and more a concern over differing directions of social pressures created bydifferent peer groups. Finally, to explain our results, the concern over privacy would alsohave to vary with the forms of heterogeneity explored above, such as the importance ofbeing popular.
D. Signup itself signals something about ability. The pattern of lower signup underthe public condition could arise if wanting the SAT prep package is seen as a sign of lowability (higher ability students don’t need it), and low ability is stigmatized. However, webelieve this is unlikely to explain our key results. It is extremely common, if not nearlyuniversal, to use some form of SAT prep, even for high performing students. Further,Bursztyn and Jensen (2015) find that signup for an SAT prep course is over 90 percentamong students in honors classes, and does not vary with whether the decision is public
49. In addition, students may have more of a signal of each other’s income levels, which tend to bemore visible (clothing, laptop, phone, book bag, home, etc.; though of course, conspicuous consumptionmay be used as a way to try to hide low income). And in some cases, students on free or reduced-costlunch receive special tickets to pay for their meals and can also show up at school early for free breakfast(sometimes, free breakfast is even delivered to students in classrooms), which would be visible to others.
50. Concern for privacy could be consistent with the results in the smart-to-be-cool schools(students are more willing incur the loss of privacy when the chance of winning, and thus expectedbenefit, is greater), but not the cool-to-be-smart schools.

32 REVIEW OF ECONOMIC STUDIES
or private; the fact that so many high ability students sign up for a course like this, andare just as willing to do so if their classmates will know, suggests that it is unlikely thatdoing so would be interpreted as a sign of low ability.
The possibility that signup is instead a signal of high ability (only smart studentswould take the SAT because they are the only ones who can get into college), and highability is rewarded is our proposed ability-rewarding mechanism. What remains is thepossibility that signup is a signal of high ability, which is stigmatized. This could helpaccount for the result in the smart-to-be-cool school that students are more willing toincur the stigma costs if the likelihood of winning the course is high. In our data, there isno difference in the distribution of grades in the smart-to-be-cool school between thosewho sign up and those who don’t in the public setting (in either lottery case), whichsuggests that just signing up, without additional information, may not be taken as asignal of high ability.51 However, we cannot rule out this possibility. Empirically, thishypothesis would look similar to the “Acting White” hypothesis. With our setup, wecannot distinguish whether SAT signup in smart-to-be-cool schools is lower when it ispublic, and increases with a greater chance of winning the lottery, because peers punisheffort (trying to get ahead or do well in school), performance (actually doing well inschool) or ability (just being smart), since all three could be signaled by SAT taking.However, there is perhaps a unifying interpretation among the three, namely that somefactor that signals a low social type or a high likelihood of leaving the community isstigmatized by peers.
E. Privacy with respect to parents, teachers or others. Although the signup formspecifically referenced privacy only with respect to classmates, it is possible that studentsmay have also mistakenly believed that the same guarantee applied to parents orteachers.52 We believe that this is unlikely as a general phenomenon, since in both types ofschools, signup was lower when the decision was public, and it seems unlikely that parents,teachers or other school officials would stigmatize or punish students for signing up for afree SAT prep package; if anything, they would likely be disappointed if they learned thatstudents did not sign up.53 However, it is possible that believing that decisions will alsobe revealed to parents or teachers could negatively affect signup. For example, studentswith poor grades may worry that teachers or parents will ridicule them for imaginingthat they might be able to get into college. Or some parents may not want their childto attend college (perhaps hoping they will join the family business or some career thatdoes not require college) or don’t want their children to get their hopes up because theycan’t afford college. We have no data on such cases, but believe they are not likely tobe very widespread. Further, Bursztyn and Jensen (2015) find that students taking bothhonors and non-honors classes respond very differently to the decision being public whenthey are with their honors peers vs. their non-honors peers. It is unlikely that they wouldmake different inferences about whether their parents, teachers or others would knowabout their signup just based on the peers they were sitting with at the time they wereasked. In addition, it seems unlikely that any perceived pressure from parents or teachers
51. Further, in principle a student could also sign up for the SAT prep course and deliberately dopoorly on the diagnostic exam as a way to counter-signal against being high ability. However, this wouldperhaps require a lot of forethought by students at the moment of signup.
52. If students believe that parents or teachers would be informed no matter what would be revealedto classmates, or not informed no matter what, these effects would be differenced out when comparingthe public vs. private regimes.
53. Lower signup rates in the public condition would also then suggest that peer social pressureis even stronger than our results indicate, since students overcome the possible costs they face fromdisappointing a parent or teacher by not signing up.
BURSZTYN ET AL. UNDERSTANDING PEER PRESSURE 33
would vary with the likelihood of winning the lottery, or the reported importance of beingpopular.54
F. Ability to announce signup, winning the lottery and the diagnostic test score evenin the private setting. We cannot rule out that in the private setting, students couldplan to reveal their signup decision to their peers. This, however, should not invalidatethe comparison between private and public settings in either of the school types. In theprivate setting, all students who have a net positive benefit from the prep package (i.e.,those who are supposed to sign up in private setting) would still sign up; some of themmight disclose their grades and some would not, but in either case signing up and notdisclosing anything is better than not signing up and not disclosing. Thus, on the margin,the decision to sign up would not be affected – even though the peers’ beliefs about thestudents who eventually disclose and those who do not may be different.
Related, our model does not explicitly give the agents a choice not to take the test.However, if this were an option, they would always take it. The reason is that the highsocial type would never sign up anyway, and then within the low social type there wouldbe unraveling: whoever wins but does not take it is believed to be the worst economictype (among those who sign up). Given that the test also has positive benefit, all agentswould take the test if they sign up and win the lottery. Thus, our model would predictthe same relationship between the probability of winning and the signup rate for each ofthe two mechanisms even if we allow for the possibility of not taking the test. As such,our predictions do not hinge on any assumption about whether this is possible. Thisimplies that even if in real-life students can refuse to take the test, our experiment stilltests the predictions of our model.
5. POLICY IMPLICATIONS AND CONCLUSION
In this paper, we find strong evidence consistent with peer pressure. High school studentsare willing to forgo educational investment opportunities due to concerns about how theywill be perceived by their classmates. We also show that such behavior can arise fromtwo very different motives.
Although both mechanisms lead to underinvestment or lower effort, it is importantfor school policy to understand which motive is operative. We consider a range ofprograms intended to improve student achievement and how they may be affected bythe prevailing peer culture.
Privacy of grades. In schools where the dominant peer culture is the fear of revealinga low economic type, keeping grades and performance private is likely to be worthwhile.Otherwise, low ability students may reduce effort in order to signal that they are coolrather than low ability. However, in schools where the main worry is signaling a high socialtype, keeping grades private could in fact be detrimental to performance. In general, notall educational effort or investments students can make can be kept private. For example,students must raise their hand in class to ask questions if they want to understandmaterial better. Participation in academic clubs will also be public. If students are goingto face stigma costs for engaging in effort or investments, it would in fact be preferablefor these students to have their grades revealed, so they can at least get the benefit ofrevealing a higher economic type. This also suggests that the emphasis on the privacyof grades, common in the U.S. but less so elsewhere, which may have been a policy
54. Though students who care more about being pleasing friends may also care more about pleasingothers.

34 REVIEW OF ECONOMIC STUDIES
designed to enhance performance at good schools, may in fact have a detrimental effecton performance in worse schools.
Privacy of inputs or effort. By contrast to the recommendations regarding privacyof grades, the exact opposite may apply when it comes to revealing inputs or effort inthe two types of schools. In schools where students care about signaling high ability, itmight be desirable to make inputs or effort as visible as possible. For example, studentsmight be offered the opportunity to sign up for optional or more advanced assignments,books or other materials in class by raising a hand or putting their name on a sign upsheet. Classes might also post lists or create leaderboards for those who read more books(either self-reported or verified by the teacher) or complete more supplemental, extraassignments. Doing so would give low ability students more opportunities to pool withthe high ability students, rather than having to portray themselves as high social types.But in schools where visible effort is stigmatized, making inputs as private as possiblemay induce greater effort.
Incentives for effort or inputs. A number of recent policy experiments have providedfinancial incentives for inputs such as reading books (see Fryer 2017 for discussion),and many schools have begun implementing such policies. Although the success ofsuch programs is mixed, the prevailing peer culture may have implications for theireffectiveness. For example, in smart-to-be-cool schools, incentives may help students avoidthe stigma of exerting effort. Students who are observed reading a book or doing extracredit can claim that they are only doing so for the money, or they can use the moneyto participate in something social, and thus maintain a high perceived social type evenwhile visibly exerting effort. By contrast, these programs may not be as effective in cool-to-be-smart schools, or may even be counterproductive. For example, in the absence ofsuch incentives, reading extra books may be a way that low ability students try to signalhigh ability or pool with high ability types, without the risk of actually revealing ability.Financial incentives may weaken the signaling value of those actions, since others mightthink a student is just reading extra books for the money, thereby possibly reducingeffort.
Participation Mandates. Where effort is stigmatized, mandating participation insome activities may be effective. For example, students will not be singled out for socialstigma if they raise their hand in class, attend a review session or take an SAT prep courseif all students are required to do so. On the other hand, where ability is stigmatized,mandatory participation in some activities may have adverse affects for low abilitystudents. Policies such as cold calling, group work or class presentations may lead toworse outcomes for such students, who may be stigmatized, engage in behaviors to avoidrevealing low ability or otherwise go out of their way to signal a high social type.
Tracking. Although it is often thought that one negative aspect of sorting that affectslow ability students is that they lose out on the positive effects of having high ability peers,our results for cool-to-be-smart schools suggest that high ability peers also have a negativeeffect on low ability students because the latter will want to avoid revealing their lowability. Greater sorting by ability may reduce the stigma of being the lowest ability personwithin a class; the more homogeneous the ability and achievement levels are for studentswithin a class, presumably the less stigma associated with poor performance there willbe. The implications for tracking in smart-to-be-cool schools is more ambiguous. On theone hand, tracking may encourage effort by putting high performing students togetherwith other high performing students (and away from low performing students) who maybe less likely to stigmatize each other’s effort. On the other hand, being placed in a higherperforming track is likely to be visible to one’s peers and may itself be stigmatized.

BURSZTYN ET AL. UNDERSTANDING PEER PRESSURE 35
Information or marketing campaigns to change peer cultures or attitudes. Schoolsoften try to deliver messages to students to encourage greater effort and performance.Understanding which peer concern prevails in a particular school can help in the designof such campaigns or messaging, by tailoring it to the specific peer concern that maybe holding students back. This is particularly important because targeting the wrongmessage could actually be counterproductive. For example, trying to change attitudesso that doing well in school is rewarded rather than stigmatized (to counter the “smartto be cool” norm) by emphasizing all of the positive things associated with doing well,may actually increase the stigma associated with not doing well (creating or worseningthe “cool to be smart” norm). In fact, this presents a sobering possibility; attempts tocounter one form of negative peer social pressure may just lead to another form, withoutimproving outcomes.
Labeling. Some programs may be labeled or marketed differently in the presence ofthese two peer cultures. For example, teachers often make themselves available to studentsafter class. When such programs are labeled as extra help, attending will be perceivedas a sign of low ability. Calling such programs advanced material or enrichment mightreverse some of that stigma in cool-to-be-smart schools. But in schools where effort isstigmatized, the exact opposite may hold. Calling them advanced might make them morestigmatized (there may be less stigma associated with efforts to make sure a student isn’tfailing vs. optional efforts to go beyond what is required for class).
Thus, although policy should of course not be guided by one principle alone,understanding the underlying peer culture would suggest the following recommendations.In cool-to-be-smart schools, preferred policies might include: marketing campaigns thatdestigmatize poor performance; labeling extra help programs as advanced material orenrichment; keeping grades and honors rolls private; making effort visible; not providingfinancial incentives for student effort or inputs; and using fewer mandates. In smart-to-be-cool schools, preferred policies might include: marketing programs that try todestigmatize effort and doing well in school (or emphasizing the future benefits ofschooling); avoiding labeling programs as advanced material or enrichment; providingincentives for effort, but otherwise making effort less visible; using participationmandates; and tracking.
Even when the same recommendations would hold for both types of school cultures,it is still valuable just to recognize when observability affects effort. For example, asnoted, teachers often offer extra help or tutoring to some students after school. Attendingsuch a meeting, even when it is just one-on-one with the teacher, may be visible topeers. In cool-to-be-smart schools, such sessions might be taken as a signal of low ability,reducing students’ willingness to attend. In smart-to-be-cool schools, willingness to attendmaybe be low because it is seen as exerting effort or revealing a low social type. In bothsettings, students may be more likely to attend if teachers are able to offer sessions tostudents privately or remotely, such as through phones, tablets or desktop-based videochat services.
As a final point, beyond these policy implications, we wish to note that although wefocus on SAT test prep, our model and results may have implications for understandinga wider range of student behaviors. For example, in light of our finding that studentsin cool-to-be smart schools attempt to avoid revealing low ability, one might imaginethat students could act out, engage in self-handicapping behavior (for example, visiblyundertaking social activities in order to have an excuse for not doing well), skip classes(to avoid being called on, or when one has to make a presentation in front of the class)or even potentially drop out, due to such motives. Similarly, in smart-to-be-cool schools,

36 REVIEW OF ECONOMIC STUDIES
students who are making effort or performing well may engage in other risky activities(skipping class, using alcohol, tobacco or drugs, being disruptive in class) as a way ofcounter-signaling their social type. While this is not to suggest that all of these behaviorsare driven by peer social motives, our empirical support for these motives suggests thatadditional study of the role they may play in these other behaviors is warranted. And asabove, understanding the underlying mechanism is likely to be important for designingpolicies to address these behaviors.
REFERENCES
ACEMOGLU, D. and JACKSON, M. (2017). “Social Norms and the Enforcement ofLaws,” Journal of the European Economic Association, 15(2), p. 245-295.
AKERLOF, G. and KRANTON, R. (2000). “Economics and Identity,” Quarterly Journalof Economics, 115 (3), p. 715-753.
AKERLOF, G. and KRANTON, R. (2010). Identity Economics: How Our IdentitiesShape Our Work, Wages, and Well-Being, Princeton University Press.
Ariely, Dan, Anat Bracha, and Stephan Meier (2009). “Doing Good or Doing Well? ImageMotivation and Monetary Incentives in Behaving Prosocially,” American EconomicReview, 99(1), p. 544-555.
Ashraf, Nava, Oriana Bandiera, and Kelsey Jack (2014). “No Margin, No Mission?A Field Experiment on Incentives for Public Services Delivery.” Journal of PublicEconomics, 120, p. 1-17.
Ashraf, Nava, Oriana Bandiera, and Scott S. Lee (2014). “Awards Unbundled: Evidencefrom a Natural Field Experiment.” Journal of Economic Behavior & Organization,100, p. 44-63.
Austen-Smith, David and Roland Fryer (2005). “An Economic Analysis of ActingWhite,’” Quarterly Journal of Economics, 120(2), p. 551-583.
Ausubel, David (1977). Maori Youth: A Psychoethnological Study of CulturalDeprivation. Massachusetts: The Christopher Publishing House.
Bagwell, Laurie Simon and B. Douglas Bernheim (1996). “Veblen Effects in a Theory ofConspicuous Consumption,” American Economic Review, 86 (3), p. 349-73.
Benabou, Roland and Jean Tirole (2006). “Incentives and Prosocial Behavior,” AmericanEconomic Review, 96 (5), p. 1652-1678.
Benabou, Roland and Jean Tirole (2011). “Laws and Norms,” NBER Working Paper No.17579.
Berman, Eli (2000). “Sect, Subsidy, and Sacrifice: An Economist’s View of Ultra-Orthodox Jews,” Quarterly Journal of Economics, 115(3), p. 905-953.
Bernheim, B Douglas (1994). “A Theory of Conformity,” Journal of Political Economy,102 (5), p. 841-77.
Blackwell, Lisa S., Kali H. Trzesniewski and Carol S. Dweck (2007). “Implicit Theoriesof Intelligence Predict Achievement Across an Adolescent Transition: A LongitudinalStudy and an Intervention,” Child Development, 78(1), p. 246-263.
Briggs, Derek C. (2009). Preparation for College Admission Exams, National Associationfor College Admissions Counseling Discussion Paper.
Bursztyn, Leonardo, Florian Ederer, Bruno Ferman, and Noam Yuchtman (2014).“Understanding Mechanisms Underlying Peer Effects,” Econometrica, 82(4), p. 1273-1301.
Bursztyn, Leonardo and Robert Jensen (2015). “How Does Peer Pressure AffectEducational Investments?,” Quarterly Journal of Economics, 130(3), p. 1329-1367.

BURSZTYN ET AL. UNDERSTANDING PEER PRESSURE 37
Bursztyn, Leonardo and Robert Jensen (2017). “Social Image and Economic Behavior inthe Field: Identifying, Understanding and Shaping Social Pressure,” Annual Review ofEconomics, Vol. 9, p. 131-153.
Carrell, Scott E., Richard L. Fullerton, and James E. West (2009). “Does Your CohortMatter? Measuring Peer Effects in College Achievement,” Journal of Labor Economics,27, p. 439-464.
Carrell, Scott E., Bruce I. Sacerdote, and James E. West (2013). “From Natural Variationto Optimal Policy? The Lucas Critique Meets Peer Effects,” Econometrica, 81, p. 855-882.
Chandrasekhar, Arun G., Benjamin Golub and He Yang (2016). “Signaling, Stigma, andSilence in Social Learning,” manuscript.
Charles, Kerwin K., Erik Hurst, and Nikolai Roussanov (2009). “ConspicuousConsumption and Race,” Quarterly Journal of Economics, 124(2), p. 425-467.
Cho, In-Koo, and David M. Kreps (1987). “Signaling Games and Stable Equilibria,”Quarterly Journal of Economics, 102(2), p.79-221.
Coleman, James (1961). The Adolescent Society: The Social Life of the Teenager and ItsImpact on Education. Glencoe, IL: Free Press.
DellaVigna, Stefano, John A. List and Ulrike Malmendier (2012). “Testing for Altruismand Social Pressure in Charitable Giving,” Quarterly Journal of Economics, 127(1),p. 1-56.
DellaVigna, Stefano, John A. List, Ulrike Malmendier, and Gautam Rao (2017). “Votingto Tell Others,” Review of Economic Studies, 84(1), p. 143-181.
Dobbie, Will, and Roland G. Fryer, Jr. (2011). “Are High-Quality Schools Enough toIncrease Achievement among the Poor? Evidence from the Harlem Children?s Zone,”American Economic Journal: Applied Economics, 3, p. 158-187.
Duflo, Esther, Pascaline Dupas, and Michael Kremer (2011). “Peer Effects, TeacherIncentives, and the Impact of Tracking: Evidence from a Randomized Evaluation inKenya,” American Economic Review, 101, p. 1739-1774.
Dweck, Carol S. (2007). Mindset: The New Psychology of Success. New York: BallantineBooks.
Fordham, Signithia and John U. Ogbu (1986). “Black Students’ School Success: Copingwith the ‘Burden of Acting White’,” The Urban Review, 18, p. 176-206.
Frank, Robert H (1985). Choosing the Right Pond: Human Behavior and the Quest forStatus, Oxford University Press.
Fryer, Roland G., Jr., and Lawrence F. Katz (2013). “Achieving Escape Velocity:Neighborhood and School Interventions to Reduce Persistent Inequality,” AmericanEconomic Review, 103, p. 232-237 .
Fryer, Roland (2007). “A Model of Social Interactions and Endogenous Poverty Traps,”Rationality and Society, 19(3), p. 335-366.
Fryer, Roland (2017). “The Production of Human Capital in Developed Countries:Evidence from 196 Randomized Field Experiments,” in Duflo, Esther and AbhijitBanerjee, eds., Handbook of Field Experiments, Vol 2. Amsterdam: North-Holland.
Fryer, Roland and Paul Torelli (2010). “An Empirical Analysis of ‘Acting White’,”Journal of Public Economics, 94(5-6), p. 380-96.
Gans, Herbert (1962). The Urban Villagers: Group and Class in the Life of Italian-Americans. New York: The Free Press.
Goffman, Erving (1959). The Presentation of Self in Everyday Life. New York: AnchorBooks.
Government Accountability Office (GAO) (2010). Many Challenges Arise in EducationStudents Who Change Schools Frequently. GAO-11-40.

38 REVIEW OF ECONOMIC STUDIES
Jacob, Brian A. (2004). “Public Housing, Housing Vouchers, and Student Achievement:Evidence from Public Housing Demolitions in Chicago,” American Economic Review,94, p. 233-258.
Karlan, Dean and Jonathan Zinman (2009). “Observing Unobservables: IdentifyingInformation Asymmetries With a Consumer Credit Field Experiment,” Econometrica,77(6), 1993-2008.
Kling, Jeffrey R., Jeffrey B. Liebman, and Lawrence F. Katz (2007). “ExperimentalAnalysis of Neighborhood Effects,” Econometrica, 75, p. 83-119.
Lavecchia, Adam M., Heidi Liu and Philip Oreopoulos (2015). “Behavioral Economics ofEducation: Progress and Possibilities,” IZA Discussion Paper No. 8853.
Lee, Kenneth W. and William G. Warren (1991). “Alternative Education: Lessons fromGypsy Thought and Practice,” British Journal of Educational Studies, 39 (3), p. 311-324.
Leibenstein, Harvey (1950). “Bandwagon, Snob, and Veblen Effects in the Theory ofConsumers? Demand,” Quarterly Journal of Economics, 64 (2), 183-207.
Lewin, Kurt (1936). Principles of Topological Psychology. New York: McGraw-Hill.Mas, Alexandre, and Enrico Moretti (2009). “Peers at Work,” American Economic
Review, 99, p. 112-145.Oreopoulos, Philip (2003). “The Long-Run Consequences of Living in a Poor
Neighborhood,” Quarterly Journal of Economics, 118, p. 1533-1575.Perez-Truglia, Ricardo and Guillermo Cruces (2017). “Partisan Interactions: Evidence
from a Field Experiment in the United States,” Journal of Political Economy, 125(4),p. 1208-1243.
Providence Journal (2016). “Urban R.I. Districts Challenged by Churning,” August 23,2016.
Ross, Lee and Richard E. Nisbett (1991). The Person and the Situation: Perspectives ofSocial Psychology. New York: McGraw-Hill.
Sacerdote, Bruce (2001). “Peer Effects with Random Assignment: Results for DartmouthRoommates,” Quarterly Journal of Economics, 116, p. 681-704.
Spence, Michael (1973). “Job Market Signaling,” Quarterly Journal of Economics, 87(3),p. 355-374.
Washington Post (2015). “Thousands Move in and Out of Schools During the Year,Creating Disruptions,” July 4.
Zimmerman, David J. (2003). “Peer Effects in Academic Outcomes: Evidence from aNatural Experiment,” Review of Economics and Statistics, 85, p. 9-23.
Veblen, Thorstein (1899). The Theory of the Leisure Class, New York: The New AmericanLibrary.