Cool Factor: Hybrid Diesel-Electric Buses · OC Transpo, the City of Ottawa’s tran- ... of...
6
Sustainable Energy Solutions Canada’s Coolest Cities looked at the question: “What are Canada’s large cities doing to encourage low-carbon choices for personal transportation?” Ottawa is implementing climate solutions through advanced technology The City of Ottawa is reducing greenhouse gas emissions one bus at a time. OC Transpo, the City of Ottawa’s tran- sit service, has been using hybrid diesel-electric buses since November 2008. In total, 177 hybrid buses have been added to the fleet, accounting for almost 20% of OC Transpo’s fleet of full-sized buses. Each hybrid bus is estimated to reduce greenhouse gas emissions by 38% compared to a conven- tional diesel bus. Other advanced technology includes the old-fashioned bicycle with a new twist on ownership. The City of Ottawa intro- duced a pilot bike share program in the summer of 2009. Us- ers pay for the use of the bike and return it to one of the bike stations throughout the city. The limited-scale pilot project consisted of 50 bikes and four stations and generated more than 5,000 trips in its three-month trial period. (See the City of Montreal Case Study for a description of its large-scale bike share program, BIXI.) The City of Ottawa recently intro- duced plans to increase the percentage of people travelling by bicycle and is planning to add almost 2,000 km of new bike lanes. The Ottawa-Gatineau Census Metropolitan Area (CMA; see COOLEST CITIES CANADA’S Ottawa & CMA Cool Factor: Hybrid Diesel-Electric Buses The Ottawa-Gatineau CMA has a relatively low percentage of the population living in neighbourhoods with at least medium density. The Ottawa-Gatineau CMA has a similar percentage (28%) of commuters travelling by bike, transit and by foot as the Toronto and Montreal urban areas. The City of Ottawa did not have current estimates of greenhouse gas emissions or reduction targets at the time this report was produced. Plans are underway to provide this information later in 2010. RESULTS SUMMARY — OTTAWA definition on page 6) is home to more than 1.1 million people and had among the highest percentages of commuters walking, biking or taking transit in 2006. The frac- tion of commuters choosing low-carbon transit is comparable to the Toronto and Montreal metropolitan regions — regions with much higher populations. But that fraction increased only slightly between 2001 and 2006; faster improvements will be needed to significantly reduce greenhouse gas emissions. Challenges remain The City of Ottawa may need to devote more resources to understanding its greenhouse gas emissions from transportation and objectives for reductions. The City of Ottawa was working on estimating city-wide greenhouse gas emissions for 2004, as this report went to press, and will be developing reduction targets in the near future. Other major cities have accomplished these tasks previously. The City of Ottawa and the Ottawa-Gatineau CMA will likely need to incorporate other initiatives to return greenhouse gas emissions to 1990 levels, or even lower. Current accomplishments and a review of trends indicate that new projects and policies to reduce travel distances and encourage low-carbon forms of transportation are needed to reduce emissions. FOR MORE INFORMATION communities.pembina.org Here you will find the complete Coolest Cities technical report, plus all six Case Studies: • Vancouver • Calgary • Edmonton • Toronto • Ottawa • Montreal
Transcript of Cool Factor: Hybrid Diesel-Electric Buses · OC Transpo, the City of Ottawa’s tran- ... of...

Sust
aina
ble
Ener
gy S
olut
ions
Canada’s Coolest Cities looked at the question: “What are Canada’s large cities doing to encourage low-carbon choices for personal transportation?”Ottawa is implementing climate solutions through advanced technologyThe City of Ottawa is reducing greenhouse gas emissions one bus at a time. OC Transpo, the City of Ottawa’s tran-sit service, has been using hybrid diesel-electric buses since November 2008. In total, 177 hybrid buses have been added to the fleet, accounting for almost 20% of OC Transpo’s fleet of full-sized buses. Each hybrid bus is estimated to reduce greenhouse gas emissions by 38% compared to a conven-tional diesel bus.
Other advanced technology includes the old-fashioned bicycle with a new twist on ownership. The City of Ottawa intro-duced a pilot bike share program in the summer of 2009. Us-ers pay for the use of the bike and return it to one of the bike stations throughout the city. The limited-scale pilot project consisted of 50 bikes and four stations and generated more than 5,000 trips in its three-month trial period. (See the City of Montreal Case Study for a description of its large-scale bike share program, BIXI.) The City of Ottawa recently intro-duced plans to increase the percentage of people travelling by bicycle and is planning to add almost 2,000 km of new bike lanes.
The Ottawa-Gatineau Census Metropolitan Area (CMA; see
COOLEST CITIESCANADA’S
Ottawa & CMACool Factor: Hybrid Diesel-Electric Buses
TheOttawa-GatineauCMAhasarelativelylowpercentageofthepopulationlivinginneighbourhoodswithatleastmediumdensity.
TheOttawa-GatineauCMAhasasimilarpercentage(28%)ofcommuterstravellingbybike,transitandbyfootastheTorontoandMontrealurbanareas.
TheCityofOttawadidnothavecurrentestimatesofgreenhousegasemissionsorreductiontargetsatthetimethisreportwasproduced.Plansareunderwaytoprovidethisinformationlaterin2010.
RESULTS SUMMARY — OTTAWA
definition on page 6) is home to more than 1.1 million people and had among the highest percentages of commuters walking, biking or taking transit in 2006. The frac-tion of commuters choosing low-carbon transit is comparable to the Toronto and Montreal metropolitan regions — regions with much higher populations. But that fraction increased only slightly between 2001 and 2006; faster improvements will be needed to significantly reduce greenhouse gas emissions.
Challenges remainThe City of Ottawa may need to devote more resources to understanding its greenhouse gas emissions from transportation and objectives for reductions. The City of Ottawa was working on estimating city-wide greenhouse gas emissions for 2004, as this report went to press, and will be developing reduction targets in the near future. Other major cities have accomplished these tasks previously.
The City of Ottawa and the Ottawa-Gatineau CMA will likely need to incorporate other initiatives to return greenhouse gas emissions to 1990 levels, or even lower. Current accomplishments and a review of trends indicate that new projects and policies to reduce travel distances and encourage low-carbon forms of transportation are needed to reduce emissions.
FOR MORE INFORMATION
communities.pembina.orgHere you will find the complete Coolest Cities technical report, plus all six Case Studies:
• Vancouver• Calgary• Edmonton
• Toronto• Ottawa• Montreal

City of Ottawa’s greenhouse gas reduction targetsThe City of Ottawa is in the process of updating its greenhouse gas reduction targets.
CANADA’S COOLEST CITIES — Case Study
City of Ottawa
City of Ottawa’s strategy for climate action and transportationThe City of Ottawa is a participant in the Partners for Climate Protection program, a network of Canadian municipal govern-ments that have committed to acting on climate change. Otta-wa is working toward setting greenhouse gas reduction targets through a process called Choosing Our Future, an innovative joint planning initiative of the City of Ottawa, the City of Gatineau and the National Capital Commission. The project will include a 100-year long-term vision, along with strategic directions for the next 30 years that will include targeted goals and an action plan for the cities and commission to follow.
The City of Ottawa Transportation Master Plan, released in November 2008, states that there will be a focus on improving walking, cycling and transit options. The City aims to increase the share of morning peak-hour travel by alternative transit modes as follows:
1. Walking modal share will increase from 9.3% in 2005 to 10% in 2031.
2. Cycling modal share will increase from 1.7% in 2005 to 3% in 2031.
3. Transit modal share will increase from 23% in 2005 to 30% in 2031.
To support these objectives, the City of Ottawa has developed a Cycling Plan (2008) and a Pedestrian Plan (2009).
OneoftheCityofOttawa’ssuccessstoriesisthestronguptakeofnewtechnologiesforreducinggreenhousegasemissions.TheCity’s2008TransportationMasterPlansettheobjectiveto“achievestate-of-the-artenvironmentalefficiency,includingfuelefficiencyandareducedgreenhousegasfootprint.”Thisobjectivehasbeenrealized,inpart,throughthepurchaseofhybriddiesel-electricbuses.TheCityhaspurchased177hybridbuses,witheachbuscapableofreducinggreenhousegasemissionsby38%,comparedtoconventionaldieselbuses.Evaluationofthebuseshasnotbeencompletedyet.
TheTransportationMasterPlanalsosetsgoalsforincreaseduseofpublictransit.Inparticular,theplan“aimstoincreasetheproportionofmotorizedperson-tripscarriedbytransitinthemorningpeakhourfrom23%in2005to30%(alevelsimilartomanyEuropeancities)in2031.“Theplanincludesmeasurestomeetthisgoal,suchas“improvetheformofdevelopment,reducethesupplyofabundantfreeparkingatkeydestinations,improvepublicawarenessandsupport,levelthefinancialplayingfieldbetweentransitanddriving,betterintegratetransitwithothermodes,andsetprioritiesfornewinfrastructurethatimprovetransit’sserviceadvantagewhereverpossible.”
COOL FACTOR: Hybrid diesel-electric buses
CITY OF OTTAWA CHALLENGES CITY OF OTTAWA SUCCESSES
• Thereisgoodcooperationbetweenlanduseandtransportationdepartments.
• TheCitydevelopedanewTransportationMasterPlanin2008,followedbyspecificplansforcyclingandwalking.
• Anadditional1,967kmofbikelanesareplanned.
CITY STATS (2006 CENSUS)
Population:812,129
Land Area: 2,778.13km2
Density:292.3residentsperkm2
• Informationongreenhousegasemissionsfromrecentyearsisnotyetavailable.
• Updatedtargetsforgreenhousegasreductionsarebeingestablishedattimeofprinting.
• Translatingplansandtargetsintoactionischallenging.
• Targetsforcycling,walkingandtransitarenotveryambitious.
What are the City of Ottawa’s emissions?Data is being updated and is currently not available.
CityPhoto:JuliaKilpatrick,ThePembinaInstitute

City of Ottawa
CANADA’S COOLEST CITIES — Case Study
City of Ottawa’s transportation choices In 2006, approximately one-third of Ottawans chose to commute by transit, walking or cycling. This percentage was unchanged from 2001.
Regular passenger transit trips in City of Ottawa
City of Ottawa lessons learned (from interviews)• Internal leadership is currently really helping to advance the
sustainability and the environmental portfolio.
• The transportation and land use departments communicate well and work closely together. The new community sustainability department is working on the integration of sustainability throughout the City.
• Ottawa’s transportation and land use policies do not explicitly consider greenhouse gas reductions. Instead, there is a focus on promoting alternative modes of transportation.
• Reducing greenhouse gas emissions is not a priority in the job descriptions of most Ottawa employees.
• Lack of funding has been a significant challenge.
City of Ottawa transit servicesTransit trips by OC Transpo increased by 8% from 2001 to 2006, the same rate as population growth in the areas served by OC Transpo. Transit service improved at approximately the same rate — transit service hours increased by 5% and transit vehicle kilometres increased by 8%.
City of Ottawa mode share, 2006
Other1%
WalkandBicycle10%
Transit22%
How do Ottawans get to work?
Percent change in City of Ottawa mode share, 2001–2006
Other
WalkandBicycle
Transit
CarPassenger
CarDriver
0% 10% 20% 30% 40% 50% 60% 70% 80%
2001
2006
100
90
80
70
60
50
40
30
20
10
02001 2002 2003 2004 2005 2006
Regu
larP
asse
nger
Trip
s(m
illio
ns) Ottawa bicycle paths
On-street: 283 kmOff-street: 258 kmTotal: 541 kmBike path kilometres per 1,000 people: 0.67
The City of Ottawa has 541 km of bike paths. The 2008 Cycling Plan outlined plans for an additional 1,967 km
of bike lanes, although there is no specified time frame for implementing the new lanes.
CarPassenger7%
CarDriver60%
Phot
o:J
ulia
Kilp
atric
k,T
heP
embi
naIn
stitu
te
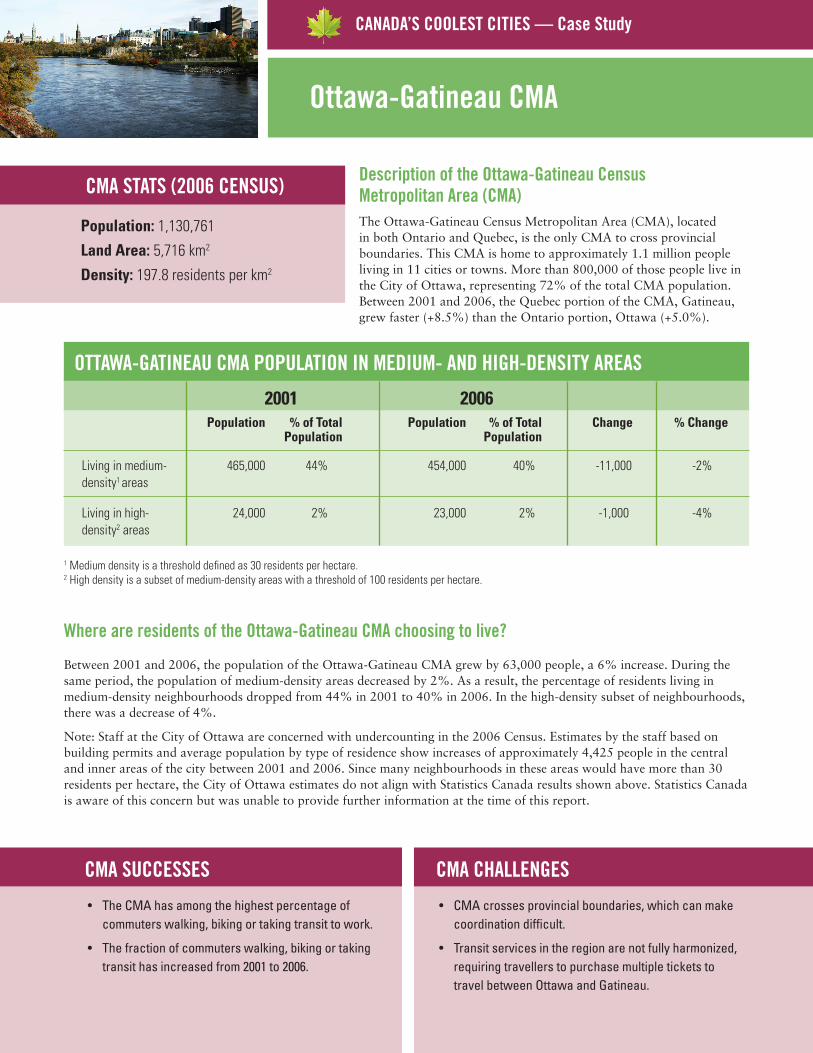
Where are residents of the Ottawa-Gatineau CMA choosing to live?
Between 2001 and 2006, the population of the Ottawa-Gatineau CMA grew by 63,000 people, a 6% increase. During the same period, the population of medium-density areas decreased by 2%. As a result, the percentage of residents living in medium-density neighbourhoods dropped from 44% in 2001 to 40% in 2006. In the high-density subset of neighbourhoods, there was a decrease of 4%.
Note: Staff at the City of Ottawa are concerned with undercounting in the 2006 Census. Estimates by the staff based on building permits and average population by type of residence show increases of approximately 4,425 people in the central and inner areas of the city between 2001 and 2006. Since many neighbourhoods in these areas would have more than 30 residents per hectare, the City of Ottawa estimates do not align with Statistics Canada results shown above. Statistics Canada is aware of this concern but was unable to provide further information at the time of this report.
CANADA’S COOLEST CITIES — Case Study
Ottawa-Gatineau CMA
CMA STATS (2006 CENSUS)
Population:1,130,761
Land Area: 5,716km2
Density:197.8residentsperkm2
Description of the Ottawa-Gatineau Census Metropolitan Area (CMA)The Ottawa-Gatineau Census Metropolitan Area (CMA), located in both Ontario and Quebec, is the only CMA to cross provincial boundaries. This CMA is home to approximately 1.1 million people living in 11 cities or towns. More than 800,000 of those people live in the City of Ottawa, representing 72% of the total CMA population. Between 2001 and 2006, the Quebec portion of the CMA, Gatineau, grew faster (+8.5%) than the Ontario portion, Ottawa (+5.0%).
2001 2006 Population % of Total Population % of Total Change % Change Population Population
Livinginmedium- 465,000 44% 454,000 40% -11,000 -2%density1areas
Livinginhigh- 24,000 2% 23,000 2% -1,000 -4%density2areas
OTTAWA-GATINEAU CMA POPULATION IN MEDIUM- AND HIGH-DENSITY AREAS
1Mediumdensityisathresholddefinedas30residentsperhectare.2Highdensityisasubsetofmedium-densityareaswithathresholdof100residentsperhectare.
CMA SUCCESSES CMA CHALLENGES
• TheCMAhasamongthehighestpercentageofcommuterswalking,bikingortakingtransittowork.
• Thefractionofcommuterswalking,bikingortakingtransithasincreasedfrom2001to2006.
• CMAcrossesprovincialboundaries,whichcanmakecoordinationdifficult.
• Transitservicesintheregionarenotfullyharmonized,requiringtravellerstopurchasemultipleticketstotravelbetweenOttawaandGatineau.

How do people in the Ottawa-Gatineau CMA get to work?
How far are residents of the Ottawa-Gatineau CMA commuting?
Between 2001 and 2006 the Ottawa-Gatineau CMA saw the average commute distance increase by 4% from 7.8 km to 8.1 km.
The Ottawa-Gatineau CMA is tied with the Montreal CMA for the third longest commute of the CMAs in this study.
Ottawa-Gatineau CMA
CANADA’S COOLEST CITIES — Case Study
Ottawa-Gatineau CMA mode share, 2006
Other1%
WalkandBicycle9%
Transit19%
CarPassenger8%
CarDriver63%
Average Commute Distance in Ottawa-Gatineau CMA
Percent change in Ottawa-Gatineau CMA mode share, 2001–2006
Other
WalkandBicycle
Transit
CarPassenger
CarDriver
0% 10% 20% 30% 40% 50% 60% 70% 80%
2001
2006
2001
2006
km
0.0 2.0 4.0 6.0 8.0 10.0
In 2006, the combined percentage of workers choosing to walk, bike or take transit was 28% in the Ottawa-Gatineau CMA, amongst the highest of the major Canadian urban areas. For this indicator, the Ottawa-Gatineau CMA matches the Toronto CMA and is just
slightly below the Montreal CMA (29%). This is a strong achievement considering that the Ottawa-Gatineau CMA has a lower population base than the Toronto or Montreal CMAs.
Photo:JuliaKilpatrick,ThePembinaInstitute

Canada’s six largest urban areas provide homes and jobs for almost 15 million people, nearly half of our population. Transporting these citizens to and from work, school, health care, shopping and other destinations consumes energy, which in turn contributes to environmental problems, in particular climate change. Municipal and other local governments have the opportunity and responsibility to take action on reducing greenhouse gas emissions, especially those from transportation in their boundaries.
The amount of energy consumed for personal transportation in cities depends on urban design — the locations of homes, jobs and services, plus the options for travelling among these locations. Urban design and transportation policies can help decrease energy consumption, save money, limit environmental impacts and make communities more livable.
The information in this case study was developed by analyzing numeric data from both the core city and the wider census metropolitan area (CMA), and by interviewing staff at the core city. The numeric data provide a picture of current transportation and urban design choices, as influenced by past policies and decisions. The interviews allowed us to explore potential future directions based on current policies.
The study consists of six case studies, one for each of Canada’s largest urban areas (Toronto, Montreal, Vancouver, Ottawa, Edmonton and Calgary), and a technical report. The technical report covers the research approach, findings across the different urban areas and recommendations. The other case studies and the technical report are available at http://communities.pembina.org.
RECOMMENDATIONS
Ouranalysishighlightsfivekeyactionsforsuccessfulprogress:Measure,Estimate,Implement,ShareandEvaluate.Theseactionshavebeenundertakentosomedegreealreadybycitiesineachurbanarea.Nowgovernmentsmustco-ordinatetheseactionstoreducegreenhousegasemissionsacrossthewholeurbanarea.
MEASURE Developsystemsforconsistent,frequentestimatesofgreenhousegasemissionsfromurbanpersonal transportationandensureresultsarereadilyavailabletoCitydepartmentsandtothepublic.
ESTIMATE Provideestimatesoffuturegreenhousegasemissionsforanysignificantinfrastructureorpolicydevelopment.
IMPLEMENT Ensurelanduseandtransportationplansareimplementedanddevelopadditionalinitiativesto meetgreenhousegasreductiontargets.
SHARE Increaseparticipationofmultipledepartmentsandacrossmunicipalitiesinplanningandinformationsharing.
EVALUATE Trackprogresstowardmeetinggreenhousegasreductiontargetsandestimatetheimpactofinfrastructure.
Thekeyactionswillrequireinitiativesandresourcesfromalllevelsofgovernment.Priorityinitiativesformunicipalgovernmentstosupporttheseactionsare:
1. Trackprogresstowardmeetinggreenhousegasreductiontargetsfromtransportationandlandusepolicies.
2. Rewarddevelopmentofcompactcommunitiestolimitsprawlinlargeurbanareas.Implementthesepoliciesjointlywithneighbouringcommunitiestoensurethepoliciesareeffectivefortheregion.
3. Investinlow-carbontransportationchoices(transit,walkingandbikinginfrastructure).
4. Developpoliciestoencouragepeopletoliveclosetoworkandservices,encouraginglow-carbontransportationoptionsandreducingtimespentbehindthewheel.
Provincialandfederalgovernmentsalsohaveastrongroletoplayinsupportingmunicipalitiesbyprovidingleadershipandfundingfordevelopingcompactcommunitiesandlow-carbontransportationchoices.
SeetheTechnicalReportforadditionalinitiativesforeachofthekeyactions.
CANADA’S COOLEST CITIES
About the project
Canada’sCoolestCitiesfocusesonCanada’ssixlargestCensusMetropolitanAreas(CMAs)andthecorecitywithineachCMA.ACMAisaStatisticsCanadadefinitionforthemetropolitanregionthatcoversmultiplemunicipalities.CMAsaresimilarto,butnotexactlythesameas,theinformaldesignationsfortheurbanareassuchasMetroVancouverandtheGreaterTorontoArea.TheCMAdefinitionsareusedbecausetheyareclearlydefinedbyStatisticsCanada,themainsourceofdataforthisproject.BecausetheCMAscovermuchlargerareasthanindividualcities,thedataforaCMAcapturesmoreofthetransportationbehaviour.
WHAT IS A CMA?