CONZ7E7 - ncbi.nlm.nih.gov
18
CLINICAL SIGNIFCANCE OF BLOOD VISCOSITY Hunterian Lecture on 19th February 1970 by J. A. Dormandy, F.R.C.S. Surgical Registrar, Department of Surgery, Royal Free Hospital; Hon. Lecturer, Department of Applied Physiology, Institute of Basic Medical Sciences, Royal College of Surgeons of England INTRODUCTION FOR A LONG time there has been a tendency among laboratory workers to study blood as a column of liquid in a specimen tube; in fact, of course, the most vital function of this most vital fluid is that it should flow, and one of the most important determinants of a flowing liquid is its viscosity. But it is only recently that the importance of the viscosity of the blood has become apparent to us. Viscosity is the measure of fluid A B. ROTATIONAL SPEED (N) V, CONZ7E7 }dx zct_ DRQUNOE (r ) V2 DIS r SHEAR RATE Velocity Gradient = 2SHEAR RATE * 2 N 3 62N sc * ~~~~itSEA AE 60 3-83C sin f SHEAR STRESS * Force per areo = F T T ea A SHEAR STRESS --- - dyn*s cmt 1Tr3 2868 VISCOSITY, SHEAR STRESS SHEAR STRESS SHEAR RATE VISCOSITY T - -poWe SHEAR RATE lnON Fig. 1. (a) Definition of viscosity. (b) Diagram of the viscometer sample cup with conical disc and showing the calculation of the viscosity in absolute units. friction and can be considered as the internal friction resulting when a layer of fluid is made to move in relationship to another layer (Fig. la). If two parallel planes of fluid of Area 'A' are made to move at different velocities, ' V1 ' and ' V2 ', by force ' F ', the velocity gradient will be expressed by the formula d where dx is the distance between the two dx, planes. This velocity gradient, which is produced in the liquid by the force ' F', is called the shear rate and is measured in units of inverse seconds. The force per unit area which produced this rate of shear is expressed by the formula - which is called shear stress. Viscosity is then A, defined as the ratio of shear stress to the shear rate it produces. Newton assumed that for a given material this ratio was constant, and therefore its viscosity was constant. In other words, if you wish to move fluid twice as fast, it will require twice as much force. 211 (1970, Vol. 47)
Transcript of CONZ7E7 - ncbi.nlm.nih.gov

CLINICAL SIGNIFCANCE OF BLOOD VISCOSITYHunterian Lecture on 19th February 1970
byJ. A. Dormandy, F.R.C.S.
Surgical Registrar, Department of Surgery, Royal Free Hospital; Hon. Lecturer,Department of Applied Physiology, Institute of Basic Medical Sciences, Royal College
of Surgeons of England
INTRODUCTIONFOR A LONG time there has been a tendency among laboratory workersto study blood as a column of liquid in a specimen tube; in fact, of course,the most vital function of this most vital fluid is that it should flow,and one of the most important determinants of a flowing liquid is itsviscosity. But it is only recently that the importance of the viscosityof the blood has become apparent to us. Viscosity is the measure of fluid
A B. ROTATIONAL SPEED (N)
V, CONZ7E7}dx
zct_ DRQUNOE(r )
V2 DIS r
SHEAR RATE Velocity Gradient = 2SHEAR RATE * 2 N 3 62N sc* ~~~~itSEA AE 60 3-83C
sin f
SHEAR STRESS * Force per areo = F T Tea A SHEAR STRESS --- - dyn*s cmt1Tr3 2868
VISCOSITY, SHEAR STRESS SHEAR STRESSSHEAR RATE VISCOSITY
T
- -poWeSHEAR RATE lnON
Fig. 1. (a) Definition of viscosity. (b) Diagram of the viscometer sample cup withconical disc and showing the calculation of the viscosity in absolute units.
friction and can be considered as the internal friction resulting when alayer of fluid is made to move in relationship to another layer (Fig. la).If two parallel planes of fluid of Area 'A' are made to move at differentvelocities, ' V1 ' and ' V2 ', by force ' F ', the velocity gradient will be
expressed by the formula d where dx is the distance between the twodx,planes. This velocity gradient, which is produced in the liquid by theforce ' F', is called the shear rate and is measured in units of inverseseconds. The force per unit area which produced this rate of shear is
expressed by the formula - which is called shear stress. Viscosity is thenA,defined as the ratio of shear stress to the shear rate it produces. Newtonassumed that for a given material this ratio was constant, and thereforeits viscosity was constant. In other words, if you wish to move fluid twiceas fast, it will require twice as much force.
211(1970, Vol. 47)
J. A. DORMANDY
The credit for first describing the haemodynamic importance of bloodviscosity should go to Stephen Hales, a minister at Teddington, at thebeginning of the 18th century. In his book, where he described his classicmeasurements of blood pressure and the concept of flow in vessels along apressure gradient, he also makes the following observation: ' The resistancewhich the blood meets with in these capillary passages may be greatlyvaried, either by different degrees of viscosity or fluidity of the bloodor the several degrees of constriction or relaxation of those fine vessels '1.The quantitative investigation of the part played by viscosity in blood
flow had to wait another century till Poiseuille performed his carefulexperiments on the flow of fluids through narrow tubes2. The result wasPoiseuille's formula which relates flow directly to the driving pressure,the fourth power of the radius of the vessel and inversely to the viscosity(Table I). With this Poiseuille has probably the best claim to beingconsidered the father of modern rheology. Indeed the modern unit ofviscosity is called the Poise after him. It was while looking at the threevariables in Poiseuille's formula that I was struck by the tremendousdifference in the attention that has been paid to the importance of the
TABLE IPOISEUILLE's FORMULA
i1 AP x r4Rate of flow - x
8 lxnwhere AP = pressure gradient
r = radius of vessel= length of vessel
l= viscosity of the blood
driving pressure and the calibre of the vessels, while by comparison thephysiology and pathology of blood viscosity has hardly been studied.
I undertook the investigations which form the basis of this lectureto try and establish a practical method of assessing blood viscosity inpatients and to define its clinical importance.Many of the difficulties involved in the measurement of blood viscosity
arise from the fact that blood is not a Newtonian fluid, that is the ratioof shear rate to shear stress is not constant. As the shear rate of blooddecreases so the fall in shear stress becomes proportionately more,signifying an increase in viscosity at low shear rates.'
Figure 2 shows the actual viscosity measurements on two samplesof blood and illustrates this point. As the force moving the blood, thatis the shear stress, declines so the decrease in the velocity of flow, theshear rate, gets proportionately less. The viscosity of whole blood rises,increasingly precipitously, as the shear rate decreases. This creates theapparent paradox that when blood moves slowly it needs proportionatelymore driving force than when it moves fast.
212

CLINICAL SIGNIFICANCE OF BLOOD VISCOSITY
ViscometryA viscometer is a device for applying a known stress to a sample of
fluid and measuring the displacement it produces. In the present studiesa Cone-on-Plate Brookfield Microviscometer was used, which is anadaptation of an industrial viscometer and was originally described byWells ,et al.3 (Fig. lb). A conical disc is rotated in a small rhodium cupcontaining the sample by a variable speed motor through a berylliumcopper spring connection. The drag on the rotating cone, due to theviscosity of the sample, can then be measured by the torque on the springsuspension. Although the difference in velocity between the rotating coneand the cup increases towards the periphery, the distances between the twosurfaces also increases. Therefore, with a cone of the correct angle thevelocity gradient or shear rate will be kept constant throughout the sample.
50
40
30
VISCOSITY(c.p.S.)
20
10
* Patient Viscosityo Control Shear stres3 -15
k-AORTA - ARTERIES -44 CAPILLARIES -VENA CAVA ---VEINS -4 - 10
SHEP
(Dyn
> . - ,p
50 100 150SHEAR RATE (sec1')
AR STRESSnes /Cm2)
200 250
Fig. 2. Graph showing the relationship between shear rate, shear stress and thecalculated viscosity in two samples of blood, belonging to a patient and his control.The estimated physiological range of shear rates in various parts of the circulation
is also shown.
The viscosity can then be calculated from the dimensions of the chamber,the rotational speed of the cone and the torque in the spring suspension.The sample cup is surrounded by a water jacket to keep the sample at
370 C. because viscosity is critically dependent on temperature.The standard technique evolved for clinical measurements in patients
involved collecting 10 ml. of venous blood into a plastic syringe. This wasanticoagulated with 125 i.u. of solid lithium heparin, and 0.8 ml. sampleswere used in the viscometer. On occasions when venous and arterialblood could be withdrawn and tested simultaneously no significantdifference was found in the viscosity. To ensure equilibration of therotating spring suspension and a steady state in the sample, it had to beexposed to a given shear rate for at least 3 to 4 minutes. Readings wererepeated twice on the same sample and then at least once more on a new
213
0

J. A. DORMANDY
0.8 ml. sample withdrawn at the same time. The coefficient of variationof repeated readings was 2% at high shear rates, the reproducibilitybecoming progressively less at lower shear rates. The accuracy of anyviscometer in terms of absolute units of viscosity is much less and this iswhy I believe that in clinical investigations of patients a comparativetechnique should be adopted using normal controls measured in parallel.The inaccuracy of readings calculated in absolute units is part* due tominor changes in the mechanics of the apparatus over longer periods oftime, and partly to the fact that the measured blood viscosity is criticallydependent on the treatment of the sample after withdrawal.An example of this is the curious phenomenon which can be observed
when the same sample of blood is exposed to a succession of shear rates.Apparently the viscosity of whole blood under identical conditions can bedifferent depending on the previous history of the sample. For instance,at a particular low shear rate, the viscosity will be greater if the blood hadpreviously been exposed to a higher shear rate than if the previous readinghad been taken at lower shear rates. This dependence of flow propertieson time is called thixotropy and is a phenomenon also exhibited by someother fluids, for instance by modern non-drip paints.The view that comparative assessments of blood viscosity are more
accurate than absolute measurements is strengthened by the wide variationin the normal viscosity reported by the few workers who have measured it.Even at high shear rates, where measurements are most accurate, the rangeof mean normal viscosities reported vary from 1.7 to 5.5 centipoises indifferent series4, 5, 6. However the internal accuracy, or rather thereproducibility, of any well contfolled and standardized method is muchbetter. The mean normal visco§ity in the present series was 3.53 with astandard deviation of 0.26 centi7poise. If the variations in haematocritare standardized, by a method which will be described, the variation inthe viscosity of a normal subject over a period of a month is usually lessthan 5 %. Although I have said that at the present time the most practicalway to assess a patient's blood viscosity is by comparison to normalcontrols, this method does have the objection that at this early stage it isdifficult to be certain who has a normal viscosity. In practice, controlswere chosen by excluding patients with any symptoms or signs of haemato-logical or cardiovascular disease.
Physiological shear rateAnother fundamental problem in the measurement of blood viscosity
arises from the fact that blood is non-Newtonian and the viscosity varieswith the shear rate. It is therefore important to know what is the physio-logical range of shear rates at which viscosity measurements should bemade in order to be clinically significant. Because the shear rate is therate of change of velocity it will depend on both the dimensions of thevessel and the velocity of the blood flowing through it, which itself varies
214

CLINICAL SIGNIFICANCE OF BLOOD VISCOSITY
from a theoretical zero near the wall to a maximum along the axis. Thevelocity gradient therefore changes from a maximum near the wall to aminimum in the axis of flow. The situation is further complicated inarteries where the velocity changes during the cardiac cycle. Furthermorethere is a difference in the range of velocity from vessel to vessel due todifferences in diameter and the rate of blood flow. Taking averagefigures for the dimensions of the vessels and the rates of blood flow throughvarious parts of the circulation, a range of shear rates can be calculated4.If these shear rates are superimposed on the graph illustrating the shearrate dependence of blood viscosity (Fig. 2), it will be apparent that thecalculated physiological shear rates in most parts of the circulation fallalong the flat part of the curve where blood is near-Newtonian. It isperhaps significant that the lowest shear rate and therefore the highestviscosity appears to be in the very large veins, and that the shear ratein capillaries is probably more than in any other part of the circulation.Because the non-Newtonian behaviour of blood only becomes marked atshear rates mostly below the physiological range, in many of the clinicalstudies to be presented the viscosity was measured at two shear rates only,230-1 and 23 sec.-I. The accuracy of the viscometer is also greatest atthese higher shear rates.
VISCOSITY HAEMATOCRIT RELATIONSHIP
Although the dependence of viscosity on haematocrit is recognized asbeing great, there is no agreement on the exact magnitude of this relation-ship. For instance, Dintenfass7 from Sydney described a linear relation-ship between haematocrit and viscosity using scales which were neitherarithmetic nor logarithmic, while Skovborg8 found the relationship to belinear using arithmetic scales along both axes. The exact nature of therelationship is very important if direct comparisons are to be made betweenviscosities of samples with different haematocrits.
Methods
The connection between viscosity and haematocrit was investigated inthree ways:
1. Direct correlation of the haematocrit and viscosity in normal subjects
Figure 4 shows the viscosity and haematocrit of 23 normal controls, aswell as patients with vascular disease. A semi-logarithmic graph isused, comparing the logarithm of the viscosity to the haematocrit, becausethis gave the closest linear correlation in this as well as other experiments.The considerable scatter observed when blood from different subjects iscompared emphasized that the haematocrit is only one of many determin-ants of blood viscosity.
215

J. A. DORMANDY
2.- Measuring the changes in blood viscosity and haematocrit duringintravenous infusions
This was done in 16 patients receiving infusions with solutions otherthan blood. The method has the advantage that the same red cells andplasma are used in each experiment; on the other hand it is open to thecriticism that'the solution infused may itself have a specific effect onviscosity independently of altering the haematocrit.
SHEAR RATE - 230 sec.
50 __ _ _ 5
1.0 ~~~~~~~~575~
30
115 00v 20 SHEAR
30'
RATES -S ~~~~~~~~~~~~~~~~sec-
- 2 4 N ) 0 10 [ SD 12¢ SD230c ~~~~~~~~~~~~~+201"(
0~~~~~~~~~~
- n h icst o loarthi Icl) oesr'. a ifrntserrts
230G
5 0
240otos9h cte fth oto icste botteronma sas
2 ____ ~~~~~~~~~~~PATIENTS CONTROLS0 20 4.0 60 80 100 SD 12c SD 4%
HAEMATOCRIT Standard error of differ ice 3 4AC
~(a) (b)Fig. 3. '(a) Regression lines summarizing the relationship between the haematocritand the~ viscosity (on a. logarithmic scale), measured at different shea'r rates.(b) The blood viscosity of 28. patients with severe arterial disease compared to24 controls; the scatter of the control viscosities about their own mean is alsoshown. All viscosity measurements were standardized to a haematocrit of 45 %.
3. Measuring the changes in viscosity of the same blood after varying its¢.hamatocrit in vitro-50 ml. of blood was withdrawn from volunteers and divided into five
samples, whose haematocrits were altered by withdrawing varying amountsof plasma and cells from each sample. - The changes in viscosity causedby altering the concentration of the same red cells and plasma could thenbe measured.ResultsThe results obtained by these three methods coincided very closely.
Viscosities were always measured at 230 sec.-1 and in many cases at lowershear rates as well. Figure 3 (a) summarizes the results, showing theregression lines at different shear rates. At any given haematocrit the
216

CLINICAL SIGNIFICANCE OF BLOOD VISCOSITY
viscosity increases with decreasing shear rate which is merely an expressionof the non-Newtonian behaviour of whole blood. In addition, the changein the slope of the regression lines implies that the dependence of viscosityon haematocrit becomes more and more marked as the shear rate becomesless and less, an effect that would be even more apparent if the viscosityhad also been represented on an arithmetic scale.The slope of this linear relationship between the logarithm of the
viscosity and the haematocrit within the physiological range is such thatthe variations in haematocrit which are often seen clinically will have asignificant effect on viscosity. For instance, at-a shear rate of 230 sec.-1,raising the haematocrit from 40 to 45 % will increase the viscosity by12%. The same change in haematocrit which raises the viscosity by12% at a shear rate of 230 sec.-1 will raise the viscosity by 25% at a shearrate of 5.75 sec.-I. It is because of this that it is necessary to correct fordiffertnces in haematocrit before comparing the blood viscosity ofpatients and controls. It is also worth noting that although the regressionlines tend to converge when extrapolated they do not meet at a point onthe ordinate. There are two possible explanations: either blood at zerohaematocrit, that is plasma, is also non-Newtonian, or the linear relation-ship found in the physiological range does not hold true for haematocritsoutside this range. I think the latter explanation is more likely to becorrect. Finally, it was noticed in all these experiments that althoughthere may be big differences in the absolute viscosities of two patientsthe effect of changing the haematocrit will be similar.BLOOD VISCOSITY IN PERIPHERAL VASCULAR DISEASEThe investigation of these basic considerations sprang from a wish to
assess the importance of an abnormal viscosity in patients with peripheralvascular disease. A group of 28 patients were studied, all of whom hadbeen referred to a vascular unit for evaluation of their disease with a viewto possible surgical treatment. Their symptoms varied from severeintermittent claudication to rest pain or ischaemic skin changes; severeaorto-iliac or femoro-popliteal disease was confirmed in all cases byaortography. Blood viscosities were measured by the technique describedat two shear rates, 230 sec.-1 and 23 sec.-1 and the haematocrits weredetermined on the same samples. The results were compared to normalcontrols studied simultaneously and as far as possible subjected to thesame treatment before measurement.
In such direct comparisons correction for differences in haematocritbecomes particularly important and therefore all the measured viscositieswere corrected to an arbitrarily chosen standard haematocrit of 45%.This conversion was done mathematically using the formula for thehaematocrit viscosity relationships at different shear rates already investi-gated.Results
Figure 3 (b) shows the results when the patients and controls are matched
217

J. A. DORMANDY
directly as described. As a group the viscosity of the patients is 13.4%higher than that of their controls. Although this is statistically significant,much more surprising is the very large rise in viscosity observed in someof the patients. These patients will be considered in more detail later,particularly in relation to the results of vascular surgery. These grosslyabnormal viscosities were not due to an unusually high haematocrit sincethis was standardized before comparison of the patients and controls.Figure 4 is a scatter diagram where the viscosity of the patients and controlsis compared to their haematocrits. It shows that although a high haemato-crit in the normal controls usually went with a high viscosity, this associa-
6 655 5-5
5 5
4.5 4** 50 0
4 0 .0 4VISCOSITY 0J00 o
INC.P.S. 3s5 305
3 0 3
2.5 2.5
35 40 45 50 55
% HAEMATOCRIT
* PATIENTSO coTNwoS SHEAR RATE - 230 sec.- 1
Fig. 4. Scatter diagram showing the measured blood viscosity of the patientsand their controls at their actual haematocrits. The regression line shows therelationship of the haematocrit to the logarithm of the viscosity in the control
samples.
ion was far less marked in the patients, and most of them with grosslyraised viscosity did not have an abnormally high haematocrit. In fact theaverage haematocrit of the patients was only a little over 1% higher thanthe average of the controls. The spread of the viscosities, particularlyin the patients, is not a normal distribution. Six of the patients have ahigher viscosity than any of the controls and it seems likely that at leasttwo populations of patients are being looked at. The blood viscosity ofa number of patients with peripheral vascular disease falls within thenormal control range; however, a few patients have an abnormallyhigh blood viscosity which must contribute significantly to their poorcirculation.
218

CLINICAL SIGNIFICANCE OF BLOOD VISCOSITY
There have been very few reports in the literature on the blood viscosityof patients with arterial disease. Dintenfass9 investigated viscosity in avariety of pathological conditions but he used extremely low shear rates,less than one inverse second, believing these to be most realistic physio-logically. It has already been seen that the non-Newtonian behaviourof blood is greatest at these very low shear rates where normal controlblood viscosities are many hundreds of times that of water, or of bloodat higher shear rates (Fig. 2). Another investigation of patients withvascular disease was carried out by Rosenblatt and his colleagues inHonolulu6, who found a 14.50% increase in viscosity at high shear ratesin patients with coronary artery disease. Having found this marked risein the blood viscosity in some of the patients with vascular insufficiency,
A a
.50% - .50%
*40% - .40 -
VISCOSITY *30% *30% SCOMPARED *TO CONTROL .20% * *2 . *20
0 * ~00 *e. 10% .10%-
'0% @ * -0 0
-10%- -10%
10 20 30 *0 100 200 300SEOIMENTATION RATE FIBRINOGEN (mgm./00mis. P1`5oM)
o AvWoge plosma fibInogen of controls
COEFFICIENT OF CORRELATION = .016 COEFFICIENT OFCORRELATION .04STANDARD ERROR OF COEFFICIENT .0 25
Fig. 5. Correlation between the change in blood viscosity of patients withperipheral arterial disease and the sedimentation rate (A) and plasma fibrinogen (B).
two further questions need to be answered. Why do some patients haveabnormally elevated blood viscosity and to what extent does it contributeto their poor circulation?
Determinants of viscosity
Very little is known about the determinants of viscosity, other thanhaematocrit and, as we have seen, patients with abnormally viscous bloodcan have a normal haematocrit.
Sedimentation rateViscosity may also be related in some way to the rate or frequency of
red cell aggregationl10 11. This could explain the gain in viscosity bothwith increasing red cell concentration and with a fall in shear rate. Onemeasure of red cell aggregation is the sedimentation rate and this wastherefore determined in all the samples from the patients (Fig. 5a).Not surprisingly the E.S.R. of the patients was significantly raised, but
219

J. A. DORMANDY
when the individual values were compared to the percentage rise of theviscosity no significant correlation could be found. The two patientswith the highest viscosity had sedimentation rates only slightly abovenormal.
CholesterolThe serum cholesterol was also estimated, but again no correlation was
found with an abnormally high viscosity.Fibrinogen
Chien12 has suggested that it is the plasma fibrinogen level whichinfluences the rate of red cell aggregation and also to some extent causesthe non-Newtonian behaviour of blood. He as well as Merrill13 inAmerica have shown that defibrinogenated blood shows less non-Newton-ian behaviour and less thixotropy than normal blood. Figure 5 (b) showsthe plasma fibrinogen and the rise in blood viscosity of the patients.There is a positive correlation between the rise in viscosity and the plasmafibrinogen level. Nevertheless the factors which influence blood viscosity,and more importantly the factors which cause a pathological increase inviscosity, are virtually unknown. There is clearly a need for much morebasic research in this area.
PHYSIOLOGICAL REACTION TO ALTERED BLOOD VISCOSITYThe whole question of viscosity is only interesting if there is a real link
between changes in blood viscosity and changes in blood flow. Poiseuilledid his experiments with Newtonian fluids, not blood, and used rigidmechanical tubes, not elastic blood vessels. Yet ever since Poiseuille'sexperiments 125 years ago there has been an assumption that blood flowmust be inversely and proportionately related to viscosity. The truthof this assumption needs to be tested experimentally. A series of animalexperiments were therefore performed to investigate the haemodynamicresponse of the cardiovascular system to an alteration in the blood viscosity.Figure 6 summarizes three possible responses to a fall in viscosity and theprincipal changes in various parameters which would be expected ineach case. The immediate fall in peripheral resistance, which is a functionof the blood viscosity and vascular tone, may be accompanied by asimultaneous direct effect on the heart increasing its stroke (alternative' A' in Fig. 6). Such direct effects would be independent of the nervesupply to the heart and would therefore persist after chemical denervationof the heart. The simultaneous increase in cardiac output and decreasein peripheral resistance would be reflected in an augmented pulse pressurewith an unchanged mean blood pressure. Alternatively, if a change inviscosity had no direct effect on the heart, the fall in peripheral resistancewould tend to lower the blood pressure and activate the baroreceptorreflex as in alternatives ' B ' and ' C ' (Fig. 6). The baroceptor mechanismcould then tend to maintain the arterial pressure in one of two ways:
220

CLINICAL SIGNIFICANCE OF BLOOD VISCOSITY
it could increase the heart rate and cardiac output or it could evoke avasoconstriction returning the total peripheral resistance to the originalvalue. Which of these responses was predominant could be of greatpractical significance. If the major effect was on the heart this wouldbenefit the circulation by increasing the cardiac output. On the otherhand if a fall in viscosity merely caused a compensatory vasoconstriction,keeping the peripheral resistance constant, then this would be no gainto the circulation. If the cardiac component of tho baroreceptor reflexpredominated as in alternative ' B ', the effect on the cardiac outputand peripheral resistance would be similar to that found in alternative' A'
CARDIOVASCULAR REACTION TO CHANGE IN VISCOSITY
THEORETICAL POSSIBILITIES
FALL IN BLOOD VISCOSITY
IDIRECT EFFECT f LOWER BLOOD PRESSURE AND
ON HEART _ ACTIVATION OF BARORECEPTORS
// /(/ CARDIOEXCITATORY VASOMOTOR
y / CENTRE CENTRE
\Y - C ~~~r. 1n l So
L_~~~JfiD (VASOCONSTRICTION)
I c
EXPECTED FINDINGS
cC. H. R. S IP PR DENERVATIONrA It-- t'tti I No effect
, B @ tt t t 1 1 ~~~Diminished responsesSC 1-1-1-14___ I _lo effect
Fig. 6. Schematic outline of the three theoretically possible reactions of thecardiovascular system to a fall in blood viscosity. The expected changes invarious cardiovascular parameters with each response are also shown. (C.O. =
Cardiac output, H.R. = Heart rate, S.V. = Stroke volume, P R. = Peripheralresistance.)
but the higher cardiac output would be due to a rise in heart rate ratherthan stroke volume and the response would be altered by cardiac denerva-tion. Lastly, if the baroreceptor response is chiefly one of vasoconstriction,as in alternative ' C ', then this would be reflected by the unchangedcardiac output and pulse pressure.MethodsThe systolic and diastolic arterial blood pressures were recorded with
a pressure transducer connected to the common carotid artery and theheart rate calculated from the pressure tracing. The cardiac output wasmeasured with an electromagnetic flow probe on the root of the aorta,and in some experiments the blood flow was also monitored in the renal
221

J. A. DORMANDY
and femoral arteries. The central venous pressure was estimated in theusual way with a manometer attached to a catheter in the right atrium.A stimulating electrode was placed on the vagus in the neck. Changes inthe blood viscosity were produced by exchange transfusions with packedcells, plasma, Low Molecular Weight Dextran or saline, in such a wayas to try to keep the circulating blood volume constant.
The heart was chemically denervated with an intravenous infusion ofPropranolol (4 micrograms/kg./min.) followed by an injection of Atropine(50 micrograms/kg.) 15 minutes after the beginning of the Propranolol
~ 200 iN~j ( I i
3 00. . Ax C1
ad 1.I0H. R ~ ~ ~ ~ ~ ~ ~ ~ ~ ~ ~~N.4
4PROPANOLL INFUSION 40 ng /
0 30 60 90 120
4.5 ~~~ ~ ~ ~ ~~~~~i
Fig. 7. Summary of the results obtained in a typical dog experiment investigating theeffects of a plasma exchange transfusion on viscosity, cardiac output (C.O.),blood pressure (B.P.), and heart rate (H.R.). Chemical denervation of the
heart did not alter the response.
drip. The complete blocking of parasympathetic and sympathetic nervesto the heart was tested by vagal stimulation and intravenous injection ofIsoprenaline (0.05 mg.) respectively.
Results
Figure 7 summarizes the principal changes during a typical experimentusing plasma exchange transfusions to alter viscosity. 100 ml. of wholeblood were withdrawn and replaced by an equal volume of plasma in 10 ml.fractions so that the total blood volume was not significantly altered atany time. While the blood viscosity at a shear rate of 230 sec.-1 dimin-ished by approximately 15t%, the cardiac output was simultaneouslyaugmented by almost 400. Rather unexpectedly, the heart rate hardlychanged at all. This was in fact a characteristic of almost all the experi-ments and meant that the increase in cardiac output was due to an expan-
222
CLINICAL SIGNIFICANCE OF BLOOD VISCOSITY
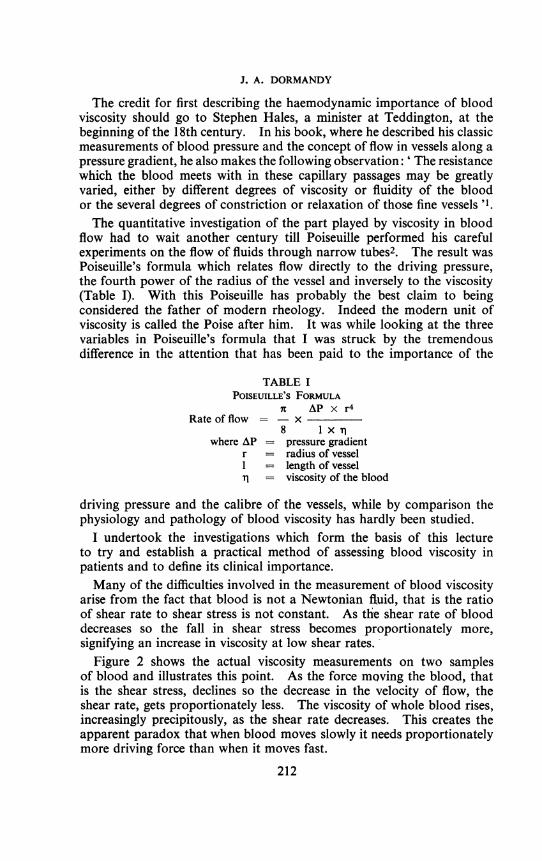
sion of the stroke volume. The rise in systolic blood pressure washigher than in the diastolic pressure, suggesting that the drop in peripheralresistance was less than the rise in the cardiac output.
After infusion of Propranolol and the injection of Atropine the absenceof a response to repeating the autonomic stimulation of the heart confirmedcomplete blockage of the cardiac nerve supply. Repeating the exchange
CHANGE IN C.O. (0) and P.R. (0)
0% * = Peripheral Resistance and Vtscosity.Change in P.R. = 1-5 x Change in - 04
(t = - 0'95 )
\ O O = Cardiac Output and Viscosity.O\ ° .40% Change in C.O. = - 2-0S x Change in + 0-6
o0 (1 -OH900-
+30%0
0 0
O +20%
O +1% XCHANGE IN VISCOSITY
I I I-30% 20 OG-to-0+lh + 20% +.30%
* -10%
0~~~~~~~~-20% O
*/ 8\
/* -30%0
Fig. 8. Summary of the results obtained in 20 experiments similar to thatillustrated in Figure 7. The change in viscosity, represented on the horizontalaxis, is compared to the change in cardiac output and peripheral resistance,
shown on the vertical axis.
transfusion, and lowering the viscosity further, produced very much thesame results as before denervation of the heart.
Figure 8 compares the changes in cardiac output and peripheral resistanceto changes in blood viscosity in this group of experiments. The correlationbetween these changes is very good. The magnitude of the inverserelationship between cardiac output and viscosity is surprisingly great,the regression equation showing that the change in cardiac output isrelated to the change in viscosity in the ratio of two to one. In otherwords, a 10% fall in viscosity produced a 20% rise in cardiac output.The changes in the peripheral resistance were less than in the cardiac
223

J. A. DORMANDY
output; a difference that was reflected in the variations of the pulsepressure, which was therefore inversely related to the change in viscosity.It is worth repeating again that the changes in the cardiac output werenot due to parallel changes in the heart rate.Of the three theoretical possibilities (Fig. 6) these findings most closely
parallel the results which would be expected if viscosity had a direct effecton both the heart and the peripheral resistance. There is no significantreflex vasoconstriction and the increase in cardiac output is not due toany extrinsic reflexes because there is no tachycardia and denervationdoes not alter the response. In fact viscosity appears to have a markeddirect effect on the stroke volume. The mechanism of this effect isdifficult to understand, particularly as it operates in the presence of anunchanged filling and emptying pressure. Nevertheless, there is nodoubt that blood viscosity has a very critical influence on cardiac function.
CLINICAL IMPORTANCE OF BLOOD VISCOSITYThe applicability of these findings to the human cardiovascular system
is suggested by the similar changes observed in human calf blood flowduring intravenous transfusions which altered the blood viscosity14.
These investigations into the physiological response to an alteredviscosity were undertaken to assess the importance of the abnormallyhigh viscosities which were recorded in some patients. If these results canin fact be validly applied, then the patients with arterial disease who havea 10 to 300% increase in blood viscosity will have a 20 to 60% decrease intheir blood flow solely due to their abnormal blood viscosity and quiteapart from any impairment offlow due to vascular narrowing. Correctingthe vascular abnormality alone may well still leave them with severeinsufficiency of flow. It must be remembered that only some of thepatients with vascular disease had an abnormally high blood viscosity;others fell within the normal range and there was no correlation betweenthe severity of the disease and the viscosity. Viscosity did, however,seem to have a profound influence on the post-operative course of thosepatients who had reconstructive vascular surgery.
Viscosity and vascular surgeryThe immediate post-operative period after vascular reconstruction is
well recognized as being a particularly critical time when a large percentageof the failures occur. This may be associated with the poor flow throughthe reconstructed vessel that has occasionally been observed immediatelyafter operation15. This phenomenon has not been explained and isunrelated to any local technical fault or systemic disorder such as hypo-volaemia or cardiac failure. The possibility that acute changes in bloodviscosity may be the cause of a poor flow through recently reconstructedvessels was investigated by monitoring the blood viscosity as well as theblood flow during and after reconstructive surgery.
224

CLINICAL SIGNIFICANCE OF BLOOD VISCOSITY
a FEMORO - POPLITEALVEIN BYPASS AMPUTATKJ
(a)
140
B.P. 100
(mm. Hg)
60
4
CALFBLOODFLOW
(ml/100gm/min) 2
BI.
BLOOD
VISCO6ITY(C.P. .) 4
1. V. FLUIDS
TIME
I
II
llB
EEIv9 '10 11 S
A.MA P.M.
I+1
I+,
I+15
I+10
4- LEFT LEG
4 RIGHT LEG
FEMORO-POPLITEALVEIN BYPASS
I CLAMPS ON I
(b)
140
S.P.(-m/Hg) ioo
0
LEGBLOODFLOW
(n.1/100mg/min) 2.
0
5 -
BLOOD 4VBSCOSITY 4(c. p. S.)
at 230 set.13.
FLtIDS
TIME
Fig. 9. Changes in blood viscosity, calf blood flow and blood pressure in twopatients during and after a femoro-popliteal vein bypass. Fluids infused duringsurgery are shown in units of 500 ml. (D.S. = Dextrose saline, B = Whole
blood, H = Hartmann's solution.)
225
a~~~~~~~~- X
tI i

J. A. DORMANDY
Two patients who were in many ways similar will illustrate the type ofchanges observed. Both patients were men in their late fifties whopresented with severe intermittent claudication on one side. Aortographyshowed a long superficial femoral block with a patent profunda and a goodrun off. A femoro-popliteal vein bypass was performed in both patientsand they both appeared to be technically satisfactory; here, however,the similarity ended. The first patient (Fig. 9a) had a slightly raisedblood viscosity before operation with a reasonably good blood flow onthe left, 4.2 ml./100 g./minute, but much less on the right, where he hadthe femoral block. While the common femoral artery was clamped,the flow on the left rose slightly and this was accompanied by a declinein the viscosity. Three units of blood and 500 ml. of Dextrose/Saline weretransfused during the operation to keep the blood pressure at a reasonablelevel. When the clamps were removed a brief period of hyperaemia wasnoted with a gratifying improvement in the flow on the operated sidecompared with the pre-operative level. The viscosity of the blood,however, began to climb as soon as the clamps were released, and withina few hours it was 25 % above the pre-operative level. The improvementin blood flow did not even last until the end of the operation and by thatevening the high blood viscosity had severely impaired the blood flowin both legs but particularly on the operated side. At this low levelof less than 1 ml./100 g./min. the leg could not survive and 10 days laterit had to be amputated.
Contrast this with the other patient who had a very similar pre-operativepicture (Fig. 9b). The pre-operative blood flows were much the same,but this man's blood viscosity was even higher than the previous patient's.Soon after the beginning of the operation a big difference was noticed, inthat the blood viscosity decreased and went on decreasing. This wasin marked contrast to the first patient and may have been connected witheither the exclusion of the diseased leg from the circulation or, as I thinkmore likely, with the fact that the majority of this patient's fluid replace-ment was with solutions other than blood. The decline of the bloodviscosity was arrested by the removal of the clamps, but in the criticalfirst few days it only rose very slowly and did not reach the high pre-operative levels till 10 to 14 days later. Parallel with this low viscositythe blood flow in the operated leg fell only slightly in the immediatepost-operative period and never reached the dangerously low levels seenin the first patient. A week after operation this patient was walking inthe ward and two weeks later he was discharged considerably improved.
ETreatment of abnormal blood viscosity
There is evidence then that some patients with vascular disease have anabnormally high blood viscosity and that this can change acutely duringsurgical operations. There is also evidence that a very close relationshipexists between changes in blood viscosity and blood flow. Unfortunately
226
CLINICAL SIGNIFICANCE OF BLOOD VISCOSITY
in most cases we do not know the cause for the raised blood viscosityand as yet no specific treatment has been discovered.
Various intravenous solutions have been said to cause an improvementin the circulation, at least partly by an effect on blood viscosity1l' 16. Thebest known of these is Low Molecular Weight Dextran. In many of thepatients studied during intravenous infusion, and in some of the animalexperiments, L.M.W.D. was used. A comparison with other intravenousfluids suggested that L.M.W.D. does not have a specific effect on bloodviscosity and that alterations in viscosity can be fully accounted for byhaemodilution14. In fact haemodilution seems to be the only definitepractical method available at this time for lowering blood viscosity.Its importance can be observed in the operative records of the two patientsdescribed earlier. The patient whose blood viscosity remained low atthe end of the operation, with a successful result, was predominantlytransfused with solutions other than blood. A fall in haematocrit alsolowers the oxygen-carrying capacity of the blood, but on theoreticalgrounds at least it would seem that haemodilution within the normal rangemay be of overall benefit to the patient in terms of oxygen availability.For instance, haemodilution sufficient to alter the haematocrit from 50%to 45 % would reduce the haemoglobin content of the blood by 10%, butit would also lower the viscosity by 12% at a shear rate of 230 sec.-1and by even more at lower shear rates (Fig. 3a). On the basis of thesereported experiments, the increase in blood flow produced by a 12% fallin viscosity is much greater, varying from 20 to 30% in different experiments(Fig. 8). The enhancement to the blood flow due to the fall in viscositywould therefore more than outweigh the disadvantage of the decrease inhaemoglobin concentration. Haemodilution has been accepted as partof the treatment of polycythaemia, but perhaps it would also be usefulin the treatment of patients with circulatory disorders who have a haema-tocrit in the so-called normal range. A 100% haemoglobin is perhapsnot always the unmitigated blessing it is often thought to be.
CONCLUSIONThe most practical and significant method of investigating the blood
viscosity of patients is using a comparative technique with normal controls,making the necessary corrections for differences in haematocrit. Measure-ments should be made at high shear rates, which are both more physiologi-cal and more accurate. Using this technique, some patients with arterialdisease have been shown to have an abnormally high blood viscosity.Although the aetiology of this condition is unknown it has been shownthat changes in viscosity do have a pathological significance in thatalteration in the blood viscosity produced a two-fold opposite change inblood flow. This was predominantly due to a direct effect on both thestroke volume and the peripheral resistance, independent of nervousreflexes.
227

J. A. DORMANDY
Much more needs to be known about the clinical significance of bloodviscosity, but the evidence presented suggests that assessment of the bloodviscosity should form part of the investigation of every patient withcirculatory disease. Abnormalities in blood viscosity may be as importantpathologically as lesions of the heart or the vessels. Equally importantis the monitoring of the blood viscosity in patients during and immediatelyafter vascular surgery.
ACKNOWLEDGEMENTSI would like to record my gratitude to Professor D. Slome, in whose
department I worked while carrying out this study. The clinical investi-gations were performed in Mr. Sol Cohen's vascular unit and I wouldalso like to thank him for his encouragement and help. Finally mythanks are due to Mr. Drewell and his staff of technicians in ProfessorSlome's department.
REFERENCES1. HALES, S. (1753) Statical Essays, Vol. 2. London, Imrys and Manby.2. POISEUILLE, J. L. M. (1846) Mem. Acad. Sci., Paris, 9, 433.3. WELLS, R. E., DENTON, R., and MERRILL, E. W. (1961) J. Lab. clin. Med. 57, 646.4. WHITMORE, R. L. (1967) Nature, 215, 123.5. RAND, P. W., LACOMBE, E., HUNT, M. E., and AUSTIN, W. M. (1964) J. appl.
Physiol. 19, 117.6. ROSENBLATT, G., STOKES, J., III, and BASSETT, D. R. (1965) J. Lab. clin. Med.
65, 202.7. DINTENFASS, L. (1968) Med. J. Aust. 1, 681.8. SKOVBORG, F., NIELSEN, A. V., SCHLICHTKRULL, J., and DITZEL, J. (1966) Lancet,
1,129.9. DINTENFASS, L., JULIAN, D. G., and MILLER, G. E. (1966) Amer. Heart J. 71, 587.
10. WELLS, R. E. (1966) Bibl. Anat. 9, 520.11. GELIN, L. E., and THOREN, 0. K. A. (1961) Acta chir. scand. 122, 303.12. CHIEN, S., USAMi, S., DELLENBACK, R. J., GREGERJEN, M. I., NANNINGA, L.,
and GUEST, M. M. (1967) Science, 157, 829.13. MERRILL, E. W., and PELLETIER, G. A. (1967) J. appl. Physiol. 23, 178.14. DORMANDY, J. A. Unpublished data.15. RENWICK, S., GABE, I. T., SHILLINGFORD, J. F., and MARTIN, P. (1968) Surgery,
64, 544.16. YAO, S. T., and SHOEMAKER, W. C. (1966) Ann. Surg. 164, 973.
DONATIONSDURING THE PAST few weeks the following generous donations have beenreceived:£20,250 Cocoa, Chocolate apd Confectionery Alliance (further
gift to Dental Research Unit).£350 Ilford Limited (promise of 7 annual payments of £50 p.a.)
(further gift).£300 Legacy from the late Mrs. S. E. Moore.£250 The Leathersellers' Company (further gift for cancer
research).Kodak Limited (further gift).
£105 J. Clapman, Esq.£100 The late Mrs. Ceinwen Williams (bequest for research
purposes).In addition there have been a number of gifts under £100 which total-£170 14s.
228