converting methane to liquid fuel with electromagnetically velocitized magnesium microparticles

Converting Waste Plastics into Fuel
Report on Waste Quantification and
Characterization for Bangkok Metropolitan
Administration
Prepared for
United Nations Environment Program
International Environmental Technology Centre (IETC)

Table of Contents
List of Tables i
List of Figures ii
Chapter 1 Introduction 1
1.1 Overview of Solid Waste Management for Bangkok
Metropolitan Administration (BMA)
1
1.2 Scope of Report 3
Chapter 2 Methodology for Data Collection 4
2.1 Secondary Data Collection 4
2.2 Qualification and quantification of residential waste 4
2.3 Recycling and Resource Recovery 5
2.4 Waste Analysis 5
2.4.1 Bulk density analysis 5
2.4.2 Moisture Content 6
2.4.3 Volatile Solids 7
2.4.4 Ash Content 7
2.4.5 Calorific Value 7
Chapter 3 Solid Waste Generation in BMA 8
3.1 Waste Generated by Different Generators 8
3.1.1 Municipal Solid Waste 8
3.1.2 Commercial Waste 16
3.1.3 Industrial Waste 17
3.1.4 Health Care Waste 18
3.1.5 Construction and Demolition Waste 20
3.2 Resource Recovery Pattern 21
3.3 Solid Waste Generated by Sources not Receiving
Collection Services
25
3.4 Wastes at Disposal Site 26
3.5 Other Analysis 30
3.5.1 Bulk Density 30
3.5.2 Moisture Content 31
3.5.3 Volatile Solids 32
3.5.4 Ash Content 33
3.5.5 Calorific Value 34
Chapter 4 Projection of Waste Generation 35
4.1 Municipal Solid Waste Generation 35
4.2 Waste Property Forecast 37
Chapter 5 Conclusion 39
Reference 40

List of Tables
Table 1 Physical Composition of Waste Discharged from Different
Income Levels
Table 2 Amount of Solid Waste Collected by Category
Table 3 Composition of waste from selected business sectors
Table 4 Distribution of Health Facility in the BMA
Table 5 Physical Composition of Medical Waste
Table 6 Comparison of wastes by utilization from three transfer stations
in fiscal year 2005
Table 7 Quantity of waste reduced after waste reduction campaigns and
estimation of costs saved
Table 8 Types and amount of treated and disposed solid waste in fiscal
year 2005
Table 9 Bulk Density of solid waste
Table 10 Moisture content of mixed waste at disposal site and at
collection trucks
Table 11 Average volatile solid contents of waste in BMA
Table 12 Ash content of solid waste
Table 13 Calorific values of solid waste
Table 14 Forecast of waste discharge growth rate
Table 15 Trend of waste composition in wet base (unit: %)

List of Figures
Figure 1 Relevant agencies with solid waste management in Bangkok.
Figure 2 Quantity of municipal solid waste generated
Figure 3 MSW generations in Bangkok in Relation to the population
growth and per capita generation rate
Figure 4 Physical component of municipal solid waste
Figure 5 Example of community solid waste composition collected. No
waste separation can be observed
Figure 6 Percentage of household hazardous waste delivered to three
transfer stations
Figure 7 Waste from local markets, unsorted
Figure 8 Waste from industrial process that sometime went untreated
Figure 9 Composition of infectious medical waste and general municipal
waste of medical institutions
Figure 10 Number of Office Building Construction Permits in Bangkok
Figure 11 Three types of recycling programs implemented in Thailand
Figure 12 Community Waste Bank
Figure 13 Compost productions from MSW
Figure 14 Composition of municipal solid wastes arrived at transfer
stations from 1994 to 2007
Figure 15 Forecast of municipal solid waste generation from year 2000 –
2016
Figure 16 Forecast of waste discharge and collection amount
Figure 17 Forecast of physical composition (wet base)
1
Chapter 1
Introduction
1.1 Overview of Solid Waste Management for Bangkok Metropolitan
Administration (BMA)
Bangkok, the capital city of Thailand is a mega-city located in the center of
the country on the low flat plain of Chao Phraya River which extended to the
Gulf of Thailand. It is surrounded by Samut Sakhon and Samut Prakan to the
south; Nakhon Pathim to the west; Nonthaburi, Pathumthani and Nakhon Nayok
to the north and Chachoengsao to the east. The elevation is ranging from 1.50-
2.3 m. Mean Sea Level. Bangkok has monsoon type of climate, which can be
classified into three main seasons; rainy, cool and hot. Within the area of
Bangkok, the city is divided into 50 districts and 154 sub-districts. Urbanized
area has speeded to cover almost half of the city area. Existing land use
consists of three main types; residential use (23 %), agricultural use (23.58 %),
and the rest for commercial, industrial and government use.
With an area of 1,568.737 sq. km., it ranks 68th in size out of the country’s
76 provinces but has the largest population and population density. The total
population in Bangkok as of 2003 was 5,844,607 (2,822,171 male and
3,022,436 female), which was approximately 10% of the total population of
Thailand.
The increasing quantity of solid wastes in Bangkok has caused serious
environmental problems, which in turn deteriorate quality of life of urban
populations. Rapid increase of wastes due to the trends of increasing
population, mass production and mass consumption has made it difficult for
authorities to manage solid waste properly.
Quantity of general solid waste had increased from 3,260 tons per day in
1985 to that of 6,633 tons per day in 1995 and 9,472 tons per day in 2002. The
other type of waste is hazardous waste that consists of infectious waste from
2
hospitals, household hazardous waste, electronic waste and industrial
hazardous waste from manufacturing process.
The Environmental Department and 50 districts offices are responsible
for the collection of solid waste in Bangkok. BMA has applied both direct and
indirect methods for collecting solid waste. For direct collection method, the
waste is collected by vehicles or boats.
Indirect collection is a system in which BMA provides containers for
collecting waste at various sources such as markets, department stores, and
pedestrian walkways. The containers are classified according to food waste,
recyclable waste, and household hazardous waste. The collected waste is
transported to 3 transfer stations then transferred to 2 sanitary landfills at
Kumpaeng Saen district Nakhon Phathom province and Bang Plee district
SamutPrakarn province. Figure 1 shows the solid waste management scheme
of Bangkok.

3
Figure 1 Relevant agencies with solid waste management in Bangkok.
Source: Dept of Public Cleansing, BMA, 2002
1.2 Scope of Report
As there are many studies on solid waste management systems for BMA,
the data has been collected intensively with high accuracy. The report therefore
is done based on secondary data available. Site surveys and observations
were being conducted in order to verify the accuracy of available data. Data on
different type of wastes from different generation points were being discussed
separately.
Solid Waste
Disposal (96.52%)
Illegal Dumping Composted Naturally
On Site Recycling (3.48%)
Separated Not Separated
Recycled (1) by BMA (0.02%) Recycled (2) by Garbage Collectors (4.33%)
Collected
Transfer Stations
Recycled (3) by waste picker at sites (0.20%)
Evaporation of water Final Disposal
Total Recycled = 8.04%

4
Chapter 2
Methodology For Data Collection
2.1 Secondary Data Collection
Secondary data have been used to gain background information about
the formal solid waste management system as well as waste generation and
characterization in BMA. Most of the secondary data has been collected from
BMA reports, reports conducted by non-governmental organizations, published
research reports, articles, and books.
2.2 Qualification and Quantification of Residential Waste
The analysis of waste compositions was conducted in order to verify
accuracy of data acquired through literature search. Waste samples were
collected from waste collection trucks at different locations in Bangkok. Waste
was randomly loaded into a plastic bucket, which was then tapped on to the
ground few times. If this reduces waste volume in the bucket, additional waste
is added until the bucket is full. Balance was used to measure the weight of the
bucket and the weight of the filled basket. Waste is then sorted according to the
following items to determine waste composition:
• Paper (recyclable)
• Paper (non-recyclable)
• Textile
• Plastic and foam (recyclable)
• Yard waste
• Food waste
• Bone and shell
• Leather and rubber
• Metal

5
• Bottle and glass
• Ceramic and stone
• Unclassified
2.3 Recycling and Resource Recovery Patterns
Recycling has been an effective strategy used in Bangkok metropolis
area to reduce the quantity of waste generated. Data on recycling and resource
recovery patterns were collected via available data published and from
observation and informal interviews with sectors involved with recycling and
resource recovery.
2.4 Waste Analysis
There are many parameter related to waste characteristics that can help
waste manager to decide proper management scheme for waste in each
locality. In this report five parameters are discussed. The parameters are
density of waste, moisture content, volatile solid, ash content and calorific value.
2.4.1 Bulk Density Analysis
Waste bulk density is another important measure used to define the
number and capacity of waste storage and collection facilities required. Based
on waste density and the capacity of trucks, the amount of waste collected can
be measured in tons (weight). The high density measured reflects the less
effectiveness of compaction vehicles for waste transportation. However, waste
density provides rough information of the characteristics of solid waste
produced. The parameter is affected by many factors such as seasonal
variation and the way that waste is put into containers.
In this report, 20 samples of waste fractions were measured for bulk
density of solid waste in order to verify the accuracy of data available. Samples
were collected at random from waste collection trucks at different location in

6
Bangkok. Each sample was divided into two piles of waste; the number reported
here is an average from each sampling point. Waste was put into the weigh box
to overflowing. Weigh the filled box and calculate the bulk density to three
significant figures.
Calculation Bulk Density = (W- WT)/V
Where:
W = the weight of the box full,
WT = the weight of the box empty, and
V = the volume of the box determined
2.4.2 Moisture Content (MC)
Data on moisture content of mixed solid waste at the dumping site were
available. Therefore, the report has determined moisture content of residential
waste according to the standard procedures. Samples used for bulk density
analysis were used for MC analysis as well. Sample were divided into two piles;
the first pile for total moisture content while component of second pile will be
segregated for major components such as organic, paper, soft plastic, hard
plastic, and glass. Initial weight of each category was measure, after which the
samples were placed in electric oven at 90oC for 48 hours. Dried weights were
then record and calculation of moisture content was done with the following
formula;
Moisture Content (MC) = 100 x (W-D)/W
Where:
W = Wet weight of sample
D = Dried weight of sample

7
2.4.3 Volatile Solid
Volatile solids refer to the amount of matter that volatilizes when heated
to 550oC. After completion of the TS test, the crucible containing the total solids
mass is heated at 550oC until all volatile matter has been ignited and burned.
This amount is then figured as;
Volatile Solid (VS) = mcf –mcx / V
where:
mcf = crucible mass after drying at 103oC (mg)
mcx = crucible mass after drying at 550oC (mg)
V = sample volume (L)
A volatile solid is a useful approximation of the amount of organic matter
present in sample.
2.4.4 Ash Content
Ash content indicates the mass of incombustible material remaining after
burning a given waste sample as a percentage of the original mass of the waste
sample. Samples used for moisture content analysis were used for ash content
analysis. Weigh of samples were recorded, samples were then burned and
transferred to furnace operated at 600oC for two hours. The remaining ash was
allowed to cool down before the recording of ash weight. Calculation for
percentage of ash from residential wastes were done and compared with
acquired documents.
2.4.5 Calorific Value
The energy potential of waste depends on the mix of materials and their
moisture content. The higher the calorific value of the waste the more energy
can be extracted. In this report, calorific value presents is the number reported
by the BMA.

8
Chapter 3
Solid Waste Generation in BMA
3.1 Waste Generated by Different Generators
3.1.1 Municipal Solid Waste
The quantity of waste generated depends on many factors. The most
important are population growth, economic growth, and the efficiency of the
reuse and recycling system. Both the growth of population and economic
development have resulted in increasing municipal solid waste of Bangkok
Metropolitan Administration. Change in quantity of municipal solid waste
generated is shown in Figure 2.
Figure 2 Quantity of municipal solid waste generated

9
The municipal solid waste comprised of daily waste produced by
households, institutions and businesses is approximately 67% of the total waste
generation. The remaining 33% consists of hazardous and non-hazardous
industrial waste and hospital waste. Bangkok produces 8,500 ton/day of wastes
around 3.1 millions ton/year, equivalent to 24% of total wastes of the country.
During 1980-1997, the volume of waste increased by 10% but the figure
dropped to 1.52% during 2003-2007 due to BMA successful campaigns on
waste reduction and source separation (Figure 3).
Figure 3 MSW generations in Bangkok in Relation to the population growth and
per capita generation rate

10
(A) Waste Composition
Composition of waste generated in Bangkok is highly biodegradable,
mainly composed of an organic fraction with high moisture content. Food waste,
plastic/foam, paper, metal, and glass are the common component of waste (Fig.
4 - 5). The average moisture content of municipal solid waste in Bangkok is
around 50 % in wet mass basis.
Figure 4 Physical component of municipal solid waste

11
Figure 5 Example of community solid waste composition collected. No waste
separation can be observed.
When economic condition is taken into consideration, households from
different income levels generate slightly different waste composition. From the
study conducted by Japan Bank for International Cooperation – Special
Assistance for Project Formation (JBIC – SAPROF), households were
categorized into three income levels;
Class A Households: ≥ 30,000 Baht/month/household
Class B Households: 13,000 – 29,999 Baht/month/household
Class C Households: 1 – 12,999 Baht/month/household
Waste composition discharged from three categories was analyzed and
as reported in Table 1.
12
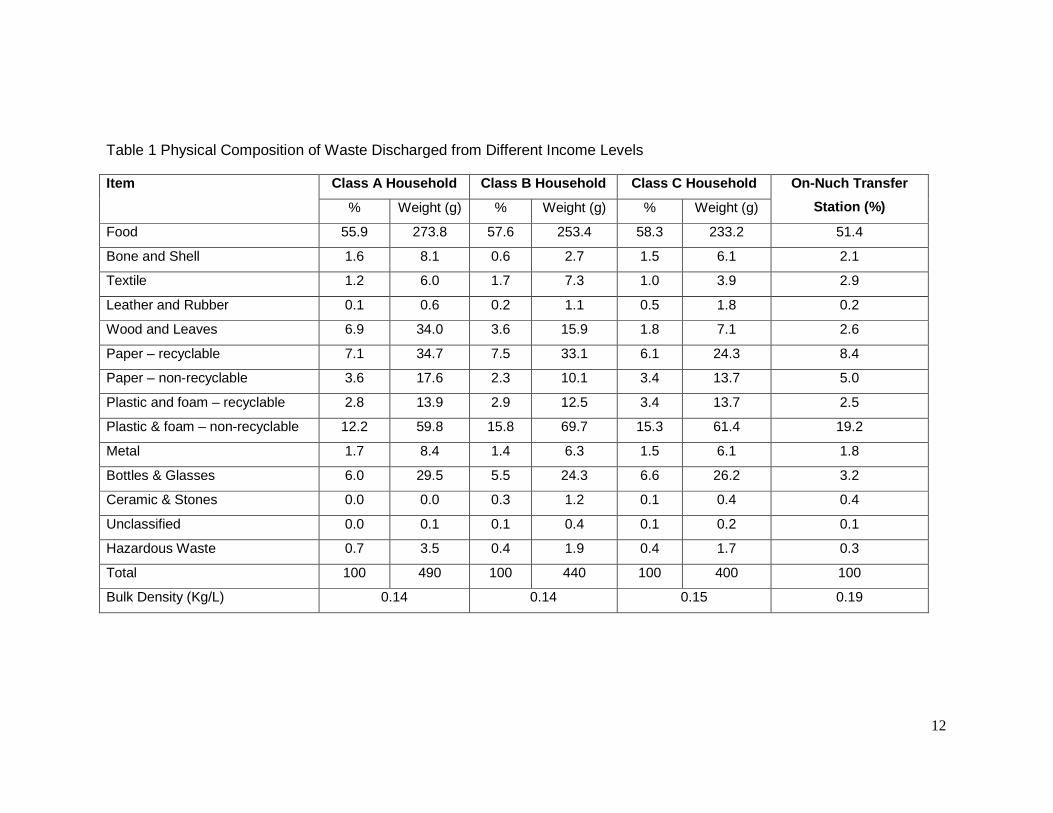
Table 1 Physical Composition of Waste Discharged from Different Income Levels
Class A Household Class B Household Class C Househo ld Item
% Weight (g) % Weight (g) % Weight (g)
On-Nuch Transfer
Station (%)
Food 55.9 273.8 57.6 253.4 58.3 233.2 51.4
Bone and Shell 1.6 8.1 0.6 2.7 1.5 6.1 2.1
Textile 1.2 6.0 1.7 7.3 1.0 3.9 2.9
Leather and Rubber 0.1 0.6 0.2 1.1 0.5 1.8 0.2
Wood and Leaves 6.9 34.0 3.6 15.9 1.8 7.1 2.6
Paper – recyclable 7.1 34.7 7.5 33.1 6.1 24.3 8.4
Paper – non-recyclable 3.6 17.6 2.3 10.1 3.4 13.7 5.0
Plastic and foam – recyclable 2.8 13.9 2.9 12.5 3.4 13.7 2.5
Plastic & foam – non-recyclable 12.2 59.8 15.8 69.7 15.3 61.4 19.2
Metal 1.7 8.4 1.4 6.3 1.5 6.1 1.8
Bottles & Glasses 6.0 29.5 5.5 24.3 6.6 26.2 3.2
Ceramic & Stones 0.0 0.0 0.3 1.2 0.1 0.4 0.4
Unclassified 0.0 0.1 0.1 0.4 0.1 0.2 0.1
Hazardous Waste 0.7 3.5 0.4 1.9 0.4 1.7 0.3
Total 100 490 100 440 100 400 100
Bulk Density (Kg/L) 0.14 0.14 0.15 0.19

13
(B) Waste Discharge Rate
Although waste composition did not vary much between households from
different income levels, however, the discharge ratio differed by income class.
The rate of waste discharge from class A and class B households were
noticeably higher than in class C household. Average discharge rate for each
income class is as follow;
Class A household: 490g/day
Class B household: 440g/day
Class C household: 400g/day
However, seasonal variation of discharge rate should also be taken into
consideration.
(C) Waste Collection Amount
BMA focuses on effective collection to minimize uncollected waste.
Collection trucks are rented to solve vehicle unavailability and problem on
vehicle maintenance. In fiscal year 2007, almost 65% of garbage trucks out of
are rented in service. Effective waste collection requires public cooperation on
proper time and places in dropping waste to reduce uncollected wastes.
Appropriate routing for collection trucks is required. The approaches employed
are:
1. Assigning of waste dropping and collection schedule
• Main streets, minor streets and market places:
1) 08.00 p.m. to 03.00 a.m.
2) Collection completed by 06.00 a.m.
• Collection is made daily for communities, small roads and lanes.
For areas inaccessible by collection trucks, volunteers collect waste at source
and put into a collection point.
2. Waste collection by types and increase collection frequency.
• General wastes • Daily or every other day based on location.

14
• Food wastes • Daily basis.
• Recyclable wastes • Every Sunday
• Hazardous wastes • 1st and 15th of the month
At present, most of municipal solid wastes were collected. BMA has
estimated that 99% of wastes generated were collected and transferred.
Quantity of waste collected is shown in Table 2. To further improve waste
collection, collection route map is re-arranged and information technology and
the Global Positioning System is introduced.
Table 2 Amount of Solid Waste Collected by Category.
Type 2002 2003 2004 2005 2006 2007
Amount of General
Garbage (ton/day)
9460.40 9,349.97 9,356.69 8,495.97 8,376.95 8,718.78
Volume of Hazardous
Waste (ton/day)
0.14 0.12 0.14 0.14 0.15 0.19
Volume of Infectious
Waste (ton/day)
14.285 15.367 15.245 16.197 17.356 18.820
(D) Household Hazardous Waste
A management system for most community generated hazardous waste
does not exist. While over half of the waste generated from community sources
such as households, gas stations, and dry cleaners is recycled, only one
percent of the remainder is treated. As a result, each year an estimated
140,000 tons of this waste is either co-disposed with municipal solid waste or
discharged to the sewer or directly to the environment. These practices
increase the risk of exposure to the general public, collection workers, and
scavengers, and can contribute to groundwater contamination.
In 2005, the Department of Environment predicted that the amount of
hazardous wastes contaminating with hazardous waste is 24.6 tons /day,
representing 0.29 percent of the total waste amount. The amount of household
hazardous waste collected and delivered to three waste transfer and treatment

15
centers is shown in Fig. 6. Only 0.5 percent could be collected and delivered by
BMA to the licensed company for disposal and proper handling of waste.
Figure 6 Percentage of household hazardous waste delivered to three transfer
stations
It should be noted that the pattern of hazardous waste delivered to
transfer stations is irregular. BMA therefore has developed and implemented
several plans to recover hazardous from household more effectively. For
example, BMA has cooperated with shopping malls, convenient stores and high
rise building to come up with the locations of containers accommodating
household hazardous waste and with collection for disposal.
16
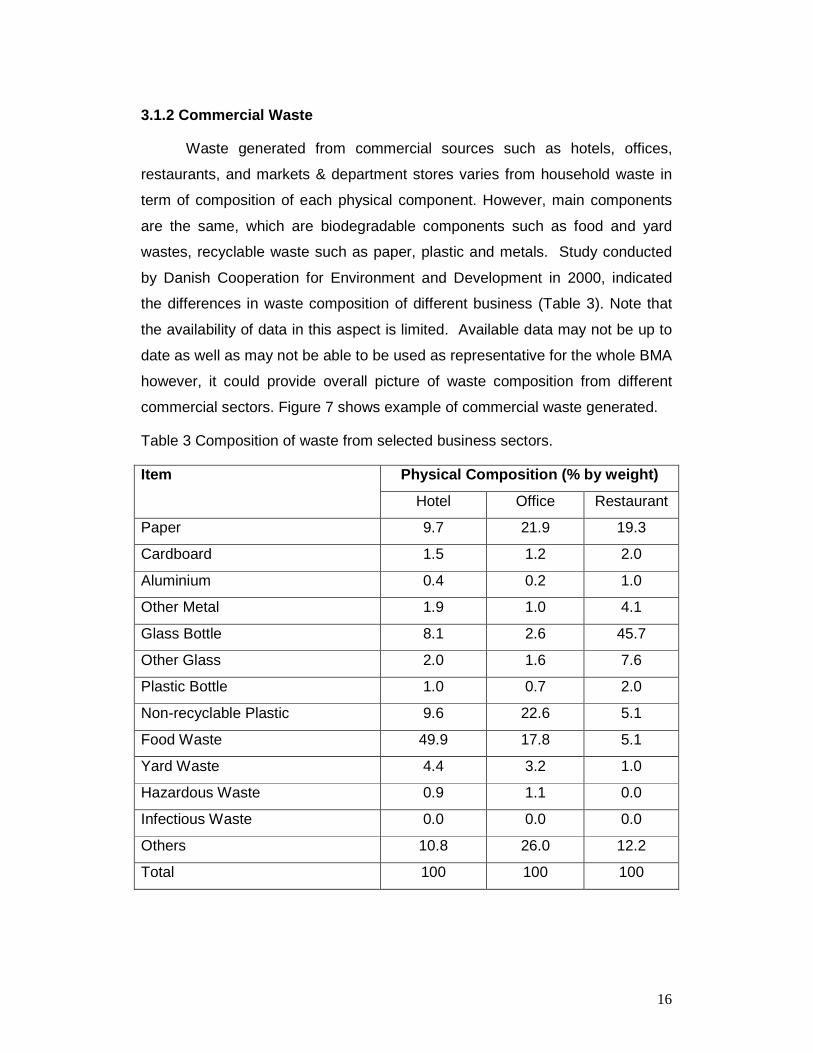
3.1.2 Commercial Waste
Waste generated from commercial sources such as hotels, offices,
restaurants, and markets & department stores varies from household waste in
term of composition of each physical component. However, main components
are the same, which are biodegradable components such as food and yard
wastes, recyclable waste such as paper, plastic and metals. Study conducted
by Danish Cooperation for Environment and Development in 2000, indicated
the differences in waste composition of different business (Table 3). Note that
the availability of data in this aspect is limited. Available data may not be up to
date as well as may not be able to be used as representative for the whole BMA
however, it could provide overall picture of waste composition from different
commercial sectors. Figure 7 shows example of commercial waste generated.
Table 3 Composition of waste from selected business sectors.
Physical Composition (% by weight) Item
Hotel Office Restaurant
Paper 9.7 21.9 19.3
Cardboard 1.5 1.2 2.0
Aluminium 0.4 0.2 1.0
Other Metal 1.9 1.0 4.1
Glass Bottle 8.1 2.6 45.7
Other Glass 2.0 1.6 7.6
Plastic Bottle 1.0 0.7 2.0
Non-recyclable Plastic 9.6 22.6 5.1
Food Waste 49.9 17.8 5.1
Yard Waste 4.4 3.2 1.0
Hazardous Waste 0.9 1.1 0.0
Infectious Waste 0.0 0.0 0.0
Others 10.8 26.0 12.2
Total 100 100 100
17
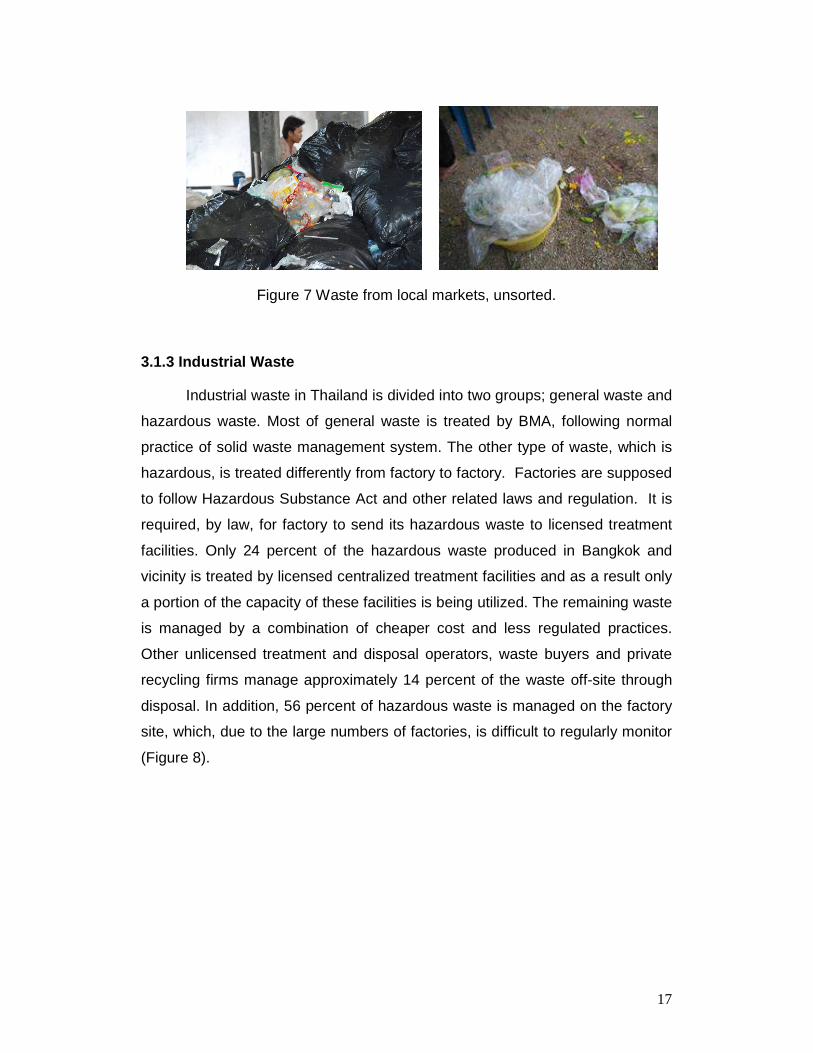
Figure 7 Waste from local markets, unsorted.
3.1.3 Industrial Waste
Industrial waste in Thailand is divided into two groups; general waste and
hazardous waste. Most of general waste is treated by BMA, following normal
practice of solid waste management system. The other type of waste, which is
hazardous, is treated differently from factory to factory. Factories are supposed
to follow Hazardous Substance Act and other related laws and regulation. It is
required, by law, for factory to send its hazardous waste to licensed treatment
facilities. Only 24 percent of the hazardous waste produced in Bangkok and
vicinity is treated by licensed centralized treatment facilities and as a result only
a portion of the capacity of these facilities is being utilized. The remaining waste
is managed by a combination of cheaper cost and less regulated practices.
Other unlicensed treatment and disposal operators, waste buyers and private
recycling firms manage approximately 14 percent of the waste off-site through
disposal. In addition, 56 percent of hazardous waste is managed on the factory
site, which, due to the large numbers of factories, is difficult to regularly monitor
(Figure 8).

18
Figure 8 Waste from industrial process that sometime went untreated.
3.1.4 Healthcare Waste
Infectious waste is managed much more effectively due to the ministerial
rules and regulations, which require health care premises to separate infectious
wastes for appropriate treatment to prevent any public heath threats.
The institutions that deal with technical matters of medical waste
management include the Pollution Control Department (PCD), the Department
of Health (DH) and the Bangkok Metropolitan Administration (BMA). Each
institution carries out its own functions rather independently. However, due to
the differences in the definition of medical waste used by each institution, there
are discrepancies in the basic data pertaining to hospital wastes, particularly
with respect to the types and generation rate of wastes. Due to the reasons
cited above, the waste generation rates issued by the BMA, DH and PCD are
0.11, 0.43 and 0.65 kg/bed/day respectively. In 1995 the DH commissioned a
study on the disposal of hospital wastes by incineration, which revealed that the
average waste-generation rate was 0.23 kg/bed/day.
In order to treat infectious waste appropriately, the BMA operates
incinerators for the disposal of medical wastes in the Bangkok area. Infectious
waste management practices are dependent upon the type of medical facility. In
Bangkok alone there are over 3,000 hospitals and clinics (Table 4). Table 5
shows physical characteristics of general and infectious medical waste. Figure
9 shows composition of medical waste and general solid wastes generated that
are kept for selling.

19
Table 4 Distribution of Health Facility in the BMA
Administrative Level Health Facility Number
Public Hospital • Medical school hospitals
• General Hospital
• Specialized hospital/institution
• Public health centers/branches
• 10-Beds hospital (BMA)
5
29
19
60/83
3
Private Hospital (With inpatient beds)
• No. of hospital
• No. of beds
117
16,001
Clinics (Without inpatient beds)
• Modern
• Traditional
2,821
260
Table 5 Physical Composition of Medical Waste
Components Composition (% dry weight basis)
Cotton/gross 67.15
Rubber glove 12.52
Plastic 13.48
Paper 2.71
Wood 3.23
Food 0.65
Leather 0.13
Metal 0.12

20
Figure 9 Composition of infectious medical waste and general municipal waste
of medical institutions.
3.1.5 Construction and Demolition Waste
The rapid urbanization of Thailand has generated and increased demand
for housing and infrastructure, which in turn creates large quantity of
construction and demolition waste. At present, increasing unregulated dumping
of construction waste and the limited space in landfill has become major waste
management problems.

21
Although some materials (i.e. wood, glass, and metal) presence in
municipal solid waste are perceived as building materials, it is unclear if these
materials wastes were generated from construction activity as they can also be
generated from other activities unrelated to construction.
The main components of construction waste are steel reinforcement,
wood, concrete, cement, bricks, and tiles. Nevertheless, quantity of each
component varies from site to site depending on size and design of construction
projects. Trend of construction and demolition waste has grown following
construction permits given by government authority.
3.2 Resource Recovery Pattern
From the information on composition of municipal solid waste in the
BMA, it can be seen that waste can be classified according to their utilization as
follow;
• Waste to be used in fertilizer fermentation,
• Waste to be used in recycled process, and
• Waste to be sent to landfill for final disposal.
At present BMA has initiate waste reduction program by the promotion of
compost production and waste separation for recycled materials. Table 6
compare waste arrived at three transfer stations by its utilization potential.

22
Table 6 Comparison of wastes by utilization from three transfer stations in fiscal
year 2005.
Transfer Station Type of Waste
Utilization On Nuch
(%)
Nong Khaem
(%)
Sai Mai
(%)
Average
(%)
Fertilizer Ferment Type
49.39 47.85 54.34 50.53
Food 44.25 41.36 47.35 44.32 Wood & Leaves 5.14 5.66 4.53 5.11 Others 0.0 0.83 2.46 1.10 Recycle Type 9.65 10.67 8.74 9.69 Paper (Recycled) 1.14 0.63 0.38 0.72 Plastic (Recycled) 4.12 1.91 1.62 2.55 Foam 0.52 1.31 1.76 1.20 Glass 1.54 5.02 2.94 3.16 Metal 2.33 1.80 2.04 2.06 Landfill type 40.96 41.48 36.92 39.78 Paper (non-recycled) 7.65 10.84 8.31 8.93 Plastic (non-recycled) 27.75 22.45 23.19 24.46 Leather & Rubber 0.68 1.41 0.39 0.83 Cloth & Textile 2.86 6.36 4.53 4.58 Stone & Ceramic 1.14 0.34 0.11 0.53 Bone & Shell 0.88 0.08 0.39 0.45
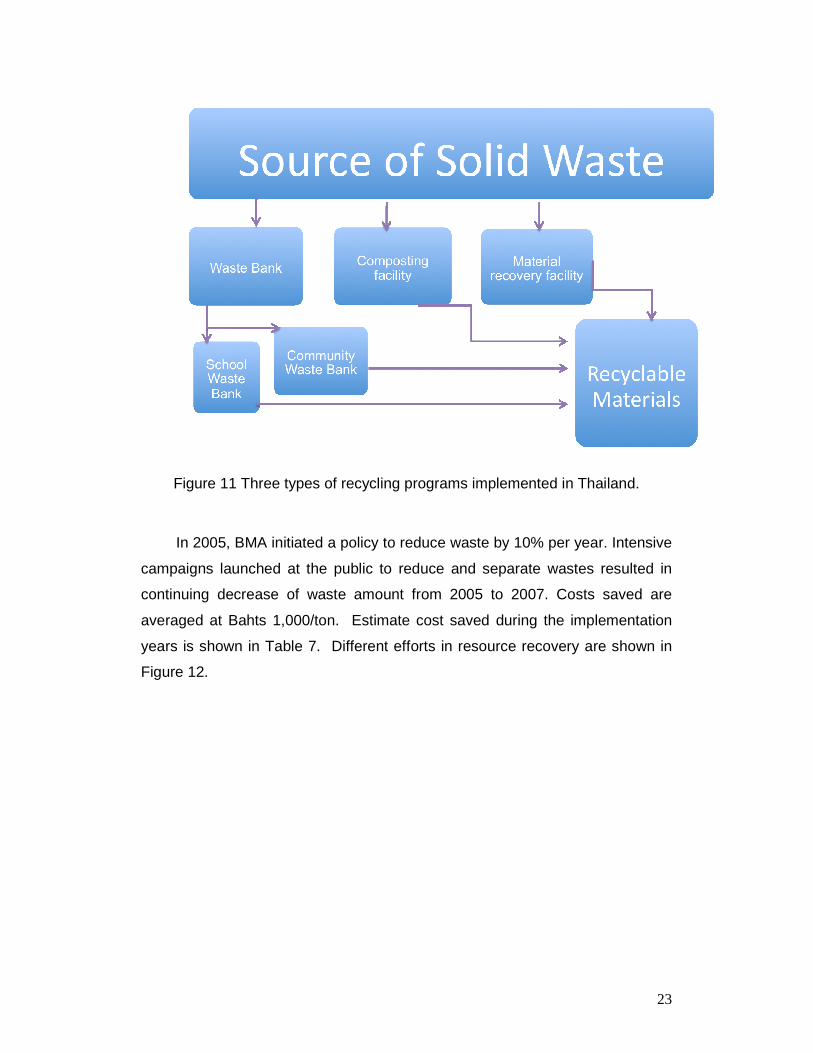
For BMA recycling practices are dominated by informal sector. Very low
portion of waste generated are being recycled. Most recycling efforts have
focused on encouraging community to establish garbage bank and composting
facilities. There are three basic type of recycling programs being implemented
in Thailand as shown in Figure 11.
23
Figure 11 Three types of recycling programs implemented in Thailand.
In 2005, BMA initiated a policy to reduce waste by 10% per year. Intensive
campaigns launched at the public to reduce and separate wastes resulted in
continuing decrease of waste amount from 2005 to 2007. Costs saved are
averaged at Bahts 1,000/ton. Estimate cost saved during the implementation
years is shown in Table 7. Different efforts in resource recovery are shown in
Figure 12.

24
Figure 12 Community Waste Bank
Table 7 Quantity of waste reduced after waste reduction campaigns and
estimation of costs saved
Year
Quantity of
Waste Reduced
(Tons/day)
Estimate Cost
Saved
(Baht/day)
Total Cost Saved
(Million
Baht/year)
2005 860.42 860.420 314
2006 979.47 979,470 357
2007 637.91 637,910 232
Resource recovery system mentioned above is considered as formal
recycle strategy; however, in Thailand an informal sector of resource recovery
seems to be more active. Material recovery apart from that of BMA’s initiative
includes
(a) Material recovery by waste pickers and tricycle waste buyers in
towns.
In Thailand, recycling at generation source has long been
practiced. Households, shop houses and business sectors
normally separate their recyclable waste (mainly paper, glass and
metal) and store it until the amount is enough to sell to waste
buyer or recycling shops. Waste buyer purchases these materials
directly from waste generators. The study conducted by Pollution
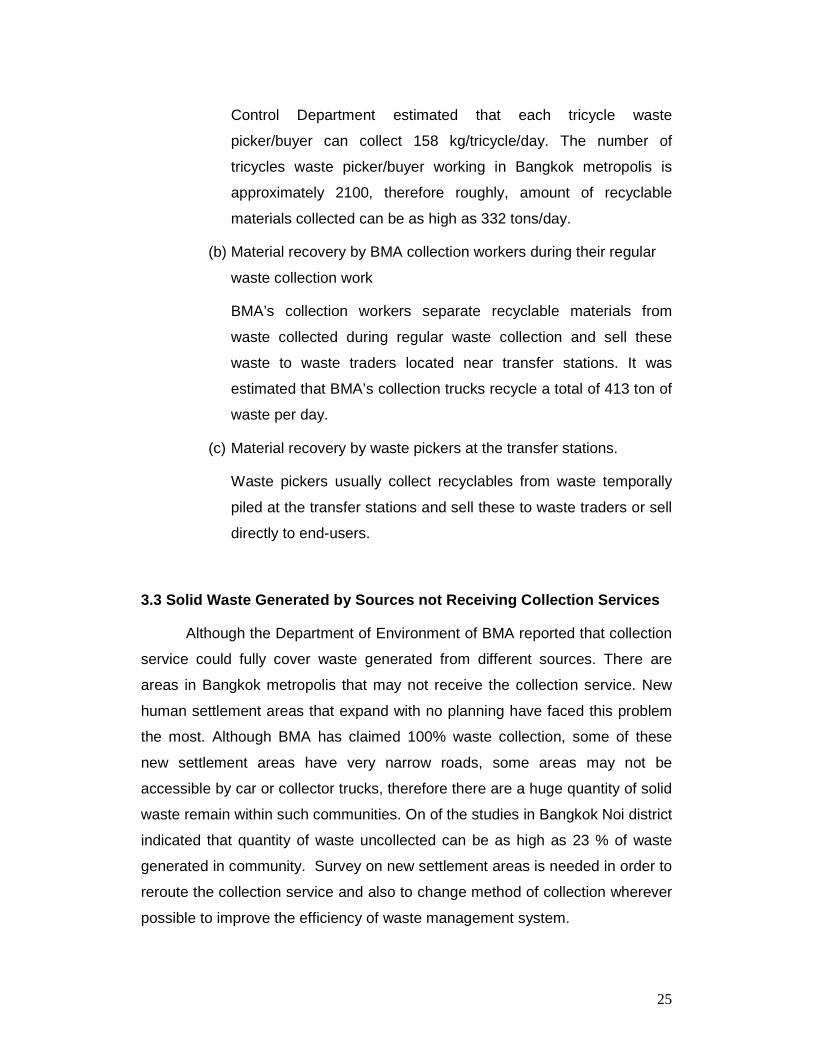
25
Control Department estimated that each tricycle waste
picker/buyer can collect 158 kg/tricycle/day. The number of
tricycles waste picker/buyer working in Bangkok metropolis is
approximately 2100, therefore roughly, amount of recyclable
materials collected can be as high as 332 tons/day.
(b) Material recovery by BMA collection workers during their regular
waste collection work
BMA’s collection workers separate recyclable materials from
waste collected during regular waste collection and sell these
waste to waste traders located near transfer stations. It was
estimated that BMA’s collection trucks recycle a total of 413 ton of
waste per day.
(c) Material recovery by waste pickers at the transfer stations.
Waste pickers usually collect recyclables from waste temporally
piled at the transfer stations and sell these to waste traders or sell
directly to end-users.
3.3 Solid Waste Generated by Sources not Receiving Collection Services
Although the Department of Environment of BMA reported that collection
service could fully cover waste generated from different sources. There are
areas in Bangkok metropolis that may not receive the collection service. New
human settlement areas that expand with no planning have faced this problem
the most. Although BMA has claimed 100% waste collection, some of these
new settlement areas have very narrow roads, some areas may not be
accessible by car or collector trucks, therefore there are a huge quantity of solid
waste remain within such communities. On of the studies in Bangkok Noi district
indicated that quantity of waste uncollected can be as high as 23 % of waste
generated in community. Survey on new settlement areas is needed in order to
reroute the collection service and also to change method of collection wherever
possible to improve the efficiency of waste management system.

26
3.4 Wastes at Disposal Site
The composition of waste at disposal sites varies influencing by
economic conditions, social activities, culture and other factors. The Division of
Solid Waste Hazardous Waste and Nightsoil Management has monitored
closely the composition of waste entering transfer sites. Percentage of each
component is also changing from year to year. However, the main components
remain the same; food waste, plastic waste, and paper waste. Composition of
wastes arrived at transfer station from different years is shown in Figure 14.
The general conclusion of wastes arrived at transfer stations can be drawn as
followed;
1.) Wastes for composting represent the highest volume ranging from
49% to 61%. (Figure 13)
2.) Wastes to be disposed in landfills ranging from 33.15% to 40.13%
3.) Wastes for recycling ranging from 5.85% to 15.08%
Figure 13 Compost productions from MSW

27
Figure 14 Composition of municipal solid wastes arrived at transfer stations
from 1994 to 2007.
28
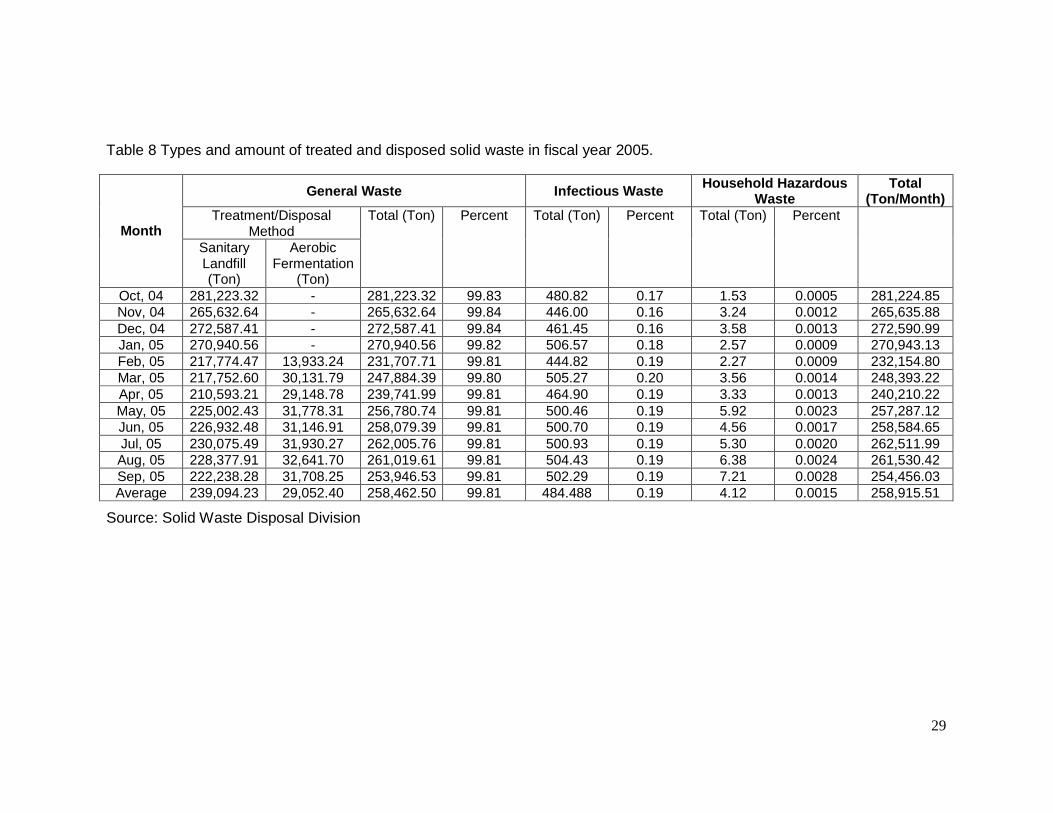
Apart from general municipal solid wastes, all three-transfer station also
collects infectious and household hazardous wastes. Quantity of each type of
waste in fiscal year 2005 is shown in Table 8. It can be seen that very low
quantity of infectious and household hazardous wastes can be collected, both
categories combined contribute less than one percent of total waste delivered.
29
Table 8 Types and amount of treated and disposed solid waste in fiscal year 2005.
General Waste Infectious Waste Household Hazardous Waste
Total (Ton/Month)
Treatment/Disposal Method Month
Sanitary Landfill (Ton)
Aerobic Fermentation
(Ton)
Total (Ton) Percent Total (Ton) Percent Total (Ton) Percent
Oct, 04 281,223.32 - 281,223.32 99.83 480.82 0.17 1.53 0.0005 281,224.85 Nov, 04 265,632.64 - 265,632.64 99.84 446.00 0.16 3.24 0.0012 265,635.88 Dec, 04 272,587.41 - 272,587.41 99.84 461.45 0.16 3.58 0.0013 272,590.99 Jan, 05 270,940.56 - 270,940.56 99.82 506.57 0.18 2.57 0.0009 270,943.13 Feb, 05 217,774.47 13,933.24 231,707.71 99.81 444.82 0.19 2.27 0.0009 232,154.80 Mar, 05 217,752.60 30,131.79 247,884.39 99.80 505.27 0.20 3.56 0.0014 248,393.22 Apr, 05 210,593.21 29,148.78 239,741.99 99.81 464.90 0.19 3.33 0.0013 240,210.22 May, 05 225,002.43 31,778.31 256,780.74 99.81 500.46 0.19 5.92 0.0023 257,287.12 Jun, 05 226,932.48 31,146.91 258,079.39 99.81 500.70 0.19 4.56 0.0017 258,584.65 Jul, 05 230,075.49 31,930.27 262,005.76 99.81 500.93 0.19 5.30 0.0020 262,511.99 Aug, 05 228,377.91 32,641.70 261,019.61 99.81 504.43 0.19 6.38 0.0024 261,530.42 Sep, 05 222,238.28 31,708.25 253,946.53 99.81 502.29 0.19 7.21 0.0028 254,456.03 Average 239,094.23 29,052.40 258,462.50 99.81 484.488 0.19 4.12 0.0015 258,915.51
Source: Solid Waste Disposal Division

30
3.5 Other Analysis
3.5.1 Bulk Density
Bulk density of solid waste reported by BMA and from samples collected
seems to share same characteristic. The value ranges from 0.23 – 0.40 kg/L
with an average value of 0.33 Kg/L, slightly lower than that of BMA’s data. The
reason could be that samples collected in this study are taken from waste
collector trucks, while BMA’s samples were taken at transfer stations. The
density of MSW increases markedly as it is first generated in the household and
then finally disposed into landfill.
Table 9 Bulk Density of solid waste.
Year Bulk
Density
(Kg/L)
Sample
No.
Bulk
Density
(Kg/L)
Sample
No.
Bulk
Density
(Kg/L)
1994 0.35 1 0.29 13 0.32
1995 0.35 2 0.33 14 0.23
1996 0.35 3 0.35 15 0.30
1997 0.32 4 0.33 16 0.35
1998 0.42 5 0.28 17 0.36
1999 0.34 6 0.34 18 0.38
2000 0.38 7 0.26 19 0.36
2001 0.34 8 0.35 20 0.28
2002 0.39 9 0.36
2003 0.37 10 0.40
2004 0.39 11 0.39
2005 0.33 12 0.35
The
res
Dat
a fr
om S
econ
dary
Sou
rce
Average 0.36
Dat
a fr
om F
ield
Mea
sure
men
t Dur
ing
Apr
il –
May
200
9
Average 0.33

31
3.5.2 Moisture Content
The transfer of moisture takes place in garbage bins and collector trucks,
and thus the moisture contents of various components changes with time. The
moisture content becomes important when the refused is processed into fuel or
when it is burned.
Table 10 Moisture content of mixed waste at disposal site and at collection
trucks.
Year Moisture
Content
(%)
Sample
No.
Moisture
Content
(%)
Sample
No.
Moisture
Content (%)
1994 48.92 1 61.24 13 54.37
1995 49.71 2 46.78 14 57.08
1996 49.11 3 55.60 15 46.79
1997 55.12 4 48.12 16 51.00
1998 57.00 5 53.50 17 44.36
1999 52.76 6 49.89 18 50.15
2000 60.43 7 48.0 19 47.45
2001 55.62 8 62.31 20 55.63
2002 46.46 9 58.54
2003 44.16 10 53.43
2004 49.98 11 47.87
2005 49.94 12 62.11
Dat
a fr
om S
econ
dary
Sou
rce
Average 51.60
Dat
a fr
om F
ield
Mea
sure
men
t Dur
ing
Apr
il –
May
200
9
Average 49.92

32
3.5.3 Volatile Solids
Volatile solids content is often used as a measure of the biodegradability
of the organic fraction of solid waste, however, it can be misleading as some of
the organic constituents f MSW are highly volatile but low in biodegradability.
Table 11 Average volatile solid contents of waste in BMA.
Year Volatile
Solid
(%)
Sample
No.
Volatile
Solid
(%)
Sample
No.
Volatile
Solid
(%)
1994 33.95 1 31.23 13 43.27
1995 38.89 2 36.00 14 34.48
1996 39.26 3 40.67 15 29.57
1997 34.25 4 33.34 16 31.36
1998 32.57 5 37.58 17 33.28
1999 38.82 6 35.36 18 28.41
2000 33.16 7 35.95 19 32.67
2001 33.74 8 33.26 20 34.63
2002 - 9 31.47
2003 43.61 10 36.62
2004 41.50 11 38.41
2005 43.86 12 40.03
Dat
a fr
om S
econ
dary
Sou
rce
Average 37.60
Dat
a fr
om F
ield
Mea
sure
men
t Dur
ing
Apr
il –
May
200
9
Average 34.88

33
3.5.4 Ash Content
After combustion, the remaining part of solid waste is ash that is needed
to be disposed, thus affect design capacity of landfill. Ash from MSW
combustion also contain hazardous compounds such as metals
Table 12 Ash content of solid waste.
Year Ash
Content
(%)
Sample
No.
Ash
Content
(%)
Sample
No.
Ash
Content
(%)
1994 17.13 1 12.37 13 7.28
1995 11.40 2 8.73 14 8.72
1996 11.63 3 9.25 15 6.25
1997 10.63 4 10.27 16 8.25
1998 10.43 5 8.26 17 10.21
1999 8.42 6 7.15 18 9.22
2000 6.41 7 11.71 19 6.59
2001 10.64 8 10.92 20 8.26
2002 - 9 8.31
2003 12.23 10 9.48
2004 8.52 11 8.29
2005 6.20 12 12.59
Dat
a fr
om S
econ
dary
Sou
rce
Average 12.92
Dat
a fr
om F
ield
Mea
sure
men
t Dur
ing
Apr
il –
May
200
9
Average 9.10
34
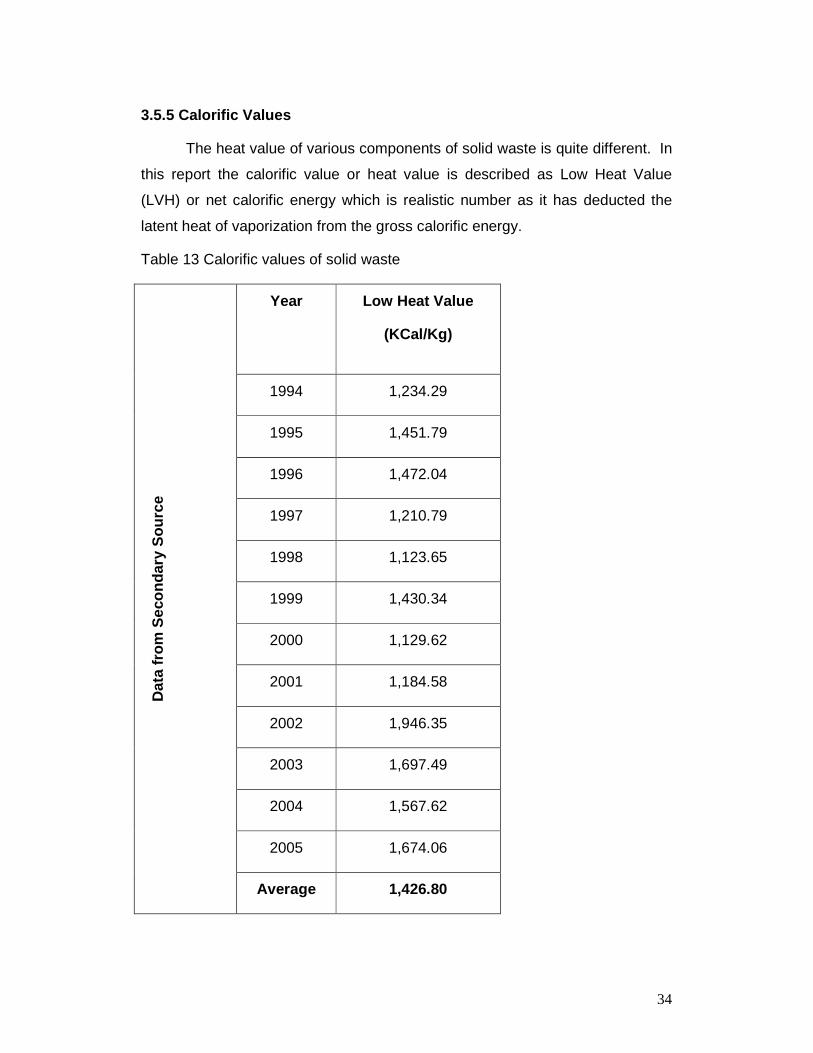
3.5.5 Calorific Values
The heat value of various components of solid waste is quite different. In
this report the calorific value or heat value is described as Low Heat Value
(LVH) or net calorific energy which is realistic number as it has deducted the
latent heat of vaporization from the gross calorific energy.
Table 13 Calorific values of solid waste
Year Low Heat Value
(KCal/Kg)
1994 1,234.29
1995 1,451.79
1996 1,472.04
1997 1,210.79
1998 1,123.65
1999 1,430.34
2000 1,129.62
2001 1,184.58
2002 1,946.35
2003 1,697.49
2004 1,567.62
2005 1,674.06
Dat
a fr
om S
econ
dary
Sou
rce
Average 1,426.80
35
Chapter 4
Projection of Waste Generation
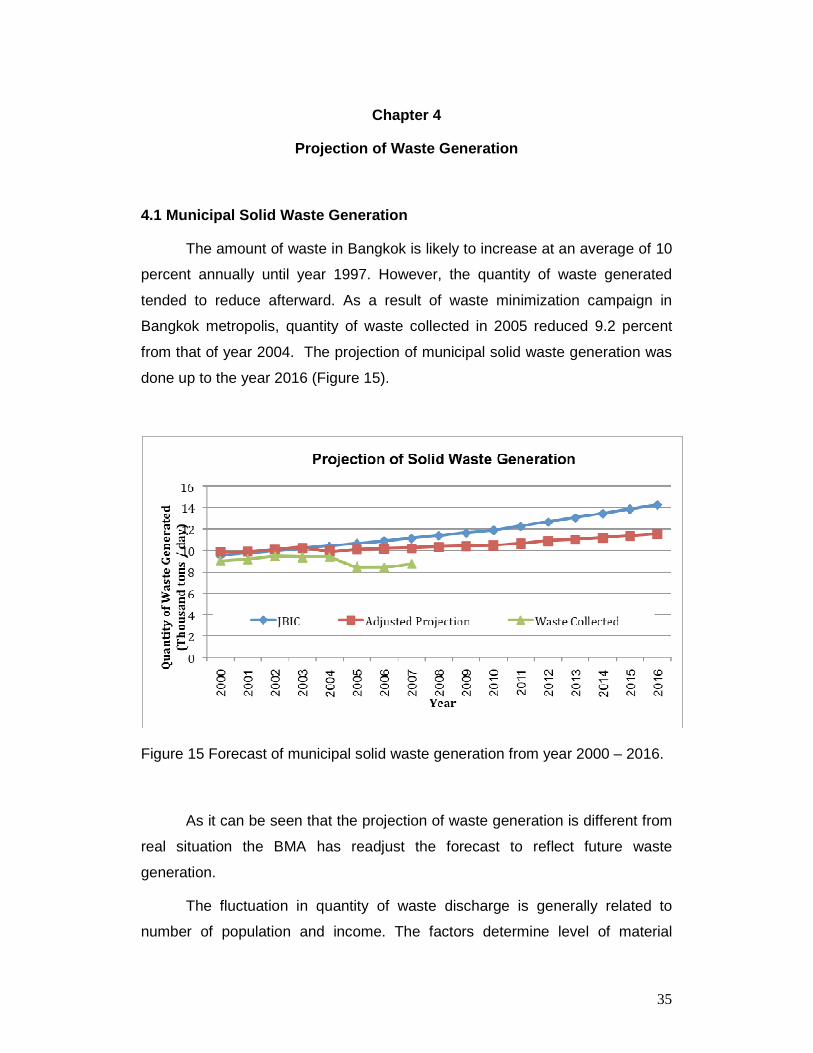
4.1 Municipal Solid Waste Generation
The amount of waste in Bangkok is likely to increase at an average of 10
percent annually until year 1997. However, the quantity of waste generated
tended to reduce afterward. As a result of waste minimization campaign in
Bangkok metropolis, quantity of waste collected in 2005 reduced 9.2 percent
from that of year 2004. The projection of municipal solid waste generation was
done up to the year 2016 (Figure 15).
Figure 15 Forecast of municipal solid waste generation from year 2000 – 2016.
As it can be seen that the projection of waste generation is different from
real situation the BMA has readjust the forecast to reflect future waste
generation.
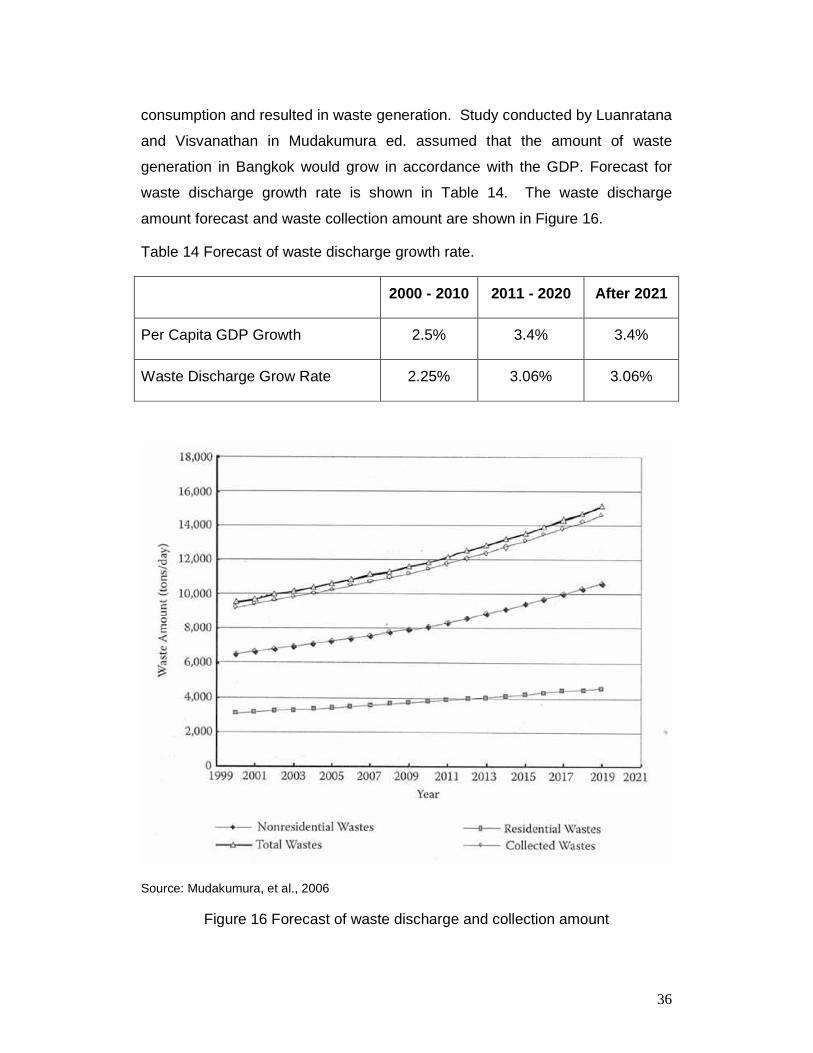
The fluctuation in quantity of waste discharge is generally related to
number of population and income. The factors determine level of material
36
consumption and resulted in waste generation. Study conducted by Luanratana
and Visvanathan in Mudakumura ed. assumed that the amount of waste
generation in Bangkok would grow in accordance with the GDP. Forecast for
waste discharge growth rate is shown in Table 14. The waste discharge
amount forecast and waste collection amount are shown in Figure 16.
Table 14 Forecast of waste discharge growth rate.
2000 - 2010 2011 - 2020 After 2021
Per Capita GDP Growth 2.5% 3.4% 3.4%
Waste Discharge Grow Rate 2.25% 3.06% 3.06%
Source: Mudakumura, et al., 2006
Figure 16 Forecast of waste discharge and collection amount

37
4.2 Waste Property Forecast
Luanratana (2003) has predicted changes in waste composition in wet
based. Trend in physical composition of waste in wet based is shown in Table
15. Waste physical composition forecast until 2019 was done using existing
data together with statistical analysis. Figure 17 show the result of the forecast
of physical composition of waste.
Table 15 Trend of waste composition in wet base (unit: %)
Year Paper Textile Plastic Wood Food Bone
Shell Rubber Metal Glass
Stone
Ceramic
1996 11.3 7.3 19.1 3.0 46.6 0.4 2.4 2.8 6.7 0.5
1997 11.4 6.2 17.4 5.8 51.9 0 0.6 2.3 4.5 0
1998 11.6 3.7 19.8 14.5 43.4 0 0.8 2.0 4.2 0
1999 9.6 11 25.8 7.9 40.9 0 2.2 1.0 1.7 0
2000 13.4 2.9 21.7 2.6 51.8 2.1 0.2 1.8 3.2 0.4
Ave. 11.46 6.22 20.76 6.76 46.9 0.5 1.24 1.98 4.06 0.18

38
Figure 17 Forecast of physical composition (wet base)

39
Chapter 5
Conclusion
The report on quantification and characterization of solid waste in
Bangkok Metropolitan Administration was carried out based on available
secondary data. Various secondary sources were compiled and verified their
accuracy with each other. Primary data, especially in waste property and
composition were collected in order to verify the accuracy of existing data.
Result of waste analysis varies slightly from that of existing data. It could
be influenced by several factors such as seasonal change, economic conditions
and consumption behavior of population. However, the results of both primary
and secondary data do provide good insight of solid waste composition and
quantity of waste generated.
From the study, solid waste of BMA has high organic content and
appropriate for composting process. However, trend in waste composition show
increasing proportion of waste plastics that can be recycled.
Material recovery in Bangkok has increased due to waste reduction
campaign implemented by the BMA. However, the quantity of material
recovered is still low and there is a possibility of increasing such recovery.
Informal sector in material recovery should be promoted and organized. The
recycle activity done by waste collectors during their regular waste collection
should be control to increase efficiency of waste collection process.
The report was done base on current socio-economic situation.
Population growth and economic growth that normally influence waste
generation rate change over time, with economic recession in 2009, waste
generation forecast may not be applicable and readjustment of the forecast may
be necessary.

40
Reference
Bangkok Metropolitan Administration. Bangkok State of The Environment
2002.
Bangkok Metropolitan Administration. Statistical Profile of BMA 2003.
Bangkok Metropolitan Administration. Bangkok State of The Environment
2005.
Bangkok Metropolitan Administration. Bangkok State of The Environment
2006-2007.
Chiemchaisri, C., Juanga, J. P., and C. Visvanathan 2006. Municipal solid
waste management in Thailand and disposal emission inventory.
Environmental Monitoring and Assessment. Doi:10.1007/s10661-007-
9707-1.
Kofoworola, O. F. and S.H. Gheewala. Estimation of construction waste
generation and Management in Thailand. Waste Management,
29(2009)731-738.
Luanratana, W. Cleaner Production Potential at Bangkok Metropolitan
Administration. MS Thesis, Asian Institute of Technology. 2003.
Luanratana, W, and Vivanathan, V. Sustainable waste management: A
case study of Bangkok Metropolitan Authority, In Sustainable
Development Policy and Administration. Edited by Mudakumura G.D.,
Mebratu, D., and Haque, M.S. 2006.
Padungsirikul, P. Sustainable Solid Waste Landfill Management Research
and Development in Thailand.
World Bank. Thailand Environment Monitor 2003.