
Control, Supervision and Operation Diagnostics of Light ...
75
THESIS ON POWER ENGINEERING, ELECTRICAL ENGINEERING, MINING ENGINEERING D23 Control, Supervision and Operation Diagnostics of Light Rail Electric Transport ARGO ROSIN TALLINN 2005
Transcript of Control, Supervision and Operation Diagnostics of Light ...

THESIS ON POWER ENGINEERING,
ELECTRICAL ENGINEERING, MINING ENGINEERING D23
Control, Supervision and Operation Diagnostics of Light Rail Electric
Transport
ARGO ROSIN
TALLINN 2005

Faculty of Power Engineering Department of Electrical Drives and Power Electronics
TALLINN UNIVERSITY OF TECHNOLOGY Dissertation was accepted for the commencement of the degree of Doctor of Technical Science on August 30, 2005 Supervisor: Tõnu Lehtla, Prof., Ph.D., Department of Electrical Drives and Power Electronics, Tallinn University of Technology Opponents: Valeri Vodovozov, Prof., D. Sc., St Petersburg State University of Electrical Engineering, Russia Rysczard Strzelecki, Prof., D. Sc., Gdynia Maritime University, Poland Tõnu Pukspuu, Chairman of Board, Ph. D, SystemTest Ltd., Estonia Commencement: August 30, 2005 Declaration: “Hereby I declare that this doctoral thesis, my original investigation and achievement, submitted for the doctoral degree at Tallinn University of Technology, has not been submitted for any degree or examination.” Argo Rosin, ................................ The thesis (written in Estonian) includes an introduction, 5 chapters, conclusions, references, and appendixes, covering 145 pages. The thesis contains 83 illustrations and 16 tables. References include 101 publications. Copyright Argo Rosin 2005 ISSN ISBN

DISSERTATIONS DEFENDED AT TALLINN UNIVERSITY OF TECHNOLOGY ON
POWER ENGINEERING, ELECTRICAL ENGINEERING, MINING ENGINEERING
1. Jaan Tehver. Boiling on porous surface. 1992. 3. Endel Risthein. Electricity supply of industrial plants. 1993. 4. Tõnu Trump. Some new aspects of digital filtering. 1993. 5. Vello Sarv. Synthesis and design of power converters with reduced
distortions using optimal energy exchange control. 1994. 6. Ivan Klevtsov. Strained condition diagnosis and fatique life prediction for
metals under cyclic temperature oscillations. 1994. 7. Ants Meister. Some phase-sensitive and spectral methods in biomedical
engineering. 1994. 8. Mati Meldorf. Steady-state monitoring of power system. 1995. 9. Jüri-Rivaldo Pastarus. Large cavern stability in the Maardu granite
deposit. 1996. 10. Enn Velmre. Modeling and simulation of bipolar semiconductor devices.
1996. 11. Kalju Meigas. Coherent photodetection with a laser. 1997. 12. Andres Udal. Development of numerical semiconductor device models and
their application in device theory and design. 1998. 13. Kuno Janson. Paralleel- ja järjestikresonantsi parameetrilise vaheldumisega
võrgusageduslik resonantsmuundur ja tema rakendamine. 2001. 14. Jüri Joller. Research and development of energy saving traction drives for
trams. 2001. 15. Ingo Valgma. Geographical information system for oil shale mining -
MGIS. 2002. 16. Raik Jansikene. Research, design and application of magneto-
hydrodynamical (MHD) devices for automation of casting industry. 2003. 17. Oleg Nikitin. Optimization of the room-and-pillar mining technology for
oil-shale mines. 2003. 18. Taivo Kangilaski. Eesti Energia käiduhaldussüsteem. 2004. 19. Viktor Bolgov. Load Current Stabilization and Suppression of Flicker in
AC Arc Furnace Power Supply by Series-Connected Saturable Reactor. 2004.
20. Raine Pajo. Power System Stability Monitoring - an Approach of Electrical Load Modelling. 2004.
21. Nikolai Dorovatovski. Thermographic diagnostics of electrical equipment of Eesti Energia Ltd. 2004.
22. Katrin Erg. Groundwater Ssulphate Content Changes in Estonian Underground Oil Shale Mines. 2005

3
Table of Contents Table of Contents ................................................................................................. 3 Abbreviations ....................................................................................................... 4 Introduction .......................................................................................................... 5 1. State of the Art........................................................................................... 11
1.1. Overview........................................................................................... 11 1.2. Analysis and Classification............................................................... 12
1.2.1. Communication technologies................................................... 12 1.2.2. Onboard systems, devices and functions.................................. 14 1.2.3. Control and diagnostic models................................................. 16 1.2.4. Methods and algorithms ........................................................... 18
1.3. Design, development and integration................................................ 19 2. Analysis of the existing system ................................................................. 23
2.1. Failure influence on the traffic.......................................................... 24 2.2. Faults and failure causes ................................................................... 24 2.3. Availability and effectiveness of repairs........................................... 25 2.4. Problem statement............................................................................. 26
3. Control, supervision and diagnostics system design ................................. 27 3.1. Onboard control and diagnostic system............................................ 31 3.2. Onboard supervision system............................................................. 35
3.2.1. Driver HMI............................................................................... 36 3.2.2. Positioning and passenger information control ........................ 40
3.3. Mobile Diagnostics System .............................................................. 44 4. System evaluation...................................................................................... 49
4.1. Profitability ....................................................................................... 49 4.1.1. Impact of vehicle average speed .............................................. 49 4.1.2. Impact of fault identification speed.......................................... 50 4.1.3. Impact of investments/maintenance costs to the repairs .......... 51
4.2. Designed system analysis ................................................................. 51 5. Future research and development .............................................................. 53
5.1. Regional traffic control and supervision........................................... 53 5.1.1. Real-time passenger information.............................................. 53 5.1.2. Traffic signal priority ............................................................... 54
5.2. Energy management system.............................................................. 54 Conclusion.......................................................................................................... 56 References .......................................................................................................... 58 Abstract .............................................................................................................. 65 Kokkuvõte .......................................................................................................... 66 List of Publications............................................................................................. 67 Intellectual property ........................................................................................... 68 LISA / ANNEX 1............................................................................................... 69
ELULOOKIRJELDUS.............................................................................. 69 CURRICULUM VITAE............................................................................ 72

4
Abbreviations BPC – onboard personal computer DAB – Digital Audio Broadcasting DB – database DVB – Digital Video Broadcasting GDB – ground database GSM – Global System for Mobile communications HMI – human machine interface ODS – onboard diagnostic system PIS – passenger information system PLC – programmable logic controller PU – processing unit SC – security camera UI – user interface UMTS – Universal Mobile Telecommunications System VDB – vehicle database WLAN – Wireless Local Area Network GPRS – General Packet Radio Service WMAN – Wireless Metropolitan Area Networks UIC – Union Internationale des Chemins de Fer ROSIN – Railway Open System Interconnection Network ATC – Advanced Train Control System ARE – Advanced Railroad Electronics System ITC – Incremental Train Control System PTC – Positive Train Control System TGV – Train a grande vitesse ICE – InterCity Express System PTS – Positive Train Separation System ETCS – European Train Control System TCN – Train Communication Network GUI – Graphical User Interface

5
Introduction Rail vehicles computer-based systems date back to the beginning of the 1980s. Initially, these were used for emergency supervision (“black-box”) function on the rail vehicles. Today the computer-based systems are used for train control, monitoring, diagnostics, supervision, traffic control and passenger information. The main functions of computer-based control and diagnostics systems in the electric rail transport area are:
1. technical system supervision and diagnostics of a vehicle (including archiving and reporting) etc
2. data communication with traffic control centers, databases, traffic data archiving and comparison with reference data etc
3. passenger information, like advertising, information of stops, other functions to increase passenger comfort
Today large systems, including transport systems, are communication-based. The traditional radio communication (voice communication) does not satisfy all the demands. The number of monitored and supervised devices/systems and traffic loads has grown tenth times. Also, demands for operative control and management of public transport are higher. Use of data communication networks in vehicle onboard systems provides more flexibility (universality) and modularity, including better maintenance, service and reliability. In addition, they reduce the amount of wires and cables. Onboard control systems, actuators and sensors are traditionally distributed, which are connected over different data communication networks and are able to exchange and transmit large amount of data. Data communication systems provide flexible, inexpensive and easier expansion (openness) of control systems. Technology development, moral and physical aging, increased human quality of life and higher needs (incl. technology) mean needs for modernization and development of periodical technical systems. Modernization of network-based systems is flexible and easier than on the traditional signal circuits. Traffic density, amount of devices/subsystems and needs for operative traffic control and management have increased. Main problems of communication-based systems are multiplicity of different communication protocols, interfaces, standards; arising from the integration of the sophisticated systems and devices, especially in the urban public transport. To solve these problems, sometimes large investments are required for soft- and hardware, personal training etc. For the same reason, system reconfiguration, reprogramming, reconstruction etc. are time consuming. The progress of technology requires harmonization of standards and new manufacturer-independent standard development. An example of harmonization

6
is the standard for train control network, to provide higher reliability and safety in the transport systems. The main purpose of that standard is to provide systems/devices compatibility and independence of the manufacturer. The main reason of standardization activity in this field is the fast development of international transport control systems and integratibility of the rolling stocks of different countries. To assure flexibility and openness, it is important to use standardized modern bus systems, which are a basis for the development and design of efficient remote control and diagnostic systems. The use of remote control systems has grown in the fields like transport, power engineering, environment technologies and other mobile applications. Typical applications are public transport, traffic control, traffic statistics, meteorological data measurement and analysis etc.
VEHICLE BUS
TRAIN BUS
WLAN MDCN RCN
LAN
RCN
VOICECOMMUNICATION
VOICECOMMUNICATIONVOICE COMMUNICATION
VOICE COMMUNICATION
DEPOT
WAYSIDE
ONBOARD
BEFORE TODAY
Figure 1 Communication systems in the light rail vehicles
Today we have the basic data communication network standards for different levels of rolling stock. The demands for the reliability of bus systems are higher in transport than in industry. However, some of the data communication systems used in industry correspond to transportation standards and these systems are sometimes more flexible and open in terms of integration, remote control and diagnostics. Actuality of the problem Active and long-term standardization that continues (IEEE Std P-1482, Standard for Rail Vehicle Monitoring and Diagnostics Systems) in the field of rail vehicles control and diagnostic systems proves the actuality and complexity of the theme of the thesis. Also, active research and development work in the field of intelligent transport control, supervision and diagnostics systems, including the EU research and development Framework Programmes in the field of Surface Transport. Actuality and complexity of the subject field is confirmed also by the long-term (over 7 years) standardization work in the vehicle monitoring and diagnostics area (IEEE Std P-1482 Standard for Rail Vehicle

7
Monitoring and Diagnostics Systems). There is currently no consensus standard specifying monitoring and diagnostics systems for rail transit. Each order of new vehicles or overhaul of old vehicles requires engineering by all parties to determine which information to monitor, what to capture, how often to sample and how long to preserve the information. The standard defines a hierarchy of levels at which monitoring and diagnostics may take place, ranging from component level, through the car and train level, all the way to the full transit system level where information is transmitted to a central control location [MCG98]. The main reasons of increased research and technology development work in the field of intelligent control and diagnostics systems of rail transport are:
• finances of the European 6th and 7th Framework Programmes, for example, in such areas, as “Low cost power-integrated advanced hybrid configurations”, “Efficient rail traction and sustainable energy supply” etc.
• decreasing amount of mineral and natural resources, increase in the price of mineral and natural resources, energy saving.
Existing systems do not satisfy the needs neither do they correspond to those of modern technology. For example, in urban public transport telematics and remote control systems are not sufficiently used. Telematics and remote control systems can significantly reduce maintenance costs and traffic jams, increase service quality, perform remote diagnostics, increase average speed, improve traffic management. Disadvantages of the existing public transport control and diagnostics systems:
1. Sophisticated and time-consuming reconfiguration and programming of passenger information systems. The memory card based reconfiguration and programming is widely used. Low hard- and software flexibility and openness (which means low variety of design and control modes).
2. Too many control panels for a driver (mostly 3...4 displays and panels from which two are actively used).
3. No automatic display of security camera picture in stops to increase traffic and passenger safety. In most cases, a camera picture displayed (always) reduces safety.
4. Limited flexibility and integration possibilities of different onboard, wayside and central level systems and subsystems.
5. Absence or limitation of communication links (incl. broadband communication network) up to the local and regional traffic control level.

8
6. Not enough possibilities of environment data and auxiliary devices or circuit lifetime data analysis, which means poor efficiency of the preventive and condition based maintenance.
Use of wireless data communication networks (for dispatching, service, diagnostics, maintenance, configuration, programming) increases system flexibility, service and maintenance efficiency. Systems with modern digital communication networks, flexible modularized structure is more efficient, have higher safety and reliability, offer more comfort for passengers. This means that more functions are integrated in the system with fewer expenses on the hard- and software; it is easier and cheaper to expand the system; less wires, space and weight. The main aims of the doctoral research are the reliability analyses of a trams onboard systems, development of methods for the design of control, supervision and diagnostics systems and application of these systems on the pilot tram. To achieve these goals, it is required to study and analyze existing systems, methods, and algorithms; to develop and design new technical solutions. The main research tasks of the thesis are as follows:
1. research and analysis of the efficiency of the reliability, service and maintenance system
2. classification and influence of faults and failures (for example, repairs per tram, repairs per kilometer etc.)
3. research and analysis of existing control and diagnostics systems of rail vehicles (including control systems, devices, classification of processes by functionality). Also, fault identification, data transfer and possibilities of the analysis of automation of fault elimination and system development and design
4. composing of the initial task for new control and diagnostics system development and design (including the data flow diagrams)
5. development and design of control, supervision and diagnostic models, algorithms to increase the maintenance (preventive and condition based) efficiency and passenger comfort.
6. description of research fields of public rail transport perspective (including traffic control and energy management systems.
Scientific novelty It involves the following:
1. reliability of analyzed trams and fault/failures/repair impact on traffic 2. analysis of the suitability of the existing control and diagnostic models
and algorithms

9
3. reliability and expert knowledge based methods for control, supervision and diagnostics system development and design
4. developed control, supervision, diagnostic models and algorithms to increase the passenger comfort, safety, security (including the efficiency of fault identification)
5. proved economic effect of the used methods Practical significance The first cooperation project of trams in Tallinn was started in 1997. The main reason to start this project was a poor technical condition of electrical equipment on trams. The project was started by measuring tram drive load and efficiency in the real traffic conditions. During the second stage, a new intelligent traction drive, economically feasible for Tallinn trams was developed (in 2000). Today about 30 trams are equipped with the new traction drive. The new traction drive system reduces about 50% of energy consumption as compared to the old system. A year later, in the third stage, an auxiliary power supply development and design project has started. Approximately 10 trams have the new auxiliary power supply system. During the fourth stage (in 2004), an intelligent control, supervision and diagnostics system was developed and tested in the real traffic. The main practical results are as follows:
1. development and design of the tram control, supervision and diagnostics system for a pilot tram, based on an original solution
2. methods of composed control, supervision and diagnostics system developed reduce system development costs up to 20%
3. methods of supervision and diagnostics developed reduce up to 30% fault/failure localization costs
4. the flexible, open and modular structure reduces the costs of system expansion and integration (with prospective systems)
5. the pilot tram designed and tested 6. one patent application and one industrial design, registered in the Estonian
Patent Office. Dissemination of results and publication
1. The author has over 19 scientific publications from which four are referred in the INSPEC database and published in the prereviewed international conference collections.
2. The developed and designed system has been reported at the international exhibitions. The solution designed has attracted attention by international companies, like Ganz Transelektro Traction Electrics Ltd., Bombardier Transportation and Alstom Belgium S.A. (at the 11th International Power Electronics and Motion Control Conference and Exhibition).
3. At the beginning of 2005, negotiations started at the Tallinn University of Technology with the representatives of Ukraine Ministry of Education and

10
Science (V. Radchenko) concerning the acquired knowledge and technology transfer to Ukraine. Also, the pilot tram was presented in the Tallinn Tram and Trolleybus Company Ltd.
4. The developed and designed solutions have been presented in Poland, Latvia, Lithuania, Russia, and other former Soviet countries.
5. At the beginning of 2005 active cooperation with the Tallinn City Government Transport Department started within the EU 6th and 7th Framework Programmes, for example, in such areas as “Low cost power-integrated advanced hybrid configurations”, “Efficient rail traction and sustainable energy supply” etc.
Acknowledgements The present activities in the field of electric public transport have attracted attention in Estonia and in other countries. These include:
1. Estonian Association of Transport and Roads nominated the thesis author as candidate to the title of “Engineer of the Year for 2004”.
2. In 2001, the author received a grant by the Development Foundation of TUT for his research and development work. In the same year the first prize of the student research by the Estonian Academy of Sciences was awarded to Reivo Kruus (Tallinn Technical University, thesis completed at Kempten College) Bachelor’s thesis “Process control and visualisation over the Internet” (in English; supervisor Argo Rosin (TTU) and advisor Professor J. Steinbrunn (Kempten)).

11
1. State of the Art
1.1. Overview The first rail vehicles in the world were inter-city trains. The first city vehicle was a horse-tram; the first one appeared in New York in 1832. In Tallinn, Estonia, the first horse-tram line was opened on 24 August 1888. The first tram with a steam power drive was taken to use on 22 September 1915. The first petrol engine tram started in Tallinn in 1921. Electrification and industry progress brought to the streets trams, the first electric vehicles for city passenger transport. The first electric trams in the world were used already on the second half of the 19th century. In Estonia the first trams appeared in the streets in Tallinn on 28 October 1925.
Table 1.1 Generations of control systems
Generation System Devices I Electromechanica
l Contactors, relays, signalling devices and indicators, contact-controllers, motors, heating devices, lighting etc.
II Electronics, Analog-communication
Contactless sensors, semiconductor based switching devices, semiconductor converters, semiconductor control devices, voice communication, radio communication, heating and ventilation, lighting etc.
III Microprocessor, Digital-communication, Computers, information technology
Programmable logic controller, traction control, traction converters, converters, controllers, onboard communication networks CAN, LON etc.), information displays, cameras, ticket devices, counting and passage, broadband communication networks (Ethernet, WLAN), wide area mobile communication networks (GSM, GPRS), positioning, databases, energy management etc.
Fast progress in the electronics (microelectronics and power electronics) industry in the second half of the 20th century brought about the development of intelligent control and diagnostics systems. The use of intelligent systems provides better comfort, safety and security for passengers, improves the reliability. Historically, three control systems generations in the rail vehicle systems can be distinguished (Table 1.1).

12
1.2. Analysis and Classification
1.2.1. Communication technologies All market studies indicate that telematics systems have a promising future and should be economically beneficial [ZHA02]. The main purposes of using modern communication technologies in the vehicle telematics systems were [KOO02, SWA04, SAF94, LAR02, UMT00]:
• greater safety and security for passengers and operators • greater operational efficiency to maintain optimal service levels and
obtain best use of expensive assets • enabling priority based public transport traffic control and decreasing
the traffic delays • reducing the human error influence
Table 1.2 Comparison of wireless communication systems
System Max. expected data rate, kbit/s
Communication range Perspective
DVB 16000 Depending on the radio station Middle DAB 1500 Depending on the radio station Low GSM 9,6 Depending on the service provider Low GPRS 171 Depending on the service provider Middle UMTS 2000 Depending on the service provider High Bluetooth (802.15)
721 < 100 m Low
WLAN (802.11b)
54000 < 1 km (depending on access points density)
Middle
WMAN (802.16)
155000 < 100 km (depending on access points density)
High
Most widely spread wireless communication technologies in the world are GSM-based data communication in the vehicle telematics applications [CAM02, TRA99] and for vehicle positioning system is GPS [CHO98, ZHA02] (Table 1.2). Still, the broadband communication technology [HED04, LIU03, FAB00] is more often used for wireless telematics applications (also for onboard applications). Field buses like Controller Area Network (CAN) have been utilized in the automotive environment as a substitute for the large and expensive wiring to connect the onboard auxiliary devices [KRI98] (Table 1.3). Today the time triggered CAN (TTCAN) has merits to be quite inexpensive and reliable [BER04]. The LonWorks as LON is widely used on rail transit projects throughout the world. The IEEE1473 standard specifies both, the TCN and

13
LonWorks. Today in the small vehicles incl. tram are used CAN and in the train LonWorks.
Table 1.3 Comparison of field buses
Characteristics CAN LON INTERBUS Max. node amount
Undetermined, depending of manufacturer
32385, 127 network section
512 slaves, 1 master
Max. bus length 1 km (50kbit/s) 40 m (1.5 Mbit/s)
2 km (78kbit/s) TP 6.1 km (5.48 kbit/s) opt.
13 km (widebus) 100 km (opt.)
Bus Medium Shielded twisted pair, power circuit, fiber optic
Twisted pair, radio, IR, power circuit, fiber optic
5-wire (TP), fiber optic, IR
Interface RS485 RS485 RS485 Transfer speed 20kbit/s...1
...(1.5) Mbit/s 600 bit/s...1.25Mbit/s 500 bit/s...2Mbit/s
Cycle (8 nodes, 4 byte)
ca 1.3 ms ca 70 ms ca 1...3 ms
Structure Decentral Decentral Central Reliability HD=6 HD=4 HD=4 Companies/ Organizations
CiA, SAE Autoindustrie, OSEK, LAV, over 1000 manufacturer
Echelon, USA Gesytec, D, LNO, LUI
Fa. Phoenix Contact INTERBUS.Club, DRIVECOM, ENCOM
Price (per Unit) ca 200 EEK ca 320... EEK Master 160... EEK Slave 160...EEK
International Train Traffic and automatic coupling of the electronic equipment of the train vehicles through a data bus were some reasons for a worldwide standardization of onboard data communication. Deputies from over 20 countries worked for several years on the definition of train communication standards. Today according to IEC 61375 regulations the TCN is constituted by local network based on a hierarchical architecture with two buses Wire Train Bus and Multifunction Vehicle Bus. First one runs all over the train allowing the interconnection of various nodes, capable of transmitting and receiving information related to controls, messages and states among various devices, which are onboard of the vehicles forming the train. The second one is bordered inside a vehicle and is responsible for data transfer to and from each electronic or electromechanical device connected to bus from that vehicle [KOO01 KOO02, IEE992, SUL03, KIR01, ROS97, TRA99] (Table 1.4).

14
Table 1.4 Basic classification of rail vehicle networks
Characteristics Train Bus Vehicle Bus Topography, configuration
>860 m, connectable in the field
<300 m, fixed, pre-connected
Symmetry Right/left, front/rear No orientation Addressing, configuration
Relative, depends on composition, configuration at each composition change
Absolute (physical or logical), configuration at installation time
Number of stations <32, 1(2) per vehicle <256 per vehicle Data rate 1 Mb/s 1.5Mb/s Medium Twisted wire pair, UIC data
cable Twisted wire pair, optical fibres
Medium access Cyclic (25ms) and sporadic Cyclic (1ms) and sporadic Link Protocol Source-addressed broadcast
and datagrams Source-addressed broadcast and datagrams
Complexity High, due to inauguration Low
1.2.2. Onboard systems, devices and functions The functional classification of a trains onboard devices can be found in many publication, the most exhaustive classification is described by P. Koopman in his publication [KOO02]. The functional classification for other rail vehicles like metro vehicles, light rail, trams etc. is not available. The main research work is targeted to train transport [LIU03, NIE99, NIE00, HÖR99, WEG00]. Generally, all the rail vehicles and their devices are similar and have almost the same functionality (Table 1.5). The train systems must determine the geographic location of locomotives, trains, track units, and track forces with a reasonable accuracy. The system must also be capable of accurately distinguishing the parallel tracks and determining the direction of train movement. The system must detect defective equipment such as a hot box or dragging equipment, a slide condition or a broken rail condition. The system should provide self-diagnostics to ensure that key parameters are available and they are properly functioning. The system must also monitor the following parameters: speed of train, acceleration and deceleration rate, throttle position, dynamic brake setting, brake pipe pressure, emergency brake application, wheel slip, fuel level, and locomotive health monitoring. The communications system configurations should be flexible and expandable. The systems must provide both voice communications and data communications. The system should be able to receive, store, process, and disseminate information to the subsystems and to provide the dispatcher and the locomotive engineer with the information needed both for manual and automatic control actions. The onboard computer stores a database of signal indications, track curvature, gradients, mileposts, speed limits, speed restrictions, and the locations of all devices that need to communicate information to the train [ACH98].

15
Table 1.5 Classification of onboard devices by the functionality
Pos. Devices Train Metro Tram 1. Doors � � � 2. Traction � � � 3. Braking and antiskid � � � 4. Automatic train control � � � 5. Signalling, localization � � � 6. Radio and other communication � � � 7. Driver HMI, user interface � � � 8. Energy (electric, pneumatic, hydraulic) � � � 9. Diagnostics (online, offline, depot) � � � 10. Log, archiving and registration � � � 11. Fire (signalling and douse) � � � 12. Anti-icing � � � 13. Tilting � � � 14. Suspension � � � 15. Lights, other � � � 16. Heating, ventilation, cooling � � � 17. Passenger information (visual, audio,
entertainment, advertisement) � � �
18. Toilet � � � 19. Reservation (seat) � � � 20. Ticket � � � � - yes, � - no The following positioning methods are used in different countries throughout the world: external signal methods, such as Global Positioning System (GPS), LORAN-C, Omega, Geostar (commercial satellite positioning system); wayside or track-based methods, such as transponders and track circuits; and self-contained methods such as an odometer dead reckoning, and inertial navigation system (INS) [ACH98].
CENTRAL CONTROL WAYSIDE ON-BOARD
ERTMS/ETCS
Saf
e T
rans
mis
sion
Uni
t (S
TU
)
Rad
io B
lock
Cen
tre
(RB
C)
Dis
patc
her
Man
-mac
hine
Inte
rfac
e
Ser
vice
Man
-mac
hine
Inte
rfac
e
Eur
obal
ise
Tra
ditio
nal I
nter
lock
ing
Tec
hnol
ogy
Onb
oard
Com
pute
r (E
VC
)
Bal
ise
Ant
enna
(C
AU
and
BT
M)
Opt
ical
Pul
se G
ener
ator
(O
PG
),S
peed
and
Dis
tanc
e U
nit (
SD
U)
Dig
ital I
nput
/ O
utpu
t (D
X)
Onb
oard
Saf
e T
rans
mis
sion
Uni
t(S
TU
trai
nbor
ne)
GS
M-R
Veh
icle
Ant
enna
(R
AU
)
Equ
ipm
ent i
n th
e D
river
’s C
ab(D
river
MM
I)
Figure 1.1 ERTMS/ETCS structure

16
The European Union (EU) has been advancing a project relating to the provision of a high-speed railway network with the objective of resolving the major technical operating problem of overcoming the present multiplicity of signalling and train control systems. It wishes to resolve the major obstacles to interoperability for the various national railways among the European countries. In 1991, nine major European companies of the signalling industry reached an agreement with the EU to pursue a joint development of a new train control system, ETCS and later ERTMS (European Rail Traffic Management System/European Train Control System), which will have capability of functioning in combination with all the existing tracks and wayside equipment of train protection and train control systems [ACH98, THI00, JAN98] (Figure 1.1). An analogical system in North America is ATCS (Advanced Train Control System), precisely described by the D. C. Coll and A. U. H. Sheikh [SHE90, COL90].
1.2.3. Control and diagnostic models Statistics shows that operational faults occur most often (70%) among all kind of faults. About 80 % downtime is spent locating its source and 20% spent on the repair [WHU99]. With a condition based maintenance (CBM) system well implemented, a company can save as much as 20 % in decreased stock in spare parts, decreased loss in production, decreased loss in quality flaws etc. [BEN02, YAN05]. The main objectives of passenger vehicle control and diagnostics systems are to prevent traffic jams, reduce service and maintenance costs, increase safety and security, and increase the passenger comfort. These objectives can be achieved by condition based maintenance, efficient preventive maintenance, reconstruction and development of new systems, methods and algorithms, which are flexible for expansions, enable failures and fault identification and localization in an early stage. The early indication of failures can help to avoid major breakdowns and catastrophes that could otherwise result in substantial material damage and human injuries [SEN99]. Control systems are divided into three levels: execution level, coordination level and management and organization level [ULI95]. Intelligent control systems include all of these levels. Execution level, the level of lowest intelligence and highest precision contains the sequences of action needed to manipulate the system. Coordination level represents the interface between the high level of intelligence, consisting of supervision with alarming and automatic protection, fault diagnosis, redundancy actions or reconfiguration. The management level, the level of highest intelligence and lowest precision, where large amounts of domain knowledge are required to reason, plan and make decision about the organization of a task.

17
The different levels have different needs, which is main reason why one certain method cannot be used. The intelligent systems are hybrid systems, which have different levels, technologies and methods. For example, according to OSA-CBM standard (Open System Architecture for Condition-Based Maintenance), the condition based maintenance system includes seven levels: sensor module, signal processing, condition monitoring, health assessment, prognostics, decision-making support, presentation [DJU03]. For condition monitoring or assessment, hybrid (combined) technics of fault identification and diagnostics [ZHA93, MCD95, GON98] are mainly used. Safety and reliability are generally achieved by a combination of fault avoidance, fault removal, fault tolerance, fault detection and diagnosis, automatic supervision and protection [ISE02]. The main tasks of diagnostics systems are fault localization, cause identification and prognosis [TOG96]. Generally, diagnostics systems and functions classified are as follows [FEN01, MCG01, PRO99]:
1. Rule-based (represent the experience of skilled diagnosticians, generally in the form of IF THEN rules)
2. Model-based, including fault models, causal models, structural and behavioral models, diagnostic inference models (approximate presentation of the real system, involves model use to predict faults by observations and information from real system), structured hypothesis tests [NYB99]
3. Machine learning, including case-based reasoning, explanation based learning, learning knowledge from data (approaches exploit knowledge of previous successful or failed diagnoses to continually improve system performance, or use available domain data to automatically generate knowledge)
4. Artificial Intelligence, including neural network (can be considered as weighted directed graphs), fuzzy logic (provides mechanisms to represent and manipulate linguistic concepts)
5. Hybrid According to standards VDI/VDE Richtlinie 3541, 3542, 3691 and published research materials, most frequently used keywords in the field of supervision, monitoring, fault detection and diagnostics can be presented as shown in Table 1.6 [ISE97].
Table 1.6 Fault detection and diagnostics terminology
States and signals Functions Models Property Fault, failure, malfunction, error, disturbance, perturbation, symptom
Fault detection, fault isolation, fault identification, fault diagnosis, monitoring, supervision, protection, correction, interlocking
Quantitative model, qualitative model, diagnostic model, analytical redundancy
Reliability, safety, availability, maintainability,

18
1.2.4. Methods and algorithms Based on fault signal incipience analysis four main diagnostic methods can be defined: signal-based, analytical model-based, case-based [DUM98] and knowledge-based methods [XIA88, SZC97]. In the intelligent expert systems, between the different control and diagnostic systems levels, the qualitative and quantitative model based methods are tightly intertwined [ULI95]. R. Isermann distinguishes fault detection and diagnostic methods as shown [ISE97] in Figure 1.2. The knowledge-based fault diagnosis includes analytical knowledge and heuristical knowledge [ISE93, REI91]. B. Fenton describes three broad classes of knowledge, which are applied to diagnosis: heuristic, fundamental and historical. Heuristic knowledge employs rules and/or procedures, which relate symptoms to faults, often with associated certainty values or probabilities (for example, IF THEN rules). Fundamental knowledge uses underlying physics of the device to reason from the first principles (Model-Based reasoning). Historical knowledge employs data or experiences recorded during previous diagnostic session to perform new diagnoses (case-based reasoning) [FEN01].
Fault detection and diagnosis methods
Model-based fault-detection methods Fault diagnosis methods
Sta
te a
nd o
utpu
t obs
erve
rs
Par
ity e
quat
ions
Iden
tific
atio
n an
d pa
ram
eter
estim
atio
n
Processmodel based
methods
Signal modelbased
methods
Ban
dbas
s fil
ters
Spe
ctra
l ana
lysi
s
Max
imum
ent
ropy
est
imat
ion
Changedetectionmethods
Mea
n an
d va
rianc
e es
timat
ion
Like
hood
-rat
io-t
est,
Bay
es d
ecis
ion
Run
-sum
test
,tw
o pr
obe
t-tes
tClassification
methodsApproximate
reasoning methodsG
eom
etric
al d
ista
nce
and
prob
abili
stic
met
hods
Art
ifici
al n
eura
l net
wor
ks
Fuzz
y cl
uste
ring
Pro
babi
listic
reas
onin
g
Pos
sibi
listic
reas
onin
g w
ithfu
zzy
logi
cR
easo
ning
wit
artif
icia
l neu
ral
netw
orks
Hyp
othe
sis
test
ing
Figure 1.2 Classification of fault detection and diagnostic methods
Analytical knowledge consists of analytical process models based on the theoretical (physical) models, parameters and variable estimation methods, normal process behavior, fault statistic, train of events and process. Heuristic knowledge relies on the fault-trees (event and faults relation), process flow and faults statistic. R. Isermann distinguishes model-based fault detection methods as follow: process models and fault modeling, parameter estimation [ISE93], observers incl. state observers and output observers, parity equations and signal model based. He divides diagnostics methods generally into classification methods and inference methods [ISE04]. Diagnostics algorithms are classified in the three basic groups: quantitative model-based, qualitative model-based and process history based algorithms [VEN02, KAV02, REN02, PRI89] (Figure 1.3).

19
Complex diagnostics systems, depending the hierarchy and architecture, include always realtime, online and offline diagnostics [FOX91, SKO95, GRE92]. Depending on hierarchy, to achieve the optimality and quality of diagnostic algorithms, it is most useful to apply combined/hybrid diagnostic methods. Realtime and online systems monitor the process, obtaining sensor data. A crucial aspect of realtime systems, and one that distinguishes them from online systems is the time criticality of data analysis (reaction time 1µs...0.5s). Online diagnostics is used mainly in supervision systems [CON96, DEU03]. In this case reaction, data transfer time is over 0,5 s. A diagnostic system is considered offline when analyzing a system that is not connected to, obtaining its information from the operator and/or data files.
QuantitativeModel-Based Qualitative Model-Based
Obs
erve
rs
Par
ity S
pace
EK
F (K
alm
an F
ilter
s)
CausalModel
AbstractionHierarchy
Dig
raph
s
Faul
t Tre
es
Qua
litat
ive
Phy
sics
Stru
ctur
al
Func
tiona
l
Process History Based
Qualitative Quantitative
Exp
ert S
yste
ms
Tren
d A
naly
sis
Sta
tistic
al
Neu
ral N
etw
orks
Prin
cipa
l Com
pone
nt A
naly
sis/
Par
tial L
east
Squ
ares
Sta
tistic
al C
lass
ifier
s
Figure 1.3 Classification of diagnostic algorithms
An intelligent train/tram diagnostic system integrates all diagnostics levels. In the model-based systems, the failure or faults detection speed and efficiency depends on the accuracy of the model (fault-tree, events description etc.). The efficient and intelligent diagnostics system design and integration with other systems depends on using the methods in different design phases.
1.3. Design, development and integration The main objective in the new system development and design is solving of integration problems. Automotive systems are mechatronic systems that are characterized by integration of components (hardware) and signal-based functions (software), resulting in autonomous functionality [ISE02]. One of the features of the state-

20
of-the art control and supervision systems is a growing degree of functional and hardware integration. Ongoing integration of computer systems goes hand in hand with significant decentralization and distributed operation of technical systems for control and supervision. Integration requires the use of a multi-network architecture with many connected and cooperating ancillary computer networks [AUG02]. The system design process is a combination of sub-processes like design exploration and systems integration [IWA00]. In the first sub-process, the designer clarifies objectives, identifies problems, assesses situation, decomposes problems and searches for possible solutions. In the second sub-process, the designer integrates subsystems into one whole system, considering systems hierarchy and roles of subsystems. E. G. Nilsson splits system integration into four main areas, each addressing one aspect of integration which may be addressed independently of the other: integration technology, integration architecture, semantic integration, user integration [NIL90]. The first part addresses the implemented mechanisms that allow the transfer of data between systems and mechanisms for initiating actions in other systems. These mechanisms are necessary to achieve successful systems integration, but do not automatically imply it. The second part focuses on how system design influences the possibility to achieve easy and safe sharing of data and functionality between systems. New types of architecture are necessary to successfully develop integrated systems. The third part addresses the semantic content of data in different systems. It is important to be aware of the semantic inconsistencies, especially with systems from different vendors. The fourth part focuses on the systems from the end user point of view. In new systems design and development the main objectives are the integration of problem solving, where the main tasks are machine-machine integration problem solving. Machine-machine integration includes the following design and development problems and tasks: hardware-hardware, hardware-software, software-software compatibility and integration. Additionally, machine-human integration problems must be taken into consideration, which influence safety, security and reliability of the systems. The influence of human factors in human-machine interface design is a highly complex process; people differ dramatically in intelligence, aptitude, culture and physical characteristic. In passenger vehicles, passenger safety depends directly on the human factor (driver). Good onboard graphical user interfaces (GUI) design involves determining end user needs, testing for simple and effective usability, focusing on functionality, concentrating on display consistency, ensuring ease of use, using color effectively, using colors with ideal contrast ratios, balancing the visual harmony of the display, making sure the text is readable. The best operator interfaces incorporate human-related factors into their programs [HAL02]. System integration often requires the development of unique hard- and software solutions or applications [BRU99]. In many cases the question is how to design control systems for small local networks that can only operate effectively if the costs for initial installation, operation and maintenance of the system are low. A

21
promising approach is to distribute the tasks of vehicle/train control, protection and interlocking over a network of cooperating components using the standard communication facilities offered by mobile telephone providers [HAX99, HAX00]. Disadvantages of standard solution are dependence of networks providers on the time critical situations (for example, network overload). The minimizing of expenses does not provide the optimality, incl. reliability, security and safety. Broadband communication technologies will enable the integration of large amounts of new control data together with many new information services, including more efficient control with closer links to onboard equipment, better maintenance by collecting large amounts of sensing data to ground systems, more and better information services for crews and passengers by linking vehicle control and ground systems [ISH04]. The fast development of wireless data communication technologies is a basis for the fast development of telediagnosis and teleservice systems design in the next years. One of such systems is described by R. Isermann [WOL02], where he states that progress in the component level of supervised processes can be provided by remote control and diagnostics. In such systems it is most important to integrate supervision systems, component level and other systems over wired or wireless wide area communication network. It is very important to analyze telediagnosis and –service applications and problems in the transport sector, to reduce maintenance costs, increase safety and passenger comfort. K. T. Seow describes three main behavioral components on the systems design and integration process of passenger land-transport systems: initiator, vehicle, and traveler. His design methodology consists of the following steps: Problem Description, Modeling the Passenger Land-Transport Systems and Behavioral Specifications, Supervisor and Control Law Synthesis and Supervisor and Control Law Simulation [SEO04, YOO01]. T. C. Hartrum and J. C. Nonnweiler describe software systems integration methodology using formal specifications. Model integration methodology is divided into two stages: integration analysis and integration phase [HAR01]. Integration analysis consists of input model selection, communication pattern identification and communication pattern analysis. Integration phase contains value conversions and state-based trigger strategies. State-based trigger strategies have four types of control: counter-based, event-based, value based, user-based strategies. Integration phase includes input model checking, fault elimination, integration model creation, structural components creation, functional and dynamic components creation. The first tasks in the system integration are identification and description of system structure, hierarchy and functional layers [XIA88]. I. P. Burdon describes in-depth one light-rail project objectives, tasks, systems and management phases. The management of project quality is controlled most effectively through the use of project quality plan. The main activities that the project quality plan defines are obligations (what), schedules (when), methods (how), finance (costs), contracts (rules) and responsibilities (who) [BUR96].

22
Still, the main tasks of diagnostics systems are fault detection and isolation [POM90], which includes identification of fault type, range, difficulty, location and time [ISE97]. Desirable characteristics of fault diagnostic system are detection and diagnosis speed, isolability, robustness, novelty identifiability, classification error estimate, adaptability, explanation facility, modeling requirements, storage and computational requirements and multiple fault identifiability [VEN02]. The main problems and tasks in the system design phase are modelling, strategies and methodology. Diagnostic task can generally be divided to on- and offboard diagnostics [BID99]. The supervision of complex systems is basically realized in two different ways. The first one is global process monitoring, which regards the particular structure of the system. The second one, fault detection in the individual actuators and sensors is performed in a decentralized manner within the respective components. The traditional methods used so far for process supervision, i.e. simple limit checking of characteristic signals for a designated fault, can further be replaced by novel technics. Within the automatic control of technical systems, supervisory functions serve to indicate undesired or unpermitted process states, and to take appropriate action in order to maintain the operation and to avoid damage or accidents [ISE97]. In the supervision systems R. Isermann distinguishes three main functions: monitoring, automatic protection and supervision with fault diagnosis. New technics will allow occasional, abrupt or incipient fault and failures identification; fault diagnostic in the actuators and sensors or system components; fault identification in the closed circuits; transition process monitoring. Main evaluation parameters by the systems designs are modularity of hard- and software, dispersion. All of these parameters increase system reliability and decrease maintenance costs. Object-orientation and distributed multi-agent systems define the software modularity. Multi-agent systems are distributed computer systems consisting of several (semi-) autonomous, but cooperatively interacting agents. A group of agents tries to solve a complex problem, which could not be solved by any of the agents alone or with suitable quality, by cooperation [WEI98]. R. Weiss and Y. L. Murphey provide a good overview of an automotive distributed agent diagnostics system application [WEI98, MUR03, CRO03]. In the latter, a detail overview of signal-based fault detection method is given and the significance of signal segmentation in the vehicles systems is described. To achieve great flexibility, object-oriented program paradigm can be chosen [ARM88]. C. S. Xu describes an object-oriented expert system tool for fault diagnosis, where the diagnostics problem-solving is described as a three-dimensional model, which includes problem characteristics, method and strategy and evolution manner phase [XIA95]. The object-oriented approach is especially suited for program maintenance and code reutilization due to its encapsulation properties. The object-oriented approach makes it easier to integrate the knowledge (rules, frames, procedures, scripts, heuristics, databases, functional blocks) from multiple sources and multiple levels [GEY95, WOH99]. The success of a system

23
reliability analysis depends on the experience of the reliability engineer and the process specific knowledge. In the object-oriented approach, the knowledge is always represented with classes, objects, properties, rules and methods. The rules presented in the mathematical, linguistic or other way, associate needed knowledge to solve the tasks and problems. Rules sets can be grouped according to aims, which are called hypothesis. In the passenger transport (trams), as a dynamic system, the fault diagnosis is more difficult than in the static, manufacturing systems. The energy system and transport system are in a way comparable. In the transport system, the vehicles moving all the time along the line, having different locations, contact line sections, traffic density sections, environment parameters etc. In the energy systems the center of energy consumption changes all the time, having different locations. For example, Y. Sekine describes power systems diagnosis expert system, which collects environmental, territorial and consumption data to identify exact location of fault and causes [SEK92]. It is important also to identify the vehicle location; in- and outside power supply circuit’s parameters to define direct or indirect causes of faults and failures. Model-based diagnosis is believed to play an important role: during the design phase, for the achievement, assessment and definition of the optimal information level (through an iteration among design actions on the system, available information and diagnostic goals); in performing the diagnostic task (onboard and offboard) by the optimal information management (propagation and correlation among measurements and diagnostic model variables); in defining a sound methodology for a comprehensive approach to diagnosis from the design phase to the field application. Defining such a methodology must be carried out with continuous reference to the guiding applications [BID99]. It is important to distinguish diagnostics systems tasks between the onboard sub-systems, dispatching center or service center. The new system development and integration methodology focuses on optimal models, modules and object-based systems representations; trade-off analysis for heterogeneous systems; optimal system architecture, which includes system distribution and hierarchy analysis and optimization.
2. Analysis of the existing system Before the system development and design, during the last 14 years repair and maintenance data were analyzed, including analysis of failure types and rates, maintenance and repair types and rates, main stop causes etc. This analysis shows the direct impact of maintenance efficiency on the failure rates and repair costs.

24
2.1. Failure influence on the traffic Main causes for traffic stops were technical failures and accidents (Figure 2.1); 75% (53) of downtime was caused of them.
31%
44%
10%3%
12%
Accident Technical causePow er Department Trail ServiceOthers
Figure 2.1. Causes of stop
2.2. Faults and failure causes Based on the analysis of the data collected between 1989-2003 it can be concluded that repairs were caused by 57 % by electrical, 37% by mechanical and 6 % by others failures. Main electrical failures occurred in the following tram devices and electrical circuits: electrical drive, 600 V DC control and power supply circuits, doors control an supply circuits, 24 V DC control and supply circuits and breaks (Figure 2.2).
35%
14%11%
10%
10%
9%4% 3% 3% 1%
El.driv e 600 V supply Doors24 V control Breaks 24 V supply600 V control Accidents HeatingLighting
Figure 2.2. Causes of failure

25
2.3. Availability and effectiveness of repairs The service and maintenance work contains repairs on request - 42%, preventive maintenance - 27%, repair in the street - 21%, and reconstruction - 10%. In an ideal case, service and maintenance work should contain: preventive maintenance - 50%, repair on request - 30%, repair on the street - 10%, and reconstruction -10%. By increasing the efficiency and quality of preventive maintenance the maintenance costs can be reduced, reliability and passenger comfort can be increased (Figure 2.3). By increasing the quality and effectiveness of preventive maintenance, the demand on repairs in the depot and repairs in streets will decrease; the availability will increase, which means more accurately functioning trams in the streets. Technical readiness is a parameter that describes the technical condition of all trams. Technical readiness is the percentage of the trams that are functional. The timely reconstruction and utilization of old trams, automatic diagnostics and other factors affect the availability of trams.
Rc cx
c−
= ,
(1)
where c-amount of all trams, cR- amount of trams in repair/service. Reliability is related to a specified time period, but an estimate of life expectancy is more useful in most circumstances. This is given by mean time to failure (MTTF) for non-repairable items. The mean time to repair/service is also a similar parameter. Comparison of both the parameters enables us to analyze the efficiency of service and repair (Figure 2.4).
0
2000
4000
6000
8000
10000
12000
1989
1990
1991
1992
1993
1994
1995
1996
1997
1998
1999
2000
2001
2002
2003
0,65
0,7
0,75
0,8
0,85
0,9
0,95
Repair on the street Preventive Maintenance
Repair in the Depot Availability
Figure 2.3. Repair, maintenance and availability

26
Average meantime to failure is 370 h and to repair (including failure localization) 33 h. As different statistics shows, over 80% of downtime is spent on locating the failure source and only 20 % is spent on the repair.
0
100
200
300
400
500
600
700
1990
1991
1992
1993
1994
1995
1996
1997
1998
1999
2000
2001
2002
2003
time,
h
05101520253035404550
time,
h
MTTF MTTR
Figure 2.4. Meantime to failure and to repair
2.4. Problem statement Disadvantages of the existing maintenance system:
1. service and maintenance time depends entirely on the human factor 2. preventive maintenance depends entirely on the human factor 3. maintenance is based on interval and failure rather than on condition and
history 4. failure/fault localization depends only on human factor (specialists know-
how) 5. notification of failures/faults occurring in traffic depends only on the
human factor (driver) 6. no special equipment for faster failure/fault localization and identification
Passenger and maintenance personnel needs were analyzed before starting the new system design process. Some of these needs were to
• reduce the maintenance cost • provide modularity and flexibility of different soft- and hardware
solutions • reduce cost raised from vandalism • introduce “black box” functionality into the control system

27
• provide integrated passenger onboard and depot information system • achieve system compatibility with other rail and public transport vehicles
and systems • provide rapid timetable deviation and expert model based fault analyses
Also, other developed control and diagnostic systems for vehicles were analyzed. In all cases, the main purposes for system development were: to improve safety and efficiency, to examine new technologies that provide automatic identification of train speed and position, advanced traffic planning, direct dispatcher intervention in hazardous traffic situations and reduce human error [ACH98]. All of these purposes were more or less, dependent of real needs and needed investment price to be taken into account by the design of the system. According to expert analysis and statistical analysis, the demand list for systems design and development (including the functional description, protocols 05.06.2002 and 13.06.2002) was composed (Table 2.1).
Table 2.1 Development and design requirements
System, sub-systems, device Demand Control panels � Heating/Ventilation �/� Brakes � Motors and buggies � Doors � Traction drive control system (incl. converter) � Auxiliary power supply system � Turn-on system � Passenger information system � Onboard-PC, Onboard and mobile diagnostic � Dispatching, Web-based passenger information � � - yes, � – partly
3. Control, supervision and diagnostics system design The control and diagnostics system is divided into the onboard and the depot system. The onboard system includes the traction converter (chopper) control system, the battery charger control system, the onboard PLC, the onboard PC, passenger information displays, a GPS-receiver, a security camera, and communication systems (Figure 3.1). Data communication between different onboard systems are organized over three different protocols: • RS485 - between the passenger information system and onboard PC • CAN - between the traction drive control system, battery charger control
system and onboard PLC

28
• ETHERNET - between the onboard PC, the onboard PLC, the security camera, and the WLAN access point.
Data communication between the tram onboard and depot systems (dispatching center) of trams is organized over the GSM/GPRS- and WLAN network. Over Ethernet will be collect large amounts of sensing and first level diagnostics data into the onboard PC and send the data to depot systems. Passengers can be provided with improved information services.
Distributed I/O
Board PLC
Inside displayOutsidedisplay 1
Outsidedisplay 2
Outsidedisplay 3
Board PC
RS485/RS232converter
WLANAccessPoint
Securitycamera
GPRSmodem
RS C S TR RD TD C DTA LK / D ATA
TA LK
GPS
Ethernet
CAN
RS485Traction
ConverterBatteryCharger
Figure 3.1 Onboard information and diagnostics system
Messages that are transmitted between a tramcar and the dispatching centre have different priority levels. High priority messages should be transmitted immediately, while others can be transmitted periodically or when a connection is possible. Statistical data can be buffered and forwarded to the database periodically. In a tram, the data can be transmitted to the dispatch centre by help of voice over radio, GSM/GPRS and WLAN (Figure 3.2). The information throughput of the existing audio connection over narrow bandwidth FM radio is very low. Thus, this channel is not suitable for video transmission. GSM/GPRS can be used to transmit higher priority data. The speed of data transmission is low, but the whole city area is covered.
Dispatching Center Network
(etrhernet) Wireless Local Area Network
(WLAN)
OnBoard Communication
Network (ethernet, CAN, RS485,
RS232)
GPRS/GSM SMS for critical message
transferring
Mobile Maintenance (GPRS/GSM
SMS, WLAN)
Figure 3.2 Structure of the data communication system

29
The software used in a tram onboard PC is divided into four groups: process visualization and control software, communication software and data storage software. The data transferred from onboard PLC, -PC to the dispatching center (saved in SQL Server) are used in the diagnostic, control, dispatching, economic and maintenance process. Developed dispatching system includes the following software for data management and archiving: Real-Time Historian SQL-Server, Terminal Services for maintenance and dispatching visualization application, analytical and reporting tool. It is possible to print reports, to make event-based and other analyses, to prepare statistics about tram operations, faults etc. A typical modern vehicle has a large number of sensors, controllers, and computer modules embedded in the vehicle that collect abundant signals. Vehicle fault diagnosis very much depends on vehicle signal diagnosis [CRO03]. The main functions of the developed diagnostics system are rapid pinpointing the faulty system, fault analysis and lifetime analysis. Fault analysis is the main task of diagnosis. Fault analysis is used to determine the actual fault, the effects of the fault, the current system status, components that should be replaced, and/or compensating actions to take. Most current diagnostics systems wait until a fault actually occurs or a threshold is passed before detecting and dealing with the fault a posteriori. Fault avoidance systems, especially valuable in process control, analyze the situation more closely, detecting the fault a priori, and take action to prevent the fault from manifesting. Fault analysis is the main task of diagnosis. Fault analysis is used to determine the actual fault, the effects of the fault, the current system status, components that should be replaced, and/or compensating actions to take [FOX91]. In the secondary - online diagnosis level onboard-PC collects all tram data that are transferred to the offboard SQL-database (for on/offline diagnosis). Other main diagnostic functions of onboard-PC are data processing for tram driver HMI and archiving for “black-box”. From mobile maintenance computer is possible to get connection with all databases in the different level. The knowledge structure [GEO98] of the control and diagnostics system of the tram reflects the physical relations of the system to be monitored, with three levels of connection nodes: the system as the control and diagnostics system; subsystems as traction control systems, auxiliary power supply control system and control system of auxiliary devices; the components as monitored parameters and values from the actuators and sensors (Figure 3.4). Doing this can convert complex diagnostics into small simple models and simplify the fault tolerance and hazard control [YOU04].

30
Onboard supervisionand information
system
Onboard control and diagnostic system
iMac
DispatchingHMI
Traction and PowerSupply
GDB
Converter
Doors
Dispatching, service andmaintenance center
Heating and ventilation
Breaks
Signalisation
Lighting
Realtime/Online diagnostic Realtime/On/Off-linediagnostic
On-/Off-linediagnostic
Turnout
Power circuit
Driver Control Panel
Environment
Traction Drive Control System
Auxiliary Power Supply Control System
Mobil diagnostics system
HMIDB
PUDB
PU DB
PU
DBHMI
BPC
VDB
HMI
PIS
iMac
Service &Maintenance
HMISC
Passenger counting
Figure 3.3 Structure of diagnostics system
The developed and designed control and diagnostics system has three data management levels: real-time, on-line and on/off-line (Figure 3.3). The real-time level is divided into three subsystems: traction, auxiliary power supply and auxiliary control system (onboard-PLC). Each subsystem makes primary data collection, analysis and diagnosis, which are needed for onboard devices control.
1.1 1.2 1.19
1.1.1 1.1.2 1.1.8 1.2.1 1.2.2 1.2.17
1
2.1 2.2 2.18
2.1.1 2.1.2 2.1.40 2.2.1 2.2.2 2.2.18
2
3.1 3.2 3.8
3.1.1 3.1.2 3.2.1 3.2.2 3.2.12
3
ODS
SYSTEM
SUBSYSTEM
1 - TRACTION DRIVE CONTROL SYSTEM(process parameters 1.1...1.19)
2 - ONBOARD CONTROL SYSTEM(process parameters 2.1...2.18)
3 - AUXILIARY POWER SUPPLY CONTROL SYSTEM(process parameters 3.1...3.8)
COMPONENT
Figure 3.4 Knowledge structure of the diagnostics system for a tram

31
3.1. Onboard control and diagnostic system Onboard control and diagnostics system consists of three main components: control and diagnostic application, user interface, database for reference and process parameters. On the user interface, the value of all variables of onboard PLC, condition data (faults and failures), sensing data configuration data can be displayed and changed. The control and diagnostics system collects data from board devices/subsystems, like doors, brakes, power supply, traction control systems; processes the collected data; controls devices and sub-systems; transfers data to the supervision and others systems; archives the data in the text file format (Figure 3.5).
Tram boardOnboard control and diagnostics system
Control and diagnosticapplication
Doors
Heating
Brakes
Turn on
Power supplycircuits
Traction controlsystem
Auxiliary powersupply control
system
Lights
Mobile phone ofservice personnel
Supervision system
Mobile diagnosticssystem
UI
TF
Figure 3.5 Interconnections and structure of the onboard control and diagnostics
system
32
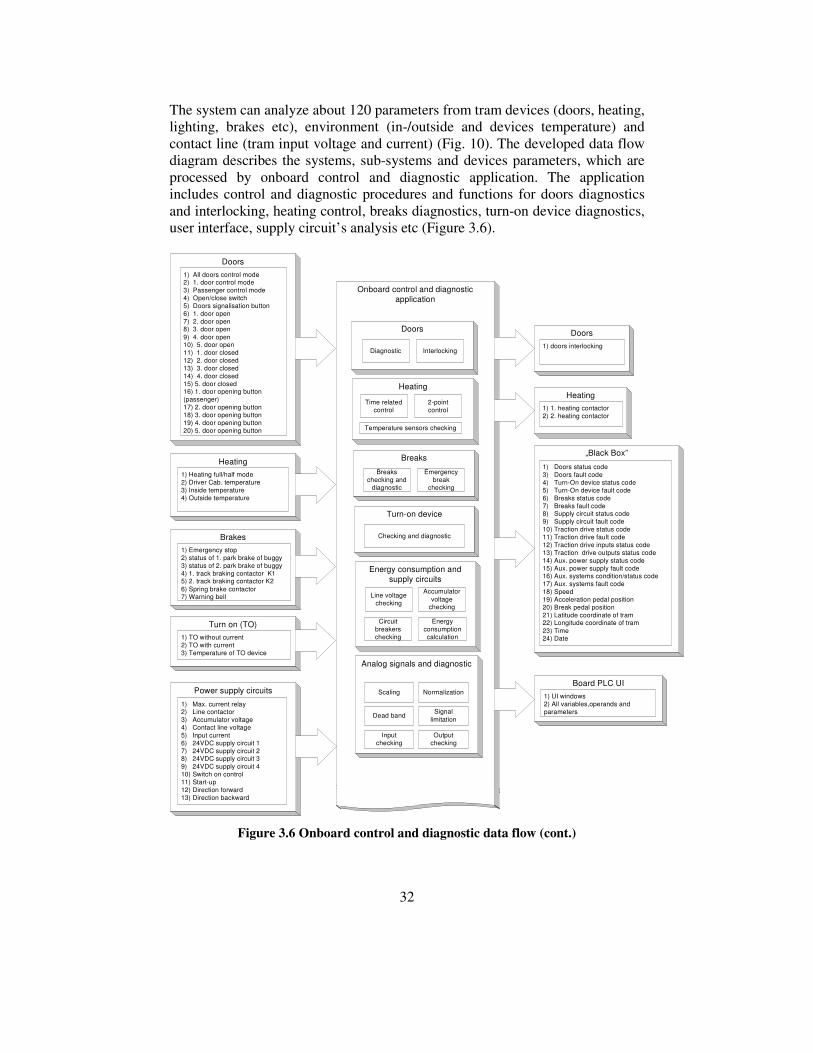
The system can analyze about 120 parameters from tram devices (doors, heating, lighting, brakes etc), environment (in-/outside and devices temperature) and contact line (tram input voltage and current) (Fig. 10). The developed data flow diagram describes the systems, sub-systems and devices parameters, which are processed by onboard control and diagnostic application. The application includes control and diagnostic procedures and functions for doors diagnostics and interlocking, heating control, breaks diagnostics, turn-on device diagnostics, user interface, supply circuit’s analysis etc (Figure 3.6).
Onboard control and diagnosticapplication
Doors
Turn on (TO)1) TO without current2) TO with current3) Temperature of TO device
Heating1) Heating full/half mode2) Driver Cab. temperature3) Inside temperature4) Outside temperature
„Black Box”
1) Doors status code3) Doors fault code4) Turn-On device status code5) Turn-On device fault code6) Breaks status code7) Breaks fault code8) Supply circuit status code9) Supply circuit fault code10) Traction drive status code11) Traction drive fault code12) Traction drive inputs status code13) Traction drive outputs status code14) Aux. power supply status code15) Aux. power supply fault code16) Aux. systems condition/status code17) Aux. systems fault code18) Speed19) Acceleration pedal position20) Break pedal position21) Latitude coordinate of tram22) Longitude coordinate of tram23) Time24) Date
Doors1) doors interlocking
Heating1) 1. heating contactor2) 2. heating contactor
Heating
Temperature sensors checking
Time relatedcontrol
2-pointcontrol
Doors
Diagnostic Interlocking
Brakes1) Emergency stop2) status of 1. park brake of buggy3) status of 2. park brake of buggy4) 1. track braking contactor K15) 2. track braking contactor K26) Spring brake contactor7) Warning bell
Breaks
Breakschecking and
diagnostic
Turn-on device
Checking and diagnostic
Emergencybreak
checking
Power supply circuits
Energy consumption andsupply circuits
Energyconsumptioncalculation
Line voltagechecking
Accumulatorvoltage
checking
Circuitbreakerschecking
Analog signals and diagnostic
Scaling Normalization
Dead band Signallimitation
Inputchecking
Outputchecking
Board PLC UI1) UI windows2) All variables,operands andparameters
1) All doors control mode2) 1. door control mode3) Passenger control mode4) Open/close switch5) Doors signalisation button6) 1. door open7) 2. door open8) 3. door open9) 4. door open10) 5. door open11) 1. door closed12) 2. door closed13) 3. door closed14) 4. door closed15) 5. door closed16) 1. door opening button(passenger)17) 2. door opening button18) 3. door opening button19) 4. door opening button20) 5. door opening button
1) Max. current relay2) Line contactor3) Accumulator voltage4) Contact line voltage5) Input current6) 24VDC supply circuit 17) 24VDC supply circuit 28) 24VDC supply circuit 39) 24VDC supply circuit 410) Switch on control11) Start-up12) Direction forward13) Direction backward
Figure 3.6 Onboard control and diagnostic data flow (cont.)

33
One of the largest modules in the application design is the communication module, which includes procedures for GSM, CAN and Modbus Ethernet configuration, initialization, communication, and diagnostic tasks (Figure 3.7).
Service personal mobile phone
1) Tram number2) Tram location3) Device type4) Device fault code
SQL database
All variables, operands andparameters
Mobile diagnostic system UIAll variables, operands andparameters
Data blocks
Driver HMI
1) Aux. systems fault code2) Aux. systems fault code3) Traction drive fault code 14) Traction drive fault code 25) Traction drive status code6) Accumulator voltage7) Driver cab. temperature8) Outside temperature9) Inside temperature10) Turn-on device temperature11) Kilometrage12) Speed13) Traction drive current14) Contact line voltage15) Tram input current16) Power & energy consumption
Auxiliary power supply (APS)control system
1) Output current2) Accumulator voltage3) Input voltage4) 3-ph. ventilators voltage5) Aux. power supply fault code6) Aux. power supply status code7) 3-ph. ventilators voltagemodulation frequency8) APS output voltage
Traction control system
Lights1) Emergency lights2) Dim lights3) Far lights
Onboard supervision system1) Tram location
User Interface (UI)
Environment & lifetime analyses
Temperature change analyses
Switchingcounting
Lifetimecalculation
Communication & diagnosis
GSM-modeminitialisation
ETHERNET-portinitialisation
CAN initialisation
CAN-interfacereading, storage
SMS send
SMS initialisation
SMS receive
MODBUS IPconfuguration
MODBUS IPSCAN
configuration
GSM diagnostic
CAN diagnostic
ETHERNETSocket Timed
Out
1) Time2) Motor field current3) 1. buggy motor armature current4) 2. buggy motor armature current5) Converter DC-link voltage6) Speed7) 1. buggy transistors switchingduration8) 2. buggy transistors switchingduration9) Acceleration pedal position10) Brake pedal position11) Reference current of braking12) Traction drive fault code13) Traction drive status code14) Inputs status code15) Output status code16) Reference of field current17) Feedback of EMF18) Reference of EMF19) Reference of field weakening20) Date
Board PLC UI
1) Menu buttons2) Number buttons3) Function buttons4) Acknowledgement buttons
User menuInstruction Configuration
Fault & status codes Indications
System menu
Data types
System
Function blocks
Password
Hardware configuration
Figure 3.7 Onboard control and diagnostic data flow
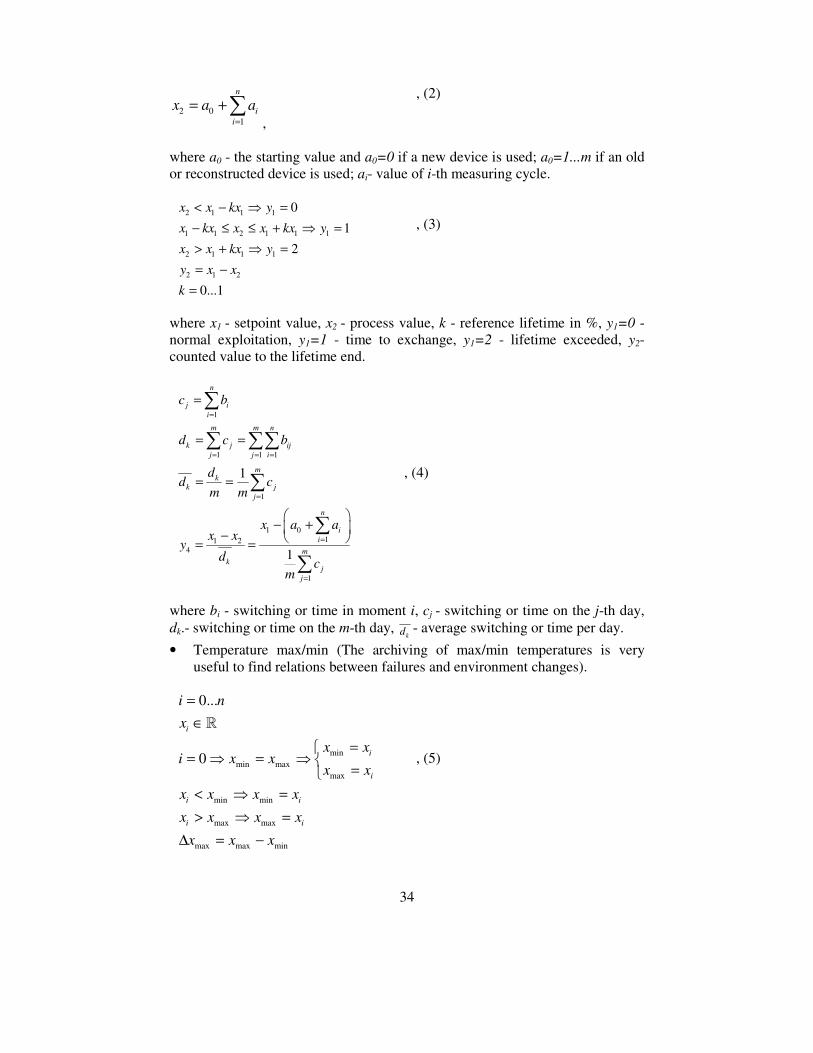
An overview of time and switching-based lifetime, max/min temperature, and the rate of change of temperature calculations are shown on below (2...6). • Lifetime (for each device, lifetime range (time and/or switching times) is
given. The self-diagnostic integration to systems makes preventive maintenance much more effective.
34
2 01
n
ii
x a a=
= +�,
, (2)
where a0 - the starting value and a0=0 if a new device is used; a0=1...m if an old or reconstructed device is used; ai- value of i-th measuring cycle.
2 1 1 1
1 1 2 1 1 1
2 1 1 1
2 1 2
0
1
2
0...1
x x kx y
x kx x x kx y
x x kx y
y x x
k
< − � =− ≤ ≤ + � => + � == −
=
, (3)
where x1 - setpoint value, x2 - process value, k - reference lifetime in %, y1=0 - normal exploitation, y1=1 - time to exchange, y1=2 - lifetime exceeded, y2-counted value to the lifetime end.
1
1 1 1
1
1 011 2
4
1
1
1
n
j ii
m m n
k j ijj j i
mk
k jj
n
ii
mk
jj
c b
d c b
dd c
m m
x a ax x
yd c
m
=
= = =
=
=
=
=
= =
= =
� �− +� �− � �= =
�
� ��
�
�
�
, (4)
where bi - switching or time in moment i, cj - switching or time on the j-th day, dk.- switching or time on the m-th day,
kd - average switching or time per day.
• Temperature max/min (The archiving of max/min temperatures is very useful to find relations between failures and environment changes).
minmin max
max
min min
max max
max max min
0...
0
i
i
i
i i
i i
i n
x
x xi x x
x x
x x x x
x x x x
x x x
=∈
== � = � =�
< � => � =
∆ = −
�
, (5)

35
where i- ith measuring cycle, xi - temperature in the i-th measuring cycle, xmax -maximum temperature, xmin - minimum temperature, �xmax - maximum temperature change. • The rate of change of temperature (depending on the rate of change of
temperature, constants for lifetime analyses can be calculated).
1 11 1
1 1n n
x i i i ii i
k x x x xnt T− −
= =
= − = −� � , (6)
where kx - rate of change, xi - measured temperature in the timeslot i, n - the number of measured cycles, t - time of the measuring cycle.
3.2. Onboard supervision system Onboard supervision system includes two sub-systems: driver control and monitoring system, positioning and the passenger information system. The sub-systems are based on the following applications: driver HMI, driver UI, positioning and passenger information control (PPIC) application, PPIC user interface, PLC I/O-server for data communication, and remote data acquisition service application (Figure 3.8).
Tram board
Outside displays
Onboard supervision system
GPS-receiver
PLC
Driver HMIapplication
I/O Server(MODUBUS)
Front and sidedisplay
Rear display
Inside display
Remote IDAS
Positioning andpassenger information
control application
Depot
InSQL
Web-browser(Internet Explorer)
Camera
TF
AF
Acoustic system
UI
DriverUI
Onboardcontrol &diagnosticapplication
Figure 3.8 Structure and interconnections of onboard supervision system

36
The Driver HMI application, intended for coordination, controls and communicates with the onboard systems/devices, like the acoustic system, camera, positioning and passenger information system (displays), acoustic files databank, text files databank, and onboard PLC.
3.2.1. Driver HMI Within the automatic control of technical systems, supervisory functions serve to indicate undesired or unpermitted process states, and to take appropriate action in order to maintain the operation and to avoid damage or accidents [3]. The developed tram driver HMI provides large amounts of valuable information to the tram driver and increases traffic safety. It enables us to
• display the electrical, mechanical and software faults on the screen of the board PC
• control in the manual mode the tram information system directly from board PC touch screen
• control in the automatic mode the passenger information system according to the data received from GPS
• display important information (speed, current, voltage, temperatures) • display the picture from the security camera • add the system of tram traffic and schedule control that operates with
control times and shows the driver if he/she is too late or too early. The developed data flow diagram describes the system, sub-system and device parameters, which are processed by the driver HMI application, and gives an overview of the procedures (Figure 3.9). The passenger onboard acoustic and visual information control is a complex process. It is developed and designed to provide different control modes of information announcement: manual and automatic announcement. In both modes, to activate the needed mode, driving line and direction must be chosen. For example, the automatic announcement mode consists of the following procedures: automatic preconfiguration by location, condition checking for stop announcement, announcement of stop, condition checking for the next stop announcement and announcement of the next stop. In the each stop area, the process starts again by checking the procedure condition for stop announcement (Figure 3.10).
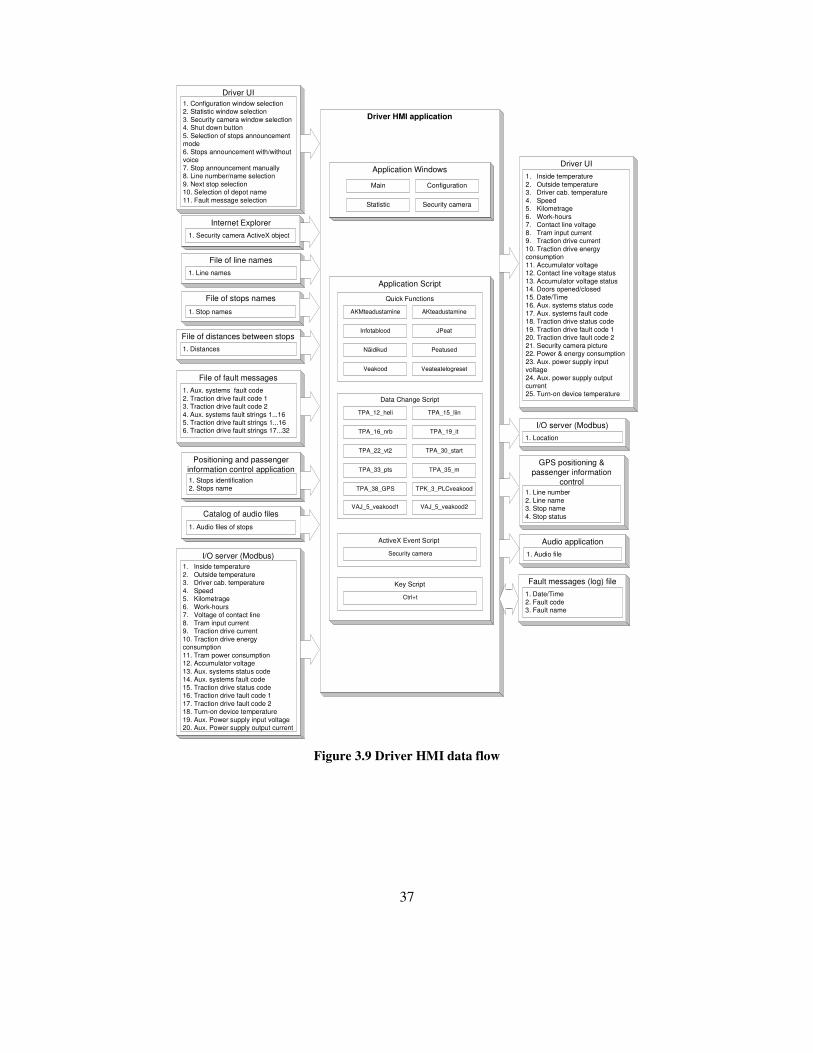
37
Driver HMI application
GPS positioning &passenger information
control1. Line number2. Line name3. Stop name4. Stop status
Application Windows
Main Configuration
Statistic Security camera
I/O server (Modbus)1. Location
Audio application1. Audio file
Driver UI1. Inside temperature2. Outside temperature3. Driver cab. temperature4. Speed5. Kilometrage6. Work-hours7. Contact line voltage8. Tram input current9. Traction drive current10. Traction drive energyconsumption11. Accumulator voltage12. Contact line voltage status13. Accumulator voltage status14. Doors opened/closed15. Date/Time16. Aux. systems status code17. Aux. systems fault code18. Traction drive status code19. Traction drive fault code 120. Traction drive fault code 221. Security camera picture22. Power & energy consumption23. Aux. power supply inputvoltage24. Aux. power supply outputcurrent25. Turn-on device temperature
Driver UI1. Configuration window selection2. Statistic window selection3. Security camera window selection4. Shut down button5. Selection of stops announcementmode6. Stops announcement with/withoutvoice7. Stop announcement manually8. Line number/name selection9. Next stop selection10. Selection of depot name11. Fault message selection
Internet Explorer1. Security camera ActiveX object
File of line names1. Line names
File of stops names
1. Stop names
File of distances between stops1. Distances
Positioning and passengerinformation control application1. Stops identification2. Stops name
Catalog of audio files
1. Audio files of stops
I/O server (Modbus)1. Inside temperature2. Outside temperature3. Driver cab. temperature4. Speed5. Kilometrage6. Work-hours7. Voltage of contact line8. Tram input current9. Traction drive current10. Traction drive energyconsumption11. Tram power consumption12. Accumulator voltage13. Aux. systems status code14. Aux. systems fault code15. Traction drive status code16. Traction drive fault code 117. Traction drive fault code 218. Turn-on device temperature19. Aux. Power supply input voltage20. Aux. Power supply output current
Fault messages (log) file1. Date/Time2. Fault code3. Fault name
Application Script
Quick Functions
AKMteadustamine AKteadustamine
Infotablood JPeat
Näidikud Peatused
Veakood Veateatelogreset
Data Change Script
TPA_12_heli TPA_15_liin
TPA_16_nrb TPA_19_it
TPA_22_vt2 TPA_30_start
TPA_33_pts TPA_35_m
TPA_38_GPS TPK_3_PLCveakood
VAJ_5_veakood1 VAJ_5_veakood2
ActiveX Event Script
Security camera
Key Script
Ctrl+t
File of fault messages1. Aux. systems fault code2. Traction drive fault code 13. Traction drive fault code 24. Aux. systems fault strings 1...165. Traction drive fault strings 1...166. Traction drive fault strings 17...32
Figure 3.9 Driver HMI data flow
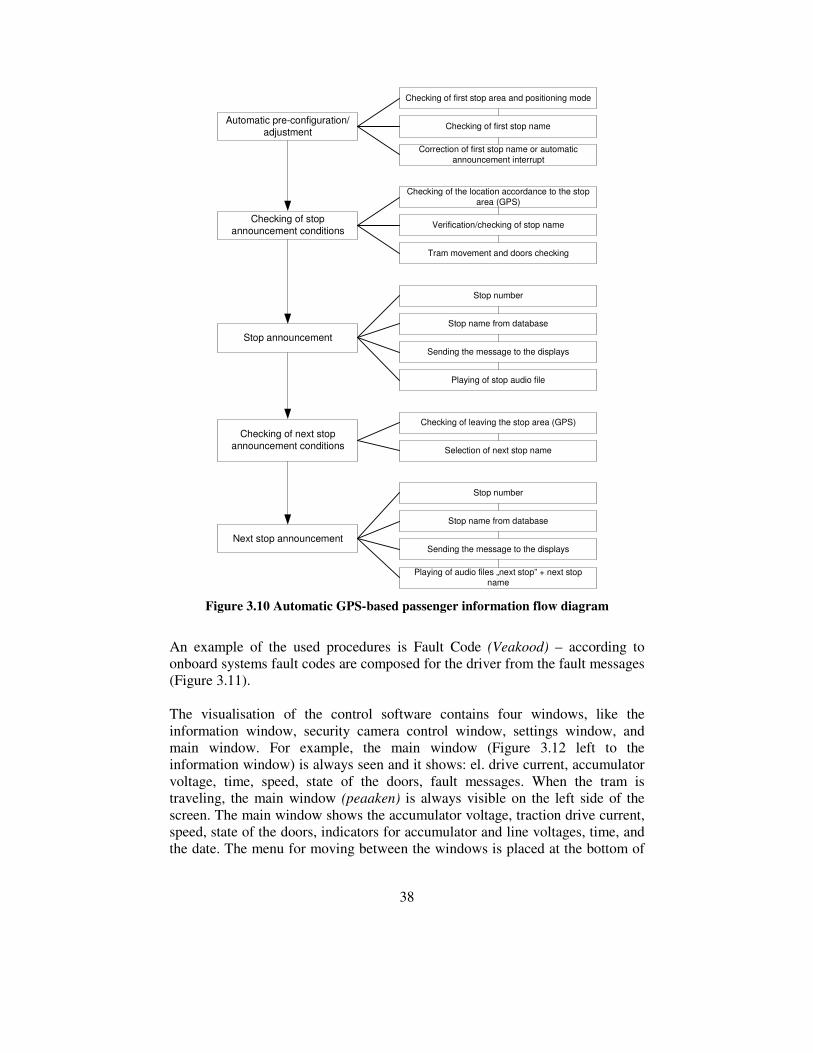
38
Automatic pre-configuration/adjustment
Stop announcement
Checking of next stopannouncement conditions
Next stop announcement
Stop number
Stop name from database
Sending the message to the displays
Playing of stop audio file
Stop number
Stop name from database
Playing of audio files „next stop” + next stopname
Sending the message to the displays
Checking of first stop area and positioning mode
Checking of first stop name
Correction of first stop name or automaticannouncement interrupt
Checking of stopannouncement conditions
Checking of the location accordance to the stoparea (GPS)
Verification/checking of stop name
Tram movement and doors checking
Checking of leaving the stop area (GPS)
Selection of next stop name
Figure 3.10 Automatic GPS-based passenger information flow diagram
An example of the used procedures is Fault Code (Veakood) – according to onboard systems fault codes are composed for the driver from the fault messages (Figure 3.11). The visualisation of the control software contains four windows, like the information window, security camera control window, settings window, and main window. For example, the main window (Figure 3.12 left to the information window) is always seen and it shows: el. drive current, accumulator voltage, time, speed, state of the doors, fault messages. When the tram is traveling, the main window (peaaken) is always visible on the left side of the screen. The main window shows the accumulator voltage, traction drive current, speed, state of the doors, indicators for accumulator and line voltages, time, and the date. The menu for moving between the windows is placed at the bottom of

39
the screen and the fault message field is placed on the upper part of the screen with selection keys. In the configuration window (seadete aken) it is possible to choose texts for the passenger information system (displays), next stop, switch acoustic information on/off, manual or GPS-based automatic mode for the passenger information system. In the statistic window (statistika aken) different indications for driver are shown.
Begin
Fault codechanged
End
Check and compare thefault code changes
References offault codes
and messages
Yes
Date/Time
Compose the faultmessage
Userinterface
Monitor the faultmessage
Store the fault messageFaultmessages
No
Figure 3.11 Algorithm of “Fault code” procedure
Figure 3.12 Main, configuration and statistic window

40
The passenger cabin security camera picture will be transferred from to the camera window (turvakaamera aken). Two solutions can be applied to show the camera picture: manual and automatic. The first one will be activated if the driver chooses this from the menu and another will activated automatically in the stops (Figure 3.13).
Figure 3.13 Main and security camera window
3.2.2. Positioning and passenger information control First, a solution was developed, where the position of the tram was located by the transit value. But problems occurred, like inaccuracy of the transit value caused by slipping of the wheels. The solution based on GPS seems the most reliable. Although the GPS-based system may face some problems in the urban conditions (for example, poor visibility of GPS satellites between high buildings), it was tested and worked properly. In most places, the streets are wide enough and buildings are not too high to see satellites for positioning. The developed data flow diagram describes the systems, sub-systems and applications parameters, which are processed by positioning and passenger information control application, and gives an overview of the procedures (Figure 3.14). Data from the GPS receiver comes in sentences (NMEA 0183 standard), which consist of comma-separated parameters. To use it, we need first to filter out only needed RMC (Recommended Minimum Specific GPS/TRANSIT Data) sentences and then separate the needed parameters from the sentence to the variables. This is called the process step of GPS data preparation.

41
Positioning andpassenger information
control application
GPSpositioning
Configuration& test
UI
1. Send code to inside display2. Send code to outside display 13. Send code to outside display 24. Latitude coordinate5. Longitude coordinate6. Speed from GPS-receiver7. Checking of GPS information8. Stop name for Driver HMI9. GPS log10. Program log11. Display information fromDriver HMI
UI
1. Serial port number of displays2. Serial port parameters of displays3. Outside display 1 test message4. Outside display 2 test message5. Inside display test message6. Advertisement text to inside display7. Advertisement interval8. GPS serial port number9. GPS serial port parameters10. Permission of GPS file logging11. Logfile (GPS) name12. Change of stop name13. Reference latitude change14. Ref. deviation change of latitude15. Ref. longitude change16. Ref. deviation change of longitude17. DDE using
Driver HMI application
GPS receiver
1. Latitude coordinate2. Pole of latitude coordinate3. Longitude coordinate4. Pole of longitude coordinate5. Reliability6. Speed
Outside display 1
1. Format information2. Line number3. Line name4. Checksum
Outside display 2
1. Format information2. Line number3. Checksum
Inside display
1. Format information2. Line number3. Line name4. Advertisement text5. Checksum
Driver HMI application
1. Stop status2. Stop name
1. Line number2. Line name3. Stop name4. Stop status
Displays control
Inside displaycontrol
Outside displayscontrol
Configuration file
1. Serial port number2. Serial port parameters3. Advertisement text toinside dislay4. Advertisement interval
Stops location table
1. Stop name2. Latitude coordinate3. Longitude coordinate4. Deviation range of latitude5. Deviation range of longitude
Figure 3.14 Positioning and passenger information control application data flow
The second step, called area matching, consists of the main functionality of the application. It finds out if the location co-ordinates from the GPS receiver are in any of the areas, which are in the database. A simplified algorithm of that part of the positioning program is shown in Figure 3.15.

42
Are GPS co-ordinates in the
area?
Read first row fromdatabase table
Any locationbased processes
started?
Start theprocess defined
for this area
Stop all locationbased processes
Yes
Yes
No
End
Morerows left in the
database?
No
Yes
Read next rowfrom database
table
Begin
No
Figure 3.15 Algorithm for location checking
Basically there are two conditions when the visual messages are changed and acoustic messages are played: the vehicle has stopped in the stop area and the doors are opened; the vehicle is leaving the stop. Tram stop area calculation is based on the elementary formula as shown below (7).
i i GPS i i
i i GPS i i
x x x x x
y y y y y
− ∆ ≤ ≤ + ∆ − ∆ ≤ ≤ + ∆�
, (7)
where xi – longitude coordinate for stop point, yi – latitude coordinate for stop point, �xi – stop point deviation range on the longitude scale, �yi – stop point deviation range on the latitude scale, i – stop database row number, xGPS – longitude coordinate from GPS receiver, yGPS – latitude coordinate from GPS receiver. In the last step, the GPS data coming from the receiver is logged into the flash memory or hard drive. Logging is used for diagnostics and testing purposes. It
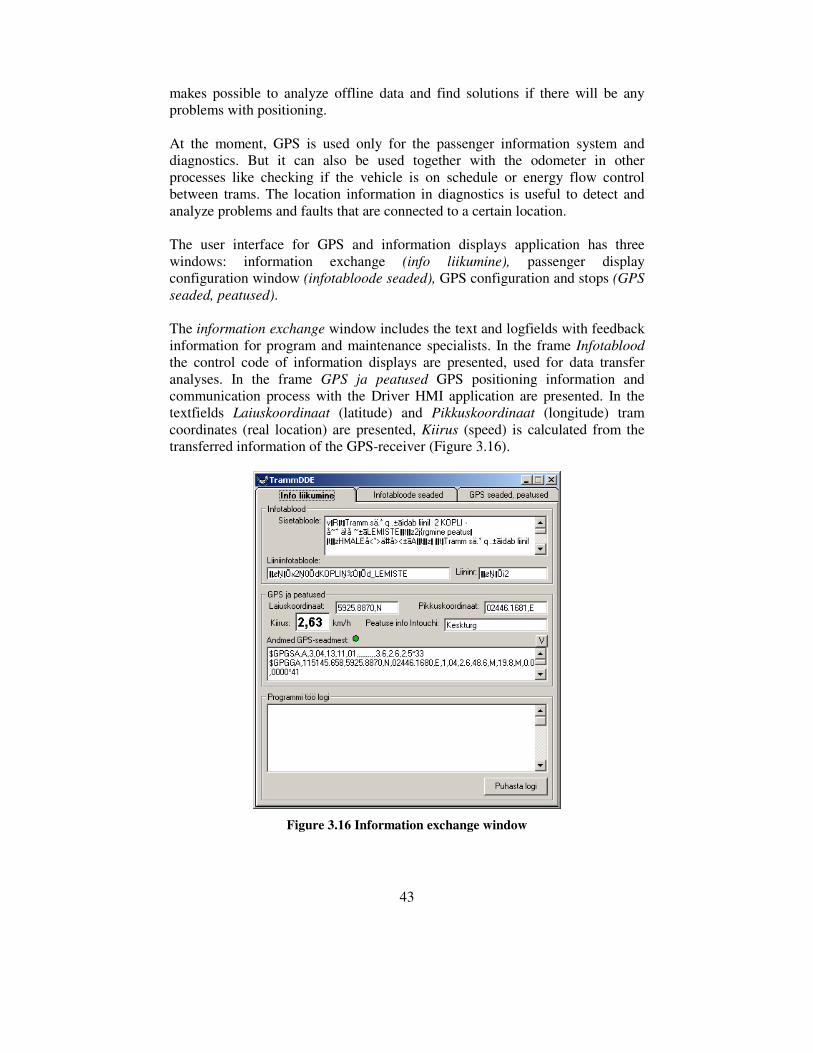
43
makes possible to analyze offline data and find solutions if there will be any problems with positioning. At the moment, GPS is used only for the passenger information system and diagnostics. But it can also be used together with the odometer in other processes like checking if the vehicle is on schedule or energy flow control between trams. The location information in diagnostics is useful to detect and analyze problems and faults that are connected to a certain location. The user interface for GPS and information displays application has three windows: information exchange (info liikumine), passenger display configuration window (infotabloode seaded), GPS configuration and stops (GPS seaded, peatused). The information exchange window includes the text and logfields with feedback information for program and maintenance specialists. In the frame Infotablood the control code of information displays are presented, used for data transfer analyses. In the frame GPS ja peatused GPS positioning information and communication process with the Driver HMI application are presented. In the textfields Laiuskoordinaat (latitude) and Pikkuskoordinaat (longitude) tram coordinates (real location) are presented, Kiirus (speed) is calculated from the transferred information of the GPS-receiver (Figure 3.16).
Figure 3.16 Information exchange window
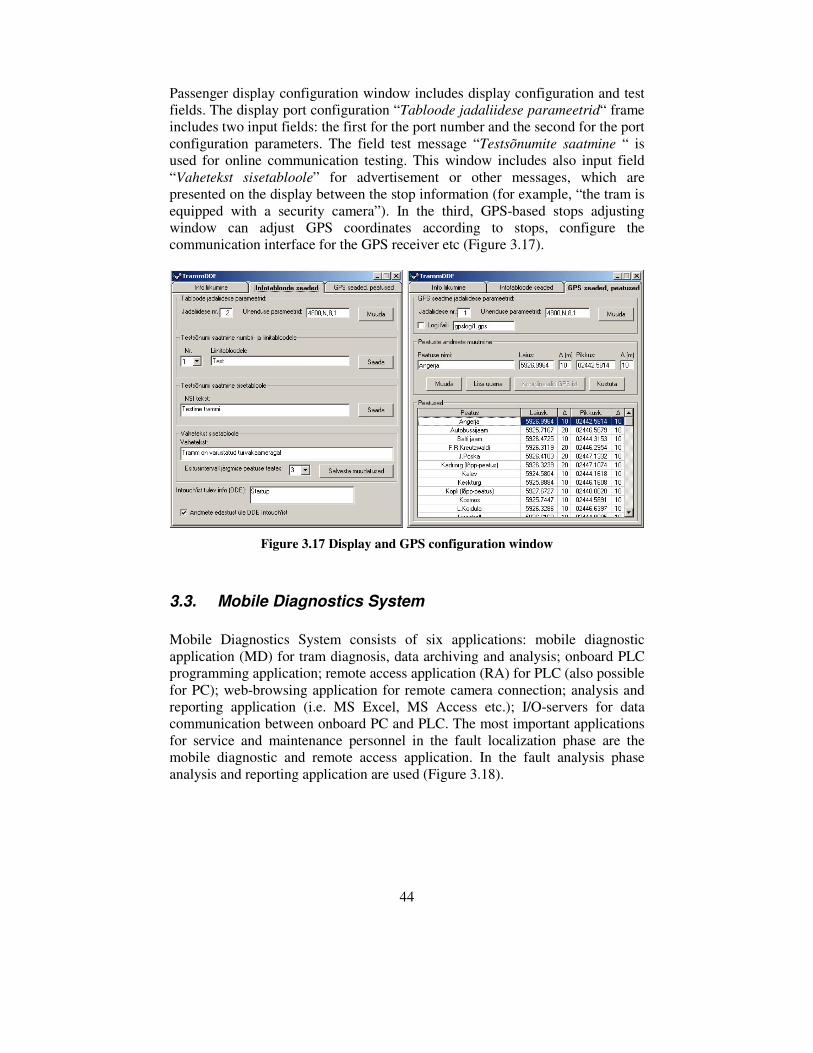
44
Passenger display configuration window includes display configuration and test fields. The display port configuration “Tabloode jadaliidese parameetrid“ frame includes two input fields: the first for the port number and the second for the port configuration parameters. The field test message “Testsõnumite saatmine “ is used for online communication testing. This window includes also input field “Vahetekst sisetabloole” for advertisement or other messages, which are presented on the display between the stop information (for example, “the tram is equipped with a security camera”). In the third, GPS-based stops adjusting window can adjust GPS coordinates according to stops, configure the communication interface for the GPS receiver etc (Figure 3.17).
Figure 3.17 Display and GPS configuration window
3.3. Mobile Diagnostics System Mobile Diagnostics System consists of six applications: mobile diagnostic application (MD) for tram diagnosis, data archiving and analysis; onboard PLC programming application; remote access application (RA) for PLC (also possible for PC); web-browsing application for remote camera connection; analysis and reporting application (i.e. MS Excel, MS Access etc.); I/O-servers for data communication between onboard PC and PLC. The most important applications for service and maintenance personnel in the fault localization phase are the mobile diagnostic and remote access application. In the fault analysis phase analysis and reporting application are used (Figure 3.18).
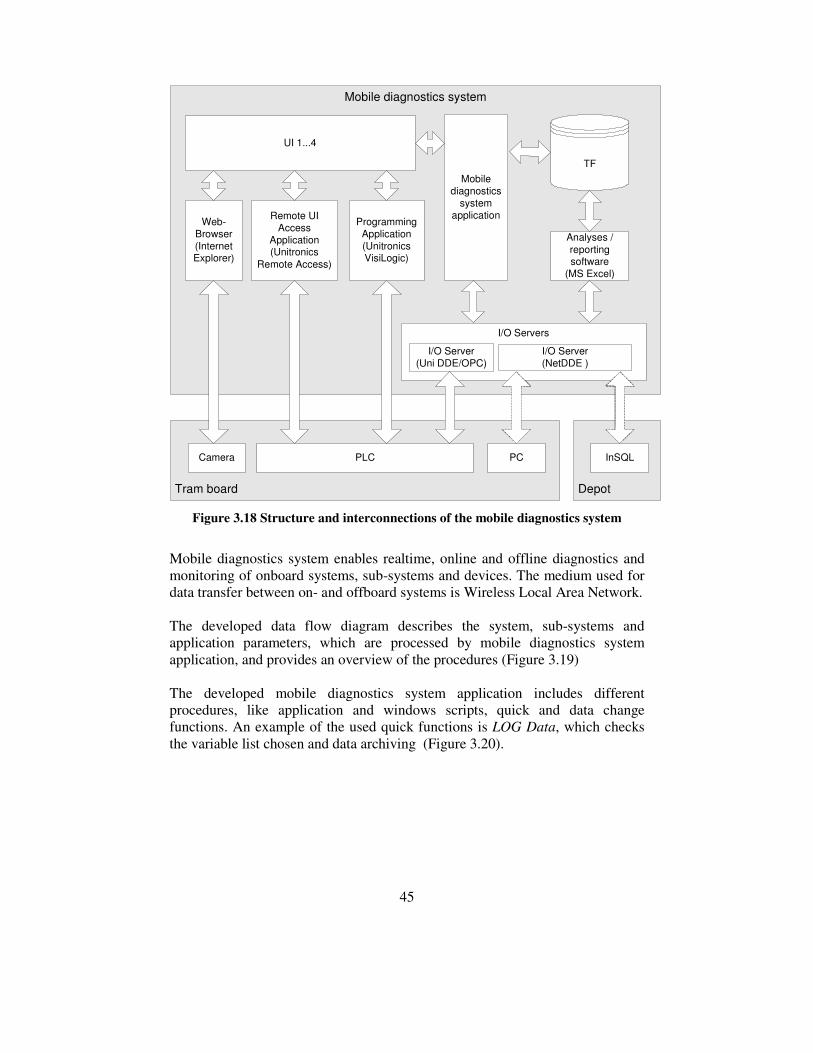
45
Mobile diagnostics system
Analyses /reportingsoftware
(MS Excel)
TF
I/O Servers
I/O Server(NetDDE )
I/O Server(Uni DDE/OPC)
Tram board
PLC PC
Depot
InSQL
Remote UIAccess
Application(Unitronics
Remote Access)
Web-Browser(InternetExplorer)
Mobilediagnostics
systemapplication
ProgrammingApplication(UnitronicsVisiLogic)
Camera
UI 1...4
Figure 3.18 Structure and interconnections of the mobile diagnostics system
Mobile diagnostics system enables realtime, online and offline diagnostics and monitoring of onboard systems, sub-systems and devices. The medium used for data transfer between on- and offboard systems is Wireless Local Area Network. The developed data flow diagram describes the system, sub-systems and application parameters, which are processed by mobile diagnostics system application, and provides an overview of the procedures (Figure 3.19) The developed mobile diagnostics system application includes different procedures, like application and windows scripts, quick and data change functions. An example of the used quick functions is LOG Data, which checks the variable list chosen and data archiving (Figure 3.20).
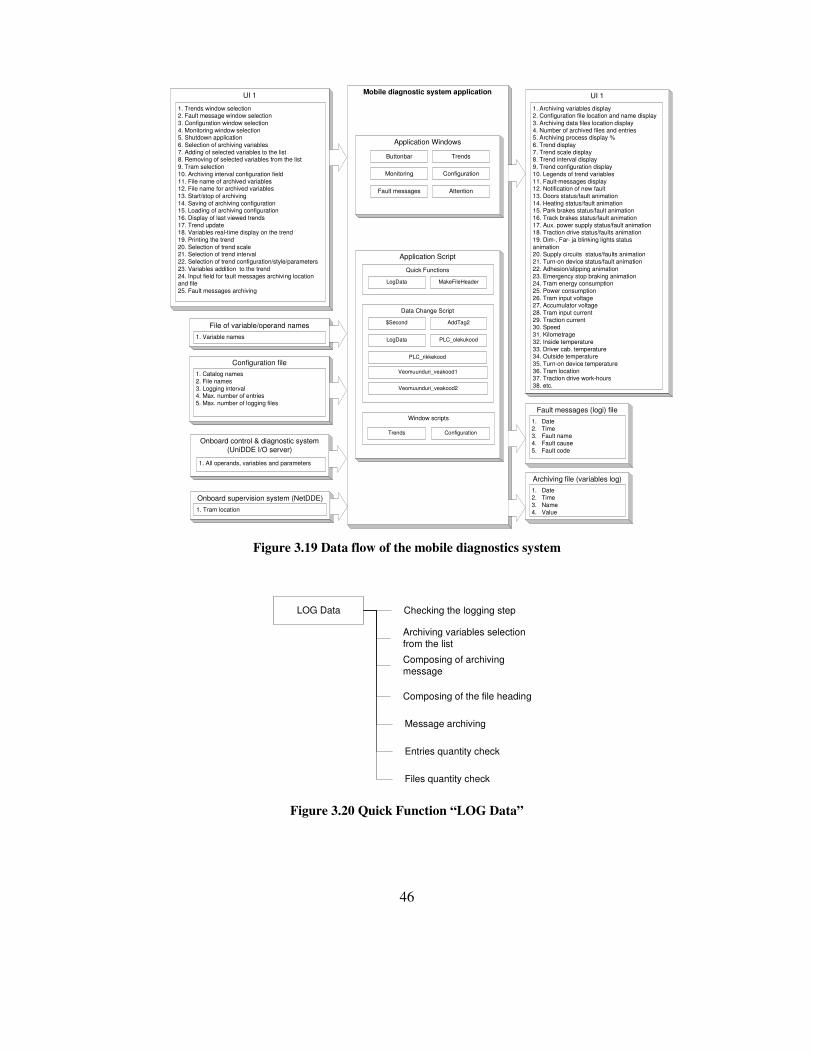
46
Mobile diagnostic system application
Fault messages (logi) file1. Date2. Time3. Fault name4. Fault cause5. Fault code
UI 1
File of variable/operand names1. Variable names
Onboard control & diagnostic system(UniDDE I/O server)
Application Script
Quick Functions
LogData MakeFileHeader
Data Change Script
$Second AddTag2
LogData PLC_olekukood
PLC_rikkekood
Veomuunduri_veakood1
Window scripts
Trends
Configuration file1. Catalog names2. File names3. Logging interval4. Max. number of entries5. Max. number of logging files
Application Windows
Buttonbar Trends
Monitoring Configuration
Fault messages Attention
Veomuunduri_veakood2
Configuration
Archiving file (variables log)1. Date2. Time3. Name4. Value
UI 1
1. Archiving variables display2. Configuration file location and name display3. Archiving data files location display4. Number of archived files and entries5. Archiving process display %6. Trend display7. Trend scale display8. Trend interval display9. Trend configuration display10. Legends of trend variables11. Fault-messages display12. Notification of new fault13. Doors status/fault animation14. Heating status/fault animation15. Park brakes status/fault animation16. Track brakes status/fault animation17. Aux. power supply status/fault animation18. Traction drive status/faults animation19. Dim-, Far- ja blinking lights statusanimation20. Supply circuits status/faults animation21. Turn-on device status/fault animation22. Adhesion/slipping animation23. Emergency stop braking animation24. Tram energy consumption25. Power consumption26. Tram input voltage27. Accumulator voltage28. Tram input current29. Traction current30. Speed31. Kilometrage32. Inside temperature33. Driver cab. temperature34. Outside temperature35. Turn-on device temperature36. Tram location37. Traction drive work-hours38. etc.
Onboard supervision system (NetDDE)1. Tram location
1. All operands, variables and parameters
1. Trends window selection2. Fault message window selection3. Configuration window selection4. Monitoring window selection5. Shutdown application6. Selection of archiving variables7. Adding of selected variables to the list8. Removing of selected variables from the list9. Tram selection10. Archiving interval configuration field11. File name of archived variables12. File name for archived variables13. Start/stop of archiving14. Saving of archiving configuration15. Loading of archiving configuration16. Display of last viewed trends17. Trend update18. Variables real-time display on the trend19. Printing the trend20. Selection of trend scale21. Selection of trend interval22. Selection of trend configuration/style/parameters23. Variables addition to the trend24. Input field for fault messages archiving locationand file25. Fault messages archiving
Figure 3.19 Data flow of the mobile diagnostics system
LOG Data
Archiving variables selectionfrom the list
Composing of archivingmessage
Composing of the file heading
Message archiving
Entries quantity check
Files quantity check
Checking the logging step
Figure 3.20 Quick Function “LOG Data”

47
Another example is a simplified fault-processing algorithm, which describes presentation, archiving of fault codes and other processing functions (Figure 3.21).
Begin
Parameterspreconfiguration
New faults
Add to list
Yes
No
Monitor the listUser
Interface
Delete fault
Delete faultmessagesNo
Yes
Store fault
Store faultmessageNo
Yes
Fault file
End Figure 3.21 Algorithm for fault codes processing
Mobile diagnostics system user interface consists of four windows: configuration, trends, fault-messages, and tram monitoring window. In the configuration window can choose the monitored tram and configured archiving parameters, for example, start and stop of archiving, file size, amount of files, update cycle for archiving, file name, file location, archived variables (tags), amount of archived variables per file. Depending on the control and diagnostic processes, changes in the foregoing settings are needed to optimize the computer resource and reduce the specialist time by information analysis (Figure 3.22).
Figure 3.22 Configuration and Trend window

48
The Trend window presents the parameters chosen in the realtime or archived parameters as an offline presentation. All the graphs can be printed. This window is important for service specialists in the depot or in the traffic by testing and analyzing the condition, states, events of the tram devices, contact lines and systems. The fault and event message window presents and can activate the archiving of faults and event messages from the onboard control and diagnostics system and the traction drive control system (Figure 3.23). Faults and event messages are very important afterwards to analyze the system by AI, statistical and other methods (Figure 3.24).
Figure 3.23 Fault-messages and Monitoring window
The Monitoring window animates the tram control-diagnostics system, the traction drive control system and devices (doors, brakes, power supply circuits) condition (fault-red, event-yellow, operational-green).
0
5
10
15
20
25
30
12:1
7:03
:45
12:1
7:39
:267
12:1
8:15
:319
12:1
8:51
:521
12:1
9:27
:643
12:2
0:04
:656
12:2
0:40
:718
12:2
1:18
:763
12:2
1:54
:915
12:2
2:30
:967
12:2
3:07
:249
12:2
3:43
:331
12:2
4:20
:404
12:2
4:57
:628
12:2
5:34
:741
12:2
6:10
:783
12:2
6:46
:835
volta
ge, p
ower
V, W
-300
-200
-100
0
100
200300
400
500cu
rren
t, A
Battery voltage Input currentElectric pow er Traction current
Figure 3.24 Data analysis in the MS Excel

49
4. System evaluation
4.1. Profitability
4.1.1. Impact of vehicle average speed Profitability analysis was first used in the world for passenger transport. In the passenger transport, the passenger comfort maximization is realized by the minimization of carfare and travel-time [VIL96]. The formula to calculate prospective profitability of the designed system is as follows:
( )1 01 0
k kl lS q c t q c t t q c
v v� �
= ⋅ ⋅ ∆ = ⋅ ⋅ − = ⋅ ⋅ −� �� �
, (8)
where q - amount of passengers per year, �t - reduced travel time, c - passenger travel time cost per hour, t1 - travel time after investment, t0 - travel time before investment, v1 - speed after investment, v0 - speed before investment, lk - middle kilometrage per passenger.
0
1000
2000
3000
4000
5000
6000
7000
0 0,1 0,2 0,3 0,4 0,5 0,6 0,7 0,8 0,9 1
speed growth, km/h
tota
l sav
ing
per
year
, x
1000
EE
K
0
20
40
60
80
100
tram
sav
ing
per
year
, x
1000
EE
K
Total saving Saving per tram
Figure 4.1 Investment profitability at increased speed
The average gross income in the third quarter of 2004 was 7,021 EEK, which means that the average gross income per hour was 44 EEK. In consequence [VIL96] the costs of passenger travel time per hour is 14...15 EEK. The Statistical Office of Estonia has reported 250 million passengers per year. The proportion of trams and trolleys in the passenger transport was 28%, 70 million people (about 200,000 passengers per day). The Tram and Trolleybus Company
50
of Tallinn has reported 31 million passengers per year (approximately 85,000 people per day). An average use of trams in the traffic was 80. The number of passengers per tram was 387,500 annually (1062 passengers per day). Line-hours for all trams were 283,000. 110 passengers were transported per line-hour. An approximate kilometrage per tram was 4 million kilometers, which means that after reconstruction the average speed of trams was 14.14 km/h. Loading of trams was 17%. As reported by the City Planning Department of Tallinn on 15 June 2001, an average traveling kilometrage per passenger was 3 kilometers. Based on the analysis of the Tram and Trolleybus Company, the average speed of trams before reconstruction was 13.8 km/h and after reconstruction 14.1 km/h, this means that the difference in speeds was 0.3 km/h. The profitability of 300,000 EEK investments per tram can be calculated approximately for 11 years (Figure 4.1). In this calculation annual gross income growth and growth in passenger amount are not taken into consideration.
4.1.2. Impact of fault identification speed A simplified formula for repair time can be described as
l kt t t= + , (9) where tl – fault localization time, tk – fault elimination time. Fault localization time depends on the automatisation of the control and diagnostic process, optimization, computer-based data management, data communication networks, know-how of specialists etc. Fault elimination (repair) time depends on process automation, logistic, specialists know-how, assembly and disassemble time, adjusting time etc. The detailed formula of maintenance time calculation is
1 1
n m
li kji j
t t t= =
= +� � , (10)
where tli – fault localization time unit, tkj – fault elimination time unit. Adding to the time unit the cost vector, maintenance costs can be calculated as given in the following formula:
1 1
n m
k li i kj ji j
C t p t q= =
= +� � , (11)
where pi – cost of the fault localization time unit, qj - cost of the fault elimination time unit. The economy of maintenance costs is calculated as follows:

51
1k kC C C −∆ = − , (12) where Ci-maintenance cost before investment, Ci-1-maintenance cost after investment. Theoretically, maintenance cost can be reduced up to 20%, by using the designed control, diagnostics and supervision system.
4.1.3. Impact of investments/maintenance costs to the repairs The analysis of the existing investments and service-maintenance costs shows a decreasing trend of faults/failures (Figure 4.2). To increase the efficiency of service and maintenance, a new supervision and remote diagnostics system had to be developed and designed.
0
5000
10000
15000
20000
25000
30000
1990
1991
1992
1993
1994
1995
1996
1997
1998
1999
2000
2001
2002
2003
2004
0
200
400
600800
1000
1200
1400
1600
Failures Repairs
Investment Repair and maintenance costs
Figure 4.2 Trends of failures, investments, repairs and maintenance costs
4.2. Designed system analysis Generally, a designed system can be described as an open, flexible and modular system. Designed system is protected by two patent applications, two utility models and one industrial design solution (Table 4.1). In the system development and design different hard- and software integration problems were solved, targeted at low costs and manufacturer independent structure. It was designed and successfully tested. The developed control and diagnostic models and algorithms will increase system reliability, traffic safety, passenger comfort etc.

52
Table 4.1 Developed and designed system analysis
System Control, supervision and diagnostics system (including the onboard control and diagnostics systems, onboard supervision system (with driver HMI, positioning and passenger information)), mobile diagnostics system
Strength • 2 patent applications • 2 utility models • 1 industrial design solution • flexible and manufacturer
independent system structure • independence of higher employment
costs • reduced vandalism costs • reduced fault/failure localization costs • includes algorithms for life-time and
other analysis for better maintenance and service organization
• ergonomical and space optimal design
• multitude of wireless data communication channels, which increase diagnostics system reliability
• multitude of possible onboard data communication channels, which guarantee separation of systems with different functionality and demands on the reliability
• doubled archiving system • remote programming, configuration,
tuning and appliance, which reduces maintenance costs
• easy integration of new systems incl. multimedia solutions, which means reduced expansions costs
Weakness • missing of multimedia solutions • more qualified personnel • complex system
Opportunities • easy integration of new technologies • easy to expand • easy to reconfigure
Threats • uncertainty in the technology development
• higher employment

53
5. Future research and development The main research and development branches in the future can be complex public transport control system, traffic priority system, and realtime passenger information system at stops and distributed energy supply system (ultra capacitors etc.). The aims of the following research/development work will be: to reduce fleet and operating costs, increase line accessibility, decrease overall the public transport travel time, increase travel time punctuality and regularity, reduce emissions and energy consumption, increase passenger valuations and comfort.
5.1. Regional traffic control and supervision The designed system is flexible to integrate it to the complex traffic control system. The designed system already includes different data communication technologies, control and diagnostic capabilities, a global positioning system etc. The modularized and flexible soft- and hardware structure facilitates fast and easy integration with regional/local traffic control center over wireless broadband link or GSM network. The development of the regional or national traffic control and supervision system will simplify significantly the public transport management system, document management, planning etc. and will reduce operation costs. Among the advantages provided are: automatic data collection, reporting (about faults, passenger amount and jams), printing, analyzing. Analogous systems are widely used in the world, however they are too complex and expensive and do not consider local environment, needs and other parameters. Example of the designed prospective public transport control systems are shown in Figure 5.1.
5.1.1. Real-time passenger information The designed system can be directly integrated with a prospective real-time passenger information system. The designed system collects all the data (like location, time, vehicles faults or failures, speed, vehicle timetable) required for priority system development. It has also the modules for data communication between realtime passenger system and displays on the stops. The main tasks of the realtime passenger information system are: to increase passenger valuations and comfort. Passengers can optimize their drive routes, which means they can reduce their travel time and thus increase the surplus value. Realtime information is most valuable in the rush hour, when many passengers can choose fast alternative travel lines and get from location A to location B faster than traditionally. Also, it helps to optimize the traffic line load, reduce traveling time and increase system profitability.

54
5.1.2. Traffic signal priority Traffic signal priority system is the sub-system of regional traffic control system. The signal priority system enables us to collect traffic related data, like traffic jams, to optimize traffic lights cycles, to increase line accessibility and travel time punctuality etc.
TrainsTrolleys
WAN või MANTCP/IP
Laptop
InSQLServer
Depooinsener
Printer
Trollipark
Ethernetswitch
Ethernetswitch
Terminalserver
Depoo dispetšer Sõidukitehoolduspersonal
GSM,GPRS
GSM,GPRS modem
Laptop
InSQLServer
Depooinsener
Printer
Elektriraudtee
Ethernetswitch
Ethernetswitch
Terminalserver
Depoo dispetšer Sõidukitehoolduspersonal
GSM,GPRS
GSM,GPRS modem
Laptop
InSQLServer
Depooinsener
Printer
Trammipark
Ethernetswitch
Ethernetswitch
Terminalserver
Depoo dispetšer Sõidukitehoolduspersonal
GSM,GPRS
GSM,GPRS modem
Mobiilside operaatorid
GSM, GPRS, WLAN, ...
Sõitjad
Tallinnatransport
Ühistranspordi juhtimiskeskus
Dispetšer Dispetšer
Projektor
GPRS modem
InSQLserver
Terminalserver
Ethernet switchEthernet switch
Server
Portaalserver sõitjate jaoks
Ruuter
Laptop
InSQLServer
Depooinsener
Printer
Bussipark
Ethernetswitch
Ethernetswitch
Terminalserver
Depoo dispetšer Sõidukitehoolduspersonal
GSM,GPRS
GSM,GPRS modem
Trams
WLANtugijaam
Busses
Wayside infrastructure (WLAN / GSM / GPRS / RF communication, passenger information, traffic lights priority etc.)
Figure 5.1 Perspective public transport control system
5.2. Energy management system The main research and development branch in the future can be system integration with the distributed energy supply system (ultra capacitors etc.) for electric vehicles. Traditionally, vehicles cannot control the energy flow in power lines. During their braking period, vehicles cannot control how the generated energy is distributed between substations and other vehicle loads. Neither can they control distribution of power losses in power lines.
Traction converter
Ultracapacitor
Heating unit
Pantograph
Charging converter
Breakingresistor
Figure 5.2 Energy flow diagram in the tram

55
To control the energy consumption process in the lines and in addition reduce losses, some conceptual changes to the traditional energy supply model are needed. This change can be achieved by implementing high-speed energy storage devices, such as ultracapacitors, energy access converters (energy switches) on a vehicle board and a new control strategy that uses information technology methods and management processes (Figure 5.2). Storage devices can save energy before it is needed (before the period of actual loose coupling) and give it rapidly off to drives or the power line when needed. Power lines, power line control system, data communication networks and energy access modules put together form a system called the energy bus. An energy bus can take a form of a complete network to deliver energy to a group of energetic components. For example, the positions and needs about energy consumptions of each tram to another trams will be transferred over a data communication network. If other trams need energy in the storage device (the ultra capacitors is full), then the energy transfer process starts (Figure 5.3).
Uline1
Tramm 1 Tramm 2
E1GPS1
E2GPS2
GP
S 1
GP
S2
Uline2
Energy flow control
Figure 5.3 Structure for exchange of energy between the trams
56
Conclusion The system includes functions like diagnostics for preventive maintenance and service, recording of events and alarms, human-machine communication etc. The main results of the developed methods and system are: 1. As a result of the analysis of the existing maintenance system the methods
(questionnaires, opinion polls, patent analyses etc.) to determine the development and design range were evolved.
2. The developed multi-level and complex diagnostics system makes it possible to use and test different expert models, AI methods and algorithms. Diagnostic data duplication and archiving in the onboard PC and PLC increases the diagnostics system reliability. In addition, the use of different wireless communication networks for rapid diagnostic information transfer to the maintenance personal and dispatching centre will increase efficiency and reliability of the diagnostics system. The developed mathematical models for tram onboard systems real-time, online and offline diagnostics reduce the failure localization costs up to 30%, which reduces maintenance-repair time and traffic downtime. Theoretically, maintenance cost can be reduced up to 20%, by using the designed control, diagnostics and supervision system. The integration of tram security camera has reduced expenses of 5000...1000 EEK/tram raised from vandalism.
3. An optimal use of the computer resource by the integration of “black-box” functionality, driver HMI and GPS-based line and stops information control has reduced development costs up to 20%, as compared to conventional solutions. The developed GPS-based automatic messaging system has shown that it is more reliable and easier to make than the transit-based system. With messaging the tram driver has more time for concentrating on driving and passenger safety. The development of an optimal driver HMI model makes it possible for the tram driver to analyze more effectively and quickly and adjust the vehicle condition, enabling one to reduce the downtime up to 10%.
4. Modularity, flexibility and openness for different hard- and software solutions provides for prospective energy flow control solutions (incl. the energy storage systems integration etc), which theoretically makes it possible to reduce the energy consumption up to 20 % (using the ultra-capacitors in the braking and acceleration process). The integration of fast wireless data communication systems in the tram control and diagnostics system enables easy development of data communication and energy flow control between other trams and substations. The developed tram control and diagnostics system is ready for integration with the public transport and traffic control system. On the basis of the developed control/diagnostics

57
system and data communication networks, the energy bus concept for energy storage devices can be studied and developed.
5. Pilot tram designed and tested. One patent application and one industrial design by thesis author.
The above-mentioned considerations help boost the efficiency of train or tram transportation systems and improve the quality of travel for the passengers. The developed system has been awarded one patent application and one industrial design registered in the Estonian Patent Office.

58
References [ACH98] Achakji G. 1998. A Review of State-of-the-Art Train Control Systems
Technology. Transportation Development Centre (TDS), Transport Canada Publication No TP13105E, Project No 9126, Transport Canada File No ACD4100-17-14, 800 Rene Levesque Blvd. West, 6th Floor, Montreal, Quebec, Canada, March 1998.
[ARM88] Armano G., Solimano M. 1988. Empirical and Functional Knowledge in an Expert System for Fault Diagnosis, Artificial Intelligence for Industrial Applications, IEEE AI '88, Proceedings of the International Workshop on, 25-27 May 1988, pp. 109 - 114.
[BEN02] Bengtsson M. 2002. Condition Based Maintenance on Rail Vehicles. IDPMTR 06, 2002.
[BER04] Bertoluzzo M., Buja G., Zuccollo A. 2004. Communication Networks for Drive-by-Wire Application. EPE-PEMC 2004, Riga, Latvia, 2004.
[BID99] Bidian P., Tatar M., Cascio F., Theseider-Dupre D., Sachenbacher M., Weber R., Carlen C. 1999. Powertrain Diagnostics: A Model-Based Approach. Proceedings of ERA Technology Vehicle Electronic Systems Conference '99, Coventry, UK.
[BRU99] Chang C. S., Bruce A. G., Hampton I. M. 1999. Seamless real-time control systems: challenges for the railway industry. Computing & Control Engineering Journal Volume 10, Issue 2, April 1999, pp. 81-87.
[BUR96] Burdon I. P. 1996. The execution and administration of light-rail projects. Engineering Management Journal, Volume: 6, Issue: 1, Feb. 1996, pp. 51-59.
[CAM02] Campos F. T., Mills W. N., Graves M. L. 2002. A Reference Architecture For Remote Diagnostics And Prognostics Applications. AUTOTESTCON Proceedings, 2002 IEEE, Oct. 2002, pp. 842-853.
[CHO98] Choi H. N. 1998 A System Concept for Mobile and Stationary Teleservice Applications. Industrial Electronics Society 1998, IECON’98, Proceedings of the 24th Annual Conference of the IEEE, Vol. 4, 31 Aug.-4 Sept. 1998, pp. 2079-2083.
[COL90] Coll D. C., Sheikh A. U. H., Ayers R. G., Bailey J. H. 1990. The Communications System Architecture of the North American Advanced Train Control System. IEEE Transactions on Vehicular Technology, Vol.39, No. 3, August 1990, pp. 244-255,
[CON96] Cong M., Zhang J., Qian W. 1996. Knowledge-Based Monitoring And Diagnosis For A Flexible Assembly System. Proceedings of The IEEE International Conference on Industrial Technology, pp. 716-719.

59
[CRO03] Crossman J. A., Hong Guo, Murphey Y. L., Cardillo J. 2003. Automotive signal fault diagnostics - part I: signal fault analysis, signal segmentation, feature extraction and quasi-optimal feature selection. Vehicular Technology, IEEE Transactions on, Volume: 52, Issue: 4, July 2003, pp. 1063 - 1075.
[DEU03] Deuzkiewicz P., Radkowski S. 2003. On-Line Condition Monitoring of a Power Transmission Unit of a Rail Vehicle. Mechanical Systems and Signal Processing 17 (6), pp. 1321-1334.
[DJU03] Djurdjanovic D., Lee J., Ni J. 2003. Watchdog Agent—an infotronics-based prognostics approach for product performance degradation assessment and prediction. Advanced Engineering Informatics, Volume 17, Issues 3-4, July-October 2003, pp. 109-125.
[DUM98] Dummermuth E. 1998. Advanced diagnostic methods in process control. ISA Transactions 37, Elsevier Science Ltd., pp.79-85.
[FAB00] Nieva T., Fabri A., Benammour A. 2000. Jini technology applied to railway systems; Distributed Objects and Applications. Proceedings DOA’00 International Symposium, 21-23 Sept. 2000, pp. 251-259.
[FEN01] Fenton B., McGinnity T. M., Maguire L. P. 2001. Whither AI in test and diagnosis? AUTOTESTCON Proceedings, IEEE Systems Readiness Technology Conference, 20-23 Aug. 2001, pp. 333 – 351.
[FOX91] Foxvog D., Kurki M. 1991. Survey of Real-Time and On-Line Diagnostic Expert Systems. Real Time Systems, Proceedings of Euromicro '91 Workshop, 12-14 June 1991, pp. 61 - 69
[GEO98] GeoControl Systems, Inc., “Intelligent Diagnostic System FLIDS”, June 1998.
[GEY95] Geymayr J. A. B., Ebecken N. F. F. 1995. Fault-Tree Analysis: A Knowledge-Engineering Approach. Reliability, IEEE Transactions on, Volume: 44, Issue: 1, March 1995, pp. 37 - 45.
[GON98] Gonzalez C. A., Acosta G., Mira J., C de Prada, 1998. Knowledge based process control supervision and diagnosis: the AEROLID approach. Expert Systems With Applications 14, Elsevier Science Ltd., pp. 371-383.
[GRE92] Grelinger G., Morizet-Mahoudeaux P. 1992. A Fully Integrated Real-Time Multi-Tasking Knowledge-Based System: Application to an On-Board Diagnostic System. Artificial Intelligence for Applications, 1992, Proceedings of the Eighth Conference on, Monterey USA, 2-6 March 1992, pp. 310-316.
[HAL02] Hall S., Cockerham K., Rhodes D. 2002. What's your color? Industry Applications Magazine, IEEE Volume 8, Issue 2, March-April 2002, pp. 50 - 54.

60
[HAR01] Hartrum T. C., Nonnweiler J. C. 2001. Software System Integration Methodology using Formal Specifications. Circuits and Systems 2001, MWSCAS 2001, Proceedings of the 44th IEEE 2001 Midwest Symposium on Volume: 2, 14-17 Aug. 2001, pp. 674-677.
[HAX00] Haxthausen A. E., Peleska J. 2000. Formal Development and Verification of a Distributed Railway Control System. IEEE Transactions on Software Engineering Vol. 26, No. 8, pp. 687-701.
[HAX99] Haxthausen A. E., Peleska J. 1999. Formal Development and Verification of a Distributed Railway Control Systems. FM’99-Formal Methods, World Congress on Formal Methods in the Development of Computing Systems, Toulouse, France, September 20-24, Proceedings, Volume I.
[HED04] Heddebaut M., Deniau V., Adouane K. 2004. In-Vehicle WLAN Radio-Frequency Communication Characterization. IEEE Transactions on Intelligent Transportation Systems, Vol.5, No.2, June 2004, pp. 114-121.
[HÖR99] Meyer zu Hörste M., Schnieder E. 1999. Modelling and Simulation of Train Control Systems using Petri Nets, FM’99-Formal Methods, World Congress on Formal Methods in the Development of Computing Systems, Toulouse, France, September 20-24, Proceedings, Volume I.
[IEE992] IEEE Std 1473-1999, IEEE Standard for Communications Protocol Aboard Trains. The Institute of Electrical and Electronics Engineers, Inc., 345 East 47th Street, New York, NY 10017-2394, USA, 1999, Approved 18 March 1999 IEEE-SA Standards Board.
[ISE02] Isermann R., Schwarz R., Stölzl S. Fault-Tolerant Drive-by-Wire Systems. IEEE Control Systems Magazine, October 2002
[ISE04] Isermann R. 2004. Model-Based Fault Detection and Diagnosis-Status and Applications. 16th IFAC Symposium on Automatic Control in Aerospace, 14-18 June 2004, St. Petersburg, Russia.
[ISE93] Isermann R. 1993. Fault Diagnosis of Machines via Parameter Estimation and Knowledge Processing - Tutorial Paper. Automatica, Vol. 29, No. 4, Great Britain, pp. 815-835.
[ISE97] Isermann R. 1997. Supervision, Fault-Detection, and Fault-Diagnosis Methods- An Introduction. Control Engineering Practice, Vol. 5, No. 5, Elsevier Science Ltd., pp.639-652.
[ISH04] Ishida K., Kitabayashi H., Nagasu M., Bekki K. 2004. New Train Control and Information Services Utilizing Broadband Networks. Hitachi Review, Volume 53, No. 1, February 2004
[IWA00] Iwamasa M. 2000. Concept design visualization - a component-based approach. Systems, Man, and Cybernetics, 2000 IEEE International Conference on Volume 2, 8-11 Oct. 2000, pp. 1192 - 1197.

61
[JAN98] Jansen L., Meyer zu Hörste M., Schnieder E., CPN'98, First Workshop and Tutorial on Practical Use of Coloured Petri Nets and Design/CPN, June 10-12 1998.
[KAV02] Venkatasubramanian V., Rengaswamy R., Kavuri S. N., Yin K. 2002. A review of process fault detection and diagnosis Part III: Process history based methods. Computers and Chemical Engineering 27 (2003), Elsevier Science Ltd., pp. 293-311.
[KIR01] Kirrmann H., Zuber P. A. 2001, THE IEC/IEEE TRAIN COMMUNICATION NETWORK, IEEE MICRO, March/April 2001.
[KOO01] Koopman P., Chakravarty T. 2001. Analysis of the Train Communication Network Protocol Error Detection Capabilities. http://www.tsd.org/papers/, 25 February 2001.
[KOO02] Koopman P. 2002. Train Communication Network & FlexRay. Distributed Embedded Systems, 21 October 2002.
[KRI98] Kriesel W., Heimbold T., Telschow D. 1998. Bustechnologien für die Automation, Vernetzung, Auswahl und Anwendung von Kommunikationssystemen. Hüthig Verlag Heidelberg, 450 pages.
[LAR02] Larsson J. E. 2002. Diagnostic Algorithms Based on Multilevel Flow Models. Proceedings of the 19th Workshop of the Swedish Artificial Intelligence Society, Ronneby, Sweden
[LIU03] Liuyun, Zhangzhenjiang. 2003. A New Train Real-time Dispatching System. IEEE 2003, pp. 3332-3335.
[MCD95] McDonald M., Richards A. 1995. 3-vehicle health monitoring on the Docklands Light Railway. Advanced Condition Monitoring Systems for Railways, IEE Colloquium, 4 Oct 1995, Pages: 4/1 - 4/6.
[MCG01] Fenton B., McGinnity T. M., Maguire L. P. 2001. Fault Diagnosis of Electronic Systems Using Intelligent Techniques: A Review. Systems, Man and Cybernetics, Part C, IEEE Transactions on, Volume: 31, Issue: 3, Aug. 2001, pp. 269 – 281.
[MCG98] McGean T. J. 1998. Developing IEEE Rail Transit Vehicle Standards. Railroad Conference, Proceedings of the 1998 ASME/IEEE Joint, 15-16 April 1998, pp. 95 - 105.
[MUR03] Murphey Y. L., Crossman J. A., Chen Z. H., Cardillo J. 2003. Automotive Fault Diagnosis-Part II: A Distributed Agent Diagnostic System. IEEE Transactions on Vehicular Technology, Vol. 52, No.4, July 2003, pp. 1076-1098.
[NIE00] Nieva T. 2000. NePESM : New Paradigms for Embedded Systems Management. Proceedings of Swiss Priority Programme for Information and Communications Structures - Closing Conference, Fribourg, Switzerland, January 2000, pp. 66-68.
[NIE99] Nieva T. 1999. Automatic Configuration for Remote Diagnosis and Monitoring of Railway Equipments. Proceedings of Applied Informatics-AI’99, Innsbruck (Austria), February 1999.

62
[NIL90] Nilsson E. G., Nordhagen E. K., Oftedal G. 1990. Aspects of systems integration. Systems Integration '90, Proceedings of the First International Conference on 23-26 April 1990, pp. 434 - 443.
[POM90] Pomeroy B. D., Spang H. A., Dausch M. E. 1990. Event-based architecture for diagnosis in control advisory systems. Artificial intelligence in Engineering, Vol. 5, No. 4, Computational Mechanics Publications.
[PRI89] Price C., Hunt J. 1989. Using Qualitative Reasoning for Diagnostic Applications. Expert Systems for Fault Diagnosis in Engineering Applications, IEE Colloquium, 20 Apr 1989, pp. 8/1 - 8/3.
[PRO99] Provan G., Chen Y-L. 1999. Model-Based Diagnosis and Control Reconfiguration for Discrete Event Systems: An Integrated Approach. Proceedings of the 38th Conference on Decision & Control, Phoenix, Arizona USA, December 1999, pp. 1762-1768.
[REI91] Isermann R., Reiss T., Wanke P. 1991. Model based fault diagnosis of machine tools. Decision and Control, Proceedings of the 30th IEEE Conference, vol.3, 11-13 Dec. 1991, pp. 2574 - 2579.
[REN02] Venkatasubramanian V., Rengaswamy R., Kavuri S. N. 2002. A review of process fault detection and diagnosis Part II: Quantitative models and search strategies. Computers and Chemical Engineering 27 (2003), Elsevier Science Ltd., pp. 313-326.
[ROS97] User requirements for networked applications in the railway environment. Railway Open System Interconnection Network-ROSIN, http://www.labs.it/rosin/docs/d031v22.pdf
[SAF94] Saffer H. G., Wright T. 1994. The Development of LRT Signal Control Techniques for the Sheffield Supertram System. Conference Publication No. 391, IEE, Road Traffic Monitoring and Control, pp. 89 - 92.
[SEK92] Sekine Y., Akimoto Y., Kunugi M., Fukui C., Fukui S. 1992. Fault diagnosis of power systems. Proceedings of the IEEE, Volume: 80, Issue: 5, May 1992, pp. 673 - 683.
[SEN99] Sen A. K., Murty A. S. R. 1999. Parallel processing application in traction motor fault diagnosis. Electric Power Systems Research 52 (1999), Elsevier Science Ltd., pp. 241-249.
[SEO04] Seow K. T., Pasquier M. 2004. Supervising Passenger Land-Transport Systems. IEEE Transactions on Intelligent Transportation Systems, Vol.5, No.3, September 2004, pp. 165-176.
[SHE90] Sheikh A. U. H., Coll D. C., Ayers R. G., Bailey J. H. 1990. ATCS: Advanced Train Control System radio data link design considerations. Vehicular Technology, IEEE Transactions, Volume: 39, Issue: 3, Aug. 1990, pp. 256 - 262.
63
[SKO95] Skormin V. A., Apone J. 1995. On-Line Diagnostics of a Variable Displacement Pump of a Flight Actuation System. Aerospace and Electronics Conference, NAECON 1995, Proceedings of the IEEE 1995 National, vol.1, pp. 503-510.
[SZC97] Szczesny R., Piquet H., Kurzynski P. 1997. Fault Detection and Diagnosis in the Electric Drives. 7th European Conference on Power Electronics and Applications, Volume 2, 8-10 September 1997, Tronheim, Norway, EPE Association, pp. 995-1000.
[SUL03] Sullivan T., Open Architecture Train ControlTM, 5th International Conference on Communications Based Train Control, May 7, Washington, DC, 2003
[SWA04] Swanson J. D. 2004. Advanced Light Rail Vehicle Communication Systems Design. Rail Conference, Proceedings of the 2004 ASME/IEEE Joint, 6-8 April 2004, pp. 213 - 219.
[ZHA02] Zhao Y. 2002. Telematics: Safe and Fun Driving. IEEE Intelligent Systems January/February, Vol. 17, No. 1, IEEE, pp.10-14.
[ZHA93] Zhang W. -B. 1993. Vehicle Health Monitoring for AVCS Malfunction Management. Vehicle Navigation and Information Systems Conference, Proceedings of the IEEE-IEE, 12-15 Oct. 1993, pp. 501 - 504.
[THI00] Thies H., Wik A. 2000. SBB’s FSS Pilot Project - The First Application of ERTMS/ETCS Level 2 Worldwide, ERTMS/ETCS, SIGNAL+DRAHT 9 / 2000, pp. 92.
[TOG96] Toguyeni A. K. A., Craye E., Gentina J. C. 1996. A framework to design a distributed diagnosis in FMS. Systems, Man, and Cybernetics, IEEE International Conference, vol.4, 14-17 Oct. 1996, pp. 2774 - 2779.
[TRA99] TrainCom, Integrated Communication System for Intelligent Train Applications, Contract No: IST-1999-20096, Project Presentation, http://www.traincom.org/documents/presentation.pdf
[ULI95] Ulieru M. 1995. Approaching Intelligent Control System Design. Systems, Man and Cybernetics, “Intelligent Systems for the 21st Century”, IEEE International Conference, Vol. 1, 22-25 Oct. 1995, pp. 563-568.
[UMT00] Enabling UMTS / Third Generation Services and Applications, Report No. 11, UMTS Forum, First edition, revision 1.0, www.umts-forum.org, October 2000.
[WEG00] Nieva T., Wegmann A. 2000. A Conceptual Model for Remote Data Acquisition Systems. ER2000 Conference, LNCS 1920, Springer-Verlag Berlin Heidelberg 2000, pp.354-368.
[WEI98] Weiss R., Steger C. 1998. Design and implementation of a real-time multi-agent system. Electrotechnical Conference, MELECON 98, 9th Mediterranean, vol.2, 18-20 May 1998, pp. 1269 - 1273.

64
[VEN02] Venkatasubramanian V., Rengaswamy R., Yin K., Kavuri S. N. 2002. A review of process fault detection and diagnosis Part I: Quantitative model-based methods. Computers and Chemical Engineering 27 (2003), Elsevier Science Ltd., pp. 293-311.
[WHU99] Hu W., Schroeder M., Starr A. G. 1999. A Knowledge-Based Real-Time Diagnostic System for PLC Controlled Manufacturing System. Systems, Man, and Cybernetics, IEEE SMC '99 Conference Proceedings. 1999 IEEE International Conference, vol.4, 12-15 Oct. 1999, pp. 499 - 504.
[VIL96] Villemi M. 1996. Transpordiökonoomika, Majandusraamat 2-33, Külim, Tallinn, 72 pages
[WOH99] Wohlschläger R., EURO-Matsushita Electric Works AG, IEC1131-3 Function Blocks support remote application programming via modem, Application example, PLCOpening, April 1999.
[WOL02] Wolfram A., Isermann R. 2002. Component based tele-diagnosis approach to a textile machine. Control Engineering Practice 10 (2002), Elsevier Science Ltd., pp. 1251-1257.
[XIA88] Xiaojun Z., Shuzi Y., Anfa Z., Hanmin S. 1988. A Knowledge-Based Diagnosis System for Automobile Engines. Systems, Man, and Cybernetics, Proceedings of the 1988 IEEE International Conference on Volume: 2, Year: 8-12 Aug 1988, pp. 1042-1047.
[XIA95] Xu C. S., Xu Z. M., Xiao P. D., Zhou Z. Y., Liu S. X. 1995. An object-oriented expert system tool for fault diagnosis. Instrumentation and Measurement Technology Conference, IMTC/95. Proceedings. 'Integrating Intelligent Instrumentation and Control’, IEEE, 24-26 April 1995, pp. 614-618.
[YAN05] Yan J., Lee J., Pan Y. -C. 2005. Introduction of watchdog prognostics agent and its application to elevator hoistway performance assessment. Journal of the Chinese Institute of Industrial Engineers, Vol. 22, No. 1, pp. 56-63.
[YOO01] Yoo S. P., Lee D. Y., Son H. I. 2001. Design and verification of supervisory controller of high-speed train. Industrial Electronics, 2001. Proceedings. ISIE 2001. IEEE International Symposium, Vol. 2, 12-16 June 2001, pp. 1290 – 1295.
[YOU04] You S., Jalics L. 2004. Hierarchical Component-Based Fault Diagnostics for By-Wire Systems. SAE Technical Paper Series 2004-01-0285, SAE International, 2004 SAE World Congress, March 8-11, Detroit, Michigan, USA.
[AUG02] Augusiak A., Kamrat W. 2002. Automated Network Control and Supervision. IEEE Computer Applications in Power, IEEE, pp. 20-23.
[NYB99] Nyberg M. 1999. Automatic design of diagnosis systems with application to an automotive engine. Control Engineering Practice 7 (1999), Elsevier Science Ltd., pp. 993-1005.

65
Abstract This thesis proposes the analysis of control- and operation diagnostics problems of trams and development of new methods, models and systems. Thesis describes the faults and failures influence to the traffic, their causes, maintenance system efficiency etc. The thesis includes classification and analysis of existing diagnostic methods, algorithms, rail vehicles onboard systems and functions. The proposed new methodology is based on the system integration object-oriented approach. Method includes on the design phase hybrid observer-expert-statistic based system and their functions analysis. It is designed new models for tram control, diagnosis and supervision to increase the system reliability, safety, security and passenger comfort. The proposed methodology was successfully applied in the pilot tram of Tallinn Tram and Trolleybus Company Ltd. for new onboard control-diagnostic system, onboard supervision system and mobile diagnostic system design. On the designed system is submitted one patent applications and industrial design solution.

66
Kokkuvõte Käesolevas doktoritöös käsitletakse elektritrammide juhtimis- ja diagnostika probleeme. Analüüsitakse seniseid trammi hooldus- ja remondisüsteeme, mille alusel määratakse kindlaks süsteemide põhiprobleemid. Esitatakse rööbassõidukite juhtimis- ja diagnostika süsteemide, meetodite ja algoritmide liigitus. Kirjeldatakse välmitud trammi pardaseadmete diagnostika, trammijuhi kasutajaliidese, GPS-positsioneerimise ja infotabloode juhtimise funktsioone, mudeleid ja algoritme. Töö lõpus analüüsitakse süsteemi tasuvust ja käsitletakse perspektiivseid uurimis- ja teadustöö valdkondi.
Töös on selgitatud Tallinna trammide hoolduskulude vähendamise võimalusi. Selleks on koostatud 10 aasta jooksul kogutud andmete põhjal trammide rikete analüüs, uuritud nende tekkepõhjusi jne.
Doktoritöö tähtsaimaks tulemuseks on originaalse skeemilahendusega ja mudelitega trammi juhtimis-, talitlusjärelevalve ja diagnostikasüsteemi väljatöötamine Tallinna Trammi- ja Trollibussikoondisele. Uusimal tehnoloogial põhinev süsteem on riist- ja tarkvaraliselt paindlik, universaalne, kohandatav väheste muudatustega ühistranspordis kasutatavatele nii rööbastega kui ka rööbasteta sõidukitele.
Välmitud süsteemi kohta on esitatud 1 patenditaotlus ja 1 tööstusdisainlahendus.

67
List of Publications 1. A. Rosin, J. Laugis, T. Lehtla. Using of Industry Automation Software
and Hardware in Education and Training. 4th International Scientific Colloquium CAx Techniques Bielefeld, 13-15 September, 1999.
2. A. Rosin, J. Laugis, T. Lehtla. Mechatronics in initial vocational training. The 7th Biennial Conference on Electronics and Microsystem Technology "Baltic Electronics Conference": BEC 2000: October 8-11, 2000, Tallinn, Estonia: conference proceedings. Tallinn, 2000, 9985-59-179-8, pp. 225-228.
3. A. Rosin, J. Laugis, T. Lehtla. Experimental Sand-filter Systems in Tallinn Water Treatment Plant. ICP Conference, Utrecht, 10…11 October 2000.
4. A. Liiva, A. Rosin, Prof. J. Steinbrunn. Teleservice and Monitoring Via Internet Using a Webcamera and HMI Software, The 3rd Research Symposium of Young Scientists, Actual problems of electrical drives and industry automation. Tallinn, 2001, 9985-69-020-6, pp. 85-88.
5. R. Kruus, A. Rosin, Prof. J. Steinbrunn. Lift monitoring and process control over PLC integrated HTML server, The 3rd Research Symposium of Young Scientists, Actual problems of electrical drives and industry automation. Tallinn, 2001, 9985-69-020-6, pp. 89-92.
6. A. Rosin. GSM and Internet based Industry Automation Systems in the training process, The 3rd Research Symposium of Young Scientists, Actual problems of electrical drives and industry automation. Tallinn, 2001, 9985-69-020-6, pp. 96-100.
7. A. Rosin, T. Lehtla. Experimental Water Systems Control and Monitoring via Multipoint Interface. BEC 2002: proceedings of the 8th Biennial Baltic Electronics Conference: October 6-9, 2002, Tallinn, Estonia. Tallinn, c2002, 9985-59-292-1, pp. 397-400.
8. T. Möller, A. Rosin. Data communication with InTouch application over Windows DDE. The 4th Research Symposium of Young Scientists "Actual Problems of Electrical Drives and Industry Automation" : Tallinn, Estonia, May 17-21, 2003. Tallinn, 2003, 9985-69-027-3, pp. 75-76.
9. T. Jalakas, A. Rosin, Information System of Modernized KT4 prototype tram, NorFA Summer Seminar, Proceedings on Nordic Network for Multi Disciplinary Optimised Electric Drives, Tallinn, Estonia, June 4th-6th 2004, 4 pages;
10. T. Möller, A. Rosin, GPS based messaging for tram, NorFA Summer Seminar, Proceedings on Nordic Network for Multi Disciplinary Optimised Electric Drives, Tallinn, Estonia, June 4th-6th 2004, 2 pages.;
11. A. Rosin, M. Lehtla, T. Möller. Intelligent Control and Diagnostics System for Tallinn Trams, In: EPE-PEMC 2004 11th International

68
Power Electronics and Motion Control Conference. Riga, Latvia: Riga Tech. Univ, 2004. Vol.6. p. 185-188
12. E. Pettai, J. Laugis, T. Lehtla, J. Joller, A. Rosin, Distributed energy supply system for electric vehicles, In: EPE-PEMC 2004 11th International Power Electronics and Motion Control Conference. Riga, Latvia: Riga Tech. Univ, 2004. Vol.6. p. 6-221.
13. �. �������, �. ����, �. �����, �. �����, �. ����� "�� ����� ��������� ������������� � ������ ����������� ! ������� "������#�$�� �����������%���� ������ ����������� ���"������ �����". Teadusajakiri " ���i&�� �����������"i��", Ukraina, Kiiev, 2004.
14. J. Laugis, T. Lehtla, E. Pettai, J. Joller, A. Rosin, M. Lehtla, D. Vinnikov, Modernisation of Trams in Estonia, UEES'04, 24-29. September 2004, Alushta, The Crimea, Ukraine
15. A. Rosin, Pettai, Lehtla, Development of Control and Diagnostics System for Tallinn Trams, BEC 2004: proceedings of the 9th Biennial Baltic Electronics Conference: October 3-6, 2004, Tallinn, Estonia. Tallinn, c2004, 9985-59-462-2, pp. 327-330.
16. A.Rosin, Analyse of control- and diagnostics problems of trams and development of new systems and methods, 2nd International Symposium „Topical Problems of Education in the Field of Electrical and Power Engineering“ Kuressaare, 17 – 22 January, 2005
Intellectual property 1. Patent application “Energy flow controller for vehicle system”; The
Estonian Patent Office, reg. nr.0424; Applicant: Tallinn University of Technology; Authors: Elmo Pettai, Juhan Laugis, Tõnu Lehtla, Jüri Joller, Argo Rosin; Date: 31.07.2002
2. Industrial design solution “Control Panel - Juhtpult”; The Estonian Patent Office, reg. nr. 00686; Applicant Tallinn University of Technology; Authors: A. Rosin, E. Pettai, T. Jalakas, P. Aas; Validity: 31.07.2002.... ...31.07.2007.

69
LISA / ANNEX 1
ELULOOKIRJELDUS 1. Isikuandmed Ees- ja perekonnanimi: Argo Rosin Sünniaeg ja –koht: 09.08.1972, Tallinn Kodakondsus: eestlane Perekonnaseis: vabaabielus Lapsed: 2 poega 2. Kontaktandmed Aadress: Tedre 27-18, 11311, Tallinn Telefon: (+372) 52 903 05 E-posti aadress: [email protected] 3. Hariduskäik Õppeasutus (nimetus lõpetamise ajal)
Lõpetamise aeg
Haridus (eriala/kraad)
Tallinna Tehnikaülikool 1998 tehnikateaduste magister, elektriajamid ja jõuelektroonika
Tallinna Tehnikaülikool 1996 diplomeeritud insener, robotitehnika
Tallinna Polütehnikum 1991 elektroonikatehnik, elektronarvutid, -seadmed ja -riistad
Tallinna 4. Keskkool 1987 põhiharidus 4. Keelteoskus (alg-, kesk- või kõrgtase)
Keel Tase Saksa Kõrgtase Inglise Kesktase Vene Kesktase Soome Kesktase 5. Täiendõpe
Õppimise aeg Õppeasutuse või muu organisatsiooni nimetus 2004 TTÜ sisekoolituskursus teemal “Suhtlustreening”, 14 h 2003 TTÜ sisekoolituskursus teemal “Projektijuhtimine”, 40 h 2003 TTÜ sisekoolituskursus teemal “Intellektuaalomandi ja
patendinduse alused”, 40 h 2002 Täienduskoolituse põhikursus teemal “Industrial SQL
Server”, firmas Klinkmann, Helsingi, Soome, 16 h
70
2000 Täienduskoolituskursus teemal “GSM-traadita andmeside”, firmas Klinkmann, Tallinn, Eesti, 8 h
2000 Täienduskoolituse kursus edasijõudnutele “Talitlusjärelevalve tarkvara InTouch”, Kaunase Tehnikaülikool, Kaunas, Leedu, 40 h
2000 Seminar teemal “Innovatsioon: andmebaasid, internet ja GSM süsteemide integreerimine ettevõtte juhtimisse”, Klinkmann, Tallinn, 8 h
1997 Täienduskoolituskursus teemal “Uusi nõudeid elektripaigaldiste projekteerimises ja käidus”, Tallinna Tehnikaülikool, Eesti
1996 Entwicklung einer Experimentiereinrichtung zur Untersuchung eines Industrie-Vertikal-Knickarm-Roboters in einem Flexiblen Automatisierungssystem mit Prozessvisualisierung, Kempteni Rakenduskõrgkool, Saksamaa
1996 Täienduskoolituse kursus algajatele “Talitlusjärelevalve tarkvara InTouch”, firmas Klinkmann, Helsinki, Soome, 16 h
1995 Kreuzachsentisch mit bürstenlosen Servoantrieben und mit dem Einsatz einer Positionierbaugruppe IP246 der SPS - SIMATIC S5, Kempteni Rakenduskõrgkool, Saksamaa
1994 - 1995 Hochregallager Entwicklung und Programmierung, Kempteni Rakenduskõrgkool
1994 Metalliteolisuuden automaatioprojekteihin liittyvät suunnitelutyöt AutoCad R12 Windows-ohjelmistolla sekä Sigrapf - ET - ohjelmistolla / WS 30 työasemalla
6. Teenistuskäik Töötamise aeg Ülikooli, teadusasutuse või muu
organisatsiooni nimetus Ametikoht
1998 - Tallinna Tehnikaülikool teadur 1998 - 2001 AS Contactus peaautomaatik 1996 Fachhochschule Kempten - Neu-Ulm insener 1995 - 1997 Tallinna Tehnikaülikool insener 1994 Siemens OY spetsialist 7. Teadustegevus 2001-2003 ETF uurimistoetus G4852 “Elektriajamite ja
jõupooljuhtmuundurite parameetrite diagnostika talitluse tõhustamiseks ja töökindluse suurendamiseks”, teema täitja, (01.01.01 - 31.12.03)

71
2004 HM sihtfinantseerimine T002 “Elektritranspordi ajami- ja automaatikasüsteemid”, teema täitja, (01.09.04 - 31.12.04)
2002-2004 ESTAG arendustoetus 245F “Elektritranspordi veoajamid, automaatika- ja infosüsteemid”, teema täitja, (15.05.02 - 08.03.04)
2003-2007 HM sihtfinantseerimine T513 “Energiamuundus- ja -vahetusprotsesside uurimine elektriajamite ja pooljuhtmuundurite jõuvõrkudes”, teema täitja, (01.01.03 - 31.12.07)
1999-2001 ESTAG arendustoetus 920F “Trammide elektri-, signalisatsiooni-, andmeside- ja infosüsteemide pilootprojekt”, teema täitja, (29.06.99 - 31.12.01)
2002 Siseriiklik leping 202L “Trammide elektriajamite ja jõumuundurite moderniseerimine”, teema täitja, (01.01.02 - 31.12.02)
2001-2002 Siseriiklik leping 105L “Trammide veoajamite rekonstrueerimine”, teema täitja, (18.01.01 - 30.06.02)
8. Kaitstud lõputööd
• Laboritöö juhendi ja protsessi visualiseerimise väljatöötamine paindjuhtimissüsteemis “FLAUSY” vertikaalse liigendkäega robotile, (Dipl. Eng)
• Programmeeritavad kontrollerid, (M. Sc.)
9. Teadustöö põhisuunad
• Rööbassõidukite elektri-, automaatika- ja infosüsteemide juhtimis- ja diagnostika probleemide analüüs ning uute meetodite ja süsteemide välmimine
10. Teised uurimisprojektid
• Liiva- ja söefiltrite katsestendi modelleerimine ja välmimine veepuhastusprotsesside uurimiseks
Kuupäev: 28.05.2005

72
CURRICULUM VITAE 1. Personal information Name: Argo Rosin Place and date of birth: 09.08.1972, Tallinn Citizenship: Estonian Marital status: unregistered marriage Children: 2 sons 2. Contact information Address: Tedre 27-18, 11311, Tallinn Telephone: (+372) 52 903 05 E-mail: [email protected] 3. Education Institution
Graduation date
Education
Tallinn University of Technology
1998 M. Sc., Electrical Drives and Power Electronics
Tallinn University of Technology
1996 Dipl. Eng, Robotics
Tallinn Polytechnic School
1991 Technician of electronics, Computer Techniques
Tallinn Secondary School No 4
1987 Basic
4. Languages
Language Level German High English Middle Russian Middle Finnish Middle 5. Special Courses
Date Organisation 2004 “Communication training”, Tallinn University of
Technology 2003 “Project Management”, Tallinn University of Technology 2003 “Basics of Patents and intellectual property”, Tallinn
University of Technology 2002 “Industrial SQL Server”, Klinkmann OY, Helsinki, Finland 2000 “GSM-Wireless Communication”, Klinkmann Eesti AS,
Tallinn, Estonia

73
2000 “InTouch Advanced Course”, Kaunas University of Technology, Kaunas, Lithuania
2000 “Innovation: databases, Internet and GSM systems integration in company management”, Klinkmann Eesti AS, Tallinn
1997 “New demands on electrical design, installation and operation”, Tallinn University of Technology
1996 “Entwicklung einer Experimentiereinrichtung zur Untersuchung eines Industrie-Vertikal-Knickarm-Roboters in einem Flexiblen Automatisierungssystem mit Prozessvisualisierung”, Kempten University of Applied Science, Germany
1996 “InTouch Basic Course”, Klinkmann OY, Helsinki, Finland 1995 “Kreuzachsentisch mit bürstenlosen Servoantrieben und mit
dem Einsatz einer Positionierbaugruppe IP246 der SPS - SIMATIC S5”, Kempten University of Applied Science, Germany
1994 - 1995 “Hochregallager Entwicklung und Programmierung”, Kempten University of Applied Science, Germany
1994 “Metalliteolisuuden automaatioprojekteihin liittyvät suunnitelutyöt AutoCad R12 Windows-ohjelmistolla sekä Sigrapf - ET - ohjelmistolla / WS 30 työasemalla”, SIEMENS OY, Espoo, Finland
6. Professional Employment
Date Organisation Position 1998 - Tallinn University of Technology Researcher 1998 - 2001 AS Contactus Project Manager 1996 Kempten University of Applied Science Engineer 1995 - 1997 Tallinn University of Technology Engineer 1994 Siemens OY Specialist 7. Scientific Work 2003-2007 T513 Energy conversion and exchange processes in power
networks of electrical drives and semiconductor converters, target finance-based main topic
2004 T002 Drive and automation for electricity-driven vehicles, Funded by the Ministry of Education and Research
2002-2004 245F Traction drives, automation and information systems, Enterprise Estonia support contract
2001-2003 G4852 Diagnostics of electrical drives and power semiconductor converters for improvement of operation and reliability, Estonian Science Foundation grant

74
2002 202L Modernisation of electrical drives and power converters of trams, Contract
2001-2002 105L Reconstruction of tram traction drives, Contract
1999-2001 920F Trams electrical, signalisation, communication, information systems pilot project, Enterprise Estonia support contract
8. Theses
• Composing Instruction of Laboratory Work and Process Visualisation for Vertical Articulated Arm Robot in the Flexible Automation System “FLAUSY”, (Dipl. Eng)
• Programmable Logic Controllers, (M. Sc.)
9. Main Areas of Scientific Work
• Electrical Rail Vehicle board systems control- and operation diagnostics problems analysis and development of new methods and systems
10. Other Research Projects
• Experimental system modelling and design for sand and carbon filters research in the water treatment processes
Date: 28.05.2005