Control of Volatile Organic Compound (VOC) Air Pollutants
192
Control of Volatile Organic Compound (VOC) Air Pollutants Paige H. Hunter Dissertation submitted to the Faculty of the Virginia Polytechnic Institute and State University in partial fulfillment of the requirements for the degree of Doctor of Philosophy in Chemical Engineering S. Ted Oyama, Chair William L. Conger Leonard K. Peters Raymond B. Reneau Charles Hagedorn June 1, 2000 Blacksburg, Virginia Keywords: Air Pollution Control, Volatile Organic Compounds, VOC, Ozone, Catalyst, Control Technologies
Transcript of Control of Volatile Organic Compound (VOC) Air Pollutants

Control of Volatile Organic Compound(VOC) Air Pollutants
Paige H. Hunter
Dissertation submitted to the Faculty of the Virginia Polytechnic Instituteand State University in partial fulfillment of the requirements for the degree
of
Doctor of Philosophy in
Chemical Engineering
S. Ted Oyama, ChairWilliam L. CongerLeonard K. Peters
Raymond B. ReneauCharles Hagedorn
June 1, 2000Blacksburg, Virginia
Keywords: Air Pollution Control, Volatile Organic Compounds, VOC,Ozone, Catalyst, Control Technologies

ii
Control of Volatile Organic Compound (VOC) Air Pollutants
Paige H. Hunter
(ABSTRACT)
A variety of methods exist to remove volatile organic compound(VOC) air pollutants from contaminated gas streams. As regulatory andpublic opinion pressures increase, companies are searching for moreeffective methods to control these emissions. This document is intended as aguide to help determine if existing systems are adequate and to provideadditional information to improve the efficiency of the systems. It exploresconventional methods of controlling VOC emissions, as well as innovativetechnologies including membrane separation, plasma destruction, and ozonecatalytic oxidation. The conventional technologies covered includecondensation, adsorption, absorption (or scrubbing), thermal incineration,flaring, catalytic incineration, and biofiltration. Each chapter includes adescription of the technology, a discussion of the types of systems available,notes on the design of the system, economic estimates, an explanation ofpotential problems, and a list of considerations for installation andmaintenance concerns. The final chapter is dedicated to the preparation andcharacterization of metal catalysts which were developed to improve thereaction rate of VOCs using ozone as an oxidant.

iii
For family and friends who have supported, encouraged, and tolerated methrough this project.

iv
Acknowledgements
It is with pleasure that I express my appreciation to colleagues,friends, and family that have helped me throughout this project. Inparticular, my husband, Mark, has been far more than the "patient andunderstanding" partner, doing whatever was needed, but, more importantly,demonstrating endless tolerance. James McKenna prepared much of theartwork for Chapters 3 through 10. Corey Reed assisted in collecting andanalyzing data for Chapter 11, and Doo-Hwan Lee completed the surfacearea measurements presented in that chapter. Dr. Ted Oyama has been anexcellent guide and mentor. Rhonda Dotson has taken on a patientcounselor role, gently asking about my progress and listening to myfrustrations. Mark Furgurson has been a wonderful source ofencouragement throughout the process and has routinely taken on additionalresponsibilities so that I could have more time to concentrate on writing andattending classes. But this document would never have been possiblewithout Don Shepherd and the other members of the Roanoke RegionalOffice of the Virginia Department of Air Pollution Control, who instilled inme a deep commitment to air quality and took the time to teach me aboutpollution control systems and regulations.

v
Table of Contents
Chapter 1 Introduction___________________________________________________ 1
Chapter 2 Overview of Technologies for Reduction of VOCs ____________________ 2
Methods of VOC Control ____________________________________________ 2
Condensation _____________________________________________________ 3
Adsorption _______________________________________________________ 3
Absorption / Scrubbing______________________________________________ 4
Thermal Incineration _______________________________________________ 4
Catalytic Incineration _______________________________________________ 5
Flaring___________________________________________________________ 5
Biological Treatment _______________________________________________ 5
Membrane Separation_______________________________________________ 6
UV Treatment_____________________________________________________ 6
Catalytic Ozone Oxidation ___________________________________________ 6
Comparison of Technologies _________________________________________ 6
References _______________________________________________________ 9
Chapter 3 Condensation ________________________________________________ 13
Technology Description ____________________________________________ 13
Types of Condensers ______________________________________________ 14
Condenser System Design __________________________________________ 17
Economic Estimates _______________________________________________ 20
Potential Problems ________________________________________________ 23
Installation, Operation, and Maintenance Considerations __________________ 23
Chapter 4 Adsorption __________________________________________________ 28
Technology Description ____________________________________________ 28
Types of Adsorption Systems _______________________________________ 34
Adsorption System Design__________________________________________ 36
Economic Estimates _______________________________________________ 39
Potential Problems ________________________________________________ 43
Installation, Operation, and Maintenance Considerations __________________ 44
References ______________________________________________________ 46

vi
Chapter 5 Absorption __________________________________________________ 49
Technology Description_____________________________________________ 49
Types of Absorption Systems ________________________________________ 50
Absorption System Design __________________________________________ 56
Economic Estimates________________________________________________ 67
Potential Problems _________________________________________________ 69
Installation, Operation, and Maintenance Considerations ___________________ 71
References _______________________________________________________ 75
Chapter 6 Thermal Incineration __________________________________________ 79
Technology Description_____________________________________________ 79
Types of Thermal Incineration Systems ________________________________ 81
Thermal Incinerator System Design ___________________________________ 84
Economic Estimates________________________________________________ 89
Potential Problems _________________________________________________ 91
Installation, Operation, and Maintenance Considerations ___________________ 93
References _______________________________________________________ 95
Chapter 7 Flaring _____________________________________________________ 99
Technology Description_____________________________________________ 99
Types of Flares___________________________________________________ 101
Flare Design_____________________________________________________ 101
Economic Estimates_______________________________________________ 103
Potential Problems ________________________________________________ 109
Installation, Operation, and Maintenance Considerations __________________ 110
References ______________________________________________________ 111
Chapter 8 Catalytic Incineration _________________________________________ 113
Technology Description____________________________________________ 113
Types of Catalytic Incineration Systems _______________________________ 115
Catalytic Incinerator System Design __________________________________ 117
Economic Estimates_______________________________________________ 120
Potential Problems ________________________________________________ 123
Installation, Operation, and Maintenance Considerations __________________ 123
References ________________________________

vii
Chapter 9 Biodegradation______________________________________________ 130
Technology Description ___________________________________________ 130
Types of Biodegradation Systems ___________________________________ 131
Biofilter System Design ___________________________________________ 131
Economic Estimates ______________________________________________ 137
Potential Problems _______________________________________________ 138
Installation, Operation, and Maintenance Considerations _________________ 140
References _____________________________________________________ 142
Chapter 10 Emerging Technologies ______________________________________ 146
Membrane Separation_____________________________________________ 146
Ambient Oxidation Processes_______________________________________ 151
Corona Destruction_______________________________________________ 154
Plasma Destruction_______________________________________________ 155
Ozone Catalytic Oxidation _________________________________________ 155
Chapter 11 Preparation and Characterization of Supported Manganese and Iron OxideCatalysts _______________________________________________________ 160
Abstract _______________________________________________________ 160
Introduction ____________________________________________________ 160
Experimental Method _____________________________________________ 164
Results and Discussion____________________________________________ 167
Conclusions ____________________________________________________ 178
Acknowledgements ______________________________________________ 179
References _____________________________________________________ 180

viii
List of Figures
Figure 2-1. Range of Flow Rates for Various VOC Treatment Technologies .................. 7Figure 2-2. Range of Concentrations for Various VOC Treatment Technologies ............ 8Figure 3-2. Shell-and-Tube Condenser ......................................................................... 15Figure 3-4. Spray Chamber ........................................................................................... 16Figure 3-5. Venturi Scrubber (or Condenser)................................................................ 17Figure 3-6. Cost of Heat Exchanger per Meter of Length in Dollars ............................. 22Figure 3-7. Additional Cost of Heat Exchanger per Meter of Length in Dollars ............ 22Figure 4-1. Pore Structure ............................................................................................ 28Figure 4-2. Typical Process Flow Diagram of an Adsorption System ........................... 30Figure 4-3. Isotherms of Typical Pollutants at 298 K (25 oC, 77 oF)............................. 32Figure 4-4. Progress of Adsorption Mass Transfer Rate Through the Bed..................... 33Figure 4-5. Flow of the Mass Transfer Zone Through the Bed...................................... 33Figure 4-6. Conventional Adsorber Bed ....................................................................... 34Figure 4-7. Moving Bed Adsorber................................................................................ 35Figure 4-8. Fluidized Bed Adsorber.............................................................................. 36Figure 4-9. Schematic Diagram of the Cooling Cycle ................................................... 37Figure 5-1. Countercurrent Packed Tower Absorber...................................................... 51Figure 5-2. Cross-Flow Absorber .................................................................................. 52Figure 5-3. Baffle Tower............................................................................................... 53Figure 5-4. Vertical Spray Chamber .............................................................................. 54Figure 5-5. Venturi Scrubber......................................................................................... 55Figure 5-6. Centrifugal Absorber................................................................................... 56Figure 5-7. “Gas-Injection” Support Plate ..................................................................... 59Figure 5-8. US Stoneware’s Pressure Drop Correlation ................................................. 62Figure 5-9. Two Types of Demisters ............................................................................. 66Figure 5-10. Range of Droplet Sizes and Velocities for Effective Separation................. 67Figure 6-1. Effect of Temperature and Residence Time on Destruction Efficiency ....... 80Figure 6-2. Glenro, Inc. Recuperative Oxidizer with Secondary Heat Recovery ........... 82Figure 6-3. Anguil Recuperative Thermal Oxidizer ...................................................... 83Figure 6-4. Anguil Environmental Systems, Inc. Regenerative Oxidizer........................ 83Figure 6-5. REECO Horizontal Flow Regenerative Incinerator .................................... 84Figure 6-6. Anguil Environmental Systems, Inc Roto-Concentrator ............................. 84Figure 7-1. Typical Flare Diagram................................................................................ 99Figure 7-2. Self-Supported Flare ................................................................................ 104Figure 7-3. Guyed Supported Flare............................................................................. 104Figure 7-4. Derrick Supported Flare ........................................................................... 105Figure 8-1. Cross Sectional Diagram of Catalyst Composition................................... 113Figure 8-3. Catalytic System with Recuperative Heat Exchange, Glenro, Inc. ............ 116Figure 8-4. Anguil Regenerative Catalytic Oxidizer .................................................... 117Figure 9-1. Typical Flow Diagram of a Biofilter......................................................... 132Figure 9-2. Open Type Biofilter .................................................................................. 133Figure 9-3. Installed Capital Cost Range for Biofilter Systems Greater than 100 m3 ... 138Figure 10-1. Flow Diagram for a Membrane Separation System................................. 147Figure 10-2. Various Configurations of Membrane Separators ................................... 149

ix
Figure 10-3. Flow Diagram of a Packed Bed PCO Reactor......................................... 153Figure 11-1. Pellets ................................................................................................... 162Figure 11-2. Cordierite Monolith................................................................................ 162Figure 11-3. Cordierite Foam ..................................................................................... 163Figure 11-4. Pressure drop vs. Velocity for Various Types of Substrates .................... 163Figure 11-5. Foam Substrate ...................................................................................... 164Figure 11-6. Iron Oxide Sample with Uneven Drying................................................. 166Figure 11-7. Manganese Impregnated Catalyst Sample............................................... 168Figure 11-8. Iron Impregnated Catalyst Sample.......................................................... 168Figure 11-9. Sample Impregnated with a Mn:2 Fe Ratio............................................. 169Figure 11-10. Sample Impregnated with a 2 Mn: Fe Ratio........................................... 169Figure 11-11. TPR Graph for Manganese Sample....................................................... 170Figure 11-12. TPR Graph for Iron Sample.................................................................. 171Figure 11-13. TPR Graph for the Mn:2 Fe Sample ..................................................... 171Figure 11-14. TPR Graph for 2 Mn: Fe Sample .......................................................... 172Figure 11-15. TPR Graph for the Washcoated Blank .................................................. 172Figure 11-16. TPR Graph for Manganese with Helium Carrier Gas ............................ 173Figure 11-17. TPR Graph for Iron with Helium Carrier Gas ....................................... 173Figure 11-18. Oxygen Chemisorption Response for Mn Sample................................. 174Figure 11-19. Oxygen Chemisorption Response for Iron Sample................................ 175Figure 11-20. Oxygen Chemisorption Response for the Mn:2 Fe Sample ................... 175Figure 11-21. Oxygen Chemisorption Response for the 2 Mn: Fe Sample .................. 176Figure 11-22 Cumulative Oxygen Adsorption for Mn Sample .................................... 176Figure 11-23. Cumulative Oxygen Adsorption for Fe Sample..................................... 177Figure 11-24. Cumulative Oxygen Adsorption for Mn:2 Fe Sample ........................... 177Figure 11-25. Cumulative Oxygen Adsorption for 2Mn:Fe Sample ............................ 178

x
List of Tables
Table 2-1. Methods of VOC Abatement _____________________________________ 3Table 3-1. Typical Industrial Applications of Condensers ______________________ 14Table 3-2. Typical Overall Heat Transfer Coefficients _________________________ 19Table 3-3. Recommended Instrumentation __________________________________ 20Table 3-4. Heat Exchange Area per Unit Length of Exchanger __________________ 21Table 3-5. Cost Ratio of Various Materials of Construction Relative to Carbon Steel_ 23Table 3-6. Advantages and Disadvantages of Condensation Systems______________ 24Table 4-1. Summary of Types of Adsorption ________________________________ 29Table 4-2. Instrumentation to Consider for Adsorption Systems _________________ 36Table 4-3. Isotherm Parameters ___________________________________________ 39Table 4-4. Factors for Estimating the Total Installed Capital Cost of
Adsorption Systems ___________________________________________ 42Table 4-5. Annual Operating Costs for Adsorption Systems_____________________ 43Table 4-6. Advantages and Disadvantages of Adsorption Systems________________ 45Table 5-1. Typical Applications of Absorption _______________________________ 49Table 5-2. Henry’s Law Coefficients_______________________________________ 57Table 5-3. Packing Data_________________________________________________ 63Table 5-4. Recommended Instrumentation __________________________________ 67Table 5-6. Annual Operating Costs for Absorber Systems______________________ 70Table 5-7. Advantages and Disadvantages of Absorption_______________________ 74Table 6-1. Typical Applications of Thermal Incineration for VOC Removal ________ 81Table 6-2. Pre-Exponential Factors and Apparent Activation Energies ____________ 86Table 6-3. Recommended Instrumentation __________________________________ 89Table 6-5. Annual Operating Costs for Incinerator Systems ____________________ 93Table 6-6. Advantages and Disadvantages of Thermal Incineration_______________ 94Table 7-1. Typical Applications of Flaring _________________________________ 100Table 7-2. Flammability Limits in Air_____________________________________ 103Table 7-3. Instrumentation to Consider for Flare Systems _____________________ 103Table 7-4. Factors for Capital Cost Equation _______________________________ 105Table 7-5. Determination of Knock Out Pot Wall Thickness ___________________ 107Table 7-6. Factors for Estimating the Total Installed Capital Cost of Flares _______ 108Table 7-7. Annual Operating Costs for Flare Systems ________________________ 109Table 7-8. Advantages and Disadvantages of Flares __________________________ 110Table 8-2. Recommended Instrumentation _________________________________ 120Table 8-4. Annual Operating Costs for Incinerator Systems____________________ 123Table 8-5. Advantages and Disadvantages of Catalytic Incineration _____________ 125Table 9-1. Typical Applications of Biodegradation ___________________________ 132Table 9-2. Maximum Elimination Capacities of Various Compounds ____________ 136Table 9-3. Recommended Instrumentation _________________________________ 137Table 9-4. Factors for Estimating the Total Installed Capital Cost of
Biofiltration Systems__________________________________________ 139Table 9-5. Annual Operating Costs for Biofilter Systems _____________________ 140Table 9-6. Advantages and Disadvantages of Biofiltration ____________________ 141Table 10-1. Applications of Membrane Separation Systems for VOC Removal ____ 147
xi
Table 10-2. Advantages and Disadvantages of Membrane Separation ___________ 151Table 10-3. Applications of PCO Systems for VOC Removal __________________ 153Table 10-4. Advantages and Disadvantages of PCO _________________________ 154Table 11-1. Weights of Samples and Applied Coating ________________________ 165Table 11-2. BET Surface Area Analysis Results_____________________________ 166Table 11-3. Experimental Data for Catalyst Preparation_______________________ 170Table 11-4. Results of Oxygen Chemisorption Testing________________________ 178

Chapter 1
Introduction
Over the last fifteen years, public awareness has been raised significantly about theeffects of air pollution on the environment and society. Reports of the amount of pollutantsemitted into the atmosphere have made headlines as the requirements of community right-to-know laws came into force and companies began to report the amount of pollution released to theair, water, and land. In addition, the 1990 Clean Air Act established annual fees for largerindustries based on the amount of pollution emitted into the air from the facilities. These factorshave encouraged industries to consider installing additional air pollution controls, even onsources where the controls are not required by regulation. For some companies, this action isregarded as a method to protect a corporate image based on improving public health. For others,it may be a method to appease neighbors or to appeal to a "greener" market.
Whatever the motivation, the result on the air pollution control industry is the same. Theincreased interest in controlling emissions, including low concentrations of emissions, is drivingthe industry toward creative problem solving, innovative controls, and combining controlmethods to achieve more efficient processes. As the demand for controls with higher removalefficiency increases, the market for innovative control technologies also improves. This thesisexplores the technologies that are currently available, along with an additional section on thepotential use of ozone to improve catalytic incineration performance. Ozone is recognized as astrong oxidant for VOCs. Therefore, the potential for improving the destruction efficiency ofVOCs in catalytic incinerators or reducing the required combustion temperature is promising bythe use of ozone. Such a process could substantially reduce the energy requirements to controlVOCs. Research is continuing to refine the process for using ozone in catalytic incineration. Thedetails of recent research to manufacture catalysts and characterize them is the subject of the lastchapter.

Chapter 2
Overview of Technologies for Reduction of VOCs
Various strategies exist to control VOC release. The most desirable is to improve processes sothat emissions are minimized at the outset. This is the idea behind “environmentally consciousmanufacturing” [1], “green engineering” [2], and “benign by design” [3] initiatives in variousindustries. These initiatives may be applied in two ways: improvements or redesign of processes.Improvements include alteration of unit operations, such as increasing reactor yields, raisingseparation levels, or simply cutting down on fugitive emissions. Redesign involves morefundamental changes in processes such as switching from an organic phase to an aqueous phase,converting from stoichiometric to catalytic chemistry, or going from batch to continuousoperation. In all these cases the concept is to eliminate emissions at the point of creation andavoid “end of the pipe” treatment.
An effective technology for waste minimization which is extremely broad in scope is catalysis.Its use in a wide variety of environmental applications has been reviewed [4]. For example,catalysis can be used to manufacture environmentally safer products like hydrofluorocarbons asreplacements for the problematic chlorofluorocarbons (CFCs). It can be used as an alternative tohazardous and toxic chemicals like HCN, HF, HCl, phosgene in a variety of processes. It can beused to improve yields, reduce side-products, and produce unique molecules in a variety ofchemical and energy applications.
There are many situations where it is impractical or impossible to avoid production of somewaste. This can be due to inherent limitations in selectivity of reactions, or unavoidableinefficiencies in separations. Both kinetic and thermodynamic factors may be involved in thesecases. Airborne contaminants may also be generated by the nature of the process itself. Forexample, manufacturing, painting, cooking, dry-cleaning, and animal rendering operationsrepresent situations in which activities are carried out in relatively open spaces with release ofvolatile species into the immediate environment. Such operations usually require ventilation tosweep away any noxious substance. Treatment of this air stream containing low concentrationsof contaminants now becomes the objective. Again, in this situation catalysis can be veryeffective [4]. Catalysis is used for the elimination of pollutants from fixed sources like powerplants, mobile sources like vehicles, and increasingly in everyday environments like office, home,and retailing outlets.
Methods of VOC ControlA number of options are available for the elimination of VOCs [5]. These are described
in a number of books and monographs [6,7,8,9,10,11,12,13,14,15] and are summarized in Table2-1.

3
Table 2-1. Methods of VOC AbatementMethods ReferencesCondensation 6,16Adsorption 15,17,18,19Absorption / Scrubbing 6,15,20,21Thermal incineration 9,22,23Catalytic incineration 9,24Flaring 25, 26Biological treatment 27,28,29Odor modification 5,30Air dilution 6,31,32Membrane separation 33UV treatment 34Ozone catalytic oxidation This thesis
The use of these methods depends on the precise nature of the VOCs, the concentration levels,and the conditions (temperature, pressure, flow rate). These have been described in a generalmanner in a number of articles and books. They are briefly described below and will be coveredin more detail in subsequent chapters with particular emphasis on their applications to VOCs.
CondensationCondensation is the liquefaction of condensable contaminants by the use of low
temperatures. Specifically, the compounds to be removed from the gaseous phase are cooled to atemperature at which their partial pressure (fugacity) in the gas stream exceeds their dew point, sothat they transform to liquids. Conventional condensers are shell and tube heat exchangers [35],used because they contain a relatively large amount of surface area for heat transfer, but are fairlycompact. Critical parameters which establish the requirements and efficiency of the condenserinclude: the overall heat transfer coefficient (a function of the hot and cool stream composition,flow characteristics, and the construction material), the difference in temperature between thestreams, and the operating pressure [36].
Condensation is most effective for compounds with high boiling points [37]. However, if asignificant portion of the organic material is composed of compounds which solidify at thecondenser operating temperature, a standard shell and tube design condenser will not be effective,as these will quickly foul the heat transfer area, plugging the condenser. For those cases, acontact condenser, in which the hot and cool streams come directly into contact with each otherwould be more appropriate.
AdsorptionAdsorption refers to the trapping of pollutants on a high-surface area material.
The process is typically used to remove contaminants in fairly low concentrations from agas stream. The pollutants are adsorbed onto the surface or interstitial areas of a materialsuch as activated carbon or a molecular sieve by physical or chemical attraction. Oncethe carbon or adsorbent material is saturated, that is, it can no longer adsorb any morepollutant, the material is regenerated, typically by introducing steam to drive off thepollutants [38]. The vent stream is condensed, decanted if necessary to separate the

4
aqueous layer from the organic layer, and in some cases, further treated. For example,one of the layers may require distillation to further separate the constituents from theaqueous phase or from each other [39]. Because of the subsequent separation required toreuse the solvents, carbon adsorption is not well suited to streams which have a largenumber of VOCs, nor does it work effectively on streams that have constituents whichare difficult to separate. In those circumstances, as well as situations where the adsorbedspecies has a large molecular weight and is therefore difficult to desorb, or in cases oflow flows [40], the carbon can be used and then disposed of. This creates a similardilemma to that of incineration, though, in that it treats a symptom (VOC emissions) butcauses other problems such as waste disposal.
Absorption / ScrubbingAbsorption is a physical process consisting of the dissolution of a pollutant in a
liquid. In absorbers (or scrubbers), the vapor stream is introduced into a chamber whereit is intimately mixed with the liquid. The amount of pollutants remaining in the gasstream as it leaves the scrubber is governed by Henry’s law, which establishes theamounts of a component in equilibrium in the gas and water streams for dilute mixtures[41]. By using counter current gas and water flows, the mass transfer between the vaporand liquid phases is maximized. If the vapor and liquid have adequate contact, thegaseous components that are soluble in the liquid are absorbed, where they may react orbe removed by discharging the liquid. Some additional removal is accomplished by theevaporative cooling that occurs in the scrubber; some components condense out and areremoved as the liquid is removed. Absorption, however, is not effective on constituentswhich are not soluble in the liquid medium. Therefore, it, too, is not well suited to vaporstreams which have a large variety of constituents.
There is a variation of absorption known as wet scrubbing where the gas-phase componentundergoes a chemical reaction [42] with a component in the liquid phase. The reactions can be ofan acid-base nature, or an oxidation type. The reaction of the liquid phase compound results in alower concentration of the liquid phase compound than would otherwise exist at equilibrium.Thus, the driving force for removal of the gas-phase component is higher than in simpleadsorption. However, a drawback is that the scrubbing agent is consumed in the process, andhence the method is more costly than adsorption where the liquid phase can be reused. Also, insome cases, the process generates a by-product which must be separated and disposed [43].
Thermal IncinerationIncineration is basically the burning of combustible wastes [44]. For many years,
thermal incinerators have been considered to be one of the most effective control devices forVOCs. They are relatively easy to operate, not likely to foul, and do not require additionalprocesses to remove the pollutant. They are sometimes coupled with recuperative heatexchangers for energy efficiency or, more recently, with more efficient regenerative heatexchangers. Operating costs can be further minimized by ensuring that the gas stream is asconcentrated as possible so that energy is not expended to heat excess air. The concentration isusually limited to approximately 25% of the Lower Explosive Limit (or LEL) by fire insuranceregulations [45]. Incinerators are ideal candidates for gas streams which contain a variety ofpollutants and where any solvent that is recovered is not viable for reuse. Under proper

5
conditions, the design efficiencies are typically in excess of 98%, and depend primarily on thegaseous components combusted, the residence time, the amount of mixing, and the combustiontemperature [46]. Costs associated with incineration processes are typically higher than thoseassociated with solvent recovery processes like carbon adsorption or condensation due to the costof the natural gas and increased solvent cost. In addition, incineration can be perceived as a“Band-Aid” approach to VOC control, since it treats the major problem of VOC emissions butgenerates smaller problems like NOx and CO2 generation.
Catalytic IncinerationCatalytic incineration or combustion refers to the burning of combustible wastes with the
aid of a catalyst [47,48,49,50]. The catalyst opens up a different reaction pathway with a loweractivation energy than gas-phase combustion and allows oxidation to proceed at a lowertemperature. Advantages of catalytic combustion are lower energy requirements and lowerproduction of NOx. However, caution must be exercised with catalytic units to avoid theintroduction of particulate matter or metal fumes which can foul the catalyst [24]. The catalyst isusually a noble metal like platinum or palladium dispersed on an inert oxide support. To avoidpressure drop problems the support is usually deposited on the surface of a monolith carrier.
FlaringFlaring is another combustion technique which involves the direct burning of an organic
stream in an open flame. It is carried out at the tip of a burner, usually with the addition of extrafuel and, sometimes, steam [26]. There is no combustion chamber, so flame temperature andproper mixing of the combustible mixture with air are critical design aspects [51]. Flaring cantolerate large variations in flow rate, so is commonly employed in transient situations such asstartup and shutdown. It is routinely used in refining as a method of disposing of VOCs in thatindustry.
Biological TreatmentBiological treatment consists of using microorganisms to biologically degrade
contaminants [34]. Biological purification is a relatively new technology in the field ofair pollution control, although the same concept has been used for years to treatwastewater streams. Microorganisms are grown on a substrate (biofiltration) or aresuspended in a liquid scrubber media (bio-scrubbers) [52]. The scrubber liquid orsubstrate may also serve as an adsorbent for the pollutants, so that the microbes have aconstant food supply, even if the process is not operating. In less variable processes, themicrobes are contained in compost, peat, or a similar soil and the air stream is passedthrough the bed for treatment. Just as in water treatment operations, the microorganismsbreak down the large organic molecules into smaller, less harmful molecules, consuminga portion of the molecules for energy to sustain their microbial activity. Although thistechnology is still not well accepted in the US, there are several hundred installationsoperating worldwide [53]. Like adsorption, bio-purification is a good alternative forstreams which have relatively low concentrations of organic constituents and is mosteffective for systems containing alcohols, ethers, aldehydes, and ketones.
Biofiltration offers excellent VOC removal, even from dilute gas streams with relatively lowmaintenance and operating costs. However, care must be exercised to remove particulates, ensureadequate moisture is present, avoid gas channeling, and maintain a fairly constant temperature

6
[29]. As with wastewater treatment systems, the microbes are susceptible to significant changesin the nature or concentration of pollutants and can be killed by sudden changes. Therefore,highly variable processes, or batch systems in which products change daily or weekly are notwell-suited to biofiltration. In addition, design of a biofiltration system generally requires a pilotunit to determine the treatability of the gas stream and the residence time required for effectiveremoval.
Membrane SeparationMembrane technology involves the use of semipermeable membranes to separate VOCs
from a process stream [33]. The technology has been used in water purification, and has beenadapted for use with gaseous media. Basically, the separation is based on preferential diffusionof VOCs across thin polymer layers wrapped around a perforated central tube. The driving forceis a pressure differential between the inner and outer portions of the tube. The method is effectivefor recovering VOCs such as chlorinated hydrocarbons, chlorofluorocarbons, andhydrofluorocarbons that have been traditionally difficult to separate because of their highvolatility.
UV TreatmentUV treatment is another emerging technology in which ultraviolet light is used to oxidize
organic compounds. The oxidation reaction is promoted by the photocatalytic effect of the UVlight and is conducted in the presence of a catalyst to activate the oxygen into highly reactivespecies including ozone. After reaction, the air stream is scrubbed to perform additionaloxidation, dried, and remaining VOC compounds are adsorbed in activated carbon. Thetechnique has been reported to be up to 99% effective in the destruction of organic compounds[34, 54]. Problems are activity at high flow rates and the low photoefficiencies of the catalyticprocess, which results in high costs [55].
Catalytic Ozone OxidationOzone catalytic oxidation technology is already seeing commercialization in a number of
household applications such as the deodorization of refrigerators and toilets and the purificationof room air. A contaminated gas stream is mixed with ozone and passed over a catalyst bed tocarry out a low-temperature catalytic combustion reaction. The process utilizes the oxidizingpower of ozone together with the activity and selectivity of oxidation catalysts to convert VOCsto CO2 and H2O. The process works at high and low VOC concentrations, and at high flow rates.Because of the use of ozone the air stream does not require appreciable heating. Improvements ingeneration equipment have decreased the cost of the ozone substantially, and this promises tobecome a broadly used technology.
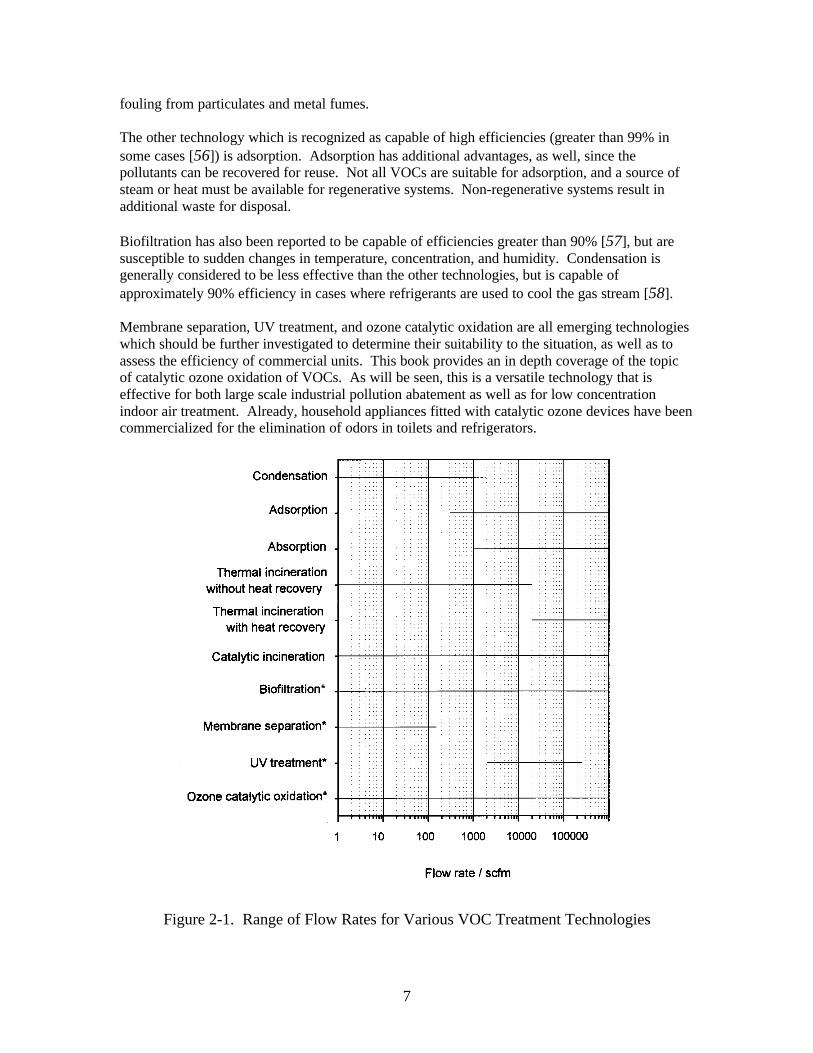
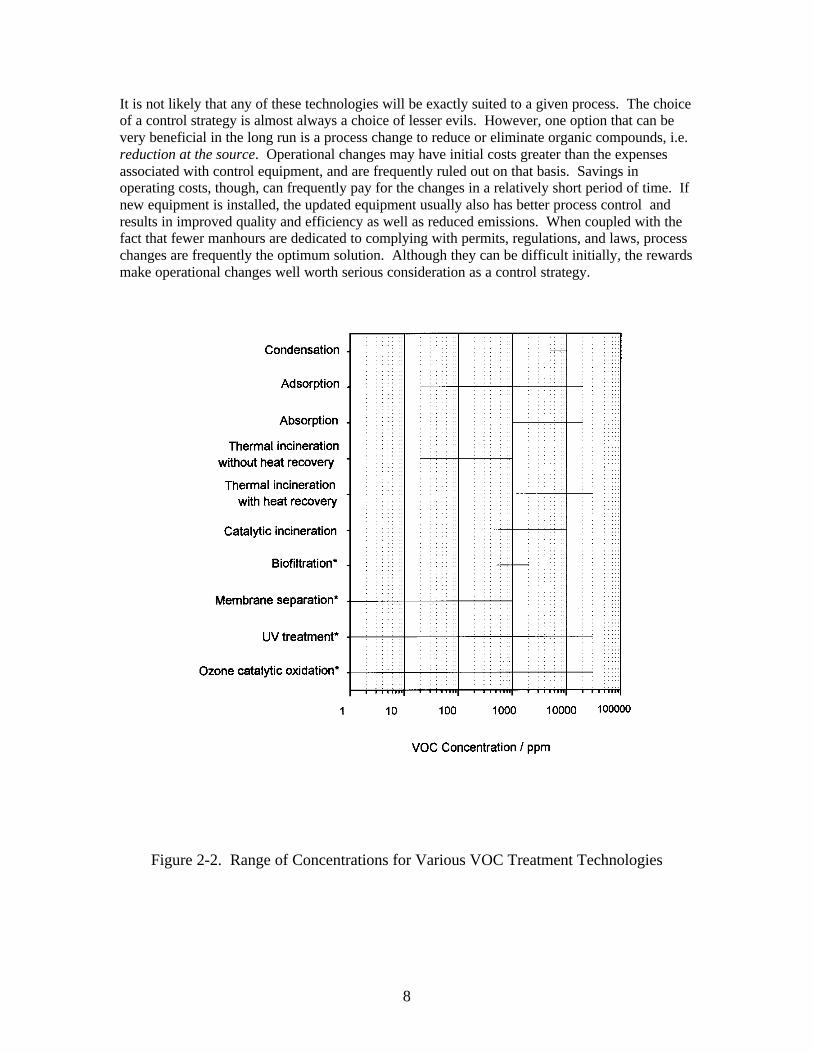
Comparison of TechnologiesFigures 2-1 and 2-2 [Adapted from ref. 14, with permission] illustrate the ranges of
concentration and flow rate that are generally suitable for different technologies. These, incombination with required control efficiency and the availability of utilities, labor, and capitalform the basis for a control technology choice. In most cases where a VOC control is desired orrequired, one immediate and easy solution is incineration. Incineration is a very effective,flexible control technology that allows for changes in pollutants, concentration, and flow. Inaddition, thermal incineration devices are available today with greater than 95% heat recoverywhich minimizes the amount of supplemental fuel required. Catalytic incineration is also capableof high removal efficiencies with minimal natural gas requirements, but is more susceptible to
7
fouling from particulates and metal fumes.
The other technology which is recognized as capable of high efficiencies (greater than 99% insome cases [56]) is adsorption. Adsorption has additional advantages, as well, since thepollutants can be recovered for reuse. Not all VOCs are suitable for adsorption, and a source ofsteam or heat must be available for regenerative systems. Non-regenerative systems result inadditional waste for disposal.
Biofiltration has also been reported to be capable of efficiencies greater than 90% [57], but aresusceptible to sudden changes in temperature, concentration, and humidity. Condensation isgenerally considered to be less effective than the other technologies, but is capable ofapproximately 90% efficiency in cases where refrigerants are used to cool the gas stream [58].
Membrane separation, UV treatment, and ozone catalytic oxidation are all emerging technologieswhich should be further investigated to determine their suitability to the situation, as well as toassess the efficiency of commercial units. This book provides an in depth coverage of the topicof catalytic ozone oxidation of VOCs. As will be seen, this is a versatile technology that iseffective for both large scale industrial pollution abatement as well as for low concentrationindoor air treatment. Already, household appliances fitted with catalytic ozone devices have beencommercialized for the elimination of odors in toilets and refrigerators.
Figure 2-1. Range of Flow Rates for Various VOC Treatment Technologies
8
It is not likely that any of these technologies will be exactly suited to a given process. The choiceof a control strategy is almost always a choice of lesser evils. However, one option that can bevery beneficial in the long run is a process change to reduce or eliminate organic compounds, i.e.reduction at the source. Operational changes may have initial costs greater than the expensesassociated with control equipment, and are frequently ruled out on that basis. Savings inoperating costs, though, can frequently pay for the changes in a relatively short period of time. Ifnew equipment is installed, the updated equipment usually also has better process control andresults in improved quality and efficiency as well as reduced emissions. When coupled with thefact that fewer manhours are dedicated to complying with permits, regulations, and laws, processchanges are frequently the optimum solution. Although they can be difficult initially, the rewardsmake operational changes well worth serious consideration as a control strategy.
Figure 2-2. Range of Concentrations for Various VOC Treatment Technologies

9
References 1. M. P. Dudukovic; P. L. Mills, Special Issue on Symposium on Catalytic Reaction
Engineering for Environmentally Benign Processes, Ind. Eng. Chem. Res. 1994, 33,2885-3290.
2. P. T. Anastas; T. C. Williamson, Eds., Green Chemistry: Designing Chemistry forthe Environment, ACS Symposium Series No. 626, American Chemical Society:Washington, D.C., 1996.
3. P. T. Anastas; C. A. Farris, Benign by Design—Alternative Synthetic Design forPollution Prevention, ACS Symposium Series 577, American Chemical Society:Washington, D.C., 1993.
4. A. T. Bell; L. E. Manzer; N. Y. Chen; V. W. Weekman; L. L. Hegedus; C. J. Pereira,“Protecting the Environment through Catalysis”, Chem. Eng. Prog., Feb.1995, p. 26.
5. W. H. Prokop, “Odors”, in Air Pollution Engineering Manual, A. J. Buonicore andW. T. Davis, Eds., Chp. 5, p. 147, Van Nostrand Reinhold, New York, 1992.
6. Air & Waste Management Association, Emerging Solutions to VOC & Air ToxicsControl, Proc. Specialty Conf. San Diego, Feb. 26-28, 1997, AWMA, Pittsburgh,1997.
7. H. J. Rafson, Ed., Odor and VOC Control Handbook, McGraw-Hill, New York,1998.
8. N. de Nevers, Air Pollution Control Engineering, McGraw-Hill, New York, 1995.9. R. M. Heck; R. J. Farrauto, Catalytic Air Pollution Control, Van Nostrand Reinhold,
New York, 1995.10. J. C. Mycock; J. D. McKenna; L. Theodore, Handbook of Air Pollution Control
Engineering and Technology, CRC Press, Lewis Publishers: Boca Raton, 1995.11. C. D. Cooper; F. C. Alley, Air Pollution Control, A Design Approach, 2nd Ed.;
Waveland Press: Prospects Heights, Illinois, 1994,12. R. D. Griffin, Principles of Air Quality Management, Lewis Publishers: Boca Raton,
1994, Chp. 5, pp. 113-158.13. D. R. Patrick, Ed., Toxic Air Pollution Handbook, Van Nostrand Reinhold: New
York, 1994.14. N. Mukhopadhyay; E. C. Moretti, Current and Potential Future Industrial Practices
for Reducing and Controlling Volatile Organic Compounds, Center for WasteReduction Technologies, American Institute of Chemical Engineers: New York,1993.
15. A. L. Hines; T. K. Ghosh; S. K. Loyalka; R. C. Warder, Jr., Indoor Air Quality &Control, Prentice Hall, Englewood Cliffs, New Jersey, 1993.
16. A. J. Buonicore, “Control of Gaseous Pollutants-Condensation”, in Air PollutionEngineering Manual, A. J. Buonicore; W. T. Davis, Eds., Van Nostrand Reinhold:New York, 1992, Chp. 2, p. 31.
17. T. E. Cannon, “Carbon Adsorption Applications”, in Air Pollution Control andDesign Handbook, Part 1, P. N. Cheremisinoff; R. A. Young, Eds., Marcel Dekker:New York, 1977, Chp. 15, p. 421.
18. M. H. Stenzel, “Remove Organics by Activated Carbon Adsorption”, Chem. Eng.Prog. 1993, 89(4), 36.

10
19. M. J. Ruhl, “Recover VOCs via Adsorption on Activated Carbon”, Chem. Eng.
Prog. 1993, 89(7), 37.20. J. W. MacDonald, “Packed Wet Scrubbers”, in Air Pollution Control and Design
Handbook, Part 2, P. N. Cheremisinoff; R. A. Young, Eds., Marcel Dekker: NewYork, 1977, Chp. 25, p. 699.
21. N. D. Phillips, “Countercurrent Contact Wet Scrubbing”, in Air Pollution Controland Design Handbook, Part 2, P. N. Cheremisinoff; R. A. Young, Eds., MarcelDekker: New York, 1977, Chp. 26, p. 721.
22. R. D. Ross, “Thermal Incineration”, in Air Pollution Control and Design Handbook,Part 1, P. N. Cheremisinoff; R. A. Young, Eds., Marcel Dekker: New York, 1977,Chp. 17, p. 449.
23. A. Garg, “Specify Better Low-NOx Burners for Furnaces”, Chem. Eng. Prog. 1994,90(1), 46.
24. T. H. Snape, “Catalytic Incineration”, in Air Pollution Control and DesignHandbook, Part 1, P. N. Cheremisinoff; R. A. Young, Eds., Marcel Dekker: NewYork, 1977, Chp. 21, p. 543.
25. R.Y. Purcell, G.S. Shareef, Control Technologies for Hazardous Air Pollutants,USEPA, Research Triangle Park, NC, 1986, p. 25-26, 60-63.
26. W.M. Vatavuk, “Flares” in OAQPS Control Cost Manual, 4th Edition (includingsubsequent revisions), USEPA, Research Triangle Park, NC, 1990, Chp. 7, p.1-45.
27. G. Leson and A. M. Winer, “Biofiltration: An Innovative Air Pollution ControlTechnology for VOC Emissions”, J. Air Waste Manag. Assoc. 1991, 41, 1045.
28. H. Bohn, “Consider Biofiltration for Decontaminating Gases”, Chem. Eng. Progress1992, 88, 34.
29. R.F. Michelsen, “Biofiltration”, in Handbook of Air Pollution Control Engineeringand Technology, J.C. Mycock, J.D. McKenna, L. Theodore, Eds., Lewis Publishers,Boca Raton, Florida, 1995, Chp. 21, p. 375-394.
30. T. M. Hellman, “Odor Control by Odor Modification”, in Air Pollution Control andDesign Handbook, Part 2, P. N. Cheremisinoff; R. A. Young, Eds., Marcel Dekker:New York, 1977, Chp. 44, p. 1005.
31. J. T. Yeh, “Modeling Atmospheric Dispersion of Pollutants”, in Air PollutionControl and Design Handbook, Part 1, P. N. Cheremisinoff; R. A. Young, Eds.,Marcel Dekker: New York, 1977, Chp. 6, pp. 167-178.
32. J. B. Christian, “Estimate the Effects of Air Emissions with this Process ScreeningModel”, Chem. Eng. Prog., June 1995, p. 59.
33. R. W. Baker; J. Kaschemekat, J. G. Wijmans; V. L. Simmons (MembraneTechnology and Research, Inc.) Membrane Vapor Separation Systems for theRecovery of VOCs. Presentation at the 85th Annual AWMA Meeting andExhibition, Kansas City, MO, June 1992.
34. G. Gschwandtner; S. Fairchild, Controlling Odorous Emissions from Iron Foundries,USEPA, Research Triangle Park, NC, 1992, p.17-18.
35 . G. Hounsell, “Condensers”, in Handbook of Air Pollution Control Engineering andTechnology, J.C. Mycock, J.D. McKenna, L. Theodore, Eds., Lewis Publishers,Boca Raton, Florida, 1995, Chp. 12, p. 223-256.
36 . R.Y. Purcell, G.S. Shareef, Control Technologies for Hazardous Air Pollutants,USEPA, Research Triangle Park, NC, 1986, p. 27, 75-80.

11
37 . A.J. Buonicore, “Condensation”, in Air Pollution Engineering Manual, A.J.
Buonicore; W.T. Davis, Eds., Van Nostrand Reinhold, New York, 1992, p. 52-58.38 . A. Turk, “Adsorption”, in Air Pollution, Third Edition, Volume IV: Engineering
Control of Air Pollution, A.C. Stern, Ed., Academic Press, New York, 1977, Chp. 8,p. 329-363.
39 . L. Theodore; A.J. Buonicore, Air Pollution Control Equipment, Volume II: Gases,CRC Press, Inc., Boca Raton, Florida, 1988, Chp. 10, p. 43-77.
40 . Handbook of Air Pollution Technology, S. Calvert; H.M. Englund, Eds., John Wiley& Sons, New York, 1984, Chp. 3, p. 162-185.
41 . R.M. Bethea, Air Pollution Control Technology: An Engineering Point of View, VanNostrand Reinhold Company, New York, 1978, Chp. 12, p. 331- 365.
42 . U. von Stockar; C.R. Wilke, “Absorption” in Kirk-Othmer Encyclopedia ofChemical Technology, 4th Edition, Volume I, John Wiley & Sons, New York, 1991,p. 38-93.
43 . T. Godish, Air Quality, 2nd Ed., Lewis Publishers, Inc., Chelsea, Michigan, 1991, p.327- 328.
44. S.M. Weiss, “Afterburners”, in Air Pollution Engineering Manual, J.A. Danielson,Ed., USEPA, Research Triangle Park, NC, 1973, p. 171-183.
45. W.M. Vatavuk, “Thermal and Catalytic Incinerators”, in OAQPS Control CostManual, 4th Ed., USEPA, Research Triangle Park, NC, 1990, Chp. 3, p. 1-66.
46. R.L. Burglund, “Exhaust Control, Industrial” in Kirk-Othmer Encyclopedia ofChemical Technology, Fourth Edition, Volume 9, J.I. Kroschwitz; M. Howe-Grant,Eds., John Wiley & Sons, New York, 1994, p.1024-1027.
47. Spivey, J. J. Ind. Eng. Chem. Res. 1987, 26, 2165.48. Zwinkels, M. F. M.; Järås, S. G.; Menon, P. G.; Griffin, T. A. Catal. Rev.-Sci. Eng.
1993, 35, 319.49. Pfefferle, L. D.; Pfefferle, W. C. Catal. Rev.-Sci. Eng. 1987, 29, 219.50. Prasad, R.; Kennedy, L. A.; Ruckenstein, E. Catal. Rev.-Sci. Eng. 1984, 26, 1.51. A.J. Buonicore, “Incineration”, in Air Pollution Engineering Manual, A.J.
Buonicore; W.T. Davis, Eds., Van Nostrand Reinhold, New York, 1992, p. 58-70.52. M.J. Suess; K. Grefen; D.W. Reinisch, Ambient Air Pollutants from Industrial
Sources: A Reference Handbook, World Health Organization Regional Office forEurope, Elsevier, New York, 1985, pp.708 - 713.
53. G. Lesen; A.M. Winer, “Biofiltration: An Innovative Air Pollution ControlTechnology For VOC Emissions”, Journal of the Air and Waste ManagementAssociation, 1991, 41(8), 1045-1054.
54. T.J. Overcamp, G.R. DeHollander, H. Chang, C.P.L. Grady, “A BiologicallyEnhanced Scrubber for Volatile Organic Compounds,” Paper No. 91-180.12,AWMA Annual Meeting, Vancouver, British Columbia, 1991.
55. E. Wilson, “TiO2 Appears Inefficient for Water Treatment”, Chem. & Eng. News,July 1, 1996, p. 29.
56. J. Hoskins, personal communication, 1985-1988.57. VDI- Handbuch Reinhalten der Luft, VDI Richtlinien 3477, Biological Waste
Gas/Waste Air Purification, Biofilters, Band 6, December, 1991.

12
58. G.S. Shareef, W.J. Barbour, S.K. Lynch, W.R. Pelt, W.M. Vatavuk, “Refrigerated
Condensers”, in OAQPS Control Cost Manual, 4th Edition (including subsequentamendments, USEPA, Research Triangle Park, NC, 1990, Chp. 8, p. 1-50.

Chapter 3
Condensation
Technology DescriptionCondensation is a process used to separate compounds by either cooling the gas stream or
pressurizing a gas stream to conditions where one or more of the components separates from the mixtureas a liquid. This occurs when the partial pressure (fugacity) of the constituent in the gas phase equals orexceeds the vapor pressure of the pure component in liquid form under the same conditions [1]. Theefficiency of removing VOCs from a gas stream by condensation depends on the vapor pressure of thecomponent to be separated, the pressure and temperature that can be achieved during condensation, andthe concentration of the constituent in the gas stream [2]. A typical flow diagram of a condensationsystem for air pollution control is shown in Figure 3-1.
Water-cooled condensers are commonplace in industry [3]; they are used to prevent the escape of rawmaterials from the process, to liquefy components separated by distillation columns, and to liquefysteam to reuse it as boiler feedwater. Condensation is generally assumed to be considerably lessefficient than other technologies for removing pollutants from the low concentration gas streamsencountered in air pollution control [2]. However, an alternative coolant [4] such as calcium chloride,Freons, or methylene chloride may yield condensing systems with 90 percent [2, 5] or better efficiency.The increased efficiency, which results from outlet gas temperatures of 194 to 277 K (-79 to 4 oC, -110to 40 oF) [6], comes at the cost of increased maintenance and system complexity, though. A refrigerantmust be selected carefully to ensure that potential leakage of the coolant does not result in a more severe
Clean Flue Gas
CoolantIn
Condensate
Condenser
Decanter
Water
RecoveredSolvent
ProcessGas
CoolantOut
Figure 3-1. Typical Condensation Process

14
environmental threat than that posed by the original gas stream. The potential danger from refrigerantleaks and the energy consumed by the refrigeration cycle should be weighed against the toxicity andimpact of the untreated gaseous stream.
Condensers, particularly water-cooled condensers, are frequently used in combination with othercontrol technologies [7]. In carbon adsorption systems, condensers are used to liquefy the concentratedplume of steam and pollutant that are removed during the desorption stage. They are also used forpretreatment of a gas stream, such as in a rendering plant where as much as 95% of the gas volume maybe reduced by condensation [8]. Since cooling of the gas stream is inherent in a condensing system, thesystem reduces the volume and pollutant loading of a gas stream before it enters a final "polishing"control device, such as an absorber, adsorber, or incinerator. This enables the final control device to besmaller and to achieve lower emissions. Condensers may be used to reduce the loading to a level belowthe Lower Explosive Limit (LEL) of the gas stream. When placed in front of a destructive controldevice such as an incinerator or absorber, a condenser provides for partial recovery of raw materialsprior to the final destruction necessary to achieve low emission rates. However, such a system requiresthat the gas stream be cooled, only to be heated up again to reach the combustion temperature.Condensation systems are more effective on compounds which have low vapor pressures at theachievable outlet gas temperature; typically higher molecular weight compounds are most suited torecovery by condensation. Table 3-1 gives several applications of condenser systems for VOC control[9, 10, 11].
Table 3-1. Typical Industrial Applications of Condensers [9, 10, 11]Storage tanks
Petroleum refiningPhthalic anhydride manufacturing
Ammonia manufacturing
Dry cleaning
Styrene manufacturingRendering plants
Vapor degreasersKraft pulp mills
Types of CondensersThere are two primary types of condensers, contact and non-contact [12, 13]. The most
common is the non-contact or surface condenser [14], in which heat is transferred across a barrier(usually a metal pipe or plate) which separates the gas stream from the coolant. Examples of non-contact condensers include shell-and-tube heat exchangers (Figure 3-2, redrawn from [8]) and plate-and-frame heat exchangers (Figure 3-3, [15]). In shell-and-tube heat exchangers, the coolant normally flowsthrough the tubes [16]; the gas stream flows through the shell outside the tubes, and the condensibleconstituents form a film on the outside surface of the tubes. If there is little moisture in the gas stream,non-contact condensing systems can provide for pure product recovery [17] in situations where only onecondensible compound is present in the gas stream. Even with moisture in the gas stream, the recovery

15
Figure 3-3. Plate and Frame Heat Exchanger [modified from 15]
is fairly simple: the organic is separated from the water either by decanting (if it is not soluble in thewater) or by distillation [18].
In a contact condensing system, the coolant is sprayed directly into the gas stream to obtain themaximum heat transfer. These systems, while they are usually less complicated and less expensive [19],create additional difficulties since the coolant must be separated from the condensed vapor if either oneis to be reused. If the condensate is not reused, the liquid stream must be discarded, usually through awastewater treatment plant. Thus, an air pollution problem is simply converted to a wastewater problem[16]. However, contact condensers also have the advantage that the liquid absorbs any solublecompounds, acting as both a condenser and an absorber [20, 21], at least until the liquid becomessaturated with the pollutant.
CoolantInlet
GasOutlet
GasInlet
CoolantOutlet
Figure 3-2. Shell-and-Tube Condenser [modified from 8]
Hot Stream Fluid Flow
Cold Stream Fluid Flow

16
Contact condensers come in a variety of designs [16], including simple spray chambers [8] (see Figure3-4) and venturi scrubbers [8] (in which the velocity of the gas is accelerated to increase the contact,Figure 3-5). These types of vessels are also effective particulate collection devices [22, 23], animportant consideration if the gas stream also contains particulate which might foul a shell-and-tubecondenser.
Figure 3-4. Spray Chamber [modified from 8]
Some contact condensing systems cool the condensate further than normally required and use the chilledcondensate as the recirculating coolant [24]. While this method is only effective with pollutants whichhave a relatively low vapor pressure, it provides a good solution to the wastewater disposal problemencountered with miscible coolant and condensate systems.
PollutedGas Stream
Water
Drain
CleanedGas Stream

17
High Pressure Water
Gas WithEntrainedVapors
Discharge
Figure 3-5. Venturi Scrubber (or Condenser) [modified from 8]
Condenser System DesignChoosing and specifying a condensation system for air pollution control involves several considerations.In addition to evaluating whether the technology is appropriate, the designer must also consider safety,efficiency, economics, and maintenance requirements. An important aspect of the safety considerationsis designing the system to fail safe. Assuming that every condenser will eventually leak, at least for ashort while, the designer should determine whether the coolant should leak into the gas stream or viseversa. The stream under the most pressure will inevitably make its way into the other stream once thevessel begins to leak, so the condenser should be designed for pressures that ensure that the leakage issafe and easy to detect.
The efficiency of the condensation system depends on adequate heat transfer and the concentration ofthe pollutant in the gas stream. The gas stream should therefore be as concentrated as possible, sinceadditional air consumes cooling capacity [25] that would otherwise be used for condensing the pollutant.Excess air also dilutes the concentration of the pollutant, making it more difficult to achieve the partialpressure necessary for removal. As with the other control devices, unnecessary air flow should beeliminated [13] by reducing the airflow at pickup points if possible, properly maintaining the seals in theductwork, eliminating unnecessary pickup points, and maintaining valves and valve seats in excellentcondition. The concentration in the ductwork should never exceed fire safety levels. This is of particularimportance in cases in which storage tanks are vented to a condenser, since the exhaust stream from thetank is saturated with solvent vapor.
Because of the strong influence of adequate heat transfer on the overall operation of the condenser,

18
ensuring an adequate supply of coolant at as low a temperature as possible and minimizing potentialfouling are important aspects of the system design. It is important to ensure that adequate heat transfersurface is available. However, overdesigning the heat transfer area can actually be detrimental to thecondenser operation [3] if the overdesign results in less air velocity and less liquid washing per unit ofcondensing surface so that more fouling occurs.
A rough estimate of the surface area required for condensation in a simple countercurrent heatexchanger can be obtained by determining the total amount of heat, q (J hr-1 or Btu hr-1) that must betransferred out of the gas stream to achieve the desired outlet temperature. The specific heat of thevapor, the specific heat of the liquids, and the latent heat of vaporization of the condensible compoundsmust be known. The required surface area is then estimated by the equation [4]:
)T (Uq/ A lmc ∆= 3-1
where Ac = Amount of heat transfer area required, m2 or ft2
q = Amount of heat to be transferred, J h-1 or Btu h-1
U = Overall heat transfer coefficient, J m-2 h-1 K-1 or Btu ft-2 h-1 R-1
Tlm∆ = The log-mean temperature difference is calculated by the formula:
)T /T( ln
T - T = T21
21lm
∆∆∆∆
∆ 3-2
where T1∆ = Temperature difference between the hot fluid and the cold fluidat the entrance of the hot fluid to the heat exchanger, K or oR
T2∆ = Temperature difference between the hot fluid and the cold fluidat the entrance of the cold fluid to the heat exchanger, K or oR
Some typical overall heat transfer coefficients are given in Table 3-2. These values are intended as ageneral guide only and are not intended as the sole source of information for heat transfer. A morerigorous estimation such as that given in Perry’s Handbook [26], Bejan [27], Sherwood and Reed [28],McAdams [29], or Jakob [30] should be used for design. Heat transfer equipment vendors are alsoexcellent sources for precise information regarding the heat transfer coefficient for a given situation.

19
Table 3-2. Typical Overall Heat Transfer Coefficients [3, 11, 20, 31, 32, 33, 34]
Vapor CoolantU
(J K-1 m-2 s-1)
U(Btu oF-1 ft-2 h-1)
Ammonia Water 260-880 150-500
Alcohol Water 80-350 45-200
Methanol Water 440-880 250-500
Kerosene Water 50-110 30-65
Light Organics (viscosity <0.5 cP),benzene, toluene, acetone, ethanol,gasoline)
Water 130-260 75-150
Heavy Organics Heavy Organics 50-200 30-110
Heavy Organics Light Organics 150-300 85-170
Heavy Organics Water 25-370 15-210
Light Organics Heavy Organics 50-200 30-110
Light Organics Light Organics 200-400 110-230
High Boiling Hydrocarbons Water 35-90 20-50
Low Boiling Hydrocarbons Water 140-350 80-200
Organic Solvents (with large amount ofnoncondensibles)
Water or brine 35-140 20-80
Naphtha Water 90-130 50-75
Vegetable oil vapors Water 35-90 20-50
Steam Water 350-1400 200-800
Gases (in general) Water 4-90 2-50
Light organics Brine 70-200 40-100
Gases Air 4-15 2-8
Adequate provisions must also be made for subcooling the condensed liquid [8] so that the vapor is notsimply re-evaporated from the warm liquid once the liquid reaches a storage tank or open vessel. Thismay be accomplished by maintaining a pool of condensate covering a small portion of the heat transfersurface. If this method is used, adjustments in the amount of heat transfer area should be made in thedesign of the condenser to ensure that adequate heat transfer area exists above the liquid pool to achievethe desired removal rate. Alternatively, a separate liquid-to-liquid heat exchanger or subcooler can be

20
installed to maintain the desired condensate temperature. Separate subcoolers are typically muchsmaller than the condenser. A list of instrumentation that should be considered for condenser systems isgiven in Table 3-3.
Table 3-3. Recommended Instrumentation
Gas stream temperature and pressure (inlet and outlet)
Pollutant concentration
Fan speed
Coolant flow and temperature (inlet and outlet)
Condensate flow
Refrigerant pressure (inlet and outlet), if applicable
Economic EstimatesThe cost of a standard shell-and-tube heat exchanger can be estimated using the method
published by Cowie [35]. If necessary, the cost of auxiliary equipment such as pumps and fans can beestimated using the equations given by Vatavuk [4, 6]. The amount of heat transfer area per meterlength of the exchanger is given in Table 3-4. Figures 3-6 and 3-7 give two components of the heatexchanger cost: a component that represents the cost of the heat exchanger per meter of length, and theadditional cost that must be added to account for tube length.
These factors are based on the cost of a standard split ring floating head heat exchanger made of carbonsteel shell and 19.05 mm (3/4 inch) tubes. Additional allowance must be made for other materials ofconstruction, heat exchanger design, temperatures above 343 oC, or different tube or baffleconfigurations [35]. The costs should be scaled to current values using the methods given by Vatavuk[4]. In addition to the cost of the heat exchanger and associated equipment, the installation costs mustbe included in the estimate. Installation costs associated with heat exchangers are typically 30-60 % ofthe cost of the equipment alone [33].

21
Table 3-4. Heat Exchange Area per Unit Length of Exchanger [modified from 35]Shell Diameter Area/ Tube Length
mm in m2/m ft2/ft
203 OD 8 1.67 5.48
254 OD 10 3.1 10
305 OD 12 4.54 14.9
356 OD 14 5.6 18
406 OD 16 7.89 25.9
457 OD 18 10.6 34.9
508 OD 20 15 49
560 OD 22 18.2 59.7
610 OD 24 22.2 72.8
635 OD 25 24.3 79.6
688 OD 27 28.0 91.9
737 OD 29 33.1 109
787 OD 31 38.2 125
838 OD 33 43.5 143
890 OD 35 49.5 162
940 OD 37 55.3 182
991 OD 39 62.2 204
1067 OD 42 72.7 238
1143 OD 45 84 276
1219 OD 48 96.2 316
1295 OD 51 108 353
1372 OD 54 121 396
1524 OD 60 149 490
OD – Shell diameter is outside diameter. ID - Shell diameter is inside diameter.

22
ShellDiameter
mm
3,0002,000
1,000
10010,0001,000 100,000
Figure 3-6. Cost of Heat Exchanger per Meter of Length in Dollars [redrawn from 35]
ShellDiameter
mm
3,0002,000
1,000
1001,000100 10,000
Figure 3-7. Additional Cost of Heat Exchanger per Meter of Length in Dollars [redrawn from 35]

23
Potential ProblemsFouling of the heat transfer area is one of the most prevalent concerns with non-contact heat
exchangers [12]. Fouling refers to the build up of a layer of foreign material on the heat transfer surface[3] which reduces the rate of heat transfer. This may occur due to particulates in the incoming gasstream, contaminants in the cooling stream, organic growth in the cooling stream, or a variety of otherfactors. When river water is used as a coolant, special care must be taken to ensure that seeds fromliving organisms do not reach the heat exchanger tubes. For example, in the case of river mussels, thecondenser tubes provide a relatively warm spot and the mussels can multiply quickly, choking off thecooling water flow [36].
Corrosion is also a consideration in condensation equipment [18]. Appropriate materials are critical formaintaining the structural integrity of the condenser and ensuring that leaks do not occur. The durabilityof several materials of construction in corrosive atmospheres are given in Perry's [37]. Table 3-5 givesthe relative costs of several materials. Although a titanium or hastelloy condenser has a much higherinitial cost, it may easily pay for itself in maintenance, lost production, and replacement costs in acorrosive environment.
Table 3-5. Cost Ratio of Various Materials of Construction Relative to Carbon Steel [33]304 Stainless Steel 7
316 Stainless Steel 10
Copper 7
Monel 10
Nickel 12
Hastelloy C 40
Inconel 13
Effective removal of the pollutant from the gas stream is dependent on the movement of gas moleculesto the cold surface [38]. If the gas is cooled by more than 40 or 50 K (75 to 95 oF), there is thepossibility that fog will form in the condenser. This happens when the rate of heat transfer exceeds therate of mass transfer, thereby cooling the gas before the gas molecules disperse to the cold surface andcondense. The resulting condensate fog is comprised of relatively small droplets (approximately onemicron in diameter or smaller) which are difficult to collect [7].
Installation, Operation, and Maintenance ConsiderationsIt is important to minimize thermal and mechanical stress and vibration [3] to reduce the
opportunity for cracks and leaks [12]. Due to the shape and connections on a shell-and-tube condenser,it is very tempting to install it wherever it can be squeezed in and to force piping into place around it. Itis, however, critical that the piping be designed and constructed to fit properly with adequate support for

24
the condenser so that the connections and condenser shell are not stressed unnecessarily. To avoidunnecessary thermal stress, the condenser should be warmed up slowly and uniformly by starting thecoolant flow, then allowing the warm vapor in gradually [3]. Adequate venting is also a key toavoiding thermal stress during start-up, since it minimizes any cold spots [39].
Ample space must be maintained near the end of a shell-and-tube condenser to provide access and allowthe tubes to be pulled from the shell for cleaning. Such routine maintenance should include a thoroughcleaning of tubes on the inside and outside surfaces. Any cleaning methods must be used with care toavoid loosening seals between the tube and the tubesheet; steaming individual tubes is of particularconcern [14]. During the outage, any tubes which have developed thin spots or leaks should be pluggedto prevent loss of coolant or vapor. Careful documentation of tube failures will assist later in assessingerosion or stress problems in tubes. Similarly, proper instrumentation is essential to identifyingmalfunctions of a condenser. If measurements are made once the condenser is operational, but beforefouling occurs, conditions can later be compared to the initial conditions to determine if he condenser isworking properly or and to identify problems. A summary of the advantages/ disadvantages ofcondensation is given in 3-6.
Table 3-6. Advantages and Disadvantages of Condensation SystemsAdvantages Disadvantages
Allows for recovery / concentration of thepollutant
Effectiveness is pollutant-specific, depends onvapor pressure of compound
No additional pollutants formed Potential corrosion of ductwork due to moisture ingas stream
Generally less efficient than other alternatives
Potential for wastewater problems [40]

25
25
References 1. G.T. Joseph; D.S. Beachler, APTI Course 415: Control of Gaseous Emissions,
Student Manual, USEPA, Research Triangle Park, NC, 1981, Chapter 6.2. R.Y. Purcell; G.S. Shareef, Control Technologies for Hazardous Air Pollutants,
USEPA, Research Triangle Park, NC, 1986, p. 24,27, 75-80.3. L.Theodore; A.J. Buonicore, Air Pollution Control Equipment; Volume II: Gases,
CRC Press, Inc., Boca Raton, Florida, 1988, Chapter 9, p. 31-40.4. W.M. Vatavuk, OAQPS Control Cost Manual Fourth Edition, USEPA, Research
Triangle Park, NC, 1990 (including subsequent amendments), Chapter 6.5. R.Y. Purcell; G.S. Shareef, Evaluation of Control Technologies for Hazardous Air
Pollutants, EPA, Research Triangle Park, NC, 1986.6. W.M. Vatavuk, Estimating Costs of Air Pollution Control, Lewis Publishers,
Chelsea, Michigan, 1990, p. 172-179.7. B.B. Crocker, "Air Pollution Control Methods" in Kirk-Othmer Encyclopedia of
Chemical Technology, Fourth Edition, Volume 1, J.I. Kroschwitz; M. Howe-Grant,Eds., John Wiley & Sons, New York, 1991, p.749-825.
8. R.T. Walsh; R.C. Murray, "Vapor Condensers" in Air Pollution EngineeringManual, J.A. Danielson, Ed., USEPA, Research Triangle Park , NC, 1973, p.198-207.
9. A.C. Stern; R.W. Boubel; D.B. Turner; D.L. Fox, Fundamentals of Air Pollution:Second Edition, Academic Press, Inc., Orlando, Florida, 1984, p. 433-436.
10. B. Henderson-Sellers, Pollution of Our Atmosphere, Adam Hilger Ltd, Bristol, GreatBritain, 1984, p. 177-181.
11. R.T. Walsh; P.G. Talens, W.C. Rogers, "Reduction of Inedible Animal Matter" inAir Pollution Engineering Manual, J.A. Danielson, Ed., USEPA, Research TrianglePark, NC, 1973, p. 815-829.
12. A.J. Buonicore, "Condensation" in Air Pollution Engineering Manual, A.J.Buonicore; W.T. Davis, Eds., Van Nostrand Reinhold, New York, 1992, p. 52-58.
13. G. Hounsell, "Condensers" in Handbook of Air Pollution Control Engineering andTechnology, J.C. Mycock; J.D. McKenna; L. Theodore, Lewis Publishers, Chelsea,Michigan, 1995, p. 223-256.
14. J.J. Spivey, "Recovery of Volatile Organics From Small Industrial Sources",Environmental Progress, 1988, Volume 7, Number 1, p. 31.
15. Polaris Corporation, http://www.engin.umich.edu/equipment/exchange/platefra.html,August, 1996
16. R.D. Griffin, Principles of Air Quality Management, Lewis Publishers, Ann Arbor,Michigan, 1994, p. 187-191.
17. H.W. Parker, Air Pollution, Prentice-Hall, Inc., Englewood Cliffs, NJ, 1977, p. 258-260.
18. S.J. Priebe, Informal Report - The Recovery of Volatile Organic Compounds, IdahoNational Engineering Laboratory, Idaho Falls, 1989, p. 5-11.
19. W.F. Connery, "Condensers", in Air Pollution Control Equipment: Selection,Design, Operation, and Maintenance, Louis Theodore; Anthony J. Buonicore, Eds.,ETS, Inc., Roanoke, Virginia, 1992, Chapter 6, p. 153-169.

26
26
20. A.J. Buonicore; L. Theodore; R.E. McKinney; G. Tchobanoglous, "Waste
Management" in Perry's Chemical Engineers' Handbook, Sixth Edition, D.W. Green;J.O. Maloney, Eds., McGraw-Hill Book Company, New York, 1984, Section 26, p.30-31.
21. J. Joseph; D. Beachler; J. Jahnke; M. Leslie; J. Henry, APTI Course 415: Control ofGaseous Emissions: Instructor's Guide, USEPA, Research Triangle Park, NC, 1981,Chapter 16.
22. D.L. Harmon; L.E. Sparks, "Conclusions from EPA Scubber Research andDevelopment" in Plant Inspection Workshop - Techniques for EvaluatingPerformance of Air Pollution Control Equipment: Operation and Maintenance ofWet Scrubbers, compiled by PEDCo Environmental, Inc., USEPA, ResearchTriangle Park, NC, 1981, p.77-101.
23. C.E. Lapple, "Dust and Mist Collection" in McGraw-Hill Encyclopedia ofEnvironmental Science and Engineering, Third Edition, S.P. Parker; R.A. Corbitt,Eds. in Chief, McGraw-Hill, Inc., NY, 1992, p. 130-132.
24. B.B. Crocker; K.B. Schnelle, "Control of Gases by Absorption, Adsorption, andCondensation" in Handbook of Air Pollution Technology, S. Calvert; H.M. Englund,Eds., John Wiley & Sons, New York, 1984, Section 4, p. 186-189.
25. A.C. Stern; R.W. Boubel; D.B. Turner; D.L. Fox, Fundamentals of Air Pollution,Academic Press, New York, 1973, p. 419-422.
26. J.G. Knudson; K.J. Bell; A.D. Holt; H.C. Hottel; A.F. Sarofim; F.C. Standiford; D.Stuhlberg; V.W. Uhl, "Heat Transmission" in Perry's Chemical Engineer'sHandbook, D.W. Green; J.O. Maloney, Eds., McGraw-Hill Book Company, NewYork, 1984, Section 10.
27. A. Bejan, Heat Transfer, John Wiley and Sons, Inc., New York, 1993, p. 444-478.28. T.K. Sherwood; C.E. Reed, Applied Mathematics in Chemical Engineering,
McGraw-Hill, New York, 1939, p. 68.29. H.M. McAdams, Heat Transmission: Second Edition, McGraw-Hill, New York,
1942, p.289.30. M. Jakob, Heat Transfer: Volume II, Wiley, New York, 1957, p. 356-365.31. Kern, Process Heat Transfer, McGraw-Hill Book Company, New York, 1950.32. R.N. Robinson, Chemical Engineering Reference Manual, Fourth Edition,
Professional Publications, Inc, Belmont, CA, 1988, Chapter 7.33. M.S. Peters; K.D. Timmerhaus, Plant Design and Economics for Chemical
Engineers, Third Edition, McGraw-Hill Book Company, New York, 1980, p.645-652.
34. J.P. Holman, Heat Transfer, McGraw-Hill Book Company, New York, 1986, p.527.35. R.C. Cowie, "Costing of Shell-and-Tube Heat Exchangers" in Hemisphere
Handbook of Heat Exchanger Design, G.F. Hewitt, Ed., Hemisphere PublishingCorporation, New York, 1990, Section 4.8.2, p. 1-5.
36. H.R. Dickson, personal communication, 1985-1988.37. A.S. Krisher; O.W. Siebert, "Materials of Construction" in Perry's Chemical
Engineers' Handbook, 6th Edition, D.W. Green; J.O. Maloney, Eds., McGraw-HillBook Company, New York, 1984, Section 23, p. 15-39.
38. H.E. Hesketh, Air Pollution Control, Ann Arbor Science Publishers, Inc., AnnArbor, Michigan, 1979, p. 137-141.

27
27
39. K.J. Bell, "Operational Problems in Process Condensers", in Condensation and
Condenser Design, J. Taborek; J. Rose; I. Tanasawa, Eds., ASME, New York, 1993,p. 55-65.
40. J.H. Siegell, "Exploring VOC Control Options", Chemical Engineering, 1996, 103,6, p. 92-96.

28
Chapter 4
Adsorption
Technology DescriptionAdsorption is a technique commonly used to remove relatively low concentrations of
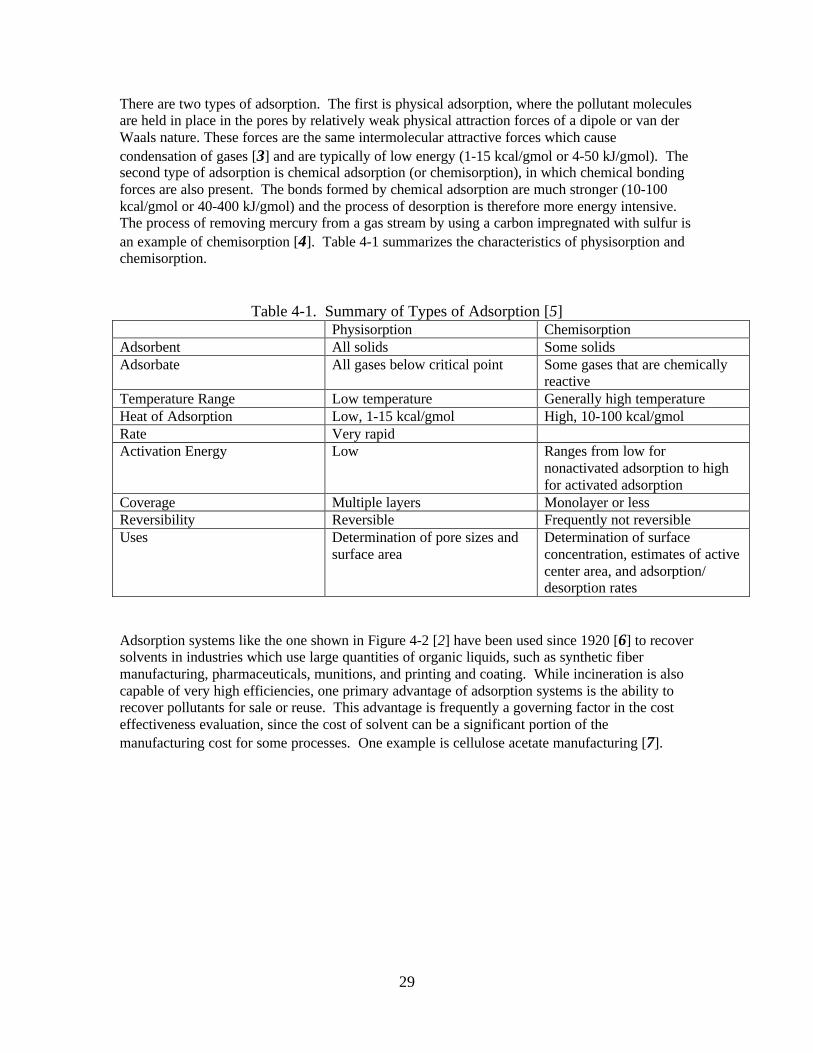
pollutants from a gas stream by trapping them on a solid with a large surface area. The solid istypically an activated carbon or a crystalline material with high internal porosity whose surfaceholds (adsorbs) the pollutant through intermolecular forces. The pore structure includesmacropores (diameters larger than 50 nm), micropores (diameters less than 2 nm), and mesopores(transitional sizes between micropores and macropores) [1]. As shown in Figure 4-1 [2], formicropores, adsorbed molecules can actually block access to internal surfaces. Diffusion andmass transfer rates govern the movement of the pollutant from the air stream to the exteriorsurface of the solid, and then from the exterior into the pore structure. The efficiency ofremoving VOCs from a gas stream by adsorption depends on the type and concentration ofpollutant, the pressure, temperature, and humidity of the gas stream as well as the pore structure,quantity of active sites, and nature of adsorbent material.
Macropore
MoleculeBlocking Pore
Area UnavailableFor Adsorption
Figure 4-1. Pore Structure (redrawn from [2])
29
There are two types of adsorption. The first is physical adsorption, where the pollutant moleculesare held in place in the pores by relatively weak physical attraction forces of a dipole or van derWaals nature. These forces are the same intermolecular attractive forces which causecondensation of gases [3] and are typically of low energy (1-15 kcal/gmol or 4-50 kJ/gmol). Thesecond type of adsorption is chemical adsorption (or chemisorption), in which chemical bondingforces are also present. The bonds formed by chemical adsorption are much stronger (10-100kcal/gmol or 40-400 kJ/gmol) and the process of desorption is therefore more energy intensive.The process of removing mercury from a gas stream by using a carbon impregnated with sulfur isan example of chemisorption [4]. Table 4-1 summarizes the characteristics of physisorption andchemisorption.
Table 4-1. Summary of Types of Adsorption [5]Physisorption Chemisorption
Adsorbent All solids Some solidsAdsorbate All gases below critical point Some gases that are chemically
reactiveTemperature Range Low temperature Generally high temperatureHeat of Adsorption Low, 1-15 kcal/gmol High, 10-100 kcal/gmolRate Very rapidActivation Energy Low Ranges from low for
nonactivated adsorption to highfor activated adsorption
Coverage Multiple layers Monolayer or lessReversibility Reversible Frequently not reversibleUses Determination of pore sizes and
surface areaDetermination of surfaceconcentration, estimates of activecenter area, and adsorption/desorption rates
Adsorption systems like the one shown in Figure 4-2 [2] have been used since 1920 [6] to recoversolvents in industries which use large quantities of organic liquids, such as synthetic fibermanufacturing, pharmaceuticals, munitions, and printing and coating. While incineration is alsocapable of very high efficiencies, one primary advantage of adsorption systems is the ability torecover pollutants for sale or reuse. This advantage is frequently a governing factor in the costeffectiveness evaluation, since the cost of solvent can be a significant portion of themanufacturing cost for some processes. One example is cellulose acetate manufacturing [7].

30
Condenser
RegeneratingSteam
Outlet
Pretreatment
Figure 4-2. Typical Process Flow Diagram of an Adsorption System (redrawn from [2])
Another advantage of adsorption systems is that they work well with a wide range of adsorbateconcentrations. If designed and operated properly, the removal efficiencies, which can exceed98% [8], result in low outlet concentrations consistently, even with inlet concentrations exceeding10,000 ppm.
Once the pollutant (or adsorbate) is adsorbed onto the surface of the solid (or adsorbent), thepollutant is held in place by van der Waals forces or by capillary condensation [3, 9, 10, 11].Eventually, the pores are full or entry of additional molecules is blocked, and the solid is unableto adsorb any more pollutant. At this point, the solid is said to be “saturated” and is removedfrom service. It may be discarded or sent back to the manufacturer to be “cleaned out”, or it maybe regenerated in place. Regeneration or desorption is the process of using heat or lowerpressure to reverse the adsorption process. Direct steam injection is the most widely usedmethod of providing heat for regeneration [12]. However, heating coils, hot air, microwaveradiation and infrared radiation have also been used or investigated [13, 14]. A technique calledpressure swing adsorption or “PSA” [15] may also be used, in which the adsorption cycle isunder high pressure and the desorption is accomplished by operating the adsorber at a lowerpressure [16].
Although it may seem somewhat pointless to adsorb the pollutant onto the surface of a solid onlyto drive it off again, the amount of air present during the desorption process is considerably lessthan that in the original gas stream, and a vapor stream with a much higher concentration isproduced. The vapor stream is usually condensed to recover the pollutant [17]. If the pollutant isnot water soluble, the condensed liquid stream can be decanted to produce a stream of relativelypure organic liquid. If the pollutant is water soluble, the condensed liquid stream is typicallydistilled from the condensed steam to recover the organic liquid [18] or the entire stream is sentto a wastewater treatment plant for disposal.
Adsorbers are frequently paired with other control systems, such as condensers used after thedesorption cycle to cool and liquify the steam/pollutant mixture. Condensers may also be used

31
before the adsorption equipment to reduce the concentration of a pollutant to a safer level, such asone that is below the lower explosive limit of the gas stream (LEL) or to a level where the heat ofadsorption is not sufficient to start a fire in the adsorber. Adsorption is an exothermic process andthe heat that results from adsorption of large concentrations of a pollutant can be dangerous if notproperly dissipated or controlled with relative humidity [19]. Having water present in the bed oras humidity in the gas stream provides a heat sink and allows better control of the exothermicprocess. However, water must be used with caution, since it competes to some degree with thepollutant for sites on the adsorbent. This effect is much less evident with activated carbon (a non-polar adsorbent) than with other adsorbents such as zeolites and aluminosilicates (which arepolar).
Adsorption is also used in conjunction with incinerators, providing a means of concentrating thegas stream prior to destruction and lowering the overall amount of energy required forcombustion. For example, a pollutant in dilute concentrations can be adsorbed onto carbon, thendesorbed using hot air. By the adsorption/desorption cycle, the concentration of pollutant in theair can be increased significantly, decreasing the volume of air that must be heated to thecombustion temperature [20].
Adsorption is well suited for organic compounds which have molecular weights in the range of40 to 130 [21, 22] and boiling points in the range of approximately 290 to 420 K (21 to 150 oC,70 to 300 oF) [10]. These compounds have high enough boiling points to be adsorbed(compounds that are gases at room temperature are not adsorbed to a substantial amount) [23]and low enough boiling points to be removed from the adsorbent. Adsorption is similar to theprocess of distillation [3] in that heavier compounds are retained better than lower boilingcompounds and remain in the carbon, much as they would remain on the lower trays of adistillation column. By this process, the heavier, higher-boiling compounds replace the lighterweight, lower boiling compounds that are adsorbed. The higher boiling compounds are also moredifficult to displace during regeneration, so they tend to accumulate in the bed. The presence ofsuch compounds occupies active space in the pores and decreases the efficiency of the carbonbed. This is particularly a problem in processes where lubricating oils are used; even very smallconcentrations of lubricant can significantly affect the performance of a carbon bed [7]. It isgenerally accepted that adsorption in the carbon bed occurs only within a fairly small zone calledthe mass transfer zone or MTZ [13, 24] The size of the MTZ depends on the velocity of airthrough the carbon bed, the pollutant characteristics, the temperature and pressure, and thehumidity. Air is usually fed down through the carbon in the adsorber to avoid fluidizing the bed,to avoid creating channels for the air to bypass the carbon, and to avoid abrading the carbon anymore than necessary. As vapor first enters the top surface of the carbon, the majority of thepollutant is removed from the gas stream before the gas travels very far into the bed. Masstransfer may actually only occur in the top three or four inches of carbon [9]. In the activeadsorption zone, an equilibrium is reached between the gaseous molecules which impinge and areretained on the surface and those which are in the gas phase. There is a constant process ofadsorption and desorption as molecules move. The equilibrium ratio of the amount of pollutantadsorbed to the partial pressure of pollutant in the gas stream at a constant temperature isrepresented by an isotherm. Isotherms of some typical pollutants are shown in Figure 4-3 [25,26].

32
Figure 4-3. Isotherms of Typical Pollutants at 298 K (25 oC, 77 oF) [25, 26]
Figure 4-4 [25] depicts the change that occurs in the pollutant concentration at various depths inthe bed as time progresses. At the beginning of the adsorption cycle (curve “a”), the bedimmediately starts adsorbing pollutant, and the concentration declines rapidly over a very shallowportion of the bed (the critical bed depth, Lc). As the top layers become saturated, theconcentration of pollutant in that those layers becomes the same as the incoming gas. But there isrelatively fresh carbon which has not been exposed to high concentrations of pollutant below thesaturated layer. The mass transfer zone (represented by Tc in the diagram) shifts down, and theadsorption continues (the same process is depicted in Figure 4-5 [13]). By this process, the masstransfer zone works its way down the bed until its leading edge comes to the bottom of the carbonbed (curve “b” in Figure 4-4). This point, at which the concentration of organic in the exhauststream begins to rise rapidly, is referred to as the breakthrough point. That is, the point at whichthe mass transfer zone is exiting the carbon bed, and (virtually) complete adsorption of thepollutant is no longer occurring.

33
a b c d
Exiting GasStream
Air Flow
Bed Depth
LcCl
VaporConcentration
C
TcCi
D
PenetrationCe = Ct
Figure 4-4. Progress of Adsorption Mass Transfer Rate Through the Bed (adapted from[25])
The mass transfer zone concept makes it evident that, at any given time, only a small portion ofthe carbon is actually being used in the adsorption process; there is carbon which has not yetencountered the mass transfer zone and carbon which is saturated, but only a few inches of thecarbon may actually be in use. Since stationary carbon beds can be several feet deep [27], thereis a substantial amount of carbon which is needed to maintain a reasonable adsorption cycle time,but is not in active use.
Bed Behind Adsorption ZoneSaturated With Pollutant
Co CoCoCo
C1 C2 C3 C4
C4
C3C2C1
Volume OfEffluent Treated
Breakpoint
BreakthroughCurve
ConcentrationOf Solute In
Effluent
AdsorptionZone
Figure 4-5. Flow of the Mass Transfer Zone Through the Bed [13]

34
The length of the mass transfer zone is determined by the pollutant characteristics, inletconcentration, and velocity through the bed. The amount of time that the bed can adsorbbefore reaching the “breakthrough” point can be calculated from the following equation[25]:
ρ−=
t
m
m
Cpp C
Cln
K
Q
QC
ww t 4-1
where: tp = breakthrough time, minwp = capacity of carbon to adsorb pollutant, kg pollutant/ kg carbon (lb pollutant/lbcarbon)wc = weight of carbon, kg (lb)Cm = inlet concentration, kg/m3 (lb/ft3)Q = actual flowrate, m3/min (ft3/min)ρ = density of activated carbon, kg/m3 (lb/ft3)K = pseudo first order reaction rate constant derived experimentallyCt = breakthrough concentration kg/m3 (lb/ft3)
Operation of the carbon bed can be optimized using the amount of carbon, type of carbon, carbonreplacement schedule, and bed depth to diameter ratio as variables. For large installations,collection of experimental data and pilot studies are essential to optimize these variables.
Types of Adsorption SystemsThe conventional adsorber vessel (Figure 4-6) is a fairly long cylinder which may be
installed in either a vertical or horizontal position [23]. The bed of adsorbent material is severalfeet thick and is suspended on a screen. Vapor laden air flows down through the bed.Regeneration steam is frequently introduced from the bottom of the vessel. Several other typesof adsorber vessels have been developed to maximize contact of the adsorbent with the gasstream and to minimize the amount of carbon in the system.
Steam AndVapor Outlet
Cylinder
CarbonBed
Steam Inlet
Figure 4-6. Conventional Adsorber Bed (adapted from [2])

35
Moving bed adsorbers are similar to fixed bed adsorbers, but the carbon is usually contained in ahollow cylinder or a disk -shaped packed bed (see Figure 4-7) [2, 28]. While one section of thecarbon is adsorbing, another section is being steamed.
ActivatedCarbon Bed
Purified Air Out
Steam Inlet
Vapor Laden Air In
Steam And Vapor Out
Steam And Vapor Out
Vapor Laden Air In
Figure 4-7. Moving Bed Adsorber [redrawn from 2]
Another type of adsorber designed to minimize the amount of carbon is the fluidized bedadsorber, (Figure 4-8 [11]). In a fluidized bed adsorber, the gas flows up through the carbon andsuspends it. The carbon, which is in intimate contact with the gas stream, adsorbs the pollutantsand works its way down the column and is replaced by recycled carbon introduced at the top ofthe adsorber. A regenerative section is also included in the fluidized bed; it may be at the top ofthe fluidized bed so that carbon is regenerated immediately before entering the adsorbing section[29], or it may be at the bottom of the adsorption section [3]. Table 4-2 gives a list ofinstrumentation that should be considered for adsorption systems.

36
CleanedGas
ContaminatedGas
Reg. Gas PlusAdsorbed
Contaminants
HotRegenerating
Gas
SolidsAir Lift
Air
Air
Ads
orpt
ion
Sec
tion
Reg
ener
atio
nS
ectio
n
Sieve Tray
DownSpout
Spring
Figure 4-8. Fluidized Bed Adsorber (adapted from [11])
Table 4-2. Instrumentation to Consider for Adsorption SystemsGas stream temperature and pressure (inlet and outlet)
Fan speedOutlet concentration
Bed temperatureHumidity
Adsorption System DesignFor continuous processes in which regenerative adsorption is used, several adsorbers are
installed in parallel so that one or more are always available for adsorption while used ones are

37
regenerating (see Figure 4-9). It is also advantageous to operate the system in a “cooling” mode[30] in which the adsorber that has just finished steaming is not put directly on line, but takes theexhaust gas from an active adsorber. Routing the exhaust gas from the primary adsorbing bedthrough the “cooling” bed accomplishes two things. First, the relatively cool air serves to removethe heat from the steamed bed and dries it out, so that sites are available for organic vaporadsorption instead of being occupied by water molecules. Second, as the primary adsorbing bedbecomes saturated and the exhaust concentration starts to rise, the exhaust gas is still being routedthrough the “cooling” bed. Since the cooling bed by this point in the cycle, is cooled and almostdry, it provides a clean bed to adsorb any residual organics before they are exhausted. Once theadsorbing bed reaches the breakthrough point (the point at which the concentration of organiccompounds in the exhaust begins to increase dramatically), it is taken off line and steamed.Similarly, the bed that was in the “cooling” mode switches to be the primary bed for adsorptionand the bed that was steaming begins the cooling cycle.
Figure 4-9. Schematic Diagram of the Cooling Cycle (adapted from [20])
In any regenerative adsorption system, some amount of pollutant remains in the adsorbent afterregeneration is complete. This leftover portion is referred to as the “heel.” The magnitude of theheel can be changed by adjusting the temperature, pressure, length of the regeneration step, or byusing activated carbon from a different source, but it is economically unfeasible to eliminate italtogether. A balance must be struck between the amount of heel left in the solid and the amountof steam used for the desorption. It is not cost effective nor possible under normal timeconstraints to continue the steaming past an optimum time at which the vast majority of theadsorbate has been removed.
In addition to the amount of adsorbent available, the type of adsorbent also significantly impactsthe effectiveness of the system. A wide variety of solids are available for use in adsorptionsystems. The most common is activated carbon, also referred to as activated charcoal. Due to itsnon-polar nature, it is the adsorbent best suited for most VOC abatement systems, and is the only

38
one discussed in the remainder of this section. Other adsorbents include silica gel; zeolites (ormolecular sieves), which have a very precise crystal structure and pore size; and carbonmolecular sieves [31], an activated carbon made from polymeric materials which also hasuniform pores.
The phenomenon in which higher boiling compounds replace low-boiling compounds has led tothe development of “sacrificial” or “suicidal” carbon beds. These are beds which are placed infront of another control device to remove heavier compounds which might otherwise destroy thefinal control equipment [6]. The sacrificial bed is replaced or regenerated well beforebreakthrough of the heavier compound occurs. One potential application for such a system is inthe manufacture of ammunitions containing nitroglycerine. Organic solvents used in theproduction of propellents are driven off by evaporation. In propellant formulas which alsocontain nitroglycerine, the nitroglycerine is also emitted, making it unsafe to collect or control thesolvent emissions. It has been suggested that a sacrificial bed could be used to collect the heaviernitroglycerine vapors. This would be followed by a separate carbon bed to recover the othersolvents. Such a system would also have to include an acid bath or other means of destroying thenitroglycerine once it accumulates in the carbon, but the sacrificial bed offers an alternative to thecurrent method of exhausting the vapors without control [32].
There are several methods to determine the appropriate size of a carbon bed. One of the simplestmethods, given by Vatavuk [26], uses Freundlich isotherms to predict the amount of carbonnecessary to accomplish the desired removal. The following equation is used to determine themaximum amount of pollutant which can be adsorbed onto the carbon under a given set ofconditions:
we = k(CF P)m 4-2
where we = the maximum amount of pollutant that is adsorbed under the given conditions,expressed as kg (or lb) of adsorbate/ kg (or lb) of adsorbent,
CF = conversion factor equal to 1.45x 10⁻⁴ for pressures in Pa (1 for pressuresin psia)P = partial pressure of the pollutant in kPa (or psia), andk, m = pollutant specific isotherm parameters (see Table 4-3 [26, 33]). Valuesshould not be extrapolated outside of the applicable range listed in the table.
The total amount of pollutant to be removed from the gas stream is calculated by thefollowing equation:
M = C * A * MW /F 4-3
where:M = Mass of pollutant to be adsorbed, kg/hr (lb/hr),C = Concentration of pollutant, ppmv (ppmv)A = Air Flow, Nm3/hr, corrected to 0 oC, (scfm, the air flow corrected to 70 o F), andMW = Molecular weight of pollutant, kg/kg-mole (lb/lb-mole)F = Conversion factor of 2.24 x 10⁷ (6.42 x 10⁶)
Once the amount of pollutant to be adsorbed is determined, the required amount of carbon iscalculated by dividing the mass of pollutant (M) by the mass loading (we). Since the resultingcarbon requirement represents the amount needed to adsorb the pollutant under ideal equilibrium

39
conditions, a safety factor of 100% is customary [26]. Therefore, the total amount of carbon inthe system is generally twice that which would be required under ideal conditions.
Other design equations and procedures are given by LeVan, Carta, and Yon in Perry’s ChemicalEngineers’ Handbook [34], and Buonicore and Theodore [11, 35]. Although these procedurescan be used for initial cost estimates and to estimate the size of the adsorbers, empirical data isessential to proper design of a carbon adsorption system [36]. Any potential application shouldbe tested on a lab scale, not only to determine the feasibility and efficiency which can beachieved, but also to evaluate the effectiveness of various carbons for the given application. Twocarbons of the same size, even if produced from the same raw material using the same process,but at different plants, will behave differently in the same recovery system [7]. For the bestperformance, different types of carbons should be tested with the VOC of interest to determinenot only the efficiency with which each adsorbs the compound, but also the degree of desorptionthat can be accomplished, the susceptibility of the carbon to abrasion, and the incrementalpressure drop through the carbon.
Table 4-3. Isotherm Parameters [26]Ads.Temp Isotherm
ParametersApplicable Partial PressureRange
Adsorbate K oC oF k m Pa psiaBenzene 298 25 77 0.597 0.176 0.7-340 0.0001-0.05Chlorobenzene 298 25 77 1.05 0.188 0.7-70 0.0001-0.01Cyclohexane 311 38 100 0.508 0.210 0.7-340 0.0001-0.05Dichloroethane 298 25 77 0.976 0.281 0.7-280 0.0001-0.04Phenol 313 40 104 0.855 0.153 0.7-210 0.0001-0.03Trichloroethane 298 25 77 1.06 0.161 0.7-280 0.0001-0.04Vinyl Chloride 311 38 100 0.200 0.477 0.7-340 0.0001-0.05m-Xylene 298 25 77 0.708 0.113 0.7-7 0.0001-0.001
298 25 77 0.527 0.0703 7-340 0.001-0.05Acrylonitrile 311 38 100 0.935 0.424 0.7-100 0.0001-0.015Acetone 311 38 100 0.412 0.389 0.7-340 0.0001-0.05Toluene 298 25 77 0.551 0.110 0.7-340 0.0001-0.05
Economic EstimatesCapital costs of the adsorption system are dependent on the gas flow, concentration, and
the required efficiency. A procedure for estimating the installed capital cost of an adsorptionsystem is given in the OAQPS Control Cost Manual [26]. Any estimates derived from thesecalculations should be checked with a vendor for confirmation. The estimates also need to bescaled up to current values. Scaling factors can be found on the EPA CATC website athttp://www/epa.gov/ttn/catc. Once the total amount of carbon that is required and the number ofadsorbers to be used in the system is determined, the capital cost of each adsorber vessel can becalculated based on the surface area of each vessel, according to the equations given below. Notethat the equations are based on the amount of carbon in each vessel and the gas flow rate througheach actively adsorbing vessel. In SI units, the vessel diameter is calculated from:
D = 7.93 x 10⁻³ MCA vb/ QA 4-4
In English units, the equation is:

40
D = 0.127 MCA vb/ QA 4-5where: D = diameter of the required adsorber vessel, (or ft)
MCA = mass of carbon in each adsorber, kg (or lb)vb = superficial velocity through the bed, m/min (ft/min)QA = actual flowrate of gas through each adsorber that is on-line, m3/min(acfm)
The adsorber length is calculated in SI units from the equation:
L = 126 QA2/ (MCA vb
2) 4-6
In English units, the equation is:
L = 7.87 QA2/ (MCA vb
2) 4-7
where: L = length of the adsorber vessel, m (or ft)
Once the diameter and length of the vessel are determined, the surface area is calculatedfrom the following equation:
S = π D (L + D/2) 4-8where: S = surface area, m2 (or ft2)
Then the vessel cost is estimated from:CV = 9.71 S 0.778 for SI units 4-9CV = 271 S 0.778 for English units 4-10
where CV is the cost of each vessel in fall, 1989 dollars
These estimates are valid for horizontal adsorbers made of 304 stainless steel which arelarger than approximately 0.7 to 1 meters (2 to 3 feet) in diameter, with surface areasbetween 9 and 196 m2 (97 and 2110 ft2). Other materials of construction maysignificantly alter the cost. See Chapter 3 for factors for other metals. The cost ofductwork, stacks, pumps, fans, condensers, instrumentation, piping, and a decanter arenot included in this cost. The ratio of the total system cost (with the exception ofinstrumentation and site specific requirements such as long ductwork) to the vessel costsare estimated from the following formulas.
In SI units:
RC = 3.62 Q –0.133 4-11
In English units:
RC = 5.82 Q –0.133 4-12

41
where RC = ratio of total equipment cost to adsorber costQ = actual flowrate of entire system, m3/min (or ft3/min)
The total system cost can then be estimated from:
CC = RC (N CC MCA + N CV) 4-13
where CC = capital cost of adsorption equipment N = number of vessels required
CC = Cost of carbon, approximately $4.40 / kg ($2/lb) in fall 1989 dollars
The total capital investment can be estimated from the factors in Table 4-4. Particulateremoval devices and site-specific construction requirements are not included. If theadsorption system is to be placed a long distance from the generation site, both the cost ofadditional ductwork and the cost of additional booster fans should be included in the costestimate. As with the other chapters in this book, the cost estimates are to indicate ageneral order of magnitude. They are not specific enough to use as construction costsand should be confirmed with actual prices from vendors.Annual costs may be approximated using the guidelines in the OAQPS Cost Control Manual [26],as given in Table 4-5. Expected pressure drop through a bed of 4 x 10 mesh Calgon “PCB”carbon can be estimated as [26, 33]:
In SI units:
bP∆ = (2.12x10⁻⁴ vb + 2.03 x 10⁻⁶ vb2)0.0333 MAC/ (L D) 4-14
in English units:
bP∆ = (0.03679 vb + 1.107 x 10⁻⁴ vb2)0.0333 MAC/ (L D) 4-15
where bP∆ = pressure drop through the adsorber bed, kPa (or in of water column)

42
Table 4-4. Factors for Estimating the Total Installed Capital Cost of Adsorption Systems[26]
Cost Element Estimated CostDirect Costs Purchased Equipment Cost Adsorber system and Auxiliary Equipment CC, Estimated from equation Instrumentation 0.10 CC Taxes 0.03 CC Freight 0.05 CC Total Purchased Equipment Cost, PEC 1.18 CC
Installation Costs Foundations and Supports 0.08 PEC Erection and Handling 0.14 PEC Electrical 0.04 PEC Piping, Insulation, and Painting 0.04 PEC Total Installation Cost 0.30 PEC
Site Preparation As required for specific site, SP Buildings As required for specific site, BLDG
Total Direct Costs 1.30 PEC + SP + BLDG
Indirect Costs Engineering and Supervision 0.10 PEC Construction, Field Expenses, and Fees 0.15 PEC Start-up and Performance Test 0.03 PEC Contingency 0.03 PEC Total Indirect Costs 0.31 PEC
TOTAL INSTALLED CAPITAL COSTS, TCC 1.61 PEC + SP + BLDG
In addition to the pressure drop calculated above, 0.25 kPa (1 in of water column) shouldbe included to account for losses through the ductwork. If long or complex ductwork isused, the miscellaneous pressure drop could be much higher. Electricity requirementscan then be estimated from the following formulas.
In SI units:Power = 1.65x10⁻² Q η∆ /P 4-16
In English units:Power = 1.17x10⁻⁴ Q η∆ /P 4-17
where: P∆ = pressure drop across the entire system, kPa (in of water column)η = combined efficiency of motor and fan, usually 35-65%

43
Operating and maintenance labor requirements are usually minimal, at approximately one halfhour per shift each.
Table 4-5. Annual Operating Costs for Adsorption Systems [26]Direct Annual Costs Unit Cost Estimated Requirement Utilities: Electricity $0.05/ kWh Calculated above Steam $13/1000 kg
$6/1000 lb3 to 4 kg steam /kg ofVOC adsorbed (lb steam/lb VOC adsorbed)
Cooling Water $40 to 80/1000 m3
$0.15 to 0.30/ 1000 gallons3.43 times the steamrequirement
Operating Labor $12.96/h ½ hour per shift Maintenance Labor $14.26/h ½ hour per shift Maintenance Materials Equal to maintenance labor Supervisory Labor 15% of Operating Labor Replacement Carbon $4.40/kg * 1.08 (shipping and
taxes) * CRF5 (see below forcalculation, assuming a fiveyear life)$2.00/ lb* 1.08* CRF5
Carbon requirementcalculated above
Replacement Carbon Labor CRF5 * $0.11/kgCRF5 * $0.05/lb
Carbon requirementcalculated above
Indirect Annual Costs Overhead 60% of Maintenance Costs Property Tax 1% of TCC Insurance 1% of TCC Administrative Costs 2% of TCC Capital Recovery(CRF = i(1+ i)n/[(1+ i)n-1]where i = pretax marginal rate of return n = economic life of equipment,usually 10 to 20 years
CRF * TCC
Total Annual Operating Costs Direct + Indirect Operating Costs
Potential ProblemsProper operation of an adsorption system depends on adequate contact between the
adsorbent and the adsorbate. Sudden changes in air velocity or poor provisions for airdistribution in a carbon bed can result in turbulent air flow patterns in which the adsorbent isphysically moved and a hollowed spot in the bed results. Air flows more readily through the thinspot in the bed, so that portion of the carbon quickly becomes saturated and the overall capacityof the adsorption system is decreased significantly. Such a problem can be detected if the systemis equipped with an analyzer and recorder of the organic vapor concentration in the exhaust fromthe adsorber. Normally, such analyzers are used to monitor exhaust concentration from each bedat the very end of the cycle. However, for suspected problems, the analyzer should be capable of

44
continuously measuring the exhaust concentration from any one bed, so that problems can beidentified and isolated as quickly as possible. The normal exhaust concentration curve will starthigh when the bed is wet, but will quickly decrease as the bed dries out and begins to adsorb. Itwill reach a minimum where it should remain until just before the adsorber is removed fromservice for regeneration. At that point, the curve will increase very sharply as breakthroughoccurs. By comparing the shape of the concentration curve in a troublesome adsorber with theanticipated shape, conclusions about what might be wrong can be made without having to removethe adsorber from service. For example, if the curve comes down steeply when the adsorption isinitiated but starts back up gradually, it may indicate that there is a thin spot in the bed, allowingthe polluted gas to bypass the majority of the bed. Once the carbon in the thin spot becomessaturated, the removal efficiency starts to decline. If the curve never reaches the anticipatedminimum, it may indicate that there are leaking steam valves so the bed is remaining wet all ofthe time or that there are leaking isolation valves that allow untreated air to be directly exhaustedinstead of traveling through the adsorber bed.
The potential for fouling due to lubricant oils or other heavy organic contaminants has alreadybeen discussed. Another source of problems is particulate matter in the gas stream. Particulatesalso block access of the gases to the pores and cause a gradual increase in pressure drop as theyaccumulate in the bed. In gas streams where solids are likely to be present, a simple particulatefilter should be installed prior to the adsorbers [37].
As noted earlier, the presence of organic vapors, carbon, oxygen, and heat from regeneration raiseconcerns about the possibility of fires in the adsorption beds. It is advisable to ensure thatanytime steam is used to regenerate carbon, the bed is adequately cooled before it is exposed toair. This is particularly important if high pressure steam is used to revitalize the carbon. Thetemperatures achieved in such a scenario are adequate to cause spontaneous combustion of thecarbon if oxygen is available [38].
The heat and presence of the carbon can cause some compounds such as acrylic acid, phenol, 2-ethylhexanol, and toluene diisocyanate [6] to polymerize. Polymerized compounds are heavierthan the original chemical and hence, more difficult to desorb from the carbon. As with othercontaminants, the polymeric substance occupies available sites on the carbon and decreasesoverall effectiveness.
Installation, Operation, and Maintenance ConsiderationsPerhaps the most important detail in maintaining the efficiency of an adsorber unit is to
eliminate any duct inleakage or unnecessary dilution air. An equilibrium is established in thecarbon as the gas makes its way through the bed. The equilibrium is concentration dependent, soif the pollutant is more dilute, not as much adsorbate will be retained on the carbon. Additionalair also means that the gas must travel faster through the bed, and the retention time is decreased.This combination of factors makes the daily or weekly check for duct damage critical. Inaddition to the typical inspection for obvious holes or creases, old ducting should also be checkedfor structural integrity, since the duct can be abraded to only a very thin porous shell withoutnoticeable damage [7]. The concentration in the ductwork should be routinely checked to ensurethat it never approaches unsafe levels.
Temperature is another important factor in maintaining the equilibrium. The lower thetemperature, the more pollutant is adsorbed in a given system [2]. Table 4-6 gives the overalladvantages and disadvantages of adsorption systems.

45
Table 4-6. Advantages and Disadvantages of Adsorption Systems
Advantages Disadvantages
Allows for recovery / concentration of thepollutant
Effectiveness is pollutant-specific, depends onvapor pressure of compound
Usually no additional pollutants formed Potential corrosion with some organic solvents(ketones, halogenated compounds)
High efficiency over a wide range ofconcentrations and pollutants
Treatment of wastewater stream required

46
References 1. S. Lowell; J.E. Shields, Powder Surface Area and Porosity, Chapman and Hill, New
York, 1991.2. G.T. Joseph; D.S. Beachler, APTI Course 415 Control of Gaseous Emissions:
Student Manual, USEPA, Research Triangle Park, NC, 1981, p.5-1 to 5-39.3. J.C. Mycock; J.D. McKenna; L. Theodore, “Adsorption” in Handbook of Air
Pollution Control Engineering and Technology, Lewis Publishers, New York, 1995,Chapter 10, p. 173-198.
4. J.C. Crittenden; R.D. Cortwright; B. Rick; S. Tang; and D. Perram, “Using GAC toRemove VOCs from Air Stripper Off-Gas,” American Water Works AssociationJournal, 80, 5, 73-84.
5. J.J. Carberry, Chemical and Catalytic Reaction Engineering, McGraw-Hill, NewYork, 1976.
6. T.E. Cannon, “Carbon Adsorption Applications,” in Air Pollution Control andDesign Handbook (in Two Parts), P.N Cheremisinoff; R.A.Young, Eds., MarcelDekker, Inc, New York, 1977, p. 421-429.
7. J. Hoskins, personal communication, 1985-1988.8. R.Y. Purcell; G.S. Shareef, Control Technologies for Hazardous Air Pollutants,
USEPA, Research Triangle Park, NC, 1986, p. 24.9. T.M. Hellman, “Odor Control by Adsorption”, in Air Pollution Control and Design
Handbook (in Two Parts), Part II, P.N. Cheremisinoff, R. A. Young, Eds., MarcelDekker, Inc., New York, 1977, p. 991-1003.
10. J.O. Ledbetter, Air Pollution in Two Parts: Part B - Prevention and Control, MarcelDekker, Inc., New York, 1974, Chapter 17, p.123-133.
11. A.J. Buonicore; L. Theodore, Industrial Control Equipment for Gaseous Pollutants,Volume I, CRC Press, Cleveland, Ohio, 1975, p.132-202.
12. R.G. Wynne; L.P. Spencer, "Adsorbers" in Air Pollution Control Equipment:Selection, Design, Operation, and Maintenance, L. Theodore; A.J. Buonicore, Eds.,ETS, Inc., Roanoke, Virginia, 1992, Chapter 4, p. 73-132.
13. A.J. Buonicore, “Adsorption” in Air Pollution Engineering Manual, A.J. Buonicore;W.T. Davis, Eds., Van Nostrand Reinhold, New York, 1992, Chapter 2, p. 15, 31-52.
14. C.S. Fang; S. Khor, “Reduction of Volatile Organic Compounds in AqueousSolutions Through Air Stripping and Gas-Phase Carbon Adsorption,” EnvironmentalProgress, 8, 4, 270-278.
15. K.E. Noll; V. Gounaris; W.S. Hou, Adsorption Technology for Air and WaterPollution Control, Lewis Publishers, Inc., Chelsea, Michigan, 1992, p. 1-45, 76-79,279-297.
16. J.D. Sherman, “Adsorption, Gas Separation” in Kirk Othmer Encyclopedia ofChemical Technology, Fourth Edition, Volume I, A to Alkoids, J.I. Kroschwitz; M.Howe-Grant, Eds., John Wiley and Sons, New York, 1991, p. 493-528.
17. M.F. LeDuc, “Adsorption Equipment” in Air Pollution Engineering Manual, John A.Danielson, EPA, Research Triangle Park , NC, 1973, p. 189-198.
18. J.P. Tomany, Air Pollution: the Emissions, the Regulations, & the Controls,American Elsevier Publishing Company, Inc., New York, 1975, p.272-305.

47
19. H.E. Hesketh, Air Pollution Control, Ann Arbor Science Publishers, Inc., Ann
Arbor, Michigan, 1979, Sections 4.5, 5.6, and 6.6.20. B.B. Crocker, K.B. Schnelle, “Adsorption” in Handbook of Air Pollution
Technology, S. Calvert, and H.M. Englund, Eds., John Wiley & Sons, New York,1984, Chapter 3, p. 162-185.
21. N. Mukhopadhyay; E.C. Moretti, Current and Potential Future Industrial Practicesfor Reducing and Controlling Volatile Organic Compounds, Center for WasteReduction Technologies, American Institute of Chemical Engineers, New York,1993, p. 17-19.
22. R.M. Bethea, Air Pollution Control Technology: An Engineering Analysis Point ofView, Van Nostrand Reinhold Company, New York, 1978, Chapter 13, p. 366-393.
23. D.E. Painter, Air Pollution Technology, Reston Publishing Company, Inc., Reston,Virginia, 1974, p. 185-188.
24. T. Godish, Air Quality, Second Edition, Lewis Publishers, Chelsea, Michigan, 1991,p. 325-326.
25. T.A. Dorling, “Carbon Adsorption” in Odour Control: A Concise Guide, F.H.H.Valentin; A.A. North, Eds., Warren Spring Laboratory, Stevenage, Hertfordshire,Great Britain, 1980.
26. W.M. Vatavuk; W.L. Klotz; R.L. Stallings, “Carbon Adsorption” in OAQPS ControlCost Manual, 4th Ed., W.M. Vatavuk, USEPA, Research Triangle Park, NC, 1990(including subsequent amendments), Chapter 4, available on the web athttp://www.epa.gov/ttn/catc.
27. J. Laznow; A. Patkar, “Gaseous Toxic Air Pollutant Control Technologies” in ToxicAir Pollution Handbook, D.R. Patrick, Ed., Van Nostrand Reinhold, New York,1994, Chapter 21, p. 373-397.
28. G.E. Keller, “Adsorption: Building Upon a Solid Foundation,” ChemicalEngineering Progress, October, 1995, p. 56-68.
29. A. Turk, "Adsorption" in Air Pollution, Third Edition, Volume IV: EngineeringControl of Air Pollution, A.C. Stern, Ed., Academic Press, New York, 1977, Chapter8, p.329-363.
30. G.T. Joseph; D. Beachler, APTI Course 415: Control of Gaseous Emissions: StudentWorkbook, EPA, Research Triangle Park, NC, 1981.
31. C.D. Cooper; F.C. Alley, Air Pollution Control: A Design Approach, SecondEdition, Waveland Press, Prospect Heights, Illinois, 1994, Chapter 12, p. 379-409.
32. J. Joseph; D. Beachler; J. Jahnke; M. Leslie; J. Henry, APTI Course 415 Control ofGaseous Emissions: Instructor’s Guide, USEPA, Research Triangle Park, NC, 1981.
33. Adsorption Handbook, Calgon Corporation, Pittsburgh, PA, 1980.34. M.D. LeVan; G. Carta; C.M. Yon, “Adsorption and Ion Exchange” in Perry’s
Chemical Engineers’ Handbook, 7th Ed., D.W. Green; J.O. Maloney, Eds., McGraw-Hill, New York, 1997, Section 16, p. 16-1 to 16-66.
35. L. Theodore; A.J. Buonicore, Air Pollution Control Equipment Volume II: Gases,CRC Press, Inc., Boca Raton, Florida, 1988, Chapter 10, p. 42-77.
36. D.M. Ruthven, “Adsorption” in Kirk Othmer Encyclopedia of Chemical Technology,Fourth Edition, Volume I, A to Alkoids, J.I. Kroschwitz; M. Howe-Grant, Eds., JohnWiley and Sons, New York, 1991, p.493-528.

48
37. K. Noll; W.J. Franek; L. Stander, APTI Course 482: Sources and Control of Volatile
Organic Pollutants: Instructor’s Guide, USEPA, Research Triangle Park, NC, 1987.38. H.R. Dickson, personal communication, 1985-1988.

49
Chapter 5
Absorption
Technology DescriptionAbsorption (also known as scrubbing) is a process in which pollutants in a contaminated gas
stream are dissolved into a solvent liquid stream by mass transfer [1]. The driving force is the differencein the partial pressure of the pollutant in the gas stream and the vapor pressure (or solubility) of the samecomponent in the liquid. A low vapor pressure of the component in the liquid stream indicates that thecomponent is less likely to come out of the liquid, and is therefore soluble [2]. Because this equilibriumestablishes the effectiveness and size of the absorption equipment, it is very important that a solvent bechosen in which the organic contaminant is as soluble as possible. The size of absorption systems canalso be minimized by using a liquid which results in a reaction with the pollutant. This process, calledchemical absorption, reduces the concentration of pollutant in the liquid and drives the absorption towardcompletion [3]. The process which does not use a chemical reaction but relies on the solubility toremove the pollutant is called physical absorption.
Absorption systems are capable of removal efficiencies greater than 98% [3]. Because of their highefficiencies, they are frequently used to remove odorous compounds from gaseous streams. Applicationsfor indoor air treatment have also been described in the literature [4]. Water is commonly used as thescrubbing liquid [5] or sorbent. For example, scrubbers are used at rendering plants to removecontaminants in the plant exhaust before it is released into the atmosphere [6]. In some cases, sea water,chlorine, hypochlorite, hydrochloric acid, sodium hydroxide, or sodium bicarbonate are added to enhancethe scrubbing efficiency [7, 8]. Absorption systems are most suited to plants that already have anoversized wastewater treatment plant or pollutants which can be removed by simple chemical reactionwith little effect on the chemical composition of the liquid stream. Simple absorber designs are alsouseful for streams that contain large amounts of particulate, since the particulate can more easily foul apacked bed. It not usually possible to optimize removal of both particulate and gaseous components inthe same vessel [9]. Table 5-1 lists some typical applications of adsorption systems for air pollutioncontrol [7, 10, 11].
Table 5-1. Typical Applications of Absorption [7, 10, 11]Odor Control in Rendering Plants or Fish ProcessingLight Hydrocarbon Absorption at Petroleum Refineries
Plating Operations
Sewage Treatment Odor Removal
Organic Binder Emissions from Foundries
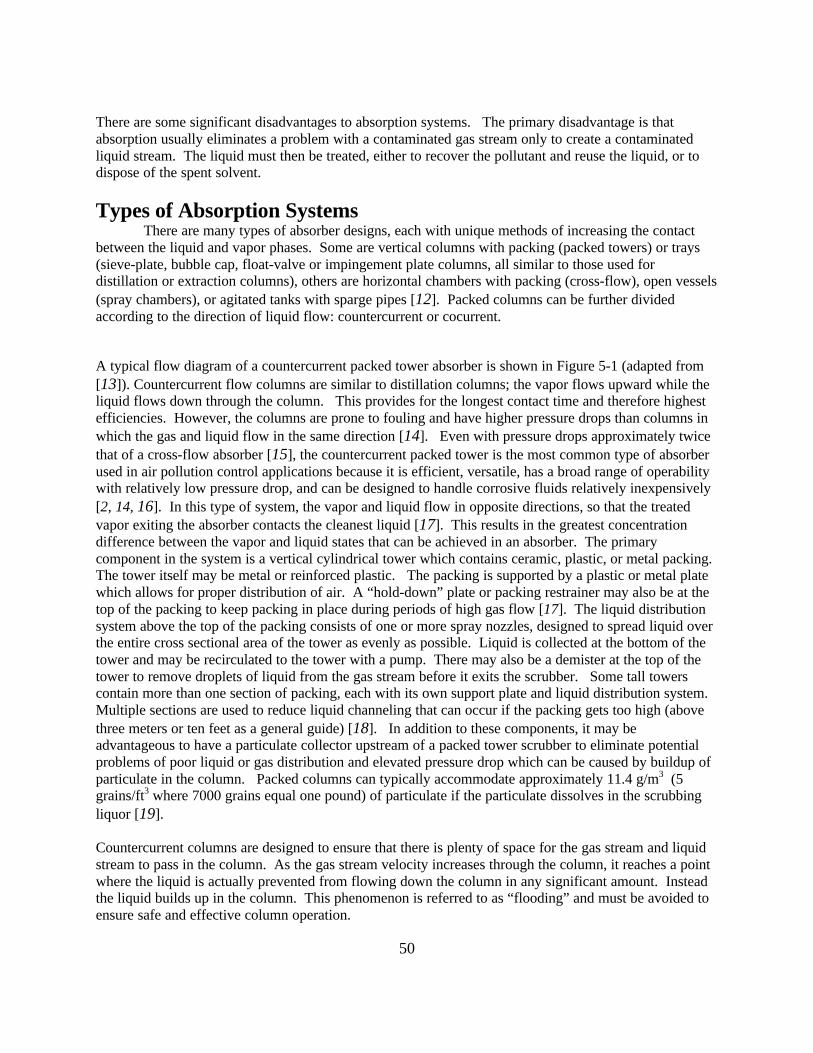
50
There are some significant disadvantages to absorption systems. The primary disadvantage is thatabsorption usually eliminates a problem with a contaminated gas stream only to create a contaminatedliquid stream. The liquid must then be treated, either to recover the pollutant and reuse the liquid, or todispose of the spent solvent.
Types of Absorption SystemsThere are many types of absorber designs, each with unique methods of increasing the contact
between the liquid and vapor phases. Some are vertical columns with packing (packed towers) or trays(sieve-plate, bubble cap, float-valve or impingement plate columns, all similar to those used fordistillation or extraction columns), others are horizontal chambers with packing (cross-flow), open vessels(spray chambers), or agitated tanks with sparge pipes [12]. Packed columns can be further dividedaccording to the direction of liquid flow: countercurrent or cocurrent.
A typical flow diagram of a countercurrent packed tower absorber is shown in Figure 5-1 (adapted from[13]). Countercurrent flow columns are similar to distillation columns; the vapor flows upward while theliquid flows down through the column. This provides for the longest contact time and therefore highestefficiencies. However, the columns are prone to fouling and have higher pressure drops than columns inwhich the gas and liquid flow in the same direction [14]. Even with pressure drops approximately twicethat of a cross-flow absorber [15], the countercurrent packed tower is the most common type of absorberused in air pollution control applications because it is efficient, versatile, has a broad range of operabilitywith relatively low pressure drop, and can be designed to handle corrosive fluids relatively inexpensively[2, 14, 16]. In this type of system, the vapor and liquid flow in opposite directions, so that the treatedvapor exiting the absorber contacts the cleanest liquid [17]. This results in the greatest concentrationdifference between the vapor and liquid states that can be achieved in an absorber. The primarycomponent in the system is a vertical cylindrical tower which contains ceramic, plastic, or metal packing.The tower itself may be metal or reinforced plastic. The packing is supported by a plastic or metal platewhich allows for proper distribution of air. A “hold-down” plate or packing restrainer may also be at thetop of the packing to keep packing in place during periods of high gas flow [17]. The liquid distributionsystem above the top of the packing consists of one or more spray nozzles, designed to spread liquid overthe entire cross sectional area of the tower as evenly as possible. Liquid is collected at the bottom of thetower and may be recirculated to the tower with a pump. There may also be a demister at the top of thetower to remove droplets of liquid from the gas stream before it exits the scrubber. Some tall towerscontain more than one section of packing, each with its own support plate and liquid distribution system.Multiple sections are used to reduce liquid channeling that can occur if the packing gets too high (abovethree meters or ten feet as a general guide) [18]. In addition to these components, it may beadvantageous to have a particulate collector upstream of a packed tower scrubber to eliminate potentialproblems of poor liquid or gas distribution and elevated pressure drop which can be caused by buildup ofparticulate in the column. Packed columns can typically accommodate approximately 11.4 g/m3 (5grains/ft3 where 7000 grains equal one pound) of particulate if the particulate dissolves in the scrubbingliquor [19].
Countercurrent columns are designed to ensure that there is plenty of space for the gas stream and liquidstream to pass in the column. As the gas stream velocity increases through the column, it reaches a pointwhere the liquid is actually prevented from flowing down the column in any significant amount. Insteadthe liquid builds up in the column. This phenomenon is referred to as “flooding” and must be avoided toensure safe and effective column operation.

51
Entrainment Separator(Demister)
NozzlePacking RestrainerPacking
LiquidRe-distributor
Packing Support PlateGas InletOverflowLiquid Outlet
PackingSupport Plate
LiquidInlet
Gas Outlet
Figure 5-1. Countercurrent Packed Tower Absorber (adapted from [13])
In some countercurrent packed columns, a lightweight packing is used that is partially or completelyfluidized by the gas stream. This type of scrubber is referred to as a mobile packing scrubber. In eachstage, the plastic packing spheres are contained between two grids, approximately 0.6 to 1.5 m (2 to 5feet) apart. For difficult separations, as many as five or more stages may be used. The movement of thespheres allows for solids to be flushed through the system and also permits the use of more viscousscrubbing liquids [15]. At air flows of 120 to 150 m/min (400 to 500 ft/min), the design has air flowcapacities approximately 5-6 times that of a conventional packed or plate scrubber [7]. The associatedpressure drop is approximately 0.5 to 0.75 kPa (2 to 3 inches of water) per stage [7].
Countercurrent columns may also have sieve plate or bubble cap trays instead of packing to provide forgas-liquid contact. Scrubbers containing sieve plate or bubble cap trays generally have a more narrowoperating range than packed towers [20]. Sieve plates are horizontal disks that fit tightly in the tower.The liquid and gas pass through holes (typically 3 mm or 1/8 in diameter, placed about 10 mm or 3/8 inapart [21]) in the plates. The column may also have downcomers to allow the liquid to flow from plate toplate more easily. The plates are typically placed about 0.3 m (12 in) apart if there are no downcomers,0.38 m (15 in) apart if the column has downcomers [18]. Sieve plates can be placed closer together in thecolumn than bubble cap trays, since sieve plates normally only have about one third as much entrainment[22].
A bubble cap tray has a more complex structure which collect the gas coming up through a tray and

52
forces it back down into the liquid to establish good gas-liquid contact. Bubble cap trays are usually setabout 0.46 m (18 in) apart [22]. It is important to maintain an even liquid level on both sieve plates andbubble cap trays so that there is equal resistance to gas flow across the entire cross sectional area of theabsorber. Therefore, the plates should be level and bubble cap columns should have an adequate numberof downcomers to ensure that the liquid head across each plate is even [21]. Typical pressure dropsthrough these columns are approximately 0.5 to 1 kPa (2 to 4 in of water column) per plate or tray [16].These absorbers are better suited to processes in which heat is evolved during solution of the pollutant inthe liquid (ammonia in water, for example), since they can be designed with cooling coils between theplates. They are also better suited to gas streams with fouling tendencies or particulate matter, since theycan be cleaned easier [23]. However, they are less suitable than packed columns for foaming liquids [12].Additional information comparing high performance trays with structured packings is available [24].
In cocurrent columns, the gas and liquid flow in the same direction, usually downward through a packedcolumn [14]. The amount of contaminant that can be removed from the vapor stream with this method islimited, since there is no supply of fresh liquid toward the end of the contact time to drive the equilibriumfurther toward removal of the contaminant from the gas stream. However, these vessels can handle moregas flow than countercurrent columns, since increased gas flow facilitates liquid flow through the column,and there is no possibility of flooding [25].
The gas in cross-flow vessels flows horizontally while the liquid flows downward through the packing asshown in Figure 5-2 [23]. It has both a low pressure drop and improved solids handling capability.Cross-flow vessels are currently used for pollutants with moderate - to high- solubility [14]. This type ofscrubber effectively removes particulate which is 5 microns and larger from the gas stream [25].
Packing
Dry CellLiquid Sprays
Figure 5-2. Cross-Flow Absorber [23]
Baffle towers are not common, but are a type of scrubber with simple contact mechanisms between thegas and liquid. The liquid cascades down through the column, flowing from one plate to the other asshown in Figure 5-3 [19]. The gas must pass through the liquid cascade as it makes its way up thecolumn. Very little information is available on designing these types of columns [19].

53
Gas Outlet
Liquid Inlet
Gas Inlet
Liquid Outlet
Figure 5-3. Baffle Tower [19]
Some equipment which has historically been used to remove particulate from gas streams is alsooccasionally used to remove very soluble organic compounds. Spray chambers may be vertical (as shownin Figure 5-4, adapted from [23]) or horizontal vessels which contain multiple levels of spray nozzles toprovide a liquid mist or fog through which the gas passes. Figure 5-5 shows a venturi scrubber (redrawnfrom [23]), which operates by injecting liquid into gas stream. The liquid may be injected at a venturi, orit may be injected upstream of the venturi. The difference in velocity between the gas stream and theliquid droplets provide for contact between the phases. Although venturi scrubbers are well-suited forgaseous streams which contain a significant amount of particulate, they do not provide for long contacttimes and are therefore only suitable for use with very soluble compounds [26]. The venturi scrubbermust be followed by a gas-liquid separation device; most installations have a cyclonic separator in whichliquid droplets are removed by inertia.

54
Clean Gas Out
Spray Nozzles
Polluted Gas In
Figure 5-4. Vertical Spray Chamber (adapted from [23])
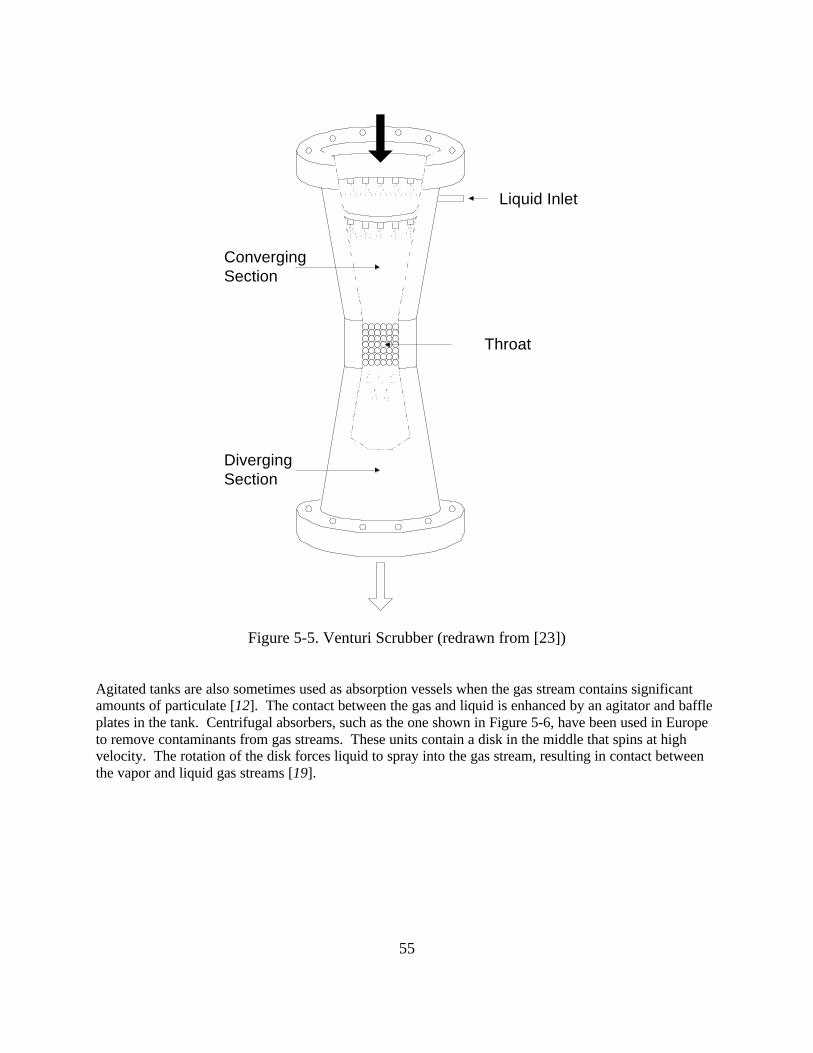
55
Liquid Inlet
Throat
ConvergingSection
DivergingSection
Figure 5-5. Venturi Scrubber (redrawn from [23])
Agitated tanks are also sometimes used as absorption vessels when the gas stream contains significantamounts of particulate [12]. The contact between the gas and liquid is enhanced by an agitator and baffleplates in the tank. Centrifugal absorbers, such as the one shown in Figure 5-6, have been used in Europeto remove contaminants from gas streams. These units contain a disk in the middle that spins at highvelocity. The rotation of the disk forces liquid to spray into the gas stream, resulting in contact betweenthe vapor and liquid gas streams [19].

56
Liquor In Gas In
Gas Out
Liquor Out
Figure 5-6. Centrifugal Absorber (redrawn from [19])
Absorption System DesignThe design methods given here are for packed bed absorbers, since the majority of scrubbers are packedbeds. They are included as general guides to facilitate understanding of absorption systems, to enablequick cost estimates, and to assist in identifying problems with existing absorption systems. Detaileddesign considerations are given in Perry’s Chemical Engineer’s Handbook [1, 27], Indoor Air Qualityand Control [4], Air Pollution Control Equipment, Volume II [13], Air Pollution Control and DesignHandbook, Part II [8], Industrial Control Equipment for Gaseous Pollutants, Volume I [22], Odor andVOC Control Handbook [28, 29, 30], Kirk-Othmer Encyclopedia of Chemical Technology [31], and theOAQPS Control Cost Manual [17], available on the internet at http://www.epa.gov/ttn/catc/products.html.Additional information useful in estimating tray efficiencies can be found in Bubble Tray Design Manual[32] and Equilibrium-Stage Separation Operations in Chemical Engineering [33]. Additionalinformation on designing cross flow units can be found in “The Crossflow Scrubber – A Digital Modelfor Absorption” [34]. Formulas for calculating removal efficiencies of particulate in spray towers aregiven by Hesketh [35]. It is also advantageous to consult manufacturers in the design of any absorptionsystem, since they can frequently offer specific experience with similar applications.
The efficiency of a given absorber is usually predicted using Henry’s Law which relates the concentrationof a compound in the liquid stream to the concentration (or partial pressure) of the compound in the gasstream at equilibrium [23]:
pA = H xA 5-1

57
where: A is the pollutant to be absorbedpA = partial pressure of A in the vapor stream (molar concentration, mol/l or M),xA = concentration of A in the liquid (molar concentration, mol/l or M), andH = Henry’s Law Constant (molar concentration in gas/molar concentration in liquid,
M/M)
Several Henry’s law coefficients are given in Table 5-2 [36]. Additional information is given bySchwartz and White [37] and Martin [38]. A more comprehensive list of values is contained in Sourcesand Control of AirPollution [39] and on the world wide web under http://chemfinder.camsoft.com.Various equations for Henry’s law are used. When using Henry’s law coefficients from other sources,care must be exercised to identify the units [21]. Some texts define a Henry’s law coefficient which is theinverse of the one given here. Henry’s law applies when the partial pressure of the pollutant does notexceed one atmosphere of pressure [40] and when compounds do not react during absorption. Thecoefficients are temperature dependent; they may be adjusted by van’t Hoff’s equation [41, 42] whichsimplifies to:
( )( )
−
∆=
211
2
T
1
T
1
R
H
TH
THln 5-2
where: ∆H = heat of solution of the gaseous pollutant, kJ/kmolR = Gas constant, 8.314 kJ/kmol KH(T1) and H(T2) = Henry’s law coefficient at two different temperatures, andT 1 and T2 = absolute temperatures.
This approximation is only valid when ∆H is relatively constant, that is, over relatively small temperatureranges.
Table 5-2. Henry’s Law Coefficients [36]Pollutant Solvent H, M (gas)/M (liquid) Temp (K)
Acetylene (C2H2) Water 0.823 288Ammonia (NH3) Water 4.71 x 10 -4 288Ethane (C2H6) Water 17.2 288Ethylene (C2H4) Water 6.82 288Hydrogen Chloride (HCl) Water 2.82 x 10⁻⁹ 288Hydrogen Sulfide (H2S) Water 0.322 288Methane Water 25.7 288Ozone (O3) Water 2.19 298Propylene (C3H6) Water 3.86 288Sulfur Dioxide (SO2) Water 7.85 x 10 –3 288
Lower Henry’s law coefficients indicate improved solubility, since the pollutant is less likely to evaporateinto the gas stream. The absorption efficiency is enhanced if the pollutant reacts with the liquid, thereby

58
decreasing the concentration of pollutant in the liquid and driving the absorption reaction towardcompletion. For this reason, weak acid solutions, caustic solutions, and ozone are sometimes used inscrubbers to improve the removal of organic compounds from a gas stream.
The selection of solvent is generally the first step in absorption design [13, 27]. Other importantconsiderations in determining an appropriate solvent are [7, 13, 19, 26, 43]:
1. Solubility. The pollutant should be as soluble as possible in the liquid at the expectedoperating temperature to enhance the mass transfer rate [44].
2. Low volatility. The solvent should generally have a volatility less than approximately 0.1mm Hg at the outlet temperature to avoid excessive evaporation of the solvent from thecolumn [19]. Evaporation of the solvent can cause unnecessary operating expense, inaddition to creating a different air pollution problem. The prominent exception to this iswater, which is used in most absorption systems [5] because evaporation of water is notgenerally a significant cost or pollution issue, and other design considerations such assolubility and disposal outweigh the concerns.
3. Corrosivity. The solvent selected should have a low corrosivity if possible so that lessexpensive materials of construction can be utilized. In addition, the corrosivity of thepollutant and any reaction products between the pollutant and the solvent should beconsidered in determining appropriate construction materials.
4. Cost. Cost is an obvious concern for systems where the liquid is only used once. Insome absorption systems, the solvent is continuously regenerated and reused by distillingthe pollutant, by reacting it to form a removable solid, or by liquid-liquid extraction.Even though the liquid is recycled, there are inevitably losses through equipment leaks,cleaning, equipment blowdown, and degradation.
5. Availability. The liquid should be easy to obtain in a relatively short time period so thatthe equipment is not out of service if a column is accidently released to a sewer or in caseof a malfunction. For solvents which may have a long delivery time, it may be feasible touse an additional storage tank to ensure that there is always an adequate supply available.
6. Safety. To simplify the operating procedures and protect workers, the liquid should haveas low a toxicity and flammability as possible.
7. Low viscosity. A low viscosity reduces electrical demands for pumping the liquid,reduces the column pressure drop which results in lower electrical demands for movingthe gas stream, decreases the likelihood of exceeding the capacity of the column duringperiods of high gas flow (flooding), and increases the efficiency of the column byimproving liquid distribution.
8. Stability. The liquid should not degrade with use or expected temperature.9. Low melting point. A low melting point is desirable to keep the column from freezing in
cold weather, particularly if the column is taken out of service.
Mineral oil, heavy hydrocarbon oils, and aqueous solutions are also used as sorbents in absorptionsystems [3, 45].
Before the overall size of the absorber can be determined, the packing material must be identified. Thepacking material will affect the degree of contact that can be achieved in the scrubber, and will affect theweight of the scrubber and the materials of construction. Packing may be “dumped” or structured.Despite the name, “dumped” packing is not randomly thrown into the absorber. It must be installedcarefully to avoid breaking the packing and ensure that it is spread uniformly. Structured packing isgenerally stacked in the vessel. In addition to sophisticated dumped or structured packing material,

59
simple materials such as broken rock, coke, broken bottles, aggregate, marbles, and wood slats have alsobeen used [8, 9, 15, 21]. The selected packing should provide for: maximum amount of wetted area pervolume of packing, reasonable weight, chemical resistance to the gas stream and liquid streamconstituents, good distribution of liquid and gas phases, minimal amount of liquid retained on the packing(holdup), low gas pressure drop through the packing, structural strength, design flexibility (to allowchanges in operation without substantial effects on the removal efficiency), and low cost [21, 46]. Thechosen packing should have a diameter less than about 1/30th of the column diameter [2], and it shouldnot force the gas stream to contract or expand, since that would increase the pressure drop through thecolumn unnecessarily [8].
The packing supports must have the physical strength to support the weight of the packing and liquid,they must be able to withstand the expected temperature and corrosivity of the gas and liquid streams, andthey must provide adequate passage of the gas and liquid so that there is not a significant pressure drop.The support plates may be as simple as a grid or expanded metal plate, or they may be designed toseparate the gas and liquid flows as in “gas-injection” support plates (see Figure 5-7) [8].
Gas Flow
Figure 5-7. “Gas-Injection” Support Plate (adapted from [8])
An estimate of the absorber size can be obtained using US Stoneware’s correlation [9, 22, 47]once the liquid and gas mass flow rates have been determined. It is assumed that the gas flowrate, initial concentration, and required removal efficiencies are specified by the application. Theconcentration of pollutant in the liquid stream and exiting the column can then be determinedfrom the Henry’s law correlation. It is usually assumed that the concentration of pollutant in theentering liquid stream is zero, although this can also be estimated from Henry’s law if the liquidis reused after recovery of the pollutant. Furthermore, the required liquid flowrate can becalculated by an overall mass balance from the overall amount of pollutant that must be removedand the final concentration of that pollutant in the gas stream. Assuming that the pollutant is theonly constituent of the gas stream that is soluble in the liquid and that the solvent is nonvolatile,the minimum liquid to gas ratio can be determined from the following equations [17]. If theconcentration of pollutant is more than a few percent of the volume, these assumptions are nolonger valid.
Yo = Yi (1-/100) 5-3

60
where Yo = pollutant concentration in gas stream leaving adsorber, kg-mol pollutant/kg-mol pollutant free gas (lb-mol/lb-mol)
Yi = pollutant concentration in gas stream entering adsorber, kg-mol pollutant/kg-molpollutant free gas (lb-mol/lb-mol)
� = removal efficiency, %Xo
e = maximum concentration of pollutant in the liquid stream leaving the absorber,assuming that the liquid is in equilibrium with the gas stream entering the absorber,kg-mol pollutant/kg-mol pollutant free solvent (lb-mol/lb-mol)
Xi = concentration of pollutant in liquid stream entering the absorber kg-molpollutant/kg-mol pollutant free solvent (lb-mol/lb-mol). Henry’s law is generallyvalid for determining this value for small concentrations of pollutant.
The minimum liquid to gas ratio is then:
ie
o
oi
min XX
Y -Y
G
L
−=
5-4
and the actual liquid to gas ratio can be calculated from:
AFG
L
G
L
minact
=
5-5
where: L = molar flow rate of pollutant-free solvent, kgmol/h (lbmol/h)G = molar flow rate of pollutant-free gas, kgmol/h (lbmol/h)AF = adjustment factor to compensate for the fact that true equilibrium is not realistic,
typically between 1.2 and 1.5 [48]
Once the pollutant-free liquid and gas flows are known, the total molar flowrate of the liquid andgas streams are calculated by the following equations:
Gmol, T = G(1+Yi) 5-6
Lmol,T = L(1+Xi) 5-7
and the cross sectional area that is required for the expected gas and liquid flowrates isdetermined. The value of the following expression is calculated and located on the x-axis of thechart given in Figure 5-8.
5.0
L
G
m
m
G
L
ρρ
5-8
where: Lm = Liquid Flowrate, mass per hour units

61
Gm = Gaseous Flowrate, mass units per hour units, must correspond with those for theliquid flowrate [9].
ρG = density of gas stream, 1.17 kg/m3 (0.073 lb/ft3) for air at 303 K (30 oC, 86 oF)[23]
ρL = density of liquid stream, 1000 kg/m3 (62.4 lb/ft3) for water at 303 K (30 oC, 86oF), units must correspond to those of ρG.
The point on the flooding line in Figure 5-8 is then located that corresponds to the abscissa valuecalculated above. The value on the y-axis which results is ε. Using this value, the followingequation can be solved for G'flood [23], using packing factors given in Table 5-3.
Using a packing factor in SI units:
[ ]( ) 5.02.0
L
5.0cLG
floodF
g81.1'G
φµ
ρερ= 5-9
With a packing factor in English units:
[ ]( ) 5.02.0
L
5.0cLG
floodF
g'G
φµ
ρερ= 5-10
where: G'flood = the mass flow rate of gas per unit of column cross sectional area whichwill just cause the column to flood, g s-1m-2 (lb s-1ft-2)
ε = the y-axis value from Figure 5-8.gc = the gravitational constant, 9.82 m/s2 (32.2 ft/s2)F = Packing Factor, m2/m3 (ft2/ft3)φ = ratio of liquid specific gravity to that of waterµL = liquid viscosity, cP, 0.8 cP for water

62
Figure 5-8. US Stoneware’s Pressure Drop Correlation [23]

63
Table 5-3. Packing Data [17, 23, 46]Weight Surface Area Packing Factor, F Price (1990 $)Packing Size (in)
(lb/ft3) (kg/m3) (ft2/ft3) (m2/m3)Void
Fract.(%) ft2/ft3) (m2/m3) ($/ft3) ($/m3)½ 52 833 114 374 65 580 1903
1 44 705 58 190 70 155 509 12.8 4521 ½ 42 673 36 118 72 95 312 10.3 364
2 38 609 28 92 75 65 213 9.4 332
Raschig Rings (Ceramicor porcelain)
3 34 545 19 62 77 37 121 7.8 275½ x 1/32 77 1233 128 420 84 300 984
1 x 1/32 40 641 63 207 92 115 377 36.5 1289
Raschig Rings (CarbonSteel)
2 x 1/16 38 609 31 102 92 57 187 20.5 7241 155 5474
1.5 117 4132
Raschig Rings (StainlessSteel)
2 87.8 31011 52.0 1836
1.5 46.2 16312 33.9 1197
Raschig Rings (CarbonSteel)
3 31.0 1095¼ 55 881 274 899 63 900 2953
½ 54 865 155 509 64 240 787
1 48 769 79 259 68 110 361 33.5 11831.5 40 641 46 151 71 65 213 21.5 759
Berl Saddles (Ceramic orporcelain)
prices given forporcelain
2 38 609 32 105 75 45 148 15.6 551

64
Weight Surface Area Packing Factor, F Price (1990 $)Packing Size (in)(lb/ft3) (kg/m3) (ft2/ft3) (m2/m3)
VoidFract.(%) ft2/ft3) (m2/m3) ($/ft3) ($/m3)
¼ 54 865 300 984 75 725 2379½ 45 721 190 623 78 200 6561 44 705 78 256 77 98 322 17.6 622
1.5 39 625 59 194 76 52 171 13.0 4592 42 673 36 118 79 40 131 11.8 417
Intalox Saddles(Ceramic)
3 36 577 28 92 79 22 72 10.7 3781 6.00 96 63 207 91 30 98 21.2 749
2 3.75 60 33 108 93 20 66 13.1 463
Intalox Saddles (Plastic) Prices given for
polypropylene
3 3.25 52 27 89 94 15 49 7.0 2475/8 7.0 112 104 341 87 97 3181 5.5 88 63 207 90 52 171 21.2 749
1.5 4.8 77 39 128 91 40 131 14.4 509
Pall Rings (Plastic) prices given for
polypropylene
2 4.5 72 31 102 92 25 82 13.1 4635/8 x 0.018
thick38 609 104 341 93 73 239
1 30 481 63 207 94 48 1571 ½ x 0.03
thick24 384 39 128 95 28 92
Pall Rings (Steel)
2 22 352 31 102 96 20 661 7.5 120 55 180 87 40 1312 3.9 62 38 125 93 20 66 11.5 406
Tellerettes
3 5 80 30 98 92 15 49Tellerette pricing given is an average of prices from $100 to 700/m3 ($3 to 20/ft3)

65
It is usually assumed that the column will operate at a gas flow between 50 and 75% of theflooding velocity [13, 22], although well-designed columns can operate at flows up to 90% offlooding [19]. The gas flow per unit area through the column under normal operating conditionscan be estimated from the following equation [9]:
G'oper = f G'flood 5-11
where G'oper = mass flow of gas stream per unit area of column under normal operation, g s-1m-2 (lb s-1ft-2)
f = acceptable fraction of flooding for normal operation, typically 0.6 [2, 22]
The required column cross sectional area can be obtained by [9]:
A = G/ G'oper 5-12
where: A = Column cross sectional area, m2 (ft2)
Since absorption columns are usually round, the diameter is calculated from the formulafor the cross sectional area of a circle [1]:
π=
A4D 5-13
where: D = Column diameter, m (ft)
The calculated column diameter should be rounded up to a readily available diameter.Increments of 0.15 m (or 1/2 foot) are common.
Typical liquid flow rates are approximately 0.04 to 2 m3/min per square meter (1-50 gal/min persquare foot) of column area. Superficial gas velocity through a packed tower is generally about30 to 150 m/min (100-500 ft/min) [15].
For extremely soluble pollutants or pollutants which react with the scrubbing liquid, the numberof theoretical stages (NOG) can be estimated from [9, 17]:
NOG = ln (Y1/Y2) 5-14
where Y1 = mole fraction of pollutant in the entering gasY2 = mole fraction of pollutant in the exiting gas
The height of a theoretical transfer unit (HOG) should be obtained from vendor information for thespecific application, but it usually ranges between 0.3 and 1.2 m (1 and 4 ft). A rough estimate of0.6 m (2 ft) can be used if necessary [9]. The total packing height is calculated from:
Hpack = NOG * HOG 5-15
It may be necessary to install the packing in sections, each with a separate packing support plateand liquid distribution system in tall towers. Generally, packing is installed in sections threemeters (ten feet) high. For columns packed with Raschig rings, the maximum depth of eachsection should be no more than approximately three column diameters, to a maximum of 3 to 5 m

66
(10 to 15 ft). For saddle packings, the depth of each section should be no more thanapproximately five to ten column diameters, to a maximum of 4 to 6 m (12 to 20 ft) [13].
Other important factors in designing an absorption system are to ensure that the liquid and gasesare distributed evenly throughout the column. Otherwise, gas channeling can result, causingareas of low gas or liquid flow which cause losses in removal efficiency.
Two types of demisters are shown in Figure 5-9. While chevrons are frequently used, particularlyin dirty gas streams, they are usually considered less efficient in removing small particles thanmesh pads. The very small droplets (less than 5 �m in diameter) are not captured as effectivelyas they are in a mesh pad, increasing the likelihood that water droplets will escape the collector.Demisters may be installed in horizontal or vertical piping; horizontal is preferred [21]. Figure 5-10 [8] gives a graphical representation of the range of droplet sizes and velocities that result ineffective separation in a mesh pad.
Wire Mesh Chevron
Figure 5-9. Two Types of Demisters (adapted from 23])
New developments in absorption techniques include cryogenic absorption [45], UV enhancement,and combinations of scrubbing columns and catalytic beds designed to destroy odorouscompounds. In the Odorgard process from ICI Katalco, compounds are absorbed into a dilutehypochlorite solution, then the liquid is passed over a catalyst to oxidize the pollutants. Theprocess is designed to reduce the amount of free chlorine emitted from scrubbers and achievelower outlet concentrations of the pollutants [2]. Caternary grid scrubbers use suspended webs ofwire mesh which are suspended from the column sides and fall in a hyperbolic shape. One designincludes an ultraviolet lamp and hydrogen peroxide to destroy methanol in the wastewater frompaper production [3]. Table 5-4 includes a list of instrumentation that should be considered forabsorption systems [21].

67
DropletSize, um
1000
100
10
11 10 100
Vapor Velocity, ft/sec
UsefulSeparation
Gravity Settling
Poor ImpactEfficiency
Re-entrainment
Figure 5-10. Range of Droplet Sizes and Velocities for Effective Separation [8]
Table 5-4. Recommended Instrumentation [21]Gas stream temperature and pressure (inlet and outlet)
Liquid flowrate and pressureInlet gas stream relative humidity
Fan speedpH of liquid effluent
Mist eliminator wash rate and frequency
Economic EstimatesOne method of estimating the cost of an absorption system is given by the OAQPS
Control Cost Manual and is considered to be accurate to within 30% [17]. The total columnsurface area is first calculated:
( )81.2D52.1H4.1DS pack ++π= 5-16
where: S = Surface area of column, ft2, valid for diameters between 0.6 and 3.7 m (2 and 12feet) and packing heights between 1.2 and 3.7 m (4 and 12 ft)
Then the cost of the components of a fiberglass reinforced plastic column (in third quarter 1991dollars) can be estimated by multiplying the surface area in m2 (ft2) by a factor of $1240/m2
($115 /ft2) [17]. This factor includes the cost of the column, inlet and outlet ports for gas andliquid, sump space, two liquid distributors, two packing supports, a mist eliminator, internalpiping, and ladders and access platforms, but does not include packing, instrumentation, fans, orpumps. This cost estimate is valid for columns with surface areas from 6.4 to 140 m2 (69 to 1507

68
ft2). For other materials of construction, the cost can be scaled by a factor of 0.8 to 1.1 for apolypropylene column, a factor of 0.5 to 0.9 for a polyvinyl chloride (PVC) column, and a factorof 1.1 to 1.75 for a stainless steel column (304) [17]. This, as well as any other costs, should bescaled up to current value using procedures given in the EPA’s “Escalation Indexes for AirPollution Control Costs”, which can be found on the internet under http://www.epa.gov/ttn/catc[17].
In addition to the items included in the cost of the column, the cost of the packing,instrumentation, fans, and pumps must also be included in the total equipment cost (EC).Approximate packing costs are given in Table 5-3. The cost of instrumentation is estimated at10% of the cost of the column, packing, and auxiliary equipment, following the method in theOAQPS Control Cost Manual. However, as noted there, the cost of instrumentation and controlsvaries depending on the complexity of the system [17].
General information on other types of scrubbers indicates that a bubble cap column costs about2/3 as much as a packed tower with ceramic rings for the same application using the samematerials of construction. A sieve plate tower is about 45% of the cost of the packed tower [21].The total installed cost of the system can be estimated from the factors in Table 5-5.
Annual costs may be approximated using the same methodology as given in the OAQPS CostControl Manual [17], as shown in Table 5-6. Total electricity requirements can be estimatedfrom the formulas for the fan and pump requirements. A method for calculating the electricityrequirement for the fan is given in Chapter 4. The electricity for required for the pumps can beestimated from the following equations.
pump
Lipump eff
PL252.0*746.0E = 5-17
where: Epump = electricity requirements for the liquid pump, kWLI = Inlet liquid flow, gallons per minutePL = Liquid pressure, feet of watereffpump = efficiency of the pump and motor combined, approximately 0.4-0.7
Solvent requirements can be estimated from the liquid flowrates determined earlier. If the solventis recycled, an estimate should be made of the amount of solvent that is evaporated duringabsorption or lost during the remaining processing steps. Operating and maintenance laborrequirements vary depending on the complexity and dependability of the system, but can beestimated as one half hour per shift, following the suggestion in the OAQPS Control CostManual.

69
Table 5-5. Factors for Estimating the Total Installed Capital Cost of Absorption Systems[Adapted from 17]
Direct Costs Purchased Equipment Cost Absorber, Packing, and Auxiliary Equipment EC, Estimated from equation Instrumentation and Controls 0.1 * EC Taxes 0.03 * EC Freight 0.05 * EC Total Purchased Equipment Cost, PEC 1.18 * EC
Installation Costs Foundations and Supports 0.12 PEC Erection and Handling 0.40 PEC Electrical 0.01 PEC Piping, Insulation, and Painting 0.32 PEC Total Installation Cost 0.85 PEC
Site Preparation As required for specific site, SP Buildings As required for specific site, BLDG
Total Direct Costs 1.85 PEC + SP + BLDG
Indirect Costs Engineering and Supervision 0.10 PEC Construction, Field Expenses, and Fees 0.20 PEC Start-up and Performance Test 0.02 PEC Contingency 0.03 PEC Total Indirect Costs 0.35 PEC
TOTAL INSTALLED CAPITAL COSTS, TCC 2.2 PEC + SP + BLDG
Potential ProblemsThe capital cost of the absorber depends on the volume of gas to be treated. Similarly,
the efficiency of the absorption process depends on the concentration of the pollutant in the gasstream (the higher the concentration in the gas stream, the better the removal is expected).Therefore, it is critical that air infiltration be kept to a minimum by ensuring that seals in theductwork remain air tight, eliminating unnecessary pickup points, maintaining valves and valveseats in excellent condition, and reducing the amount of air going into the capture system as muchas possible. Care must be taken to ensure that the concentration in the ductwork does not exceedsafe levels.
As with other gaseous control systems, corrosion can become a problem if the selection ofconstruction materials is not deliberate. Since the absorption system saturates the gas stream withliquid, condensation in the remaining ductwork and fan can also lead to corrosion [18]. If a liningor plastic material is chosen to reduce corrosion, care must be taken to ensure that the temperatureof the gas stream will not exceed the maximum allowable temperature of the material [4].

70
Table 5-6. Annual Operating Costs for Absorber Systems (adapted from [17])Direct Annual Costs Unit Cost Estimated Requirement Utilities: Electricity $0.05/ kWh calculated above Solvent $40 to 80/1000 m3
$0.15 to 0.30/ 1000gallons
calculated above
Wastewater Treatment or solvent disposal $1000/1000 m3
$3.80/1000 galcalculated above
Chemical Use for Regenerating Solvent Application specific Application specific Operating Labor $12.96/h ½ hour per shift Maintenance Labor $14.26/h ½ hour per shift Maintenance Materials 100% of Maintenance
Labor Supervisory Labor 15% of Operating Labor
Indirect Annual Costs Overhead 60% of total operating and maintenance costs Property Tax 1% of TCC Insurance 1% of TCC Administrative Costs 2% of TCC Capital Recovery (from Estimating Costs of Air
Pollution Equipment [5, 6])CRF * TCC where CRF = [i(1+i)m]/[(1+ i)m-1]; i = interest rate m = control system economic lifeCRF = 0.1315 for 15 year equipment life and 10%interest rate
Total Annual Operating Costs Direct + Indirect Operating Costs
Even if corrosion is not anticipated as a problem, the gas stream characteristics may require otherconsiderations for the materials of construction. For example, if the gas or liquid stream containshigh levels of particulate, organic linings or construction materials may be particularlysusceptible to erosion [7].
For the column to be as effective as possible, the contact between the gas phase and the liquidphase must be excellent. Clogged liquid distribution systems, plugged air holes in plates, andbypassing must be avoided. Proper instrumentation can assist in diagnosing such problems; arelatively small amount of money spent for additional pressure or flow measurements when thesystem is installed can save a significant amount of time in trouble shooting later.
The column should also be designed with adequate turndown ratios which correspond to typicalproduction levels in the process so that the column operates as efficiently as possible undervarious sets of operating conditions. However, adequate excess capacity should be included inthe initial design to ensure that the capacity of the column can be increased if necessary withoutincreasing the physical size [7]. This can be done by either providing a flanged connection on the

71
shell to allow for extra shell sections to be added, or the shell can be designed with extra height toallow for additional packing to be added [18]. If the shell is designed with extra height, thedesign should ensure that the liquid distribution system is never so high above the packing levelthat it makes the liquid distribution inefficient by allowing all of the liquid to reach the towerwalls. Similarly, overpacking the column can result in poor distribution [8].
Installation, Operation, and Maintenance ConsiderationsDuring installation, it is critical that the tower be carefully levelled to ensure that the
liquid and gas flow are not altered by a slight tilt. The liquid and gas lines should be traced toensure that connections are correct and are leak tight and rotation of pumps should be checked.In lines which may have significant concentrations of solids, provisions may be needed forrecirculation to prevent settling in the lines. Packing should be installed by carefully stacking ifit is structured packing. In the case of dumped packing, liquid should be added to the column toprotect the packing from damage [13, 21]. Any damage to the packing could result in liquidchanneling or in increased pressure drop on the gas stream. A week or more may be required forpolypropylene packings to become “conditioned”; because of the molding process, the surfacemay not be immediately wettable [8].
Approximately two weeks after the scrubber is put into operation, it should be inspected forpluggage and to determine if the packing has settled [18] or shifted. If the packing has settled,packing should be added to the design level, taking care to ensure that the packing is evenlydistributed over the bed [21].
The warm, humid environment in wet scrubbers can be a preferred location for bacterial growth.Excessive bacteria can result in a soap bubble-like appearance and clogging of the columninternals or mist eliminators. It is frequently necessary to add bacteriostats to ensure that thisproblem does not occur. When adding bacteriostats, however, the Material Safety Data Sheetshould be reviewed to make sure that the ingredients in the bacteriostat are compatible with theconstruction materials of the column.
Proper operation of mist eliminators ensures that liquid droplets do not escape from the scrubber.If the demisters become clogged, the gas flow through the remaining demister area may speed up,and may carry over additional liquid with it. This possibility can be reduced in scrubbers withsignificant particulate loading in the gas stream by installing nozzles above the demisters to washthem in place. Washing is typically done while the absorber is off line to ensure that the washingliquid is not entrained in the exhaust gas [18].
Effective pollutant removal depends on establishing intimate contact between the gas phase andthe liquid phase. If the scrubber is operating perfectly, the gas stream which leaves the scrubberis completely saturated with solvent. For scrubbers which use water as the solvent, the gasstream leaving the scrubber contains the maximum amount of moisture that it can hold under theexisting temperature conditions. Depending on gas stream temperatures, the gas stream exitingthe scrubber may begin to cool as it travels through the stack and into atmosphere. The gas cannot continue to hold all of the moisture at lower temperatures, so the vapor begins to condense.Condensing liquid particles agglomerate into droplets. Therefore, on days in which the outdoortemperature is cooler than the operating temperature of the scrubber, it is typical to have dropletsof water in the gas stream exiting the stack. Droplets in the gas stream on days in which theweather is warmer than the scrubber operating temperature indicate that there is carryoverthrough the demisting system. Additional discussion of this phenomenon and potential methods

72
of addressing it are given in the Electric Utility Users Manual [9]. While the given articlespecifically addresses flue gas desulfurization systems, most of the concepts apply to other typesof wet scrubbers as well, with the exception that flue gas desulfurization systems usually use alime or limestone slurry as the scrubbing liquid. This concept is also documented in Handbook ofAir Pollution Control Engineering and Technology which states "Conceivably, during wintertimeoperation some moisture due to condensation may be observed and considered a problem with theentrainment separator. However, it should be recognized that this is not uncommon, since the airoff an absorber [scrubber] is saturated with water vapor, and any difference or lowering of thetemperature will cause condensation to occur" [9]. Other methods of reducing condensation inthe stack exhaust is to cool the gas stream to below the ambient temperature or to heat it toapproximately 27 K (27oC, 50 oF) above saturation [15].
Carryover of droplets through the demisting system can be caused by several conditions:
1. Most packed bed scrubbers are designed for vertical velocities of approximately 1to 2 m/s (3 to 6 ft/s) [10]. If the velocity of the gas stream approaches 2 m/s (6ft/s) at the design flow rate, any clogging can cause the air to bypass the portionsof the demisters which are clogging, increasing the linear velocity through theremainder of the demister. This can cause liquid to be entrained in the gas streamas it leaves the demisting zone.
2. If mesh pad demisters are used, they are typically installed on a slight angle toallow captured droplets to drain properly [23].
3. Velocities below approximately 1 m/s (3 ft/s) [7] or about 30% of the designvelocity [21] can result in inefficient demister performance for droplets less thanapproximately 100 �m in diameter, because the water droplets do not havesufficient inertial energy to impact on the scrubber demister material. Instead,they follow the streamlines of the gas flow and exit the scrubber with the gas.
4. Torn or misplaced mesh pads will allow bypassing of the gas stream, resulting inentrained liquid exiting with the gas stream. It is possible for demisters to bechemically degraded by the constituents of the liquid or gaseous streams. In thecase of polypropylene mesh pads, the polypropylene can be attacked by strongoxidizing acids, peroxide, gasoline, benzene, carbon tetrachloride, acetone,alcohols, or wet chlorine [48] streams. Chemical damage to plastic material canbe verified by examining one of the old mesh pads to determine the condition ofthe fiber. If either chemical or heat damage has occurred, the fiber should bebrittle, maleable, or deformed.
5. Poorly functioning nozzles or liquid distribution systems can also result incarryover of liquid through the demister. The nozzles should be examined toidentify small pieces of plastic or solids which can clog the distributors.
Increases and decreases in pressure drop through a column can indicate improper operation.Increases in pressure may be due to increased liquid flow, plugged or decomposing packing,plugging demister, blockages in the packing support plate or air distribution systems, or increasedair flow through the scrubber [18]. Liquid and gas flow rates should be monitored duringscrubber operation to detect any gradual changes in flow. To check for plugging, it isadvantageous to take pressure drop readings without any liquid flow immediately after thepacking and demisters are installed, cleaned, or replaced. This data will help determine whetherfuture episodes of high pressure drop are associated with increased pressure drop in the vapor

73
stream (such as in the demisters or packing) or are the result of increased liquid flow. The drypressure drop during periods of questionable operation can be compared with the dry pressuredrop when the demisters and packing are known to be clean. If there is a significant differencebetween the two, it is an indication that the increase in overall pressure drop is due to clogging ofthe demisters or column [9]. If there is not a significant difference, then other factors should beexamined to identify the reason for the excessive pressure drop. Other factors that affect thedemister operation, pressure drop, and the overall operation of the scrubber are excessive vapor orliquid flow rates. Care should be taken to ensure that the gas flow is neither excessive nor so lowthat it results in an excessive liquid flow rate.
Decreases in pressure drop can indicate low liquid flows, low air flows, channeling of liquidthrough the scrubber which may be resulting from poor liquid distribution, collapsed packingsupport plates, or changes in the density of the gas [18, 21]. Changes in the pressure or flow ofliquid may be attributable to plugged filters or pipes in the liquid system, plugged nozzles, lowsump level ( which may cause pump cavitation), a worn pump impeller, changes in valveposition, internal piping leaks or breaks, or eroded spray nozzles [18]. Changes in gas flow mayresult from plugging in the packing or demister, changes in liquid flow, poor fan operation due toloose belts or worn impeller, partially plugged ductwork, changes in damper settings, leaks in theductwork or scrubber, damage to the packing or packing support plates [18]. If the efficiency ofan absorption system decreases, it may be attributable to low liquid flow, insufficient additivefeed, pH probe malfunction, or liquid channeling due to pluggage in the scrubber or liquiddistribution system [18].
It is also recommended that copies of the fan curves for the systems be retained, so that the gasflowrate can be determined as the pressure drop through the scrubber changes. The curves shouldbe prepared at approximately the same temperature of the gas as it goes through the fan.
Particulate that builds up in the tower, demister, or distribution systems increases the pressuredrop and hinders efficient operation, so any particulate collection devices before the scrubbershould be maintained in good operating condition. Since it is possible that media replacementwill be required, the system should be designed and constructed with adequate space and accessfor demisters and packing or trays to be removed as easily as possible.
Once the column is in place and operational, there are still changes that can be made to facilitateimproved operation. If increased gas flows must be accomodated, it is possible to convert acountercurrent column into a cocurrent one, where the gas and liquid both travel down throughthe column. Cocurrent columns do not experience the same difficulties with flooding, butefficiency would be sacrificed [7]. Changes in packing material can also affect the pressure dropand efficiency achieved in the column for a cost significantly below that required to replace thecolumn or install an additional unit.
If liquid is channeling through the column but the liquid distributors are working well, theproblem may be due to poor liquid flow characteristics in the packing. It may help to replace aportion of the top packing layers with smaller size packing to improve liquid distribution [8].Newer packing designs have been developed to reduce lateral flow [8]; these may also beadvantageous in such a situation. These packings are also less likely to redistribute liquid flow,so proper liquid distribution is even more critical than with older style packings. An overallsummary of the advantages and disadvantages of absorption systems is given in Table 5-7.

74
Table 5-7. Advantages and Disadvantages of Absorption
Advantages Disadvantages
Allows for recovery / concentration of thepollutant
Effectiveness is pollutant-specific, depends onsolubility of compound
High efficiencies possible Transfers air pollution problem to liquid wasteproblem
No additional pollutants formed Potential corrosion of ductwork due to additionalmoisture in gas stream

75
References 1. J.R. Fair, D.E. Steinmeyer, W.R. Penney, B.B. Crocker, “Gas Absorption and Gas-
Liquid System Design” in Perry’s Chemical Engineers’ Handbook, Seventh Edition,D.W. Green, J.O. Maloney, Eds., McGraw-Hill, 1997, Section 14.
2. T.T. Shen, “For VOC Control Seminar – Absorption,” in Control of GaseousEmisions – VOC’s Handbook, ETS Professional Training Institute, ETSInternational, Inc., Roanoke, Virginia, 1995.
3. R.W. Purcell, G.S. Shareef, Control Technologies for Hazardous Air Pollutants,USEPA, Research Triangle Park, NC, 1986.
4. “Absorption Applications” in Indoor Air Quality and Control, A.L. Hines; T.K.Ghosh; S.K. Loyalka; R.C. Warder, Jr., PTR Prentice-Hall, Inc., Englewood Cliffs,NJ, 1993, p. 205-234.
5. T. Godish, Air Quality, 2nd Edition, Lewis Publishers, Chelsea, Michigan, 1991,p.327-328.
6 . K. Noll, W.J. Franek, L. Stander, APTI Course 482: Sources and Control of VolatileOrganic Air Pollutants, USEPA draft, 1987, Lesson 24.
7. R.M. Bethea, Air Pollution Control Technology: An Engineering Analysis Point ofView, Van Nostrand Reinhold, New York, 1978, p. 331-365.
8. M.V. Bhatia, “Packed Tower and Absorption Design” in Air Pollution Control andDesign Handbook (In Two Parts), Part II, P.N. Cheremisinoff, R.A. Young, Eds.,Marcel Dekker, Inc, New York, 1977, p. 609-697.
9. “Absorption” in Handbook of Air Pollution Control Engineering and Technology,J.C. Mycock, J.D. McKenna, L. Theodore, Lewis Publishers, Boca Raton, FL, 1995,Chapter 9, p. 149-171.
10. R.W. Boubel, D.L. Fox, D.B. Turner, A.C. Stern, “Control Devices and Systems” inFundamentals of Air Pollution, 3rd Edition, Academic Press, San Diego, 1994, p.478.
11. G. Gschwandtner, S. Fairchild, Controlling Odorous Emissions from Iron Foundries,US EPA, 1992.
12. “Gas Absorption” in Air Pollution Technology, D.E. Painter, Reston PublishingCompany, Inc., Reston, VA, 1974, p. 179-185.
13. L. Theodore, A.J. Buonicore, “Absorption” in Air Pollution Control Equipment,Volume II: Gases, CRC Press, Inc., Boca Raton, Florida, 1988, p. 79-113.
14. J.W. Macdonald, “Absorbers” in Air Pollution Control Equipment: Selection,Design, Operation, and Maintenance, L. Theodore, A.J. Buonicore, Ed., ETS, Inc.,Roanoke, Virginia, 1992, p.45-71.
15. J.P. Tomany, Air Pollution: the emissions, the regulations, & the controls, AmericanElsevier Publishing Company, Inc., New York, 1975, p. 302-344.
16. S. Calvert, “Scrubbing” in Air Pollution, Third Edition, Volume IV: EngineeringControl of Air Pollution, Academic Press, New York, 1977, p. 257-291.
17. W. Barbour, R. Oommen, G.S. Shareef, W.M. Vatavuk, “Gas Absorbers” in OAQPSControl Cost Manual, Fifth Edition, USEPA, Research Triangle Park, NC, 1996,Chapter 9.
18. A.J. Buonicore, “Absorption” in Air Pollution Engineering Manual, Van NostrandReinhold, New York, 1992, p. 15-31.

76
19. B.B. Crocker, K.B. Schnelle, Jr., “Control of Gases by Absorption, Adsorption, and
Condensation” in Handbook of Air Pollution Technology, S. Calvert, H.M. Englund,Ed., John Wiley & Sons, New York, 1984, p.135-161.
20. Unit Operations Laboratory, Chemical Engineering Department, ClemsonUniversity, Clemson, SC, 1984.
21. H.E. Hesketh, Air Pollution Control, Ann Arbor Science, Ann Arbor, Michigan,1979.
22. A.J. Buonicore, L. Theodore, Industrial Control Equipment for Gaseous Pollutants,Volume I, CRC Press, Inc., Cleveland, Ohio, 1975, p. 59-138.
23. G.T. Joseph, D.S. Beachler, APTI Course 415: Control of Gaseous Emissions:Student Workbook, US EPA, Research Triangle Park, NC, 1981, Chapters 5, 6, and7.
24. J.L. Bravo, “Select Structured Packings or Trays?”, Chem. Eng. Prog., July 1997, p.36-41.
25 . J.W. MacDonald, “Packed Wet Scrubbers” in Air Pollution Control and DesignHandbook (In Two Parts), Part II, P.N. Cheremisinoff, R.A. Young, Eds., MarcelDekker, Inc, New York, 1977, p. 699-720.
26. J.A. Danielson, Air Pollution Engineering Manual, EPA, Research Triangle Park ,NC, 1973.
27. L. Theodore, A.J. Buonicore, J.D. McKenna, I.J. Kugelman, J.S. Jeris, J.J. Santoleri,T.F. McGowan, “Waste Management” in Perry’s Chemical Engineers’ Handbook,Seventh Edition, D.W. Green, J.O. Maloney, Eds., McGraw-Hill, 1997, Section 25,p. 25-1 to 25-111.
28. C.M. McGinley, “Packed Columns” in Odor and VOC Control Handbook, H.J.Rafson, Ed., McGraw-Hill, New York, 1998, p. 8.102-8.110.
29. H.J. Rafson, “Mist Scrubbing” in Odor and VOC Control Handbook, H.J. Rafson,Ed., McGraw-Hill, New York, 1998, p. 8.111- 8.130.
30. R.P.G. Bowker, “Other Designs” in Odor and VOC Control Handbook, H.J. Rafson,Ed., McGraw-Hill, New York, 1998, p. 8.131-8.138.
31. U. von Stockar; C.R. Wilke, “Absorption” in Kirk-Othmer Encyclopedia ofChemical Technology, Fourth Edition, Volume 1: A to Alkaloids, J.I. Kroschwitz; M.Howe-Grant, Eds., John Wiley & Sons, New York, 1991, p.38-93.
32. Research Committee, Bubble Tray Design Manual, American Institute of ChemicalEngineers, New York, 1958.
33. E.J. Henley, J.D. Seader, Equilibrium-Stage Separation Operations in ChemicalEngineering, John Wiley & Sons, New York, 1981.
34. S.V. Cabibbo, A.J. Teller, “The Crossflow Scrubber – A Digital Model forAbsorption”, Paper number 69-186, APCA 62nd Annual Meeting, New York, 1969.
35. H.E. Hesketh, “Predict Particle Collection in Spray Towers”, Chem. Eng. Prog.,October 1995, p. 98-100.
36. L. Peters, “Topics In Air Pollution Control” Class notes, Virginia Tech, Blacksburg,VA, 1995.
37. S.E. Schwartz, W.H. White, “Solubility Equilibria of the Nitrogen Oxides and Oxy-Acids in Dilute Aqueous Solution,” Adv. Environ. Sci. Tech., 4, p. 1-45.

77
38. L.R. Martin, “Kinetic Studies of Sulfite Oxidation in Aqueous Solution,” in SO2,
NO, NO2 Oxidation Mechanisms: Atmospheric Considerations, J.G. Calvert, Ed.,Butterworth, Boston, 1984, p. 63-100.
39. R.J. Heinsohn; R.L. Kabel, Sources and Control of Air Pollution, Prentice Hall,Upper Saddle River, NJ, 1999.
40. R.L. Pigford, A.P. Colburn, “Gas Absorption” in Chemical Engineers’ Handbook,Third Edition, McGraw-Hill Book Company, Inc., New York, 1950, p. 673-676.
41. J.H. Seinfeld, Atmospheric Chemistry and Physics of Air Pollution, John Wiley &Sons, New York, 1986, p.195-246.
42. K.G. Denbigh, The Principles of Chemical Equilibrium, Third Edition, CambridgeUniversity Press, 1971.
43. J.O. Ledbetter, Air Pollution: In Two Parts; Part B – Prevention and Control,Marcel Dekker, New York, 1974, p.99-121.
44 . K. Wark; C.F. Warner; W.T. Davis, “Absorption” in Air Pollution: Its Origin andControl, Addison Wesley Longman, Inc., Menlo Park, CA., 1998, p. 314-340.
45. N. Mukhopadhyay, E.C. Moretti, Current and Potential Future Industrial Practicesfor Reducing and Controlling Volatile Organic Compounds, Center for WasteReduction Technologies, American Institute of Chemical Engineers, New York,1993.p. 19-20, 50.
46. “Gas Absorption” in Air Pollution Control: A Design Approach, Second Edition,C.D. Cooper; F.C. Alley, Waveland Press, Inc., Prospect Heights, Illinois, 1994, p.411-447.
47. “Generalized Pressure Drop Correlation, Chart Number GR-109, Revision 4”, U.S.Stoneware Co., Akron, Ohio, 1963.
48. Perry� s Chemical Engineers’ Handbook, Sixth Edition, R.H. Perry, D. Green, Eds.,McGraw Hill, New York, 1984.
1. R.N. Robinson, Chemical Engineering Reference Manual for the PE Exam, 5th Ed.,Professional Publications, Inc., Belmont, CA, 1996.
2. “Process Destroys Odors in Gas Streams”, Chem. Eng. Prog., June 1995, p. 19, 21.3. M. Valenti, “Scrubbing away pollution”, Mechanical Engineering, 118 (1996), 12, p.
72-74.4. H.E. Hesketh, “Wet Scrubbers”in Air Pollution Control, Ann Arbor Science, Ann
Arbor, Michigan, 1979, Section 6.5, p.217-235.5 . W.M. Vatavuk, Estimating Costs of Air Pollution Control, Lewis Publishers, 1990,
p.30-31.6 . W.M. Vatavuk, “Cost Estimating Methodology” in OAQPS Control Cost Manual,
Fifth Edition, USEPA, Research Triangle Park, NC, 1996, Chapter 2.7 . M. Borenstein, “Special Construction Materials for Scrubbers” in Air Pollution
Control and Design Handbook (In Two Parts), Part II, P.N. Cheremisinoff, R.A.Young, Eds., Marcel Dekker, Inc, New York, 1977, p. 949-961.
8 . A.D. Nelson, R.J. Schmitt, D. Dickeson, “Upgrading the Performance ofGroundwater VOC Air Strippers”, Env. Prog., 1997, 16, 1, p. 43-46.
9. Electric Utility Engineer� s FGD Manual, US Dept of Energy Pittsburgh EnergyTechnology Center, prepared by Radian International, LLC, p. I.4.5-1through I.4.6-19.

78
10. A. J. Buonicore, "Wet Scrubbers" in Air Pollution Control Equipment: Selection,
Design, Operation and Maintenance, L. Theodore and A.J. Buonicore, Ed., ETS,Inc., Roanoke, VA, 1992, p. 233-281.

79
Chapter 6
Thermal Incineration
Technology DescriptionIncinerators are relatively simple devices in which organic material in a gas stream is destroyedby combustion. Gaseous incinerators are also sometimes referred to as “afterburners”,particularly if they are installed downstream of a primary fuel combustion unit [1], like a medicalwaste incinerator. This name is indicative of the equipment’s function: to provide adequate timeand temperature for compounds to finish burning. If designed and operated properly, the exhaustfrom gaseous incinerators consists primarily of carbon dioxide and water, along with inert gasesfrom the atmosphere like nitrogen. Because of their capability for high destruction efficiency andtheir ability to destroy a wide variety of compounds, incinerators are very common controldevices [2]. For situations which are particularly sensitive to emissions of nitrous oxides, othercontrol devices should be considered, since there is inevitably some formation of nitrous oxides atcombustion temperatures, although methods and equipment are available to minimize theirformation.
Care must be taken to properly identify the constituents of a gas stream before incineration isselected as the control method. Sulfur compounds in the gas stream (including mercaptanswhich are added to natural gas and propane to make sure that leaks are detectable [3]) react toform sulfur dioxide, which may need to be removed before venting to the atmosphere. Likewise,halogenated compounds in the contaminated gas stream react to form acids which can severelycorrode ductwork and downstream equipment if not removed immediately after the incinerationprocess. The gas stream must also be relatively clean, that is, there should not be materialpresent that would clog nozzles if the gas stream is used as primary combustion air. Metalspresent in the gas stream can also affect the combustion process, especially in units wherecombustion is promoted by the presence of a catalyst. Vaporized species from elements such asiron and silicon can bind to the catalyst and render it inactive. In addition, materials which mightcoat the surface of the catalyst without reacting must be avoided in catalytic incinerators.
There are two primary types of incinerators: thermal incinerators (or thermal oxidizers) andcatalytic incinerators [4]. Thermal incinerators rely on a high operating temperature and usuallya direct flame to ignite the pollutants. They generally operate in the range of 973-1073 K (700 to800 oC, 1300-1500 oF) [5], but field testing has shown that most incinerators should maintainapproximately 1143 K (870 oC, 1600 oF) for at least 0.75 seconds to achieve 98% reduction ofnon-halogenated compounds [6, 7, 8, 9]. Halogenated compounds are more difficult to destroy[10]. Incineration temperatures as high as 1477 K (1204 oC, 2200 oF) are required for effectivedestruction of some chlorinated compounds [11]. Catalytic incinerators, as described in Chapter8, contain a surface of noble metal or other catalyst which brings the reactants together in closeproximity or otherwise facilitates the oxidation reaction so that it occurs at a lower temperature.Catalytic units generally operate in the range of 620 to 870 K (340 to 590 oC, 650 oF to 1100 oF)[12]. Flares, which basically function as thermal incinerators with no combustion chamber, arediscussed in Chapter 7.
In thermal incinerators, the organic removal efficiency that can be achieved is governed by the

80
“three T’s” [13]: time, temperature, and turbulence. In other words, the combustion reactiondepends on maintaining the proper temperature for long enough for the combustion process tooccur. In order to ensure that the temperature and reactants are distributed evenly, the incineratormust provide adequate velocity and turbulence to mix the combusted gases with the pollutants.The proper conditions are already present in many boiler or process heater fireboxes; these, too,can be used for incineration of gases if the gaseous stream introduction is properly positioned[14]. It is well documented that there is flexibility between the temperature and residence timerequirements, that is, the required time can be shortened by elevating the temperature, and a lowertemperature can be used if the mixture is allowed a longer time to react. Figure 6-1 [15] gives atypical correlation of the relationship between temperature and retention time. Well designedand maintained incineration units are capable of achieving efficiencies of 99% at pollutantconcentrations greater than approximately 100 ppm [16].
600 700 800 900 1000 1100 1200
ResidenceTime
20
40
60
80
100
PollutantDistribution
%
Temperature K
1.0 sec
0.1
0.01
0.001
Figure 6-1. Effect of Temperature and Residence Time on Destruction Efficiency[adapted from 15]
Incineration is most appropriate for processes where there is no physical or economic benefit torecovering the organic material. Examples of typical uses for thermal incineration are given inTable 6-1 [17, 18, 19, 20, 21].

81
Table 6-1. Typical Applications of Thermal Incineration for VOC Removal[17, 18, 19, 20, 21]
Landfill offgases
Printing operationsMedical waste incinerator exhaust
Bakeries
Paint bake ovensFoundry core ovens
Paper operations
Coffee roasting
Sewage sludge incineration offgas
Rendering plants
Smokehouse operations
Textile drying
Asphalt blowing and asphalt paper manufacture
Types of Thermal Incineration SystemsIncinerators are further characterized by the method used to transfer heat from the
gaseous exhaust to the incoming waste gas stream. Older thermal incinerator units and catalyticincinerators commonly use recuperative heat exchangers (as shown in Figure 6-2 [22] and 6-3[23]), in which the exhaust gases from the incinerator pass through a shell-and-tube or plate-typeheat exchanger to recover the heat of combustion and increase the fuel efficiency of the VOCdestruction process. The incoming gases pass through the heat exchanger, too, but withoutdirectly contacting the exhaust gas. Recuperative units are generally only able to recover about70% of the available heat [24], although at least one manufacturer reports primary heat recoveryin a recuperative unit of up to 82% [25]. Some units are designed with a secondary heat recoveryunit to preheat air, water, or heat transfer oil for other plant processes such as drying ovens [26].
More recently, regenerative systems have been introduced (see Figure 6-4 [27]) which use bedsof rock or packed ceramic material as a heat sink. Regenerative incinerators allow for better heatrecovery, meaning that dilute vapor streams can be incinerated at lower costs [28]. The post-combustion gases pass through one bed and heat up the ceramic material. Then the flow shifts,and the post-combustion gas stream is used to heat up a second bed of ceramic material whilepre-combustion air flows through the first hot bed, gaining heat as it travels to the burner. Flow isshifted back and forth between the beds as they heat up and cool down. Heat transfer efficienciesof approximately 95% can be achieved with regenerative units [6]. The average number of cyclesis between 15 and 60 per hour [24]. The alternating sequence decreases the removal efficiencywhich can be achieved in such a system; control efficiencies are usually below 99% [29, 30]. Atleast one manufacturer reports destruction efficiencies of 95 to 99% [31]. Depending on therequired removal efficiencies, more than two beds may be needed. In some cases a third bed isused as a “purge” bed to capture the untreated gases that would normally be exhausted from the

82
Figure 6-2. Glenro, Inc. Recuperative Oxidizer with Secondary Heat Recovery [22]

83
Figure 6-3. Anguil Recuperative Thermal Oxidizer [23]
ducting when the valves change position [24]. For systems demanding removal efficienciesabove 98%, the valving mechanism becomes more complex, as double valves are used to reducethe opportunity for any leakage. The space between the valves is slightly pressurized with freshair to ensure that no untreated gas is released to the stack [24].
Figure 6-4. Anguil Environmental Systems, Inc. Regenerative Oxidizer [27]Horizontal flow regenerative incinerators have been introduced recently which result in lowerspace requirements and make the technology more suitable for retrofit situations [29]. Figure 6-5shows an example of the flow through a horizontal regenerative incinerator [29]. In addition,

84
some manufacturers have introduced a system which combines an adsorbing wheel with thermalor catalytic incineration so that the inlet gas to the incinerator is more concentrated. This resultsin better thermal efficiency, since the amount of air that must be heated to the combustiontemperature is signficantly decreased. An example is shown in Figure 6-6 [23].
Figure 6-5. REECO Horizontal Flow Regenerative Incinerator [29]
Figure 6-6. Anguil Environmental Systems, Inc Roto-Concentrator [23]
Thermal Incinerator System DesignIt is a generally accepted practice to model the complex free radical reactions that occur
during combustion as a single first order reaction for many compounds [32, 33, 34, 35], so thatthe final concentration (or the overall destruction efficiency) can be estimated if the temperature,T, and residence time, τ, are known:

85
τ−=
k
C
Cln
0B
B 6-1
where: k = Ae-E/RT 6-2and: A = Compound specific constant (s-1)
E = Apparent activation energy, kJ/mol (or Btu/lb-mol, if English units areused throughout the calculation)
R = Gas constant, 8.314 kJ/mol K (or 1.987 Btu/lb-mol oR)τ = Residence time, sT = Absolute Temperature, K (or oR)
Values of the apparent activation energy and compound specific constants are given in Table 6-2.The average residence time of an incinerator can be estimated from knowledge of the outletvolumetric flow rate, Q, and the volume of the incinerator, V:
=τ
Q
V6-3
where: V = Internal volume of the incinerator chamber, m3 (or ft3)Q = Flowrate of gases out of the incinerator, m3/s (or ft3/s)
As with other VOC control devices, the amount of gas to be treated should be minimized toreduce the capital and operating costs of the incinerator. Care must be exercised, however, toensure that the concentration of pollutant in the gas does not exceed a safe level in the ducting,even during process upsets or start up conditions. This is particularly important, since theincinerator itself provides a source of heat and ignition. Most insurance companies consider 25%of the Lower Explosive Limit (LEL) to be the maximum acceptable concentration of VOC in theducting as a general guide. Although this value can be exceeded in some situations, it typicallyrequires additional instrumentation to monitor the level of VOCs at all times and toinstantaneously shut down the process or vent the contaminated gas to the atmosphere at a giventhreshold. Information regarding the LEL should be available from Material Safety Data Sheetsor the chemical manufacturer. Additional information about the LEL is also available from theU.S. Bureau of Mines [36, 37]. The heating value of hydrocarbons at the LEL has beendetermined to be approximately 2 mJ/Nm3 (50 Btu/scf )[6].
To ensure an effective incinerator design, the operating temperature should be approximately 90-150 oC (200-300 oF) above the highest autoignition temperature of any of the components [38].The autoignition temperature is the temperature at which a mixture of organics and air will ignitewithout a spark or flame [39]. Modulating controls should be used to regulate the flow of fuel tothe burner [40]. In the past, units have been designed with on/off controls for the pilot ignitionsource. This type of control is ineffective because it allows short intervals of time where noflame is available for the combustion process. Although the intervals are short, they cansubstantially affect the overall performance of the incinerator. It is essential that the propertemperature and retention time be maintained so that contaminants are completely destroyed.Incomplete combustion can lead to compounds such as aldehydes, dioxins, and furans with moresevere health effects than the original hydrocarbon gas components.[3, 41]
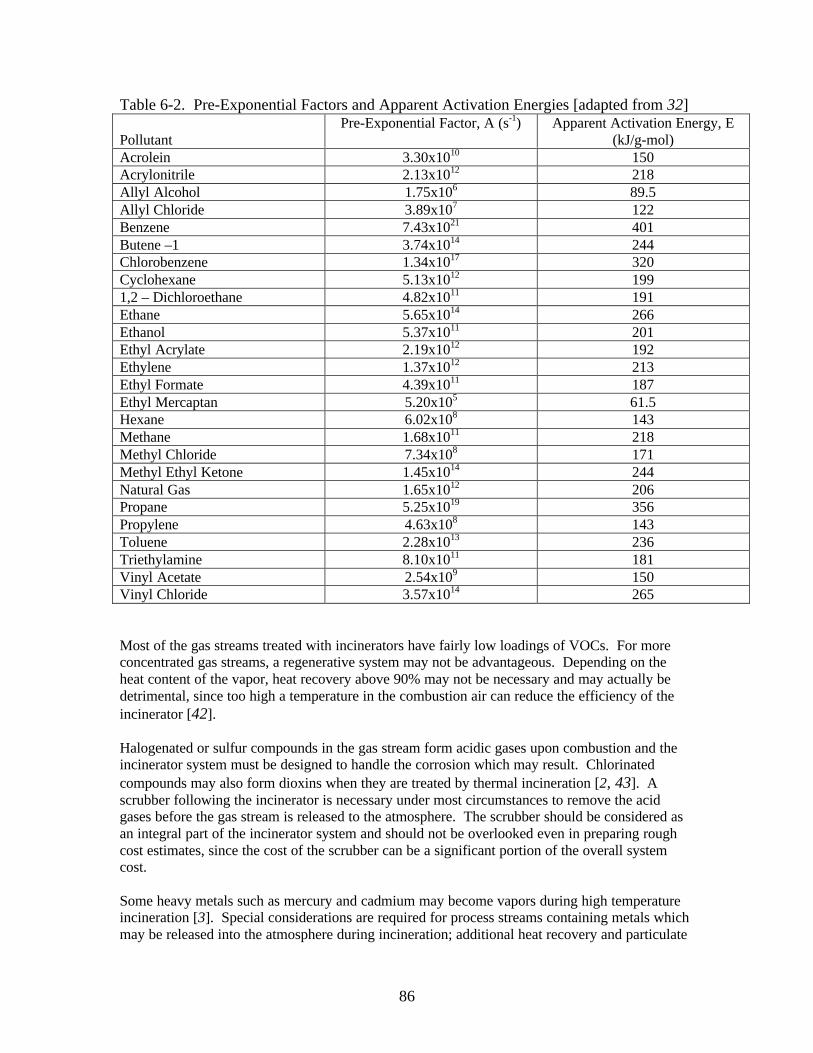
86
Table 6-2. Pre-Exponential Factors and Apparent Activation Energies [adapted from 32]
PollutantPre-Exponential Factor, A (s-1) Apparent Activation Energy, E
(kJ/g-mol)Acrolein 3.30x10¹⁰ 150Acrylonitrile 2.13x10¹² 218Allyl Alcohol 1.75x10⁶ 89.5Allyl Chloride 3.89x10⁷ 122Benzene 7.43x10²¹ 401Butene –1 3.74x10¹⁴ 244Chlorobenzene 1.34x10¹⁷ 320Cyclohexane 5.13x10¹² 1991,2 – Dichloroethane 4.82x10¹¹ 191Ethane 5.65x10¹⁴ 266Ethanol 5.37x10¹¹ 201Ethyl Acrylate 2.19x10¹² 192Ethylene 1.37x10¹² 213Ethyl Formate 4.39x10¹¹ 187Ethyl Mercaptan 5.20x10⁵ 61.5Hexane 6.02x10⁸ 143Methane 1.68x10¹¹ 218Methyl Chloride 7.34x10⁸ 171Methyl Ethyl Ketone 1.45x10¹⁴ 244Natural Gas 1.65x10¹² 206Propane 5.25x10¹⁹ 356Propylene 4.63x10⁸ 143Toluene 2.28x10¹³ 236Triethylamine 8.10x10¹¹ 181Vinyl Acetate 2.54x10⁹ 150Vinyl Chloride 3.57x10¹⁴ 265
Most of the gas streams treated with incinerators have fairly low loadings of VOCs. For moreconcentrated gas streams, a regenerative system may not be advantageous. Depending on theheat content of the vapor, heat recovery above 90% may not be necessary and may actually bedetrimental, since too high a temperature in the combustion air can reduce the efficiency of theincinerator [42].
Halogenated or sulfur compounds in the gas stream form acidic gases upon combustion and theincinerator system must be designed to handle the corrosion which may result. Chlorinatedcompounds may also form dioxins when they are treated by thermal incineration [2, 43]. Ascrubber following the incinerator is necessary under most circumstances to remove the acidgases before the gas stream is released to the atmosphere. The scrubber should be considered asan integral part of the incinerator system and should not be overlooked even in preparing roughcost estimates, since the cost of the scrubber can be a significant portion of the overall systemcost.
Some heavy metals such as mercury and cadmium may become vapors during high temperatureincineration [3]. Special considerations are required for process streams containing metals whichmay be released into the atmosphere during incineration; additional heat recovery and particulate

87
control may be warranted in these circumstances.
Procedures for calculating the total flue gas flow (that is, the flowrate of gasesleaving the incinerator) are given in the OAQPS Control Cost Manual [6] and by Vatavuk[44]:
Q = Qw + Qf 6-4
where: Q = Total flue gas flowrate, normal m3/min abbreviated Nm3/min (in English units,standard ft3/min abbreviated scfm)
Qw = Waste gas flowrate at inlet to incinerator, Nm3/min (scfm)Qf = Flowrate of auxiliary fuel, Nm3/min (scfm)
The flowrate of auxiliary fuel is calculated from the equation:
Qf = QW X/Y 6-5
where: X = 1.1 Cpo (Tc – Tr) – Cpi (Ti - Tr) – hw 6-6Y = hf -1.1 Cpo (Tc- Tr) 6-7Cpo = Mean heat capacity of exhaust stream from the incinerator,
kJ min/Nm3 (Btu scf-1 oF-1) . The heat capacity of air is typically used,since most of the gas stream is air. At 1144 K (871oC, 1600 oF), the heatcapacity of air is 1.50 kJ/Nm3 oC (0.0194 Btu/scf oF).
Tc = Combustion temperature, oC (or oF)Tr = Reference temperature, 21 oC (70oF) is typicalCpi = Mean heat capacity of inlet streams to the incinerator, kJ min/Nm3 (Btu
scf-1 oF-1). Again, the heat capacity of air is typically used, since most ofthe incoming stream is air. At 311K (38 oC, 100 oF), the heat capacity ofair is 1.4 kJ/Nm3 oC (0.018 Btu/scf oF).
Ti = Inlet gas stream temperature, after preheating, oC (oF). Ti may becalculated from the equation Ti = Tw + Eff (Tc – Tw)
Tw = Temperature of waste gas stream before preheating, oC (oF).Eff = Anticipated fractional thermal efficiency of the incinerator (usually
between 0.5 and 0.95)hw = Heat content of waste gas stream, kJ/Nm3 (Btu/scf)hf = Heat content of fuel, kJ/Nm3 (Btu/scf). For natural gas, hf is
approximately 37,000 kJ/Nm3 (900 Btu/scf).hf may be calculated in SI units from the following equation if the heat content is known in kJ/kg:
hf = heat content in kJ/kg x fuel molecular weight in kg/kg-mole /22.4 Nm3 per kg-mole6-8
In English units, hf can be calculated from the known heat content in Btu/lb:
hf = heat content in Btu/lb x fuel molecular weight in lb/lb-mole /386.5 ft3 per lb-mole6-9
These equations are considered valid for gas streams with an oxygen content above 16% thatcontain VOCs at a concentration less than 25% of the LEL. They assume a 10% loss of energyfrom the incinerator [44]. Note that no allowance is included for volume changes due to changesin the total number of moles in the system which may occur during reaction. Additional

88
correction may be needed for gas streams which contain large concentrations of organiccompounds, particularly if the organic compounds contain significant amounts of oxygen.
Additional capital cost can sometimes be avoided if an existing boiler or furnace can be used tocontrol VOCs in addition to its original function [17]. Using a VOC-containing gas stream ascombustion air can benefit the overall process, since the organic compounds serve as fuel whenthe gas stream is combusted. The following criteria must be satisfied before a boiler or processheater is used as an incinerator for waste gases [17, 45, 46]:
There should be very few particles present in the waste gas stream or formed during combustion,since any particulate may build up on heat exchanger surfaces, decreasing the overall fuelefficiency which can be achieved. If this occurs, the additional cleaning required to return theboiler or furnace to peak efficiency may be extremely expensive and may require significantequipment outage time. In addition, solids which make it beyond the heat exchanger cancontribute to the overall particulate loading in the exhaust stream and may make it more difficultfor the combustion device to meet any air pollution control requirements.
1. The gas stream should be only a small part of the total amount of air required forcombustion. If the gas stream represents a significant amount of the combustion air forthe boiler or process furnace, additional design is required to ensure that the oxygenbalance is maintained, that mixing is adequate, and that there is an alternative source ofcombustion air if the VOC process is not operating.
2. The contaminated gas stream should have an oxygen content similar to that of air. If theoxygen content is insufficient, incomplete combustion could occur. The products ofincomplete combustion can be more toxic than the original VOC contaminant. Productsof incomplete combustion may also be sticky material which fouls heat exchangersurfaces.
3. Using a boiler or process furnace to control VOC emissions may inadvertently tie theVOC emitting process and the boiler operation together, since the boiler needs to beoperating whenever the emissions are required to be controlled. This may havesignificant impacts on the VOC emitting process when a boiler is taken off-line forannual or bi-annual maintenance.
4. There should be no compounds in the waste gas stream which will damage the boiler.Halogenated compounds in the gas stream should be avoided, since they may contributeto corrosion in the boiler or flue gas equipment.
5. Additional design changes may be needed to the boiler to ensure adequate mixing. Forexample, baffling may be necessary to ensure that the waste gas does not bypass theflame. Changes to the flame patterns and radiation should be avoided.
6. It is preferable to use a base-loaded boiler to combust the waste gas. A base-loadedboiler is one that operates at a consistent rate for long periods of time. Base-loadedboilers are normally accompanied by swing-load boilers, which alter the fuel input torespond to changing steam or energy demands.
7. The concentration of the organic compound should be less than 25% of the LEL. Formore concentrated streams, the waste gas stream may need to be treated as an auxilliaryfuel, particularly if the concentration is above the LEL.
Any type of thermal combustion device generally results in the formation of some nitrous oxides(NOx). In some cases, the formation of NOx compounds is more of a concern than the presenceof VOCs. Therefore, careful examination of the NOx emissions and applicable requirementsshould be conducted before selecting incineration as the control method. A packed bed flamelessthermal oxidizer is reportedly being developed which has a relatively low combustion

89
temperature, resulting in minimal NOx formation [2, 47]. The concentration of NOx that resultsfrom the combustion process is highly dependent on the peak temperature of combustion, sincethe NOx is formed relatively quickly at high temperatures but does not readily degrade at lowertemperatures. Therefore, the NOx concentration in the exhaust gases from combustion devices aregenerally the same magnitude as equilibrium concentrations at the peak combustion temperature[48]. The formation of NOx from the nitrogen and oxygen in the air is very fast when thecombustion temperature is above approximately 1920 K (1650 oC, 3000 oF) [49]. Most thermalincinerators operate at temperatures lower than the combustion chambers in boilers and NOx
formation is minimal [50].
A list of instrumentation that should be considered is given in Table 6-3. While the amount ofinstrumentation may seem excessive during the design phase, it is often helpful for monitoringany deterioration in performance and for troubleshooting.
Table 6-3. Recommended InstrumentationCombustion temperature
Inlet / outlet concentration
Fan speedPressure
Auxiliary fuel ratePressure drop across any particulate collection devices
Economic EstimatesEstimates of the capital cost of a package recuperative thermal incineration
system are given by Vatavuk [44]. In SI units, the equation is:
CC = a (Q/0.026)b 6-10
In English units, the equation is:
CC = a Qb 6-11
where: CC = Purchased Price, in 1988 dollarsQ = Flowrate of gases after combustion, Nm3/min (scfm)a and b are parameters dependent on the amount of heat recovery required.
For 0% heat recovery, a = 3,120 and b= 0.360. For 50% heat recovery, a = 4,920and b= 0.389. At 70% heat recovery, a = 5,690 and b=0.408 [51].
These estimates are valid for incinerators between 130 and 1300 Nm3/min (5,000and 50,000 scfm) operating at approximately 1090 K (820 oC, 1500 oF). In addition tothe combustion chamber and burner, the price includes a heat exchanger, fan, motor,instrumentation and controls, and a ten foot stack. Ductwork, particulate removaldevices, and site-specific construction requirements are not included. If the incineratoris to be placed a long distance from the generation site, both the cost of ductwork and thecost of additional booster fans should be considered. As with the other chapters in thisbook, the cost estimates are to indicate a general order of magnitude. They are not

90
specific enough to use as construction costs and should be confirmed with actual pricesfrom vendors.
For comparison, Ruddy and Carroll give estimates of capital costs forrecuperative incinerators as $35.3–7060 per cubic meter per minute ($10-200 /cfm). Thecapital cost for regenerative systems is estimated as $1060-16,000/(m3/min) ($30-450/cfm)[52]. It is not specified whether these costs are for actual or standard flowrates.
For a regenerative incinerator with 95% thermal efficiency, the installed cost maybe estimated based on the inlet gas flow according to the following equations [44].
In SI units:
C = 383,000 + 589 QW 6-12
In English units,
C = 383,000 + 15.3 Qw 6-13
This equation is valid for waste gas stream flows between 130 and 1300 Nm3/min(5,000 and 50,000 scfm). The cost of foundations, freight, taxes, and ductwork are notincluded, but the labor to install the incinerator is. Approximately 20% additional cost isrequired for the foundations, freight, taxes, and ductwork [53]. To estimate the totalinstalled capital expenditure, the factors in Table 6-4 may be used, which follow themethodology of EPA’s OAQPS Cost Control Manual.
Annual costs may be approximated using the guidelines in the OAQPS Cost Control Manual [6],as given in Table 6-5. Electricity requirements can be estimated from the formulas given inChapter 4, assuming a pressure drop of 1 kPa (4 inches of water column) for the combustionchamber itself. The heat exchanger adds another 1-3.7 kPa (4-15 inches of water column),corresponding to heat recoveries of 35 to 70 percent [6]. Operating and maintenance laborrequirements are usually minimal with thermal incinerators, at approximately one half hour pershift.
Rough estimates of annual operating costs range from $530-3200 per m3/min ($15-90 /cfm) forrecuperative units to $710 – 5300 per m3/min ($20-150 /cfm) for regenerative systems accordingto Ruddy and Carroll [52].
91
Potential ProblemsLike any equipment, incinerators are susceptible to damage caused by severe temperature
changes. Although they are designed to be operated at high temperature, large fluctuations intemperature can cause thermal stress and lead to premature failure of the refractory lining.Therefore, incinerators are best suited to operations which maintain a fairly constant emission rate[29] and those that operate continuously instead of those that operate for only a few hours eachday. The manufacturer’s start-up procedure normally specifies a warm-up sequence in which theincinerator is brought to operating temperature gradually. Following this procedure lengthensthe life of the refractory, but also uses additional fuel and may take longer than is feasible for theprocess. It is not unusual for maintenance or operating staff to develop a shorter start-upprocedure. Using such a shortcut lowers the overall gas usage but is likely to result inconsiderably higher maintenance requirements. For cyclical processes, a regenerative incineratorshould be considered which can be maintained at operating temperature with minimal natural gasconsumption. Some of these units can even be put on an “idle” mode, in which little or no gas ispulled from the process, but the incinerator recycles exhaust air to the inlet to conserve heat [54].
If a dilute waste gas stream is mixed with the required amount of fuel to achieve the flametemperature, it is possible that the resulting mixture will not have adequate energy concentrationto propogate a flame. This can result in flame quenching in the incinerator, which producesadditional contaminants due to the partial oxidation of the fuel and pollutant gas. Therefore,usually about one-half of the waste gas stream is mixed with the fuel and the remaining waste gasstream is introduced after the initial flame and mixed with the products of combustion [55].

92
Table 6-4. Factors for Estimating the Total Installed Capital Cost of Thermal IncinerationSystems [6]
Cost Element Estimated Cost
Direct Costs
Purchased Equipment Cost Incinerator and Auxiliary Equipment CC, Estimated from equation Taxes 0.03 CC Freight 0.05 CC Total Purchased Equipment Cost, PEC 1.08 CC
Installation Costs Foundations and Supports 0.08 PEC Erection and Handling 0.14 PEC Electrical 0.04 PEC Piping, Insulation, and Painting 0.04 PEC Total Installation Cost 0.30 PEC
Site Preparation As required for specific site, SP Buildings As required for specific site, BLDG
Total Direct Costs 1.30 PEC + SP + BLDG
Indirect Costs
Engineering and Supervision 0.10 PEC Construction, Field Expenses, and Fees 0.15 PEC Start-up and Performance Test 0.03 PEC Contingency 0.03 PEC Total Indirect Costs 0.31 PEC
TOTAL INSTALLED CAPITAL COSTS, TCC 1.61 PEC + SP + BLDG

93
Table 6-5. Annual Operating Costs for Incinerator Systems [6]Direct Annual Costs Unit Cost Estimated
Requirement Utilities: Electricity $0.05/ kWh See Chapter 4 Natural Gas $3.30/1000 ft3 Calculated above Operating Labor $12.96/h ½ hour per shift Maintenance Labor $14.26/h ½ hour per shift Maintenance Materials Equal to maintenance labor Supervisory Labor 15% of Operating Labor
Indirect Annual Costs Overhead 60% of Maintenance Costs
Property Tax 1% of TCC Insurance 1% of TCC Administrative Costs 2% of TCC Capital Recovery (see Chapter 4 for
formula to calculate capital recoveryfactor)
CRF * TCC
Total Annual Operating Costs Direct + Indirect Operating Costs
Installation, Operation, and Maintenance ConsiderationsThe main problem with recuperative incinerators tends to be ensuring that the heat
exchange surface remains clean and that the heat exchanger does not develop cracks [56]. Inaddition to difficulties with the refractory linings in the incinerator, heat stress can take a toll onthe heat recovery equipment. At best, heat stress or buildup of material may keep butterfly valveson regenerative units from seating properly, a common problem which allows leakage of thecontaminated gas stream into the outlet gas stream, decreasing efficiency. At worst, heat stresscan crack metal joints in heat exchangers, so that gas is allowed to escape from the clean side tothe dirty side or vice versa, depending on the position of the fan. Such cracks can be difficult tolocate, since the metal contracts as it cools to room temperature. The incinerator system shouldbe designed considering the potential leakage of material. An additional fan is usually required tomove the air from the process into the incinerator. This fan may be installed either before or afterthe heat exchangers and incinerator. By careful analysis of the system and fan placement, it canbe ensured that any leakage occurs in an acceptable direction. Any inorganic particulate thatmay block nozzles, interfere with the combustion flame, or foul heat transfer surfaces should beremoved prior to the incineration system. A list of advantages and disadvantages of thermalincineration is given in Table 6-6 for comparison with other technologies during a technical andeconomic evaluation [57, 58].

94
Table 6-6. Advantages and Disadvantages of Thermal Incineration [57, 58]
Advantages Disadvantages
Simple, straightforward operation Some NOx formation, although it can beminimized
Heat recovery for other processes is feasible Explosion potential
High efficiencies possible with proper design Fuel consumption can be significant
Technology is applicable for a wide variety ofgas concentrations and constituents.
No ability to reuse pollutants
Useful for multi-component streams Approximately 3 times higher fuel usage than incatalytic incinerators

95
References 1. “Combustion” in Air Quality, 2nd Edition, T. Godish, Lewis Publishers, Chelsea, MI,
1991, p.321-325.2. R.L. Berglund, “Exhaust Control, Industrial” in Kirk-Othmer Encyclopedia of
Chemical Technology, 4th Edition, Volume 9: Elastomers, Polyisoprene to ExpertSystems, J.I. Kroschwitz; M. Howe-Grant, Eds., John Wiley & Sons, New York,1994, p. 1022-1060.
3. “Control by Combustion” in Air Pollution Control Engineering, N. De Nevers,McGraw-Hill, New York, 1995, p. 300-315.
4. “Incineration” in Standard Handbook of Environmental Engineering, R.A. Corbitt,McGraw-Hill, Inc., New York, 1990, p.4.69-4.72.
5. G.T. Joseph; D.S. Beachler, “Combustion Equipment Used for Control of GaseousEmissions” in APTI Course 415: Control of Gaseous Emissions, Student Manual,United States Environmental Protection Agency, Air Pollution Training Institute,Research Triangle Park, NC, 1981, p.3-15 to 3-31.
6. D.R. van der Vaart; J.J. Spivey; W.M. Vatavuk; A.H. Wehe, “Thermal and CatalyticIncinerators” in OAQPS Control Cost Manual, 5th Edition, United StatesEnvironmental Protection Agency, Office of Air Quality Planning and Standards,Research Triangle Park, NC, 1995, Chapter 3 (available on the web athttp://www.epa.gov/ttn/catc/products.html).
7. D.C. Mascone, “Thermal Incinerator Performance for NSPS”, memo to J.R. Farmer,United States Environmental Protection Agency, Office of Air Quality Planning andStandards, dated June 11, 1980, as described in OAQPS Control Cost Manual, 5th
Edition, Chapter 3.8. D.C. Mascone, “Thermal Incinerator Performance for NSPS Addendum”, memo to
J.R. Farmer, United States Environmental Protection Agency, Office of Air QualityPlanning and Standards, dated July 22, 1980, as described in OAQPS Control CostManual, 5th Edition, Chapter 3.
9. D.C. Mascone, “Thermal Incinerators and Flares”, memo to J.R. Farmer, UnitedStates Environmental Protection Agency, Office of Air Quality Planning andStandards, dated August 22, 1980, as described in OAQPS Control Cost Manual, 5th
Edition, Chapter 3.10. R.Y. Purcell; G.S. Shareef, “Thermal Incineration” in Control Technologies for
Hazardous Air Pollutants, Air and Energy Engineering Research Laboratory, Officeof Research and Development, U.S. Environmental Protection Agency, ResearchTriangle Park, NC, 1986, p.47-59.
11. “Thermal Oxidation” in Assessment and Control of VOC Emissions from WasteTreatment and Disposal Facilities, T.T. Shen, C.E. Schmidt, T.R. Card, VanNostrand Reinhold, New York, 1993, p. 164-166.
12. S.M. Weiss, “Catalytic Afterburners” in Air Pollution Engineering Manual, 2nd
Edition, J.A. Danielson, Ed., United States Environmental Protection Agency, 1973,p. 179-181.
13. “Equipment Characteristics – Thermal Incineration” in Air Pollution: The Emissions,The Regulations, and The Controls, J.P. Tomany, American Elsevier PublishingCompany, Inc., New York, 1975, p.231 - 251.

96
14. W.L. Polglase, “Boilers Used as Afterburners”, in Air Pollution Engineering
Manual, 2nd Edition, J.A. Danielson, Ed., United States Environmental ProtectionAgency, 1973, p. 183-189.
15. Rolke, 1972 as given by G.T. Joseph; D.S. Beachler in “Combustion EquipmentUsed for Control of Gaseous Emissions” in APTI Course 415: Control of GaseousEmissions, Student Manual, United States Environmental Protection Agency, AirPollution Training Institute, Research Triangle Park, NC, 1981, p.3-15 to 3-31
16. R.Y. Purcell; G.S. Shareef, “Vapor Emissions Control” in Control Technologies forHazardous Air Pollutants, Air and Energy Engineering Research Laboratory, Officeof Research and Development, U.S. Environmental Protection Agency, ResearchTriangle Park, NC, 1986, p. 23-33.
17. “Air Pollution Control Methods” in Kirk-Othmer Encyclopedia of ChemicalTechnology, 4th Edition, Volume 1: A to Alkaloids, J.I. Kroschwitz, M. Howe-Grant,Eds., John Wiley & Sons, New York, 1991.
18. J.M. Tyler, “Combustion Systems” in Handbook of Air Pollution ControlEngineering and Technology, J.C. Mycock; J.D. McKenna; L. Theodore, LewisPublishers, Boca Raton, Florida, 1995, p.199-221.
19. B.J. Glowiak; K. Grefen; H. Jüntgen; K. Kirchner; E. Pilarczyk; F. Sporenberg; E.Weber, “Thermal Combustion” in Ambient Air Pollutants from Industrial Sources: AReference Handbook, M.J. Suess; K. Grefen; D.W. Reinish, Eds., Published forWorld Health Organization Regional Office for Europe, Elsevier, Amsterdam, 1985,p. 714-722.
20. “Afterburner Systems Study”, Report EPA-R2-062, United States EnvironmentalProtection Agency, Research Triangle Park, NC, 1972.
21. “Technological Fact Sheet: Biothermica International, Inc.; Regenerative ThermalOxidizer (BIOTOX) Treatment of Air and Gas”,http://www.enviroaccess.ca/fiches_2/F2-01-95a.html, 1998.
22. “Fume Oxidizers for Destruction of VOCs, Odors, and Smoke”, Glenro Inc. salesliterature, Glenro Inc., Paterson, NJ, 1998 [http://www.glenro.thomasregister.com].
23. “Anguil Thermal Oxidizer System”, sales literature from Anguil EnvironmentalSystems, Inc., Milwaukee, WI, 1998.
24. J.M. Klobucar, “Choose the Best Heat Recovery Method for Thermal Oxidizers”,Chem. Eng. Prog., [April], 1995, p.57-63.
25. “Cor-Pak Recuperative Oxidizer Value Added Advantages” in ABB Air Preheater,Inc. sales literature, number TS-25, ABB, Wellsville, NY.
26. W. Elnicki, “Thermal Incineration Economics” in Air Pollution Control and DesignHandbook (in Two Parts), P.N. Cheremisinoff; R.A. Young, Eds., Marcel Dekker,Inc., New York, 1977, p.469-482.
27. “Twin-Bed Regenerative Oxidizer System”, sales literature from AnguilEnvironmental Systems, Inc., Milwaukee, WI, 1998.
28. Chemical Section Engineers, New Source Review Division of Texas NaturalResource Conservation Commission, Air Permit Technical Guidance for ChemicalSources: Flares and Vapor Oxidizers, Texas Natural Resources ConservationCommission, 1998, available on the internet at http://www.tnrcc.state.tx.us/air/nsr_permits/guidedoc.html.

97
29. R.A. Zerbonia; J.J. Spivey; S.K. Agarwal; A.S. Damle; C.W. Sanford, “Incineration”
in Survey of Control Technologies for Low Concentration Organic Vapor GasStreams, Control Technology Center, U.S. Environmental Protection Agency,Research Triangle Park, NC, 1995, Section 2.
30. Martin et.al., 1993, as described in Survey of Control Technologies for LowConcentration Organic Vapor Gas Streams
31. N. Mukhopadyay; E.C. Moretti, “Thermal Oxidation (Thermal Incineration)” inCurrent and Potential Future Industrial Practices for Reducing and ControllingVolatile Organic Compounds, Center for Waste Reduction Technologies, AmericanInstitute of Chemical Engineers, New York, 1993, p. 48-49.
32. A.J. Buonicore, “Incineration” in Air Pollution Engineering Manual, A.J. Buonicore;W.T. Davis, Eds., Van Nostrand Reinhold, New York, 1992, p.58-62.
33. “Incineration” in Air Pollution Control Equipment, Volume II: Gases, L. Theodore;A.J. Buonicore, CRC Press, Inc., Boca Raton, FL, 1988, p.115-136.
34. J. Wei; C.D. Prater, “A New Approach to First Order Chemical Reaction Systems”,Am. Inst. Chem. Eng. J., 9, 77, 1963.
35. J. Wei; C.D. Prater, Advances in Catalysis, Volume 13, Academic Press, New York,1962.
36. U.S. Bureau of Mines, “Limits of Flammability of Gases and Vapors”, U.S. Bureauof Mines, Washington, DC, Bulletin Number 503, [no date given].
37. R.D. Ross, “Thermal Incineration” in Air Pollution Control and Design Handbook(in Two Parts), P.N. Cheremisinoff; R.A. Young, Eds., Marcel Dekker, Inc., NewYork, 1977, p. 449-468.
38. “Concepts of Combustion as an Emission Control Method” in APTI Course 415:Control of Gaseous Emissions Course, United States Environmental ProtectionAgency, Richmond, Virginia, 1991.
39. C.D. Cooper; F.C. Alley, “VOC Incinerators” in Air Pollution Control: A DesignApproach, 2nd Edition, Waveland Press, Inc., Prospect Heights, Ill, 1994, p. 337-378.
40. Personal communication with Ray Goetz, Senior Engineer, Department ofEnvironmental Quality, Commonwealth of Virginia, Roanoke Regional Office,Roanoke, Virginia.
41. “Incinerators for Vapors and Gases” in Kirk-Othmer Encyclopedia of ChemicalTechnology, 4th Edition, Volume 14, Imaging Technology to Lanthanides, J.I.Kroschwitz; M.Howe-Grant, Eds., John Wiley & Sons, New York, 1995, p.118-120.
42. S.M. Weiss, “Preheating of Afterburner Inlet Gases” in Air Pollution EngineeringManual, 2nd Edition, J.A. Danielson, Ed., United States Environmental ProtectionAgency, 1973, p. 182-183.
43. Catalytic Control of VOC Emissions, A Cost Effective Viable Techonology forIndustrial, Commercial, and Waste Processing Facililies, Manufacturers of EmissionControls Association, Washington, DC, 1992.
44. “Incinerators” in Estimating Costs of Air Pollution Control, W.M. Vatavuk, LewisPublishers, 1990, p.141-156
45. K.Noll; W.J. Franek; L. Stander, “Lesson 21: Methods of Emission Control –Incineration” in APTI Course 482: Sources and Control of Volatile Organic AirPollutants, United States Environmental Protection Agency, Manpower and

98
Technical Information Branch of the Office of Air Quality Planning and Standards,Research Triangle Park, NC, 1987, p.21-1 to 21-7.
46. EPA, Controlling Pollution from the Manufacturing and Coating of Metal Products,US Environmental Protection Agency, Research Triangle Park, NC, 1977.
47. R.J. Martin; R.E. Smyth; J.T. Schofield, “Elimination of Petroleum Industry AirToxic Emissions with a Flameless Thermal Oxidizer”, Petro-Safe ’93, HoustonTexas, January 29, 1993.
48. R.J. Heinsohn; R.L. Kabel, "Formation of Nitrogen Oxides" in Sources and Controlof Air Pollution, Prentice Hall, Upper Saddle River, NJ, 1999, p. 300-308.
49. “Combustion By-Products” in Steam: Its Generation and Use, Babcock & Wilcox,New York, 1978, Chapter 18, p. 18-1 to 18-6.
50. A.B. Nunn, personal communication, 1999.51. V.S. Katan;W.M. Vatavuk; A.H. Wehe, “Incineration Techniques for Control of
Volatile Organic Compound Emissions, Part II: Capital and Annual OperatingCosts”, J. of the Air Poll. Cont. Assoc., (1987) 37, 2, p. 198-201.
52. E.N. Ruddy; L.A. Carroll, “Select the Best VOC Control Strategy”, Chem. Eng.Prog., July, 1993, p. 28-35.
53. Price information from Salem Industries, Inc., South Lyon, MI, as given by Vatavuk[44].
54. Personal communication with Tellkamp Industries.55. C.F. Gottschlich, “Combustion” in Air Pollution, 3rd Edition, Volume IV:
Engineering Control of Air Pollution, A.C. Stern, Ed., Academic Press, New York,1977, p. 365-376.
56. T.T. Shen; C.E. Schmidt; T.R. Card, “Thermal Oxidation” in Assessment andControl of VOC Emissions from Waste Treatment and Disposal Facilities, VanNostrand Reinhold, New York, 1993, p.164-166.
57. L. Theodore; A.J. Buonicore, “Thermal and Catalytic Combustion Reactors andFlares” in Industrial Control Equipment for Gaseous Pollutants, Volume II, CRCPress, Inc., Cleveland, OH, 1975, p. 75-87.
58. L. Theodore; A.J. Buonicore; J.D. McKenna; I.J. Kugelman; J.S. Jeris; J.J. Santoleri;T.F. McGowan, “Waste Management” in Perry’s Chemical Engineers’ Handbook,7th Edition, D.W. Green; J.O. Maloney, Eds., McGraw-Hill, New York, 1997,Chapter 25, p. 25-1 to 25-111.

99
Chapter 7
FlaringTechnology DescriptionFlaring is another type of combustion process, referred to as “complete combustion”, in whichthe combustion reaction occurs instantaneously at the burner tip [1], with the air diffusing acrossthe combustion boundary toward the core of fuel gas [2]. The operating temperature is generallybetween 1370 and 1920 K (1090 and 1650 oC, 2000 and 3000 oF) [3, 4]. Flares are frequentlyused to control emergency venting of pollutants during process upsets [5]. While themechanisms are similar to thermal oxidation, flares have historically been treated separately fromthermal oxidizers because it is often extremely difficult to sample the emissions from a flare.Instead, emissions are frequently calculated from emission factors developed in the early 1980’s[6]. Mixing and temperature are the critical parameters of properly designed flares, since there isno residence chamber to continue the combustion reaction [7]. While flares constitute relativelysimple control devices, there are many concerns in their operation, including noise, smoke,energy consumption, and safety [8]. Safety concerns encompass both the large amounts of heatreleased and the potential for releasing combustion by-products [9]. A typical flow diagram of aflare is given in Figure 7-1 [10].
PurgeGas
WaterSealDrain
Knock-outDrum
Gas CollectionHeader and
Transfer LineSteam Line
Ignition DeviceAir LineGas Line
FlareStack
Gas Burners
Helps PreventFlashback
SteamNozzles
PilotBurners
Figure 7-1. Typical Flare Diagram [10]
Flares are prevalent in the petrochemical industry [11, 12] both for control of emissions at steadystate, and for destroying pollutants during unstable operating conditions such as start-ups andshutdowns [13]. They are particularly well-suited to processes with variable gas flow, because

100
they can be designed to operate over a wide range of flow. Flares can handle a gas stream with amaximum flow rate 1000 times as high as the minimum flow rate [7]. In addition, they canhandle gas flows at least as high as two million pounds per hour [13]. If properly designed, flaresare capable of efficiencies rivaling those of incinerators and absorbers. On gas streams with heatcontents of 12.2 MJ/Nm3 (300 Btu/scf) or higher, 98% destruction is feasible. In fact, this isrequired by EPA regulations for some flares [2, 14].
The color of the flare flame indicates the mechanisms by which combustion is occurring. A blueflame indicates that the fuel and air mixture is being heated gradually to form aldehydes andketones which are then reacted to form carbon dioxide and water. By contrast, a yellow-orangeflame indicates that cracking of the fuel is occurring, and that the hydrocarbons have not hadadequate opportunity to react with available oxygen, so that elemental carbon and hydrogen areformed. The carbon particles cause the flame to glow yellow. If the flame is not adequatelymixed or of sufficient temperature, the carbon particles cool below the carbon ignitiontemperature and form black smoke or soot [2, 7].
As with other combustion techniques, the application of flaring is limited to situations in whichthe pollutants are not valuable enough to make recovery economically viable. Furthermore, it isgenerally also limited to gas streams with relatively concentrated organic constituents, althoughless concentrated streams can be flared if the additional cost of auxiliary fuel can be justified dueto the toxicity of the pollutant or the sensitivity of local citizens.
In general, flaring is not a suitable control technology for halogenated compounds, since thesecompounds require longer residence time to achieve complete combustion and acceleratecorrosion of the nozzle [15]. In addition, it is impossible to treat the acid by-products whichresult from burning halogenated compounds. If thermal incineration is employed instead, the off-gases can be treated by a scrubber before being released to the atmosphere.
Table 7-1. Typical Applications of Flaring [7, 16, 17, 18, 19]Acrylonitrile product loading
RefineriesDangerous gases such as hydrogen cyanide and ammonia
LandfillsSewage treatment plants
Dimethylamine odors from soap manufacturing

101
Types of FlaresThere are four types of flares, classified according to the method used to provide for
adequate contact at the burner tip. The most common is the steam assisted flare, which iscommonly used in chemical processes and refinery operations [2, 20, 21]. Steam injected intothe flame provides mixing between the air and the gas for better combustion and helps to pull airinto the combustion zone [2, 14]. The steam also assists in the combustion efficiency by reactingwith intermediate combustion products to form oxygenated compounds which combust at lowertemperatures [2, 7] . It also helps maintain a lower temperature in the flame to reduce thermalcracking [2]. The type and concentration of pollutants determine the amount of steam needed forgood combustion; the mass ratio of steam to air is usually in the range of 0.01-0.6 [2, 7, 11].Steam assisted or smokeless flares are used to control emissions of organic compounds that havea lower ratio of hydrogen to carbon [19]
Other types of flares are air-assisted, in which air is blown into the combustion zone to improvemixing and provide oxygen for combustion; non-assisted, in which a gas stream with low heatcontent and easily combustible gases that are resistant to thermal cracking is burned without anymixing enhancement; and pressure-assisted flares, in which the gas stream itself is pressurized toenhance the mixing. Air- and pressure-assisted flares are advantageous, in that they can be usedin areas without available steam. [2]
Flare DesignA flaring system generally includes a collection header for the waste gas, followed by a knock-out pot (if necessary) to remove liquid droplets. A water seal is used to prevent the flame frompropagating back down the stack and into the process if the velocity of the gas is reduced. As thegas travels through the flare, pilot burners ignite the gas stream to destroy the VOCs [22]The diameter of the flare stack and nozzle must be sized appropriately so that the flame does notpropagate back into the stack because of too low a stack gas velocity nor get extinguishedbecause of too high a flow rate. EPA has developed regulations to ensure that flares are designedto achieve high destruction efficiencies [23]. EPA guidelines for steam-assisted flares include thefollowing [2]:
1. For gas streams with heat contents greater than 41 MJ/Nm3 (1000 Btu/scf), the maximumexit velocity is 122 m/s (400 ft/s). For other gas streams, the maximum exit velocity isdetermined from the net heating value (Bv) by the following equation:
In SI units:
Vmax = 10 (Bv/0.0404 + 1214)/852
or in English units:
Vmax = 10(Bv+1,214)/852
where : Vmax = maximum exit velocity, m/s (or ft/s for English units) Bv = net heating value, MJ/Nm3 (or Btu/scf)
2. The net heating value of the gas must be at least 12.2 MJ/Nm3 (300 Btu/scf).3. A flame must be present at any time emissions may be vented.4. No visible emissions (smoke) is allowed from the flare.

102
The minimum nozzle diameter (Dmin) can be calculated from the volumetric flowrate (Q) and themaximum velocity. The diameter is normally sized so that the maximum volumetric flow rate isconveyed through the nozzle at approximately 80% of the allowable velocity, Vmax [2]:
In SI Units:
Dmin = 162.5 (Qmin/Vmax)1/2
In English Units:2/1
maxmin V
Q95.1D
=
where Dmin = Minimum nozzle diameter, (mm or in.) Q = Outlet maximum volumetric flowrate (actual m3/min or actual ft3/min).
Safety concerns associated with flares are obvious: since flares are usually installed on streamswhere the gas exceeds the Lower Explosive Limit (or LEL), a flame will propagate very quicklythrough the ducting if adequate suppression systems are not installed. Explosive limits forseveral compounds are given in Table 7-2. The flare must also be installed at a safe elevation. Aconservative calculation of the required distance from exposed objects can be made from thefollowing equations[2]:
In SI units:2/1
m
K
mB02078.0L
=
In English units:
2/1
m
K4
mB2.0L
=
where L = the required distance, meters (or feet)m = mass flow rate, kg/h (or lb/h)Bm = heat content of the gas stream, kJ/kg (or Btu/lb)K = allowable radiation, assumed to be 49 kJ h-1 m-2 (500 Btu h-1 ft-2)

103
Table 7-2. Flammability Limits in Air [7]Pollutant Lower Explosive Limit
(Volume %)Upper Explosive Limit (Volume%)
Hydrogen 4.00 74.20Carbon Monoxide 12.50 74.20Methane 5.00 15.00Ethane 3.00 12.50Propane 2.12 9.35n-Butane 1.86 8.41Isobutane 1.80 8.44n-Hexane 1.18 7.4Ethylene 2.75 28.60Propylene 2.00 11.10n-Butene 1.75 9.70Benzene 1.40 7.10Toluene 1.27 6.75Xylene 1.00 6.00Methyl Alcohol 6.72 36.50Ethyl Alcohol 3.28 18.95Ammonia 15.50 27.00Hydrogen Sulfide 4.3 45.50Gasoline 1.40 7.60
Specifications in the state of Texas for steam-assisted flares include guidance that at least 0.4kilograms (or pounds) of steam be used per kilogram (or pound) of waste gas when the H/C ratiois less than 0.3. In addition, the guidance recommends that an H/C ratio higher than of 1 beavoided, since the VOC destruction efficiency may be decreased [6]. Additional designinformation is given by Swithenbank [24]. Instrumentation that should be considered wheninstalling a flare system is given in Table 7-3.
Table 7-3. Instrumentation to Consider for Flare SystemsGas stream pressure and flow (particularly if flow is variable)
Concentration or % LELFan speed
Auxilliary fuel flow
Economic EstimatesAs shown in the following equations, the type of support required for the flare stack cansubstantially affect the cost of the system. Three types of flare structures are included: self-supported flares, derrick-supported flares, and flares supported by guy wires. Figures 7-2 [2], 7-3[2], and 7-4 [2] show examples of types of support structures which can be used for flares.Operating costs are governed primarily by the amount of auxiliary fuel, steam and electricityneeded.
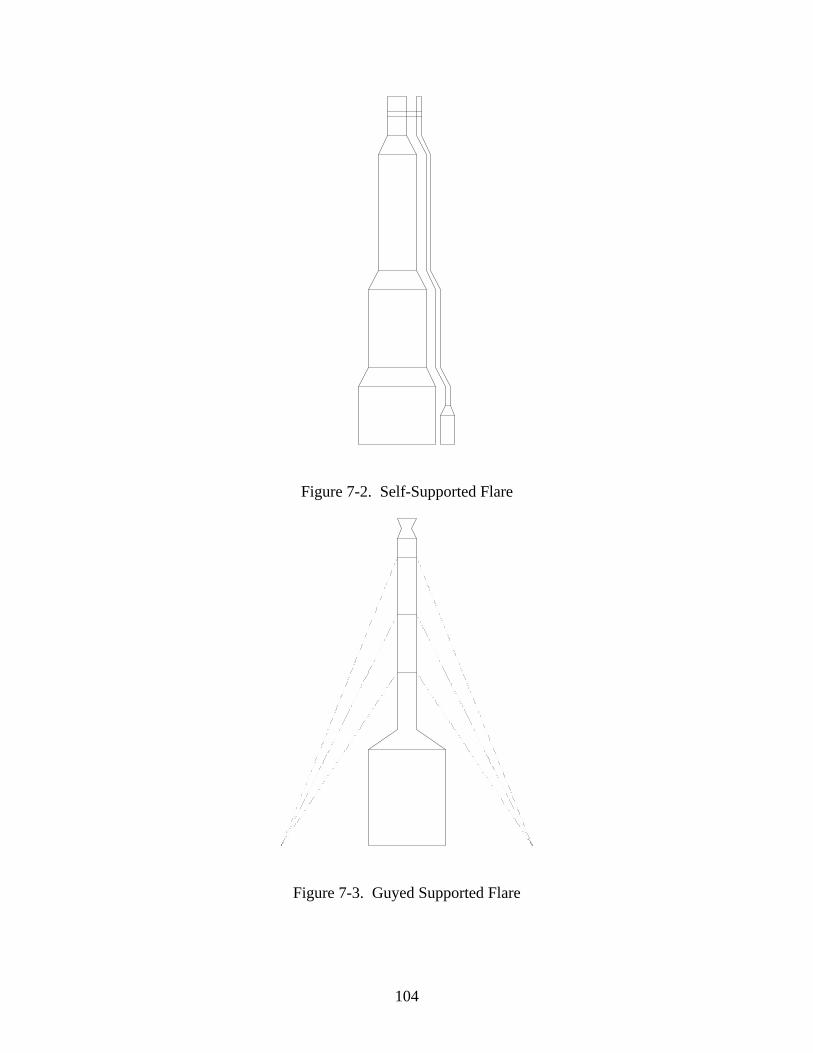
104
Figure 7-2. Self-Supported Flare
Figure 7-3. Guyed Supported Flare

105
Figure 7-4. Derrick Supported Flare
Estimates of the capital cost of the flare can be obtained from the following equations [2]. Thefigures given are in 1990 dollars and should be scaled up to the current year using escalationfactors available on the Clean Air Technology Center website (http://www.epa.gov/ttn/catc).
In SI units,
CF = a+bD/25.4+cL/3.2808
In English Units,
CF = (a + b D + c L)2
where:D = tip diameter, mm (or in)L = Height of flare stack, m, 9.14 m at a minimum (or ft, 30 feet at a minimum).Factors a, b, and c are specific to the type of support structure, given in Table 7-4:
Table 7-4. Factors for Capital Cost EquationType of Support a b cSelf supported 78.0 9.14 0.749Guy wires 103 8.68 0.470Derrick Supported 76.4 2.72 1.64
These cost estimates include a carbon steel flare stack with the upper 1.2 m (four feet) made of310 stainless steel, 310 stainless steel burner tip, pilot lights, liquid and gas seals, access laddersand platforms as required. They also include utility piping from the base of the stack, meteringand control. The equations are generally valid for tip diameters from 25 to 1520 mm (1 to 60

106
inches) and for stacks from 9.1 m to 152 m (30 to 500 feet).
In addition to the cost of the flare itself, costs for vent piping and a knock out pot must also beincluded in the overall estimate of equipment cost. The approximate size of a vertical knock outpot on a relatively constant flow vent stream can be estimated from the following equations:
In SI Units:
2/1
v
vl
a
G197
QA
ρ
ρ−ρ=
In English Units:
2/1
v
vl
a
G60
QA
ρ
ρ−ρ=
where A = cross sectional area of the knock out vessel, m2 (or ft2) Qa = actual flow rate of vent stream, m3/min (or ft3/min)
G = vapor velocity factor, usually 0.15 –0.25ρl = density of the liquid to be removed in the knock out pot, kg/m3 (or lb/ft3)ρg = density of the gas stream, kg/m3 (or lb/ft3)
Once the cross sectional area of the vessel is known, the diameter can be calculated from thefollowing equations [2].
In SI units:
A4
d min π=
In English units:
A5.13d min =
where: dmin= minimum diameter of the vessel, m (or ft)
For an actual diameter, dK, the minimum should be rounded to the next highest standard size.Vessels are usually available in 0.152 m (0.5 ft) increments. The thickness of the vessel, t, isdetermined from Table 7-5 .

107
Table 7-5. Determination of Knock Out Pot Wall Thickness [2]Diameter Thickness, t
m ft mm inLess than 0.914 Less than 3 6.4 0.25At least 0.914 and less than 1.83 At least 3 and less than 6 9.4 0.37At least 1.83 and less than 2.74 At least 6 and less than 9 12.7 0.5At least 2.74 and less than 3.66 At least 9 and less than 12 19.1 0.753.66 or over 12 or over 25.4 1
The height of the knock out drum, h (m or ft), is estimated as three times the actual diameter [2].With the diameter and height of the knock out drum, the cost of the knock out drum, CK isestimated as [2, 25, 26]:
In SI units:CK = 2.1 [ dK t (h +0.812 dK)] 0.737
In English Units:CK = 0.364 [ dK t (h +0.812 dK)] 0.737
The cost of piping the vent stream to the flare stack, CP, is calculated separately from thefollowing equation [2], assuming that that 31 m (100 feet) of piping is required that has the samediameter as the tip of the flare [27]:
In SI units:CP = 2.53 D1.21 for diameters between 25 and 610 mmCP = 4.36 D1.07 for diameters between 760 and 1520 inches
In English units:CP = 127 D1.21 for diameters between 1 and 24 inchesCP = 139 D1.07 for diameters between 30 and 60 inches
Piping costs are based on Schedule 40 carbon steel pipe.
The total purchased equipment cost includes the cost of the flare, the knock-out pot, and thepiping, plus instrumentation, sales taxes, and freight. Additional fans or blowers are not includedin these calculations, but may be required due to the significant pressure drop in some systems.Instrumentation is estimated as 10% of the equipment cost, sales taxes as 3%, and freight as 5%for a total of [2]:
PEC = 1.18 (CF + CK + CP)
As shown in Table 7-6, the total capital investment is estimated as 192% of the purchasedequipment price [19] .
Annual costs may be approximated as given in Table 7-7. Electricity requirements can beestimated from the formulas given in Chapter 4. The pressure drop for flare systems can be ashigh as 60 inches of water [28], depending on the configuration of the equipment and the lengthof the gas piping. Steam costs can be estimated as 0.6 lb/lb of waste gas [28].

108
Table 7-6. Factors for Estimating the Total Installed Capital Cost of Flares [2]Cost Element Estimated CostDirect Costs Purchased Equipment Cost Flare and Auxiliary Equipment (EC) EC = CF + CK + CP
Instrumentation 0.10 EC Taxes 0.03 EC Freight 0.05 EC Total Purchased Equipment Cost, PEC 1.18 EC Installation Costs Foundations and Supports 0.12 PEC Erection and Handling 0.40 PEC Electrical 0.01 PEC Piping, Insulation, and Painting 0.04 PECTotal Installation Cost 0.57 PECSite Preparation As required for specific site, SP Buildings As required for specific site, BLDGTotal Direct Costs 1.30 PEC + SP + BLDGIndirect Costs Engineering and Supervision 0.10 PEC Construction, Field Expenses, and Fees 0.20 PEC Start-up Performance Test 0.02 PEC Contingency 0.03 PEC Total Indirect Costs 0.35 PECTOTAL INSTALLED CAPITAL COSTS, TCC 1.92 PEC + SP + BLDG
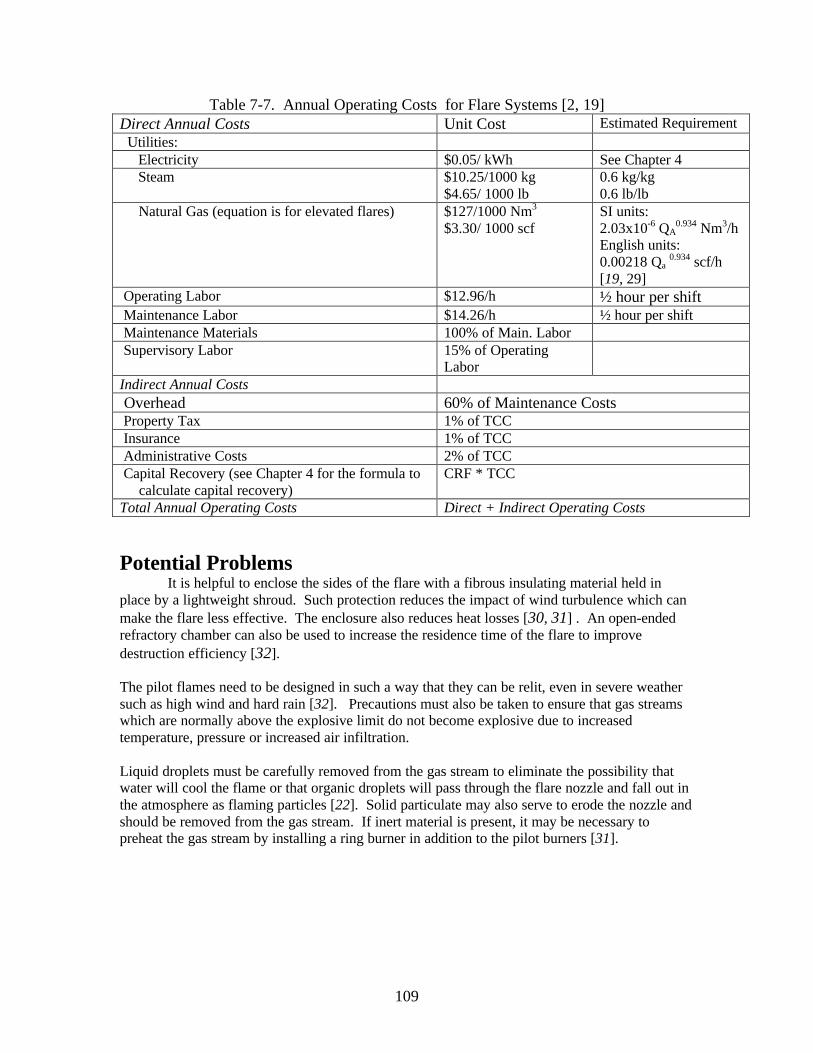
109
Table 7-7. Annual Operating Costs for Flare Systems [2, 19]Direct Annual Costs Unit Cost Estimated Requirement Utilities: Electricity $0.05/ kWh See Chapter 4 Steam $10.25/1000 kg
$4.65/ 1000 lb0.6 kg/kg0.6 lb/lb
Natural Gas (equation is for elevated flares) $127/1000 Nm3
$3.30/ 1000 scfSI units:2.03x10⁻⁶ QA
0.934 Nm3/hEnglish units:0.00218 Qa
0.934 scf/h[19, 29]
Operating Labor $12.96/h ½ hour per shift Maintenance Labor $14.26/h ½ hour per shift Maintenance Materials 100% of Main. Labor Supervisory Labor 15% of Operating
LaborIndirect Annual Costs Overhead 60% of Maintenance Costs Property Tax 1% of TCC Insurance 1% of TCC Administrative Costs 2% of TCC Capital Recovery (see Chapter 4 for the formula to
calculate capital recovery)CRF * TCC
Total Annual Operating Costs Direct + Indirect Operating Costs
Potential ProblemsIt is helpful to enclose the sides of the flare with a fibrous insulating material held in
place by a lightweight shroud. Such protection reduces the impact of wind turbulence which canmake the flare less effective. The enclosure also reduces heat losses [30, 31] . An open-endedrefractory chamber can also be used to increase the residence time of the flare to improvedestruction efficiency [32].
The pilot flames need to be designed in such a way that they can be relit, even in severe weathersuch as high wind and hard rain [32]. Precautions must also be taken to ensure that gas streamswhich are normally above the explosive limit do not become explosive due to increasedtemperature, pressure or increased air infiltration.
Liquid droplets must be carefully removed from the gas stream to eliminate the possibility thatwater will cool the flame or that organic droplets will pass through the flare nozzle and fall out inthe atmosphere as flaming particles [22]. Solid particulate may also serve to erode the nozzle andshould be removed from the gas stream. If inert material is present, it may be necessary topreheat the gas stream by installing a ring burner in addition to the pilot burners [31].

110
Installation, Operation, and Maintenance ConsiderationsCorrosion is a potential problem with any control device. In flares, it is usually a
problem with high concentrations of sulfur compounds or high concentrations of halogenatedcompounds. These compounds are better suited to incineration followed by scrubbing to removethe corrosive compounds [29].
Texas requires that all proposed flare systems include a continuous pilot ignition system so thatprocess and emergency flares are relit immediately. In addition, it is recommended that a remoteinfrared monitor be used to monitor the flame [6]. A summary of the advantages anddisadvantages of using flaring systems to control VOCs is given in Table 7-8.
Table 7-8. Advantages and Disadvantages of FlaresAdvantages DisadvantagesRelatively simple equipment and operation No recovery of contaminantCapable of high efficiency Potential corrosion of ductwork due to moisture
in gas stream
111
References 1 . “Combustion Equipment Used for Control of Gaseous Emissions” in APTI Course
415, Control of Gaseous Emissions, Student Manual, G.T. Joseph; D.S. Beachler,United States Environmental Protection Agency, Office of Air, Noise and Radiationand Office of Air Quality Planning and Standards, Research Triangle Park, NC,1981, p. 3-15 to 3-37.
2. D.K. Stone; S.K. Lynch; R.F. Pandullo; L.B. Evans; W.M. Vatavuk, “Flares” inOAQPS Control Cost Manual; 5th Edition, USEPA, Research Triangle Park, NC,1995, Chapter 7.
3. R.M. Bethea, “Combustion” in Air Pollution Control Technology: An EngineeringAnalysis Point of View, Van Nostrand Reinhold, New York, 1978, p. 395-431.
4. A.J. Buonicore, L. Theodore, “Thermal and Catalytic Combustion Reactors andFlares” in Industrial Control Equipment for Gaseous Pollutants, Volume II, CRCPress, Cleveland, OH, 1975, p.75-87.
5. N. De Nevers, “Control by Combustion” in Air Pollution Control Engineering,McGraw-Hill, Inc., New York, 1995, p. 300-315.
6. Chemical Section Engineers, Air Permit Technical Guidance for Chemical Sources:Flares and Vapor Oxidizers, New Source Review Permits Division, Texas NaturalResource Conservation Commission, Austin, TX, 1998¸ (available on the internet atwww.tnrcc.state.tx.us/air/nsr_permits/guidedoc.htm).
7. “Combustion Systems”, J.M. Tyler in Air Pollution Control Engineering andTechnology, J.C. Mycock; J.D. McKenna; L. Theodore, Lewis Publishers, NewYork,1995, p.199-221.
8 . G.T. Joseph; D.S. Beachler, “Combustion Equipment Used for Control of GaseousEmissions” in APTI Course 415: Control of Gaseous Emissions; Student Manual,United States Environmental Protection Agency, Office of Air, Noise and Radiation,Office of Air Quality Planning and Standards, Research Triangle Park, NC, 1981,Chapter 3, p.15-31.
9. “Waste Management” in Perry’s Chemical Engineer’s Handbook, 7th Edition, D.W.Green; J.O. Maloney, Eds., McGraw-Hill, 1997, p.25-37 through 25-41.
10. "Flares" in Survey of Control Technologies for Low Concentration Organic VaporGas Streams, R.A. Zerbonia; J.J. Spivey; S.K. Agarwal; A.S. Damle; C.W. Sanford;R.J. Blaszczak, Control Technology Center, U.S. Environmental Protection Agency,Research Triangle Park, NC, 1995, Section 2.4.
11. A.J. Buonicore, “Incineration” in Air Pollution Engineering Manual, A.J. Buonicore;W.T. Davis, Eds.; Van Nostrand Reinhold, New York, 1992, p. 58-70.
12. T.T. Shen, “For VOC Control Seminar – Combustion” in Control of GaseousEmissions – VOC’s Handbook, ETS Professional Training Institute, Roanoke, VA,1995.
13. “Control Device Selection” in Control Technologies for Hazardous Air Pollutants,R.Y. Purcell; G.S. Shareef; USEPA, Research Triangle Park, NC, 1986, p. 25-26.
14. “HAP Control Techniques” in Control Technologies for Hazardous Air Pollutants,R.Y. Purcell; G.S. Shareef; US EPA, Research Triangle Park, NC, 1986, p. 60-63.
15. J. Joseph; D. Beachler; J. Jahnke; M. Leslie; J. Henry, APTI Course 415, Control ofGaseous Emissions, Instructor’s Guide, United States Environmental Protection

112
Agency, Manpower and Technical Information Branch, Office of Air QualityPlanning and Standards, Research Triangle Park, NC, 1981, Lesson 5.
16. R.D. Bell; A.V. Mechtenberg, “Acrylonitrile” in Air Pollution Engineering Manual,A.J. Buonicore; W.T. Davis, Eds.; Van Nostrand Reinhold, New York, 1992, p. 404-409.
17. J.E. Rucker; R.P. Streiter, “The Petroleum Industry” in Air Pollution EngineeringManual, A.J. Buonicore; W.T. Davis, Eds.; Van Nostrand Reinhold, New York,1992, p. 811-834.
18. J.P. Bilotti; J.K. Sutherland, “Incinerators” in Air Pollution Control Equipment:Selection, Design, Operation and Maintenance, L. Theodore; A.J. Buonicore, Eds.,ETS, Inc., Roanoke, VA, 1992, p.133-151.
19. W.M. Vatavuk, “Flares” in Estimating Costs of Air Pollution Control, LewisPublishers, Chelsea, MI, 1990, p.179-186.
20. Guide for Pressure-Relieving and Depressurizing Systems, 2nd Edition, RefiningDepartment, API Recommended Practice 521, 1982.
21. V. Kalcevic, “Control Device Evaluation Flares and the Use of Emissions as Fuels”in Organic Chemical Manufacturing Volume 4: Combustion Control Devices, USEPA, Research Triangle Park, NC, 1980, Report 4.
22 . N. Mukhopadhyay; E.C. Moretti, “Flares” in Current and Potential Future IndustrialPractices for Reducing and Controlling Volatile Organic Compounds, Center forWaste Reduction Techologies, American Institute of Chemical Engineers, NewYork, 1993, p. 21-22.
23 . “General Control Device Requirements”, 60 CFR §60.18, 1993.24. J. Swithenbank, AIChE J., 18, 1972, 553.25. A. Mulet, “Estimate Costs of Pressure Vessels Via Correlations,” Chem. Eng.,
October 5, 1981, p. 145-150.26. Process Plant Construction Estimating Standards, Richardson Engineering Services,
Inc., Volume 4, 1988.27 . P. Tkatschenko, letter to D. Stone, May 2, 1990.28. W.M. Vatavuk; R.B. Neveril, “Estimating Costs of Air-Pollution Control Systems,
Part XV: Estimating Costs of Flares”, Chem. Eng., Feb. 21, 1983, p. 89-90.29. D.K. Stone; S.K. Lynch; R.F. Pandullo; L.B. Evans; W.M. Vatavuk, “Flares” in
OAQPS Control Cost Manual, 4th Edition; United States Environmental ProtectionAgency, Research Triangle Park, NC, 1990, Chapter 7.
30. B.B. Crocker, “Air Pollution Control Methods”, Kirk-Othmer Encyclopedia ofChemical Technology, Volume 1, A to Alkoids, J.I. Kroschwitz; M. Howe-Grant,Eds., John Wiley & Sons, New York, 1991, p. 749-825.
31. C.F. Gottschlich, “Combustion” in Air Pollution, 3rd Edition, Volume IV:Engineering Control of Air Pollution, A.C. Stern, Ed., Academic Press, New York,1977, p. 365-376.
32. “Incinerators” in Kirk-Othmer Encyclopedia of Chemical Technology, Volume 14,Imaging Technology to Lanthanides, J.I. Kroschwitz; M. Howe-Grant, Eds., JohnWiley & Sons, New York, 1995, p. 749-825.

113
Chapter 8
Catalytic Incineration
Technology DescriptionLike thermal incinerators, catalytic incinerators destroy organic pollutants by combustion
to produce a mixture of carbon dioxide and water. Catalytic incinerators utilize a noble metal ormetal oxide solid catalyst material. The catalyst itself does not react, but it enables thecombustion reaction to occur at a lower temperature than normal, generally without the presenceof a flame. This allows for virtually complete combustion of the pollutants with very little NOxformation. Although the mechanism of the catalyzed reaction for most organics is not wellunderstood [1], the presence of the catalyst makes a new reaction pathway possible that has alower activation energy than the uncatalyzed reaction. It is believed that the catalyst promotes thereaction by forming reactive intermediates and bringing them into close proximity on its surface[2, 3]. The catalyst is usually impregnated over a high surface area washcoat like alumina on aporous matrix as shown in Figure 8-1 [4]. As the gas flows through the matrix, the pollutants andoxygen diffuse to the surface of the catalyst, where probably both species (oxygen and thepollutant) adsorb onto the catalyst surface. The type of catalyst and the type of pollutantdetermine how the species adsorb [1]. At higher temperatures, the combustion reaction can alsopropagate into the gas phase, initiating homogeneous chain reactions [5]. Catalytic incineratorsoperate at a lower temperature, usually 620 to 870 K (340 to 590 oC, 650 oF to 1100 oF) [6], thanthermal incinerators, but if properly applied, are capable of destruction efficiencies similar tothose for thermal incinerators if properly applied. The lower operating temperature results in lessNOx formation [4] (generally less than 15 ppm [7]) and significantly smaller fuel consumption(reported to be as low as one third) [8, 9, 10] than most thermal incinerators.
Figure 8-1. Cross Sectional Diagram of Catalyst Composition [4]

114
A typical flow diagram for a catalytic incinerator is shown in Figure 8-2 [11, 12]. The pollutant-laden gas flows through a heat exchanger to preheat the incoming gas with the heat of the exhaustgases. The incinerator may or may not have a supplemental burner to further preheat thepollutant-laden gas stream. As the preheated gases react going through the catalyst bed, thetemperature of the gas stream increases. The reaction generates the same amount of heat as theheat of combustion that is generated in a thermal incinerator [13]. The reacted gas stream thenpasses back through the heat exchanger and is released to the atmosphere.
Figure 8-2. Catalytic Oxidizer Flow Diagram [11, 12]
Care must be taken to properly identify the constituents of a gas stream before either thermal orcatalytic incineration is selected as the control method. Some compounds interfere with theaction of the catalyst, either by chemically binding to the surface or by adsorbing on to thesurface and deactivating sites for future reaction. Compounds that bind chemically to the catalystare referred to as poisons and may be classified as either fast- or slow-acting. Fast-acting poisonsinclude phosphorus, bismuth, arsenic, antimony, chlorine, fluorine, bromine, and mercury. Zinc,lead, and tin are slow-acting poisons [14, 15]. The portion of the surface that is bound to thepoison is not available for reaction, so the overall reaction rate decreases due to a decrease in theamount of available surface area. Other compounds, such as heavy oils, dust, and silica [16]may coat the surface of the catalyst. If the operating temperature is not high enough to promotecombustion of the oily compounds, the surface area will be reduced. Sulfur compounds in the gasstream (including mercaptans which are added to natural gas and propane to make sure that leaksare detectable [17]) may bind to components in the washcoat to form sulfates (e.g., aluminumsulfate) [4], rendering a portion of the surface unusable. At a minimum, sulfur reacts to formsulfur dioxide, which may need to be removed before venting to the atmosphere. Halogenatedcompounds in the contaminated gas stream may also interfere with the catalyst action, either bybinding to the catalyst or reacting to form acids which can severely corrode the catalyst supports,ductwork and downstream equipment. Special attention must be given to the catalyst selection toensure that halogenated compounds do not react to form molecular halogen species like Cl2 [18].Catalysts have been developed recently which are resistant to poisoning by halogen compounds[19, 20]. Particulates, oils, sulfur, and halogens are all compounds which can poison the catalystbut which are reversible inhibitors. Once the compound is removed, the activity of the catalyst isrestored. Generally, superheated steam is adequate to remove the compounds from the catalyst

115
surface [21].
Destruction efficiencies of 98% or greater are now common in catalytic incinerators [4].Destruction efficiencies of 99% are achievable, but the increased temperature or large catalystvolume required may make the technology economically infeasible [22]. The removal efficiencyis determined by the type of catalyst, the surface area of the catalyst, the pollutant species, thepollutant concentration, the residence time, the extent of mixing, the uniformity of gas flowthrough the catalyst, the oxygen concentration, and the temperature [2, 23, 24]. Examples ofpotential uses for catalytic incineration are given in Table 8-1 [2, 15, 24,25, 26, 27, 28, 29, 30,31].
Table 8-1. Potential Applications of Catalytic Incineration for VOC Removal [2, 15, 24,25, 26, 27, 28, 29, 30, 31]
Odor control
Printing operationsPolymer processing
Bakeries
Paint bake ovensFoundry core ovensTire manufacturing
Metal furniture coatingWire enameling
Textile drying
Gasoline marketing
Types of Catalytic Incineration SystemsCatalytic incinerators can be classified in several different ways. They may be classified
according to the type of heat recovery used, the type of catalyst (noble metal or metal oxidecatalyst) used, or the shape of the catalyst substrate. Because most gas streams are dilute, heatrecovery is normally used to help reduce the amount of supplemental fuel required. Catalyticincinerators may use either recuperative or regenerative heat exchangers (see the discussion inChapter 6). Most systems use recuperative heat exchangers (as shown in Figure 8-3 [32]), inwhich the exhaust gases from the incinerator pass through a non-contact heat exchanger torecover the heat of combustion and increase the fuel efficiency of the VOC destruction process.A few regenerative systems have been introduced (see Figure 8-4 [33]) which use beds of inertceramic material as a heat sink [34, 35]. Regenerative incinerators allow for better heat recovery,meaning that dilute vapor streams can be incinerated at lower costs [36]. The type of heatrecovery system must be chosen carefully, both to avoid higher than necessary energy costs andalso to make sure that efficient energy recovery does not result in too high a catalyst temperature.

116
Figure 8-3. Catalytic System with Recuperative Heat Exchange, Glenro, Inc. [32]
Catalytic systems may also be classified according to the form of the catalyst material. Theprimary objective in design of a catalyst is to provide as much surface area as possible to promotethe reaction with minimal pressure drop. Both fixed beds and fluid beds are used to accomplishthis. A typical catalyst consists of a ceramic or metal substrate coated with an alumina washcoatto provide surface area, then a noble metal or metal oxide on the surfaces [35]. Precious metalssuch as platinum, palladium, and rhodium are frequently used; they usually allow for morereactivity which results in a lower operating temperature and shorter residence time [37, 38].Substrates for fixed beds may be in the shape of honeycombs, rods, or metal ribbon [2]. Fixedbeds may also contain catalysts in the form of beads or pellets. Fluid beds generally consist of atray or chamber filled with spherical or pellet-shaped catalysts. While pellet-shaped catalysts aremore susceptible to attrition, this can be a benefit for gas streams that contain more particulate[4]. The attritive action serves to clean off the surfaces of the catalyst beads.
Hybrid systems have also been introduced which combine adsorption with catalytic combustion,to increase the concentration of pollutants for the combustion process. The VOCs from the gasstream are adsorbed onto zeolite, then they are desorbed with a smaller gas stream. This resultsin lower energy usage, since less air must be heated to the combustion temperature. While thesystem is more complex, it does provide an alternative which uses less auxiliary fuel [39].Chapter 6 contains a diagram of one such system [40].

117
Figure 8-4. Anguil Regenerative Catalytic Oxidizer [33]
Catalytic Incinerator System DesignIt is generally not feasible to empirically predict the action of a given catalyst and organic
compound with the accuracy required for designing process equipment [13, 41]. Therefore, it ishighly encouraged that a catalytic system vendor be contacted to determine an appropriate typeand volume of catalyst for the specific VOC mixture in the gas stream. It may also be helpful touse a test unit, particularly if poisons or deactivators may be present in the gas stream [4].
The amount of gas to be treated should be minimized to reduce the capital and operating costs ofthe incinerator. Usually, the gas streams treated with catalytic incineration are so dilute that noadditional combustion air is required. If the concentration of VOC is significant, care must beexercised to ensure that the catalyst does not overheat and that the concentration of pollutant inthe gas does not exceed a safe level in the ducting, especially during process upsets or start upconditions. See Chapter 7 and the U.S. Bureau of Mines information [42, 43] for additionalinformation about acceptable ductwork concentrations and LELs. The heating value ofhydrocarbons at the LEL has been determined to be approximately 2030 kJ/Nm3 (50 Btu/scf).For catalytic units, the heat of combustion should normally be less than approximately 400kJ/Nm3 (10 Btu/scf) so that the catalyst temperature does not become excessive. However,regenerative heat recovery would reduce this number further. Similarly, if the oxygen content ofthe gas stream is lower than approximately 20%, auxiliary air may be required for the combustionprocess [41].
The inlet temperature to the catalytic bed must be higher than the catalytic ignition temperature toensure that the reaction occurs [41]. Incomplete combustion can lead to emissions of compoundswith more severe health effects than the original hydrocarbon gas stream [1, 44]. Many catalyticincinerators use a preheat burner to raise the temperature of the gas stream higher than that
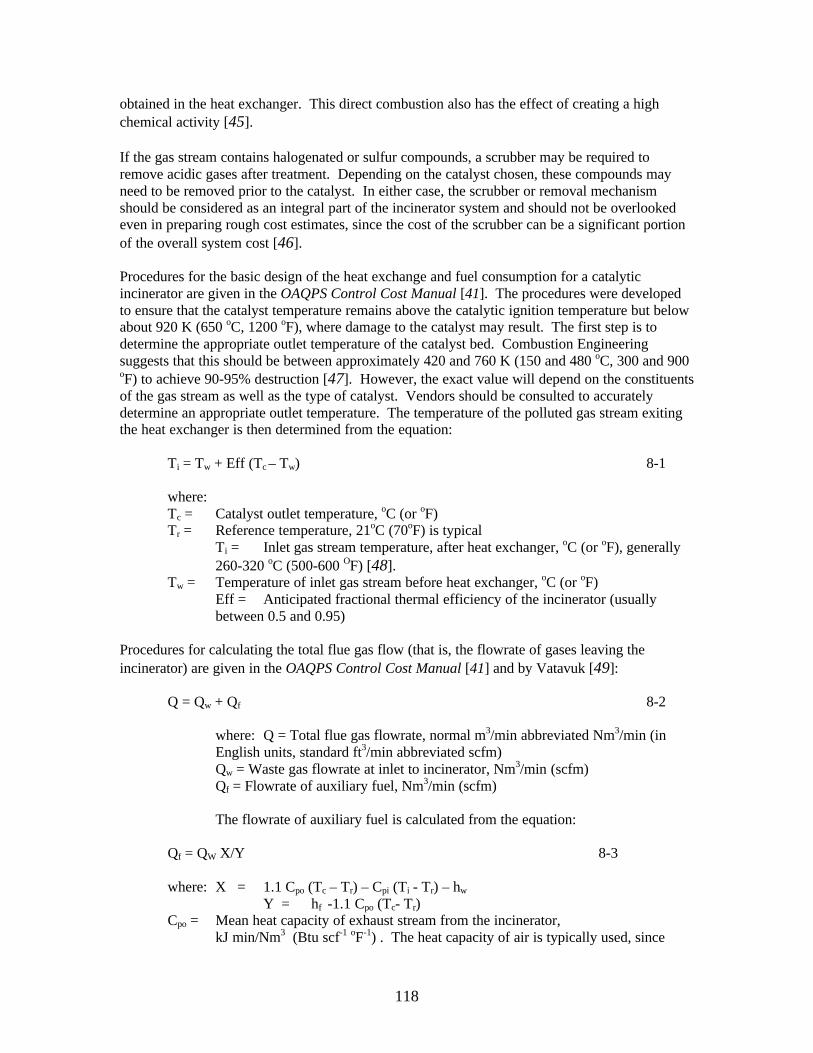
118
obtained in the heat exchanger. This direct combustion also has the effect of creating a highchemical activity [45].
If the gas stream contains halogenated or sulfur compounds, a scrubber may be required toremove acidic gases after treatment. Depending on the catalyst chosen, these compounds mayneed to be removed prior to the catalyst. In either case, the scrubber or removal mechanismshould be considered as an integral part of the incinerator system and should not be overlookedeven in preparing rough cost estimates, since the cost of the scrubber can be a significant portionof the overall system cost [46].
Procedures for the basic design of the heat exchange and fuel consumption for a catalyticincinerator are given in the OAQPS Control Cost Manual [41]. The procedures were developedto ensure that the catalyst temperature remains above the catalytic ignition temperature but belowabout 920 K (650 oC, 1200 oF), where damage to the catalyst may result. The first step is todetermine the appropriate outlet temperature of the catalyst bed. Combustion Engineeringsuggests that this should be between approximately 420 and 760 K (150 and 480 oC, 300 and 900oF) to achieve 90-95% destruction [47]. However, the exact value will depend on the constituentsof the gas stream as well as the type of catalyst. Vendors should be consulted to accuratelydetermine an appropriate outlet temperature. The temperature of the polluted gas stream exitingthe heat exchanger is then determined from the equation:
Ti = Tw + Eff (Tc – Tw) 8-1
where:Tc = Catalyst outlet temperature, oC (or oF)Tr = Reference temperature, 21oC (70oF) is typical
Ti = Inlet gas stream temperature, after heat exchanger, oC (or oF), generally260-320 oC (500-600 OF) [48].
Tw = Temperature of inlet gas stream before heat exchanger, oC (or oF)Eff = Anticipated fractional thermal efficiency of the incinerator (usuallybetween 0.5 and 0.95)
Procedures for calculating the total flue gas flow (that is, the flowrate of gases leaving theincinerator) are given in the OAQPS Control Cost Manual [41] and by Vatavuk [49]:
Q = Qw + Qf 8-2
where: Q = Total flue gas flowrate, normal m3/min abbreviated Nm3/min (inEnglish units, standard ft3/min abbreviated scfm)Qw = Waste gas flowrate at inlet to incinerator, Nm3/min (scfm)Qf = Flowrate of auxiliary fuel, Nm3/min (scfm)
The flowrate of auxiliary fuel is calculated from the equation:
Qf = QW X/Y 8-3
where: X = 1.1 Cpo (Tc – Tr) – Cpi (Ti - Tr) – hw
Y = hf -1.1 Cpo (Tc- Tr)Cpo = Mean heat capacity of exhaust stream from the incinerator,
kJ min/Nm3 (Btu scf-1 oF-1) . The heat capacity of air is typically used, since

119
most of the gas stream is air. At approximately 670K (400oC, 750 oF), the heatcapacity of air is 1.38 kJ/Nm3 oC (0.0181 Btu/scf oF).
Cpi = Mean heat capacity of inlet streams to the incinerator, kJ min/Nm3 (Btu scf-1
oF-1). Again, the heat capacity of air is typically used, since most of the incomingstream is air. At 311K (38 oC, 100 oF), the heat capacity of air is 1.30 kJ/Nm3 oC(0.017 Btu/scf oF).
hw = Heat content of waste gas stream, kJ/Nm3 (Btu/scf)hf = Heat content of fuel, kJ/Nm3 (Btu/scf). For natural gas, hf is approximately
40,200 kJ/Nm3 (1000 Btu/scf).hf may be calculated in SI units from the following equation if the heat content is known in kJ/kg:
hf = heat content in kJ/kg x fuel molecular weight in kg/kg-mole /22.4 Nm3 per kg-mole
In English units, hf can be calculated from the known heat content in Btu/lb:
hf = heat content in Btu/lb x fuel molecular weight in lb/lb-mole /386.5 ft3 per lb-mole
This must result in a positive value for the fuel consumption, or the amount of heat that is beingrecovered is too great to maintain the outlet temperature at the desired value. In addition, if thereis a preheater combustion chamber, the amount of auxiliary fuel should be at least 5% of the totalenergy to make sure that the burner flame is stable. If the required fuel consumption is less than5% of the energy, a lower heat transfer efficiency should be used and the calculations should berepeated.
If a preheat burner is used, the temperature at the outlet of the preheat burner and the inlet to thecatalyst is calculated from the equation:
)QQ(C1.1
)T1.0T(CQ]TC1.1)h[(QT
wwffpa
ripawwrpifffci ρ+ρ
+ρ++∆−ρ= 8-4
where: Tci = catalyst inlet temperature (after the preheater combustion chamber), oC (oF)ρf = density of fuel, 0.6533 kg/m3 (0.0408 lb/ft3) for methane at 298K (25 oC, 77 oF) and1 atmρw = density of polluted gas stream which can usually be adequately representedby the density of air, 1.183 kg/m3 (0.0739 lb/scf) for air at 298K (25 oC, 77 oF) and 1 atm
The value of Tci that is calculated should be checked against values of catalytic ignitiontemperatures to ensure that the preheat temperature is high enough to initiate the reaction. Thecatalytic ignition temperature should be available from the vendor.
The amount of catalyst required will depend on the type of catalyst, the required removalefficiency, the VOCs to be destroyed and the anticipated reaction temperature. If the requiredresidence time and the percentage of void space in the reactor is known, the volume can beestimated. As an approximation, 0.043 - 0.057 m3 (1.5 – 2.0 ft3) of catalyst will be required forevery thousand cubic feet of combusted gas to achieve 90-95% destruction [21]. Velocity of thegas is usually approximately 3 to 6 m/s (10-20 ft/s) through the incinerator [2].
These equations assume a 10% loss of energy from the incinerator. Note that no allowance isincluded for volume changes due to changes in the total number of moles in the system whichmay occur during reaction. Additional correction may be needed for gas streams that contain

120
large concentrations of organic compounds, particularly if the organic compounds containsignificant amounts of oxygen.
Instrumentation to consider for monitoring the overall performance and temperature history of thecatalytic combustor is given in Table 8-2.
Table 8-2. Recommended InstrumentationInlet and outlet temperature
Inlet / outlet concentrationFan speed
Pressure dropAuxiliary fuel rate
Economic EstimatesThere is typically a trade-off between the higher capital cost associated with a catalyticincinerator and the higher operating cost associated with a thermal incinerator [41]. Estimates ofthe capital cost of a fixed bed catalytic incineration system are given by the OAQPS Manual [41]according to the following equations.
In SI units, the equation is:
CC = a (Q/0.026)b 8-5
In English units, the equation is:
CC = a Qb 8-6
where: CC = Purchased Price, in 1988 dollarsQ = Flowrate of gases after combustion, Nm3/min (scfm)
a and b are parameters dependent on the amount of heat recovery required. For 0% heatrecovery, a = 1,105 and b= 0.5471. For 50% heat recovery, a = 1,215 and b= 0.5575. At 70%heat recovery, a = 1,443 and b=0.5527.
These estimates are valid for incinerators with flowrates of approximately 50 and 1300 Nm3/min(2,000 and 50,000 scfm).
Estimates of the capital cost of a fluid bed catalytic incineration system are calculated from thefollowing equations.
In SI units:
CC = c+dQ/0.026 8-7
In English units:
CC = c+dQ 8-8

121
where: CC = Purchased Price, in 1988 dollarsQ = Flowrate of gases after combustion, Nm3/min (or standard ft3/min, scfm)
c and d are parameters dependent on the amount of heat recovery required. For 0% heatrecovery, c = 84,800 and d= 13.2. For 50% heat recovery, c = 86,600 and d = 15.8. At 70% heatrecovery, c = 83,900 and d = 19.2 [41].
These estimates are valid for incinerators with flowrates of approximately 50 to 650 Nm3/min(2,000 to 25,000 scfm).
In addition to the catalyst and preheat burner, the price includes a heat exchanger, fan, motor,instrumentation and controls, insulation, structural supports, and a short stack. Ductwork,particulate removal devices, scrubbers, and site-specific construction requirements are notincluded. If the incinerator is to be placed a long distance from the generation site, both the costof ductwork and the cost of additional booster fans should be considered. As with the otherchapters in this book, the cost estimates are to indicate a general order of magnitude and must bescaled up to current dollars to get even an estimated cost. They are not specific enough to use asconstruction costs and should be confirmed with actual prices from vendors.
To estimate the total installed capital expenditure, the factors in Table 8-3 may be used, whichgenerally follows the methodology of EPA’s OAQPS Cost Control Manual [41, 50].
Annual costs may be approximated using the guidelines in the OAQPS Cost Control Manual [41],as given in Table 8-4. Site specific values for unit costs should be used wherever possible toaccurately reflect the anticipated costs. Electricity requirements can be estimated from theOAQPS formula given in Chapter 4, assuming a pressure drop of 1.5 kPa (6 in of water column)for a monolith catalyst, 1.5 to 2.5 kPa (6 to10 inches of water column) for a fluid bed catalyticchamber. Very high efficiency designs require additional catalyst volume and are likely toincrease the pressure drop through the catalyst chamber. The heat exchanger adds another 1 to3.7 kPa (4-15 inches of water column), corresponding to heat recoveries of 35 to 70 percent [41].Operating and maintenance labor requirements are usually minimal, at approximately one halfhour per shift. However, dirty gas streams that require frequent catalyst cleaning will increase theamount of maintenance required.

122
Table 8-3. Factors for Estimating the Total Installed Capital Cost of Incineration Systems [41,50]
Cost Element Estimated CostDirect Costs Purchased Equipment Cost Incinerator and Auxiliary Equipment CC, Estimated from equation Taxes 0.03 CC Freight 0.05 CC Total Purchased Equipment Cost, PEC 1.08 CC
Installation Costs Foundations and Supports 0.08 PEC Erection and Handling 0.14 PEC Electrical 0.04 PEC Piping, Insulation, and Painting 0.04 PEC Total Installation Cost 0.30 PEC
Site Preparation As required for specific site, SP Buildings As required for specific site, BLDG
Total Direct Costs 1.30 PEC + SP + BLDG
Indirect Costs Engineering and Supervision 0.10 PEC Construction, Field Expenses, and Fees 0.15 PEC Start-up and Performance Test 0.03 PEC Contingency 0.03 PEC Total Indirect Costs 0.31 PEC
TOTAL INSTALLED CAPITAL COSTS, TCC 1.61 PEC + SP + BLDG

123
Table 8-4. Annual Operating Costs for Incinerator Systems [41]Direct Annual Costs Unit Cost Estimated Requirement Utilities: Electricity $0.059/ kWh See Chapter 4 Natural Gas $127/1000 Nm3
$3.30/1000 scfCalculated above
Catalyst Replacement $23,000/m3
$650/ft3 (metal oxide)100% replacement every2 years
Operating Labor $12.95/h ½ hour per shift Maintenance Labor $14.25/h ½ hour per shift Maintenance Materials Equal to maintenance labor Supervisory Labor 15% of Operating Labor
Indirect Annual Costs Overhead 60% of Maintenance Costs Property Tax 1% of TCC Insurance 1% of TCC Administrative Costs 2% of TCC Capital Recovery (see Chapter 4 for
formula to calculate capital recoveryfactor, CRF)
CRF * [TCC-1.08*Catalyst Cost]
Total Annual Operating Costs Direct + Indirect Operating Costs
Potential ProblemsAs with thermal incinerators, catalytic incinerators are best suited to operations that
maintain a fairly constant flow rate and emission rate. With catalytic incinerators, however, largefluctuations in concentration or flow may result in overheating of the catalyst, leading topremature catalyst aging. Temperatures above approximately 920 K (650 oC, 1200 oF) mayvolatilize the metal catalyst or cause recrystallization of the support or catalyst metal [2]. Inaddition, high temperature fluctuations increase the stress on seams as the material expands orcontracts. For that reason, catalytic incinerators are more appropriate for facilities that operatecontinuously instead of those that operate for only a few hours each day. The manufacturer’sstart-up procedure normally specifies a warm-up sequence in which the incinerator is brought tooperating temperature gradually. Following this procedure lengthens the life of the refractory,but also uses additional fuel and may take longer than is feasible for the process. It is not unusualfor maintenance or operating staff to develop a shorter start-up procedure. Using such a shortcutlowers the overall gas usage but is likely to result in considerably higher maintenancerequirements. For cyclical processes, a regenerative incinerator should be considered which canbe maintained at operating temperature with minimal natural gas consumption. Some of theseunits can even be put on an “idle” mode, in which no gas is pulled from the process, but theincinerator recycles exhaust air to the inlet to conserve energy [51].
Installation, Operation, and Maintenance ConsiderationsParticulate concentrations in a gas stream treated by catalytic incineration should be kept
below 0.12 grams/Nm3 (0.05 grains/scf). The concentration of catalytic poisons should notexceed 25 ppm [52].
The main problem with catalytic incinerators is that the catalyst must be kept in relatively good

124
condition to ensure that the reaction proceeds as anticipated. As particulate or other materialsbuild up on the surface, the amount of surface area available for reaction is decreased and theefficiency is reduced. It is generally recommended that the surface of the catalyst be cleaned byblowing jets of air across it, steaming with superheated steam, vacuuming, or cleaning with anon-phosphorus detergent every three to twelve months [13]. For gas streams which containdeactivating compounds, an acid or alkaline wash may be required to restore the catalyst to anormal activity level [4, 53]. As the catalyst ages, pores become permanently blocked fromparticulate or inorganic compounds, the metal surfaces tend to erode, vaporize, or be lost byattrition [15, 41, 54, 55], eventually leading to the need to replace the catalyst. This agingprocess may take many years to occur in a relatively clean constant gas stream, or it may occurwithin a period of months or even hours if the catalyst temperature limits are exceeded. It isrecommended that the temperature change across the catalyst bed be constantly monitored andrecorded, since that allows for an assessment of the catalyst activity. A low temperature riseacross the catalyst indicates that the catalyst may have become deactivated [19]. Recording theoutlet temperature also provides a method for confirming whether the catalyst has been subjectedto a period of elevated temperature that may have damaged it. If the catalyst is properly cared forand its activity decreases gradually, the life of the catalyst may be extended somewhat byincreasing the preheat temperature so that the average reaction temperature is increased a smallamount [2]. This may be particularly helpful in providing for continued VOC reduction while anew catalyst is ordered and delivered.
Catalytic incinerators can be designed to handle a small amount of organic particulate. However,operating such an incinerator below the design temperature can result in carbon or organicsbuilding up on the surface of the catalyst due to incomplete combustion [2].
Several other process considerations that can help avoid poisoning the catalyst are given byJennings, Krohn, and Berry [24]. The use of galvanized metal in ovens or ductwork should beavoided because the zinc used for galvanizing is a catalyst poison. Temperature indicatingdevices should not include mercury components that could also contaminate the catalyst.Cleaning detergents should not include phosphorus. Lubricants should not contain silicones orother inorganic metal compounds.
The heat exchange surfaces should also be kept clean and free of cracks [56]. In addition todifficulties with the catalytic material in an incinerator, heat stress can take a toll on the heatrecovery equipment. At best, heat stress or buildup of material may keep valves from seatingproperly, a common problem with thermal regenerative units that allows leakage from thecontaminated gas stream into the outlet gas stream, decreasing efficiency. At worst, heat stresscan crack metal joints in heat exchangers, so that gas is allowed to escape from the clean side tothe dirty side or vice versa, depending on the position of the fan. Such cracks can be difficult tolocate, since the metal contracts as it cools to room temperature. The incinerator system shouldbe designed considering the potential leakage of material. By the position of the fan, it can beensured that any leakage occurs in an acceptable direction.
Any particulate, oily substances, or catalytic inhibitors should be removed prior to theincineration system. An overall summary of the advantages and disadvantages of catalyticoxidation systems is given in Table 8-5.
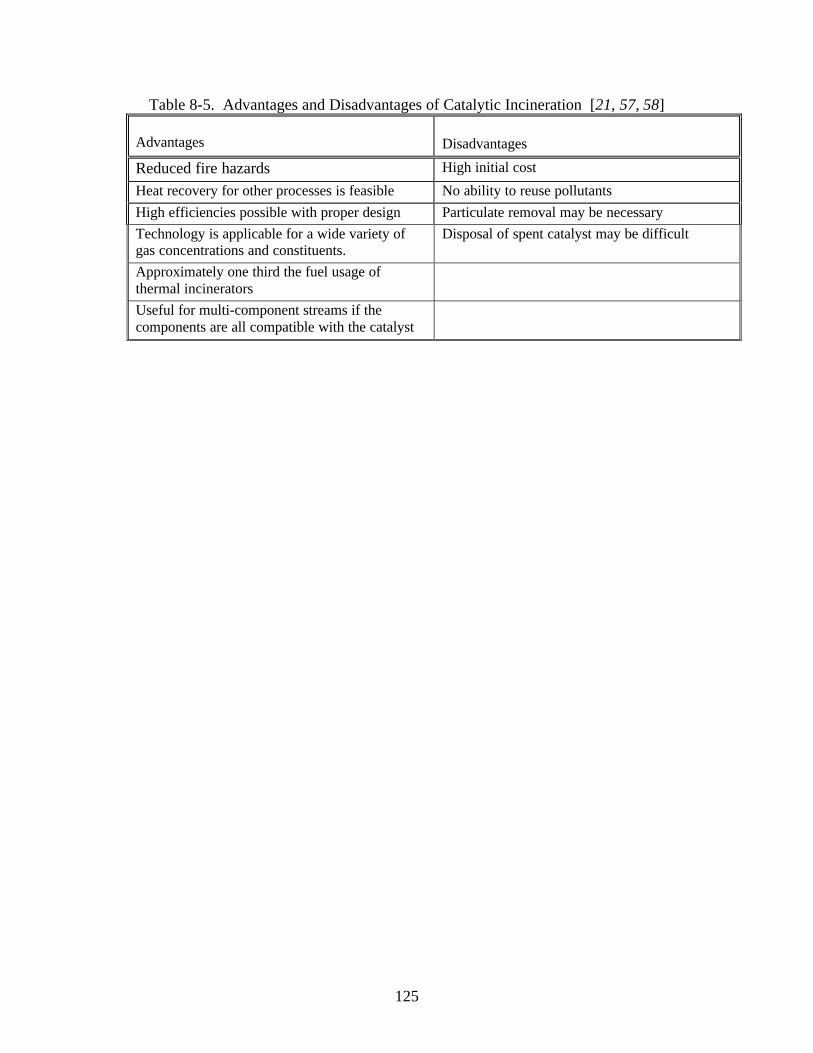
125
Table 8-5. Advantages and Disadvantages of Catalytic Incineration [21, 57, 58]
Advantages Disadvantages
Reduced fire hazards High initial cost
Heat recovery for other processes is feasible No ability to reuse pollutants
High efficiencies possible with proper design Particulate removal may be necessary
Technology is applicable for a wide variety ofgas concentrations and constituents.
Disposal of spent catalyst may be difficult
Approximately one third the fuel usage ofthermal incinerators
Useful for multi-component streams if thecomponents are all compatible with the catalyst

126
References 1. J.J. Spivey, “Complete Catalytic Oxidation of Volatile Organics”, Ind. Eng. Chem.
Res., 1987, 26, p. 2165-2180.2. “Equipment Characteristics – Catalytic Combustion” in Air Pollution: The
Emissions, The Regulations, and The Controls, J.P. Tomany, American ElsevierPublishing Company, Inc., New York, 1975, p. 250-272.
3. M.S. Jennings; N.E. Krohn; R.S. Berry, Control of Industrial VOC Emissions byCatalytic Incineration: Volume 1. Assessment of Catalytic Incineration andCompeting Controls, US Environmental Protection Agency Office of Research andDevelopment, 1984.
4. W. Chu; H. Windawi, “Control VOCs via Catalytic Oxidation”, Chem. Eng. Prog.,1996, March, p. 37-43.
5. L.D. Pfefferle; W.C. Pfefferle, “Catalysis in Combustion”, Cata.Rev.—Sci. Eng., 29(1987), 2-3, p. 219-267.
6. “Catalytic Afterburners” in Air Pollution Engineering Manual, 2nd Edition, J.A.Danielson, Ed., United States Environmental Protection Agency, 1973, p. 179-181.
7. J.A. Jahnke; D. Beachler, “Stack Gas Afterburners” in APTI Course 415: Control ofGaseous Emissions, Instructor’s Guide, Report EPA 450/2-81-004, J. Joseph; D.Beachler; J. Jahnke, US Environmental Protection Agency, Air Pollution TrainingInstitute, Research Triangle Park, NC, 1981, Lesson 5.
8. I.E. Sungkono; H. Kameyama; T. Koya, “Development of Catalytic CombustionTechnology of VOC Materials by Anodic Oxidation Catalyst”, App. Surf. Sci.,121/122, 1997, p. 425-428.
9. L. Theodore; A.J. Buonicore; J.D. McKenna; I.J. Kugelman; J.S. Jeris; J.J. Santoleri;T.F. McGowan, “Waste Management” in Perry’s Chemical Engineers’ Handbook,7th Edition, D.W. Green; J.O. Maloney, Eds., McGraw-Hill, New York, 1997,Chapter 25, p. 25-1 to 25-111.
10. “Incineration” in Air Pollution Control Equipment, Volume II: Gases, L. Theodore;A.J. Buonicore, CRC Press, Inc., Boca Raton, FL, 1988, p.115-136.
11. J.J. Spivey, “Catalytic Incineration of Gaseous Wastes” in Thermal Process, H.M.Freeman, Ed., Technomic Publishing, Cincinnati, OH, 1990, p. 95-108.
12. “Incineration” in Survey of Control Technologies for Low Concentration OrganicVapor Gas Streams, Report EPA-456/R-95-003, R.A. Zerbonia; J.J. Spivey; S.K.Agarwal; A.S. Damle; C.W. Sanford, Control Technology Center, US EnvironmentalProtection Agency, Research Triangle Park, NC, 1995, Section 2.
13. J.P. Bilotti; T.K. Sutherland, “Incinerators” in Air Pollution Control Equipment:Selection, Design, Operation, and Maintenance, L. Theodore, A.J. Buonicore, Eds.,ETS, Inc., Roanoke, VA, 1992, p. 133-151.
14. G.T. Joseph; D.S. Beachler, “Stack Gas Afterburners” in APTI Course 415: Controlof Gaseous Emissions, Student Workbook, US Environmental Protection Agency, AirPollution Training Institute, Research Triangle Park, NC, 1981, p. 4-4 through 4-5.
15. T.H. Snape, “Catalytic Incineration” in Air Pollution Control and Design Handbook(in Two Parts), P.N. Cheremisinoff; R.A. Young, Eds., Marcel Dekker, Inc., NewYork, 1977, p. 543-563.

127
16. C. Libanati; D.A. Ullenius; C.J. Pereira, “Silica Deactivation of Bead VOC
Catalysts”, App. Catal. B: Environ.15 (1998), p. 21-28.17. “Control by Combustion” in Air Pollution Control Engineering, N. De Nevers,
McGraw-Hill, New York, 1995, p. 300-315.18. J.R. Kittrell; C.W. Quinlan; J.W. Eldridge, “Direct Catalytic Oxidation of
Halogenated Hydrocarbons”, J. Air Waste Manage. Assoc., 41 (1991), 8, p. 1129-1133.
19. N. Mukhopadhyay; E.C. Moretti, “Catalytic Oxidation (Catalytic Incineration)” inCurrent and Potential Future Industrial Practices of Reducing and ControllingVolatile Organic Compounds, Center for Waste Reduction Technologies, AmericanInstitute of Chemical Engineers, New York, 1993, p. 49.
20. A.T. Bell; L.E. Manzer; N.Y. Chen; V.W. Weekman; L.L. Hegedus; C.J. Pereira,“Protecting the Environment Through Catalysis”, Chem. Eng. Prog., February, 1995,p. 26-34.
21. A.J. Buonicore, “Incineration” in Air Pollution Engineering Manual, A.J. Buonicore;W.T. Davis, Eds., Van Nostrand Reinhold, New York, 1992, p.58-62.
22. RY. Purcell; G.S. Shareef, “Catalytic Incineration” in Control Technologies forHazardous Air Pollutants, Air and Energy Engineering Research Laboratory, Officeof Research and Development, U.S. Environmental Protection Agency, ResearchTriangle Park, NC, 1986, p.53-59.
23. H.F. Dey, “Afterburners” in Air Pollution Engineering Manual, J.A. Danielson, Ed.,U.S. Department of Health, Education, and Welfare, National Center for AirPollution Control, Cincinnati, Ohio, 1967, p. 171-192.
24. “Applications of Catalytic Incinerators” in Catalytic Incineration for Control ofVolatile Organic Compound Emissions, M.S. Jennings; N.E. Krohn; R.S. Berry,Noyes Publications, Park Ridge, NJ, 1985, p.35-53.
25. A.E.R. Budd, Environ. Pollut. Manage., 1978, (January/ February), 13-14.26. Catalytic Oxidation of Discharge from Polymer Process Vessel Vents; Research
Disclosure 14052 from Industrial Opportunities, Ltd., and The Firestone Tire andRubber Co., Hampshire, UK and Akron, OH, 1975 as given in “Complete CatalyticOxidation of Volatile Organics”, J.J. Spivey, Ind. Eng. Chem. Res., 26, (1987), 2165-2180.
27. “Complete Catalytic Oxidation of Volatile Organics”, J.J. Spivey, Ind. Eng. Chem.Res., 26, (1987), 2165-2180.
28. J.C. Bonacci; R.M. Heck, “The Platinum Group Metals: An In-Depth View of theIndustry”, International Precious Metals Institute Seminar, Williamsburg, VA, April,1983.
29. A. Balough; J. Herendi; J. Bathory, “Catalytic Purification of Gaseous FactoryEffluents to Protect the Environment”, Report AD-A017807, National TechnicalInformation Service, Springfield, VA, 1975.
30. R.E. Roberts; J.B. Roberts, J. Air Pollut. Control Assoc., 26 (1976), 4, p. 353-358.31. J.P. Draves, “Destroying VOCs and Looking to the Future”, Environ. Prot., July,
1996, p. 36-38.32. “Fume Oxidizers for Destruction of VOCs, Odors, and Smoke”, Glenro Inc. sales
literature, Glenro Inc., Paterson, NJ, 1998 [http://www.glenro.thomasregister.com].

128
33. “Anguil Regenerative Catalytic Oxidizer”, sales literature from Anguil
Environmental Systems, Inc., Milwaukee, WI, 1998. Information available on theweb at http://www.anguil.com.
34. “Catalytic Oxidation Process Cleans Volatile Organics From Exhaust”, C&EN, June27, 1994, p. 42.
35. R.M. Heck; R.J. Farrauto; M. Durilla, “Employing Metal Catalysts for VOCEmission Control”, Poll. Eng., 1998, April, p. 52-55.
36. Chemical Section Engineers, New Source Review Division of Texas NaturalResource Conservation Commission, Air Permit Technical Guidance for ChemicalSources: Flares and Vapor Oxidizers, Texas Natural Resources ConservationCommission, 1998, available on the internet at http://www.tnrcc.state.tx.us/air/nsr_permits/guidedoc.html.
37. J.H. Krohling, “Catalytic Oxidation: An Energy Saving Approach to Fume and OdorControl, presented at the Air Pollution Control Association Specialty Conference onState of the Art of Odor Control Technology II, Pittsburgh, PA, March 1977.
38. M.F.M. Zwinkels; S.G. J¬rås; P.G. Menon; T.A. Griffin, “Catalytic Materials forHigh-Temperature Combustion”, Catal.Rev.- Sci.Eng., 35 (1993), 3, p. 319-358.
39. Personal communication with Chris Anguil, Anguil Environmental, Inc.40. “Anguil Rotor Concentrator/Oxidizer” Sales Literature (Leaflet RCS-3/97-5M),
Anguil Environmental Systems, Inc., Milwaukee, WI, 1997, information available athttp://www.anguil.com.
41. D.R. van der Vaart; J.J. Spivey; W.M. Vatavuk; A.H. Wehe, “Thermal and CatalyticIncinerators” in OAQPS Control Cost Manual, 5th Edition, United StatesEnvironmental Protection Agency, Office of Air Quality Planning and Standards,Research Triangle Park, NC, 1995, Chapter 3 (available on the web athttp://www.epa.gov/ttn/catc/products.html).
42. U.S. Bureau of Mines, “Limits of Flammability of Gases and Vapors”, U.S. Bureauof Mines, [Washington, DC], Bulletin Number 503, [no date given].
43. R.D. Ross, “Thermal Incineration” in Air Pollution Control and Design Handbook(in Two Parts), P.N. Cheremisinoff; R.A. Young, Eds., Marcel Dekker, Inc., NewYork, 1977, p. 449-468.
44. R.B. Diemer, Jr.; T.D. Ellis; G.D. Silcox; J.S. Lighty; D.W. Pershing, “Incineratorsfor Vapors and Gases” in Kirk-Othmer Encyclopedia of Chemical Technology, 4th
Edition, Volume 14, Imaging Technology to Lanthanides, J.I. Kroschwitz; M.Howe-Grant, Eds., John Wiley & Sons, New York, 1995, p.118-120.
45. T.Banaszak; R. Miller; A. Zieba, “Thermal-Catalytic Incineration of Waste Gases”in Combustion Technologies for a Clean Environment: Selected Papers from theProceedings of the First International Conference, Vilamoura, Portugal, September3-6, 1991, M.da Graca Carvalho; F.C. Lockwood; W.A. Fiveland; C. Papadopoulos,Eds., Gordon and Breach Publishers, Switzerland, 1995, p. 633-642.
46. Personal communication from Andrew Jones to Donald R. van der Vaart, March 28,1988, as given by D.R. van der Vaart; J.J. Spivey; W.M. Vatavuk; A.H. Wehe,“Thermal and Catalytic Incinerators” in OAQPS Control Cost Manual, 5th Edition,United States Environmental Protection Agency, Office of Air Quality Planning andStandards, Research Triangle Park, NC, 1995, Chapter 3 (available on the web athttp://www.epa.gov/ttn/catc/products.html).

129
47. Personal Communication from Bill Sheffer to Donald R. van der Vaart, March 30,
1988 as given by D.R. van der Vaart; J.J. Spivey; W.M. Vatavuk; A.H. Wehe,“Thermal and Catalytic Incinerators” in OAQPS Control Cost Manual, 5th Edition,United States Environmental Protection Agency, Office of Air Quality Planning andStandards, Research Triangle Park, NC, 1995, Chapter 3 (available on the web athttp://www.epa.gov/ttn/catc/products.html).
48. V.S. Katari; W.M. Vatavuk; A.H. Wehe, “Incineration Techniques for Control ofVolatile Organic Compound Emissions, Part II: Capital and Annual OperatingCosts”, J. of the Air Poll. Cont. Assoc., 37 (1987), 2, p. 198-201.
49. “Incinerators” in Estimating Costs of Air Pollution Control, W.M. Vatavuk, LewisPublishers, 1990, p.141-156
50. W.M. Vatavuk; R. Neveril, “Estimating Costs of Air Pollution Control Systems, PartII: Factors for Estimating Capital and Operating Costs”, Chem. Eng., November 3,1980, p. 157-162.
51. Personal communication with T. Rowe, Tellkamp Industries, Sante Fe Springs, CA.52. Personal communication between G.I. Madden and N.E. Krohn, January 7, 1982, as
described in “Applications of Catalytic Incinerators” in Catalytic Incineration forControl of Volatile Organic Compound Emissions, M.S. Jennings; N.E. Krohn; R.S.Berry, Noyes Publications, Park Ridge, NJ, 1985, p.35-53.
53. N. Mukhopadhyay; E.C. Moretti, “Catalytic Oxidation (Catalytic Incineration)” inCurrent and Potential Future Industrial Practices of Reducing and ControllingVolatile Organic Compounds, Center for Waste Reduction Technologies, AmericanInstitute of Chemical Engineers, New York, 1993, p. 16-17.
54. RY. Purcell; G.S. Shareef, “Catalytic Incinerators” in Control Technologies forHazardous Air Pollutants, Air and Energy Engineering Research Laboratory, Officeof Research and Development, U.S. Environmental Protection Agency, ResearchTriangle Park, NC, 1986, p.25.
55. G.T. Joseph, D.S. Beachler, “Catalytic Oxidation” in APTI Course 415: Control ofGaseous Emissions, Student Manual, US Environmental Protection Agency, AirPollution Training Institute, Research Triangle Park, NC, 1981, p. 3-27 to 3-30.
56. T.T. Shen; C.E. Schmidt; T.R. Card, “Thermal Oxidation” in Assessment andControl of VOC Emissions from Waste Treatment and Disposal Facilities, VanNostrand Reinhold, New York, 1993, p.164-166.
57. L. Theodore; A.J. Buonicore, “Thermal and Catalytic Combustion Reactors andFlares” in Industrial Control Equipment for Gaseous Pollutants, Volume II, CRCPress, Inc., Cleveland, OH, 1975, p. 75-87.
58. L. Theodore; A.J. Buonicore; J.D. McKenna; I.J. Kugelman; J.S. Jeris; J.J. Santoleri;T.F. McGowan, “Waste Management” in Perry’s Chemical Engineers’ Handbook,7th Edition, D.W. Green; J.O. Maloney, Eds., McGraw-Hill, New York, 1997,Chapter 25, p. 25-1 to 25-111.

130
Chapter 9
Biodegradation
Technology DescriptionBiodegradation is the process of using microorganisms to convert pollutants into simple
compounds. In air pollution control devices, the pollutants are first absorbed into a water filmthat contains microbes. Then the microbes metabolize the contaminant to obtain energy andnutrients. When VOCs are treated by biodegradation, the principal products of this metabolicprocess are carbon dioxide, water, and microbe cell mass. This process is the same one that hasbeen used for decades in wastewater treatment plants and landfills to treat organic material [1].
In the most common type of biodegradation system used for air pollution control, gas is passedthrough a moist solid media, where pollutants are absorbed into the liquid layer on the surface ofthe solids. The biological activity results from the high concentration of microorganisms in thislayer, or biofilm. These biofilters are common air pollution control devices in Europe, with over500 in place [2]; they are used to remove odorous compounds and VOCs from waste gases [3, 4].These systems are particularly effective for pollutants which are easy to degrade such as toluene,xylene, alcohols, butanol, formaldehyde, trimethylamine, acetaldehyde, and butyric acid [3].Biofilters can also be combined with carbon adsorption or condensation to treat higherconcentrations of gases. Biofilters are also capable of degrading volatile inorganic compounds(VICs) [5].
A typical biofiltration system for air pollution consists of a humidification chamber and a reactor.In addition to these components, particulate collectors may be required upstream of the biofilterto remove solid matter from the gas stream that would otherwise plug the bed and hinder gasdistribution, in addition to increasing the pressure drop through the bed. While the humidificationsystem is controlled manually for many simpler units, automatic controls are sometimes used onmore sophisticated biofiltration systems designed for low maintenance. The reactor itselfcontains solid media, usually compost, soil, or peat, which provides a surface on which themicroorganisms can reside. Organic substrates also provide nutrients to sustain the organisms.Inorganic media may be used which is more expensive [6], but is also more resistant tocompaction and maintains the porosity of the bed for longer bed life. The solids areapproximately 1 meter (3 feet) deep. Gas enters the biofilter from either the top or the bottom ofthe bed. Incoming gas travels through a piping manifold system or molded concrete blocksdesigned to uniformly distribute the gas across the surface to obtain uniform residence time of thegas stream, as well as to keep from drying out portions of the bed with higher gas velocities.Moisture levels throughout the media must be maintained at a level adequate to prevent dryingand cracking of the bed, but low enough to avoid liquid channeling and the development of areasin the bed where oxygen is not present. Any anaerobic zones which develop can result insignificant odors being emitted from the bed. The optimum moisture content is generallyconsidered to be approximately 35 % to 60% in compost biofilters for removing H2S [7] andVOCs [8, 9, 10, 11]. For biofilters with inorganic substrate materials, the optimum moisture isapproximately 40-50% [10].
Biofiltration is capable of efficiencies ranging from 80 to 99%, depending on the characteristics

131
of the pollutants [12]. The efficiency of removing VOCs from a gas stream by biodegradationdepends on several factors: the degree of contact between the gas stream and the media, themoisture level, the pollutant concentration, the residence time, and specific physicalcharacteristics of the pollutant. The physical characteristics of importance are the Henry’ Lawconstant, the solubility in water, the molecular weight, and the presence of complex bondingstructures which prevent microbial attack [1, 10, 13]. Additional information aboutbiodegradation for air pollution control is given by Skladany, Deshusses, Devinny, Togna, andWebster [14] , Bowker [15], and Heinsohn and Kabel [16]. Some typical applications forbiodegradation systems are given in Table 9-1 [3, 4, 17, 18, 19].
Types of Biodegradation SystemsThere are two types of biodegradation systems. In bio-scrubbers, the microbes are
contained in a wash liquid which is contacted with the contaminated air as in an absorber [19].This chapter will focus on biofilters (a typical diagram is in Figure 9-1 [20]), systems in whichthe microbes are contained on a solid material like compost, soil, granular activated carbon(GAC), diatomaceous earth, or inert synthetic packing material [1, 11, 21]. The microbes live ina water film around the solid particles. Gases are adsorbed into the water film and digested.Trickle bed air biofilters (TBAB) [22] or biotrickling filters [23] are a specific type of biofilter, inwhich a liquid stream of water (with or without additional nutrients) is constantly applied to thesolid media. Recycling the liquid effluent from the bed results in microbe reseeding, bettercontrol of pH, and ultimately superior performance according to several articles [11, 24, 25, 26,27, 28, 29]. In particular, the concentration of styrene or benzene that can be degraded with a90% removal efficiency in a biotrickling filter has been shown to be more than twice as high asthat which can be removed in a conventional biofilter [23, 30].
While the general configuration of biofiltration systems is similar, each system has specificdesign considerations. They vary according to the flue gas pretreatment equipment that isrequired, the number of beds, the solid media that is used, and the gas distribution system.Biofilters may be closed to the atmosphere with the exception of a vent stack, or they may haveopen tops, so that the gas flows up through the bed and directly into the atmosphere (see Figure 9-2 [31]) .
Biofilter System DesignBecause of the significant effect that the microbe activity can have on the efficiency of
the operation, it is generally required that design parameters be developed from previousexperience or from pilot testing [3, 6]. This testing can help determine the optimum solid mediafor the filter, an estimate of the required moisture addition rate, the appropriate microbes, and theappropriate residence time.

132
Table 9-1. Typical Applications of Biodegradation [3, 4, 17, 18, 19]Pharmaceutical ProcessesSolid Stabilization Processes for Landfills
Rendering Plants
Chemical Manufacturing ProcessesPrint ShopsFlavors and FragrancesCoffee and Cocoa RoastingSewage Treatment Odor Removal
Coating Processes
Composting
Food Processing
Livestock Farms
Foundries
ContaminatedAir
InfluentChemicalAnalysis
Water
Humidifier
Blower
WaterCirculation
Pump
HoldingTank
NutrientPump
NutrientTank
MonitoringPorts
Exhaust
EffluentChemicalAnalysis
PackingMaterial
Figure 9-1. Typical Flow Diagram of a Biofilter [adapted from 20]

133
Figure 9-2. Open Type Biofilter [31]
Before the overall size of the biofilter is determined, it is helpful to identify an appropriate solidbed material, since the material of choice will affect the overall operating costs of the filter, aswell as the required size. As mentioned earlier, the filter media may be organic or inert syntheticmaterial [11]. Typical organic materials are compost, peat, leaves, soil, bark, wood chips,activated carbon, or clay [1, 32, 33, 34, 35]. Inert materials that are used include perlite,pelletized ceramics, ceramic monoliths, diatomaceous earth, and synthetic packing material [6,21, 36]. While organic materials provide many nutrients needed by the microbes [6], they arealso degraded at a faster rate than the VOCs themselves [37], resulting in additional compactionof the bed and a corresponding increase in pressure drop through the media [1]. After severalyears, maintenance is required to remove the material or mix it to reduce the pressure drop andimprove overall performance. Cleaning of the air distribution system may also be needed toremove bed material which has collected there. The overall performance of the filter bed can beenhanced by adding inert solids like polystyrene beads to reduce compaction, extend bed life,and increase porosity [11, 38]. Or the entire bed can be constructed of inert media like pelletizedceramics, activated carbon or ceramic monoliths [6]. While inert media results in more uniformgas distribution [11] and less maintenance, it is also typically more expensive [6]. Additives suchas lime are sometimes used to provide buffering capacity for the bed, particularly if the bed isused to treat chloride or sulfide compounds which can result in acidic decomposition products[39, 40]. Activated carbon can also be added to improve retention of the pollutants and maintaina consistent feed source for the microorganisms in cases where the process does not emit aconstant level of pollutants [39, 41, 42].
The media should provide for even air distribution and pressure drop through the bed, highspecific surface area, high porosity, adequate inorganic nutrients, efficient drainage, goodmechanical strength to resist attrition, minimal pressure drop, and a surface that accomodatesattachment of the microbes [11, 43, 44, 45].

134
Nutrients must be present for the microbes to grow. With organic media, the microbes get manyof the inorganic nutrients required from the media itself. However, micronutrients are sometimesrequired and are available in forms which can be dissolved in water and spread onto the surfaceof the bed. The necessary nutrients include nitrogen, phosphorus, iron, calcium, and magnesiumin addition to the carbon, hydrogen, and oxygen [39] that are available in the gas stream. Theaccepted ratio of carbon to nitrogen and phosphorus is approximately 100:10:1 [46]. If theessential nutrients and micronutrients are not present, samples of the bed material will haveevidence of microbes which have encapsulated themselves [46].
Microorganisms typically found in biofilters are similar to those found in water treatmentoperations. They include both bacteria and fungi species. Bacterial species may includeactinomyces globisporus, micrococcus albus, micrmonospora vulgarus, proteus vulgarus,bacillus cereus, and streptomyces species. Typical fungi are species of the genuses penicillium,cephalosporium, mucor, circinella, cephalotecium, ovularia, and stemphilium [39].
Based on the work of Ottengraf [39, 47, 48], the reaction rate is generally assumed to follow theMonod (or Michaelis-Menten) relationship:
R = Rmax Cl / (Cl+ Km) 9-1
where:R = Biodegradation rate, units of mass per length cubed per time (M L-3 T-1)Rmax = Maximum biodegradation rate (M L-3 T-1)Cl = Concentration in the liquid biofilm (M L-3)Km = Monod (or Michaelis – Menten) constant (M L-3)
Rmax can be further described by the relationship:
Rmax = X µm/yi 9-2
where :X = active microorganism cell concentration (M L-3)µm= maximum rate of growth (T-1)yi = coefficient of cell yield
The reaction in biofilters is generally considered to be first-order at low VOC concentrations inwhich the biofilm is not completely saturated. Therefore, the rate of VOC destruction iscontrolled by the mass transfer rate of pollutant into the biofilm. [6, 39]. As the concentration inthe gas stream increases, the concentration of pollutant in the liquid (C1) is much larger than theMonod constant. At this point, the system is no longer limited by mass transfer, since the biofilmis saturated and the microorganisms have immediate access to the compounds. The point atwhich this transition from first order to zero order is pollutant specific and is determinedempirically.
This biological model assumes that there is no interaction between multiple pollutants in the gasphase. In addition, it is based on the simplifying assumptions that the gas flow through thebiofilter is plug flow and that equilibrium concentrations exist at the boundaries of the liquid andgas which can be described by Henry’s law. Furthermore, the biofilm is considered to beadequately represented as flat, since the biofilm thickness is small compared to the particle size.
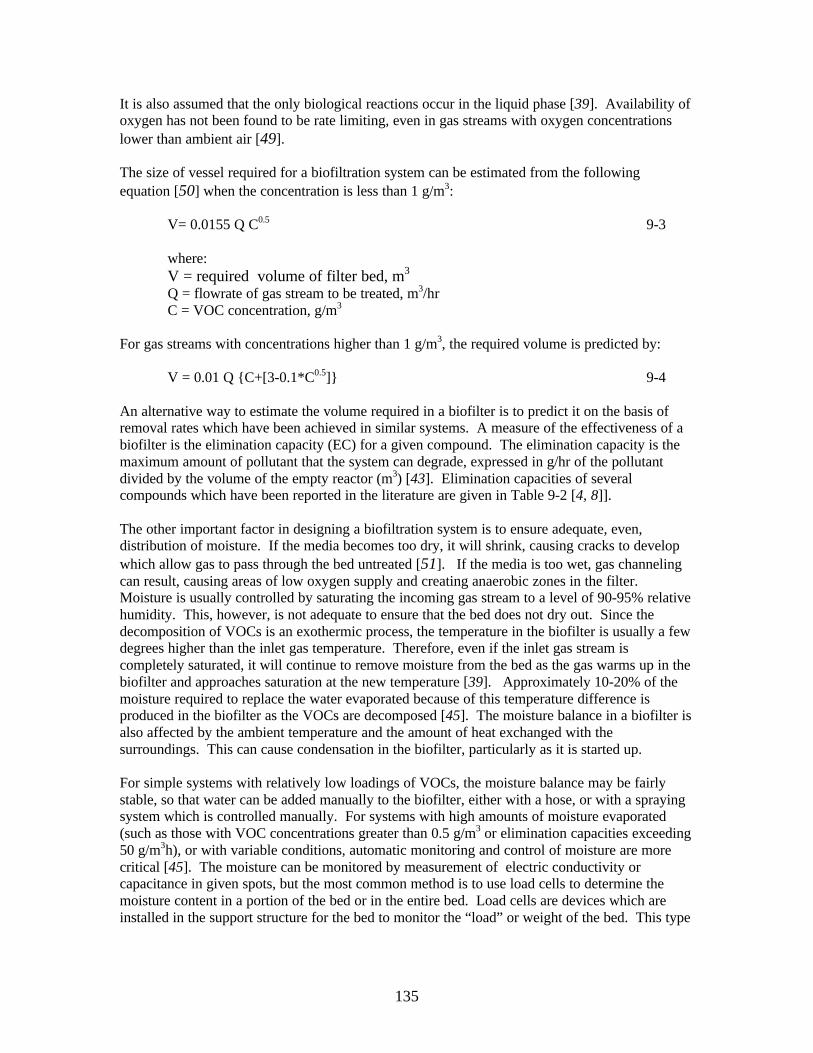
135
It is also assumed that the only biological reactions occur in the liquid phase [39]. Availability ofoxygen has not been found to be rate limiting, even in gas streams with oxygen concentrationslower than ambient air [49].
The size of vessel required for a biofiltration system can be estimated from the followingequation [50] when the concentration is less than 1 g/m3:
V= 0.0155 Q C0.5 9-3
where:V = required volume of filter bed, m3
Q = flowrate of gas stream to be treated, m3/hrC = VOC concentration, g/m3
For gas streams with concentrations higher than 1 g/m3, the required volume is predicted by:
V = 0.01 Q {C+[3-0.1*C0.5]} 9-4
An alternative way to estimate the volume required in a biofilter is to predict it on the basis ofremoval rates which have been achieved in similar systems. A measure of the effectiveness of abiofilter is the elimination capacity (EC) for a given compound. The elimination capacity is themaximum amount of pollutant that the system can degrade, expressed in g/hr of the pollutantdivided by the volume of the empty reactor (m3) [43]. Elimination capacities of severalcompounds which have been reported in the literature are given in Table 9-2 [4, 8]].
The other important factor in designing a biofiltration system is to ensure adequate, even,distribution of moisture. If the media becomes too dry, it will shrink, causing cracks to developwhich allow gas to pass through the bed untreated [51]. If the media is too wet, gas channelingcan result, causing areas of low oxygen supply and creating anaerobic zones in the filter.Moisture is usually controlled by saturating the incoming gas stream to a level of 90-95% relativehumidity. This, however, is not adequate to ensure that the bed does not dry out. Since thedecomposition of VOCs is an exothermic process, the temperature in the biofilter is usually a fewdegrees higher than the inlet gas temperature. Therefore, even if the inlet gas stream iscompletely saturated, it will continue to remove moisture from the bed as the gas warms up in thebiofilter and approaches saturation at the new temperature [39]. Approximately 10-20% of themoisture required to replace the water evaporated because of this temperature difference isproduced in the biofilter as the VOCs are decomposed [45]. The moisture balance in a biofilter isalso affected by the ambient temperature and the amount of heat exchanged with thesurroundings. This can cause condensation in the biofilter, particularly as it is started up.
For simple systems with relatively low loadings of VOCs, the moisture balance may be fairlystable, so that water can be added manually to the biofilter, either with a hose, or with a sprayingsystem which is controlled manually. For systems with high amounts of moisture evaporated(such as those with VOC concentrations greater than 0.5 g/m3 or elimination capacities exceeding50 g/m3h), or with variable conditions, automatic monitoring and control of moisture are morecritical [45]. The moisture can be monitored by measurement of electric conductivity orcapacitance in given spots, but the most common method is to use load cells to determine themoisture content in a portion of the bed or in the entire bed. Load cells are devices which areinstalled in the support structure for the bed to monitor the “load” or weight of the bed. This type

136
Table 9-2. Maximum Elimination Capacities of Various Compounds [4, 8]Compound Media EC (g/m3/h) EC (lb/ft3/h) ReferenceMethyl Formiate Unspecified 934.4 0.0583 [52]Butyl Acetate Peat 64.3 0.00401 [47]Butanol Peat 64.3 0.00401 [47]N-Butanol Compost 64.1 0.00400 [53]BTEX (benzene,toluene, ethyl benzene,xylene)
Compost 20-30 0.0012-0.0019 [54]
BTX Pelletized BiologicallyActive Media
55 0.0034 [55]
BTX Peat Moss andChicken Manure
5.8-63.6 0.00036-0.00397
[56]
Ethyl Acetate Peat 54.2 0.00338 [47]Ethyl Benzene Perlite 85.2 0.00531 [36]Ethanol Peat 120 0.00749 [43], (inlet
loading of 135g/m3/hr)
Ethanol Unspecified 175 0.0109 [23]Toluene Peat 42.2 0.00263 [47]Toluene Peat 70 0.0044 [43], (inlet
loading of 100g/m3/hr)
Toluene Perlite 72.9 0.00455 [36]Toluene Compost and inerts 21 0.0013 [48]Simulated JP-4 Fuel(85% kerosene, 15%gasoline)
Lawn compost,Composted sewagesludge, perlite,gypsum, activatedsludge
At loadings of 25-1000 ppmm3/m2min and residence times of1 to 3 minutes, >99% removal
[57]
TEX (toluene, ethylbenzene, o-Xylene)
Perlite 70 0.0044 [36]
o-Xylene Perlite 63.6 0.00397 [36]Methanol Unspecified 36.0 0.00225 [52]Methanethiol (MethylMercaptans)
Peat 24 0.0015 [58]
Styrene Unspecified 70 0.0044 [23]Dimethyl Disulfide Peat 18 0.0011 [58]Dimethyl Sulfide Peat 10 0.00063 [58]Ammonia Peat 4.3 0.00027 [59]H2S Compost 130 0.00811 [7]
of system cannot be used with open-type biofilters, since any additional weight such asgrowth of vegetation or snow on the surface of the biofilter will affect the reading. Theload cells may need to be recalibrated occasionally to compensate for media losses [45].With VOC elimination capacities greater than 100 g/m3h, it may be difficult to maintain aproper moisture level in large systems, even with automated measurement and controls.

137
Using biofilters with gas flowing down through the media can assist in maintainingproper moisture levels, since water can be easily applied to the surface of the filter media.The majority of the media drying occurs at the entrance of the gas stream to the bed, so adownflow biofilter allows water to be directed more easily to the locations where it isneeded. An exception to this is beds for treating feeds with chlorides or sulfides whichcan contain acidic decomposition products. Upflow filters may be preferable for suchbeds, because the more concentrated acidic byproducts are at the bottom of the bed andcan be flushed out more completely [45]. Gas flow through biofilters is usually between1 and 5 cubic feet per hour per square foot of media surface [4].
Other important factors in designing the system include adequate oxygen content of the gasstream [4] (although this is not usually a limiting factor in the system performance [49]), removalof decomposition products which inhibit biodegradation, supply of nutrients to the reactor, andadequate buffering capacity.
Studies [22, 60] have shown that supplying nitrogen to the reactor in the form of nitrates insteadof ammonia reduces the amount of nitrifying bacteria which are believed to inhibit theeffectiveness of the biofilter. Proper biofiltration operation requires the addition of vitaminsolutions which contain macronutrients, micronutrients, and buffers [11, 36]. Buffering agentsmay be used to adjust the pH of the media or the liquid nutrient mixture.
In reactors used to treat gas streams with acidic decomposition products, providing adequatebuffering capacity in the biofilter is important, since the biofilter performance may declinesignificantly once the buffering capacity is exhausted and the media must be replaced.Instrumentation that should be considered for biofiltration systems is given in Table 9-3 [45].
Economic EstimatesEstimates of the total installed capital cost of a biofiltration system are given in Figure 9-3, interms of dollars (1997) per cubic meter of media . At each filter volume, there is a range ofcosts. The low end of the range represents open biofilter systems, which frequently requirelonger residence times (and therefore larger vessels) to achieve a given level of control due to lessefficient gas distribution, less precise moisture control, and non-optimized filter media. Theupper end of the range represents the cost associated with installing an enclosed, controlled,multi-level biofilter system [45].
Table 9-3. Recommended Instrumentation [45]
Gas stream temperature and pressure (inlet and outlet)Inlet gas stream relative humidity
Fan speedMoisture content of the inlet gas stream
Moisture content of the media (may be manual sample)pH of liquid effluent

138
3,000
2,500
2,000
1,500
1,000
500
0
0 500 1,000 1,500 2,000 2,500 3,000
Filter Volume (cubic meters)
TotalInstalled
EquipmentCost per Volume
$/cubic meter
Figure 9-3. Installed Capital Cost Range for Biofilter Systems Greater than 100 m3 [45]
Alternatively, an estimate of the capital cost of the purchased equipment alone can be found fromthe following equations [50], then the cost scaled using standard factors to arrive at an estimate ofthe total installed capital cost. For a system which requires less than 200 m3 of media:
CC = 51315 V0.49 9-5
where: CC = Capital Cost in 1993 dollars
For a system which requires more than 200 m3 of media, the appropriate equation is:
CC = 231254 + 2285 V 9-6
To estimate the total installed capital expenditure, the factors in Table 9-2 may be used [50],which generally follow the methodology of EPA’s OAQPS Cost Control Manual [61] and HAP-PRO software[62] used for other technologies. The OAQPS Cost Control Manual and HAP-PROsoftware do not currently contain information for biofilters.
Annual costs may be approximated using the same methodology as given in the OAQPS CostControl Manual [61] for other systems, as given in Table 9-3. Electricity requirements can beestimated from the formulas given in Chapter 4, assuming a pressure drop of 50 to 3,000 Pa (0.2-12 inches of water), depending on the media chosen, the velocity through the media, the mediadepth, and the number of beds. Water requirements can be estimated from the general guidelineof 5-10 gallons of water required for every 100,000 standard cubic feet of gases treated [4].Operating and maintenance labor requirements are also highly variable, ranging from a fewminutes a day for a well controlled system treating relatively low concentrations of pollutants to afew hours a day for an open, uncontrolled system with high pollutant loadings and high moisturelosses [45].
Potential ProblemsAs the solid media in a biofilter degrades, the bed compacts and pressure drop through
the filter increases. The pressure drop through the bed should be monitored carefully so that

139
required replacement of media can be anticipated and the required outage time can be scheduledwith the production facility. Monitoring the pressure drop through the bed also enables earlydetection of cracks in the bed which allow gas to pass through untreated [4].
Optimum temperature for microbial activity is approximately 30-40 oC [4, 7, 45]. At lower orhigher temperatures, the removal of VOCs in the biofilter may be significantly reduced (byapproximately 50% for each 10 oC drop in temperature [63]). However, due to the exothermicnature of the metabolic reactions, it is possible to maintain adequate VOC removal even inambient temperatures which are significantly below the optimum [7, 64]. The most prevalentconcerns with biofilter operation are maintaining adequate moisture, removing solids which buildup in the media, “fluffing” or replacing of the solid media, and maintaining appropriatetemperatures.
Table 9-4. Factors for Estimating the Total Installed Capital Cost of BiofiltrationSystems[50]
Cost Element Estimated CostDirect Costs Purchased Equipment Cost Biofilter and Auxiliary Equipment CC, Estimated from equation Taxes 0.03 CC: Freight 0.05 CC: Total Purchased Equipment Cost, PEC 1.08 CC:
Installation Costs Foundations and Supports 0.08 PEC Erection and Handling 0.14 PEC Electrical 0.04 PEC Piping, Insulation, and Painting 0.04 PEC Total Installation Cost 0.30 PEC
Site Preparation As required for specific site, SP Buildings As required for specific site, BLDG
Total Direct Costs 1.30 PEC + SP + BLDG
Indirect Costs Engineering and Supervision 0.10 PEC Construction, Field Expenses, and Fees 0.15 PEC Start-up and Performance Test 0.03 PEC Contingency 0.03 PEC Total Indirect Costs 0.31 PEC
TOTAL INSTALLED CAPITAL COSTS, TCC 1.61 PEC + SP + BLDG
Optimum temperature for microbial activity is approximately 30-40 oC [4, 7, 45]. At lower orhigher temperatures, the removal of VOCs in the biofilter may be significantly reduced (byapproximately 50% for each 10 oC drop in temperature [65]). However, due to the exothermic
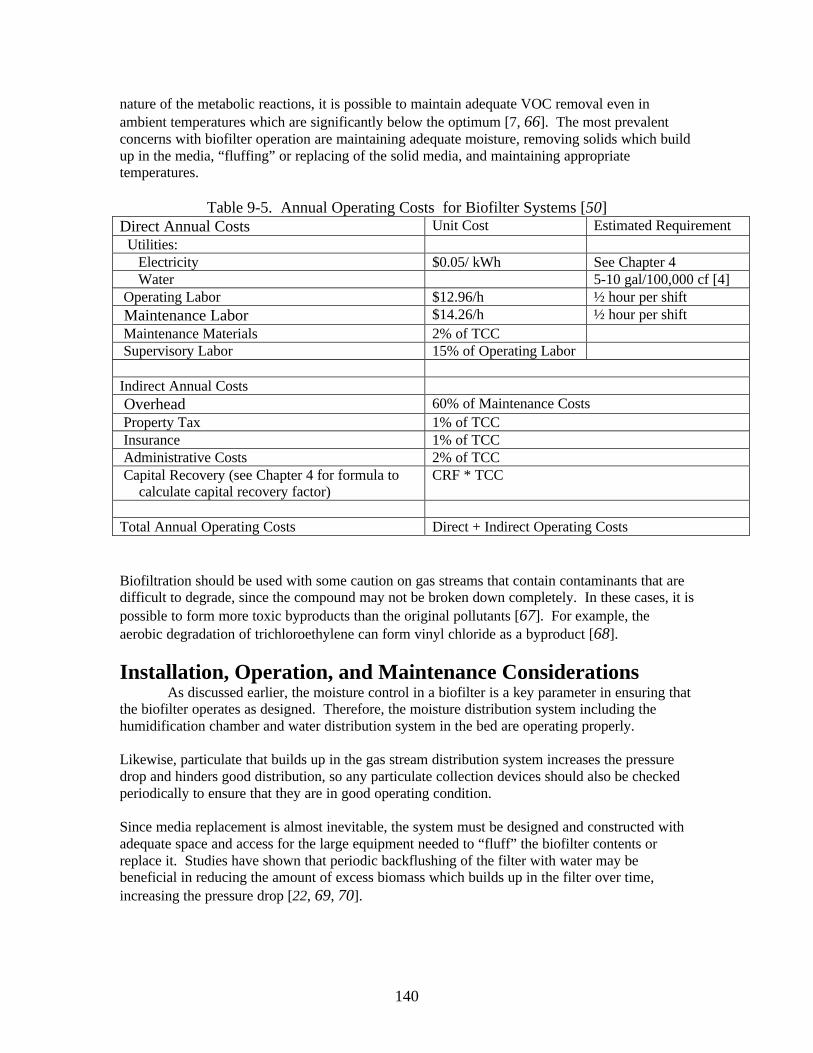
140
nature of the metabolic reactions, it is possible to maintain adequate VOC removal even inambient temperatures which are significantly below the optimum [7, 66]. The most prevalentconcerns with biofilter operation are maintaining adequate moisture, removing solids which buildup in the media, “fluffing” or replacing of the solid media, and maintaining appropriatetemperatures.
Table 9-5. Annual Operating Costs for Biofilter Systems [50]Direct Annual Costs Unit Cost Estimated Requirement Utilities: Electricity $0.05/ kWh See Chapter 4 Water 5-10 gal/100,000 cf [4] Operating Labor $12.96/h ½ hour per shift Maintenance Labor $14.26/h ½ hour per shift Maintenance Materials 2% of TCC Supervisory Labor 15% of Operating Labor
Indirect Annual Costs Overhead 60% of Maintenance Costs Property Tax 1% of TCC Insurance 1% of TCC Administrative Costs 2% of TCC Capital Recovery (see Chapter 4 for formula to
calculate capital recovery factor)CRF * TCC
Total Annual Operating Costs Direct + Indirect Operating Costs
Biofiltration should be used with some caution on gas streams that contain contaminants that aredifficult to degrade, since the compound may not be broken down completely. In these cases, it ispossible to form more toxic byproducts than the original pollutants [67]. For example, theaerobic degradation of trichloroethylene can form vinyl chloride as a byproduct [68].
Installation, Operation, and Maintenance ConsiderationsAs discussed earlier, the moisture control in a biofilter is a key parameter in ensuring that
the biofilter operates as designed. Therefore, the moisture distribution system including thehumidification chamber and water distribution system in the bed are operating properly.
Likewise, particulate that builds up in the gas stream distribution system increases the pressuredrop and hinders good distribution, so any particulate collection devices should also be checkedperiodically to ensure that they are in good operating condition.
Since media replacement is almost inevitable, the system must be designed and constructed withadequate space and access for the large equipment needed to “fluff” the biofilter contents orreplace it. Studies have shown that periodic backflushing of the filter with water may bebeneficial in reducing the amount of excess biomass which builds up in the filter over time,increasing the pressure drop [22, 69, 70].
141
Table 9-6. Advantages and Disadvantages of Biofiltration [51, 45]
Advantages Disadvantages
Relatively simple equipment and operation Effectiveness is pollutant-specific
Usually no additional pollutants formed otherthan carbon dioxide, water, biomass, and mineralsalts
Potential corrosion of ductwork due to moisturein gas stream
Process is at ambient temperatures and istherefore inherently safer
Sensitivity to temperature, concentration, andmoisture
Typically lower capital and operating costs
than other technologies
Proper moisture control of streams with highloadings of organic compounds may be difficult
Low energy requirements

142
References 1. G. Leson; A.M. Winer, “Biofiltration: An Innovative Air Pollution Control
Technology For VOC Emissions”, J. Air Waste Manag. Assoc., 41, 8, p.1045-1054.2. H. Bohn, “Consider Biofiltration for Decontaminating Gases”, Chem. Eng. Prog.,
(April 1992), p.34-40.3. K. Fouhy, “Cleaning Waste Gas, Naturally”, Chem. Eng., (Dec. 1992), p. 43-46.4. T.O. Williams; F.C. Miller, “Biofilters and Facility Operations”, Biocycle
(Nov.1992), p.75- 79.5. H. Bohn, “Consider Biofiltration for Decontaminating Gases”, Chem. Eng. Prog.,
(April 1992), p.34-40.6 . F.G. Edwards; N. Nirmalakhandan, “Biological Treatment of Airstreams
Contaminated with VOCs: An Overview”, Water Sci. Technol., 34, 3-4, p. 565-571.7 . Y. Yang; E.R. Allen, “Biofiltration Control of Hydrogen Sulfide: 1. Design and
Operational Parameters”, Air and Waste, 44, p. 863-868.8 . R.L. Corsi; L. Seed, “Biofiltration of BTEX: Media, Substrate, and Loadings
Effects”, Envir. Prog., 14, 3, p. 151-158.9. J.C. Mueller, “Biofiltration of Gases – A Mature Technology for Control of a Wide
Range of Air Pollutants”, project number 2-51-797, 1988, Report to the NationalResearch Council of Canada and the British Columbia Ministry of AdvancedEducation and Job Training.
10 . T.S. Webster; J.S. Devinny; E.M. Torres; S.S. Basrai, “Biofiltration of Odors,Toxics, and Volatile Organic Compounds from Publicly Owned Treatment Works”,Envir. Prog., 15, 3, p. 141-147.
11 . G.A. Sorial; F.L. Smith; M.T. Suidan; P. Biswas; R.C. Brenner, “Evaluation ofTrickle Bed Biofilter Media for Toluene Removal”, J. Air Waste Manag. Assoc., 45,October, p. 801-810.
12. H. Bohn, “Consider Biofiltration for Decontaminating Gases”, Chem. Eng. Prog.,(April 1992), p.34-40.
13 . V.F. Medina; T. Webster; M. Ramaratnam; and J. Devinny, “Treatment of GasolineResiduals by Granular Activated Carbon Based Biological Filtration”, J. Environ.,Sci., Health, A30 (2), (February, 1995), p. 407-422.
14. G.J. Skladany; M.A. Deshusses; J.S. Devinny; A.P. Togna; T.S. Webster,“Biological Systems: Biofilters” in Odor and VOC Control Handbook, H.J. Rafson,Ed., McGraw-Hill, New York, 1998, p. 8.150-8.191.
15. R.P.G. Bowker, “Biological Systems: Aeration Basins” in Odor and VOC ControlHandbook, H.J. Rafson, Ed., McGraw-Hill, New York, 1998, p. 8.192-8.202.
16 . “Bioscrubbers, Biofilters, and Trickle-Bed Reactors” in Sources and Control of AirPollution, R.J. Heinsohn; R.L. Kabel, Prentice Hall, Upper Saddle River, NJ, 1999,p. 488-499.
17. Kessler + Luch, “Biofiltration Makes the Organics Go Down; Biofilters RemoveLow Level Organics from Coater Exhausts”, Chem. Eng. (April 1994), p.153.
18. R. Kapahi; M. Gross, “Biofiltration for VOC and Ammonia Emissions Control”,Biocycle, (Feb, 1995), p. 87-90.

143
19. B.J. Glowiak; K. Grefen; H. Jüntgen; K. Kirchner; E. Pilarczyk; F. Sporenberg; E.
Weber, Ambient Air Pollutants for Industrial Sources, M.J. Suess; K. Grefen; D.W.Reinish, Eds., Elsevier, New York, 1985, p. 708-713.
20 . J.B. Quarles, Personal communication, 1997.21 . D.S. Hodge; J.S. Devinny, “Biofilter Treatment of Ethanol Vapors,” Envir. Prog.,
13, 3, p.167- 173.22 . F.L. Smith; G.A. Sorial; M. T. Suidan; A.W. Breen; and P. Biswas, “Development of
Two Biomass Control Strategies for Extended, Stable Operation of Highly EfficientBiofilters with High Toluene Loadings”, Environ. Sci. Tech., 30, 5, p.1744-1751.
23 . A.P. Togna; M. Singh, “Biological Vapor-Phase Treatment Using Biofilter andBiotrickling Filter Reactors: Practical Operating Regimes,” Envir. Prog., 13, 2, p.94-97.
24 . K. Kirchner; U. Schlachter; H.J. Rehm, “Biological Purification of Exhaust AirUsing Fixed Bacterial Monocultures,” Appl. Microbi. Biotechnol., 1989, 31, 629.
25. R.M.M. Diks; S.P.P. Ottengrapf, “Verification Studies of a Simplified Model for theRemoval of Dichloromethane from Waste Gases Using a Biological Trickling Filter(Parts I and II), Bioproc. Eng., 1991, 6, 131.
26 . S. Hartmans; J. Tramper, “Dichloromethane Removal from Waste Gases with aTrickle Bed Bioreactor,” Bioproc. Eng., 1991, 6, 83.
27 . G.A. Sorial; F.L. Smith; P.J. Smith; M.T. Suidan; P. Biswas; R.C. Brenner,“Development of Aerobic Biofilter Design Criteria for Treating VOCs,” PaperNumber 93-TP-52A.04, Air and Waste Management Association’s 86th AnnualMeeting, Denver, Colorado, June 13-18, 1993.
28. G.A. Sorial; F.L. Smith; P.J. Smith; M.T. Suidan; P. Biswas; R.C. Brenner,“Evaluation of Biofilter Media for Treatment of Air Streams Containing VOCs,”Proceedings of Water Environment Federation’s 66th Annual Conference, Volume10, Facility Operations, p. 429-439.
29 . H.F. Ockeloen; T.J. Overcamp; C.P.L. Grady, Jr., “A Biological Fixed-FilmSimulation Model for the Removal of Volatile Organic Air Pollutants,” Proceedingsof the 85th Annual Meeting of the Air and Waste Management Association, KansasCity, Missouri, June 21-26, 1992.
30 . A.P. Togna; B.R. Folsom, “Removal of Styrene from Air Using Bench-ScaleBiofilter and Biotrickling Filter Reactors”, Proceedings of the 85th Annual Air andWaste Management Association Meeting, Kansas City, Missouri, June 21-26, 1992.
31. Open biofilter at the Advanced Organics facility, Philadelphia, Pennsylvania.32 . M. Rothenbühler; et al., “Biofiltration of Volatile Organic Emissions in Reference to
Flexographic Printing Processes”, Water, Air, Soil Pollut., 83, p. 37-50.33 . M.G. Parvatiyar; R. Govind; D.F. Bishop, “Biodegradation of Toluene in a
Membrane Biofilter”, J. Memb. Sci., 119, p.17-24.34 . G. Wu, et al.; “Biofiltration of Volatile Organic Emissions”, Proceedings of the First
North America Conference and Exhibition, “Emerging Clean Air Technologies andBusiness Opportunities,” Poster session, Toronto, Canada, September 26-30, 1994.
35 . G. Martin; P. Laffort, Odeurs et Désodorisation dans l’Environnement, Tech & Doc,Lavoisier, Paris, 1992.

144
36 . C. Kennes; H.H.J. Cox; H.J. Doddema; W. Harder, “Design and Performance of
Biofilters for the Removal of Alkylbenzene Vapors”, Journal of ChemicalTechnology and Biotechnology, 66, p. 300-304.
37 . H.L. Bohn, “Biofiltration: Design Principles and Pitfalls”, Paper number 93-TP-52A.01, 86th Annual Air and Waste Management Association Meeting, Denver,Colorado, June 13-18, 1993.
38 . S.P.P. Ottengraf; J.J.P. Meesters; A.H.C. Van Den Oever; H.R. Rozema, “BiologicalElimination of Volatile Xenobiotic Compounds in Biofilters,” Bioproc. Eng., 1, p.66-69.
39 . R.F. Michelsen, “Biofiltration” in Handbook of Air Pollution Control Engineeringand Technology, J.C. Mycock; J.D. McKenna; L. Theodore, Eds, Lewis Publishers,Boca Raton, Florida, 1995, p. 375-394.
40 . H. Bohn; R. Bohn, “Soil Beds Weed Out Air Pollutants”, Chem. Eng., (1988) 95, 6,p. 73-76.
41 . S.P.P. Ottengraf, “Method for Biological Treatment of Waste Gases”, US PatentNumber 4,662,900, issued May 5, 1987.
42 . G. Leson; D.S. Hodge; F. Tabatabai; A.M. Winer, “Biofilter Demonstration Projectsfor the Control of Ethanol Emissions” presented at the Air and Waste ManagementAssociation 86th Meeting and Exhibition, Denver, CO, June 13-18, 1993.
43 . L. Theodore; A.J. Buonicore; J.D. McKenna; I.J. Kugelman; J.S. Jeris; J.J. Santoleri;T.F. McGowan, “Air Pollution Management of Stationary Sources” in Perry’sChemical Engineers’ Handbook, 7th Edition, D.W. Green; J.O. Maloney,Eds.,McGraw-Hill, New York, 1997, Chapter 25, p. 41-43.
44 . K. Kiared; G. Wu; M. Beerli; M. Rothenbühler; M. Heitz, “Application ofBiofiltration to the Control of VOC Emissions”, Environ. Tech., 18, p. 55-63.
45 . C. van Lith; G. Leson; R. Michelsen, “Evaluating Design Options for Biofilters”, J.Air Waste Manage. Assoc., 47, p. 37-48.
46 . Personal communication with Steve Leach, May, 1998.47 . S.P. Ottengraf, “Exhaust Gas Purification” in Biotechnology, Volume 8, H.J. Rehm,
G. Reed, Eds., VCH Verlagsgesellschaft, Weinheim, FRG, 1986, p. 427-452.48 . S.P.P. Ottengraf; A.H.C. van den Oever, “Kinetics of Organic Compound Removal
from Waste Gases with a Biological Filter”, Biotechnology and Bioengineering,(1983) XXV, p. 3089-3102
49. M.L. Bradford; R. Krishnamoorthy, “Consider Bioremediation for Waste SiteCleanup,” Chem. Eng. Prog., 87, 2, p.80-85.
50 . N. Mukhopadhyay; E.C. Moretti, Current and Potential Future Industrial Practicesfor Reducing and Controlling Volatile Organic Compounds, Center for WasteReduction Technologies, American Institute of Chemical Engineers, New York,1993, p. 61-65.
51 . D.S. Hodge; V.F. Medina; R.L. Islander; J.S. Devinny, “Treatment of HydrocarbonFuel Vapors in Biofilters”, Environ. Tech., 12, 8, p. 655-662.
52 . C. van Lith; S.L. David; R. Marsh, “Design Criteria for Biofilters”, ChemicalEngineering’s Symposium on Effluent Treatment and Waste Disposal, March, 1990,University of Leeds, England, p. 127-281.
53 . R. Helmer, “Desodorierung von Geruchsbelander Abluft in Bodenfiltern”,Gesundheits-Ingenieur, 95, 1, p. 21-26.
145
54 . R. Kamarthi; R.T. Wellington, “Bench-Scale Evaluation of Air Pollution Control
Technology Based on Biological Treatment Process”, Proceedings of the 87th AnnualMeeting of the Air and Waste Management Association, Cincinnati, Ohio, 1994.
55 . B.F. Severin; et al., “Destruction of Gas Industry VOCs in a Biofilter”, Proceedingsof the IGT Sixth International Symposium on Gas, Oil, and EnvironmentalTechnology, Colorado Springs, CO, 1994.
56 . K. Tahraoui; et al., “Biodegradation of BTX from Waste Gases in a BiofilterReactor”, Poster session of the 87th Annual Meeting of the Air and WasteManagement Association, Cincinnati, OH, 1994.
57 . D.A. Peters; et al., “Laboratory Assessment of Biofiltration for Fuel-Derived VOCEmissions Control”, Proceedings of the 86th Annual Meeting of the Air and WasteManagement Association, Denver, CO, 1993.
58 . K. Cho; M. Hirai; M. Shoda, “Removal of Dimethyldisulfide by the Peat Seededwith Night Soil Sludge”, J. Ferment. Bioeng., 71, 4, p. 289-291.
59 . M. Shoda, “Methods for the Biological Treatment of Waste Gases” in BiologicalDegradation of Wastes, A.M. Martin, Ed, Elsevier Science Publishers, 1991, NewYork, p. 31-46.
60 . X. Zhu; M.J. Rihn; M.T. Suidan; B.J. Kim; B.R. Kim, “The Effect of Nitrate onVOC Removal in Trickle Bed Biofilters”, Water Sci. Technol., 34, 3-4, p. 573-581.
61 . W.M. Vatavuk, OAQPS Control Cost Manual 5th Edition, USEPA, ResearchTriangle Park, NC, 1996.
62 . Pacific Environmental Services, Inc., HAP-PRO 2.2 (Hazardous Air PollutantProgram), J. Steigerwald, project officer, EPA Control Technology Center, RTP,NC, 1996.
63 . H.P. Rothbaum, “Heat Output of Thermophiles Occurring in Wool”, J. Bacteriol.,81, p. 165-171.
64 . W.H. Prokop; H.L. Bohn, “Soil Bed Systems for Control of Rendering Plant Odors”,J. Air Poll. Contr. Assoc., 35, 12, p. 1332-1338.
65 . H.P. Rothbaum, “Heat Output of Thermophiles Occurring in Wool”, J. Bacteriol.,81, p. 165-171.
66 . W.H. Prokop; H.L. Bohn, “Soil Bed Systems for Control of Rendering Plant Odors”,J. Air Poll. Contr. Assoc., 35, 12, p. 1332-1338.
67 . J. Devinny; D. Hodge, “Formation of Acidic and Toxic Intermediates in OverloadedEthanol Biofilters”, J. Air Waste Manag. Assoc., 45, 2, p. 125-131.
68 . G.E. Speitel; D.S. McClay, “Biofilm Reactors for Treatment of Gas StreamsContaining Chlorinated Solvents”, J. Environ. Eng., 119, 4, p. 658-678.
69 . F.L. Smith; G.A. Sorial; M.T. Suidan; P. Biswas; R.C. Brenner, Proceedings of theEPA Symposium on Bioremediation of Hazardous Wastes: Research, Development,and Field Evaluations, San Fransisco, California, 1994, p. 89-97.
70 . G.A. Sorial; F.L. Smith; M.T. Suidan; P. Biswas; R.C. Brenner, Paper 94-RA115A.05, Proceedings of the 87th Annual Meeting of the Air and WasteManagement Association Meeting, Cincinnati, OH, 1994.

146
Chapter 10
Emerging Technologies
The need for better destruction efficiency and lower cost of air pollution control systems drivesthe development of new methods of VOC elimination [1]. The basic technology for some ofthese systems, such as membrane filtration and use of ozone for VOC oxidation, has been inexistence for many years. However, as regulations become more stringent and as publicawareness increases, the technologies are reconsidered and redesigned to address air pollutioncontrol issues. In addition, there are new technologies like plasma destruction that have recentlybeen discovered as potential methods for controlling air pollutants. While many of these systemsare available commercially, there is not much information available yet about costs, maintenance,and operational concerns. This chapter describes several of those innovative technologies.
Membrane SeparationMembrane separation processes are used to remove organic compounds from a polluted
gas stream by establishing a partial pressure gradient across a semi-permeable glassy or rubberysurface that constitutes the membrane. The membrane is designed to allow either air moleculesor pollutant molecules to pass preferentially, resulting in a more concentrated pollutant stream onone side of the membrane. One common system works by pressurizing the incoming gas stream,removing as much of the pollutant as possible by condensation, then exposing the resulting gasstream to a membrane which allows passage of organic molecules while limiting the passage ofair molecules [2]. The organic permeate stream may also be under vacuum to increase thedriving force for mass transfer. The permeate stream may be recycled to the compressor inlet.Once the concentration builds up sufficiently, the pollutant is removed by the condensationprocess [3]. Two membranes in series may be used if the gas stream is dilute to reduce theamount of permeate stream that must be recycled [4].
A typical flow diagram for a membrane separation system is shown in Figure 10-1 [5]. Thepollutant-laden gas is compressed to 0.31-1.38 MPa gauge pressure (45-200 psig), then flowsinto a condenser. From the condenser, the gas flows through the membrane system where it isseparated into an exhaust gas stream that has very low concentrations of organics, and a permeategas stream which is a more concentrated VOC stream [6, 7, 8]. The permeate gas stream may berecycled to the compressor. In this system, a condenser is added between the compressor and themembrane system and the recycled vapor eventually reaches a state in which it is concentratedenough to condense. The permeate stream may also be treated by a conventional technology suchas thermal or catalytic incineration. Membrane systems are also available in which the pollutantpasses across the membrane into a scrubbing liquor, where it is presumably neutralized ordestroyed [9].

147
Compressor Condenser
MembraneModules
Outlet Gas
VOC - EnrichedPermeate
Liquid VOC
VOCContaminatedGas Stream
Figure 10-1. Flow Diagram for a Membrane Separation System [adapted from 5]
As with other technologies, the constituents of the gas stream should be well characterized beforea membrane system is employed to ensure that the membrane is chemically compatible with thepotential gas stream constituents. Membranes are susceptible to fouling, and it is advisable toremove any particulate or oily compounds prior to the membrane system. Efficiencies ofmembrane separation systems are reported to be as high as 90 to 99.99% [10, 11], although it isimportant to note that greater removal efficiencies result in lower permeate stream concentrations[2].
Membrane separation is perhaps the most developed of the technologies to be covered in thischapter. There are approximately 60 membrane filtration systems that have been installed forVOC recovery [3, 2, 12, 13]. The system is based on technology that was first envisioned in1950 by Weller and Steiner [14]. The technology has been used for several decades in theChemical Process Industry and in drinking water treatment plants [4, 15]. Typical and potentialapplications of membrane systems are given in Table 10-1 [3, 8, 12, 13, 16, 17, 18, 19]. Theprinciples of gas permeation which are the foundation of membrane design work are given in theliterature [3, 20, 21, 22, 23, 24, 25, 26, 27, 28] .
Table 10-1. Applications of Membrane Separation Systemsfor VOC Removal [3, 8, 12, 13, 16, 17, 18, 19]
Vapor Recovery from Gasoline Loading and Unloading
Hospital sterilizer ventsPharmaceutical plants
Polymer production
Industrial chiller purge streams
Film drying
Liquid ring vacuum pump exhaust
Tank and drum filling
Removal of higher hydrocarbons from natural gas
Membrane systems are convenient, in that they are continuous processes [9], they can be usedwith a large fluctuation in inlet concentration or flow [5], and they are normally modular indesign [9], which simplifies installation and increases in capacity. They are usually costcompetitive with carbon adsorption when the VOC concentration is above approximately 1000ppm [2]. They are also applicable in situations where carbon adsorption is not appropriate, such

148
as low molecular weight compounds [6] or compounds that polymerize on activated carbon.
Membrane systems can be classified according to the type of membrane used. Glassy membranes(such as polyetherimide) are more permeable to air molecules than to organics [3]; rubberymembranes (such as natural rubber) are more permeable to organic compounds. Furthermore,glassy polymers in general allow substantially less material to flow through than rubberymembranes (about 1/1000 as much). Because glassy membranes are more resistant to flow, amuch larger membrane is required than if a rubbery membrane is employed. This is aggravatedby the fact that the air must pass through the glassy membrane to get an effective separation.Since the proportion of air is usually much higher than that of the pollutant, glassy membranesresult in much larger amounts of material being transferred through the membrane. The amountof material that must pass through the membrane, in combination with the permeability of themembrane, determines the surface area of membrane required. Therefore, rubbery membranesare generally used in VOC separation, since the required surface area is significantly less thanwith glassy membranes [2]. Glassy membranes, though, can provide greater selectivity, resultingin a purer gas stream exiting the system [3]. The remainder of this chapter will deal with rubberymembranes, since they are generally the most cost effective for VOC removal.
Membrane systems can also be classified according to the design of the membrane unit. Asshown in Figure 10-2 [29], plate and frame units are similar to filter presses, where the feedstream travels into a series of plates. The pollutant migrates from the plates through themembrane into a "frame". A frame is a space between the plates that direct the permeate out ofthe membrane module.
The spiral-wound module shown is similar to a stack of flat membranes and spacers that havebeen wound around a hollow center shaft. The feed flows into one end of the space created bythe spacers, travels by the membrane, and the permeate goes through the membrane into anothercavity which winds to the hollow center shaft. The permeate collects in the center shaft and isremoved from the end of the shaft. The feed that does not go through the membrane is collectedat the end of the membrane module.
The third type, which is not commonly used for air pollution applications, is similar to a shell-and-tube heat exchanger. There are "heads" on each end which hold the ends of hollow fibers ortubes. The feed stream can flow either in the "shell" side of the membrane module, in which thepermeate is removed from the "tube" side, or the feed stream can flow in the "tube" side and thepermeate is removed from the "shell" side.

149
Figure 10-2. Various Configurations of Membrane Separators from W.J. Koros,"Membranes: Learning a Lesson from Nature", Chemical Engineering Progress, October,
1995, p. 68-81. Reproduced with permission of the American Institute of ChemicalEngineers.
The degree of separation which can be achieved in a membrane module is governed by theselectivity of the membrane to the pollutant over the remaining components of the gas stream.

150
The selectivity of the membrane is given by the formula:
αA/B = PA/PB 10-1
where: αA/B = selectivity of the membrane to pass component A instead of component BPA = permeability of gas A through the membranePB = permeability of gas B through the membrane
Usually, membranes have selectivities of approximately 20-100 [3], indicating that approximately20 to 100 times as much organic material as air will pass through the membrane. Permeability isa measure of the volume of a compound that moves through a (1 cm thick) membrane at astandard pressure difference of 1 cm of mercury. The permeability is usually given in units ofBarrers. One Barrer is equal to 1x10⁻¹⁰ cm3 (STP)/(cm2 s cmHg). The permeability of acompound is related to the diffusion coefficient, a measure of the rate of transport the compoundthrough the membrane material and the Henry's Law sorption coefficient, a measure of thecondensability of the compound [2].
It is important that the relative permeabilities or selectivity be measured in experiments with thesimulated gas composition as opposed to measuring the permeabilities of pure gases separatelyand comparing them. This technique is necessary because rubbery membranes swell in thepresence of organic compounds, changing the diffusion of each compound through themembrane. This phenomenon results in a higher selectivity for the organic compound than wouldbe predicted otherwise [3].
Likewise, temperature can affect the selectivity and permeability of the membrane. Theselectivity usually improves as the temperature is decreased [3]. Polymer membranes aregenerally limited to 363 K (194 oF, 90 oC) [30]. The amount of membrane surface required willdepend on the type of membrane, the permeability of the pollutant through the membrane, therequired removal efficiency, and the difference in pressure across the membrane [3].
Little cost information is available for membrane systems. The cost for membranes which allowpassage of organic compounds has been estimated at approximately $71/1,000 standard m3 of gas($2/1,000 scf of gas) [29] and at $4-11/kg of VOC recovered ($2-5/ lb of VOC recovered) [31].The majority of the annual cost associated with a typical membrane system will be the cost tocompress the gas stream. Annual energy consumption associated with compressing the gas maybe approximated using the guidelines in the OAQPS Cost Control Manual [32]:
Power (kW) = A Q ∆P/ η 10-2
where: A = Factor, 1.66 x 10⁻⁵ using SI units (use 1.17 x 10⁻⁴ with English units shownin parenthesis) Q = Total flue gas flowrate, standard m3/min or sccm (standard ft3/min or scfm)∆P = pressure change, Pa (inches of water)η = combined efficiency of motor and compressor
If a vacuum pump is used on the permeate stream, it would also need to be included in theelectrical cost estimate.

151
There are few moving parts in membrane systems, so they are less likely to require maintenance[9]. Membrane systems are less susceptible to malfunction due to changes in concentration andflowrate than other pollution control systems, as long as the fluctuations were anticipated as partof the original design. However, the temperature must be maintained low enough to effectivelyseparate the compounds and to ensure that the membrane is not damaged. Similarly, care must betaken to ensure that the gas stream constituents are compatible with the membrane material andother materials of construction, so that the membrane is not damaged by solvent action of the gasstream. Particulate or oils that could accumulate on the membrane or in the pores of themembrane should also be removed to extend the life of the membrane. High concentrations oforganic compounds should also be avoided to minimize the risk of explosions. See the discussionof lower explosive limits in Chapter 6.
An overall summary of the advantages and disadvantages of membrane systems is given in Table10-2 [5, 33, 34].
Table 10-2. Advantages and Disadvantages of Membrane Separation [5, 33, 34]
Advantages Disadvantages
Solvent recovery High energy costs
No secondary wastes
Compact design
High efficiencies possible with proper design
Technology is applicable for variable pollutantconcentrations.
Ambient Oxidation ProcessesUltraviolet (UV) oxidation uses the same types of photochemical reactions that occur in
the atmosphere [6, 35] to assist in the oxidation of organic compounds to form water and carbondioxide. UV light and oxidants such as ozone, peroxide, hydroxyl radicals, or oxygen radicals areused to break down the VOCs into carbon dioxide and water [1]. The wavelength of light used isdetermined based on the VOCs to be destroyed. In one system, the incoming gas stream passesthrough a filter to remove particulate, then into a chamber where the reactions occur. Followingthe main reaction chamber, any residual VOCs may be scrubbed with water or adsorbed ontoactivated carbon. The scrubbing liquor and carbon regeneration may also include oxidants tofurther enhance removal efficiency [35].
Photocatalytic oxidation (PCO) or heterogeneous photocatalysis [36] is a similar process, but itincludes a catalyst surface (usually titanium dioxide, although nickel and mixtures of titaniumdioxide and platinum have also been used) [37, 38]. In PCO, the catalyst surface is asemiconductor material that becomes active in UV or near-UV light. The light source may beeither the sun or a fluorescent bulb [39, 40]. The process operates by adsorption of the pollutantcompound onto the surface of the catalyst, then decomposition of the compound in a mannersimilar to catalytic oxidation. Ozone, peroxide, hydroxyl radicals, or oxygen radicals may also beadded to or generated within the process [41]. The process is applicable for aliphatichydrocarbons, ethers, ketones, alcohols, and aldehydes [42]. It is particularly well suited tochlorinated hydrocarbons, since they are more reactive than non-chlorinated compounds. In

152
conventional technologies, such as thermal incinerators, the chlorinated compounds are moredifficult to destroy than the non-chlorinated compounds [39]. Aromatics can also be treated; theaddition of ozone or hydrogen peroxide increases the rate of reaction of aromatics substantially[43]. Microbes are also destroyed in the process [44].
One type of PCO reactor is shown in Figure 10-3 [45]. The reactor consists of two concentrictubes. Beads coated with catalyst are packed between the two tubes, and a UV light source is putin the center tube. The polluted gas stream flows through the beads. Alternatively, the reactor canbe designed with the catalyst arranged on a series of disks over which the gas flows [46]. Thegoal of either design is to expose as much of the catalyst surface as possible to the light whilemaintaining a low pressure drop for the gas stream. The mechanism of the surface reaction is notwell understood, although it is recognized that the excitation of the semiconductor catalystmaterial promotes the formation of electron-hole pairs in the solid [41].
The constituents of the gas stream must be identified in order to determine if a PCO systemwould be suitable. In addition, particulates, oily compounds, or compounds such ashexamethyldisilazane which could foul the surface of the catalyst must be removed prior to thereactor.
Efficiencies of laboratory PCO systems have been reported as high as 99% at high temperaturesor residence times [47, 48]. Efficiencies at ambient temperatures and residence times which aremore realistic for commercial systems have been reported as high as 95% for a 400 ppm gasstream [43]. Commercial systems are currently being designed to achieve 99+% destruction [49].
PCO technology is best suited for low concentration (<1000 ppm) gas streams at low to moderateflow rates (<567 m3/min or 20,000 cfm). At higher concentrations, larger catalyst area is requiredand the system becomes less cost competitive with other technologies [45]. Normal fluorescentlighting may be an adequate light source for destroying odors and very low concentrations ofpollutants using TiO2 as a photocatalyst [50]. Potential applications of PCO systems are given inTable 10-3 [40, 45, 49, 51, 52].

153
UV Lamp
Air In
Packed BedSection Is
Wrapped WithHeating Tape
Air Out
Catalyst-coatedBeads
Figure 10-3. Flow Diagram of a Packed Bed PCO Reactor [45]
Table 10-3. Applications of PCO Systems for VOC Removal [40, 45, 49, 51, 52]
Soil or Groundwater Remediation Vent Streams
Contact Lens Degreasing
Lithography Equipment
Paint Spray Booths
Cleaning Equipment
Indoor Air Pollution from Paint and Solvents
For the reaction to occur, the organic species must first be adsorbed onto the catalyst surface.The rate of adsorption is governed by the concentration of the pollutant in the gas stream and thetemperature. Increasing temperature generally increases the rate of destruction of the compound.However, increased temperature also reduces the speed of the adsorption process, so lesscompound is available for destruction. Care must be taken to ensure that adequate surface area isavailable for adsorption. Once the surface of the catalyst is saturated with compound, increasesin concentration have little or no effect on the destruction rate of the pollutant, so the destructionefficiency declines rapidly [45]. It is also important, therefore, to ensure that adsorption sites are

154
not blinded by particulate or non-reactive compounds. The reaction also will not occur withoutlight. The light can, however, be quickly turned off or on for an intermittent pollutant stream,resulting in lower energy consumption [49].
Little cost information is available for these oxidation systems. Cost estimates have beenprepared for a photocatalytic oxidation system in the same manner as costs for other controlswere estimated by Mukhopadhyay and Moretti [53], which generally follow the methodology ofthe OAQPS Cost Control Manual published by EPA [54]. The cost for a PCO system has beenestimated at approximately $883-1069 /standard m3 per min of gas ($25-30 /scfm of gas),although the cost will depend on the relative reactivity of the compound to be treated. Unlikeother control systems, the cost increases with the concentration of organic compound, but remainsrelatively stable with increasing flowrates [39].
There are not many moving parts in PCO systems, so it is anticipated that annual maintenancecosts would be relatively low. Because of the low temperatures, simple materials of constructioncan be used like plastic piping [55] which reduce both capital and maintenance costs. An overallsummary of the advantages and disadvantages of PCO systems is given in Table 10-4 [49].
Table 10-4. Advantages and Disadvantages of PCO [49]
Advantages Disadvantages
Can be turned off with a switch to saveenergy between batches
May form additional pollutants if process is notproperly designed
Compact design Solvent recovery is not feasible
High efficiencies possible with proper design
Technology is applicable for small or shortfluctuations in pollutant concentrations.
Corona DestructionThe Corona Destruction process also operates at ambient temperature. A high voltage/
low current electrical discharge is used to produce high energy electrons which collide withVOCs and decompose them into carbon dioxide and water [1, 56]. The basic process is describedby Yamamoto [57]. It is believed that the technology may be eventually applicable for lowconcentration VOC streams, however, available information indicates that the energyrequirements are currently too high to be competitive with other technologies. Packed bedsystems which use a bed of dielectric beads (perovskite BaTiO3) with an electrode connected oneither end are being investigated. The beads store electrical energy and discharge it out of phasewith the applied electric field, producing electrons which destroy the VOC. High destructionefficiencies are possible with the corona discharge processes, however, it has been demonstratedthat ozone is formed in substantial concentrations (approximately 500 ppm, see Chapter 11). Inaddition, NOx and incomplete products of combustion may also be formed [56]. The potentialbenefits of corona destruction are that it would not require auxilliary fuel, would operate atambient temperatures, and would be able to treat both halogenated and non-halogenatedcompounds [1].

155
Plasma DestructionSeveral types of plasma destruction are also being investigated to determine if they are
applicable for controlling chlorinated or non-chlorinated compounds [6]. Plasma technologiescan be divided into high and low temperature processes. In high temperature processes, thecontaminated gas stream is mixed with oxygen or water vapor and passes into the reactor. Aplasma or high temperature ionized gas state is maintained in the reactor by an electric discharge(arc) or by radio frequency energy. The plasma is extremely reactive and the gas reacts with thewater or oxygen to form carbon dioxide [6]. One such system is used in Japan to destroychlorofluorocarbons (CFCs) and hydrochlorofluorocarbons (HCFCs). Destruction efficiencieshave been measured at 99.99% and higher using 35-138 kW of electricity for a gas streamcontaining 36-100 kg/h [58].
Cold plasma techniques heat only the electrons in the plasma by a series of micro-arcs similar totiny lightening bolts. The electron temperatures are typically 3 eV, approximately equal to30,000 K (29,700 oC or 54,000 oF). However, the remainder of the gas is not heated. Thereactions which occur are similar to the free radical reactions which occur in thermal oxidation,but the free radicals are produced by the collisions of the electrons and the gas molecules, not bythe temperature. Efficiencies in the range of 90-99% have been demonstrated on laboratory scaleunits. However, ozone, carbon monoxide, nitrous oxides, and nitric acid may also be formed asbyproducts of the reactions. Preliminary cost estimates are approximately $1.18/ scmm($33.3/1000 scfm) [59].
Ozone Catalytic OxidationCatalytic oxidation of VOCs with ozone as the primary oxidant offers the advantage of
low temperatures of reaction. This topic is currently being investigated by S. Ted Oyama'sresearch group in the Chemical Engineering Department at Virginia Tech. The synthesis processfor some of the catalysts being investigated is discussed in the next chapter.

156
References 1. E.C. Moretti; N.K. Mukhopadhyay, "VOC Control: Current Practices and Future
Trends", Chem. Eng. Prog., 1993, 7, p. 20-26.2. R.W. Baker; J. Kaschemekat; J.G. Wijmans, "Membrane Systems for Profitable
VOC Recovery", Chemtech, July, 1996, p. 37-43.3. R.W. Baker; J.G. Wijmans, "Membrane Separation of Organic Vapors from Gas
Streams" in Polymeric Gas Separation Membranes, D.R. Paul; Y.P. Yampol'skii,Eds., CRC Press, Boca Raton, FL, 1994, p.353-397.
4. N. Mukhopadhyay; E.C. Moretti, "Membrane Technology" in Current and PotentialFuture Industrial Practices for Reducing and Controlling Volatile OrganicCompounds, Center for Waste Reduction Technologies, American Institute ofChemical Engineers, New York, 1993, p. 22-23.
5. "VaporSep : Membrane Systems For VOC Recovery", MTR (MembraneTechnology and Research), Menlo Park, CA, 1998.
6. R.W. Baker; M. Jacobs, "Improve Monomer Recovery from Polyolefin ResinDegassing", Hydrocarbon Processing, 1996, March.
7. R.G. McInnes, "Explore New Options for Hazardous Air Pollutant Control", Chem.Eng. Prog., 1995, 11, p. 36-47.
8. V. Simmons; J. Kaschemekat; M.L. Jacobs; D.D. Dortmundt, "Membrane SystemsOffer A New Way to Recover Volatile Organic Air Pollutants", Chem. Eng., 1994,September.
9. C.M. Caruana, "Membranes Vie for Pollution Cleanup Role", Chem. Eng. Prog.,October, 1993, p. 11-14.
10. R.W. Baker; V. Simmons; H. Wijmans, "Membrane Recovery of Volatile OrganicComponds (VOCs) in the Pharmaceutical Industry", Pharmaceutical Engineering,(1993) 13, 5.
11. J. McCallion, "Membrane Process Captures Vinyl Chloride, Other VOCs: RecoversValues, Eases Incineration Burdens", Chem. Proc., 1994, September.
12. K. Ohlrogge; K.V. Peinemann; J. Wind; R.D. Beling, Sep. Sci. Technol., (1990) 25,p.13-15.
13. K. Matsumoto; K. Ishii; T. Kuroda; K. Inoue; A. Iwama, Polym. J., 1991, 23, 5.14. R.R. Zolandz; G.K. Fleming, "Applications" in Membrane Handbook, W.S. Winston
Ho; K.K. Sirkar, Eds., Van Nostrand Reinhold, New York, 1992, Chapter 5, p.91-93.15. L. Theodore; A.J. Buonicore; J.D. McKenna; I.J. Kugelman; J.S. Jeris; J.J. Santoleri;
T.F. McGowan, "Waste Management" in Perry's Chemical Engineers' Handbook, 7th
Ed., D.W. Green; J.O. Maloney, Eds., McGraw-Hill, New York, 1997, Chapter 25,p. 25-1 to 25-111.
16. K. Ohlrogge, presentation at The Ninth Annual Membrane Technology PlanningConference, Newton, MA, November, 1991.
17. J. Wijmans, U.S. Patent 5,071,451, December 19, 1991, as given by R.W. Baker;J.G. Wijmans, "Membrane Separation of Organic Vapors from Gas Streams" inPolymeric Gas Separation Membranes, D.R. Paul; Y.P. Yampol'skii, Eds., CRCPress, Boca Raton, FL, 1994, p.353-397.
18. K. Watler, U.S. Patent 4,857,078, August 15, 1989 as given by R.W. Baker; J.G.Wijmans, "Membrane Separation of Organic Vapors from Gas Streams" in

157
Polymeric Gas Separation Membranes, D.R. Paul; Y.P. Yampol'skii, Eds., CRCPress, Boca Raton, FL, 1994, p.353-397.
19. N. Mukhopadhyay; E.C. Moretti, "Membrane Technology" in Current and PotentialFuture Industrial Practices for Reducing and Controlling Volatile OrganicCompounds, Center for Waste Reduction Technologies, American Institute ofChemical Engineers, New York, 1993, p. 50-51.
20. R.M. Barrer, Diffusion In and Through Solids, MacMillan, New York, 1941.21. G.J. van Amerongen, J. Appl. Phys., (1946) 17, 972.22. R.M. Barrer; G. Skinner, J. Polym. Sci., (1948) 3, 549.23. A. Aitken; R.M. Barrer, Trans. Faraday Soc., (1948) 51, 549.24. G.J. van Amerongen, J. Polym. Sci., (1950) 5, 307.25. G.J. van Amerongen, Rubber Chem. Technol.,(1964) 37, 1065.26. P. Meares, J. Appl. Polym. Sci., (1965) 9, 917.27. S.A. Stern in Gas Permeation Process in Industrial Processing with Membranes,
R.B. Lacey; S. Loeb, Eds., Wiley-Interscience, New York, 1972.28. R.M. Baker; J.G. Wijmans, U.S. Patent 5,129,921, July 14, 1992.29. W.J. Koros, "Membranes: Learning a Lesson from Nature", Chem. Eng. Prog., 1995,
10, p. 68-81.30. "Development of New Membranes", Fraunhofer Institut Grenzflächen-und
Bioverfahrenstechnik, 1998, (available on the web athttp://www.igb.fhg.de/MuPT/home.en.html).
31. "VOC Offgas Membrane Separation" in "The DOE Industrial Projects Locator" onthe web at http://www.oit.doe.gov/Access/locator/2114.htm, July, 1998.
32. D.R. van der Vaart; J.J. Spivey; W.M. Vatavuk; A.H. Wehe, “Thermal and CatalyticIncinerators” in OAQPS Control Cost Manual, 5th Edition, United StatesEnvironmental Protection Agency, Office of Air Quality Planning and Standards,Research Triangle Park, NC, 1995, Chapter 3 (available on the web athttp://www.epa.gov/ttn/catc/products.html).
33. "Ethylene, Propylene Recovery System Spotlighted", Press Release from MembraneTechnology and Research, Inc., Menlo Park, CA, 1995.
34. "Novel Membranes for Natural Gas Separation", Department of Energy Tech Brief,U.S. Department of Energy, Washington, DC, November, 1994.
35. N. Mukhopadhyay; E.C. Moretti, "Ultraviolet Oxidation Technology" in Current andPotential Future Industrial Practices for Reducing and Controlling Volatile OrganicCompounds, Center for Waste Reduction Technologies, American Institute ofChemical Engineers, New York, 1993, p. 23.
36. R.A. Zerbonia; J.J. Spivey; S.K. Agarwal; A.S. Damle; C.W. Sanford,"Heterogeneous Catalysis" in Survey of Control Technologies for Low ConcentrationOrganic Vapor Gas Streams, Control Technology Center, U.S. EnvironmentalProtection Agency, Research Triangle Park, NC, 1995, Section 6.2.
37. T.T. Shen; C.E. Schmidt; T.R. Card, "Treatment Process Selection/ ModificationControl Technologies" in Assessment and Control of VOC Emissions from WasteTreatment and Disposal Facilities, Van Nostrand Reinhold, New York, 1993, p.157-177.
38. E.J. Wolfrum; R. Rabago; A.S. Jassal, "Destruction of Volatile Organic Compound(VOC) Emissions by Photocatalytic Oxidation (PCO): Final Report (ESHC003)",
158
Technology Transfer Document # 97013236A-ENG, SEMATECH, Inc., Austin, TX,1997, available at http://www.sematech.org.
39. C.S. Turchi; E.J. Wolfrum; R.A. Miller, "Gas-Phase Photocatalytic Oxidation: CostComparison with Other Air Pollution Control Technologies", Presented at AdvancedOxidation Technologies for Water and Air Remediation, London, Ontario, Canada,June, 1994, NREL/TP-41-7014, National Renewable Energy Laboratory, Golden,CO, 1994.
40. "Arizona State University/Zentox Corporation: (Photocatalytic Oxidation with AirStripping)", Arizona State University, Tempe, AZ, 1999, available on the internet athttp://www.clu-in.org/remed1.html.
41. D.A. Gratson; M.R. Nimlos; E.J. Wolfrum, "Photocatalytic Oxidation of Gas-PhaseBTEX-Contaminated Waste Streams", Prepared for the Air & Waste ManagementAssociation, 88th Annual Meeting and Exhibition, San Antonio, TX, June, 1995,Report NREL/TP-473-7575, National Renewable Energy Laboratory, Golden,Colorado, 1995.
42. "KSE, Inc. (Adsorption-Integrated-Reaction Process)", KSE, Inc., Amherst, MA,1998, available on the internet at http://www.clu-in.org/remed1.html.
43. C.S. Turchi; R. Rabago, "Benchscale Testing of Photocatalytic Oxidation (PCO) toDestroy Volatile Organic Compound (VOC) Emissions", Technology TransferDocument # 95042791A-ENG, SEMATECH, Inc., Austin, TX, 1995, available onthe internet at http://www.sematech.org.
44. "Sun-Air™ 300: with Phototech™ Photocatalytic Air Purification and DetoxificationTechnology", Universal Air Technology, Inc., Lake Hopatcong, NJ, 1998,http://www.universalair.com.
45. C.S. Turchi; R. Rabago; A.S. Jassal, "Destruction of Volatile Organic Compound(VOC) Emissions by Photocatalytic Oxidation (PCO): Field Test Results",Technology Transfer Document # 96023084A-ENG, SEMATECH, Inc., Austin, TX,1996, available on the internet at http://www.sematech.org.
46. "Radiant Decomposition of Airborne VOCs", U.S. Navy, Indian Head Division,Naval Surface Warfare Center, Indian Head, MD, 1999, available on the web athttp://www.fsec.ucf.edu//~at/detox.html.
47. J. Blanco; P. Avila; A. Bahamonde; E. Alvarez; B. Sánchez; M. Romero,"Photocatalytic Destruction of Toluene and Xylene at Gas Phase on a Titania BasedMonolithic Catalyst", Catalysis Today, (1996) 29, p. 437-442.
48. A.V. Vorontsov; E.N. Savinov; G.B. Barannik; V.N. Troitsky; V.N. Parmon,"Quantitative Studies on the Heterogeneous Gas-Phase Photooxidation of CO andSimple VOCs by Air Over TiO2", Catalysis Today, (1997) 39, p. 207-218.
49. J.R. Kittrell; C.W. Quinlan; J.W. Shepanzyk, "Photocatalytic Destruction of HexaneEliminates Emissions in Contact Lens Manufacture", Emerging Solutions to VOCand Air Toxics Control: Proceedings of A Specialty Conference, Clearwater Beach,FL, February - March, 1996, Air and Waste Management Association, Pittsburgh,PA, 1996, p. 389-409.
50. A. Fujishima, "The Raising of The Titanium", Look Japan, June, 1995, p. 26-27.51. H.M. Liljestrand; M.L. Sattler, "Photocatalytic Oxidation Processes for In-Door Air
Pollution", paper 96-WA61.07, presented at the Air and Waste Management

159
Association 89th Annual Meeting, Nashville, TN, 1996, Air and Waste ManagementAssociation, Pittsburgh, PA, 1996.
52. "Destruction Technology for Air Stripper and Vapor Extraction Off-Gas",Department of Energy and National Renewable Energy Laboratory, 1999, availableat http://www.bwonotes5.wdc.pnl.gov/iof.nsf.
53. N. Mukhopadhyay; E.C. Moretti, "Economic Analysis of Selected VOC AbatementTechnologies" in Current and Potential Future Industrial Practices for Reducingand Controlling Volatile Organic Compounds, Center for Waste ReductionTechnologies, American Institute of Chemical Engineers, New York, 1993, p. 57-65.
54. W.M. Vatavuk, OAQPS Control Cost Manual, 5th Edition, G. Moyer, Ed., UnitedStates Environmental Protection Agency, Office of Air Quality Planning andStandards, Research Triangle Park, NC, 1995, Chapter 3 (available on the internet athttp://www.epa.gov/ttn/catc/products.html).
55. "Photocatalytic Oxidation: Low Temperature Oxidation", Zentox, Ocala, FL, 1996,http://www.zentox.com/fpco.html.
56. R.A. Zerbonia; J.J. Spivey; S.K. Agarwal; A.S. Damle; C.W. Sanford, "CoronaDischarge Processes" in Survey of Control Technologies for Low ConcentrationOrganic Vapor Gas Streams, Control Technology Center, U.S. EnvironmentalProtection Agency, Research Triangle Park, NC, 1995, Section 6.1, (available on theinternet at http://www.epa.gov/ttn/catc/products.html).
57. T. Yamamoto; K. Ramanathen; M.K. Owen; D.S. Ensor; J.J. Spivey, "CoronaDestruction and Other Technologies for VOC Control", report to the U.S. EPA:AEERL, Cooperative Agreement CR815169, November, 1990.
58. "Induction-Coupled Plasma Used to Destroy CFCs in Japan", The Air PollutionConsultant, V.A. Dean, Ed., (1997) 7, 4, p. 1.11 to 1.12.
59. J.J. Coogan; A.S. Jassal, "Silent Discharge Plasma for Point-of-Use (POU)Abatement of Volatile Organic Compound (VOC) Emissions: Final Report(ESHC003), Technology Transfer Document # 97023244A-ENG, SEMATECH,Inc., Austin, TX, 1997, available on the internet at http://www.sematech.org.

160
Chapter 11
Preparation and Characterization of Supported Manganeseand Iron Oxide Catalysts
Paige H. Hunter, S. Ted Oyama
Environmental Catalysis and Materials Laboratory, Departments of Chemical
Engineering and Chemistry, Virginia Tech, Blacksburg, VA 24060
AbstractCatalysts based on manganese and iron oxide were prepared by the impregnation of an
aluminum oxide washcoat deposited on alumina foam blocks. Samples contained Mn3O4,Mn2FeO4, MnFe2O4, and Fe3O4 with a total loading of 0.35 to 0.66 mmol/g of Al2O3 washcoat(ranging from 12 to 15 wt % total oxide). The original foam blocks were approximately 5 cm by5 cm with a thickness of approximately 1.3 cm. The specific surface area of the materials coatedwith the washcoat and catalyst ranged from 90 to 130 m2g-1. Temperature programmed reductionstudies resulted in well defined peaks from approximately 360 to 970 K and indicated that theorder of reducibility was Mn3O4< Mn2FeO4< MnFe2O4< Fe3O4. Oxygen chemisorption onsamples reduced at temperatures just below the bulk reduction temperature gave oxygen uptakesof 267 to 487µmol per gram of applied coating, corresponding to dispersions of 27.4 to 51.6%.
Keywords: foam; manganese; iron; oxide; ozone; VOC
IntroductionThere are increasing economic incentives to develop highly efficient methods of removing
volatile organic compounds from industrial vent streams to reduce air pollution. One of thereasons for this increased interest is that large companies are now required to file annual reportswhich specify the amount of pollution emitted from each facility [1]. Not only are industriesconcerned about the impact of such information on their public image, but they have also becomeaware of the cost of raw materials which are being lost to the atmosphere. In addition, the CleanAir Act Amendments of 1990 require EPA to issue new regulations to limit the emissions ofcertain VOC compounds from targeted industrial categories [2]. Companies are currentlyevaluating the effects of the public scrutiny and the anticipated regulations. Many haveconcluded that it is in their best interest to install additional air pollution control equipment, evenif it is not yet required by state or federal regulations. Many more will have to install controls to

161
meet the anticipated air pollutant emission standards that are currently being developed by EPA.
The recognition that many companies will need to develop additional controls has increased theinterest in alternative or innovative air pollution control methods [3]. Some of these innovationsresult in new types of equipment; others increase the removal efficiency or the cost efficiency ofexisting technologies. This paper describes research to improve performance and reduce energyconsumption associated with catalytic incineration by the use of ozone as an oxidizing agent.
The catalysts employed are oxides of manganese and oxides of iron, including mixtures of thetwo. These catalysts have been shown in previous work [4, 5] to be effective at reducing VOCsto simple compounds such as carbon dioxide and water. With VOCs, it is critical to completelydestroy the pollutant, because incomplete oxidation can result in more harmful compounds beingproduced than present in the original gas stream [3].
Ozone is an extremely effective oxidant for destroying VOCs [6, 7, 8, 9 ]. It has been shownpreviously that ozone increases the catalytic rate by opening up new reaction channels [4, 7]. Byimprovements in catalysts and the presence of ozone, we anticipate that the temperature requiredfor complete oxidation can be substantially reduced. Because the cost of ozone can be as low as$2 /kg ($1/lb) [3], this temperature reduction could result in significant savings for companiesplanning to install new catalytic incinerators.
Additional improvements in catalyst technology include the need for catalysts which are lesssusceptible to deactivation by impurities in the gas stream, which are lighter weight [10], andwhich result in lower pressure drops [11].
There are generally three types of substrate available for catalyst deposition. Pellets (see Figure11-1 [11]) have been in use for many years in commercial systems, but generally result in ahigher pressure drop than other substrates when compared on the basis of the same number ofactive sites (see Figure 11-2 [11]). Other substrates include monoliths (Figure 11-3 [11]) andceramic foams (Figure 4 [11]). The current research uses foams as a substrate to provide goodmixing while retaining a low pressure drop. As evident in Figure 4, the foam substrate has arandom pattern which allows gas to flow in different directions, enhancing the mixing of the gasstream [10].

162
Figure 11-1. Pellets [11]
Figure 11-2. Cordierite Monolith [11]

163
Figure 11-3. Cordierite Foam [11].
Figure 11-4. Pressure drop vs. Velocity for Various Types of Substrates [11]

164
The research described here includes the preparation of manganese and iron oxidecatalysts on aluminum oxide foam substrates. An aluminum oxide washcoat is used toincrease the surface area of the foam before the catalyst is deposited. Measurements ofthe BET surface area of the prepared catalyst have been carried out and the results areincluded. BET surface area analysis results for the foam and washcoated blanks are alsopresented.
Experimental MethodSamples of Amporex aluminum oxide foam manufactured by Fiber-Ceramics, Inc in
Cincinnati, Ohio served as the substrate material for the catalyst deposition. The foam blocks are5 cm x 5 cm x 1.3 cm. A picture of the foam substrate is shown in Figure 5. The pore density ofthe original foam material is a nominal 30 pores per cm2 [12] compared to an actual measureddensity of 33 ±4 pores per cm2.
Figure 11-5. Foam Substrate
The foam samples are treated with a washcoat to increase the surface area and to improve thebonding of the metal oxide catalysts. The foam samples were treated with a slurry of 15.03 g ofalumina (Degussa Aluminumoxid C) in 100 ml of water. The aluminum oxide has a surface areaof approximately 85 to 115 m2/g [13]. A single one-step application method of the aluminumoxide slurry resulted in agglomerated particles of alumina with poor adhesion to the foamsubstrate. Therefore, the final preparation method relied on a multiple impregnation process.The sample was placed in the aluminum oxide slurry for approximately 30 seconds, removed,then was shaken to remove as much residual liquid as possible. A jet of air was subsequentlyblown down through the large face areas of the block and the sample was moved from side to sideand front to back to ensure that the jet of air was forced through all the areas of the sample. Thecoated sample was heated and calcined with a temperature profile consisting of an initial rate of0.03 K s-1 to a temperature of 373 K, where it was maintained for four hours. The second portionof the heating cycle increased the temperature by 0.08 K s-1 to a final temperature of 673 K,where it was maintained for three hours. During the heating cycles, additional air was introducedthrough a 1/8” diameter tube pointed toward the oven floor in the middle of the oven. Previouswork had used a similar air jet blowing directly on each sample. By dispersing the air evenlyover multiple samples by directing the air jet toward the bottom of the oven and using a dryingrack, the production capability was increased from one sample per cycle to eight samples percycle. Three or more coating/heating cycles were required to achieve the same approximate

165
weight of washcoat. However, the samples appeared to be more uniformly coated withoutcrystals forming in the interstitial spaces of the foam. Final weights of washcoats and originalsamples are given in Table 11-1.
Table 11-1. Weights of Samples and Applied Coating
Sample IDFoamWt (g)
WashcoatedWt (g)
Wt ofWashcoat
(g) Reagent
Wt ofSample and
CatalystCoating(g)
CatalystCoating
Wt (g)Wt of Applied
Coating (g)
phh01024a 20.269 22.958 2.689 Fe 23.451 0.493 3.182phh01024b 18.393 20.666 2.273 21.070 0.404 2.677phh01025c 19.786 22.160 2.374 Mn 22.703 0.543 2.917phh01024d 19.430 22.805 3.375 23.438 0.633 4.008phh01024e 20.108 22.989 2.881 Mn:2Fe 23.478 0.489 3.370phh01024f 19.410 22.374 2.964 22.874 0.500 3.464phh01024g 17.475 20.675 3.200 2Mn:Fe 21.160 0.485 3.685phh01024h 18.723 21.531 2.808 21.974 0.443 3.251
After the washcoat application was complete, the active catalyst was deposited onto the samplesby an impregnation method. The chemicals used in this experiment were manganese (II) acetatetetrahydrate (99.99% purity) and iron (III) nitrate nonahydrate (Aldrich, 99.99 % purity).Initially, the metal solutions were applied in the same one-step method as the original method forthe washcoat. The solution concentrations were calculated by determining the amount of metaloxide that was needed on the final sample (15-20% by weight of the washcoat weight). Then theamount of reagent was determined based on the number of moles of metal that were required toresult in the necessary deposition and the reagent was dissolved in 100 ml of water. Thepresence of high quantities of moisture during drying, though, resulted in uneven drying and asplotchy appearance, as evident in the iron oxide example shown in Figure 11-6. In addition,weights of the samples changed very little with the addition of the catalyst deposition due toseveral factors including removal of the washcoat component with long exposure to the metalsolutions and low concentration of metal solutions. Therefore, the catalyst deposition methodwas modified by use of solutions that were approximately ten times as strong and by dipping thesamples quickly into the solution, then shaking them to remove excess solution and blowing airacross them in the same manner as with the washcoat. The air jet and sample rack were alsoused during the drying/calcining process to ensure even drying.
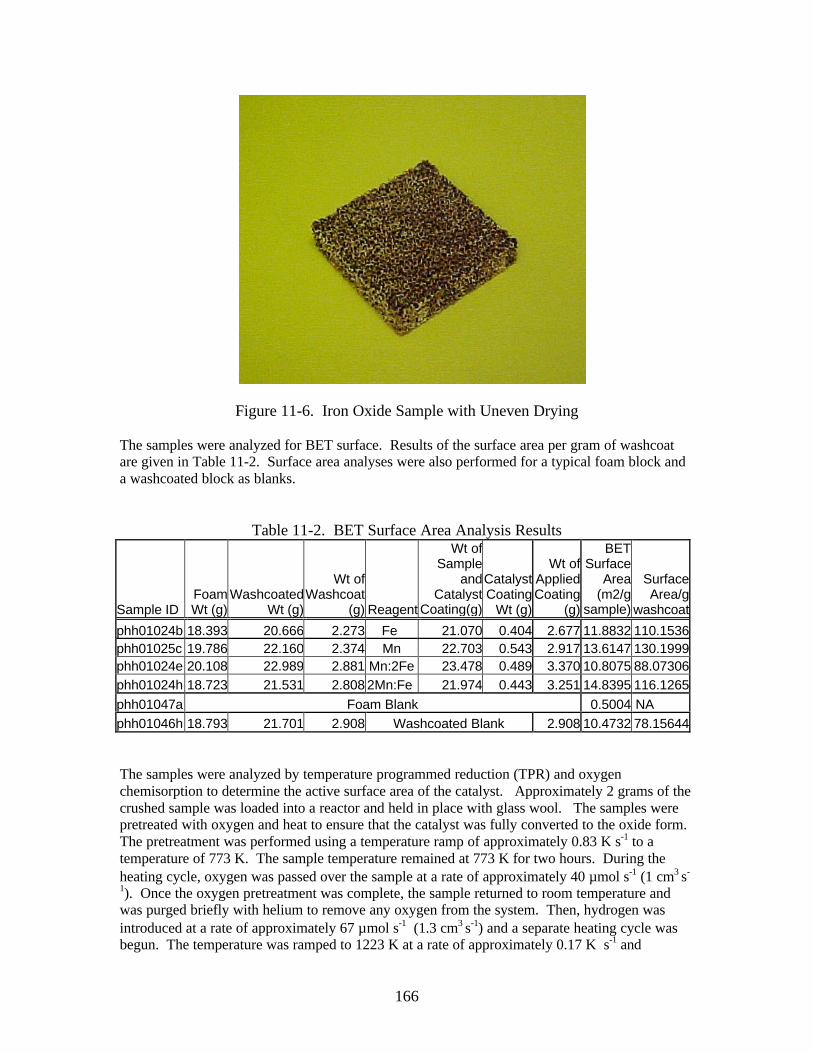
166
Figure 11-6. Iron Oxide Sample with Uneven Drying
The samples were analyzed for BET surface. Results of the surface area per gram of washcoatare given in Table 11-2. Surface area analyses were also performed for a typical foam block anda washcoated block as blanks.
Table 11-2. BET Surface Area Analysis Results
Sample IDFoamWt (g)
WashcoatedWt (g)
Wt ofWashcoat
(g) Reagent
Wt ofSample
andCatalyst
Coating(g)
CatalystCoating
Wt (g)
Wt ofAppliedCoating
(g)
BETSurface
Area(m2/g
sample)
SurfaceArea/g
washcoat
phh01024b 18.393 20.666 2.273 Fe 21.070 0.404 2.677 11.8832 110.1536phh01025c 19.786 22.160 2.374 Mn 22.703 0.543 2.917 13.6147 130.1999phh01024e 20.108 22.989 2.881 Mn:2Fe 23.478 0.489 3.370 10.8075 88.07306phh01024h 18.723 21.531 2.808 2Mn:Fe 21.974 0.443 3.251 14.8395 116.1265
phh01047a Foam Blank 0.5004 NAphh01046h 18.793 21.701 2.908 Washcoated Blank 2.908 10.4732 78.15644
The samples were analyzed by temperature programmed reduction (TPR) and oxygenchemisorption to determine the active surface area of the catalyst. Approximately 2 grams of thecrushed sample was loaded into a reactor and held in place with glass wool. The samples werepretreated with oxygen and heat to ensure that the catalyst was fully converted to the oxide form.The pretreatment was performed using a temperature ramp of approximately 0.83 K s-1 to atemperature of 773 K. The sample temperature remained at 773 K for two hours. During theheating cycle, oxygen was passed over the sample at a rate of approximately 40 µmol s-1 (1 cm3 s-
1). Once the oxygen pretreatment was complete, the sample returned to room temperature andwas purged briefly with helium to remove any oxygen from the system. Then, hydrogen wasintroduced at a rate of approximately 67 µmol s-1 (1.3 cm3 s-1) and a separate heating cycle wasbegun. The temperature was ramped to 1223 K at a rate of approximately 0.17 K s-1 and

167
remained at the elevated temperature for approximately 300 s. During the temperature ramping,the exhaust stream was monitored with a mass spectrometer (Dycor Quadrupole Gas Analyzer)for concentrations of helium, hydrogen, water, and oxygen. The resulting temperature profilewas used to determine the temperature at which reduction of the bulk material began. Theoxygen chemisorption tests were then conducted by pretreating the sample in the same mannerwith oxygen. The pretreated sample was then reduced with hydrogen flowing over it for twohours at a temperature just below that at which reduction of the bulk material began. Theobjective was to reduce the surface sites without reducing the bulk material. Once the two hourreduction cycle was complete, 5.39 µmol pulses of oxygen were introduced. The first severalpulses were complete adsorbed onto the surface of the sample. By comparing the size ofsubsequent oxygen peaks on the mass spectrometer, the total amount of oxygen uptake can bedetermined.
In addition to the standard TPRs, TPRs were conducted with the iron and manganese samplesusing helium as the carrier gas to eliminate any peaks in the TPR data due to dehydration ofsurface hydroxyl groups.
Results and Discussion
The original methods for applying the washcoat and the catalyst coating wereunsuccessful, resulting in uneven deposition of catalyst. However, the modified methods,including use of the air jet in the oven and the sample rack, resulted in even deposition of thewashcoat and metal coatings. In addition, the speed of producing samples was increasedsubstantially. The uniformity of the metal coatings is evident, as shown in Figures 11-7, through11-10. Foam weight, washcoat weight, solution concentration, and weight of catalyst coating forthe final method are given in Table III.
One of each pair of samples was crushed and tested for BET surface area. Blanks of the foammaterial and the foam coated with the alumina washcoat were also analyzed. The results of thoseanalysis are given in Table 11-2, in square meters of surface area per gram of washcoat. Themanganese oxide sample has the largest surface area, with 130 m2/g. The metal oxide coatingssubstantially increased the surface area of the block from the blank washcoated value of 78m2g-1.
The surface area of the washcoat was somewhat reduced from the original value in the powder.This may be attributable to the binding of the catalyst on the washcoat, but it is more likely due tothe multiple layers of washcoat that are applied to the sample which block micropores.

168
Figure 11-7. Manganese Impregnated Catalyst Sample
Figure 11-8. Iron Impregnated Catalyst Sample

169
Figure 11-9. Sample Impregnated with a Mn:2 Fe Ratio
Figure 11-10. Sample Impregnated with a 2 Mn: Fe Ratio

170
Table 11-3. Experimental Data for Catalyst Preparation
Sample IDFoam Wt
(g)Washcoated
Wt (g)
Wt ofWashcoat
(g) Reagent
Conc (g ofreagent/100ml of water)
Wt ofSample and
CatalystCoating(g)
CatalystCoating
Wt (g)
Wt ofAppliedCoating
(g)
phh01024a 20.269 22.958 2.689 Fe 13.51 23.451 0.493 3.182phh01024b 18.393 20.666 2.273 21.070 0.404 2.677phh01025c 19.786 22.160 2.374 Mn 8.00 22.703 0.543 2.917phh01024d 19.430 22.805 3.375 23.438 0.633 4.008phh01024e 20.108 22.989 2.881 Mn:2Fe 5.37 23.478 0.489 3.370phh01024f 19.410 22.374 2.964 17.70 22.874 0.500 3.464phh01024g 17.475 20.675 3.200 2Mn:Fe 9.85 21.160 0.485 3.685phh01024h 18.723 21.531 2.808 8.12 21.974 0.443 3.251
Temperature programmed reduction results indicated that bulk reduction begins at approximately500 K for the iron sample, 475 K for the manganese sample, 487 K for the 2 Mn:Fe sample, and506 K for the Mn:2 Fe sample. Graphs of the water signal vs. temperature for the samples andwashcoated blank are given in figures 11-11 through 11-15. The washcoated blank resulted in arelatively consistent baseline with no significant reduction. The TPR tests done with only heliumas a carrier gas resulted in no significant reduction, as shown in figures 11-16 and 11-17.
200 400 600 800 1000 12000.0
1.0x10⁻⁷
2.0x10⁻⁷
3.0x10⁻⁷
4.0x10⁻⁷
5.0x10⁻⁷
6.0x10⁻⁷
(Run PHH1041B)
TPR Data for the Mn Sample
Wat
er R
espo
nse
(Pa)
Temperature (K)
Figure 11-11. TPR Graph for Manganese Sample

171
200 300 400 500 600 700 800 900 1000 1100 1200 1300 14000.0
1.0x10⁻⁷
2.0x10⁻⁷
3.0x10⁻⁷
4.0x10⁻⁷
5.0x10⁻⁷
6.0x10⁻⁷
(Run PHH1044B)
TPR Data for the Iron Sample
Wat
er R
espo
nse
(Pa)
Temperature (K)
Figure 11-12. TPR Graph for Iron Sample
200 400 600 800 1000 12000.0
1.0x10⁻⁷
2.0x10⁻⁷
3.0x10⁻⁷
4.0x10⁻⁷
5.0x10⁻⁷
(Run PHH1054A)
TPR Data for the Mn :2 Fe Sample
Wat
er R
espo
nse
(Pa)
Temperature (K)
Figure 11-13. TPR Graph for the Mn:2 Fe Sample

172
200 400 600 800 1000 12000.0
1.0x10⁻⁷
2.0x10⁻⁷
3.0x10⁻⁷
4.0x10⁻⁷
5.0x10⁻⁷
6.0x10⁻⁷
(Run PHH1056A)
TPR Data for 2 Mn: Fe Sample
Wat
er R
espo
nse
(Pa)
Temperature (K)
Figure 11-14. TPR Graph for 2 Mn: Fe Sample
200 400 600 800 1000 1200 1400
2.0x10⁻⁷
4.0x10⁻⁷
6.0x10⁻⁷
8.0x10⁻⁷
1.0x10⁻⁶
TPR Data for the Washcoated Blank
Wat
er R
espo
nse
(Pa)
Temperature (K)
Figure 11-15. TPR Graph for the Washcoated Blank

173
200 400 600 800 1000 12000.0
1.0x10⁻⁷
2.0x10⁻⁷
3.0x10⁻⁷
4.0x10⁻⁷
5.0x10⁻⁷
6.0x10⁻⁷
(Run PHH1060A)
TPR Data for the Iron Sample with Helium
Wat
er R
espo
nse
(Pa)
Temperature (K)
Figure 11-16. TPR Graph for Manganese with Helium Carrier Gas
200 400 600 800 1000 12000.0
1.0x10⁻⁷
2.0x10⁻⁷
3.0x10⁻⁷
4.0x10⁻⁷
5.0x10⁻⁷
6.0x10⁻⁷
(Run PHH1058a)
TPR Data for the Mn Sample with Helium
Wat
er R
espo
nse
(Pa)
Temperature (K)
Figure 11-17. TPR Graph for Iron with Helium Carrier Gas

174
0 1000 2000 3000 4000 5000 6000
0.0
1.0x10⁻⁷
2.0x10⁻⁷
3.0x10⁻⁷
4.0x10⁻⁷
5.0x10⁻⁷
6.0x10⁻⁷
(Run PHH1063B)
Oxygen Chemisorption Data for the Mn Sample
Oxy
gen
Res
pons
e (P
a)
Time (s)
Figure 11-18. Oxygen Chemisorption Response for Mn Sample
The oxygen chemisorption tests were performed at approximately 500 K for the iron sample, 475K for the manganese sample, 487 K for the 2 Mn:Fe sample, and 506 K for the Mn:2 Fe sample.The manganese sample was originally tested at 368 K, but the results were inconclusive, so thetest was repeated at a temperature corresponding to the beginning of the second reductiontemperature peak. Graphs of the mass spectrometer response during the oxygen pulsing processare shown in Figures 11-18 through 11-21. In Figure 11-21, the data for one peak was notautomatically collected due to a failure of the data collection system, but the peak area wasestimated from manual readings taken during the test. Results of the oxygen chemisorptiontesting are given in Figures 11-22 through 11-25 and Table 11-4. The highest oxygenchemisorption rate occurred in the Mn:2 Fe sample with an adsorption rate of 487 µmol per gramof applied coating (includes both the alumina washcoat and the active metal oxide).

175
0 1000 2000 3000 4000 5000 6000
0.0
5.0x10⁻⁸
1.0x10⁻⁷
1.5x10⁻⁷
2.0x10⁻⁷
(Run PHH1066b)
Oxygen Chemisorption Data for the Iron Sample
Oxy
gen
Res
pons
e (P
a)
Time (s)
Figure 11-19. Oxygen Chemisorption Response for Iron Sample
0 2000 4000 6000 8000
0.0
5.0x10⁻⁸
1.0x10⁻⁷
1.5x10⁻⁷
2.0x10⁻⁷
2.5x10⁻⁷
(Run PHH1069a)
Oxygen Chemisorption Data for the Mn:2 Fe Sample
Oxy
gen
Res
pons
e (P
a)
Time (s)
Figure 11-20. Oxygen Chemisorption Response for the Mn:2 Fe Sample

176
0 1000 2000 3000 4000 5000 6000 7000
0.0
1.0x10⁻⁷
2.0x10⁻⁷
3.0x10⁻⁷
4.0x10⁻⁷
(Run PHH1074A and PHH1075A)
Oxygen Chemisorption Data for the 2Mn:Fe Sample
Oxy
gen
Res
pons
e (P
a)
Time (s)
Figure 11-21. Oxygen Chemisorption Response for the 2 Mn: Fe Sample
Cumulative Adsorption of Mn Sample
050
100150200250300350400450
1 6 11 16 21 26 31 36 41 46
Pulse Number
Oxy
gen
Ad
sorp
tio
n (
um
ol/g
of
Ap
plie
d C
oat
ing
)
Figure 11-22 Cumulative Oxygen Adsorption for Mn Sample

177
Cumulative Adsorption of Fe Sample
0
50
100
150
200
250
300
1 6 11 16 21 26
Pulse Number
Oxy
gen
Ad
sorp
tio
n (
um
ol/g
Ap
plie
d C
oat
ing
)
Graph
Figure 11-23. Cumulative Oxygen Adsorption for Fe Sample
Cumulative Adsorption of Mn:2 Fe Sample
0
100
200
300
400
500
600
1 6 11 16 21 26 31 36 41
Pulse Number
Oxy
gen
Ad
sorp
tio
n (
um
ol/g
of
Ap
plie
d
Co
atin
g)
Figure 11-24. Cumulative Oxygen Adsorption for Mn:2 Fe Sample

178
Cumulative Adsorption of 2 Mn: Fe Sample
0
50
100
150
200
250
300
350
400
1 6 11 16 21 26 31 36
Pulse Number
Oxy
gen
Ad
sorp
tio
n (
um
ol/g
Ap
plie
d
Co
atin
g)
Figure 11-25. Cumulative Oxygen Adsorption for 2Mn:Fe Sample
Table 11-4. Results of Oxygen Chemisorption Testing
Sample ID
Wt ofWashcoat
(g)
AssumedForm ofCatalyst
Wt ofSample
andCatalystCoating
(g)
CatalystCoating
Wt (g)
%Catalyst
onAlumina
%Alumina
onFoam
Wt ofAppliedCoating
(g)
OxygenAdsorption
(umol/gapplied
Coating)MW of
CatalystFractional
Dispersionphh01024b 2.273 Fe3O4 21.070 0.404 17.8 12.4 2.677 267.47 231.54 0.274phh01025c 2.374 Mn3O4 22.703 0.543 22.9 12.0 2.917 390.29 228.81 0.320phh01024e 2.881 MnFe2O4 23.478 0.489 17.0 14.3 3.370 487.01 230.63 0.516phh01024h 2.808 Mn2FeO4 21.974 0.443 15.8 15.0 3.251 365.12 229.72 0.410
Fractional dispersions were also calculated for each analyzed sample by ratioing the number ofsurface sites to the total number of moles of active metal oxide. Dispersions ranged from a lowof 27.4% in the iron sample to 51.6% in the Mn:2Fe sample.
Conclusions
An improved sample preparation method was developed which resulted in uniformdistribution of catalyst on the washcoat and a substantial increase in the production speed of thecatalysts over previous methods. Bulk reduction of the samples was found to begin atapproximately 500 K for the iron sample, 475 K for the manganese sample, 487 K for the 2Mn:Fe sample, and 506 K for the Mn:2 Fe sample. The Mn:2 Fe sample resulted in the highest

179
amount of oxygen uptake on the surface of the catalyst per gram of combined washcoat andactive metal oxide. The order of oxygen uptake during chemisorption was found to be Fe < Mn <2 Mn:Fe < Mn:2 Fe.
Acknowledgements
We would like to express our appreciation to students who assisted with this research.The BET surface area testing was conducted very efficiently by Doo-Hwan Lee. Corey Reedassisted cheerfully in the data collection and analysis.

180
References 1 . 42 U.S.C. 11001 et seq. (1986), information available on http://www.epa.gov/tri.2 . 40 CFR Part 61.3 . P.H. Hunter; S.T. Oyama, Control of Volatile Organic Compound Emissions:
Conventional and Emerging Technologies, John Wiley & Sons, New York, 2000.4 . S. T. Oyama; W. Li; W. Zhang, “A Comparative Study of Ethanol Oxidation with
Ozone on Supported Molybdenum and Manganese Oxide Catalysts”, Science andTechnology in Catalysis, 1998, p. 105-110.
5 . A. Naydenov; D. Mehandjiev, Appl. Catal., A 97 (1993), 17.6 . A. Gervasini; G.C. Vezzoli; V. Ragaini, Catal. Today, 29 (1996), 4497 . W. Li; S. T. Oyama in Heterogeneous Hydrocarbon Oxidation, B.K. Warren; S.T.
Oyama, eds., ACS Symposium Series 638; ACS, Washington, DC, 1996, p.364.8 . V. Ragaini; C.L. Bianchi; G. Forcella; A. Gervasini, in Trends in Ecological Physical
Chemistry, L. Bonati, ed., Elsevier, Amsterdam, 1993, p. 275.9 . A. Gervasini, C. L. Bianchi; V. Ragaini, in Environmental Catalysis, J.N. Armor,
Ed., ACS Sympdosium Series 552, ACS, Washington, DC, 1994, p. 352.10 . C. Heisig; W. Zhang; S.T. Oyama, “Decomposition of Ozone Using Carbon –
Supported Metal Oxide Catalysts”, Appl. Catal., 14 (1997), p. 117-129.11. B. Dhandapani; S.T. Oyama, “Gas Phase Ozone Decomposition Catalysts”, Appll.
Catal. B: Environ., 11 (1997), 129.12 . Shipping information from Amporox filters, Fiber-Ceramics, Inc. Cincinnati, Ohio,
1996.13 . “Product Information”, Degussa Corporation, Ridgefield Park, NJ, 1996.

Vita
Paige H. Hunter graduated from Clemson University in 1985 with bachelor’s degrees inChemistry and Chemical Engineering. She immediately began work in the field of air pollutionas a development engineer with Celanese Corporation. In her positions as a senior engineer and aregional engineering manager for the Virginia Department of Environmental Quality, shedeveloped a strong understanding of the challenges faced by industries as they strive to abide byair pollution regulations. As a consulting engineer for ETS, Inc., she continued to help industriesevaluate and improve their compliance with regulations. In addition, she conducted seminars onair pollution rules and equipment, assisted in major project design, helped troubleshootequipment, and pursued a Ph.D. in Chemical Engineering.