Control Enabling Solutions with Ultrathin Strain and … · · 2015-04-10Control Enabling...
25
Imagination at work. 2015 Annual Meeting – Open Session April 1, 2015 Control Enabling Solutions with Ultrathin Strain and Temperature Sensor System for Reduced Battery Life Cycle Cost
Transcript of Control Enabling Solutions with Ultrathin Strain and … · · 2015-04-10Control Enabling...

Imagination at work.
2015 Annual Meeting – Open Session April 1, 2015
Control Enabling Solutions with Ultrathin Strain and Temperature Sensor System for Reduced Battery Life Cycle Cost

© 2014 General Electric Company - All rights reserved
2
Team
Aaron Knobloch - Principal Investigator
Jason Karp Chris Kapusta Yuri Plotnikov David Lin
Brian Engle – Automotive Vertical Ldr Rob Twiney – GM Advanced Sensors Dave Geer – Principal Engineer
Dave Villella – Test Engineer Ron Martonik – Product Manager
Anna Stefanopoulou – Michigan Lead Jason Siegel Bogdan Epureanu
Charles Monroe Krishna Garikipati Nassim Samad Ki Yong Oh Howie Chu
Zhenlin Wang
Dyche Anderson – Ford Lead Arnold Mensah-Brown Ramzi Chraim
Tommy Coupar Xinfan Lin Bruce Blakemore
© 2014 General Electric Company - All rights reserved
3
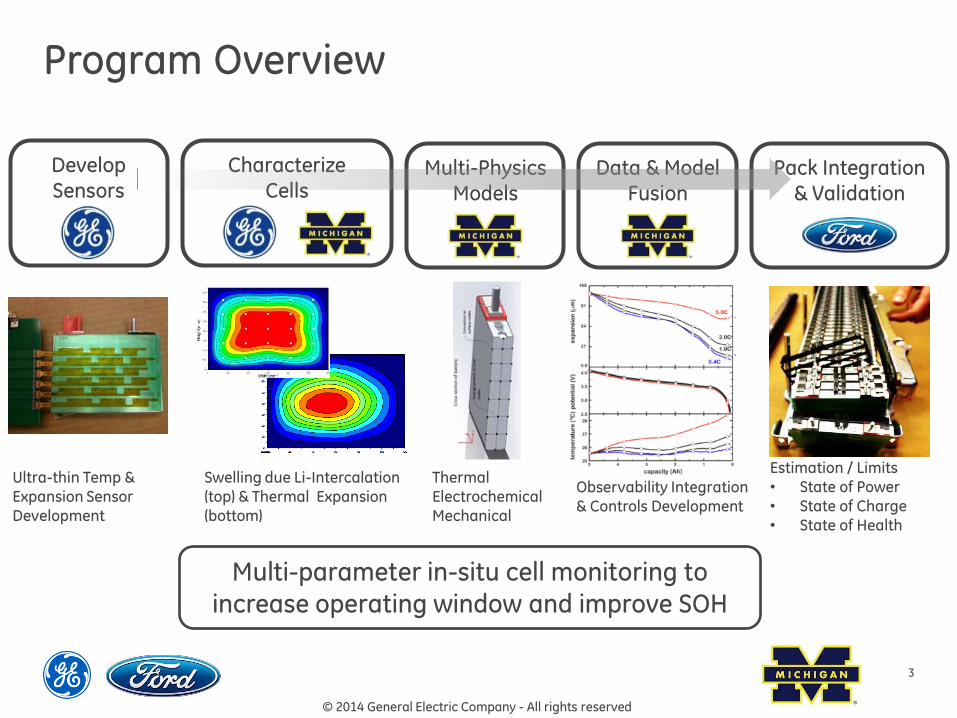
Program Overview
Multi-parameter in-situ cell monitoring to
increase operating window and improve SOH
Observability Integration & Controls Development
Ultra-thin Temp & Expansion Sensor
Development
Thermal Electrochemical
Mechanical
Estimation / Limits • State of Power • State of Charge
• State of Health
Multi-Physics Models
Data & Model Fusion
Pack Integration & Validation
Characterize Cells
Develop Sensors
Swelling due Li-Intercalation (top) & Thermal Expansion
(bottom)

© 2014 General Electric Company - All rights reserved
Program Summary & Value Proposition

© 2014 General Electric Company - All rights reserved
5
Expected System Benefit
Test Case – 5 Amp-hr Panasonic Cell for HEV Applications
Real-time Dynamic Model-based Power Limits
Temp & Expansion Sensor
Prediction Estimation
Po
we
r
State of Charge
Cold Temp Limits Room Temp Limits
Cycle OperatingWindow - Centered at
High SOC
Cycle OperatingWindow - Centered at
Low SOC
Widened State of Charge Operating Range
20% Reduction in pack size while maintaining life at higher throughput

© 2014 General Electric Company - All rights reserved
6
Enabling Sensor Technologies
Thin film RTD
• Thin (<100mm) – locate
anywhere on surface
• Develop arrays
• Accuracy
• Time response
• Enables lower cost battery
packaging
Eddy Current
• Not able to measure
expansion today
• Small / cost effective
• Can measure between cells
• Potential correlation to
battery health, SOC, …
36 point Temperature Array Leverages high volume, low
cost Flex manufacturing
Benefits Competitive Technologies
Thermistors
• Thick (>1mm)
• Limited locations
• Slower
• Lower accuracy
• Higher installation costs
Strain Gages:
• Drift, low signal level
• Temp effects
Load Cells:
• Thick (>1/4”)
• Not cell specific
Integrated Expansion & Temperature Sensor

© 2014 General Electric Company - All rights reserved
7
Fusion of Sensor Data and Models
Thermal Mechanical
-Thermal and Intercalation swelling, sensor response, and porosity change.
Electrochemical (ECM or DFN)
𝑇
𝑇
𝑆𝑂𝐶
𝜀, 𝜖
Modeled Pack Temp
Free and Constrained Swelling
0 20 40 60 80 100 120
0
10
20
30
40
50
60
70
80
Width(mm)
He
igh
t(m
m)
0.000
10.00
20.00
30.00
40.00
50.00
60.00
70.00
80.00
90.00
103.5
H1
H5
Enhanced SOC Estimation
with Measured Expansion
Measured Temp

© 2014 General Electric Company - All rights reserved
8
Model Based Power Limit
• Improved battery core temperature estimation using thin film temperature sensor -> 2 minute faster convergence rate.
• Model based power limiting strategy enables faster warmup to full power, and wider SOC operation.
• Dynamic power limits can be more conservative when necessary for health and safety.
• At low temperatures (-5oC), battery utilization (Whr throughput per cell) can be increased up to 26%.
(New) US06 Drive Cycle Benefits
Prediction Estimation

© 2014 General Electric Company - All rights reserved
Key Learnings & Results

© 2014 General Electric Company - All rights reserved
10
Charge sustaining pulses • 20, 39, 50A • Fan on, fan off
Experiment
Comsol
Reduced TEM
Electro-Thermal Model Validation
0 5 10 15 20 25 30 3527
28
29
30
31
32
33
Surface temperatures [oC]
Te
mp
era
ture
[oC
]
0 5 10 15 20 25 30 3527
28
29
30
31
32
33
Te
mp
era
ture
[oC
]
COMSOL
ECM
Experiment
0 5 10 15 20 25 30 3527
28
29
30
31
32
33
Te
mp
era
ture
[oC
]
Sensor Index
20A excitation
39A excitation
50A excitation
• Performed observability analysis
for optimal sensor placement.
• Thin film sensor enables faster core temp estimation over existing measurement location (side vs top of cell )
• Less than 2oC modeling error in pack cell temperature predictions
over a 35oC operating range
Finite element and reduced order pack models validated against vehicle drive cycle data.
Reduced
20A excitation
39A excitation
50A excitation
Samad, N., e.t. al. DSCC 2014-6321, 2014.

© 2014 General Electric Company - All rights reserved
11
Swelling (Free)
Swelling (Constrained)
Response at GE Sensor location
Thermal (∆T=10°C)
[μm]
Intercalation (∆SOC=100%)
0.0 0.2 0.4 0.6 0.8 1.0
0.0
0.5
1.0
1.5
2.0
2.5
3.0
3.5
Sw
ellin
g (
mm
)
SOC
Thermal
Li-ion intercalation
0 1 2 3 4 5 6T
Li Intercalation Swelling
Oh, e.t. al. J. Power Sources, 267(0):197 - 202, 2014.
T 6oC <=> SOC 100%
Thermal Swelling
0.0 0.2 0.4 0.6 0.8 1.0
0
20
40
60
80
100
Sw
ell
ing
(mm
)
SOC
Model
prediction Measured data
6oC
0 20 40 60 80 100 120
0
10
20
30
40
50
60
70
80
[mm]
0.000
5.000
10.00
15.00
20.00
25.00
30.00
35.00
40.00
45.00
51.00H
eig
ht(
mm
)
Width(mm)
3oC 9oC
Thermal Free Swelling

© 2014 General Electric Company - All rights reserved
12
0 100 200 300 400 500 6003
3.5
4
4.5
Vo
lta
ge
(V
)
0 100 200 300 400 500 6001000
1200
1400
Fo
rce
(N
)
0 100 200 300 400 500 6000.3
0.4
0.5
SO
C
Plant V only V+F
0 100 200 300 400 500 600-0.02
0
0.02
0.04
0.06S
OC
err
or
Time (sec)
SOC Estimation
0 100 200 300 400 500 6003
3.5
4
4.5
Vo
lta
ge
(V
)
0 100 200 300 400 500 6001000
1200
1400
Fo
rce
(N
)
0 100 200 300 400 500 6000.3
0.4
0.5
SO
C
Plant V only V+F
0 100 200 300 400 500 600-0.02
0
0.02
0.04
0.06S
OC
err
or
Time (sec)
Similar Convergence Rate
0 1000 2000 3000 4000 5000 60003
3.5
4
4.5
Vo
lta
ge
(V
)
0 1000 2000 3000 4000 5000 60001000
1200
1400
Fo
rce
(N
)
0 1000 2000 3000 4000 5000 60000.3
0.4
0.5
SO
C
Plant V only V+F
0 1000 2000 3000 4000 5000 6000-0.02
0
0.02
0.04
0.06S
OC
err
or
Time (sec)
Estimation Quality Improved
Mohan S., e.t. al. DSCC 2015, in preparation
U.S. Utility Patent Application No. 62/043,519
The relation among temperature, SOC, current
and force enables the use of measured for in
SOC estimation.
© 2014 General Electric Company - All rights reserved
13
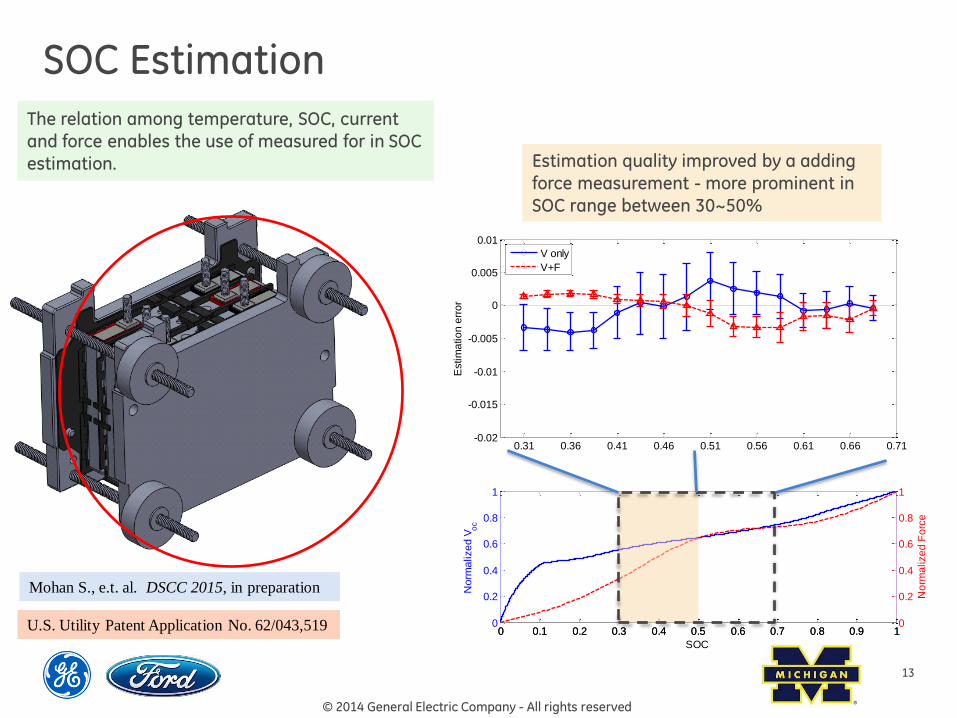
SOC Estimation
Mohan S., e.t. al. DSCC 2015, in preparation
U.S. Utility Patent Application No. 62/043,519 0 0.1 0.2 0.3 0.4 0.5 0.6 0.7 0.8 0.9 10
0.2
0.4
0.6
0.8
1
SOC
No
rma
lize
d V
oc
0 0.1 0.2 0.3 0.4 0.5 0.6 0.7 0.8 0.9 10
0.2
0.4
0.6
0.8
1
No
rma
lize
d F
orc
e
0.31 0.36 0.41 0.46 0.51 0.56 0.61 0.66 0.71-0.02
-0.015
-0.01
-0.005
0
0.005
0.01
Estim
atio
n e
rro
r
V only
V+F
0.31 0.36 0.41 0.46 0.51 0.56 0.61 0.66 0.710
500
1000
1500
Actual SOC
Vis
ita
tio
n N
o.
Estimation quality improved by a adding
force measurement - more prominent in
SOC range between 30~50%
The relation among temperature, SOC, current
and force enables the use of measured for in SOC
estimation.

© 2014 General Electric Company - All rights reserved
14
3-Cell Degradation Testing • Established baseline degradation
– 25oC cell temperature ( -10oC ambient air)
• Open loop US06 power profile, no controls (yet).
• Conclusion: Lower capacity loss at lower SOC.
• Next steps: compare degradation effects for closed loop power limiting and
wider SOC window on downsized pack.
Using 3-fixtures to assess capacity loss
56k equivalent miles driven
33% 50% 66%
50% SOC
high preload

© 2014 General Electric Company - All rights reserved
15
Power Limits, Downsizing, and Degradation
• Shift to lower SOC operation for reduced degradation
and more charge acceptance (regen braking) at -5oC.
(New) US06 Drive Cycle

© 2014 General Electric Company - All rights reserved
16
Power Limits, Downsizing, and Degradation
# of times algorithm would limit power deliver/acceptance, i.e. Energy left on the table <==> FE.
© 2014 General Electric Company - All rights reserved
Validation Plan & Performance Targets

© 2014 General Electric Company - All rights reserved
18
Status of Proof of Concept – Demonstration Pack
Sensor-Pack Integration
Gen 1 Open Loop UM Model Complete Q1 2015
Baseline U-M 3 Cell Rig
56k miles Complete Q1 2015
Demonstration Pack Operation
Validate Expected Benefits Start Q2 2015
Confirm functionality
• Verify sensor fit • Test software / find bugs • Confirm accuracy of
model estimates
Operation
• Integration • Examine target SOC window • Sensor accuracy & perf • Confirm accuracy of model
estimates
Verify model & control
• Hardware in the loop simulation
• Impact on degradation on validation conditions

© 2014 General Electric Company - All rights reserved
19
Benefit Demonstration & Validation
Instrumented Pack Control Pack
GE Sensors & UM Controls Wider Operating Window
Ford Controls
Wider Operating Window
• Use existing test profiles, adjusting SOC ranges • Two cycles “high”, two cycles “low” • Adjust between cycles if significant drift in
center point • Run for c. 30,000 mi equivalent minimum • Capacity & power tests every month – examine
degradation
P
ow
er
State of Charge
Cold Temp Limits Room Temp Limits
Cycle OperatingWindow - Centered at
High SOC
Cycle OperatingWindow - Centered at
Low SOC
Widened State of Charge Operating Range

© 2014 General Electric Company - All rights reserved
20
Expected Performance Benefits • Improved state of charge and power capability estimation • Improved power availability at low temperatures • Pack may be downsized (fewer cells or smaller cells)
AMPED
Full Pack (76 cells) – 2014MY Reduced Pack (60 cells) same total power
-21% +27%
Increased Utilization (Wh throughput per cell)
105s *
Faster Warmup
+23%
Cell Count Reduction +25C Cold (-5C)
*Results for scaled US06 battery power
profile at 25oC.

© 2014 General Electric Company - All rights reserved
Summary

© 2014 General Electric Company - All rights reserved
22
Summary
• Proven
– Temperature sensor + physics based model enables more accurate and faster (2x) prediction of core temperature
– Developed SOC estimation based on force / expansion – more sensitive (in 30-50% SOC range) than typical voltage based measurements
– Demonstrated integration of sensors & open loop control with Ford pack
– Simulated validation performance based on improved state estimation
• Ongoing
– Verify validation windows on 3 cell rig and developmental pack
– Development of closed loop control with expansion/force input
– Instrument and run validation pack to demonstrate benefit
• Challenges Addressed
– Cell SOC estimation
– SOH measurements / battery lifetime
– Model to extract maximum power capability and throughput with long life

© 2014 General Electric Company - All rights reserved
23
Program Next Steps
• Examining sensor performance on other cell types
(soft pouch, larger size)
• Commercialization of sensors & model-based
algorithms

© 2014 General Electric Company - All rights reserved
24
Acknowledgement & Disclaimer
Acknowledgment: The information, data, or work presented herein was funded in part by the Advanced Research Projects Agency-Energy (ARPA-E), U.S. Department of Energy, under Award Number DE-AR0000269.
Disclaimer: The information, data, or work presented herein was funded in part by an agency of the United States Government. Neither the United States Government nor any agency thereof, nor any of their employees, makes any warranty, express or implied, or assumes any legal liability or responsibility for the accuracy, completeness, or usefulness of any information, apparatus, product, or process disclosed, or represents that its use would not infringe privately owned rights. Reference herein to any specific commercial product, process, or service by trade name, trademark, manufacturer, or otherwise does not necessarily constitute or imply its endorsement, recommendation, or favoring by the United States Government or any agency thereof. The views and opinions of authors expressed herein do not necessarily state or reflect those of the United States Government or any agency thereof.