
Pilkington Decorative Glass Range Pilkington Texture Glass ...
Upload
dorothy-bookerCategory
view
215download
1
ContributorsPaul Pilkington, Sara Roberts, Alice Walsh
Adapted by Dave Jenner for East Midlands PHI&I Training Course 2009
Introduction to epidemiology

What is Epidemiology?
“the study of the distribution, frequency and determinants of health problems and disease in human populations”
The unit of interest is the population.
Epidemiology ...
.... allows the distribution of health and ill-health in a population to be described in terms of
– WHAT is the problem and its frequency?– WHO is affected?– WHERE and WHEN does it occur?– WHY does it occur in this particular
population?
Types of epidemiology and their uses
1. Descriptive epidemiology• Describing patterns and trends in health and
disease in populations
2. Analytical epidemiology • Examining associations and causation
3. Experimental epidemiology • Testing population interventions
Purpose of epidemiology
“To obtain, interpret and use health information to promote health and reduce disease”
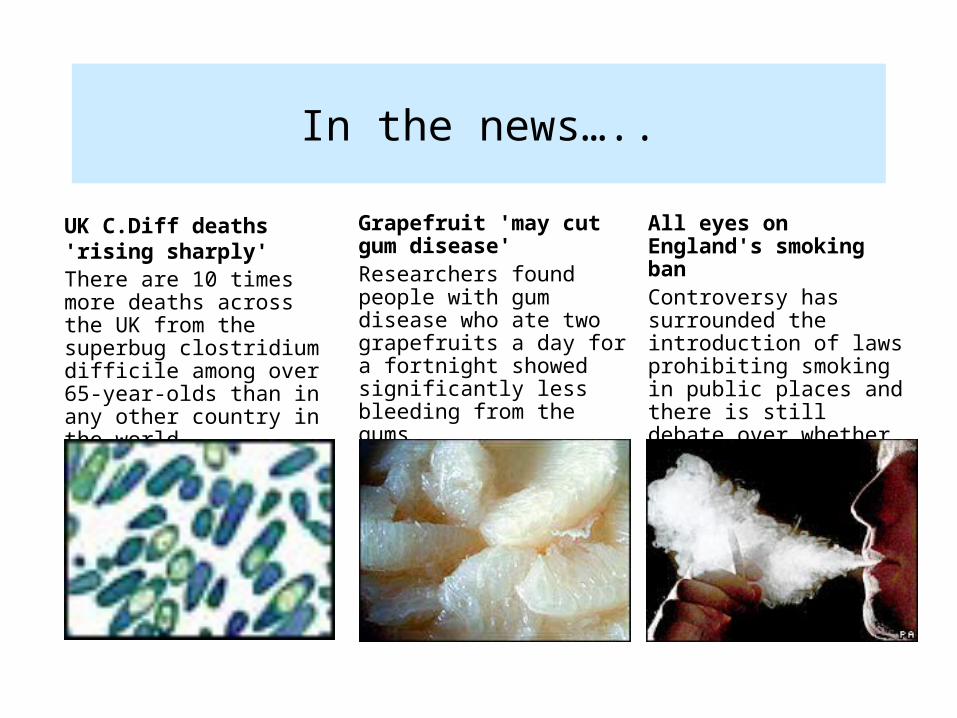
In the news…..
UK C.Diff deaths 'rising sharply'There are 10 times more deaths across the UK from the superbug clostridium difficile among over 65-year-olds than in any other country in the world.
Grapefruit 'may cut gum disease' Researchers found people with gum disease who ate two grapefruits a day for a fortnight showed significantly less bleeding from the gums.
All eyes on England's smoking ban Controversy has surrounded the introduction of laws prohibiting smoking in public places and there is still debate over whether they work.

Descriptive Epidemiology:PERSON, TIME, PLACE
• Person: Variations in health by age, sex, ethnicity, occupation, leisure interests...
• Time: Trends, seasonal variations, cohort effects…
• Place: Variations between geographical areas – local, national, international…

Descriptive epidemiology
• Often makes use of routinely collected data, e.g. death certification data, hospital episode statistics, infectious disease notifications
• May require special surveys
• Can’t answer ‘why?’ but can raise hypotheses about causes
• Can often provide sufficient information for public health action to be taken
Descriptive Epidemiology: Example 1
E coli O157 in Cornwall
Summer 2004
Several cases over a short period

Analysis by person, time, place
0123456789
10
01/0
8/20
04
02/0
8/20
04
03/0
8/20
04
04/0
8/20
04
05/0
8/20
04
06/0
8/20
04
07/0
8/20
04
08/0
8/20
04
09/0
8/20
04
10/0
8/20
04
11/0
8/20
04
12/0
8/20
04
13/0
8/20
04
14/0
8/20
04
15/0
8/20
04
16/0
8/20
04
17/0
8/20
04
18/0
8/20
04
19/0
8/20
04
20/0
8/20
04
21/0
8/20
04
22/0
8/20
04
23/0
8/20
04
24/0
8/20
04
25/0
8/20
04
26/0
8/20
04
27/0
8/20
04
28/0
8/20
04
29/0
8/20
04
30/0
8/20
04
31/0
8/20
04
01/0
9/20
04
onset date
nu
mb
er o
f n
oti
fied
cas
es
PT 21/28 secondary case (not all confirmed)
other PT
PT 21/28 primary case
Place: they had all visited the same beach and played in the same stream
Person: they were all young children visiting Cornwall on holiday
Time
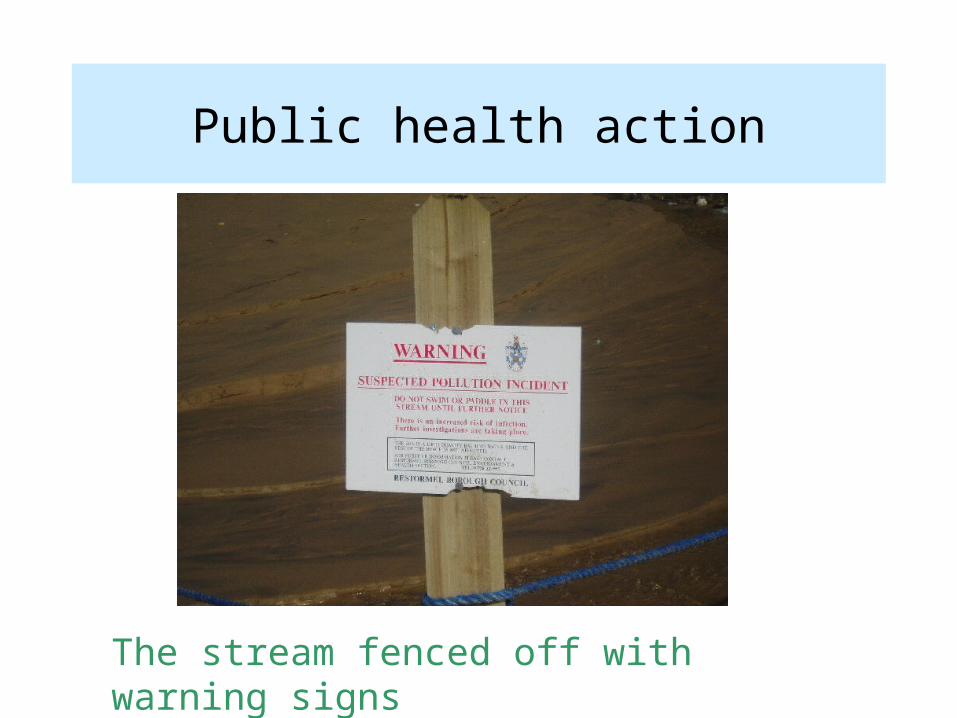
Public health action
The stream fenced off with warning signs

Descriptive Epidemiology: Example 2
Why might death rates in the UK be high?

Descriptive epidemiology: applications
studying the frequency and distribution of disease
to generate hypotheses about causes(the academic focus)
to inform local public health action(the service focus)

In the news…..
Blood pressure cases 'to top 1bn'
High blood pressure is out of control around the world, with the number of sufferers expected to exceed a billion within 20 years, experts warn.
One in four adults already has the condition, which increases the risk of heart disease, stroke and death.
“... in practice the boundaries of almost all diseases are unclear, and a full range of severity exists from the hardly perceptible to the catastrophic. Establishing what will be counted as a “case” ... can have enormous impacts on the numbers included.”
Oxford Handbook of Public Health Practice
Descriptive Epidemiology:
what counts as a case?
Measures of disease frequency
The two main measures of disease frequency are:– Incidence– Prevalence

What is incidence?
The incidence is the number of NEW CASES of disease that develop in a population during a specified time period
Usually expressed as the number of new cases per 100,000 population per year.
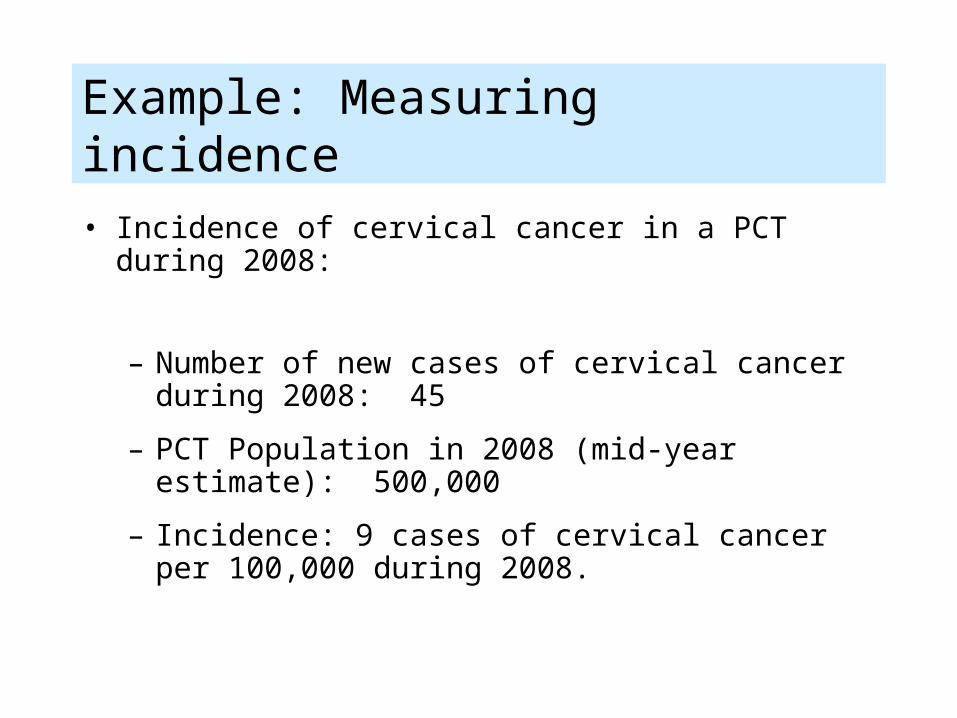
Example: Measuring incidence
• Incidence of cervical cancer in a PCT during 2008:
– Number of new cases of cervical cancer during 2008: 45
– PCT Population in 2008 (mid-year estimate): 500,000
– Incidence: 9 cases of cervical cancer per 100,000 during 2008.

What is prevalence?
Prevalence is the total number of cases of disease in a population at one point in time, taken as a proportion of the total number of persons in that population.
Also referred to as “point prevalence”
N.B. Period prevalence is a variation which represents the number of persons who were a case at any time during a specified (short) period as a proportion of the total number of persons in that population.
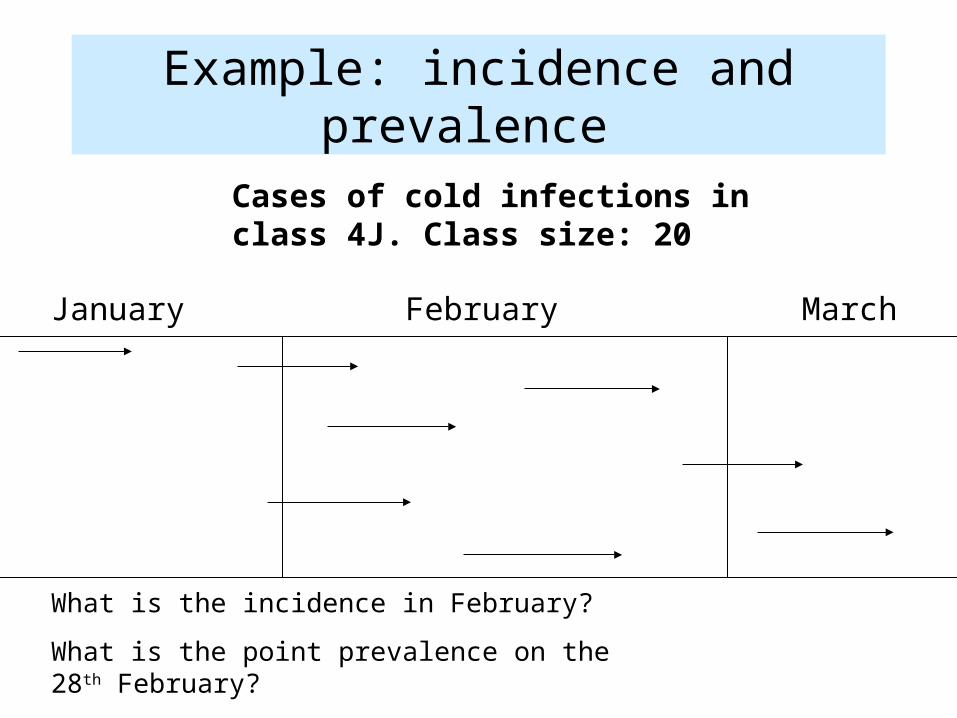
Example: incidence and prevalence
Cases of cold infections in class 4J. Class size: 20
January February March
What is the incidence in February?
What is the point prevalence on the 28th February?
What is the period prevalence during February?
incidence and prevalence
incidence:the number of new cases of disease per n of population occurring in a specified time period
prevalence:the number of persons with disease at one point in time as a proportion of the total number of persons in that population.

Why might the prevalence of a condition appear to have changed?
0
10
20
30
40
50
60
70
80
90
100
1860
1870
1880
1890
1900
1910
1920
1930
1940
1950
1960
1970
1980
1990
2000
rate
per
100
,000
po
pn
New diagnostic technique
Increased incidence following increased exposure to a causal factor
Improved treatment resulting in longer survival time
High profile case, raises awareness
Changed surveillance system – broadens the definition of a case
Improved treatment – resulting in cure for some

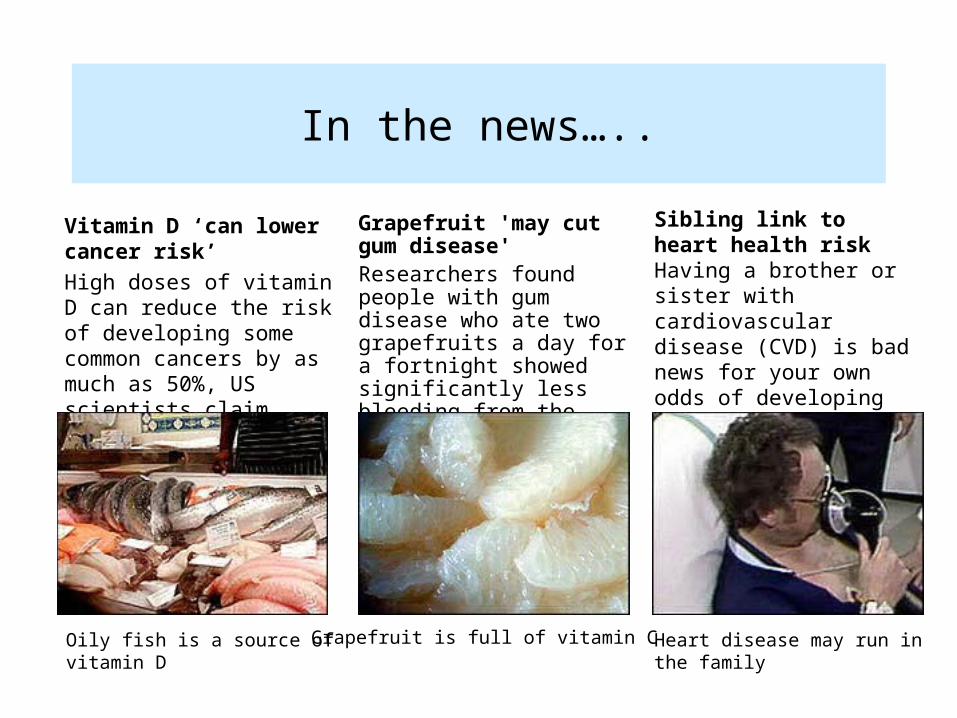
In the news…..
Vitamin D ‘can lower cancer risk’
High doses of vitamin D can reduce the risk of developing some common cancers by as much as 50%, US scientists claim.
Grapefruit 'may cut gum disease' Researchers found people with gum disease who ate two grapefruits a day for a fortnight showed significantly less bleeding from the gums.
Oily fish is a source of vitamin D Grapefruit is full of vitamin C
Sibling link to heart health risk Having a brother or sister with cardiovascular disease (CVD) is bad news for your own odds of developing problems, research has found.
Heart disease may run in the family

Analytical epidemiology
Descriptive epidemiology
+
Focus on cause and effect
=
“analytical epidemiology”

Example: John Snow
• John Snow, physician(1813-1858)
• Outbreaks of Cholera were common in London during the 19th century
• But what was causing the cholera? The popular theory at the time was that bad gases caused it (‘miasma’ theory)

What did he do?
•Analysis by place: he mapped the cases – most were near Broad Street
Anecdote: People had complained that the water smelt bad. Cases from further afield had water delivered by cart from Broad Street.

What did he do?
•Recorded deaths by water supplier
Conclusion: Risk of infection is highest in people using water Southwark and Vauxhall water company .
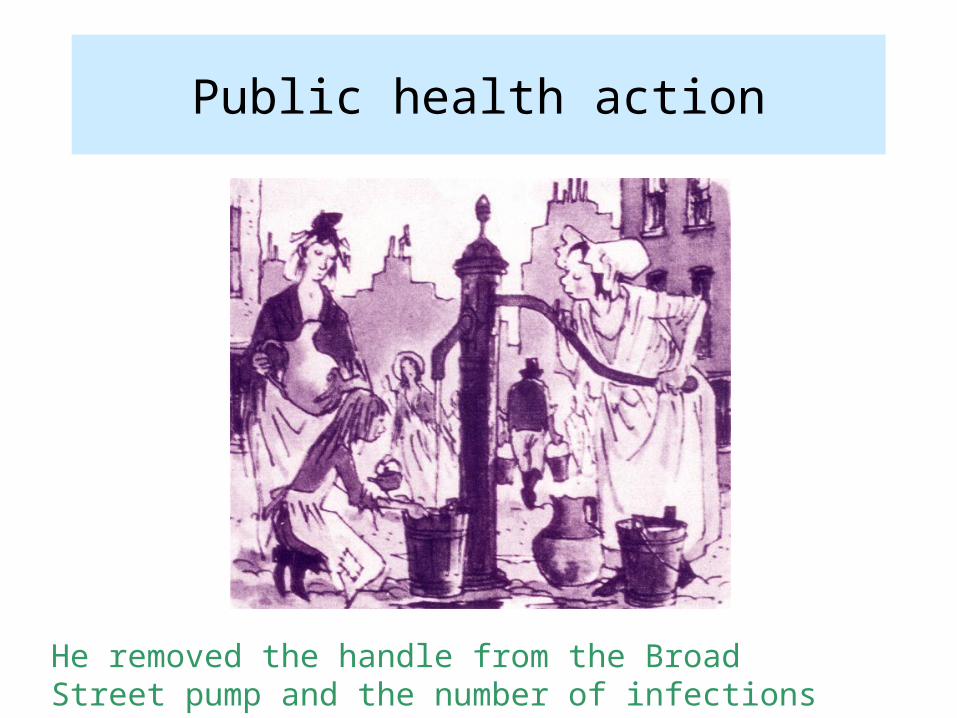
Public health action
He removed the handle from the Broad Street pump and the number of infections fell.
Analytical epidemiology:common study designs
• Cross-sectional study
• Case control study
• Cohort study

Analytical epidemiology:
Cross-sectional study - Example 1
• Information on health and other characteristics is collected
from each subject in a population at one point in time.
• Example - the prevalence of cough
– collect data on the health problem: cough (yes/no)
– collect data (in same individuals) on possible determinants:
• damp housing (yes/no)
• smoker (yes/no)
• smoker (number of cigarettes per day)
– statistical tests of association
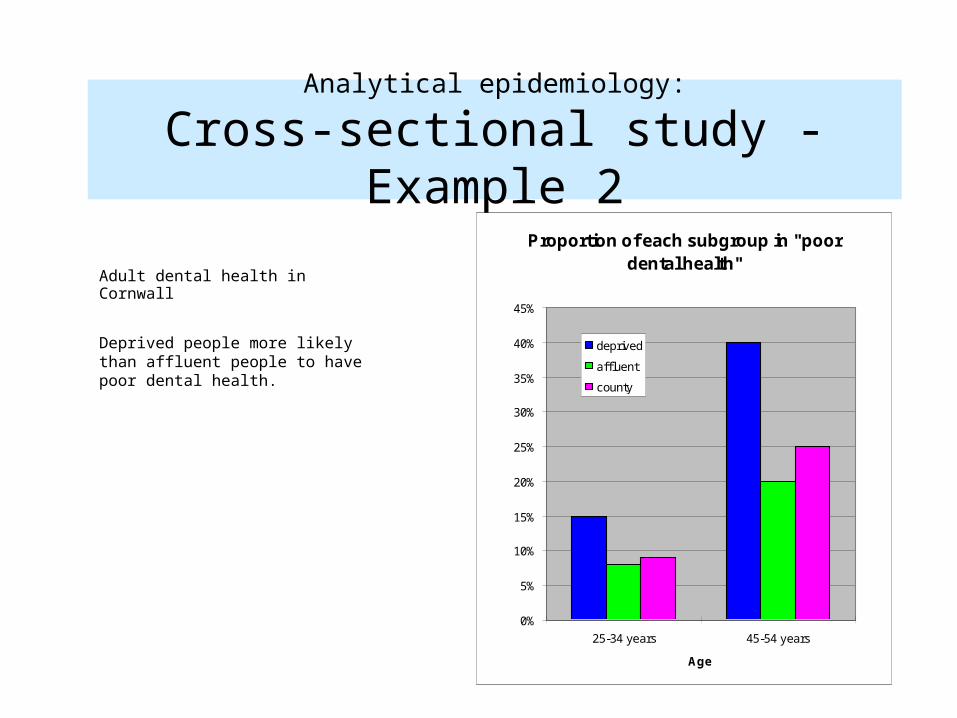
Adult dental health in Cornwall
Deprived people more likely than affluent people to have poor dental health.
Analytical epidemiology:
Cross-sectional study - Example 2
Proportion of each subgroup in "poor dental health"
0%
5%
10%
15%
20%
25%
30%
35%
40%
45%
25-34 years 45-54 years
Age
deprived
aff luent
county

Why do deprived groups have poorer dental health?
A cross-sectional study might focus on dental health and ....
– fluoridation of water supply– diet– personal dental hygiene– uptake of dental care
Analytical epidemiology:
Cross-sectional study - Example 2
• Compares people with a condition (cases) to a similar group of people without the condition (controls).
• The aim is to try and identify the risk factors which may have caused the cases to get the condition in the first place.
Analytical epidemiology:
Case-control studies

Investigation of an outbreak of Salmonella in S.E.Wales
– Two groups: Group 1 ill, Group 2 not ill– Examination of diet and behaviour during the 3
days before illness.– Those who were ill were found to have been 4.5x
more likely to have eaten sliced ham than those who were not ill.
– Further investigations revealed that those who were ill were 25x more likely to have eaten ham supplied by “producer A”.
Analytical epidemiology:
Case-control study - Example

• Follow up two groups of people over time and compare the occurrence of disease.
• One group has been exposed to a possible risk factor for the disease, while the other has not (the control group).
• The exposure is the starting point, the disease is the outcome of interest
Analytical epidemiology:
Cohort studies

• Does being exposed to asbestos cause respiratory cancer?
• Asbestos miners were followed up for 6 years. These were compared to the control group.
• Asbestos miners were 50% more likely to die of mesothelioma (a respiratory cancer) than the control group.
Analytical epidemiology:
Cohort study - Example

Beware ...
An ASSOCIATION between a risk factor (e.g. history of exposure to a substance) and a disease
DOES NOT NECESSARILY INDICATE
a CAUSAL relationship

evidence for causality comes from criteria such
as ...
• Strength of association• Consistency of findings• Temporal relationship • Geographical distribution • Dose-response relationship • Biological plausibility• Reversibility
adapted from Bradford Hill’s Criteria for Causation
Experimental epidemiology
• Testing the effectiveness of population health interventions

Randomised Controlled Trial
Didgeridoo playing as alternative treatment for obstructive sleep apnoea syndrome: randomised controlled trial. Reported in BMJ Dec 2005.
•25 adults with obstructive sleep apnoea, randomised to didgeridoo instructions and daily practice for 4 months (14), or placing on the waiting list for lessons (11).
•Didgeridoo players reported less daytime sleepiness and their partners reported less night time disturbance , compared with waiting list group.

Controlled Trials of Community Interventions

Horses for courses
what is the cause of ...?
is there a link between ... ?
how effective is ...?
how many people are affected by ...?

Conclusions
• Epidemiology is a core part of public health.
• It allows the distribution of health and ill-health in a population to be described, and possible causal factors to be identified.
• It enables public health professionals to understand health problems and take appropriate action.

What we have covered:
• What is epidemiology and what are its uses?
• Descriptive epidemiology• Incidence and prevalence• Analytical epidemiology
– types of studies– association and causation
• Experimental epidemiology
References
• Medical statistics at a glance – Petrie and Sabin. Blackwell.
• Epidemiology in Medicine – Charles Hennekins. Little, Brown and Company.
• Epidemiology for the uninitiated – G.Rose and D.Barker.
• Health Knowledge website http://www.healthknowledge.org.uk