Contributions to World GDP growth (y/y), % Economic and ...
21
June 2016 For professional investors only 1 Schroders Economic and Strategy Viewpoint Keith Wade Chief Economist and Strategist (44-20)7658 6296 Azad Zangana Senior European Economist and Strategist (44-20)7658 2671 Craig Botham Emerging Markets Economist (44-20)7658 2882 Forecast update and scenarios: rising political risk (page 2) An improvement in the outlook for Europe helps keep global growth on track in the coming year despite downgrades to our forecasts for the US and Japan. Inflation is set to pick up on the back of higher oil prices, but the impact is offset in some economies by weaker core rates. Both the Federal Reserve (Fed) and Bank of England (BoE) are expected to tighten this year, but rate rises will be tempered by a limited pick-up in wages. We introduce two new scenarios: “Trade wars” and “Brexit shakes the EU” to reflect the increase in political risk in the world economy. The balance of probabilities is still skewed toward weaker growth, but by less than in Q1 as a result of the reduced risk of a China hard landing or US recession. Eurozone growth upgraded as UK slows on Brexit fears (page 7) Better-than-expected growth data for the Eurozone have prompted upward revisions to our forecast. However, inflation remains too low for comfort and suggests the recovery still has some way to go. The UK seems to be too busy arguing over Brexit, causing growth to slow as companies take fright. The economy should rebound strongly in the second half of 2016 if the UK votes to remain, but 2017 should see even slower growth as fiscal austerity resumes. Emerging markets: looking on the bright side (page 12) Though 2016 is likely to be another tough year for the BRIC economies, there are signs that 2017 will see an improvement, overall. The worst is probably behind us in Russia and Brazil. China though will continue to slowdown, but avoid crisis for now. Views at a glance (page 18) A short summary of our main macro views and where we see the risks to the world economy Chart: World GDP forecast Source: Thomson Datastream, Schroders Economics Group. 23 May 2016. Please note the forecast warning at the back of the document. 4.9 2.6 3.1 3.8 4.9 4.5 5.1 5.1 2.3 -1.0 4.8 3.5 2.6 2.5 2.8 2.5 2.5 2.7 -3 -2 -1 0 1 2 3 4 5 6 00 01 02 03 04 05 06 07 08 09 10 11 12 13 14 15 16 17 Contributions to World GDP growth (y/y), % US Europe Japan Rest of advanced BRICS Rest of emerging World Forecast
Transcript of Contributions to World GDP growth (y/y), % Economic and ...
June 2016 For professional investors only
1
Schroders
Economic and Strategy Viewpoint
Keith Wade Chief Economist and Strategist (44-20)7658 6296
Azad Zangana Senior European Economist and Strategist (44-20)7658 2671
Craig Botham Emerging Markets Economist (44-20)7658 2882
Forecast update and scenarios: rising political risk (page 2)
An improvement in the outlook for Europe helps keep global growth on track in the coming year despite downgrades to our forecasts for the US and Japan. Inflation is set to pick up on the back of higher oil prices, but the impact is offset in some economies by weaker core rates. Both the Federal Reserve (Fed) and Bank of England (BoE) are expected to tighten this year, but rate rises will be tempered by a limited pick-up in wages.
We introduce two new scenarios: “Trade wars” and “Brexit shakes the EU” to reflect the increase in political risk in the world economy. The balance of probabilities is still skewed toward weaker growth, but by less than in Q1 as a result of the reduced risk of a China hard landing or US recession.
Eurozone growth upgraded as UK slows on Brexit fears (page 7)
Better-than-expected growth data for the Eurozone have prompted upward revisions to our forecast. However, inflation remains too low for comfort and suggests the recovery still has some way to go.
The UK seems to be too busy arguing over Brexit, causing growth to slow as companies take fright. The economy should rebound strongly in the second half of 2016 if the UK votes to remain, but 2017 should see even slower growth as fiscal austerity resumes.
Emerging markets: looking on the bright side (page 12)
Though 2016 is likely to be another tough year for the BRIC economies, there are signs that 2017 will see an improvement, overall. The worst is probably behind us in Russia and Brazil. China though will continue to slowdown, but avoid crisis for now.
Views at a glance (page 18)
A short summary of our main macro views and where we see the risks to the world economy
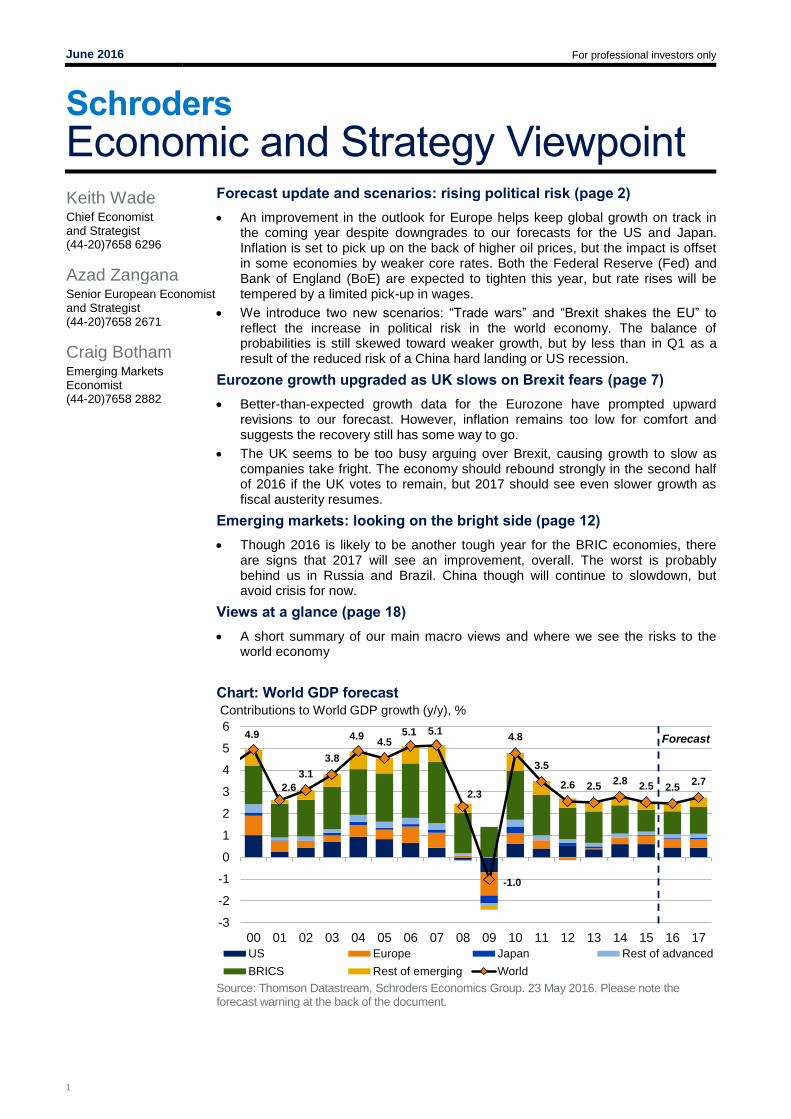
Chart: World GDP forecast
Source: Thomson Datastream, Schroders Economics Group. 23 May 2016. Please note the forecast warning at the back of the document.
4.9
2.6
3.1
3.8
4.94.5
5.1 5.1
2.3
-1.0
4.8
3.5
2.6 2.52.8
2.5 2.52.7
-3
-2
-1
0
1
2
3
4
5
6
00 01 02 03 04 05 06 07 08 09 10 11 12 13 14 15 16 17
Contributions to World GDP growth (y/y), %
US Europe Japan Rest of advanced
BRICS Rest of emerging World
Forecast

June 2016 For professional investors only
2
Forecast update and scenarios: rising political risk
Europe keeps global growth on track following downgrades to the US and Japan
Inflation forecasts steady as lower core offsets higher oil prices
After a series of downgrades, our forecast for global growth in 2016 is unchanged. Reductions in our projections for the US and Japan are offset by increases to the Eurozone and China to leave our overall growth projection at 2.5%. Much of this reflects base effects from the first quarter with the US and Japan disappointing whilst European growth has been surprisingly resilient. Going forward though we still see growth picking up in the current quarter as companies gradually clear the inventory overhang built up at the end of last year and final demand improves. True to form the US seems to be enjoying a second quarter bounce led by retail sales and housing. Broadly speaking the business surveys indicate a turn in industrial activity, but it must be said that the level of global activity is still weak and best described as tepid (chart 1).
Chart 1: Global indicator turns up, but remains tepid
Source: Thomson Datastream, Schroders Economics Group, 26 May 2016.
Rising oil prices have pushed up market inflation expectations (chart 2) and with the forward oil curve now projecting higher prices than last quarter, we have raised our inflation forecasts for the US.
Chart 2: Oil price lifts inflation expectations
Source: Thomson Datastream, Schroders Economics Group, 26 May 2016.
Elsewhere though, the inflation picture is generally more subdued than before as the impact of higher oil prices is diluted by taxes and subsidies, whilst core rates
-2.0
-1.5
-1.0
-0.5
0.0
0.5
1.0
1.5
2.0
-8
-6
-4
-2
0
2
4
6
8
1985 1990 1995 2000 2005 2010 2015
G7 industrial production y/y% Global activity indicator, rhs
1.0
1.2
1.4
1.6
1.8
2.0
2.2
2.4
2.6
2.8
20
40
60
80
100
120
140
2011 2012 2013 2014 2015 2016
Crude Oil-Brent U$/BBL US TIPS - 10 year breakeven inflation rate, rhs

June 2016 For professional investors only
3
US Federal Reserve to hike in September and December
have been coming in below expectations. This is the case in the Eurozone and Japan where our inflation forecasts have been trimmed. In Japan the assumed postponement of the consumption tax increase also reduces our inflation forecast for 2017.
On balance, global inflation is forecast to rise to 2.2% this year (from 1.8% in 2015) and to 2.4% in 2017. The forecast for next year is partly influenced by the forward profile of oil prices (the oil curve is higher but less steep) and by our view that we will not see significant second round effects from higher inflation into wages.
This is critical given that unemployment rates are running at low levels. However, the experience of recent cycles has been that wages have become less responsive to changes in unemployment, a phenomena known as the flat Phillips curve. Increased globalisation and the rise of China, combined with factors such as the reduction in trade unionism account for much of this shift. More recently studies find that average wages are being suppressed by demographic factors as baby boomers retire and are replaced by younger workers. The more senior group tend to be better paid than the latter resulting in a decline in aggregate pay.
We are also aware of the long lags between activity and inflation. For example, for the US the slowdown in activity over the past 18 months will weigh on core inflation over the forecast period (see chart 3).
Chart 3: Long lags: slower growth will weigh on US core inflation
Source: Thomson Datastream, Schroders Economics Group, 26 May 2016.
Monetary policy: the Fed in an election year
Although a US rate rise in June remains a possibility we now expect Fed Chair Janet Yellen and company to delay their next move until September. The absence of significant wage pressure and concerns over a tightening of monetary conditions via the dollar account for the delay. We still expect the Fed funds rate to rise in two steps to 1% by end 2016 and by a further two hikes to 1.5% by end 2017.
We recognise that the 21 September Federal Open Market Committee (FOMC) meeting will be close to the presidential election date (8 November), however evidence suggests that the likelihood of a Fed rate change does not significantly decrease in the run up to a presidential election. There have been periods when the Fed has stopped hiking ahead of a presidential election, but this seems to have been unaffected by the impending vote as they did not resume tightening after the election. Looking at data since 1971, history suggests presidential campaigns have not had a significant effect on Federal Reserve policy actions. As shown below, the difference in the probability of Fed policy action in and out
-6
-4
-2
0
2
4
6
8
0.5
1.0
1.5
2.0
2.5
3.0
3.5
95 97 99 01 03 05 07 09 11 13 15 17
Recession Core CPI US GDP, 6q lag, rhs
y/y % y/y %

June 2016 For professional investors only
4
ECB and BoJ to ease further, but BoE to raise rates in November after a vote to remain in the EU
New scenarios: Trade wars and Brexit shakes Europe reflect rising political risk
of election years is very small (table 1).
Table 1: Federal Reserve policy changes in and out of election years:
Non-election year Election year Difference
Probability of a change in policy
August 41% 36% -5%
September 35% 27% -8%
October 32% 36% 4%
November 38% 45% 7%
Source: Thomson Datastream, Schroders Economics Group, 23 May 2016 (based on monthly data since 1971). Please note the forecast warning at the back of the document.
Meanwhile, we look for the European Central Bank (ECB) to cut the deposit rate again in September, taking it to -0.5%, where it stays through 2017. The Bank of Japan (BoJ) is no longer expected to take rates lower following the adverse reaction to their move into negative territory in January. Fiscal support in the run up to the upper house elections in July and the further delay in the consumption tax relieve some of the pressure on the BoJ. However, we do expect them to start experimenting with helicopter money drops towards the end of the forecast period in 2017 in a renewed effort to stimulate growth in a moribund economy.
Currency wise we still look for the US dollar (USD) to strengthen against the euro, but the US unit now has a weaker profile against the Japanese yen (JPY), Chinese yuan (CNY) and sterling (GBP) in 2016. Although the interest rate differential will move further in favour of the US, past experience suggests that other factors such as the current account position come into play after the Fed has started tightening. The GBP is expected to benefit from a vote to remain in the EU in the referendum on 23 June, although this means that the BoE is expected to raise rates in November.
Scenario analysis
We have made some significant changes to our scenarios this quarter. Political risks have risen and in response we are adding in a “Trade wars” scenario and a “Brexit shakes Europe” scenario.
The former is based on the election of Donald Trump as president of the US, which brings a significant increase in tariffs on imported goods. Mr Trump has consistently targeted China and companies who have outsourced supply chains overseas. Expect a Trump administration to increase trade barriers and for rapid retaliation from those that have been hit, with the result that global trade contracts whilst inflation is pushed higher.
The second new scenario follows from a UK vote to exit the EU, which galvanises anti-EU support across Europe and results in a number of similar referenda across the continent. The resulting increase in uncertainty slows growth as companies postpone major investments and households delay purchases of big ticket items, much as we are seeing in the UK currently.
In terms of their impact on global activity, both new scenarios are ultimately seen as stagflationary. In the “Trade wars” scenario this is clear cut as higher inflation from tariff increases makes goods more expensive and hence reduces the volume of transactions. At a higher level, the allocation of resources will also be less efficient resulting in weaker growth and higher prices.
The impact of the “Brexit shakes Europe” scenario is more complex: the initial shock is deflationary as European domestic demand falls, but this then gives way to higher inflation in Europe as the GBP and EUR depreciate significantly. Softer commodity prices result in weaker currencies and higher inflation in the emerging markets. At the global level, this is mildly stagflationary, but we would see this

June 2016 For professional investors only
5
China hard landing and US recession risks remain, but are reduced
scenario as being deflationary for economies like the US and Japan with the key takeaway being one of weaker global growth.
On the deflationary side we have retained “China hard landing” and “US recession”. The former is now driven by a wave of debt defaults and the seizing up of the banking system, rather than via an equity market collapse as before. Investors are currently focused on the extraordinary growth of debt in China and are asking how this can be unwound without a crisis. Meanwhile, the US recession scenario is still driven by the slowdown in profits growth which feeds through into weaker capital spending and employment.
We have dropped the deflationary “Emerging markets (EM) defaults emerge” scenario. Although the risk remains, the number of defaults has been slow to materialise as governments have intervened and the pressure on many companies is now being relieved by the rally in commodity prices.
Note that the “Currency wars return” scenario has moved from the deflationary to the stagflationary box as a result of the change of time horizon (chart 4). Initially deflationary as a result of the increase in financial market volatility, the scenario becomes more stagflationary as inflation rises through weaker currencies. As with the “Brexit shakes EU” scenario, we would characterise this as more deflationary with currency moves generally cancelling each other out, while global activity suffers from increased uncertainty and financial market volatility as countries pursue beggar-thy-neighbour currency moves.
On the reflationary side we retain the “US wages accelerate” and “Global reflation” scenarios. The latter reflects a coordinated fiscal stimulus to growth by the major economies along the lines being called for by the International Monetary Fund (IMF) and Japan ahead of the recent G7 summit.
Arguably we could have dropped the “Wages accelerate” scenario given the lack of progress in this area. However, the US labour market remains tight and higher headline inflation is likely to raise inflation expectations as we have already seen in the financial markets. We are assuming a modest wage acceleration in the baseline and this scenario pushes that further with US wages, currently running at just over 2.5% for average hourly earnings, picking up to a 4% pace by end-2016 and 5% by end-2017. Note that although categorised as reflationary, this scenario is ultimately stagflationary as the Fed tighten more aggressively (raising rates to 3% by end 2017). See chart 4 for the impact of the scenarios relative to the base on global activity in 2017 and for fuller descriptions see page 19.
Chart 4: Impact of scenarios on growth and inflation versus base
Source: Schroders Economics Group, 23 May 2016. Please note the forecast warning at the back of the document.
Currency wars return
Global reflation
US recessionChina hard landing
Trade wars
Baseline
US wages accelerate
Brexit shakes Europe
-1.0
-0.5
+0.0
+0.5
+1.0
-1.5 -1.0 -0.5 +0.0 +0.5 +1.0 +1.5
201
7 I
nfla
tio
n v
s.
base
line f
ore
ca
st
2017 Growth vs. baseline forecast
Stagflationary Reflationary
Productivity boostDeflationary
June 2016 For professional investors only
6
Balance of probabilities skewed toward weaker growth, but by less than in Q1
Balance of probabilities
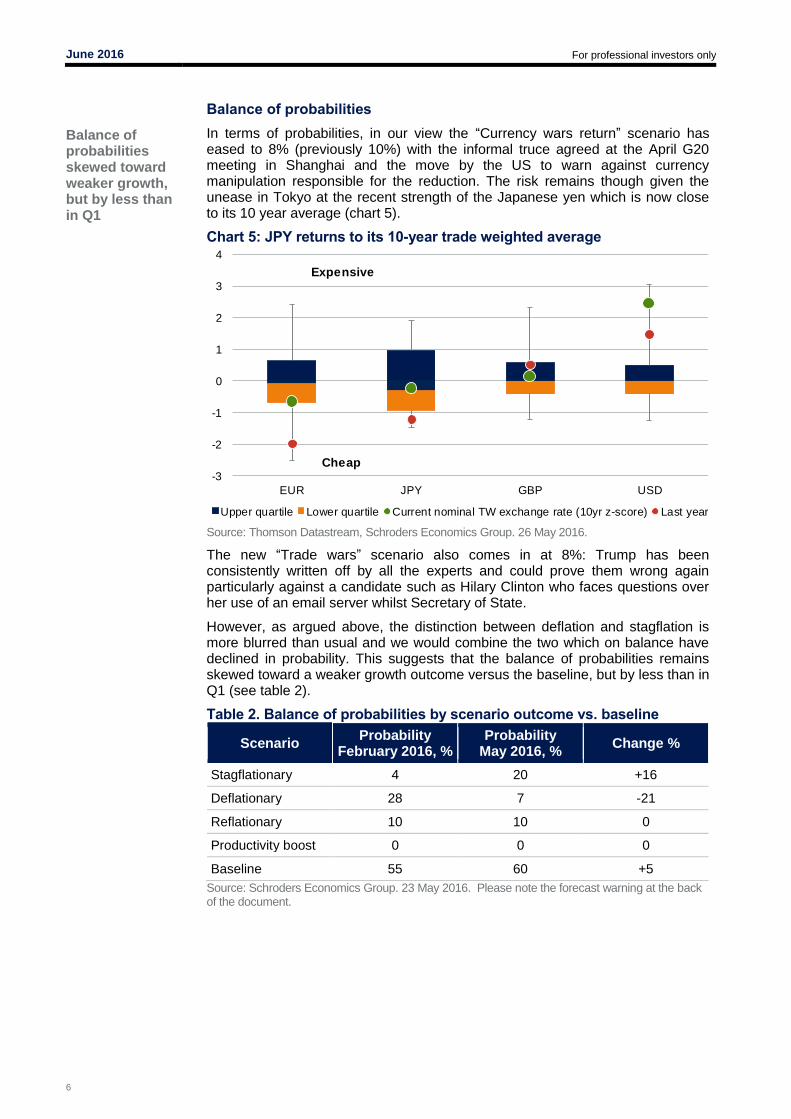
In terms of probabilities, in our view the “Currency wars return” scenario has eased to 8% (previously 10%) with the informal truce agreed at the April G20 meeting in Shanghai and the move by the US to warn against currency manipulation responsible for the reduction. The risk remains though given the unease in Tokyo at the recent strength of the Japanese yen which is now close to its 10 year average (chart 5).
Chart 5: JPY returns to its 10-year trade weighted average
Source: Thomson Datastream, Schroders Economics Group. 26 May 2016.
The new “Trade wars” scenario also comes in at 8%: Trump has been consistently written off by all the experts and could prove them wrong again particularly against a candidate such as Hilary Clinton who faces questions over her use of an email server whilst Secretary of State.
However, as argued above, the distinction between deflation and stagflation is more blurred than usual and we would combine the two which on balance have declined in probability. This suggests that the balance of probabilities remains skewed toward a weaker growth outcome versus the baseline, but by less than in Q1 (see table 2).
Table 2. Balance of probabilities by scenario outcome vs. baseline
Scenario Probability
February 2016, % Probability
May 2016, % Change %
Stagflationary 4 20 +16
Deflationary 28 7 -21
Reflationary 10 10 0
Productivity boost 0 0 0
Baseline 55 60 +5
Source: Schroders Economics Group. 23 May 2016. Please note the forecast warning at the back of the document.
-3
-2
-1
0
1
2
3
4
EUR JPY GBP USD
Upper quartile Lower quartile Current nominal TW exchange rate (10yr z-score) Last year
Expensive
Cheap

June 2016 For professional investors only
7
Eurozone growth upgraded as UK slows on Brexit fears
Eurozone growth was better than expected in Q1…
Better-than-expected growth numbers out of Europe have lifted sentiment, but disappointing inflation data suggest there is still a long way to go before the monetary union is out of the woods. Meanwhile, the UK’s upcoming referendum on its membership of the EU appears to have hit confidence and slowed growth.
Eurozone growth surprises to the upside
Eurozone GDP growth jumped to 0.5% in the first quarter compared to 0.3% in both the third and fourth quarters of 2015. The acceleration in growth comes as a surprise as most business surveys over the first quarter suggested a slowdown due to external weakness. Although not yet confirmed, it appears domestic demand remained resilient, while the drag from overseas trade eased.
Within member states, Germany saw its growth rate rise from 0.3% to 0.7% (chart 6), as domestic demand held steady, but the negative contribution from net trade moderated. Investment growth accelerated over the quarter while household consumption remained robust. German exports recovered from the contraction seen over the fourth quarter, but imports rose more sharply (reflecting the stronger domestic demand) resulting in another quarter where net trade proved a headwind to growth.
Elsewhere, French GDP rebounded in the first quarter to 0.6% growth from 0.3% in the fourth quarter of 2015, and against consensus expectations of a smaller pickup of 0.4%. We had expected such a bounce back as activity had appeared to slow in reaction to the Paris terrorist attacks last year. Indeed, the main improvement in the latest data was due to an acceleration in consumption and business investment growth. It also means that if confidence has now recovered from the events of last year, we should see growth moderate over the rest of this year, rather than this pace of growth being maintained. In a similar fashion to France, we suspect the terrorist attacks in Brussels and subsequent shut down of services may have contributed to the slowdown in Belgium in the first quarter. Activity should at least partially rebound in the second quarter.
…as most member states saw an improvement.
Chart 6: Eurozone growth accelerates in Q1
Source: Eurostat, Schroders Economics Group. 25 May 2016.
Spain also surprised to the upside by growing by 0.8% for the third consecutive quarter, despite a marked slowdown in manufacturing output over January and February. This bodes well for the rest of the year, although we do expect the annual growth rate to temper from its current rate of 3.4% to around 3% on the back of continued political uncertainty. Otherwise, Austria also surprised to the
-0.6
-0.4
-0.2
0.0
0.2
0.4
0.6
0.8
1.0
Gre Por Bel Ita UK Neth EZ19 Fra Aus Ger Spa
%, q/q
Q4 Q1
June 2016 For professional investors only
8
upside as growth accelerated to from 0.2% to 0.6% over the same period – its fastest quarterly growth rate since the start of 2015.
Eurozone inflation fails to rise
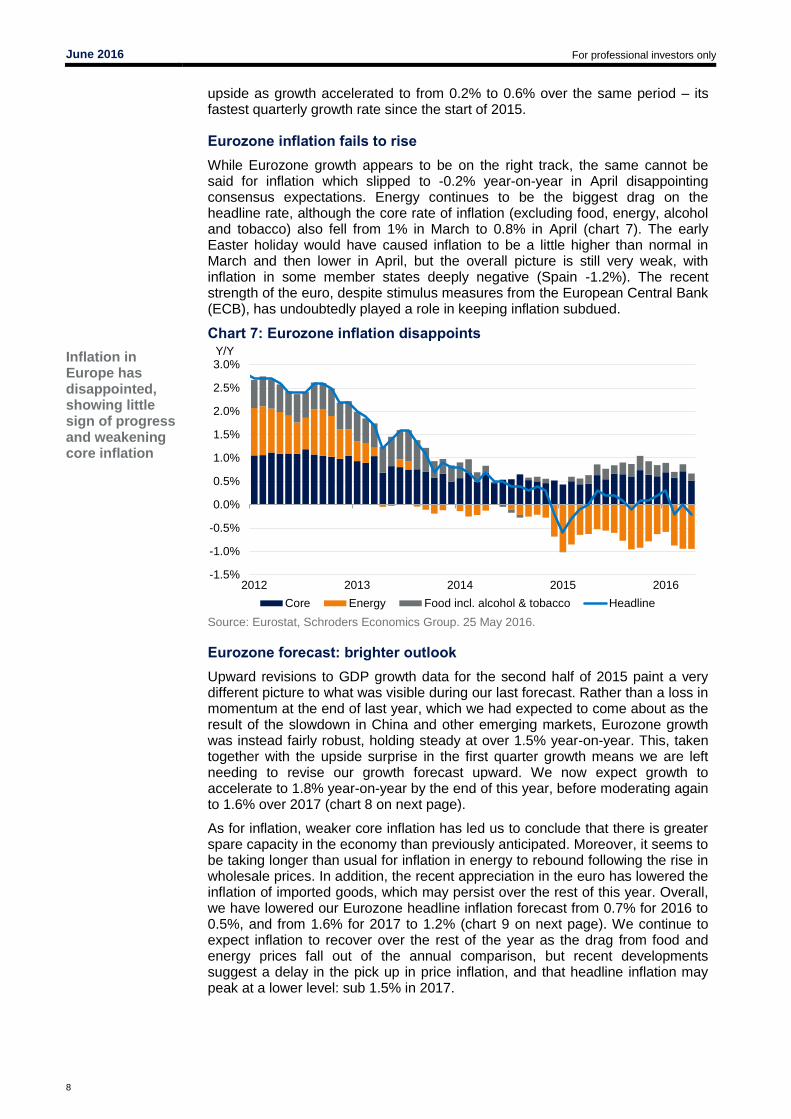
While Eurozone growth appears to be on the right track, the same cannot be said for inflation which slipped to -0.2% year-on-year in April disappointing consensus expectations. Energy continues to be the biggest drag on the headline rate, although the core rate of inflation (excluding food, energy, alcohol and tobacco) also fell from 1% in March to 0.8% in April (chart 7). The early Easter holiday would have caused inflation to be a little higher than normal in March and then lower in April, but the overall picture is still very weak, with inflation in some member states deeply negative (Spain -1.2%). The recent strength of the euro, despite stimulus measures from the European Central Bank (ECB), has undoubtedly played a role in keeping inflation subdued.
Inflation in Europe has disappointed, showing little sign of progress and weakening core inflation
Chart 7: Eurozone inflation disappoints
Source: Eurostat, Schroders Economics Group. 25 May 2016.
Eurozone forecast: brighter outlook
Upward revisions to GDP growth data for the second half of 2015 paint a very different picture to what was visible during our last forecast. Rather than a loss in momentum at the end of last year, which we had expected to come about as the result of the slowdown in China and other emerging markets, Eurozone growth was instead fairly robust, holding steady at over 1.5% year-on-year. This, taken together with the upside surprise in the first quarter growth means we are left needing to revise our growth forecast upward. We now expect growth to accelerate to 1.8% year-on-year by the end of this year, before moderating again to 1.6% over 2017 (chart 8 on next page).
As for inflation, weaker core inflation has led us to conclude that there is greater spare capacity in the economy than previously anticipated. Moreover, it seems to be taking longer than usual for inflation in energy to rebound following the rise in wholesale prices. In addition, the recent appreciation in the euro has lowered the inflation of imported goods, which may persist over the rest of this year. Overall, we have lowered our Eurozone headline inflation forecast from 0.7% for 2016 to 0.5%, and from 1.6% for 2017 to 1.2% (chart 9 on next page). We continue to expect inflation to recover over the rest of the year as the drag from food and energy prices fall out of the annual comparison, but recent developments suggest a delay in the pick up in price inflation, and that headline inflation may peak at a lower level: sub 1.5% in 2017.
-1.5%
-1.0%
-0.5%
0.0%
0.5%
1.0%
1.5%
2.0%
2.5%
3.0%
2012 2013 2014 2015 2016
Y/Y
Core Energy Food incl. alcohol & tobacco Headline

June 2016 For professional investors only
9
We have revised up our growth forecast for 2016. Inflation has been revised down for both 2016 and 2017.
The UK economy slowed unexpectedly in Q1…
…which may be due to fears over Brexit risks
Chart 8: Eurozone GDP forecast Chart 9: Eurozone inflation forecast
Source: Thomson Datastream, Schroders Economics Group. 23 May 2016. Previous forecast from February 2016. Please note the forecast warning at the back of the document.
The outlook for monetary policy is largely unchanged. While growth has been a little stronger than expected, inflation has been weaker, which should at some point prompt the ECB to look at adding additional stimulus. We suspect they will favour another cut in the deposit rate (assumed cut to -0.5% in September), although an extension of the ECB’s quantitative easing (QE) programme to beyond March 2017 is also possible. However, the extension of QE will largely depend on the take up of the new long-term refinancing operations (LTROs), which aim to provide banks with new liquidity at ultra-low and possibly even negative interest rates. The results of the take up will be published at the end of June.
UK forecast: Brexit distortions
The UK economy has seen a sudden slowdown in activity ahead of the crucial vote on its membership of the European Union. Quarterly real GDP growth fell from 0.6% at the end of 2015 to just 0.4% in the first quarter of the year. On a year-on-year basis, growth was down to 2% – the lowest annual growth rate for two years. Recent business surveys suggest nervousness amongst firms in the run up to the referendum, which may be prompting companies to postpone investment and hiring plans.
It is difficult to know how much of the slowdown in recent quarters is attributable to Brexit uncertainty, which the Bank of England (BoE) highlighted in its recent Inflation Report. If most of the slowdown is being caused by Brexit fears, then the economy should rebound strongly in the second half of the year (assuming the UK votes to remain in the EU). However, if other factors are weighing on growth, then these may not be obvious until later in the year, when growth would fail to bounce back.
In our view, we believe the Brexit referendum is likely to be responsible for most of the recent deceleration in growth, especially as most of the weakness has been seen in business investment and business activity. Households appear to have carried on as normal, with retail sales in April accelerating to over 4% real growth year-on-year.
As a result, we have changed the quarterly profile for the UK growth forecast to allow for a greater slowdown in the second quarter, but then a sharp rebound in the third quarter, followed by moderation from there on. Taken together with the upward revisions seen to the GDP figures for the second half of 2015 and we find our forecast unchanged at 1.9% for 2016 (chart 10).
0.5%
1.0%
1.5%
2.0%
i ii iii iv i ii iii iv i ii iii iv i ii iii iv
2014 2015 2016 2017
y/y
Current forecast Previous forecast
Real GDPforecast
-0.5%
0.0%
0.5%
1.0%
1.5%
2.0%
i ii iii iv i ii iii iv i ii iii iv i ii iii iv
2014 2015 2016 2017
y/y
Current forecast Previous forecast
HICP inflationforecast
June 2016 For professional investors only
10
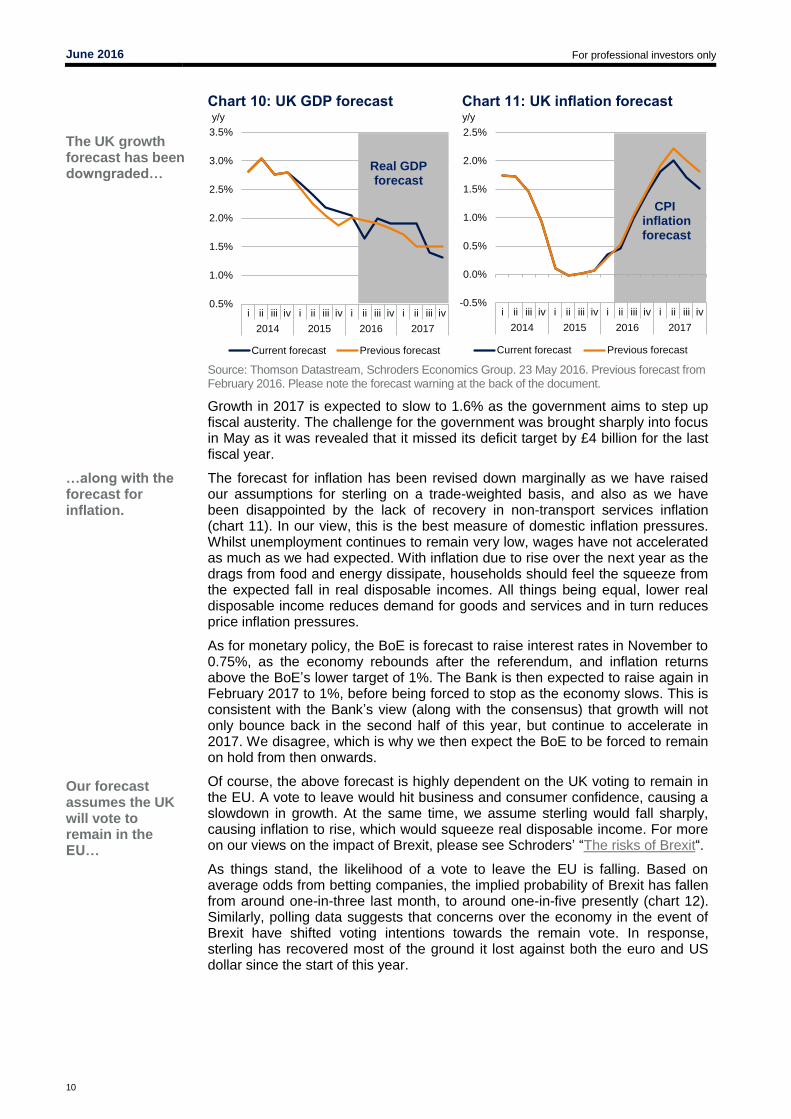
The UK growth forecast has been downgraded…
…along with the forecast for inflation.
Our forecast assumes the UK will vote to remain in the EU…
Chart 10: UK GDP forecast Chart 11: UK inflation forecast
Source: Thomson Datastream, Schroders Economics Group. 23 May 2016. Previous forecast from February 2016. Please note the forecast warning at the back of the document.
Growth in 2017 is expected to slow to 1.6% as the government aims to step up fiscal austerity. The challenge for the government was brought sharply into focus in May as it was revealed that it missed its deficit target by £4 billion for the last fiscal year.
The forecast for inflation has been revised down marginally as we have raised our assumptions for sterling on a trade-weighted basis, and also as we have been disappointed by the lack of recovery in non-transport services inflation (chart 11). In our view, this is the best measure of domestic inflation pressures. Whilst unemployment continues to remain very low, wages have not accelerated as much as we had expected. With inflation due to rise over the next year as the drags from food and energy dissipate, households should feel the squeeze from the expected fall in real disposable incomes. All things being equal, lower real disposable income reduces demand for goods and services and in turn reduces price inflation pressures.
As for monetary policy, the BoE is forecast to raise interest rates in November to 0.75%, as the economy rebounds after the referendum, and inflation returns above the BoE’s lower target of 1%. The Bank is then expected to raise again in February 2017 to 1%, before being forced to stop as the economy slows. This is consistent with the Bank’s view (along with the consensus) that growth will not only bounce back in the second half of this year, but continue to accelerate in 2017. We disagree, which is why we then expect the BoE to be forced to remain on hold from then onwards.
Of course, the above forecast is highly dependent on the UK voting to remain in the EU. A vote to leave would hit business and consumer confidence, causing a slowdown in growth. At the same time, we assume sterling would fall sharply, causing inflation to rise, which would squeeze real disposable income. For more on our views on the impact of Brexit, please see Schroders’ “The risks of Brexit“.
As things stand, the likelihood of a vote to leave the EU is falling. Based on average odds from betting companies, the implied probability of Brexit has fallen from around one-in-three last month, to around one-in-five presently (chart 12). Similarly, polling data suggests that concerns over the economy in the event of Brexit have shifted voting intentions towards the remain vote. In response, sterling has recovered most of the ground it lost against both the euro and US dollar since the start of this year.
0.5%
1.0%
1.5%
2.0%
2.5%
3.0%
3.5%
i ii iii iv i ii iii iv i ii iii iv i ii iii iv
2014 2015 2016 2017
y/y
Current forecast Previous forecast
Real GDPforecast
-0.5%
0.0%
0.5%
1.0%
1.5%
2.0%
2.5%
i ii iii iv i ii iii iv i ii iii iv i ii iii iv
2014 2015 2016 2017
y/y
Current forecast Previous forecast
CPI inflationforecast

June 2016 For professional investors only
11
…which is becoming more likely according to betting markets.
We believe the probability of Brexit is higher than implied by betting markets as the main supporters of the remain camp, those under 40 years of age, are far less likely to vote than the elderly, who mostly back Brexit.
Chart 12: The odds of Brexit tumble in betting markets
Source: oddschecker.com, Schroders Economics Group. 25 May 2016.
21%20%
22%
24%
26%
28%
30%
32%
34%
36%
38%
40%
Jan '16 Feb '16 Mar '16 Apr '16 May '16
Implied probability

June 2016 For professional investors only
12
Emerging markets: looking on the bright side
Revision momentum starting to turn
Limited impact from stimulus amid reduced government commitment
Hard landing looks unlikely for now, but credit risks building
Mixed revisions to our BRIC forecasts this quarter following a poor first quarter in Brazil but a surprisingly strong one in Russia. A small upside surprise in China also prompts an upgrade but we remain of the view that growth will continue to decelerate this year and next. India is still the best growth story in the group and indeed of any large emerging market, though reform progress is still modest at best. On the inflation side, rising oil prices are a challenge for India, but a boon to Russia through the currency channel, and outweighed by domestic considerations in volatile Brazil.
Table 3: Summary of BRIC forecasts
% per annum
GDP Inflation
2015 2016f 2017f 2015 2016f 2017f
China 6.9 6.4 6.2 1.5 2.1 1.9
Brazil -3.8 -3.5 1.0 9.0 7.3 5.0
India 7.0 7.5 7.9 5.0 5.4 5.5
Russia -3.7 -0.1 1.5 15.3 7.3 6.7
Source: Bloomberg, Thomson Datastream, Schroders Economics Group. 23 May 2016. Please note the forecast warning at the back of the document.
China: slowing, but still no crisis call
GDP growth slowed marginally in the first quarter of the year, to 6.7% year-on-year. However, much of the real data was actually better in Q1 than in Q4 2015, with the exception of retail sales. The big drag on growth came from the services sector, specifically from the financial sector, which contributed an outsized share to growth in 2015. The unwinding of these base effects will continue to weigh on growth in Q2 and to an extent in Q3.
At first, it seemed the government was once again ramping up stimulus to rev up the stalling economic engine; Q1 credit growth was notably strong, particularly in January and March. This has seen a reacceleration in the rate of growth to around 17% year-on-year, helping to support investment. But with nominal GDP growth of just 7.1%, the debt/GDP ratio will be accelerating too, and it seems concerns around this have prompted a pulling back of stimulus efforts; an unnamed but “authoritative” figure was quoted in the Chinese press on the need to control financial risks and push forward with reforms. Against this backdrop, the much weaker than expected lending data in April makes it look as though the authorities have launched a serious crackdown on lending, though the decline is not quite so great when we include municipal bonds.
Consequently, though the first quarter has led to a mechanical upward revision to our growth forecast, we maintain our overall growth path and shy away from the more bullish path of uplifting growth numbers on expectations of high levels of stimulus. We are already seeing some signs of growing corporate stress; announcements of spare capacity cutbacks have seen corporate defaults for 2016 exceed the combined level for the last two years, as it becomes more difficult to evergreen their borrowing. A further headwind to growth from this area seems likely.
Our base case is that, for now, the authorities can contain this credit stress and prevent systemic risk. However, there is a tail risk probability in which significant credit events spark investor concerns and undermine faith in the financial system generally, leading by twists and turns to a seizing up of lending and triggering a hard landing, as reflected in our risk scenarios. Of course, some analysts argue that China has already had, or is having, its hard landing. As we have said before, this argument seems typically to be based on some version of the “Li
June 2016 For professional investors only
13
Trade weighted basket looks to have been abandoned
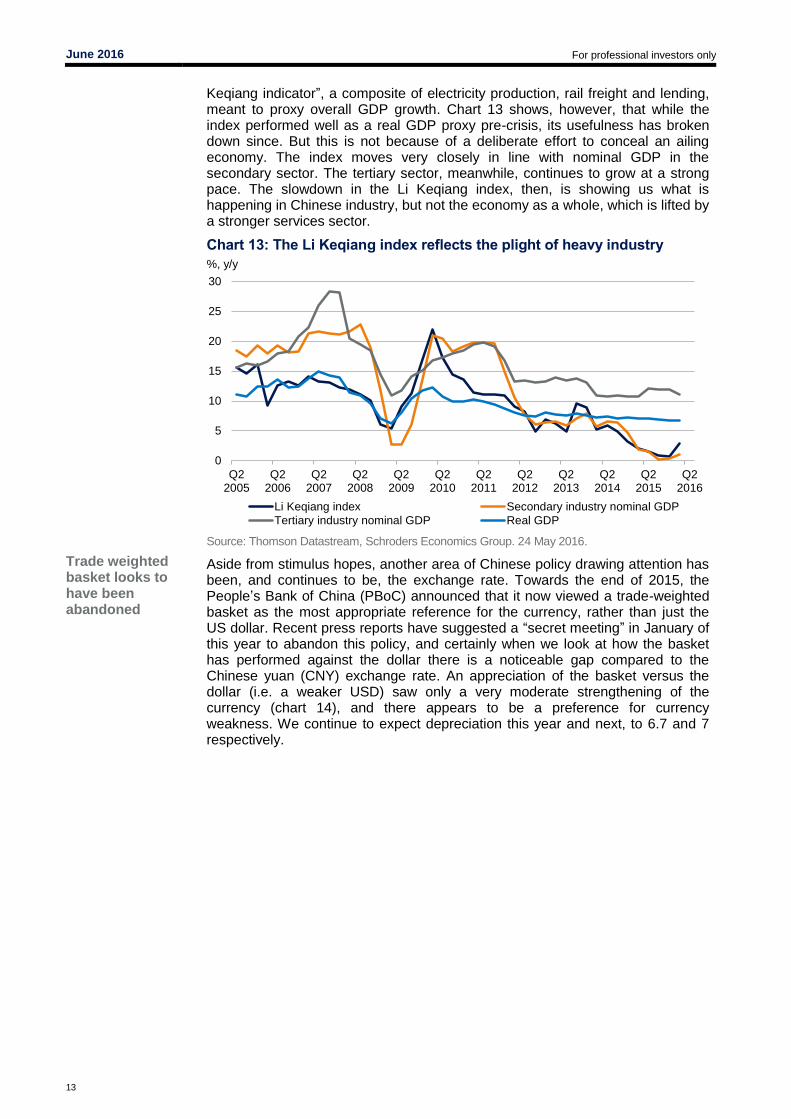
Keqiang indicator”, a composite of electricity production, rail freight and lending, meant to proxy overall GDP growth. Chart 13 shows, however, that while the index performed well as a real GDP proxy pre-crisis, its usefulness has broken down since. But this is not because of a deliberate effort to conceal an ailing economy. The index moves very closely in line with nominal GDP in the secondary sector. The tertiary sector, meanwhile, continues to grow at a strong pace. The slowdown in the Li Keqiang index, then, is showing us what is happening in Chinese industry, but not the economy as a whole, which is lifted by a stronger services sector.
Chart 13: The Li Keqiang index reflects the plight of heavy industry
Source: Thomson Datastream, Schroders Economics Group. 24 May 2016.
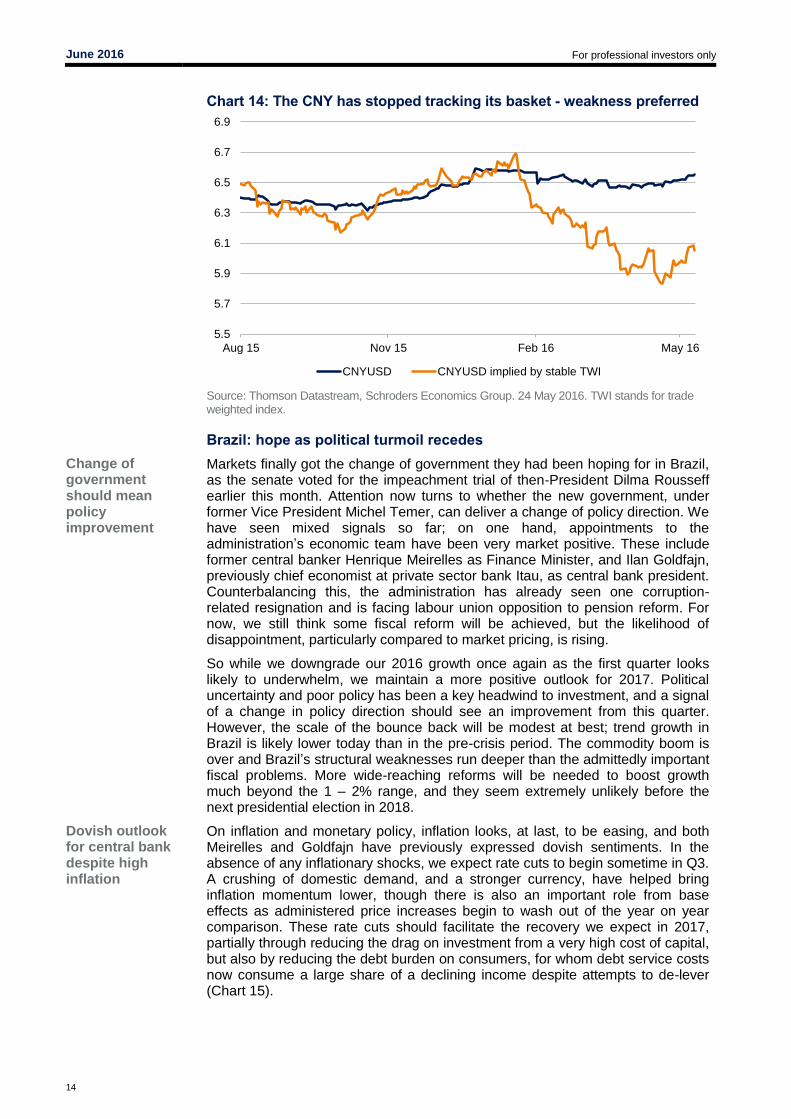
Aside from stimulus hopes, another area of Chinese policy drawing attention has been, and continues to be, the exchange rate. Towards the end of 2015, the People’s Bank of China (PBoC) announced that it now viewed a trade-weighted basket as the most appropriate reference for the currency, rather than just the US dollar. Recent press reports have suggested a “secret meeting” in January of this year to abandon this policy, and certainly when we look at how the basket has performed against the dollar there is a noticeable gap compared to the Chinese yuan (CNY) exchange rate. An appreciation of the basket versus the dollar (i.e. a weaker USD) saw only a very moderate strengthening of the currency (chart 14), and there appears to be a preference for currency weakness. We continue to expect depreciation this year and next, to 6.7 and 7 respectively.
0
5
10
15
20
25
30
Q22005
Q22006
Q22007
Q22008
Q22009
Q22010
Q22011
Q22012
Q22013
Q22014
Q22015
Q22016
Li Keqiang index Secondary industry nominal GDP
Tertiary industry nominal GDP Real GDP
%, y/y
June 2016 For professional investors only
14
Change of government should mean policy improvement
Dovish outlook for central bank despite high inflation
Chart 14: The CNY has stopped tracking its basket - weakness preferred
Source: Thomson Datastream, Schroders Economics Group. 24 May 2016. TWI stands for trade weighted index.
Brazil: hope as political turmoil recedes
Markets finally got the change of government they had been hoping for in Brazil, as the senate voted for the impeachment trial of then-President Dilma Rousseff earlier this month. Attention now turns to whether the new government, under former Vice President Michel Temer, can deliver a change of policy direction. We have seen mixed signals so far; on one hand, appointments to the administration’s economic team have been very market positive. These include former central banker Henrique Meirelles as Finance Minister, and Ilan Goldfajn, previously chief economist at private sector bank Itau, as central bank president. Counterbalancing this, the administration has already seen one corruption-related resignation and is facing labour union opposition to pension reform. For now, we still think some fiscal reform will be achieved, but the likelihood of disappointment, particularly compared to market pricing, is rising.
So while we downgrade our 2016 growth once again as the first quarter looks likely to underwhelm, we maintain a more positive outlook for 2017. Political uncertainty and poor policy has been a key headwind to investment, and a signal of a change in policy direction should see an improvement from this quarter. However, the scale of the bounce back will be modest at best; trend growth in Brazil is likely lower today than in the pre-crisis period. The commodity boom is over and Brazil’s structural weaknesses run deeper than the admittedly important fiscal problems. More wide-reaching reforms will be needed to boost growth much beyond the 1 – 2% range, and they seem extremely unlikely before the next presidential election in 2018.
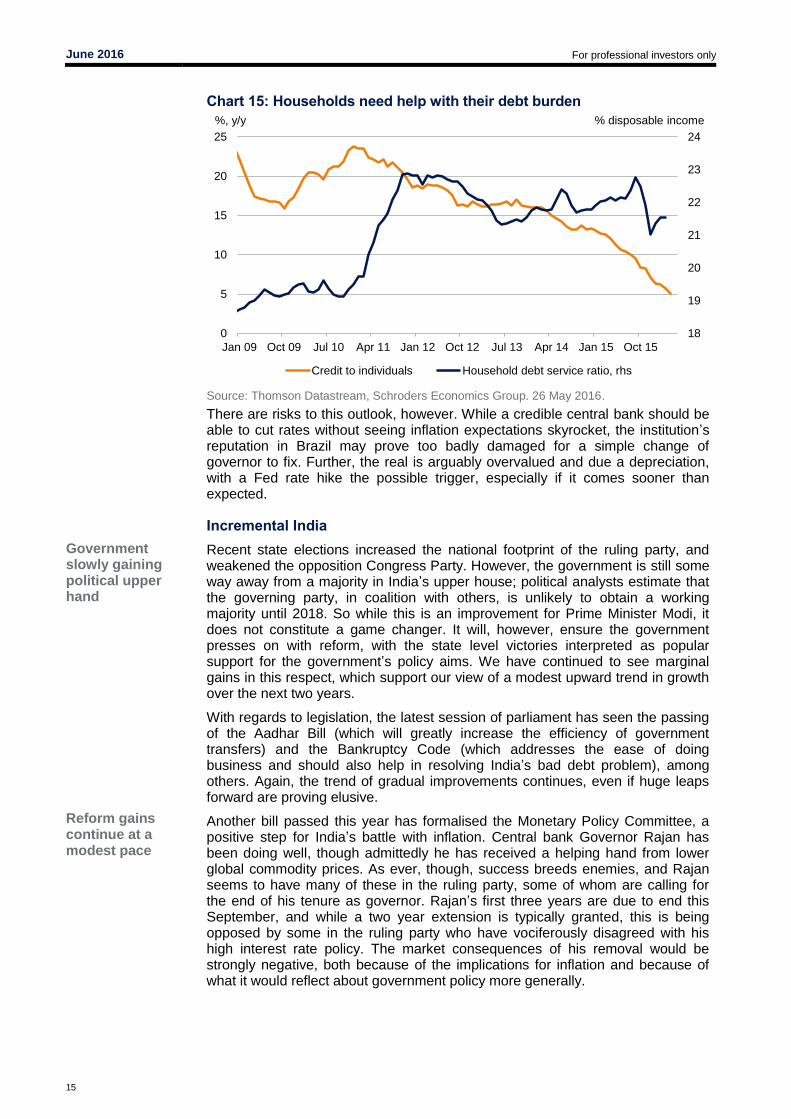
On inflation and monetary policy, inflation looks, at last, to be easing, and both Meirelles and Goldfajn have previously expressed dovish sentiments. In the absence of any inflationary shocks, we expect rate cuts to begin sometime in Q3. A crushing of domestic demand, and a stronger currency, have helped bring inflation momentum lower, though there is also an important role from base effects as administered price increases begin to wash out of the year on year comparison. These rate cuts should facilitate the recovery we expect in 2017, partially through reducing the drag on investment from a very high cost of capital, but also by reducing the debt burden on consumers, for whom debt service costs now consume a large share of a declining income despite attempts to de-lever (Chart 15).
5.5
5.7
5.9
6.1
6.3
6.5
6.7
6.9
Aug 15 Nov 15 Feb 16 May 16
CNYUSD CNYUSD implied by stable TWI
June 2016 For professional investors only
15
Chart 15: Households need help with their debt burden
Source: Thomson Datastream, Schroders Economics Group. 26 May 2016.
Government slowly gaining political upper hand
Reform gains continue at a modest pace
There are risks to this outlook, however. While a credible central bank should be able to cut rates without seeing inflation expectations skyrocket, the institution’s reputation in Brazil may prove too badly damaged for a simple change of governor to fix. Further, the real is arguably overvalued and due a depreciation, with a Fed rate hike the possible trigger, especially if it comes sooner than expected.
Incremental India
Recent state elections increased the national footprint of the ruling party, and weakened the opposition Congress Party. However, the government is still some way away from a majority in India’s upper house; political analysts estimate that the governing party, in coalition with others, is unlikely to obtain a working majority until 2018. So while this is an improvement for Prime Minister Modi, it does not constitute a game changer. It will, however, ensure the government presses on with reform, with the state level victories interpreted as popular support for the government’s policy aims. We have continued to see marginal gains in this respect, which support our view of a modest upward trend in growth over the next two years.
With regards to legislation, the latest session of parliament has seen the passing of the Aadhar Bill (which will greatly increase the efficiency of government transfers) and the Bankruptcy Code (which addresses the ease of doing business and should also help in resolving India’s bad debt problem), among others. Again, the trend of gradual improvements continues, even if huge leaps forward are proving elusive.
Another bill passed this year has formalised the Monetary Policy Committee, a positive step for India’s battle with inflation. Central bank Governor Rajan has been doing well, though admittedly he has received a helping hand from lower global commodity prices. As ever, though, success breeds enemies, and Rajan seems to have many of these in the ruling party, some of whom are calling for the end of his tenure as governor. Rajan’s first three years are due to end this September, and while a two year extension is typically granted, this is being opposed by some in the ruling party who have vociferously disagreed with his high interest rate policy. The market consequences of his removal would be strongly negative, both because of the implications for inflation and because of what it would reflect about government policy more generally.
18
19
20
21
22
23
24
0
5
10
15
20
25
Jan 09 Oct 09 Jul 10 Apr 11 Jan 12 Oct 12 Jul 13 Apr 14 Jan 15 Oct 15
Credit to individuals Household debt service ratio, rhs
%, y/y % disposable income

June 2016 For professional investors only
16
Chart 16: Indian inflation heavily influenced by food
Source: Thomson Datastream, Schroders Economics Group. 26 May 2016.
A good monsoon could make a big difference to inflation and growth
Russia battered but no longer broken by oil storm
One other risk for India, though on the upside, lies in the monsoon rains. The past two years have seen below-normal monsoons, hurting harvests and resulting in lower growth and higher inflation than would otherwise be the case. This year, with the El Niño weather phenomenon switching to La Niña, monsoon conditions are much more favourable, and so we should see a better harvest. On the growth side, this can compensate for weaker manufacturing output. On inflation, given that food is around 46% of the consumer price index (CPI) inflation basket, the benefits are obvious (chart 16).
Russia: rumbling no more
2016 began well for Russia, as first quarter GDP surprised positively, contracting 1.2% year on year rather than the 2% expected, and much better than the 3.8% contraction of the final quarter of 2015. The economy looks to be weathering the oil price slump better than anticipated.
The early GDP release does not contain a breakdown of the data, so we will have to wait to see what has driven this better-than-expected performance. However, it likely reflects the advantages of allowing the currency to perform a large share of the adjustment to the oil slump and economic slowdown (other commodity producers would do well to take lessons from Russia on this point). The rouble fell in line with oil and has remained at weakened levels as oil remains relatively range bound (though both the rouble and oil are much improved since their January 2015 lows). As a result, the current account surplus has grown; we expect net exports to have supported growth.
The weaker currency looks to have prompted a shift in the economy towards the tradeables sector as Russian industrial competitiveness has been boosted. High frequency data supports this view, with the consumer sector taking longer than industrial production to find a floor, though both now look to be on a recovery path (chart 17). We still expect a small negative for growth this year, but risks look to the upside, and a return to positive growth in the near future seems likely.
0
2
4
6
8
10
12
Jan 14 Apr 14 Jul 14 Oct 14 Jan 15 Apr 15 Jul 15 Oct 15 Jan 16 Apr 16
CPI CPI Food estimate
%, y/y

June 2016 For professional investors only
17
Expect rate cuts later this year in the absence of shocks
Chart 17: Russian industry began recovering sooner than the consumer
Source: Thomson Datastream, Schroders Economics Group. 26 May 2016.
Meanwhile, assisted by a modest rouble recovery, inflation has been trending lower in Russia, though the process paused in April. Base effects will likely switch from a tailwind to a headwind, briefly, but the disinflationary trend should resume in the third quarter and allow the central bank to begin easing. We anticipate 200 bps of cuts this year. This does assume a certain outlook for oil (see our forecast page for our oil price assumptions) and that weak growth continues to weigh on wage growth. Oil shocks or a much stronger growth profile would lead us to review our inflation and monetary policy outlook.
-10
-5
0
5
10
15
20
May 14 Aug 14 Nov 14 Feb 15 May 15 Aug 15 Nov 15 Feb 16 May 16
IP Retail sales
%, y/y

June 2016 For professional investors only
18
Schroder Economics Group: Views at a glance
Macro summary – June 2016
Key points Baseline
Stronger growth in Europe offsets downgrades to the US and Japan to leave our global growth forecast at 2.5% for 2016. The inflation profile is affected by the pick-up in oil prices although is little changed in aggregate as lower core inflation in the Eurozone and a further postponement of the consumption tax in Japan weigh on prices. For 2017, our forecasts are little changed, with growth strengthening modestly as a result of more stable emerging market activity.
The US Fed is expected to raise rates in September and December by 25 bps, so taking fed funds to 1% by end year. Further increases are expected in 2017 to 1.5% by end year, with the Fed moving cautiously on concerns about its impact on the rest of the world and the strength of domestic recovery.
UK recovery to continue, but to moderate as a result of Brexit uncertainty and the resumption of austerity. Interest rate normalisation to begin with first rate rise in November 2016 following a vote to remain in the EU at the referendum in June. BoE to move cautiously, hiking 25bps in November, peaking at around 1% in February 2017 when weaker activity will force a pause.
Eurozone recovery continues in 2016, but does not accelerate as tailwinds fade and the external environment drags on growth. Inflation to turn positive again in 2016 and rise modestly into 2017. ECB to cut rates further with the deposit rate falling to -0.5% by the end of the year where it stays through 2017.
Japanese growth now forecast at 0.5% this year and inflation at 0.0%. Following the adverse reaction to negative interest rates, the BoJ focusses on QE and introduces helicopter money in 2017H2. Fiscal policy is eased in 2016 and the consumption tax hike pushed out from 2017 to 2019.
Emerging economies benefit from modest advanced economy demand growth and firmer commodity prices, but tighter US monetary policy weighs on activity. Concerns over China’s growth to persist, further fiscal support and easing from the PBoC is expected.
Risks
Risks skewed towards weaker growth on fears of China hard landing, currency wars and a US recession. New scenarios trade wars and Brexit shakes EU would also result in weaker growth, but also higher inflation. Inflationary risks stem from a significant wage acceleration in the US, or a global push toward reflation by policymakers.
Chart: World GDP forecast
Source: Thomson Datastream, Schroders Economics Group, May 2016 forecast. Please note the forecast warning at the back of the document.
4.9
2.6
3.1
3.8
4.94.5
5.1 5.1
2.3
-1.0
4.8
3.5
2.6 2.52.8
2.5 2.52.7
-3
-2
-1
0
1
2
3
4
5
6
00 01 02 03 04 05 06 07 08 09 10 11 12 13 14 15 16 17
Contributions to World GDP growth (y/y), %
US Europe Japan Rest of advanced
BRICS Rest of emerging World
Forecast

June 2016 For professional investors only
19
Schroders Forecast Scenarios
*Scenario probabilities are based on mutually exclusive scenarios. Please note the forecast warning at the back of the document.
Scenario Summary Macro impact Probability* Growth Inflation
Baseline Our forecast for global growth in 2016 is unchanged at 2.5%. Reductions in our forecasts for the
US and Japan are offset by increases to the Eurozone and China to leave our overall projection
unchanged. Much of this reflects base effects from the first quarter with the US and Japan
disappointing whilst European growth has been surprisingly resilient. However, rising oil prices
have also played a role and with the forward futures market now projecting higher prices than
before, our global inflation forecasts have been nudged higher. In terms of growth, this has had its
greatest effect in the US where it feeds through directly into CPI inflation and hence reduces real
incomes and consumer spending. Elsewhere as a result of taxes and subsidies the effects take
longer to come through. Inflation forecasts are also influenced by a reappraisal of core rates in the
Eurozone, and in Japan by the assumed postponement of the consumption tax hike in 2017 to
2019. For 2017 our forecasts are little changed, with growth strengthening modestly as a result of
more stable activity in the emerging markets.
Although a US rate rise in June remains a possibility we still expect Janet Yellen and company to delay their
next move until September. The absence of significant wage pressure and concerns over a tightening of
monetary conditions via the dollar account for the delay, although we recognise that this will be uncomfortably
close to the Presidential election date. We still expect Fed funds to rise to 1% by end 2016 and 1.5% by end
2017. We look for the ECB to cut the deposit rate again in September, taking it to -0.5%, where it stays until
the end of 2017. The Bank of Japan is no longer expected to take rates lower following the adverse reaction to
their move in January. However, we do expect them to start experimenting with helicopter money drops towards
the end of the forecast period in 2017 in a renewed effort to stimulate growth. Currency wise we still look for the
USD to strengthen against the EUR, but the US unit now has a weaker profile against the JPY, CNY and GBP
in 2016. The latter is expected to benefit from a vote to remain in the EU in the referendum on June 23rd.
60% - -
1. Currency wars
return
After a period of truce, the currency wars return as China devalues the CNY by 10% in Q3. The
Chinese authorities choose to go for a large one-off move rather than a series of smaller moves so
as to quash speculation about further devaluation. Japan, which counts China as its largest
trading partner, responds by devaluing the JPY by 8%. This is likely to be achieved through a
combination of rate cuts and increased QQE. Finally, the ECB responds by stepping up its own
QE programme and pushing the EUR down by 10%. The round of currency devaluations unnerves
financial markets who see it as a symptom of a chronically weak world economy. Weaker equity
markets then have a further knock on effect to activity through slower consumption through
negative wealth effects and weaker investment as growth expectations decline.
The impact on the world economy is modestly staflationary with mixed results between those devaluing and
those not. Inflation is pushed up in Europe, China and EM, whilst the US and UK experience weaker growth and
lower inflation. Overall the global effects are not great as much of the moves in exchange rates cancel each
other out. However, the USD does strengthen as a result of each of devaluations thus putting deflationary
pressure on the US. There is also a general deflationary effect on activity from heightened financial market
volatility. 8% -0.2% +0.3%
2. Global reflation Frustration with the weakness of global activity leads policy makers to increase fiscal stimulus in
the world economy. This then triggers an increase in animal spirits which further boosts demand
through stronger capex. Global growth exceeds 3% in 2016 and 2017. However, higher
commodity prices (oil heading toward $70/ b) and tighter labour markets push inflation up by
0.5% in 2016.
Reflationary: stronger growth and higher inflation compared to the baseline. Central banks respond to the
increase in inflationary pressure with the fastest response coming from the US and UK which are more
advanced in the cycle compared with the Eurozone where there is considerable slack. The US Fed raises rates
to 3.5% by end-2016 and starts to actively unwind QE by reducing its balance sheet. Although there is little
slack in Japan, higher wage and price inflation is welcomed as the economy approaches its 2% inflation target.
This is likely to lead the BoJ to signal a tapering of QQE, but no increase in interest rates. Inflation concerns
result in tighter monetary policy in the emerging markets with all the BRIC economies raising rates.
5% +0.7% +0.8%
3. Trade wars The election of Donald Trump as President brings a more protectionist tone to US trade policy
with a significant increase in tariffs. Other countries retaliate and the world economy descends
into a trade war.
Stagflationary: Higher tariffs push up inflation and reduce demand thus pushing the world economy in a
stagflationary direction. Countries which are dependent on international trade are most vulnerable in this
scenario. 8% -0.5% +0.5%
4. US recession Slower profits growth causes a retrenchment in the corporate sector which cuts capex and jobs.
Consequently, the US economy tips into recession in the middle of 2016. Corporate confidence
and the equity market are badly hit, resulting in widespread retrenchment. Weaker demand from
the US hits global activity.
Deflationary: weaker global growth and inflation compared to baseline as the fall in US demand hits activity
around the world. The fall in inflation is given added impetus by a drop in commodity prices, which then adds to
pressure on energy and mining companies and producers. The Fed has to reverse course by Juy 2016 when
rates are cut back again and the QE programme restarted. Interest rates are generally lower around the world.3% -0.5% -0.3%
5. China hard
landing
A wave of bond defaults and losses for households shakes faith in the financial system resulting
in capital flight and a seizing up of the lending machinery. The government ultimately acts,
alongside the PBoC, to restore solvency, but not before the dearth of credit and forced devaluation
have hit both the Chinese and world economies. Growth in China slows to 3% in 2016 and
remains under 4% for most of 2017.
Deflationary: Global growth slows as China demand weakens with commodity producers hit hardest. However,
the fall in commodity prices will push down inflation to the benefit of consumers. Monetary policy is likely to
ease/ stay on hold while the deflationary shock works through the world economy. 4% -0.9% -0.5%
6. US wages
accelerate
Tight labour markets and rising headline inflation cause wages to accelerate faster than in the
base in the US, parts of Europe and Japan. Consumer spending initially accelerates compared to
the base, but inflation also picks up further out.
Reflationary in 2016 and 2017: stronger growth and higher inflation compared to the baseline. Better growth in
the US provides a modest stimulus to activity elsewhere, however this is likely to be tempered by a more
volatile financial environment with long yields rising as inflation expectations rise and the Fed tightens more
aggressively.
5% +0.3% +0.4%
7. Brexit shakes
Europe
The UK votes to leave the EU in June which galvanises anti-EU support across Europe. Large and
widespread protests follow with as anti-establishment parties gain momentum. In an effort to head-
off losses in upcoming elections, many member states (France, Germany, Italy, Netherlands)
announce their own EU referendums, jeopardising the whole European Union and euro projects.
Note: this is not our central view in the event that the UK votes for Brexit.
Lower growth vs. baseline. Investment across Europe stalls as political risk dents confidence. Consumers also
retrench causing demand for imports from the rest of the world to fall. Both GBP and EUR fall sharply, helping
to boost net trade for Europe, but to the detriment of EM and the US. Policy is loosened further in Europe, and
with the currencies depreciating, inflation is higher vs. the baseline. However, this is ultimately a deflationary
shock, which is felt elsewhere in the world initially.
4% -0.6% +0.1%
8. Other 3% - -
Global vs. 2017 baseline
June 2016 For professional investors only
20
Schroders Baseline Forecast
Real GDP
y/y% Wt (%) 2015 2016 Prev. Consensus 2017 Prev. Consensus
World 100 2.5 2.5 (2.5) 2.4 2.7 (2.8) 2.8
Advanced* 62.9 1.9 1.7 (1.7) 1.6 1.7 (1.9) 1.9
US 24.9 2.4 1.8 (2.1) 1.8 1.8 (2.1) 2.3
Eurozone 19.2 1.5 1.7 (1.4) 1.6 1.6 (1.6) 1.6
Germany 5.5 1.4 2.0 (1.6) 1.6 2.0 (2.1) 1.5
UK 4.2 2.3 1.9 (1.9) 1.9 1.6 (1.6) 2.2
Japan 6.6 0.6 0.5 (0.8) 0.5 1.1 (1.4) 0.5
Total Emerging** 37.1 3.6 3.8 (3.8) 3.8 4.5 (4.5) 4.4
BRICs 23.8 4.2 4.4 (4.4) 4.4 5.2 (5.2) 5.1
China 14.8 6.9 6.4 (6.3) 6.5 6.2 (6.2) 6.3
Inflation CPI
y/y% Wt (%) 2015 2016 Prev. Consensus 2017 Prev. Consensus
World 100 1.8 2.2 (2.2) 2.0 2.4 (2.6) 2.5
Advanced* 62.9 0.2 1.0 (1.0) 0.7 1.7 (2.0) 1.8
US 24.9 0.1 1.7 (1.2) 1.2 2.2 (2.3) 2.3
Eurozone 19.2 0.0 0.5 (0.7) 0.2 1.2 (1.6) 1.3
Germany 5.5 0.1 0.4 (0.9) 0.5 1.4 (1.8) 1.6
UK 4.2 0.0 0.8 (0.8) 0.7 1.8 (2.0) 1.7
Japan 6.6 0.8 0.0 (0.4) 0.0 1.0 (1.8) 1.5
Total Emerging** 37.1 4.4 4.2 (4.2) 4.1 3.7 (3.8) 3.6
BRICs 23.8 4.5 3.8 (3.8) 3.6 3.3 (3.5) 3.2
China 14.8 1.4 2.1 (1.9) 1.9 1.9 (2.1) 1.8
Interest rates
% (Month of Dec) Current 2015 2016 Prev. Market 2017 Prev. Market
US 0.50 0.50 1.00 (1.00) 0.84 1.50 (1.50) 1.07
UK 0.50 0.50 0.75 (0.75) 0.59 1.00 (1.00) 0.74
Eurozone (Refi) 0.00 0.05 0.00 (0.05) 0.00 (0.05)
Eurozone (Depo) -0.40 -0.30 -0.50 - -0.50
Japan -0.10 0.10 -0.10 (-0.25) 0.01 -0.10 (-0.50) 0.01
China 4.35 4.35 3.50 (3.50) - 3.00 (3.00) -
Other monetary policy
(Over year or by Dec) Current 2015 2016 Prev. 2017 Prev.
US QE ($Bn) 4483 4487 4496 (4505) 4514 (4523)
EZ QE (€Bn) 185 652 1548 (1372) 1788 (1732)
UK QE (£Bn) 375 375 375 (375) 375 (375)
JP QE (¥Tn) 405 383 435 (400) 475 (400)
China RRR (%) 17.00 17.50 15.00 15.00 13.00 13.00
Key variables
FX (Month of Dec) Current 2015 2016 Prev. Y/Y(%) 2017 Prev. Y/Y(%)
USD/GBP 1.45 1.47 1.50 (1.43) 1.8 1.48 (1.40) -1.3
USD/EUR 1.14 1.09 1.10 (1.08) 1.3 1.08 (1.04) -1.8
JPY/USD 108.7 120.3 107 (115) -11.1 120 (120) 12.1
GBP/EUR 0.79 0.74 0.73 (0.76) -0.5 0.73 (0.74) -0.5
RMB/USD 6.51 6.49 6.70 (6.80) 3.2 7.00 (7.00) 4.5
Commodities (over year)
Brent Crude 47.2 52.7 46.1 (36) -12.4 51.5 (42) 11.6
Consensus inflation numbers for Emerging Markets is for end of period, and is not directly comparable.
Previous forecast refers to February 2016
-0.29 0.74
Source: Schroders, Thomson Datastream, Consensus Economics, May 2016
Market data as at 13/05/2016
* Advanced markets: Australia, Canada, Denmark, Euro area, Israel, Japan, New Zealand, Singapore, Sw eden, Sw itzerland,
United Kingdom, United States.
** Emerging markets : Argentina, Brazil, Chile, Colombia, Mexico, Peru, China, India, Indonesia, Malaysia, Philippines, South Korea,
Taiw an, Thailand, South Africa, Russia, Czech Rep., Hungary, Poland, Romania, Turkey, Ukraine, Bulgaria, Croatia, Latvia,
June 2016 For professional investors only
21
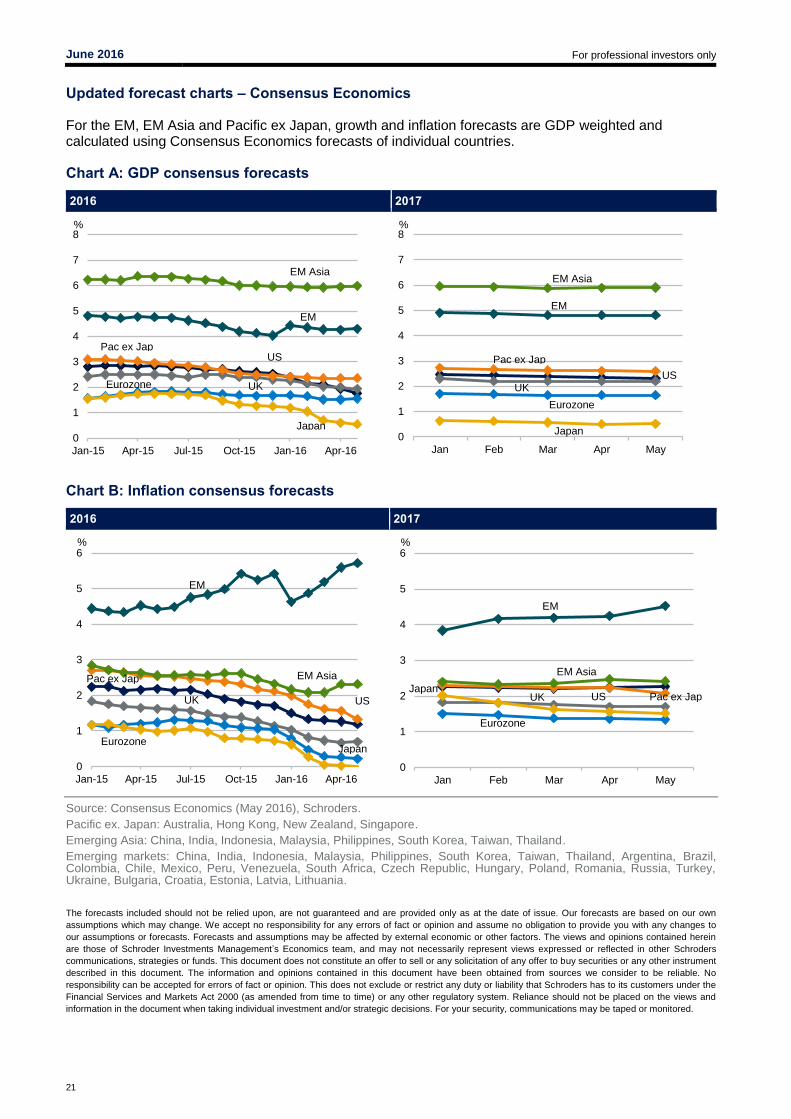
Updated forecast charts – Consensus Economics
For the EM, EM Asia and Pacific ex Japan, growth and inflation forecasts are GDP weighted and calculated using Consensus Economics forecasts of individual countries.
Chart A: GDP consensus forecasts
2016 2017
2016 2017
Source: Consensus Economics (May 2016), Schroders.
Pacific ex. Japan: Australia, Hong Kong, New Zealand, Singapore.
Emerging Asia: China, India, Indonesia, Malaysia, Philippines, South Korea, Taiwan, Thailand.
Emerging markets: China, India, Indonesia, Malaysia, Philippines, South Korea, Taiwan, Thailand, Argentina, Brazil, Colombia, Chile, Mexico, Peru, Venezuela, South Africa, Czech Republic, Hungary, Poland, Romania, Russia, Turkey, Ukraine, Bulgaria, Croatia, Estonia, Latvia, Lithuania.
The forecasts included should not be relied upon, are not guaranteed and are provided only as at the date of issue. Our forecasts are based on our own
assumptions which may change. We accept no responsibility for any errors of fact or opinion and assume no obligation to provide you with any changes to
our assumptions or forecasts. Forecasts and assumptions may be affected by external economic or other factors. The views and opinions contained herein
are those of Schroder Investments Management’s Economics team, and may not necessarily represent views expressed or reflected in other Schroders
communications, strategies or funds. This document does not constitute an offer to sell or any solicitation of any offer to buy securities or any other instrument
described in this document. The information and opinions contained in this document have been obtained from sources we consider to be reliable. No
responsibility can be accepted for errors of fact or opinion. This does not exclude or restrict any duty or liability that Schroders has to its customers under the
Financial Services and Markets Act 2000 (as amended from time to time) or any other regulatory system. Reliance should not be placed on the views and
information in the document when taking individual investment and/or strategic decisions. For your security, communications may be taped or monitored.
0
1
2
3
4
5
6
7
8
Jan-15 Apr-15 Jul-15 Oct-15 Jan-16 Apr-16
%
EM
EM Asia
Pac ex Jap
UK
Japan
US
Eurozone
0
1
2
3
4
5
6
7
8
Jan Feb Mar Apr May
%
EM
EM Asia
Pac ex Jap
UK
Japan
US
Eurozone
0
1
2
3
4
5
6
Jan-15 Apr-15 Jul-15 Oct-15 Jan-16 Apr-16
%
EM
EM AsiaPac ex Jap
UK
Japan
US
Eurozone
0
1
2
3
4
5
6
Jan Feb Mar Apr May
%
EM
EM Asia
Pac ex JapUKJapan
US
Eurozone
Chart B: Inflation consensus forecasts

![319_Chap007 GDP Ntl Y approach1.ppt [Read-Only]](https://static.fdocuments.net/doc/165x107/5866828a1a28ab3b408b5ea5/319chap007-gdp-ntl-y-approach1ppt-read-only.jpg)