Contribution of Underbalanced Drilling To Production...
12
IOSR Journal of Applied Geology and Geophysics (IOSR-JAGG) e-ISSN: 2321–0990, p-ISSN: 2321–0982.Volume 2, Issue 5 (Jul-Aug. 2014), PP 06-17 www.iosrjournals.org www.iosrjournals.org 6 | Page Contribution of Underbalanced Drilling To Production Capacity at Olkaria Geothermal Steamfield in Kenya Nzioka F.K. 1 , Githiri J.G. 2 , Kamau J.N. 3 1 Jomo Kenyatta University of Agriculture and Technology, Institute of Energy and Environmental Technology. 2 Jomo Kenyatta University of Agriculture and Technology, Department of Physics. 3 Jomo Kenyatta University of Agriculture and Technology, Department of Physics. Abstract: The planned time to drill a geothermal well at Olkaria is sometimes exceeded by a big margin when down hole challenges are encountered whilst drilling. The geographical coordinates of Olkaria are 0 o 53’09”S and 36 o 16’12”E. The current drilling practice at the field is balanced pressure drilling. The common down hole problems encountered in the field are loss of circulation, well bore collapse, minimal Rate Of Penetration (ROP) and possible formation damage which consequently leads to reduced productivity of a well. It is evident that, the longer the drilling time, the higher the cost of the well. Underbalanced drilling is the application of drilling fluids to the bore at a pressure slightly lesser than the formation fluids pressure. If the process is well executed, it may lead to the reduction/elimination of most down hole challenges. This research was geared to establishing the effectiveness of Under Balanced Drilling (UBD) in solving the down hole problems experienced at the Olkaria geothermal field. In order to carry out this exercise, simulation of under balanced drilling conditions using the Hydraulic Underbalanced Simulator (HUBS) was done utilizing data from the field. Secondly, the economics of adopting under balanced drilling technology at the field was also done. Data from four geothermal wells namely OW 731A, OW915B, OW731 and OW804 was used in the simulation exercise. Analysis of loss of circulation to well productivity for a sample of 19 wells was also undertaken. Simulated annulus volume fraction profiles showed cuttings concentration of less than 5% and an optimum circulation flow rate of 0.03 m 3 /min. The costs associated with loss of circulation of drilling fluids on average amounts to USD 127,731.00. Most of the wells sampled had over 70% of the drilled depth experienced no loss of circulation during drilling. Wells which had a circulation regime of full returns, partial returns and no returns have shown that their productivity is higher compared to the other categories and had an average production capacity of 12.03 Mw Keywords:Underbalanced drilling, Formation damage, Rate of penetration, Loss of circulation and down hole challenges. I. Introduction The current drilling practice in the Olkaria geothermal field is a mixture of both overbalanced drilling, near balance drilling and balanced drilling. A geothermal well comprises of surface hole, intermediate hole, production and the open hole sections. Geothermal wells at the field have been drilled vertically and directionally. Directional wells are drilled to about 400m and then oriented to a particular direction using a mud motor which has an inbuilt angle of orientation.The drilling fluids currently used in the current drilling practice are varied depending on the section of the hole. For the surface hole and intermediate hole sections, mud is used and for the production hole section aerated fluids and foam are employed. Geothermal well drilling is usually faced by a number of down hole challenges. These challenges include loss of circulation of the drilling fluids, low rate of penetration, formation damage and reduced productivity from a well. Lack of effective hole cleanliness due to loss of circulation may lead to a stuck drill string. The time to carry out re-circulation of fluids whilst drilling has a cost factor emanating from an increase in the overall drilling time and thus impacting negatively on the cost of the well. Formation damage pertains the partial blockage of formation fractures which normally convey the steam to the well bore. These challenges can be kept to a minimum/eliminated if advanced drilling technologies are adopted. Consequently, all these challenges leads to increased drilling time, increased cost of drilling materials, increased labour cost and reduced productivity of a well.Loss of circulation is a situation which occurs when drilling fluids are not conveyed back to the surface once injected into the well bore. Factors leading to this situation are well fractured formation and the application of high hydrostatic pressure compared to the formation pressures whilst drilling. Many geothermal wells at the Olkaria Geothermal Steamfield are drilled to target depths of 3000m. 1.1 Underbalanced drilling Underbalanced drilling is defined as drilling with the hydrostatic head of the drilling fluid intentionally designed to be lower than the pressure of the formations being drilled. The hydrostatic head of the fluid may
Transcript of Contribution of Underbalanced Drilling To Production...

IOSR Journal of Applied Geology and Geophysics (IOSR-JAGG)
e-ISSN: 2321–0990, p-ISSN: 2321–0982.Volume 2, Issue 5 (Jul-Aug. 2014), PP 06-17 www.iosrjournals.org
www.iosrjournals.org 6 | Page
Contribution of Underbalanced Drilling To Production Capacity
at Olkaria Geothermal Steamfield in Kenya
Nzioka F.K.1, Githiri J.G.
2, Kamau J.N.
3
1Jomo Kenyatta University of Agriculture and Technology, Institute of Energy and Environmental Technology. 2Jomo Kenyatta University of Agriculture and Technology, Department of Physics. 3Jomo Kenyatta University of Agriculture and Technology, Department of Physics.
Abstract: The planned time to drill a geothermal well at Olkaria is sometimes exceeded by a big margin when
down hole challenges are encountered whilst drilling. The geographical coordinates of Olkaria are 0o53’09”S
and 36o16’12”E. The current drilling practice at the field is balanced pressure drilling. The common down hole
problems encountered in the field are loss of circulation, well bore collapse, minimal Rate Of Penetration
(ROP) and possible formation damage which consequently leads to reduced productivity of a well. It is evident
that, the longer the drilling time, the higher the cost of the well. Underbalanced drilling is the application of
drilling fluids to the bore at a pressure slightly lesser than the formation fluids pressure. If the process is well
executed, it may lead to the reduction/elimination of most down hole challenges. This research was geared to
establishing the effectiveness of Under Balanced Drilling (UBD) in solving the down hole problems experienced
at the Olkaria geothermal field. In order to carry out this exercise, simulation of under balanced drilling conditions using the Hydraulic Underbalanced Simulator (HUBS) was done utilizing data from the field.
Secondly, the economics of adopting under balanced drilling technology at the field was also done. Data from
four geothermal wells namely OW 731A, OW915B, OW731 and OW804 was used in the simulation exercise.
Analysis of loss of circulation to well productivity for a sample of 19 wells was also undertaken. Simulated
annulus volume fraction profiles showed cuttings concentration of less than 5% and an optimum circulation
flow rate of 0.03 m3/min. The costs associated with loss of circulation of drilling fluids on average amounts to
USD 127,731.00. Most of the wells sampled had over 70% of the drilled depth experienced no loss of circulation
during drilling. Wells which had a circulation regime of full returns, partial returns and no returns have shown
that their productivity is higher compared to the other categories and had an average production capacity of
12.03 Mw
Keywords:Underbalanced drilling, Formation damage, Rate of penetration, Loss of circulation and down hole
challenges.
I. Introduction The current drilling practice in the Olkaria geothermal field is a mixture of both overbalanced drilling,
near balance drilling and balanced drilling. A geothermal well comprises of surface hole, intermediate hole,
production and the open hole sections. Geothermal wells at the field have been drilled vertically and
directionally. Directional wells are drilled to about 400m and then oriented to a particular direction using a mud
motor which has an inbuilt angle of orientation.The drilling fluids currently used in the current drilling practice
are varied depending on the section of the hole. For the surface hole and intermediate hole sections, mud is used
and for the production hole section aerated fluids and foam are employed. Geothermal well drilling is usually faced by a number of down hole challenges. These challenges include loss of circulation of the drilling fluids,
low rate of penetration, formation damage and reduced productivity from a well. Lack of effective hole
cleanliness due to loss of circulation may lead to a stuck drill string. The time to carry out re-circulation of fluids
whilst drilling has a cost factor emanating from an increase in the overall drilling time and thus impacting
negatively on the cost of the well. Formation damage pertains the partial blockage of formation fractures which
normally convey the steam to the well bore. These challenges can be kept to a minimum/eliminated if advanced
drilling technologies are adopted. Consequently, all these challenges leads to increased drilling time, increased
cost of drilling materials, increased labour cost and reduced productivity of a well.Loss of circulation is a
situation which occurs when drilling fluids are not conveyed back to the surface once injected into the well bore.
Factors leading to this situation are well fractured formation and the application of high hydrostatic pressure
compared to the formation pressures whilst drilling. Many geothermal wells at the Olkaria Geothermal
Steamfield are drilled to target depths of 3000m.
1.1 Underbalanced drilling
Underbalanced drilling is defined as drilling with the hydrostatic head of the drilling fluid intentionally
designed to be lower than the pressure of the formations being drilled. The hydrostatic head of the fluid may

Contribution of Underbalanced Drilling To Production Capacity at Olkaria Geothermal …..
www.iosrjournals.org 7 | Page
naturally be less than the formation pressure or it can be induced. The induced state may be created by adding
air to the liquid phase of the drilling fluid. Whether the underbalanced status is induced or natural, the result
may be an influx of formation fluids which must be circulated from the well and controlled at surface.
Conventional drilling in this context means all other forms of drilling apart from underbalanced drilling and its
mechanism is shown in Fig. 1. Equations 1 and 2 describe the operating principles of overbalanced and balanced
drilling while equation 3 describes the principle of underbalanced drilling. Fig. 2 shows the mechanism of
underbalanced drilling.
Hs > Hf
(1)
Hs = Hf
(2)
Hs < Hf
(3)
Where; Hs and Hf are hydrostatic pressure inside drill string and formation pressure respectively.
Figure 1: Overbalanced drilling (Putra, 2008)
Figure 2: Underbalanced drilling (Putra, 2008)
1.2 Loss of circulation
Loss of circulation can either be partial or severe. When drilling into a permeable „under pressured‟
zone, the drilling fluid circulation is lost and the drilling fluid flows into the formation rather than returning to
the surface. The traditional method of dealing with this situation was to continue drilling „blind‟ with water, the
pumped water being totally lost to the formation with the cuttings being washed into the formation as well
(Hole, 2008). This loss is harmful for several reasons (Finger andBlankenship, 2010):
If the drilling fluid fails to clean the hole and return cuttings to the surface, the cuttings can fallback on the bottom-hole assembly (BHA) and may result in a stuck bottom-hole assembly.
Drilling fluid, especially mud, is expensive and losing it to the formation instead of re-circulatingit is costly.
Hf
Hs
Hf
Hs

Contribution of Underbalanced Drilling To Production Capacity at Olkaria Geothermal …..
www.iosrjournals.org 8 | Page
In geothermal wells, the production zone is usually a lost-circulation zone, so it is sometimesdifficult to
cure a harmful lost circulation zone while preserving its productive potential.
Lost circulation can suddenly lower the fluid level in a well. Decreasing the static head ofdrilling fluid in a
hot formation can allow the formation fluids, gas, hot water or steam, to enterthe wellbore, causing a kick or
a blow-out. This can occur either in productive or nonproductivezones.In zones that are not hot enough
(under 220°C for high temperature utilization), the lostcirculation should be “sealed” to provide a wellbore that can be cased and cemented to thesurface, or the cementing process should be designed to accommodate
the loss of circulation toensure a good cementing job. Adequately cementing a casing through lost
circulation zones is amajor problem and can be costly.
Placement of lost circulation material (LCM) is difficult because the top and bottom of the losszone are
often not well known. The LCM or cement being used to heal the loss zone areespecially likely to migrate
away from the targeted placement zone if drilling has continuedwell past it into another loss zone, or if
there is a considerable rat hole below the original losszone.
1.3 Geothermal drilling fluids
Drilling fluids range from liquids, air, foam, mud and aerated fluids. The surface hole and intermediate
hole sections are drilled with water based mud while the production and open hole sections are drilled either
with aerated water with foam or water depending on the prevailing conditions.In foam drilling, a stable foam is generated if more liquid and a surfactant is added to the fluid. Fluid flowing from the bit exerts a jetting action
that keeps the face of the hole and edges of the bit clear of cuttings. This prolongs the life of the bit and
improves drilling efficiency. Fluid selection must be based on fluids compatibility, borehole cleaning
andstability, temperature, corrosion effects, and environmental issues (Guimerans et al, 2001).
According to Chemwotei, 2011, the functions of drilling fluids is to clean the hole while drilling, to cool the bit,
provide power to the mud motor and measuring-while-drilling (MWD) tool, support the walls of the hole,
lubricate bit and drill string and control the well pressure (prevent the well from flowing).Circulation of mud is
done to optimize on bentonite usage. The quantities of bentonite used are reduced by the re circulation of the
mud into the fluid system. Mud is conveyed from the cellar to the shale shakers by use of a pump or any other
available means. The shale shakers which are basically vibrating screens separate the cuttings and the mud is
returned back to the system. Water is also re-circulated back to the system once it cools down at the circulation pond.
1.4 Geothermal well design
The main factor that influences the design of a geothermal well is the geological formation of the area.
The design of a geothermal well involves formulating the drilling program, casing design and a cementing
program. Geothermal wells may be drilled vertically or directionally with almost the same casing design.An
example of the design of a geothermal well is shown in Fig. 3.
Figure 3: Design of a directional well
Production zone
Contribution of Underbalanced Drilling To Production Capacity at Olkaria Geothermal …..
www.iosrjournals.org 9 | Page
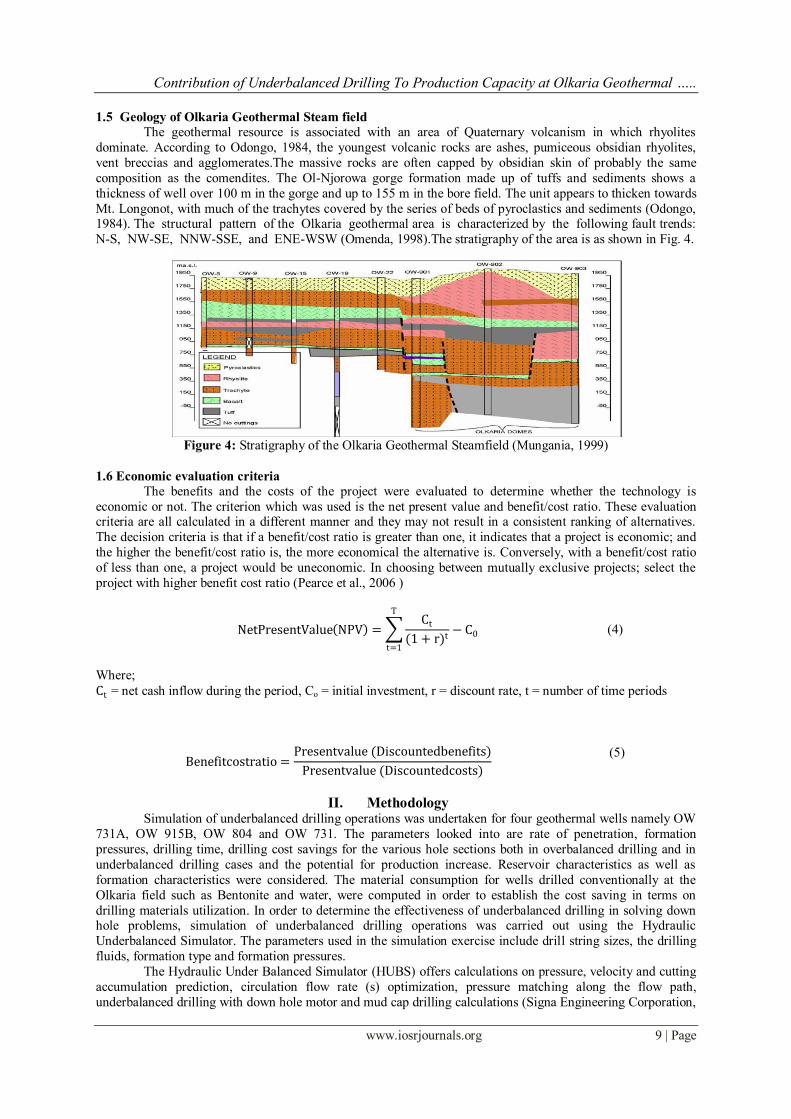
1.5 Geology of Olkaria Geothermal Steam field
The geothermal resource is associated with an area of Quaternary volcanism in which rhyolites
dominate. According to Odongo, 1984, the youngest volcanic rocks are ashes, pumiceous obsidian rhyolites,
vent breccias and agglomerates.The massive rocks are often capped by obsidian skin of probably the same
composition as the comendites. The Ol-Njorowa gorge formation made up of tuffs and sediments shows a
thickness of well over 100 m in the gorge and up to 155 m in the bore field. The unit appears to thicken towards
Mt. Longonot, with much of the trachytes covered by the series of beds of pyroclastics and sediments (Odongo, 1984). The structural pattern of the Olkaria geothermal area is characterized by the following fault trends:
N-S, NW-SE, NNW-SSE, and ENE-WSW (Omenda, 1998).The stratigraphy of the area is as shown in Fig. 4.
Figure 4: Stratigraphy of the Olkaria Geothermal Steamfield (Mungania, 1999)
1.6 Economic evaluation criteria
The benefits and the costs of the project were evaluated to determine whether the technology is
economic or not. The criterion which was used is the net present value and benefit/cost ratio. These evaluation criteria are all calculated in a different manner and they may not result in a consistent ranking of alternatives.
The decision criteria is that if a benefit/cost ratio is greater than one, it indicates that a project is economic; and
the higher the benefit/cost ratio is, the more economical the alternative is. Conversely, with a benefit/cost ratio
of less than one, a project would be uneconomic. In choosing between mutually exclusive projects; select the
project with higher benefit cost ratio (Pearce et al., 2006 )
NetPresentValue NPV = Ct
(1 + r)t
T
t=1
− C0
(4)
Where;
Ct = net cash inflow during the period, Co = initial investment, r = discount rate, t = number of time periods
Benefitcostratio =
Presentvalue (Discountedbenefits)
Presentvalue (Discountedcosts)
(5)
II. Methodology Simulation of underbalanced drilling operations was undertaken for four geothermal wells namely OW
731A, OW 915B, OW 804 and OW 731. The parameters looked into are rate of penetration, formation
pressures, drilling time, drilling cost savings for the various hole sections both in overbalanced drilling and in
underbalanced drilling cases and the potential for production increase. Reservoir characteristics as well as
formation characteristics were considered. The material consumption for wells drilled conventionally at the
Olkaria field such as Bentonite and water, were computed in order to establish the cost saving in terms on
drilling materials utilization. In order to determine the effectiveness of underbalanced drilling in solving down hole problems, simulation of underbalanced drilling operations was carried out using the Hydraulic
Underbalanced Simulator. The parameters used in the simulation exercise include drill string sizes, the drilling
fluids, formation type and formation pressures.
The Hydraulic Under Balanced Simulator (HUBS) offers calculations on pressure, velocity and cutting
accumulation prediction, circulation flow rate (s) optimization, pressure matching along the flow path,
underbalanced drilling with down hole motor and mud cap drilling calculations (Signa Engineering Corporation,

Contribution of Underbalanced Drilling To Production Capacity at Olkaria Geothermal …..
www.iosrjournals.org 10 | Page
2012). A sample of 19 wells was considered in the study. This sample size consists of both vertical and
directional wells. The wells are from the sectors of the Olkaria geothermal field which are currently under
development. The major parameter looked into was the loss of circulation of drilling fluids to the formation at
the production zone i.e. from 750m to 3000m depth. Daily drilling reports, well completion reports, and the
wells update reports formed the basis for data collection. The sampled wells were categorized into three
categories which are; wells with full and partial circulation returns, wells with full circulation returns and no
circulation returns and wells with full circulation returns. A comparison of the average production capacity in Mw for the three categories was done.
III. Data Analysis And Discussion Of Results 3.1 Simulation of underbalanced drilling operations
The drilling of directional wells OW 731A, OW 915B and vertical wells OW 731 and OW 804 was
simulated using the HUBS software. The Bottom Hole Assembly (BHA), the casing design and drilling fluid
system used in the conventional drilling of the wells were adopted for the simulation exercise.
1.5.1 Annulus volume fraction Annulus volume consists of a water fraction, air fraction and cuttings fraction. Fig. 5 shows the
simulated annulus volume fractions for four wells. For an effective under balanced drilling operation, the
annulus volume fraction for cuttings should be kept below 5% (Signa Engineering corporation, 2012).
0 1000 2000 3000Measured depth (M)
0
20
40
60
80
100
Vol
ume
fract
ion
(%)
LegendOW 731A - Water volume
OW 731A - Air volume
OW 731A - Cuttings volume
OW 915B - Water volume
OW 915B - Air volume
OW 915B - Cuttings volume
OW 804 - Water volume
OW 804 - Air volume
OW 804 - Cuttings volume
OW 731 - Water volume
OW 731 - Air volume
OW 731 - Cuttings volume
Annulus volume fraction (%)
Figure 5: Annulus volume fraction profiles
The cuttings volume fraction plots for all the wells shows a very slight increase with increase in depth.
The behavior of the plot is likely to be as a result of good transport of cuttings to the surface. The cuttings
volume fraction in all wells simulated is below 5% of the total annulus volume as shown in Fig. 5. This is in line
with the cuttings recommendation for effective underbalanced drilling. The volume fraction of water in all the
wellsdecreases linearly as the fluid mixture travels to the surface. This could be as a result of fluid losses into
the formation. The air volume fraction in all the wells is increasing linearly from deeper depth to shallow depth.
This may be attributed togas influxinto the wellbore at various depths.
3.1.2 Annulus velocity profile
Annulus velocities are key in determining the effects of the different fluid systems to rig equipment and
components. The higher the cuttings velocity, the higher the wear rate of the rotating control head components and other well head equipment. If the velocities in the entire annulus are relatively high, the possibility is that
the circulating flow rate(s) used could be well above the optimum circulating flow rate. Annulus velocities will
vary depending on the type of drilling fluid in use. When using air and water, the cuttings velocity will be high
as they leave the well due to rapid expansion of air at the exit. If foam is incorporated in the drilling fluid
system, the velocities reduce due to the capability of foam bonding the water and air particles.

Contribution of Underbalanced Drilling To Production Capacity at Olkaria Geothermal …..
www.iosrjournals.org 11 | Page
0 1000 2000 3000Measurd depth (m)
0
4
8
12
16
Vel
ocity
(m/s
ec)
LegendOW 731A - Water velocity
OW 731A - Air velocity
OW 731A - Cuttings velocity
OW 915B - Water velocity
OW 915B - Air velocity
OW 915B - Cuttings velocity
OW 804 - Water velocity
OW 804 - Air velocity
OW 804 - Cuttings velocity
OW 731 - Water velocity
OW 731 - Air velocity
OW 731 - Cuttings velocity
Annulus velocity profiles
Figure 6: Annulus velocity profiles
The velocities of the three components in the annulus in Fig. 6 are increasing as the fluid mixture travel
up the well bore. This may be due to accelerated inflow of formation fluids into the well bore thus increasing the
velocities. The velocities of the cuttings and air also tend to increase rapidly towards the surface due to the rapid
expansion of air while that of water is decreasing towards the exit.
1.5.2 Determination of the optimum circulation flow rate, maximum cuttings concentration and
minimum cuttings velocity The main reason for the determination of the optimum circulation flow rate is hole cleaning.
Circulation of inadequate fluids causes cuttings accumulation inside the well bore, thus reducing drilling
efficiency, creating down hole problems and increasing the weight of the fluid column inside the annulus. The
heavy fluid column increases the bottom hole pressure and eventually result in loss of underbalancedconditions.
The fall back of cuttings due to insufficient circulation rates results in reduction of drilling efficiency caused by
re – grinding of cuttings by the bit in a vertical well and the formation of a cuttings bed along the section of a
directional well. Circulating more fluid than required increases frictional pressure loss along the flow path,
increased fluid handling equipment capacities, over consumption of power and increased erosion to the drill
string and drilling equipments due the high velocities of cuttings. To maintain an underbalanced condition in the
well bore requires that the drilling should operate at an optimal circulation rate and provide better hole cleaning
and minimize power and equipment requirements. According to Tian et al (1999), a typical optimum circulation flow rate curve has a minimum point and the curve has a steep gradient on the left side and a less steep gradient
on the right side.
Figure 7: Optimum circulation flow rate
According to Tian et al., 1999, the optimum circulation flow rate for sufficient hole cleaning is the flow
rate which corresponds with the minimum bottom hole pressure. From Fig. 7, the optimum circulation flow rate
for water is 0.03m3/min. The volume flow rate interval used for the simulation was 0.0 m3/min to 0.28 m3/min.

Contribution of Underbalanced Drilling To Production Capacity at Olkaria Geothermal …..
www.iosrjournals.org 12 | Page
Figure 8: Maximum cuttings concentration
Circulating at a rate below the optimum circulation flow rate pointmay result in a sharp increase of
cuttings volume in the annulus as shown in Fig. 8 and this translates into inability of the drilling fluid to
effectively lift off the cuttings to the surface. Circulating at a rate above the optimum circulation flow rate point
is likely to show that, the bottom hole pressure will increase due to liquid hold up in the annulus and this might
lead to the fall back of cuttings to the bottom of the hole or formation of cuttings bed.
Figure 9: Minimum cuttings velocity
The cuttings velocity at the various fixed air flow rates is increasing with increase in volume flow rate
of water fraction. In Fig. 9, the circulation of fluids above the optimum circulation flow rate point shows an
increasing trend of the cuttings velocity. This increase in cuttings velocity is detrimental to well head
equipment.
1.6 Analysis of loss of circulation
Loss of circulation whilst drilling may range from partial to severe. Drilling fluids are lost into the
formation when these losses occur. Under normal circumstances, these fluids should be re-circulated into the
well bore.
3.2.1 Hole cleaning cost element
The cost element of the hole cleaning problems experienced during drilling at the field was tabulated
from the daily drilling reports of the sampled wells. Hole cleaning is picked as the major problem encountered
during drilling operations of the wells.

Contribution of Underbalanced Drilling To Production Capacity at Olkaria Geothermal …..
www.iosrjournals.org 13 | Page
Figure 10; Hole cleaning cost analysis (Wells used in simulation exercise)
The cost element of the circulation time for well OW 731A from Fig. 10, is high compared to the rest
of the wells. This could be partly attributed to insufficient transport of drill cuttings to the surface thus leading to
the continuous circulation of fluids to ascertain hole cleanliness. The same well OW 731A has the lowest cost of circulation fluids incurred compared to the other three wells.
3.2.2 Loss of circulation compared to well productivity
The analysis was done for a sample of 19 wells selected from the Olkaria geothermal field. The
covered depth was for the open hole section i.e. the production zone. Percentages were apportioned according to
the form of circulation returns experienced.Most of the wells sampled had over 70% of the drilled depth
experienced circulation returns during drilling. Wells which had a mixture of full returns, partial returns and no
returns have shown that their productivity is higher compared to the other categories and had an average
production capacity of 12.03 Mw.
Table 1: Analysis of loss of circulation
It may also be noted from Table 1 that wells which had full circulation during drilling are not the highest producers. Four wells with full circulation during the entire drilling have their production capacities
averaging 6.28 Mw. Wells which fall in the category of full and partial returns had an average production
capacity of 5.7 Mw.
Contribution of Underbalanced Drilling To Production Capacity at Olkaria Geothermal …..
www.iosrjournals.org 14 | Page
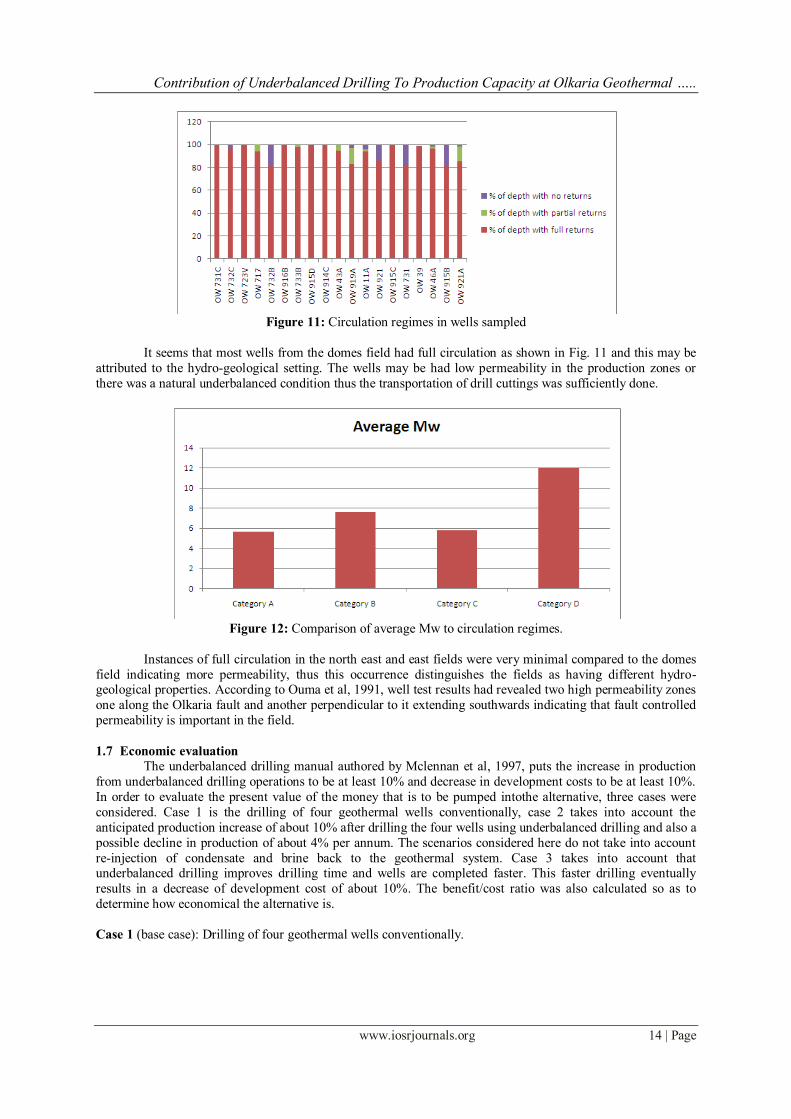
Figure 11: Circulation regimes in wells sampled
It seems that most wells from the domes field had full circulation as shown in Fig. 11 and this may be
attributed to the hydro-geological setting. The wells may be had low permeability in the production zones or
there was a natural underbalanced condition thus the transportation of drill cuttings was sufficiently done.
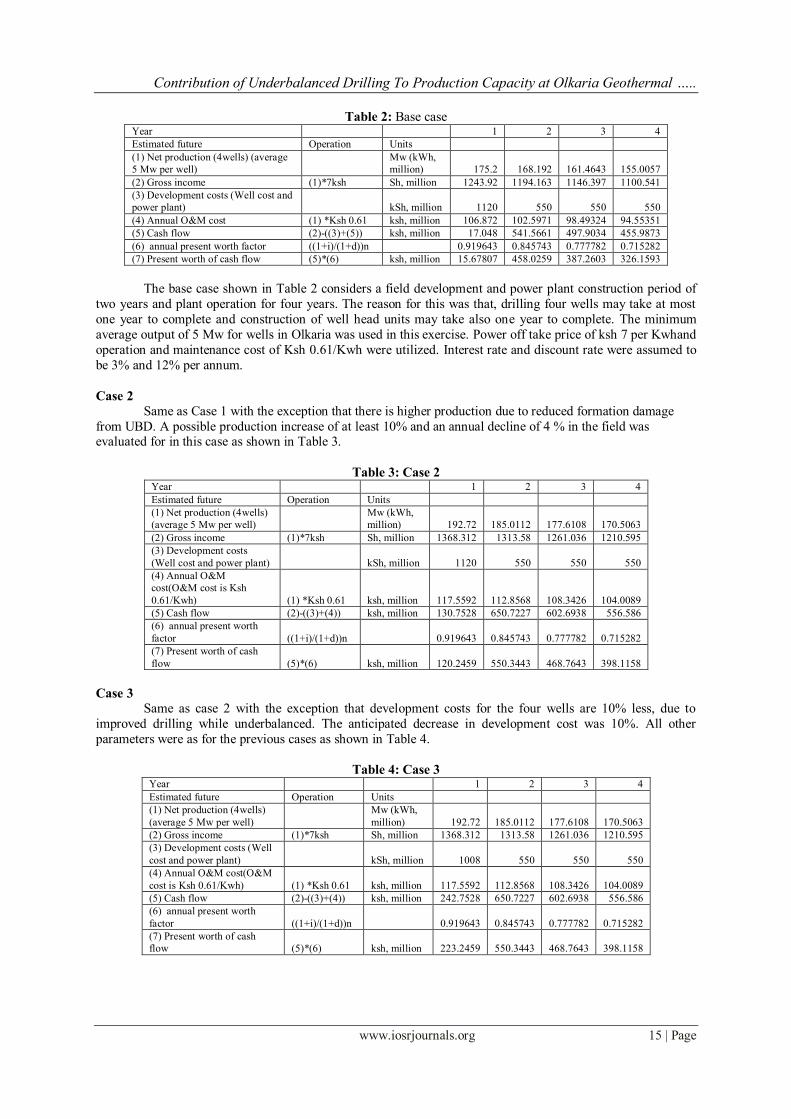
Figure 12: Comparison of average Mw to circulation regimes.
Instances of full circulation in the north east and east fields were very minimal compared to the domes
field indicating more permeability, thus this occurrence distinguishes the fields as having different hydro-geological properties. According to Ouma et al, 1991, well test results had revealed two high permeability zones
one along the Olkaria fault and another perpendicular to it extending southwards indicating that fault controlled
permeability is important in the field.
1.7 Economic evaluation
The underbalanced drilling manual authored by Mclennan et al, 1997, puts the increase in production
from underbalanced drilling operations to be at least 10% and decrease in development costs to be at least 10%.
In order to evaluate the present value of the money that is to be pumped intothe alternative, three cases were
considered. Case 1 is the drilling of four geothermal wells conventionally, case 2 takes into account the
anticipated production increase of about 10% after drilling the four wells using underbalanced drilling and also a
possible decline in production of about 4% per annum. The scenarios considered here do not take into account
re-injection of condensate and brine back to the geothermal system. Case 3 takes into account that underbalanced drilling improves drilling time and wells are completed faster. This faster drilling eventually
results in a decrease of development cost of about 10%. The benefit/cost ratio was also calculated so as to
determine how economical the alternative is.
Case 1 (base case): Drilling of four geothermal wells conventionally.
Contribution of Underbalanced Drilling To Production Capacity at Olkaria Geothermal …..
www.iosrjournals.org 15 | Page
Table 2: Base case Year 1 2 3 4
Estimated future Operation Units
(1) Net production (4wells) (average
5 Mw per well)
Mw (kWh,
million) 175.2 168.192 161.4643 155.0057
(2) Gross income (1)*7ksh Sh, million 1243.92 1194.163 1146.397 1100.541
(3) Development costs (Well cost and
power plant) kSh, million 1120 550 550 550
(4) Annual O&M cost (1) *Ksh 0.61 ksh, million 106.872 102.5971 98.49324 94.55351
(5) Cash flow (2)-((3)+(5)) ksh, million 17.048 541.5661 497.9034 455.9873
(6) annual present worth factor ((1+i)/(1+d))n 0.919643 0.845743 0.777782 0.715282
(7) Present worth of cash flow (5)*(6) ksh, million 15.67807 458.0259 387.2603 326.1593
The base case shown in Table 2 considers a field development and power plant construction period of
two years and plant operation for four years. The reason for this was that, drilling four wells may take at most
one year to complete and construction of well head units may take also one year to complete. The minimum
average output of 5 Mw for wells in Olkaria was used in this exercise. Power off take price of ksh 7 per Kwhand
operation and maintenance cost of Ksh 0.61/Kwh were utilized. Interest rate and discount rate were assumed to
be 3% and 12% per annum.
Case 2
Same as Case 1 with the exception that there is higher production due to reduced formation damage
from UBD. A possible production increase of at least 10% and an annual decline of 4 % in the field was evaluated for in this case as shown in Table 3.
Table 3: Case 2 Year 1 2 3 4
Estimated future Operation Units
(1) Net production (4wells)
(average 5 Mw per well)
Mw (kWh,
million) 192.72 185.0112 177.6108 170.5063
(2) Gross income (1)*7ksh Sh, million 1368.312 1313.58 1261.036 1210.595
(3) Development costs
(Well cost and power plant) kSh, million 1120 550 550 550
(4) Annual O&M
cost(O&M cost is Ksh
0.61/Kwh) (1) *Ksh 0.61 ksh, million 117.5592 112.8568 108.3426 104.0089
(5) Cash flow (2)-((3)+(4)) ksh, million 130.7528 650.7227 602.6938 556.586
(6) annual present worth
factor ((1+i)/(1+d))n 0.919643 0.845743 0.777782 0.715282
(7) Present worth of cash
flow (5)*(6) ksh, million 120.2459 550.3443 468.7643 398.1158
Case 3
Same as case 2 with the exception that development costs for the four wells are 10% less, due to
improved drilling while underbalanced. The anticipated decrease in development cost was 10%. All other
parameters were as for the previous cases as shown in Table 4.
Table 4: Case 3 Year 1 2 3 4
Estimated future Operation Units
(1) Net production (4wells)
(average 5 Mw per well)
Mw (kWh,
million) 192.72 185.0112 177.6108 170.5063
(2) Gross income (1)*7ksh Sh, million 1368.312 1313.58 1261.036 1210.595
(3) Development costs (Well
cost and power plant) kSh, million 1008 550 550 550
(4) Annual O&M cost(O&M
cost is Ksh 0.61/Kwh) (1) *Ksh 0.61 ksh, million 117.5592 112.8568 108.3426 104.0089
(5) Cash flow (2)-((3)+(4)) ksh, million 242.7528 650.7227 602.6938 556.586
(6) annual present worth
factor ((1+i)/(1+d))n 0.919643 0.845743 0.777782 0.715282
(7) Present worth of cash
flow (5)*(6) ksh, million 223.2459 550.3443 468.7643 398.1158

Contribution of Underbalanced Drilling To Production Capacity at Olkaria Geothermal …..
www.iosrjournals.org 16 | Page
Figure 13: Summary of the three cases
In case 1, all four wells were drilled in the first year with a conventional system . Case 2 is same as
Case 1 with the exception that there is higher production due to reduced formation damage from UBD. Case 3 is
same as case 2 with the exception that development costs for the four wells are 10% less, due to improved
drilling while underbalanced. Fig. 13 shows the net present value projections for four years of plant operation.
The criteria for an economical project should have a benefit/cost ratio of greater than one. Table 5 shows how
the ratio was obtained. The life span of the plant was assumed to be 30 years.
Table 5: Determination of the benefit cost ratio Discounted construction cost (Construction period 2 years)
Year 1 PVF (1 yr,12%) x cost in year 1 900,043,200.00
Year 2 PVF (2 yr,12%) x cost in year 2 1,315,380,000.00
Total discounted construction cost (Ksh) 2,215,423,200.00
Discounted operation and maintenance costs
Calculating present value of annuity from year 3 to 32
PVA (30 Yr, 12%) x Annual O&M cost x PVF (2Yr, 12%)
2,053,927,596.93
Total discounted costs (Ksh) 4,269,350,796.93
Discounted benefits
Calculate present value of annuity from year 3 to 32
PVA (30 yr, 12%) x annual benefit x PVF (2yr,12%)
Total discounted benefits (Ksh) 17,585,298,915.57
Benefit/cost ratio =PV (Discounted benefits)/PV (Discounted costs)
Benefit/cost ratio = 4.1
IV. Conclusion And Recomendation Volume fraction obtained in the simulation of the underbalanced drilling operation for the four wells
studied here placed the percentage of cuttings at less than 5%. This means that if the wells were drilled
underbalanced, hole cleanliness would have been highly achieved. Optimum flow rate ensures that the drill
cuttings are efficiently transported to the surface. The value obtained here was 0.03 m3/min for the water
fraction of the circulation fluid system. Circulation loss of drilling fluids helps to give an initial indication of
how permeable a well is and it is also disadvantaging because it may lead to the blockage of potential
production fractures. It is not a rule of the thumb that a well drilled with full circulation for the entire production
hole section to produce more than a well which had a mixed lost circulation regime for the same section.
Reservoir and hydro-geological properties of the geothermal system also play an important role in such a
scenario. The expected result of wells under the category of full returns to be more productive than wells in the
other categories was not achieved. However, a completely opposing occurrence was noticed whereby wells which had a mixed regime of circulation are the highest producers on average. The economic evaluation showed
that the financial benefit of utilizing underbalanced drilling is higher in the long run compared to the
conventional drilling procedures. The high benefit cost ratio of above 4.1 is a true picture of the benefits. It is
recommended that under balanced drilling be considered and applied fully in the drilling of geothermal wells in
the Olkaria geothermal field. Drilling personnel should also be given more detailed training in under balanced
drilling procedures. Additional underbalanced drilling choke manifolds and valves should be acquired.This
study also recommends more simulation of underbalanced drilling to be done using other simulation softwares
so as to compare the findings.

Contribution of Underbalanced Drilling To Production Capacity at Olkaria Geothermal …..
www.iosrjournals.org 17 | Page
Acknowledgements We thank E. Bett and V. Atwa from KenGen for their assistance in material collection at Olkaria Geothermal
steam field.
References [1]. Putra M. K. A. (2008). Drilling practice with aerated drilling fluid: Indonesian and Icelandic geothermal fields. UNU GTP report
11, United Nations University, Iceland.
[2]. Finger, J., and Blankenship, D., 2010: Handbook of best practices for geothermal. Sandia National Laboratories, report SAND2010-
6048, 84 pp.
[3]. Hole, H., 2008: Drilling fluids for drilling of geothermal wells. Presented at Petroleum Engineering Summer School, Dubrovnik,
Croatia, Workshop 26, 21 pp.
[4]. Guimerans R., Curtis F., Urbanowski R., Wilson B., Ruiz S., Fluid Selection for Underbalanced Drilling Operations, presented at
the UB Technology Conference 2001.
[5]. Chemwotei S., 2011: Geothermal drilling fluids. Report 10 in: Geothermal training in Iceland 2011. UNU-GTP, Iceland, 149-177.
[6]. Odongo M. E. O.(1984).Geology of Olkaria Geothermal Field. Kenya Power Company report no. GL/OW/020.
[7]. Omenda P. 1998, The geology and structural controls of the olkaria geothermal system, Geothermics, Vol. 27, No.1, pp. 55-
74, 1998
[8]. Mungania J. (1999). Summary of updates of the geology of the Olkaria Domes geothermal field. Kenya Electricity Generating
Company, Ltd., unpublished report.
[9]. Pearce D., Atkinson G. and Mourato S. (2006).Cost Benefit Analysis and the environment; recent developments. Organization for
Economic Cooperation and Development (OECD) Publishing, Paris, France.
[10]. Signa Engineering Corporation (2012). “ Hydraulic Underbalanced Simulator user guide”. http://www.signa.net
[11]. Tian S., Finger J. T. (1999), Advanced geothermal well bore hydraulics model. Energy sources technology conference and
exhibition, Feb 1-3 1999, Houston, Texas.
[12]. Ouma P., Ambusso W., 1991, Thermodynamic and permeability structure of Olkaria North-East Geothermal Field: Olkaria fault,
Annual Meeting of the Geothermal Resources Council; Sparks, NV, USA; 6 October 1991 through 9 October 1991, Volume 15,
1991, Pages 237-242.
[13]. Mclennan J., Carden R. S. and Curry D. (1997), Underbalanced Drilling Manual (GRI), GRI 97/0236