Contribution of Road Grade to the Energy Use of Modern ... · Los Angeles, CA 1,405 186,871...
11
NREL is a national laboratory of the U.S. Department of Energy Office of Energy Efficiency & Renewable Energy Operated by the Alliance for Sustainable Energy, LLC. This report is available at no cost from the National Renewable Energy Laboratory (NREL) at www.nrel.gov/publications. Contract No. DE-AC36-08GO28308 Contribution of Road Grade to the Energy Use of Modern Automobiles Across Large Datasets of Real-World Drive Cycles Preprint Eric Wood, Evan Burton, Adam Duran, and Jeff Gonder To be presented at the SAE World Congress 2014 Detroit, Michigan April 8-10, 2014 Conference Paper NREL/CP-5400-61108 January 2014
Transcript of Contribution of Road Grade to the Energy Use of Modern ... · Los Angeles, CA 1,405 186,871...

NREL is a national laboratory of the U.S. Department of Energy Office of Energy Efficiency & Renewable Energy Operated by the Alliance for Sustainable Energy, LLC.
This report is available at no cost from the National Renewable Energy Laboratory (NREL) at www.nrel.gov/publications.
Contract No. DE-AC36-08GO28308
Contribution of Road Grade to the Energy Use of Modern Automobiles Across Large Datasets of Real-World Drive Cycles Preprint Eric Wood, Evan Burton, Adam Duran, and Jeff Gonder To be presented at the SAE World Congress 2014 Detroit, Michigan April 8-10, 2014
Conference Paper NREL/CP-5400-61108 January 2014
NOTICE
The submitted manuscript has been offered by an employee of the Alliance for Sustainable Energy, LLC (Alliance), a contractor of the US Government under Contract No. DE-AC36-08GO28308. Accordingly, the US Government and Alliance retain a nonexclusive royalty-free license to publish or reproduce the published form of this contribution, or allow others to do so, for US Government purposes.
This report was prepared as an account of work sponsored by an agency of the United States government. Neither the United States government nor any agency thereof, nor any of their employees, makes any warranty, express or implied, or assumes any legal liability or responsibility for the accuracy, completeness, or usefulness of any information, apparatus, product, or process disclosed, or represents that its use would not infringe privately owned rights. Reference herein to any specific commercial product, process, or service by trade name, trademark, manufacturer, or otherwise does not necessarily constitute or imply its endorsement, recommendation, or favoring by the United States government or any agency thereof. The views and opinions of authors expressed herein do not necessarily state or reflect those of the United States government or any agency thereof.
This report is available at no cost from the National Renewable Energy Laboratory (NREL) at www.nrel.gov/publications.
Available electronically at http://www.osti.gov/bridge
Available for a processing fee to U.S. Department of Energy and its contractors, in paper, from:
U.S. Department of Energy Office of Scientific and Technical Information P.O. Box 62 Oak Ridge, TN 37831-0062 phone: 865.576.8401 fax: 865.576.5728 email: mailto:[email protected]
Available for sale to the public, in paper, from:
U.S. Department of Commerce National Technical Information Service 5285 Port Royal Road Springfield, VA 22161 phone: 800.553.6847 fax: 703.605.6900 email: [email protected] online ordering: http://www.ntis.gov/help/ordermethods.aspx
Cover Photos: (left to right) photo by Pat Corkery, NREL 16416, photo from SunEdison, NREL 17423, photo by Pat Corkery, NREL 16560, photo by Dennis Schroeder, NREL 17613, photo by Dean Armstrong, NREL 17436, photo by Pat Corkery, NREL 17721.
Printed on paper containing at least 50% wastepaper, including 10% post consumer waste.

1
This report is available at no cost from the National Renewable Energy Laboratory (NREL) at www.nrel.gov/publications.
Contribution of road grade to the energy use of modern automobiles across large datasets of real-world drive cycles
Eric Wood, Evan Burton, Adam Duran, and Jeff Gonder
National Renewable Energy Laboratory
Abstract
Understanding the real-world power demand of modern automobiles is of critical importance to engineers using modeling and simulation in the design of increasingly efficient powertrains. Increased use of global positioning system (GPS) devices has made large-scale data collection of vehicle speed (and associated power demand) a reality. While the availability of real-world GPS data has improved the industry’s understanding of in-use vehicle power demand, relatively little attention has been paid to the incremental power requirements imposed by road grade.
This analysis quantifies the incremental efficiency impacts of real-world road grade by appending high-fidelity elevation profiles to GPS speed traces and performing a large simulation study. Employing a large, real-world dataset from the National Renewable Energy Laboratory’s Transportation Secure Data Center, vehicle powertrain simulations are performed with and without road grade under five vehicle models. Aggregate results of this study suggest that road grade could be responsible for 1% to 3% of fuel use in light-duty automobiles.
Introduction
Understanding the real-world power demands of modern automobiles is of critical importance to engineers using modeling and simulation in the design of increasingly efficient powertrains. Historically, duty cycle characterization has been constrained to a relatively small number of “industry standard” drive cycles; in the United States, most notably the U.S. Enviornmental Protection Agency’s urban dynometer drive schedule and the Highway Fuel Economy Test driving schedule [1]. In recent years, the advent of ubiquitous global positioning systems (GPS) has made large-scale data collection of vehicle speed (and associated power demand) a reality. The insights afforded by these large databases of real-world drive cycles have been applied to numerous research areas including infrastructure utilization estimation and energy use quantification [2–16].
While the availability of real-world GPS data has improved the industry’s understanding of in-use vehicle power demands, little to no attention has been paid to the additional
power requirements imposed by road grade. High-resolution elevation data have the potential to dramatically influence energy consumption by inducing hill climbs that require additional power and/or descents that could be leveraged by regenerative braking systems to improve efficiency. These circumstances are expected to have compounding effects when coupled with real-world vehicle speed traces.
This study seeks to shed light on the implications real-world road grade has on vehicle energy use by (1) selecting a large dataset of real-world vehicle drive cycles collected via GPS, (2) appending high precision road grade values to said drive cycle data via a filtered digital elevation model (DEM), and (3) simulating the dataset over a matrix of vehicle models to quantify the incremental impacts of road grade on energy use.
METHODOLOGY
GPS Dataset
Vehicle speed data for this study are sourced from the National Renewable Energy Laboratory’s (NREL’s) Transportation Secure Data Center (TSDC) [17]. Specifically, 1-hertz travel histories 1 to 7 days in duration are queried from 6,264 vehicles across the United States, comprising over 250,000 unique trips and approximately 878,000 miles of travel. These data represent a composite of several data collection efforts from Metropolitan Planning Organizations across the country as documented on the TSDC website. Table 1 summarizes the metropolitan areas under study in this paper. Average driving distance, speed, and acceleration statistics are presented in Appendix Figures A1–A3 with individual driving histories divided into quartiles.
Appending Road Grade
This paper appends high-resolution road grade data to GPS speed traces by (1) querying a DEM for raw elevations corresponding to the GPS latitude/longitude information of the speed trace, (2) sending raw elevation values through a multi-step filtration routine to eliminate artificial noise from the distance derivitive of the elevation signal, and (3) performing differential elevation and distance calculations to determine road grade.
2
This report is available at no cost from the National Renewable Energy Laboratory (NREL) at www.nrel.gov/publications.
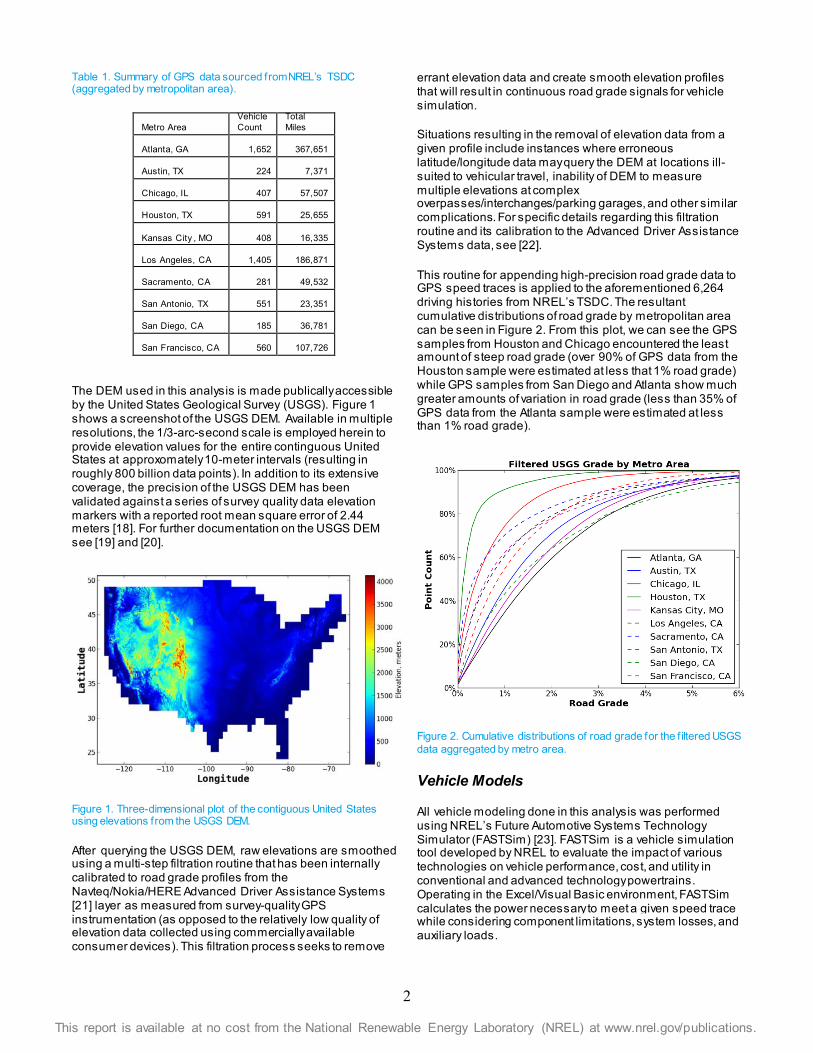
Table 1. Summary of GPS data sourced from NREL’s TSDC (aggregated by metropolitan area).
Metro Area Vehicle Count
Total Miles
Atlanta, GA
1,652
367,651
Austin, TX
224
7,371
Chicago, IL
407
57,507
Houston, TX
591
25,655
Kansas City , MO
408
16,335
Los Angeles, CA
1,405
186,871
Sacramento, CA
281
49,532
San Antonio, TX
551
23,351
San Diego, CA
185
36,781
San Francisco, CA
560
107,726
The DEM used in this analysis is made publically accessible by the United States Geological Survey (USGS). Figure 1 shows a screenshot of the USGS DEM. Available in multiple resolutions, the 1/3-arc-second scale is employed herein to provide elevation values for the entire continguous United States at approxomately 10-meter intervals (resulting in roughly 800 billion data points). In addition to its extensive coverage, the precision of the USGS DEM has been validated against a series of survey quality data elevation markers with a reported root mean square error of 2.44 meters [18]. For further documentation on the USGS DEM see [19] and [20].
Figure 1. Three-dimensional plot of the contiguous United States using elevations from the USGS DEM.
After querying the USGS DEM, raw elevations are smoothed using a multi-step filtration routine that has been internally calibrated to road grade profiles from the Navteq/Nokia/HERE Advanced Driver Assistance Systems [21] layer as measured from survey-quality GPS instrumentation (as opposed to the relatively low quality of elevation data collected using commercially available consumer devices). This filtration process seeks to remove
errant elevation data and create smooth elevation profiles that will result in continuous road grade signals for vehicle simulation.
Situations resulting in the removal of elevation data from a given profile include instances where erroneous latitude/longitude data may query the DEM at locations ill-suited to vehicular travel, inability of DEM to measure multiple elevations at complex overpasses/interchanges/parking garages, and other similar complications. For specific details regarding this filtration routine and its calibration to the Advanced Driver Assistance Systems data, see [22].
This routine for appending high-precision road grade data to GPS speed traces is applied to the aforementioned 6,264 driving histories from NREL’s TSDC. The resultant cumulative distributions of road grade by metropolitan area can be seen in Figure 2. From this plot, we can see the GPS samples from Houston and Chicago encountered the least amount of steep road grade (over 90% of GPS data from the Houston sample were estimated at less that 1% road grade) while GPS samples from San Diego and Atlanta show much greater amounts of variation in road grade (less than 35% of GPS data from the Atlanta sample were estimated at less than 1% road grade).
Figure 2. Cumulative distributions of road grade for the f iltered USGS data aggregated by metro area.
Vehicle Models
All vehicle modeling done in this analysis was performed using NREL’s Future Automotive Systems Technology Simulator (FASTSim) [23]. FASTSim is a vehicle simulation tool developed by NREL to evaluate the impact of various technologies on vehicle performance, cost, and utility in conventional and advanced technology powertrains. Operating in the Excel/Visual Basic environment, FASTSim calculates the power necessary to meet a given speed trace while considering component limitations, system losses, and auxiliary loads.

3
This report is available at no cost from the National Renewable Energy Laboratory (NREL) at www.nrel.gov/publications.
Five light-duty powertrains are modeled for the exercise of assessing the impact of real-world road grade on vehicle efficiency. These models consist of conventional spark-ignited gasoline (CV) and hybrid electric (HEV) variants of a mid-sized sedan (similar to the 2012 Ford Fusion) and a large sport utility vehicle (SUV) (similar to the 2012 Toyota Highlander). An all-electric mid-sized hatchback is also included (similar to the 2012 Nissan Leaf) to study impacts of road grade on efficiency in all-electric passenger vehicles. Relevant parameters of these vehicle models can be found in Table 2.
Table 2. Vehicle parameters used in FASTSim models.
Parameter Mid-Size Sedan (CV)
Mid-Size Sedan (HEV)
Mid-Size Hatchback (BEV)
Large SUV (CV)
Large SUV (HEV)
Frontal Area, m2
2.12 2.12 2.74 3.36 3.36
Drag Coefficient
0.33 0.33 0.33 0.34 0.34
Simulated Mass, kg
1644 1823 1701 2404 2632
Accessory Load, W
700 300 300 700 300
Internal Combustion Engine Power, kW
131 116 --- 201 172
Battery Power, kW
--- 28 90 --- 40
Simulated Combined EPA Fuel Economy
8.7L/ 100km (27 mpg)
5.5L/ 100km (43 mpg)
216 Wh/ km (347 Wh/mi)
12L/ 100km (20 mpg)
7.8L/ 100km (30 mpg)
RESULTS
The five vehicle models were simulated in FASTSim over 1-hertz travel histories 1 to 7 days in duration from 6,264 vehicle histories, comprising over 250,000 unique trips and approximately 878,000 miles of travel. These drive cycles were simulated twice: first assuming no road grade and then using the filtered USGS road grade data. These simulations are presented as unadjusted results that do not account for thermal effects such as cold starts and cabin climate control. As such, the results presented herein underestimate average fuel use relative to the adjusted U.S. Environmental Protection Agency calculations shown in Table 2.
Results are first presented for the simulations that were run without road grade. Figure 3 shows distributions of energy consumption rates for the five simulated vehicles where energy is calculated as equivalent liters of gasoline per 100 km where electricity use in the HEV and BEV models is converted assuming one gallon of gasoline is equivalent to 33.7 kWh of electricity (lower heating value of gasoline). This plot not only demonstrates the relative efficiency of each vehicle model, but also conveys that significant variation in vehicle efficiency exists within each model based on the nature of the requested speed input from the TSDC drive cycle database.
To briefly expound on the sensitivity of vehicle efficiency to drive cycle characteristics, Figures 4 and 5 are presented for the midsize CV and HEV, respectively, to show correlations between vehicle speed, acceleration, distance driven, and efficiency. These scatter plots consist of markers for each simulated trip (without appending road grade) where the position of each marker relates the average speed and acceleration of the trip, the size of the marker relates the distance driven, and color relates the simulated efficiency in FASTSim. Please note that the color scale is not consistent between plots and has been selected to achieve a gradient that aids visualization.
Figure 3. Simulated energy consumption rates for all GPS data without appending road grade (broken out by vehicle).
Figure 4. Simulated fuel economy for subset of GPS data without appending road grade (Midsize CV vehicle model).
While these plots contain a wealth of information regarding the relationship between drive cycle characteristics and vehicle efficiency, we will refer the reader to existing literature [4] that dissects such plots of large real-world datasets coupled with vehicle simulation results in great detail in order
Midsize CV Midsize HEV Midsize BEV SUV CV SUV HEV0
5
10
15
20
Ga
s E
q F
ue
l Ra
te, L
/10
0k
m
All GPS Data, No Grade

4
This report is available at no cost from the National Renewable Energy Laboratory (NREL) at www.nrel.gov/publications.
to continue with the present investigation of road grade effects on vehicle efficiency.
Following analysis of simulation results without road grade, vehicle simulation inclusive of road grade derived from a filtered version of the USGS DEM are now considered. Table 3 presents results for the percent increase in energy use as a result of including road grade in the vehicle simulations; herein this value will be referred to as the “grade penalty.” Results are aggregated by metro area and vehicle model.
Figure 5. Simulated fuel economy for subset of GPS data without appending road grade (Midsize HEV vehicle model).
It can be seen that the grade penalty is sensitive to both metropolitan area and vehicle model. In terms of geography, Houston experienced the smallest grade penalty across all vehicle models (0.1%–0.2%) while San Diego experienced the largest grade penalty across all vehicle models (2.8%–4.1%). This outcome can be seen to approximately coincide with the grade content from each metropolitan area GPS sample (see Figure 2).
Table 3. Percent increase in simulated energy use as a result of appending road grade to GPS data. Data aggregated by vehicle model and metropolitan area.
Metropolitan Area Midsize CV
Midsize HEV
Midsize BEV
SUV CV
SUV HEV
Atlanta, GA 2.4% 1.2% 1.4% 2.4% 1.1%
Austin, TX 2.5% 1.4% 1.5% 2.5% 1.5%
Chicago, IL 0.6% 0.2% 0.3% 0.6% 0.2%
Houston, TX 0.2% 0.1% 0.1% 0.2% 0.1%
Kansas City, MO 2.5% 1.1% 1.4% 2.5% 1.2%
Los Angeles, CA 2.5% 1.8% 1.6% 2.4% 1.8%
Sacramento, CA 2.4% 1.7% 1.5% 2.4% 1.8%
San Antonio, TX 1.5% 1.0% 1.2% 1.5% 1.0%
San Diego, CA 4.1% 3.0% 2.8% 4.1% 2.9%
San Francisco, CA 3.1% 2.0% 2.1% 3.1% 2.1%
In terms of grade penalty sensitivity to vehicle model, the CV powertrains experienced consistently larger grade penalties (25% to 73% greater) than their HEV counterparts. This outcome is assumed to be a result of the hybrid regenerative braking system experiencing improved efficiency in situations such as decelerating on a downhill grade and recapturing energy that would otherwise be lost as heat during conventional braking. Grade penalties between the midsize HEV and BEV models were approximately the same.
While the aggregate results for grade penalty presented in Table 3 point to penalties generally between 1% and 3%, it is important to note that at the trip level, the results are significantly more variable. Figure 6 shows grade penalty results at the trip level broken out by vehicle model. It can be seen that for any of the simulated powertrains, energy consumption can increase or decrease by double digit percentage points depending on the nature of the road grade appended. Drive cycles with a net increase in elevation would be expected to show significant increases in fuel consumption while drive cycles that exhibit net decreases in elevation have the potential to decrease fuel consumption.
Figure 6. Percent increase in simulated energy use as a result of appending road grade to GPS data. Data aggregated by vehicle model and simulated trip.
The sensitivity of vehicle incremental efficiency to road grade is further explored for the midsize CV and HEV models in Figures 7 and 8, respectively (a comparable plot for the midsize BEV is omitted as it closely resembles the midsize HEV). Trip grade penalty is scattered versus trip average road grade in these plots showing a roughly linear relationship. Additionally, each trip marker is colored by the root mean square (RMS) of road grade for that trip with marker size again reflective of trip distance. The relationship between the trip grade penalty and RMS road grade demonstrates that even trips with net zero elevation change can be significantly impacted by road grade.
Additionally, the response of each powertrain to average and RMS road grade can be contrasted. The midsize HEV demonstrates a noticeably steeper relationship between trip grade penalty and average road grade. This result is
Midsize CV Midsize HEV Midsize BEV SUV CV SUV HEV
-40%
-20%
0%
20%
40%G
rad
e P
en
alt
y b
y T
rip
All GPS Data

5
This report is available at no cost from the National Renewable Energy Laboratory (NREL) at www.nrel.gov/publications.
hypothesized to be a result of the nominally smaller fuel rates experienced by the HEV and the significantly smaller engine in the HEV (recall from Table 2 that the midsize HEV model has a 13% smaller engine than its CV counterpart). This smaller engine is thus forced to more extreme operating conditions in order to achieve the same requested speed under grade. It is also evident that the midsize HEV is less sensitive to RMS road grade than the CV model. Presumably this finding can be linked to the ability of the HEV to capture energy via regenerative braking during downhill deceleration events. Alternatively, the CV is more severely impacted by RMS road grade in a “rolling hills” situation where energy is dissipated as heat during downhill breaking events.
Figure 7. Sensitivity of trip percent energy increase to average road grade and root mean square road grade for the midsize CV.
Figure 8. Sensitivity of trip percent energy increase to average road grade and root mean square road grade for the midsize HEV.
SUMMARY
This paper has demonstrated the ability to utilize a DEM to append filtered elevations to GPS speed data collected in large-scale studies. The filtered elevation data can then be used to calculate road grade for use in powertrain simulation programs. The light-duty platforms simulated in this study, based on over 878,000 miles of driving data, experienced approximately 1% to 3% average energy consumption penalty as a result of including road grade in the simulation. Sensitivity to road grade was also investigated with select trips showing double digit percentage changes in energy use relative to trips containing no net elevation change and/or significant RMS grade.
6
This report is available at no cost from the National Renewable Energy Laboratory (NREL) at www.nrel.gov/publications.
References
1. U.S. Environmental Protection Agency, “Dynamometer Drive Schedules,” accessed October 2013, http://www.epa.gov/nvfel/testing/dynamometer.htm,
2. Simpson, M., and Markel, T., “Plug-In Electric Vehicle Fast Charge Station Operational Analysis w ith Integrated Renew ables,” International Battery, Hybrid, and Fuel Cell Electric Vehicle Symposium, May 2012, http://www.nrel.gov/docs/fy12osti/53914.pdf.
3. Attibele, P., Makam, S., and Lee, Y., “A Comparison of Real World and Accelerated Pow ertrain Endurance Cycles for Light-Duty Vehicles,” Innovative Automotive Transmissions, Hybrid and Electric Drives, May 2013.
4. Neubauer, J., and Wood, E., “Accounting for the Variation of Driver Aggression in the Simulation of Conventional and Advanced Vehicles,” Society of Automotive Engineers World Congress, April 2013, http://www.nrel.gov/docs/fy13osti/58609.pdf.
5. Lin, Z., Dong, J., Liu, C., and Greene, D., “PHEV Energy Use Estimation: Validating the Gamma Distribution for Representing the Random Daily Driving Distance,” Transportation Research Board Annual Meeting, January 2012, http://pressamp.trb.org/conferenceinteractiveprogram/PresentationDetails.aspx?ID=48184&Email=.
6. Khan, M., and Kockelman, K., “Predicting the Market Potential of Plug-In Electric Vehicles Using Multiday GPS Data,” Transportation Research Board Annual Meeting, January 2012, http://www.caee.utexas.edu/prof/kockelman/public_html/TRB12PEVuse.pdf.
7. Young, R., and Seaman, S., “Improving Survey Methods Using a New Objective Metric for Measuring Driving Time Variability in Survey and GPS Data,” Transportation Research Board Annual Meeting, January 2012, http://trid.trb.org/view.aspx?id=1130665.
8. Wood, E., Neubauer, J., Brooker, A., Gonder, J., et al., “Variability of Battery Wear in Light-Duty Plug-In Electric Vehicles Subject to Ambient Temperature, Vehicle Design, and Consumer Usage,” Electric Vehicle Symposium, May 2012, http://www.nrel.gov/docs/fy12osti/53953.pdf.
9. Smith, K., Neubauer, J., Earleyw ine, M., Wood, E., et al., “Comparison of Plug-In Hybrid Electric Vehicle Battery Life across Geographies and Drive Cycles,” Society of Automotive Engineers World Congress, April 2012, http://www.nrel.gov/docs/fy12osti/53817.pdf.
10. Smith, K., Earleyw ine, M., Wood, E., and Pesaran, A., “Battery Wear from Disparate Duty Cycles: Opportunities for Electric-Drive Vehicle Battery Health Management,” American Control Conference, June 2012, http://www.nrel.gov/docs/fy13osti/54698.pdf.
11. Neubauer, J., Brooker, A., Wood. E., Johnson, C., et al., “Sensitivity of Battery Electric Vehicle Economics to Drive Patterns, Vehicle Range, and Charge Strategies,” Journal of Power Sources, July 2012, http://www.sciencedirect.com/science/article/pii/S0378775312005290.
12. Neubauer, J., Brooker, A., and Wood, E., “Sensitivity of Plug-In Hybrid Electric Vehicle Economics to Drive Patterns, Electric Range, Energy Management, and Charge Strategies,” Journal of Power Sources, July 2012, http://www.sciencedirect.com/science/article/pii/S0378775312011809.
13. Gonder, J., Earleyw ine, M., and Sparks, W., “Analyzing Vehicle Fuel Saving Opportunities through Intelligent Driver Feedback,” SAE Int. J. Passeng. Cars – Electronic and Electrical Systems, September 2012, http://www.nrel.gov/docs/fy12osti/53864.pdf.
14. Earleyw ine, M., Gonder, J., Markel, T., and Thornton, M., “Simulated Fuel Economy and Performance of Advanced Hybrid Electric and Plug-In Hybrid Electric Vehicles Using In-Use Travel Profiles,” IEEE Vehicle Pow er and Propulsion Conference, September 2010, http://www.nrel.gov/docs/fy13osti/48773.pdf.
15. Gonder, J., Markel, T., Thornton, M., and Simpson, A., “Using Global Positioning System Travel Data to Assess Real-World Energy Use of Plug-In Hybrid Electric Vehicles,” Journal of the Transportation Research Board – Sustainability, Energy, and Alternative Fuels, 2007, http://www.nrel.gov/docs/fy07osti/40858.pdf.
16. Tate, E., Harpster, M., and Savagian, P., “The Electrif ication of the Automobile: From Conventional Hybrid, to Plug-In Hybrids, to Extended Range Electric Vehicles,” Society of Automotive Engineers World Congress, April 2008, http://www.media.gm.com/content/dam/Media/microsites/product/volt/docs/paper.pdf.
17. National Renew able Energy Laboratory, “Transportation Secure Data Center,” Accessed October, 2013: www.nrel.gov/tsdc.
18. United States Geological Survey, “Vertical Accuracy of the National Elevation Dataset,” in Digital Elevation Model Technologies and Applications: The DEM User’s Manual, Second Edition, http://ned.usgs.gov/downloads/documents/NED_Accuracy.pdf.
19. United States Geological Survey, “The National Map,” accessed October 2013, http://nationalmap.gov/view er.html.
20. United States Geological Survey, “National Elevation Dataset,” accessed October 2013, http://ned.usgs.gov/.
21. “Navteq Advanced Driver Assistance Systems,” accessed October 2013, http://www.navteq.com/industries_automotive.htm.
22. Wood, E., Burton, E., Duran, A., Gonder, J., et al., “Appending high resolution elevation data to GPS speed traces for vehicle energy modeling and simulation” Technical Report of the National Renew able Energy Laboratory, TP-5400-61109, http://www.nrel.gov/docs/fy14osti/61109.pdf.
23. National Renew able Energy Laboratory, “Future Automotive Systems Technology Simulator,” accessed October 2013, www.nrel.gov/fastsim.

7
This report is available at no cost from the National Renewable Energy Laboratory (NREL) at www.nrel.gov/publications.
Contact Information
Transportation and Hydrogen Systems Center National Renewable Energy Laboratory 15013 Denver West Pkwy MS 1634 Golden, CO 80401 Eric Wood (303) 275-3290 [email protected] Evan Burton (303) 275-3664 [email protected] Adam Duran (303) 275-4586 [email protected] Jeffrey Gonder (303) 275-4462 [email protected]
Acknowledgments
This study and the related data archiving and processing in the TSDC have been jointly supported by the U.S. Department of Energy’s Vehicle Technologies Office and by the U.S. Department of Transportation’s Federal Highway Administration. The authors would specifically like to thank Lee Slezak and David Anderson of the U.S. Department of Energy and Elaine Murakami of the U.S. Department of Transportation for their guidance and support. Use of the FASTSim vehicle modeling tool, developed at the National Renewable Energy Laboratory under funding from the U.S. Department of Energy’s Vehicle Technologies Office, was critical to the completion of this study. Special thanks to Aaron Brooker and Sean Lopp for supporting our use of FASTSim.

8
This report is available at no cost from the National Renewable Energy Laboratory (NREL) at www.nrel.gov/publications.
Definitions/Abbreviations
BEV battery electric vehicle
CV conventional vehicle
DEM digital elevation model
FASTSim Future Automotive Systems Technology Simulator
GPS global positioning system
HEV hybrid electric vehicle
NREL National Renewable Energy Laboratory
RMS root mean square
SUV sport utility vehicle
TSDC Transportation Secure Data Center
USGS United States Geological Survey

9
This report is available at no cost from the National Renewable Energy Laboratory (NREL) at www.nrel.gov/publications.
Appendix
Figure A1. Average daily driving distance of GPS data by metropolitan area.
Figure A2. Average driving speed of GPS data by metropolitan area.
Figure A3. Average daily driving positive acceleration of GPS data by metropolitan area.
Atlanta, GAAustin, TX
Chicago, ILHouston, TX
Kansas City, MO
Los Angeles, CA
Sacramento, CA
San Antonio, TX
San Diego, CA
San Francisco, CA0
20
40
60
80
100
120
Av
era
ge
Da
ily D
ista
nc
e, m
iles
Atlanta, GAAustin, TX
Chicago, ILHouston, TX
Kansas City, MO
Los Angeles, CA
Sacramento, CA
San Antonio, TX
San Diego, CA
San Francisco, CA0
10
20
30
40
50
60
70
80
Ave
rag
e S
pee
d,
mp
h
Atlanta, GAAustin, TX
Chicago, ILHouston, TX
Kansas City, MO
Los Angeles, CA
Sacramento, CA
San Antonio, TX
San Diego, CA
San Francisco, CA0.0
0.5
1.0
1.5
2.0
2.5
3.0
Av
era
ge
Po
sit
ive
Ac
ce
lera
tio
n, m
ph
/s