Contribution of laser microdissection-based technology to proteomic analysis in hepatocellular...
10
RESEARCH ARTICLE Contribution of laser microdissection-based technology to proteomic analysis in hepatocellular carcinoma developing on cirrhosis Alexandre Dos Santos 1 , Valérie Thiers 1, 2 , Sokhavuth Sar 1 , Nicolas Derian 1 , Noura Bensalem 3 , Funda Yilmaz 1 , Marie-Pierre Bralet 1, 4 , Béatrice Ducot 5 , Christian Bréchot 1 and France Demaugre 1 1 INSERM, U785, Villejuif, France 2 Institut Pasteur, Departement de Virologie, Paris, France 3 INSERM, U845, Paris, France 4 AP-HP, Hôpital Paul Brousse, Laboratoire d’anatomie pathologique, Villejuif, France 5 INSERM, U822, Le Kremlin-Bicêtre, France Hepatocellular carcinoma (HCC) is a major cause of cancer worldwide. Proteomic studies pro- vide opportunities to uncover targets for the diagnosis and treatment of this disease. However, in HCC developing in a setting of cirrhosis, the detection of proteome alterations may be hampered by the increased cellular heterogeneity of tissue when analysing global liver homo- genates. The aim of this study was to evaluate whether the identification of proteome altera- tions in these HCC cases was improved when the differential protein profile between tumour and non-tumour areas of liver was determined using hepatocytes isolated by laser micro- dissection (LM). Differential profiles established with LM-hepatocytes and liver section homo- genates using 2-DE and MS exhibited noticeable differences: 30% of the protein spots with deregulated expression in tumorous LM-samples did not display any modification in homo- genates; conversely 15% of proteins altered in tumorous homogenates were not impaired in LM-hepatocytes. These alterations resulted from the presence in cirrhotic liver of fibrotic stroma which displayed a protein pattern different from that determined in LM-hepatocytes. In conclusion, our data demonstrate the interest of LM in distinguishing between fibrotic and hepatocyte proteome alterations and thus the benefit of LM to proteome studies of HCC developing in a context of cirrhosis. Received: July 3, 2006 Revised: January 24, 2007 Accepted: February 28, 2007 Keywords: Cirrhosis / Hepatitis C virus / Hepatocellular carcinoma / Laser microdissection Proteomics Clin. Appl. 2007, 1, 545–554 545 1 Introduction Hepatocellular carcinoma (HCC) is an important cause of cancer worldwide [1] and its incidence is increasing mark- edly in North America and Europe [2]. Chronic infections due to hepatitis C (HCV) and hepatitis B (HBV) viruses are the principal aetiological factors. Thus, in most cases, HCC develops in a context of cirrhosis resulting from chronic Correspondence: Dr. France Demaugre, INSERM U785, Bâtiment Lavoisier, 16 Avenue Paul Vaillant-Couturier, 94807 Villejuif cedex, France E-mail: [email protected] Fax: 133-145-596-090 Abbreviations: HCC, hepatocellular carcinoma; LM, laser micro- dissection DOI 10.1002/prca.200600474 © 2007 WILEY-VCH Verlag GmbH & Co. KGaA, Weinheim www.clinical.proteomics-journal.com
-
Upload
alexandre-dos-santos -
Category
Documents
-
view
212 -
download
0
Transcript of Contribution of laser microdissection-based technology to proteomic analysis in hepatocellular...

RESEARCH ARTICLE
Contribution of laser microdissection-based technology
to proteomic analysis in hepatocellular carcinoma
developing on cirrhosis
Alexandre Dos Santos1, Valérie Thiers1, 2, Sokhavuth Sar1, Nicolas Derian1,Noura Bensalem3, Funda Yilmaz1, Marie-Pierre Bralet1, 4, Béatrice Ducot5,Christian Bréchot1 and France Demaugre1
1 INSERM, U785, Villejuif, France2 Institut Pasteur, Departement de Virologie, Paris, France3 INSERM, U845, Paris, France4 AP-HP, Hôpital Paul Brousse, Laboratoire d’anatomie pathologique, Villejuif, France5 INSERM, U822, Le Kremlin-Bicêtre, France
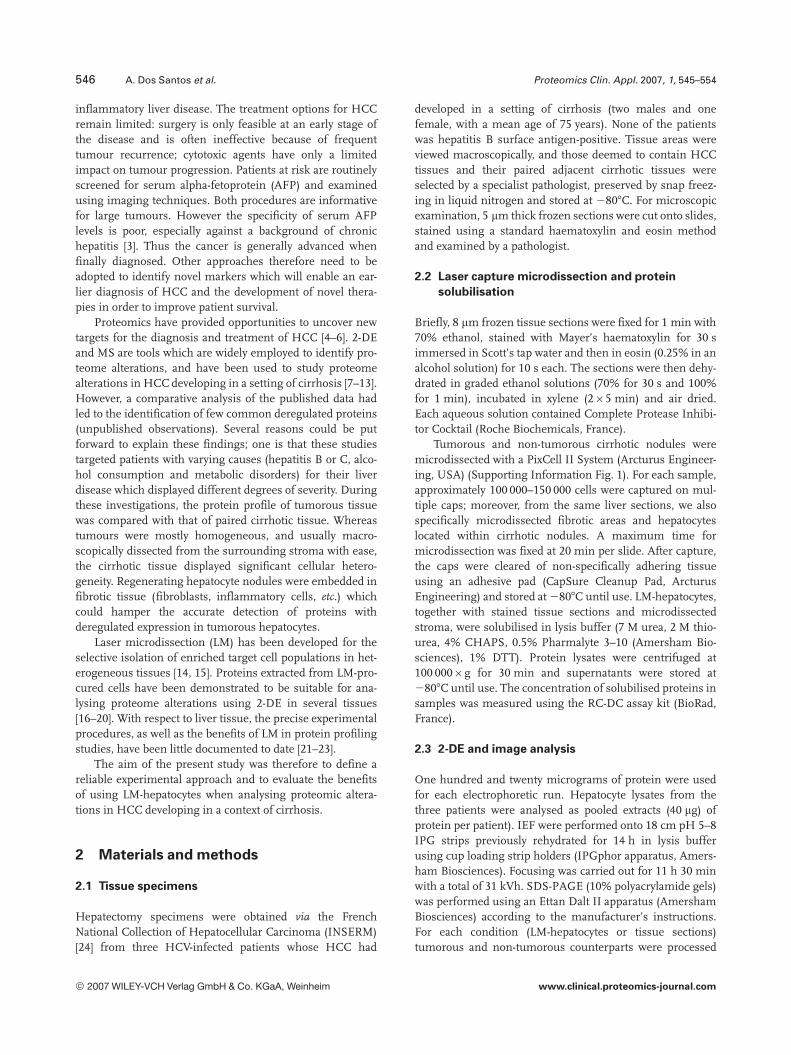
Hepatocellular carcinoma (HCC) is a major cause of cancer worldwide. Proteomic studies pro-vide opportunities to uncover targets for the diagnosis and treatment of this disease. However,in HCC developing in a setting of cirrhosis, the detection of proteome alterations may behampered by the increased cellular heterogeneity of tissue when analysing global liver homo-genates. The aim of this study was to evaluate whether the identification of proteome altera-tions in these HCC cases was improved when the differential protein profile between tumourand non-tumour areas of liver was determined using hepatocytes isolated by laser micro-dissection (LM). Differential profiles established with LM-hepatocytes and liver section homo-genates using 2-DE and MS exhibited noticeable differences: 30% of the protein spots withderegulated expression in tumorous LM-samples did not display any modification in homo-genates; conversely 15% of proteins altered in tumorous homogenates were not impaired inLM-hepatocytes. These alterations resulted from the presence in cirrhotic liver of fibroticstroma which displayed a protein pattern different from that determined in LM-hepatocytes. Inconclusion, our data demonstrate the interest of LM in distinguishing between fibrotic andhepatocyte proteome alterations and thus the benefit of LM to proteome studies of HCCdeveloping in a context of cirrhosis.
Received: July 3, 2006Revised: January 24, 2007
Accepted: February 28, 2007
Keywords:
Cirrhosis / Hepatitis C virus / Hepatocellular carcinoma / Laser microdissection
Proteomics Clin. Appl. 2007, 1, 545–554 545
1 Introduction
Hepatocellular carcinoma (HCC) is an important cause ofcancer worldwide [1] and its incidence is increasing mark-edly in North America and Europe [2]. Chronic infectionsdue to hepatitis C (HCV) and hepatitis B (HBV) viruses arethe principal aetiological factors. Thus, in most cases, HCCdevelops in a context of cirrhosis resulting from chronic
Correspondence: Dr. France Demaugre, INSERM U785, BâtimentLavoisier, 16 Avenue Paul Vaillant-Couturier, 94807 Villejuif cedex,FranceE-mail: [email protected]: 133-145-596-090
Abbreviations: HCC, hepatocellular carcinoma; LM, laser micro-dissection
DOI 10.1002/prca.200600474
© 2007 WILEY-VCH Verlag GmbH & Co. KGaA, Weinheim www.clinical.proteomics-journal.com
546 A. Dos Santos et al. Proteomics Clin. Appl. 2007, 1, 545–554
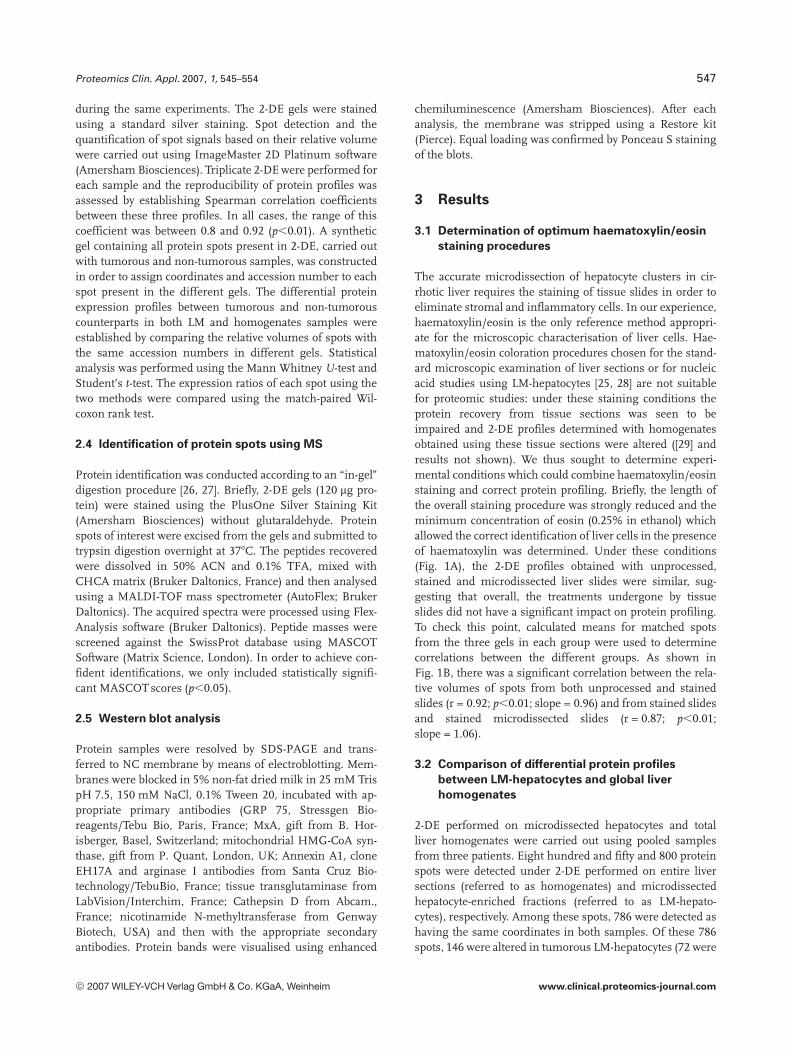
inflammatory liver disease. The treatment options for HCCremain limited: surgery is only feasible at an early stage ofthe disease and is often ineffective because of frequenttumour recurrence; cytotoxic agents have only a limitedimpact on tumour progression. Patients at risk are routinelyscreened for serum alpha-fetoprotein (AFP) and examinedusing imaging techniques. Both procedures are informativefor large tumours. However the specificity of serum AFPlevels is poor, especially against a background of chronichepatitis [3]. Thus the cancer is generally advanced whenfinally diagnosed. Other approaches therefore need to beadopted to identify novel markers which will enable an ear-lier diagnosis of HCC and the development of novel thera-pies in order to improve patient survival.
Proteomics have provided opportunities to uncover newtargets for the diagnosis and treatment of HCC [4–6]. 2-DEand MS are tools which are widely employed to identify pro-teome alterations, and have been used to study proteomealterations in HCC developing in a setting of cirrhosis [7–13].However, a comparative analysis of the published data hadled to the identification of few common deregulated proteins(unpublished observations). Several reasons could be putforward to explain these findings; one is that these studiestargeted patients with varying causes (hepatitis B or C, alco-hol consumption and metabolic disorders) for their liverdisease which displayed different degrees of severity. Duringthese investigations, the protein profile of tumorous tissuewas compared with that of paired cirrhotic tissue. Whereastumours were mostly homogeneous, and usually macro-scopically dissected from the surrounding stroma with ease,the cirrhotic tissue displayed significant cellular hetero-geneity. Regenerating hepatocyte nodules were embedded infibrotic tissue (fibroblasts, inflammatory cells, etc.) whichcould hamper the accurate detection of proteins withderegulated expression in tumorous hepatocytes.
Laser microdissection (LM) has been developed for theselective isolation of enriched target cell populations in het-erogeneous tissues [14, 15]. Proteins extracted from LM-pro-cured cells have been demonstrated to be suitable for ana-lysing proteome alterations using 2-DE in several tissues[16–20]. With respect to liver tissue, the precise experimentalprocedures, as well as the benefits of LM in protein profilingstudies, have been little documented to date [21–23].
The aim of the present study was therefore to define areliable experimental approach and to evaluate the benefitsof using LM-hepatocytes when analysing proteomic altera-tions in HCC developing in a context of cirrhosis.
2 Materials and methods
2.1 Tissue specimens
Hepatectomy specimens were obtained via the FrenchNational Collection of Hepatocellular Carcinoma (INSERM)[24] from three HCV-infected patients whose HCC had
developed in a setting of cirrhosis (two males and onefemale, with a mean age of 75 years). None of the patientswas hepatitis B surface antigen-positive. Tissue areas wereviewed macroscopically, and those deemed to contain HCCtissues and their paired adjacent cirrhotic tissues wereselected by a specialist pathologist, preserved by snap freez-ing in liquid nitrogen and stored at 2807C. For microscopicexamination, 5 mm thick frozen sections were cut onto slides,stained using a standard haematoxylin and eosin methodand examined by a pathologist.
2.2 Laser capture microdissection and protein
solubilisation
Briefly, 8 mm frozen tissue sections were fixed for 1 min with70% ethanol, stained with Mayer’s haematoxylin for 30 simmersed in Scott’s tap water and then in eosin (0.25% in analcohol solution) for 10 s each. The sections were then dehy-drated in graded ethanol solutions (70% for 30 s and 100%for 1 min), incubated in xylene (265 min) and air dried.Each aqueous solution contained Complete Protease Inhibi-tor Cocktail (Roche Biochemicals, France).
Tumorous and non-tumorous cirrhotic nodules weremicrodissected with a PixCell II System (Arcturus Engineer-ing, USA) (Supporting Information Fig. 1). For each sample,approximately 100 000–150 000 cells were captured on mul-tiple caps; moreover, from the same liver sections, we alsospecifically microdissected fibrotic areas and hepatocyteslocated within cirrhotic nodules. A maximum time formicrodissection was fixed at 20 min per slide. After capture,the caps were cleared of non-specifically adhering tissueusing an adhesive pad (CapSure Cleanup Pad, ArcturusEngineering) and stored at 2807C until use. LM-hepatocytes,together with stained tissue sections and microdissectedstroma, were solubilised in lysis buffer (7 M urea, 2 M thio-urea, 4% CHAPS, 0.5% Pharmalyte 3–10 (Amersham Bio-sciences), 1% DTT). Protein lysates were centrifuged at100 0006g for 30 min and supernatants were stored at2807C until use. The concentration of solubilised proteins insamples was measured using the RC-DC assay kit (BioRad,France).
2.3 2-DE and image analysis
One hundred and twenty micrograms of protein were usedfor each electrophoretic run. Hepatocyte lysates from thethree patients were analysed as pooled extracts (40 mg) ofprotein per patient). IEF were performed onto 18 cm pH 5–8IPG strips previously rehydrated for 14 h in lysis bufferusing cup loading strip holders (IPGphor apparatus, Amers-ham Biosciences). Focusing was carried out for 11 h 30 minwith a total of 31 kVh. SDS-PAGE (10% polyacrylamide gels)was performed using an Ettan Dalt II apparatus (AmershamBiosciences) according to the manufacturer’s instructions.For each condition (LM-hepatocytes or tissue sections)tumorous and non-tumorous counterparts were processed
© 2007 WILEY-VCH Verlag GmbH & Co. KGaA, Weinheim www.clinical.proteomics-journal.com
Proteomics Clin. Appl. 2007, 1, 545–554 547
during the same experiments. The 2-DE gels were stainedusing a standard silver staining. Spot detection and thequantification of spot signals based on their relative volumewere carried out using ImageMaster 2D Platinum software(Amersham Biosciences). Triplicate 2-DE were performed foreach sample and the reproducibility of protein profiles wasassessed by establishing Spearman correlation coefficientsbetween these three profiles. In all cases, the range of thiscoefficient was between 0.8 and 0.92 (p,0.01). A syntheticgel containing all protein spots present in 2-DE, carried outwith tumorous and non-tumorous samples, was constructedin order to assign coordinates and accession number to eachspot present in the different gels. The differential proteinexpression profiles between tumorous and non-tumorouscounterparts in both LM and homogenates samples wereestablished by comparing the relative volumes of spots withthe same accession numbers in different gels. Statisticalanalysis was performed using the Mann Whitney U-test andStudent’s t-test. The expression ratios of each spot using thetwo methods were compared using the match-paired Wil-coxon rank test.
2.4 Identification of protein spots using MS
Protein identification was conducted according to an “in-gel”digestion procedure [26, 27]. Briefly, 2-DE gels (120 mg pro-tein) were stained using the PlusOne Silver Staining Kit(Amersham Biosciences) without glutaraldehyde. Proteinspots of interest were excised from the gels and submitted totrypsin digestion overnight at 377C. The peptides recoveredwere dissolved in 50% ACN and 0.1% TFA, mixed withCHCA matrix (Bruker Daltonics, France) and then analysedusing a MALDI-TOF mass spectrometer (AutoFlex; BrukerDaltonics). The acquired spectra were processed using Flex-Analysis software (Bruker Daltonics). Peptide masses werescreened against the SwissProt database using MASCOTSoftware (Matrix Science, London). In order to achieve con-fident identifications, we only included statistically signifi-cant MASCOT scores (p,0.05).
2.5 Western blot analysis
Protein samples were resolved by SDS-PAGE and trans-ferred to NC membrane by means of electroblotting. Mem-branes were blocked in 5% non-fat dried milk in 25 mM TrispH 7.5, 150 mM NaCl, 0.1% Tween 20, incubated with ap-propriate primary antibodies (GRP 75, Stressgen Bio-reagents/Tebu Bio, Paris, France; MxA, gift from B. Hor-isberger, Basel, Switzerland; mitochondrial HMG-CoA syn-thase, gift from P. Quant, London, UK; Annexin A1, cloneEH17A and arginase I antibodies from Santa Cruz Bio-technology/TebuBio, France; tissue transglutaminase fromLabVision/Interchim, France; Cathepsin D from Abcam.,France; nicotinamide N-methyltransferase from GenwayBiotech, USA) and then with the appropriate secondaryantibodies. Protein bands were visualised using enhanced
chemiluminescence (Amersham Biosciences). After eachanalysis, the membrane was stripped using a Restore kit(Pierce). Equal loading was confirmed by Ponceau S stainingof the blots.
3 Results
3.1 Determination of optimum haematoxylin/eosin
staining procedures
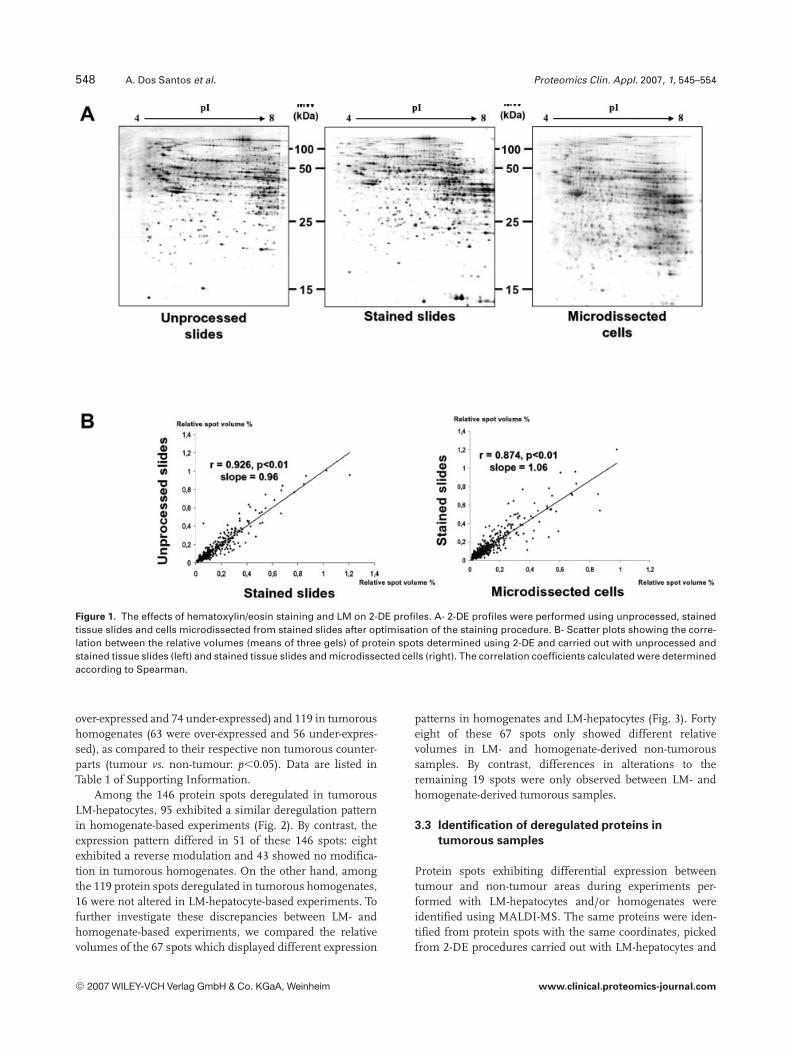
The accurate microdissection of hepatocyte clusters in cir-rhotic liver requires the staining of tissue slides in order toeliminate stromal and inflammatory cells. In our experience,haematoxylin/eosin is the only reference method appropri-ate for the microscopic characterisation of liver cells. Hae-matoxylin/eosin coloration procedures chosen for the stand-ard microscopic examination of liver sections or for nucleicacid studies using LM-hepatocytes [25, 28] are not suitablefor proteomic studies: under these staining conditions theprotein recovery from tissue sections was seen to beimpaired and 2-DE profiles determined with homogenatesobtained using these tissue sections were altered ([29] andresults not shown). We thus sought to determine experi-mental conditions which could combine haematoxylin/eosinstaining and correct protein profiling. Briefly, the length ofthe overall staining procedure was strongly reduced and theminimum concentration of eosin (0.25% in ethanol) whichallowed the correct identification of liver cells in the presenceof haematoxylin was determined. Under these conditions(Fig. 1A), the 2-DE profiles obtained with unprocessed,stained and microdissected liver slides were similar, sug-gesting that overall, the treatments undergone by tissueslides did not have a significant impact on protein profiling.To check this point, calculated means for matched spotsfrom the three gels in each group were used to determinecorrelations between the different groups. As shown inFig. 1B, there was a significant correlation between the rela-tive volumes of spots from both unprocessed and stainedslides (r = 0.92; p,0.01; slope = 0.96) and from stained slidesand stained microdissected slides (r = 0.87; p,0.01;slope = 1.06).
3.2 Comparison of differential protein profiles
between LM-hepatocytes and global liver
homogenates
2-DE performed on microdissected hepatocytes and totalliver homogenates were carried out using pooled samplesfrom three patients. Eight hundred and fifty and 800 proteinspots were detected under 2-DE performed on entire liversections (referred to as homogenates) and microdissectedhepatocyte-enriched fractions (referred to as LM-hepato-cytes), respectively. Among these spots, 786 were detected ashaving the same coordinates in both samples. Of these 786spots, 146 were altered in tumorous LM-hepatocytes (72 were
© 2007 WILEY-VCH Verlag GmbH & Co. KGaA, Weinheim www.clinical.proteomics-journal.com
548 A. Dos Santos et al. Proteomics Clin. Appl. 2007, 1, 545–554
Figure 1. The effects of hematoxylin/eosin staining and LM on 2-DE profiles. A- 2-DE profiles were performed using unprocessed, stainedtissue slides and cells microdissected from stained slides after optimisation of the staining procedure. B- Scatter plots showing the corre-lation between the relative volumes (means of three gels) of protein spots determined using 2-DE and carried out with unprocessed andstained tissue slides (left) and stained tissue slides and microdissected cells (right). The correlation coefficients calculated were determinedaccording to Spearman.
over-expressed and 74 under-expressed) and 119 in tumoroushomogenates (63 were over-expressed and 56 under-expres-sed), as compared to their respective non tumorous counter-parts (tumour vs. non-tumour: p,0.05). Data are listed inTable 1 of Supporting Information.
Among the 146 protein spots deregulated in tumorousLM-hepatocytes, 95 exhibited a similar deregulation patternin homogenate-based experiments (Fig. 2). By contrast, theexpression pattern differed in 51 of these 146 spots: eightexhibited a reverse modulation and 43 showed no modifica-tion in tumorous homogenates. On the other hand, amongthe 119 protein spots deregulated in tumorous homogenates,16 were not altered in LM-hepatocyte-based experiments. Tofurther investigate these discrepancies between LM- andhomogenate-based experiments, we compared the relativevolumes of the 67 spots which displayed different expression
patterns in homogenates and LM-hepatocytes (Fig. 3). Fortyeight of these 67 spots only showed different relativevolumes in LM- and homogenate-derived non-tumoroussamples. By contrast, differences in alterations to theremaining 19 spots were only observed between LM- andhomogenate-derived tumorous samples.
3.3 Identification of deregulated proteins in
tumorous samples
Protein spots exhibiting differential expression betweentumour and non-tumour areas during experiments per-formed with LM-hepatocytes and/or homogenates wereidentified using MALDI-MS. The same proteins were iden-tified from protein spots with the same coordinates, pickedfrom 2-DE procedures carried out with LM-hepatocytes and
© 2007 WILEY-VCH Verlag GmbH & Co. KGaA, Weinheim www.clinical.proteomics-journal.com
Proteomics Clin. Appl. 2007, 1, 545–554 549
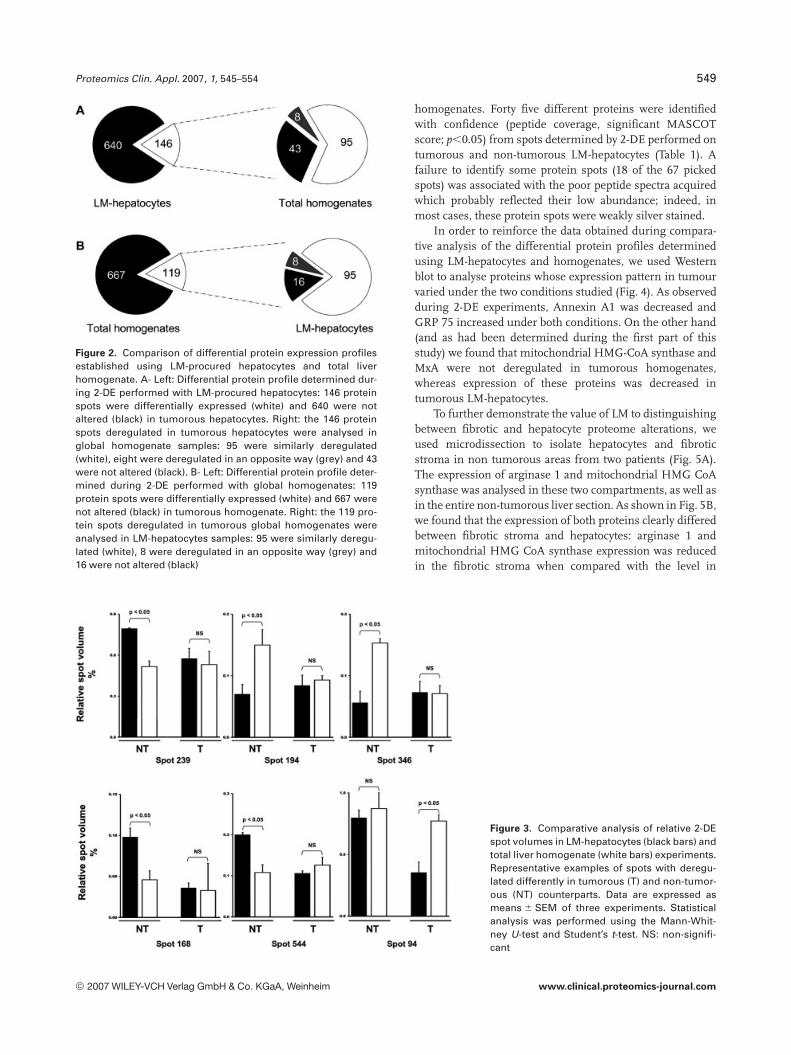
Figure 2. Comparison of differential protein expression profilesestablished using LM-procured hepatocytes and total liverhomogenate. A- Left: Differential protein profile determined dur-ing 2-DE performed with LM-procured hepatocytes: 146 proteinspots were differentially expressed (white) and 640 were notaltered (black) in tumorous hepatocytes. Right: the 146 proteinspots deregulated in tumorous hepatocytes were analysed inglobal homogenate samples: 95 were similarly deregulated(white), eight were deregulated in an opposite way (grey) and 43were not altered (black). B- Left: Differential protein profile deter-mined during 2-DE performed with global homogenates: 119protein spots were differentially expressed (white) and 667 werenot altered (black) in tumorous homogenate. Right: the 119 pro-tein spots deregulated in tumorous global homogenates wereanalysed in LM-hepatocytes samples: 95 were similarly deregu-lated (white), 8 were deregulated in an opposite way (grey) and16 were not altered (black)
homogenates. Forty five different proteins were identifiedwith confidence (peptide coverage, significant MASCOTscore; p,0.05) from spots determined by 2-DE performed ontumorous and non-tumorous LM-hepatocytes (Table 1). Afailure to identify some protein spots (18 of the 67 pickedspots) was associated with the poor peptide spectra acquiredwhich probably reflected their low abundance; indeed, inmost cases, these protein spots were weakly silver stained.
In order to reinforce the data obtained during compara-tive analysis of the differential protein profiles determinedusing LM-hepatocytes and homogenates, we used Westernblot to analyse proteins whose expression pattern in tumourvaried under the two conditions studied (Fig. 4). As observedduring 2-DE experiments, Annexin A1 was decreased andGRP 75 increased under both conditions. On the other hand(and as had been determined during the first part of thisstudy) we found that mitochondrial HMG-CoA synthase andMxA were not deregulated in tumorous homogenates,whereas expression of these proteins was decreased intumorous LM-hepatocytes.
To further demonstrate the value of LM to distinguishingbetween fibrotic and hepatocyte proteome alterations, weused microdissection to isolate hepatocytes and fibroticstroma in non tumorous areas from two patients (Fig. 5A).The expression of arginase 1 and mitochondrial HMG CoAsynthase was analysed in these two compartments, as well asin the entire non-tumorous liver section. As shown in Fig. 5B,we found that the expression of both proteins clearly differedbetween fibrotic stroma and hepatocytes: arginase 1 andmitochondrial HMG CoA synthase expression was reducedin the fibrotic stroma when compared with the level in
Figure 3. Comparative analysis of relative 2-DEspot volumes in LM-hepatocytes (black bars) andtotal liver homogenate (white bars) experiments.Representative examples of spots with deregu-lated differently in tumorous (T) and non-tumor-ous (NT) counterparts. Data are expressed asmeans 6 SEM of three experiments. Statisticalanalysis was performed using the Mann-Whit-ney U-test and Student’s t-test. NS: non-signifi-cant
© 2007 WILEY-VCH Verlag GmbH & Co. KGaA, Weinheim www.clinical.proteomics-journal.com
550 A. Dos Santos et al. Proteomics Clin. Appl. 2007, 1, 545–554
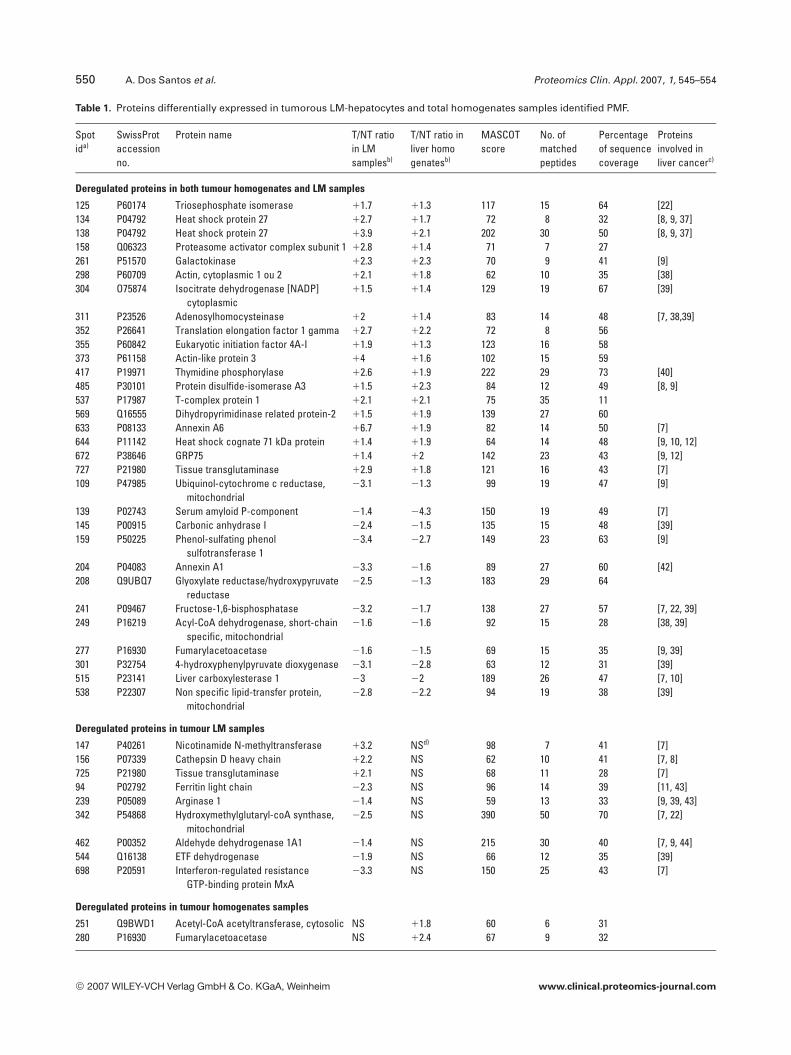
Table 1. Proteins differentially expressed in tumorous LM-hepatocytes and total homogenates samples identified PMF.
Spotida)
SwissProtaccessionno.
Protein name T/NT ratioin LMsamplesb)
T/NT ratio inliver homogenatesb)
MASCOTscore
No. ofmatchedpeptides
Percentageof sequencecoverage
Proteinsinvolved inliver cancerc)
Deregulated proteins in both tumour homogenates and LM samples
125 P60174 Triosephosphate isomerase 11.7 11.3 117 15 64 [22]134 P04792 Heat shock protein 27 12.7 11.7 72 8 32 [8, 9, 37]138 P04792 Heat shock protein 27 13.9 12.1 202 30 50 [8, 9, 37]158 Q06323 Proteasome activator complex subunit 1 12.8 11.4 71 7 27261 P51570 Galactokinase 12.3 12.3 70 9 41 [9]298 P60709 Actin, cytoplasmic 1 ou 2 12.1 11.8 62 10 35 [38]304 O75874 Isocitrate dehydrogenase [NADP]
cytoplasmic11.5 11.4 129 19 67 [39]
311 P23526 Adenosylhomocysteinase 12 11.4 83 14 48 [7, 38,39]352 P26641 Translation elongation factor 1 gamma 12.7 12.2 72 8 56355 P60842 Eukaryotic initiation factor 4A-I 11.9 11.3 123 16 58373 P61158 Actin-like protein 3 14 11.6 102 15 59417 P19971 Thymidine phosphorylase 12.6 11.9 222 29 73 [40]485 P30101 Protein disulfide-isomerase A3 11.5 12.3 84 12 49 [8, 9]537 P17987 T-complex protein 1 12.1 12.1 75 35 11569 Q16555 Dihydropyrimidinase related protein-2 11.5 11.9 139 27 60633 P08133 Annexin A6 16.7 11.9 82 14 50 [7]644 P11142 Heat shock cognate 71 kDa protein 11.4 11.9 64 14 48 [9, 10, 12]672 P38646 GRP75 11.4 12 142 23 43 [9, 12]727 P21980 Tissue transglutaminase 12.9 11.8 121 16 43 [7]109 P47985 Ubiquinol-cytochrome c reductase,
mitochondrial23.1 21.3 99 19 47 [9]
139 P02743 Serum amyloid P-component 21.4 24.3 150 19 49 [7]145 P00915 Carbonic anhydrase I 22.4 21.5 135 15 48 [39]159 P50225 Phenol-sulfating phenol
sulfotransferase 123.4 22.7 149 23 63 [9]
204 P04083 Annexin A1 23.3 21.6 89 27 60 [42]208 Q9UBQ7 Glyoxylate reductase/hydroxypyruvate
reductase22.5 21.3 183 29 64
241 P09467 Fructose-1,6-bisphosphatase 23.2 21.7 138 27 57 [7, 22, 39]249 P16219 Acyl-CoA dehydrogenase, short-chain
specific, mitochondrial21.6 21.6 92 15 28 [38, 39]
277 P16930 Fumarylacetoacetase 21.6 21.5 69 15 35 [9, 39]301 P32754 4-hydroxyphenylpyruvate dioxygenase 23.1 22.8 63 12 31 [39]515 P23141 Liver carboxylesterase 1 23 22 189 26 47 [7, 10]538 P22307 Non specific lipid-transfer protein,
mitochondrial22.8 22.2 94 19 38 [39]
Deregulated proteins in tumour LM samples
147 P40261 Nicotinamide N-methyltransferase 13.2 NSd) 98 7 41 [7]156 P07339 Cathepsin D heavy chain 12.2 NS 62 10 41 [7, 8]725 P21980 Tissue transglutaminase 12.1 NS 68 11 28 [7]94 P02792 Ferritin light chain 22.3 NS 96 14 39 [11, 43]239 P05089 Arginase 1 21.4 NS 59 13 33 [9, 39, 43]342 P54868 Hydroxymethylglutaryl-coA synthase,
mitochondrial22.5 NS 390 50 70 [7, 22]
462 P00352 Aldehyde dehydrogenase 1A1 21.4 NS 215 30 40 [7, 9, 44]544 Q16138 ETF dehydrogenase 21.9 NS 66 12 35 [39]698 P20591 Interferon-regulated resistance
GTP-binding protein MxA23.3 NS 150 25 43 [7]
Deregulated proteins in tumour homogenates samples
251 Q9BWD1 Acetyl-CoA acetyltransferase, cytosolic NS 11.8 60 6 31280 P16930 Fumarylacetoacetase NS 12.4 67 9 32
© 2007 WILEY-VCH Verlag GmbH & Co. KGaA, Weinheim www.clinical.proteomics-journal.com

Proteomics Clin. Appl. 2007, 1, 545–554 551
Table 1. Continued
Spotida)
SwissProtaccessionno.
Protein name T/NT ratioin LMsamplesb)
T/NT ratio inliver homogenatesb)
MASCOTscore
No. ofmatchedpeptides
Percentageof sequencecoverage
Proteinsinvolved inliver cancerc)
635 P08107 Heat Shock 70 kDa protein 1 NS 13.3 165 23 46 [7]636 P11142 Heat Shock cognate 71 kDa protein NS 12.5 166 21 55793 P55072 Transitional endoplasmic reticulum AT-
PaseNS 12 110 18 38 [9]
194 Q9P0G7 Lambda-crystallin NS 21.6 64 11 38 [7]221 P21695 Glycerol-3-phosphate dehydrogenase
[NAD1], cytoplasmicNS 22.3 88 13 42 [7]
346 Q9Y2T3 Guanine deaminase NS 22.2 70 12 33 [7]
a) Spot id on gel refers to the synthetic gel used for comparisonb) A positive ratio indicates overexpression in the tumour, whereas a negative ratio indicates underexpression in tumourc) Bibliographic references for proteins already described in human liver.d) NS: Not significant
Figure 4. Western blot analysis of MxA, Annexin A1, mitochon-drial HMGCoA synthase and GRP75 in both homogenate and LM-hepatocyte samples. Western blots were performed as describedin Section 2.5 using paired tumour (T) and non-tumour (NT)pooled samples from the three patients included in 2-DE experi-ments.
hepatocytes. Similarly, the expression of MxA, cathepsin D,nicotinamide N-methyltransferase and tissue transglutami-nase was markedly reduced in the fibrotic stroma whencompared with hepatocytes. Data are presented in the Sup-porting Information (Fig. 2).
4 Discussion
Cellular heterogeneity is a critical issue when investigatingHCC proteome, given the frequent association of the tumourwith cirrhosis. In combination with different downstreamanalyses, microdissected cells have made it possible to per-form genome and transcriptome-based analyses which havehighlighted new pathogenic mechanisms in several diseases[30, 31]. LM-procured cells have also allowed the detection ofproteome alterations in several diseases affecting hetero-geneous tissues such as prostate, ovary, oesophagus andbreast tissues [16–20, 29, 32, 33] using 2-DE methodology.With respect to the liver, two proteome studies carried out
Figure 5. Analysis of Arginase 1 and mitochondrial HMG CoAsynthase in global homogenates, stromal cells and hepatocytesselected by microdissection in the non-tumorous area. A - Nontumorous liver section stained with haematoxylin/eosin showsthe abundance of fibrotic stroma (F) in the cirrhotic liver. Hepa-tocyte nodules are mentioned as H. B - Fibrotic stroma andhepatocytes were microdissected in the non tumorous area ofliver from two patients. Levels of Arginase 1 and mitochondrialHMG CoA synthase expression were analysed as described inSection 2.2 in fibrotic stroma (F), hepatocytes (H) and completehomogenates (C) for each patient.
with microdissected hepatocytes have so far been published[21, 22]. However, the actual benefits of incorporating LMwhen testing for proteome alterations during liver diseasessuch as HCC developing in a setting of cirrhosis have notbeen established because comparative studies using LM-hepatocytes and total homogenates have not been assessed.
© 2007 WILEY-VCH Verlag GmbH & Co. KGaA, Weinheim www.clinical.proteomics-journal.com
552 A. Dos Santos et al. Proteomics Clin. Appl. 2007, 1, 545–554
The accurate microdissection of hepatocytes requires thestaining of tissue slides with both haematoxylin and eosin,the only staining method appropriate for accurate micro-scopic characterisation of the different cell types present inthe liver. But haematoxylin/eosin staining may have detri-mental effects on 2-DE protein profiles ([29] and results notshown) and the accurate identification of proteins by PMF[34], because eosin may establish covalent links with proteins[35, 36]. We thus optimised several steps of this stainingmethod: under these conditions, the 2-DE profiles estab-lished using stained liver sections or microdissected livercells, and the peptide spectra acquired during MS for eachprotein, did not suffer from any further alterations, thussuggesting proteome analysis could be performed accuratelyon liver sections stained with haematoxylin/eosin.
Using bioinformatics tools, 786 proteins with the samecoordinates were detected in 2-DE gels performed using totalliver homogenates and LM-hepatocytes. The validity of themethod used to establish these maps was proved by MSidentification of the same proteins in spots with the samecoordinates under both conditions (see below).
Differential protein profiles determined using micro-dissected cells and global homogenates exhibited noticeabledifferences: 30% of protein spots which showed deregulatedexpression in tumorous LM-hepatocytes did not display sig-nificant alterations in homogenates-based experiments; con-versely, 15% of proteins differentially expressed in tumoroushomogenates did not display significant alterations in LM-hepatocytes.
These data suggest that fibrotic stroma which was notcollected during hepatocyte microdissection in cirrhoticlivers could alter the proteomic patterns. Several lines of evi-dence supported this observation. As illustrated in Fig. 3,numerous differences were detected between protein pro-files determined using LM-hepatocytes and homogenatesfrom non-tumorous cirrhotic areas which included inflam-matory infiltrates and fibrosis (Fig. 5A). Furthermore, selec-tive microdissections of fibrotic stroma and hepatocyte com-partments (Fig. 5B) made it possible to demonstrate thatprotein expression differed between fibrotic stroma andhepatocytes.
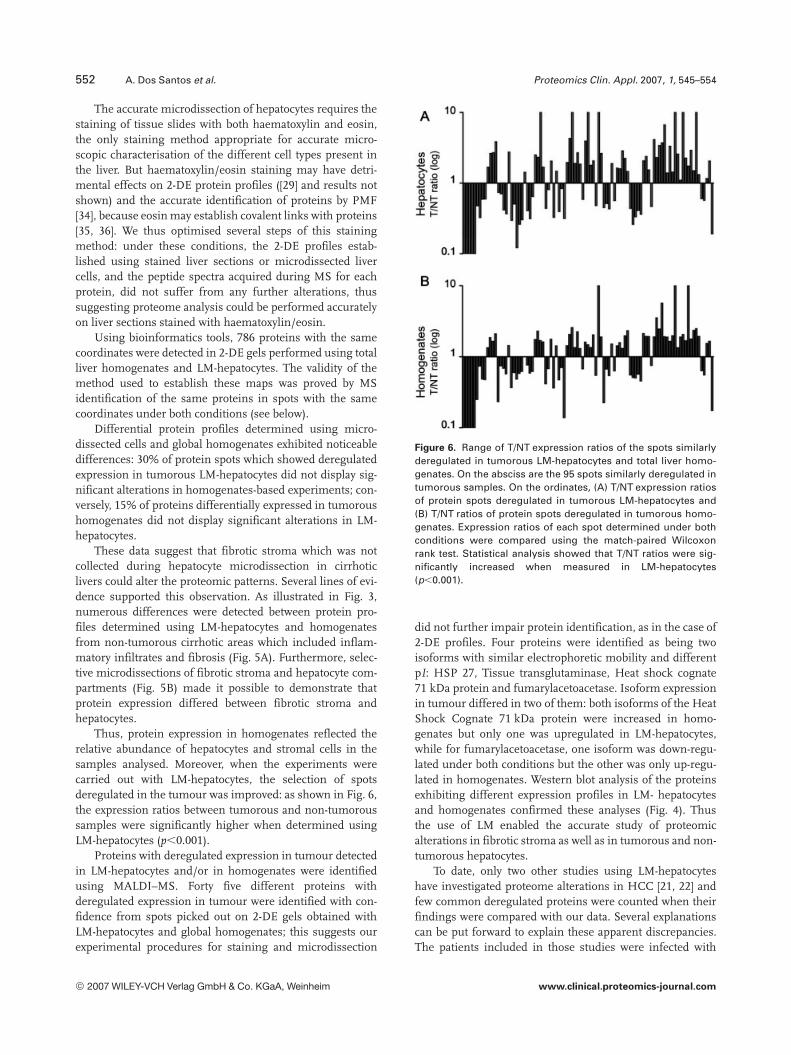
Thus, protein expression in homogenates reflected therelative abundance of hepatocytes and stromal cells in thesamples analysed. Moreover, when the experiments werecarried out with LM-hepatocytes, the selection of spotsderegulated in the tumour was improved: as shown in Fig. 6,the expression ratios between tumorous and non-tumoroussamples were significantly higher when determined usingLM-hepatocytes (p,0.001).
Proteins with deregulated expression in tumour detectedin LM-hepatocytes and/or in homogenates were identifiedusing MALDI–MS. Forty five different proteins withderegulated expression in tumour were identified with con-fidence from spots picked out on 2-DE gels obtained withLM-hepatocytes and global homogenates; this suggests ourexperimental procedures for staining and microdissection
Figure 6. Range of T/NT expression ratios of the spots similarlyderegulated in tumorous LM-hepatocytes and total liver homo-genates. On the absciss are the 95 spots similarly deregulated intumorous samples. On the ordinates, (A) T/NT expression ratiosof protein spots deregulated in tumorous LM-hepatocytes and(B) T/NT ratios of protein spots deregulated in tumorous homo-genates. Expression ratios of each spot determined under bothconditions were compared using the match-paired Wilcoxonrank test. Statistical analysis showed that T/NT ratios were sig-nificantly increased when measured in LM-hepatocytes(p,0.001).
did not further impair protein identification, as in the case of2-DE profiles. Four proteins were identified as being twoisoforms with similar electrophoretic mobility and differentpI: HSP 27, Tissue transglutaminase, Heat shock cognate71 kDa protein and fumarylacetoacetase. Isoform expressionin tumour differed in two of them: both isoforms of the HeatShock Cognate 71 kDa protein were increased in homo-genates but only one was upregulated in LM-hepatocytes,while for fumarylacetoacetase, one isoform was down-regu-lated under both conditions but the other was only up-regu-lated in homogenates. Western blot analysis of the proteinsexhibiting different expression profiles in LM- hepatocytesand homogenates confirmed these analyses (Fig. 4). Thusthe use of LM enabled the accurate study of proteomicalterations in fibrotic stroma as well as in tumorous and non-tumorous hepatocytes.
To date, only two other studies using LM-hepatocyteshave investigated proteome alterations in HCC [21, 22] andfew common deregulated proteins were counted when theirfindings were compared with our data. Several explanationscan be put forward to explain these apparent discrepancies.The patients included in those studies were infected with
© 2007 WILEY-VCH Verlag GmbH & Co. KGaA, Weinheim www.clinical.proteomics-journal.com
Proteomics Clin. Appl. 2007, 1, 545–554 553
HBV and it was reported that aetiological factors imprintedthe expression pattern of proteome in HCC tissues [9]. Else-where, Ai et al. [21] only retained ten deregulated proteins intheir study. Moreover, the strategy adopted by Li et al. [22]based on 2D-LC-MS/MS investigated a scale of proteinswhich was difficult to achieve with 2-DE/MS experiments.
Of the 40 proteins identified in our study as beingderegulated in LM-hepatocytes, 33 had been reported asbeing altered in HCC during 2-DE/MS experiments carriedout on homogenates (Table 1). Our study and the aforemen-tioned publications demonstrated the same alteration pat-terns for all but five of these proteins (isocitrate dehydro-genase, tissue transglutaminase, adenosyl homocysteinase,annexin A6 and annexin A1). Further studies need to beperformed to clarify these discrepancies. Of note, and as il-lustrated in our study by the case of fumarylacetoacetase [9],distinct isoforms could exhibit different variations in LM-hepatocytes and homogenates.
In conclusion, our data taken together demonstrate thatLM enables a comparison of hepatocyte proteome alterationsin patients whose HCC has developed in a variable fibroticcontext; moreover, by specifically isolating the fibroticstroma, these findings may also provide insights into thepathogenesis of fibrosis and the role of the microenviron-ment. During this study, LM was associated with 2-DE inorder to evidence quantitative proteomic alterations in HCC.However, 2-DE analysis requires large quantities of proteinswhich are not easily procured using LM. For this reason, itwill now be necessary to combine this technique with othermethods requiring smaller amounts of protein in order toexploit the benefits of LM methodology. By establishing thenecessary methodological procedures, our study has pavedthe way to achieving such improvements.
The authors greatly acknowledge Danielle Tondelier for herhelpful technical assistance. This work was supported by grantsfrom ARC (grant N7R03124KS), ARECA“Hepatite C et cancer”network and INSERM. 2-DE and MS analyses were performedat the Proteomic Core Facilities directed by Dr. Edelman ofIFR94, Necker, Paris, France. Alexandre Dos Santos was sup-ported by a fellowship from the Association pour la Recherche surle Cancer.
5 References
[1] Ferlay, J., Bray, F., Pisani, P., Parkin, D., IARC CancerBase N752004.
[2] Jemal, A., Murray, T., Ward, E., Samuels, A., et al., CA CancerJ. Clin. 2005, 55, 10–30.
[3] Johnson, P. J., Clin. Liver Dis. 2001, 5, 145–159.
[4] Chignard, N., Beretta, L., Gastroenterology 2004, 127, S120–S125.
[5] Hanash, S., Nature 2003, 422, 226–232.
[6] Kuramitsu, Y., Nakamura, K., Expert Rev. Proteomics 2005, 2,589–601.
[7] Blanc, J. F., Lalanne, C., Plomion, C., Schmitter, J. M. et al.,Proteomics 2005, 5, 3778–3789.
[8] Kim, J., Kim, S. H., Lee, S. U., Ha, G. H. et al., Electrophoresis2002, 23, 4142–4156.
[9] Kim, W., Oe Lim, S., Kim, J. S., Ryu, Y. H. et al., Clin. CancerRes. 2003, 9, 5493–5500.
[10] Lim, S. O., Park, S. J., Kim, W., Park, S. G. et al., Biochem.Biophys. Res. Commun. 2002, 291, 1031–1037.
[11] Park, K. S., Kim, H., Kim, N. G., Cho, S. Y. et al., Hepatology2002, 35, 1459–1466.
[12] Takashima, M., Kuramitsu, Y., Yokoyama, Y., Iizuka, N. et al.,Proteomics 2003, 3, 2487–2493.
[13] Zeindl-Eberhart, E., Haraida, S., Liebmann, S., Jungblut, P. R.et al., Hepatology 2004, 39, 540–549.
[14] Emmert-Buck, M. R., Bonner, R. F., Smith, P. D., Chuaqui, R. F.et al., Science 1996, 274, 998–1001.
[15] Simone, N. L., Bonner, R. F., Gillespie, J. W., Emmert-Buck,M. R., Liotta, L. A., Trends Genet. 1998, 14, 272–276.
[16] Jones, M. B., Krutzsch, H., Shu, H., Zhao, Y. et al., Proteomics2002, 2, 76–84.
[17] Ornstein, D. K., Gillespie, J. W., Paweletz, C. P., Duray, P. H. etal., Electrophoresis 2000, 21, 2235–2242.
[18] Paweletz, C. P., Liotta, L. A., Petricoin, E. F., 3rd, Urology2001, 57, 160–163.
[19] Somiari, R. I., Somiari, S., Russell, S., Shriver, C. D., J. Chro-matogr. B Analyt. Technol. Biomed. Life Sci. 2005, 815, 215–225.
[20] Zhou, G., Li, H., DeCamp, D., Chen, S. et al., Mol. Cell. Pro-teomics 2002, 1, 117–124.
[21] Ai, J., Tan, Y., Ying, W., Hong, Y. et al., Proteomics 2006, 6,538–546.
[22] Li, C., Hong, Y., Tan, Y. X., Zhou, H. et al., Mol. Cell. Prote-omics 2004, 3, 399–409.
[23] Melle, C., Kaufmann, R., Hommann, M., Bleul, A. et al., Int. J.Oncol. 2004, 24, 885–891.
[24] Balabaud, C., Winnock, M., Chene, G., Degos, F., Gastro-enterol. Clin. Biol. 2003, 27, 1076–1078.
[25] Iavarone, M., Trabut, J. B., Delpuech, O., Carnot, F. et al., J.Hepatol. 2003, 39, 253–261.
[26] Bensalem, N., Ventura, A. P., Vallee, B., Lipecka, J. et al., Mol.Cell. Proteomics 2005, 4, 1591–1601.
[27] Godovac-Zimmermann, J., Brown, L. R., Mass Spectrom.Rev. 2001, 20, 1–57.
[28] Vona, G., Tuveri, R., Delpuech, O., Vallet, A. et al., J. Hepatol.2004, 40, 682–688.
[29] Craven, R. A., Totty, N., Harnden, P., Selby, P. J., Banks, R. E.,Am. J. Pathol. 2002, 160, 815–822.
[30] Okuducu, A. F., Hahne, J. C., Von Deimling, A., Wernert, N.,Int. J. Mol. Med. 2005, 15, 763–769.
[31] Zhang, D., Tai, L. K., Wong, L. L., Chiu, L. L. et al., Mol. Cell.Proteomics 2005, 4, 1686–1696.
[32] Emmert-Buck, M. R., Gillespie, J. W., Paweletz, C. P., Orn-stein, D. K. et al., Mol. Carcinog. 2000, 27, 158–165.
[33] Fuller, A. P., Palmer-Toy, D., Erlander, M. G., Sgroi, D. C., J.Mammary Gland Biol. Neoplasia 2003, 8, 335–345.
© 2007 WILEY-VCH Verlag GmbH & Co. KGaA, Weinheim www.clinical.proteomics-journal.com

554 A. Dos Santos et al. Proteomics Clin. Appl. 2007, 1, 545–554
[34] Xu, B. J., Caprioli, R. M., Sanders, M. E., Jensen, R. A., J. Am.Soc. Mass Spectrom. 2002, 13, 1292–1297.
[35] Elias, J. M., Am. J. Med. Technol. 1974, 40, 513–514.
[36] Mouledous, L., Hunt, S., Harcourt, R., Harry, J. et al., Prote-omics 2003, 3, 610–615.
[37] Luk, J. M., Lam, C. T., Siu, A. F., Lam, B. Y. et al., Proteomics2006, 6, 1049–1057.
[38] Jacobs, J. M., Diamond, D. L., Chan, E. Y., Gritsenko, M. A. etal., J. Virol. 2005, 79, 7558–7569.
[39] Liang, C. R., Leow, C. K., Neo, J. C., Tan, G. S. et al., Prote-omics 2005, 5, 2258–2271.
[40] Hotta, T., Taniguchi, K., Kobayashi, Y., Johata, K. et al.,Oncol. Rep. 2004, 12, 539–541.
[41] Yokota, S., Yamamoto, Y., Shimizu, K., Momoi, H. et al., CellStress Chaperones 2001, 6, 345–350.
[42] Masaki, T., Tokuda, M., Ohnishi, M., Watanabe, S. et al.,Hepatology 1996, 24, 72–81.
[43] Yokoyama, Y., Kuramitsu, Y., Takashima, M., Iizuka, N. et al.,Proteomics 2004, 4, 2111–2116.
[44] Park, K. S., Cho, S. Y., Kim, H., Paik, Y. K., Int. J. Cancer 2002,97, 261–265.
© 2007 WILEY-VCH Verlag GmbH & Co. KGaA, Weinheim www.clinical.proteomics-journal.com