CONTOUR LINES EXTRACTION AND RECONSTRUCTION … 536_536.pdf · CONTOUR LINES EXTRACTION AND...
12
CONTOUR LINES EXTRACTION AND RECONSTRUCTION FROM TOPOGRAPHIC MAPS Tudor GHIRCOIAS and Remus BRAD Lucian Blaga University of Sibiu, Romania [email protected] ABSTRACT The past years needs for Digital Elevation Models and consequently for 3D simulations requested in various applications had led to the development of fast and accurate terrain topography measurement techniques. In this paper, we are presenting a novel framework dedicated to the automatic or semiautomatic processing of scanned maps, extracting the contour lines vectors and building a digital elevation model on their basis, fulfilled by a number of stages discussed in detail throughout the work. Despite the good results obtained on a large amount of scanned maps, a completely automatic map processing technique is unrealistic and the semiautomatic one remains an open problem. Keywords: contour line, curve reconstruction, topographic map, scanned map. 1 INTRODUCTION The growing need for Digital Elevation Models (DEMs) and 3D simulations in various fields led to the development of fast and accurate terrain topography measurement techniques. Although photogrammetric interpretations of aerial photography and satellite imagery are the most common methods for extracting altimetry information, there is a less expensive alternative for obtaining the same or similar data: the use of scanned topographic maps. Beside the cost- effectiveness there are some other advantages of this procedure: • The inherent problems of satellite and aerial images: obstructions, cloud cover, unclear atmosphere. • The time needed for obtaining the geographical data is significantly reduced. • The large number of existing paper maps, which remains the most frequent form of ground surface representation. • In the case of landscapes, which underwent changes in the past, old historical maps are often the only source of information. The most interesting information shown by these maps are the contour lines (isolines), which are imaginary lines that join different points located at the same elevation. The isolines result from intersecting the ground surface with horizontal, parallel and equidistant planes. Topographic maps usually show not only the contours but also other thematical layers which overlap: streams and other bodies of water, forest cover or vegetation, roads, towns and other points of interest, toponyms etc. Unfortunately, contour lines are usually the lowest layer in a map after the background layers. For this reason and not only, the extraction of these isolines becomes very difficult. There are mainly two difficulties in finding a solution to this open problem: • isolating the contour lines from other thematical layers of the map • processing the resulting binary image and contour reconstruction, the extracted isolines often being fragmented and affected by unwanted elements (noise). The research in the field of contour line extraction and vectorization went on for many years, recently being published more and more articles on this subject. Usually, the articles and research focus mainly on one of the two important aspects of the extraction process: contour line segmentation and automatic reconstruction, but a bit more concern is being shown about the second aspect. The main necessary steps described in most publications for an automatic or semiautomatic extraction procedure are the following: 1. preprocessing of the raster scanned map 2. segmentation 3. processing of the binary image (filtering, thinning, pruning, etc) 4. curve reconstruction 5. raster to vector conversion Given the high complexity of most topographic maps and the importance of color information, recent Special issue of The Romanian Educational Network - RoEduNet UbiCC Journal, Volume 6 681
-
Upload
nguyenduong -
Category
Documents
-
view
229 -
download
0
Transcript of CONTOUR LINES EXTRACTION AND RECONSTRUCTION … 536_536.pdf · CONTOUR LINES EXTRACTION AND...
CONTOUR LINES EXTRACTION AND RECONSTRUCTION FROM TOPOGRAPHIC MAPS
Tudor GHIRCOIAS and Remus BRADLucian Blaga University of Sibiu, Romania
ABSTRACTThe past years needs for Digital Elevation Models and consequently for 3Dsimulations requested in various applications had led to the development of fastand accurate terrain topography measurement techniques. In this paper, we arepresenting a novel framework dedicated to the automatic or semiautomaticprocessing of scanned maps, extracting the contour lines vectors and building adigital elevation model on their basis, fulfilled by a number of stages discussed indetail throughout the work. Despite the good results obtained on a large amount ofscanned maps, a completely automatic map processing technique is unrealistic andthe semiautomatic one remains an open problem.Keywords: contour line, curve reconstruction, topographic map, scanned map.
1 INTRODUCTION
The growing need for Digital Elevation Models(DEMs) and 3D simulations in various fields led tothe development of fast and accurate terraintopography measurement techniques. Althoughphotogrammetric interpretations of aerialphotography and satellite imagery are the mostcommon methods for extracting altimetryinformation, there is a less expensive alternative forobtaining the same or similar data: the use ofscanned topographic maps. Beside the cost-effectiveness there are some other advantages of thisprocedure:• The inherent problems of satellite and aerial
images: obstructions, cloud cover, unclearatmosphere.
• The time needed for obtaining the geographicaldata is significantly reduced.
• The large number of existing paper maps, whichremains the most frequent form of groundsurface representation.
• In the case of landscapes, which underwentchanges in the past, old historical maps are oftenthe only source of information.The most interesting information shown by these
maps are the contour lines (isolines), which areimaginary lines that join different points located atthe same elevation. The isolines result fromintersecting the ground surface with horizontal,parallel and equidistant planes. Topographic mapsusually show not only the contours but also otherthematical layers which overlap: streams and other
bodies of water, forest cover or vegetation, roads,towns and other points of interest, toponyms etc.
Unfortunately, contour lines are usually thelowest layer in a map after the background layers.For this reason and not only, the extraction of theseisolines becomes very difficult. There are mainly twodifficulties in finding a solution to this openproblem:• isolating the contour lines from other thematical
layers of the map• processing the resulting binary image and
contour reconstruction, the extracted isolinesoften being fragmented and affected byunwanted elements (noise).The research in the field of contour line
extraction and vectorization went on for many years,recently being published more and more articles onthis subject. Usually, the articles and research focusmainly on one of the two important aspects of theextraction process: contour line segmentation andautomatic reconstruction, but a bit more concern isbeing shown about the second aspect.
The main necessary steps described in mostpublications for an automatic or semiautomaticextraction procedure are the following:1. preprocessing of the raster scanned map2. segmentation3. processing of the binary image (filtering,
thinning, pruning, etc)4. curve reconstruction5. raster to vector conversion
Given the high complexity of most topographicmaps and the importance of color information, recent
Special issue of The Romanian Educational Network - RoEduNet
UbiCC Journal, Volume 6 681
research focused mainly on color processing of thescanned documents (using color scans of the maps);this is also the case of the proposed application. Inaddition, because of the many possible colorrepresentations of the contour lines (although shadesof brown are very common, there is no certain ruleconcerning the color) the segmentation method israther semiautomatic: the user interface offers a colorpalette, from which the user can choose the bestmatch.
Another problem, which makes segmentationeven more difficult, is caused by the false colors, aresult of the raster digitization of the map, and by thecolor halftoning technique used in the printingprocess. As further shown, the resulting noise is verydifficult to remove without affecting the thincontours.
Thus, to overcome aliasing and false colorproblems, Hedley [1] develops a gradientthresholding method, which utilizes spatial and colorspace information to get rid of noise pixels. Otherauthors [2] are employing scanned topographic mapconverted into CMYK space, where the value of theK channel is used in contour line detection. In [3]Lalonde and Li use L*a*b* and modified histogramsplitting for color pixel classification in order toobtain a binary image of the contour lines. S.Salvatore and P. [4] are taking advantage of the HSVcolor space to obtain a single color extraction. Theirmethod implies a quantization of the HSV space toreduce the complexity and building the huehistogram of the pixels, that fall in the chromaticregion of the HSV cone, the black or white pixels notbeing taken into consideration. Dupont et al. [5] usea watershed divide algorithm in RGB space to assigna pure map color to each pixel. [6] and [7] isolate thedifferent map layers, which all contain a dominantcolor, by transforming the RGB to the L*u*v* colorspace. Then they determine the peaks in thehistogram of the u*, v* coordinates whichcorrespond to the color clusters. Working directly ongray-level Chen et al. [8] are getting the contour linesegments by extraction of all of the linear featuresfrom histogram analysis and supervisedclassification. In [9], lines are removed from theimage using a novel algorithm based on quantizationof the intensity image followed by contrast limitedadaptive histogram equalization.
A slightly greater attention reflected on a largernumber of articles, has been shown to the secondaspect: binary image processing and automaticreconstruction. Thus, many articles treat only thereconstruction problem, considering the contour linesalready segmented and separated from the otherlayers. Arrighi and Soille [10] apply morphologicalfilters to the resulted binary image for noisereduction and then try to reconnect the brokencontour lines before a thinning procedure. Theirreconnection algorithm uses local information: the
Euclidean distances between the extreme points ofthe curves and their directions are combined for thejoining decision. L. Eikvril et al. [11] reconnect thecontours using a line tracing technique. Aninterruption is resolved by searching from an endpoint of a line. The corresponding end point might befound within a sector around the current direction.The use of Thin Plate Spline interpolation techniquesare suggested by [12].
D. Xin et al. [13] also use mathematicmorphology to filter the binary image [14]. Afterthinning the contour lines, they extract a set of keypoints using the c-means algorithm. These key pointsbecome input in the GGVF (Generalized gradientvector flow) snake model used for extracting thecurves. Shimada et al. [15] suggest a multi-agentsystem to solve the problem of contour linereconstruction. The purpose of each „tracing agent”,initialized by the user, is to follow a specific contour.When interruptions or other problems areencountered, it’s the role of a supervisor agent todecide which route to follow. S. Salvatore and P.Guitton [4] use the global topology of topographicmaps to extract and reconstruct the broken contours.Their reconstruction technique is based on twocomputational geometry concepts: Voronoi diagramsand Delaunay triangulations. The method is inspiredfrom the previous work of [16] and [17] focus on thereconstruction of contour lines using a method basedon the gradient orientation field of the contours. Aweight is assigned to each pair of end-pointsaccording the force needed by its potentialreconstructed curve to cross the field. The solution isthen found by solving a perfect matching problem.
Most of the reconstruction methods discussedabove use only local information and few includeinformation about the global topology of the contourlines. This results in poor reconstructions, with manyunsolved gaps or topological errors (ex. intersectingcontours), especially in maps with a high curvedensity.
2 APPLICATION FOR A SEMIAUTOMATICCONTOUR LINE EXTRACTION FROMSCANNED TOPOGRAPHIC MAPS
This application aims to be a solution for asemiautomatic procedure for extracting contour linesfrom raster images of scanned topographic maps,avoiding the time consuming effects of manualvectorization by reducing the human intervention asmuch as possible. Furthermore, in order to view theresult of isoline extraction, the application builds a 3-dimensional model of the map terrain.
A raster to vector conversion of the contour linesfrom a scanned map implies two major steps: colorimage segmentation for obtaining a binary image ofthe isolines and the binary processing of this imagefor curve recognition. At the end of each stage, a
Special issue of The Romanian Educational Network - RoEduNet
UbiCC Journal, Volume 6 682
limited intervention of the user is needed to choosethe color (colors) which best isolate the contour linesand a correction of the errors produced by the
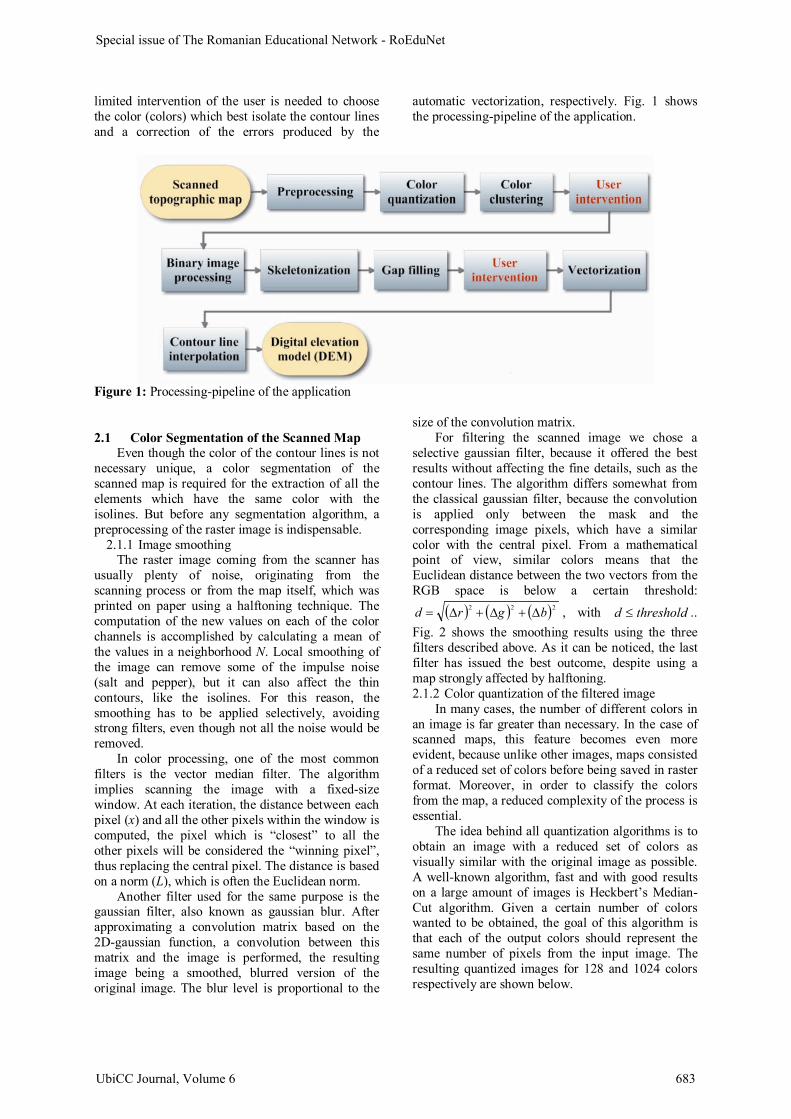
automatic vectorization, respectively. Fig. 1 showsthe processing-pipeline of the application.
Figure 1: Processing-pipeline of the application
2.1 Color Segmentation of the Scanned MapEven though the color of the contour lines is not
necessary unique, a color segmentation of thescanned map is required for the extraction of all theelements which have the same color with theisolines. But before any segmentation algorithm, apreprocessing of the raster image is indispensable.
2.1.1 Image smoothingThe raster image coming from the scanner has
usually plenty of noise, originating from thescanning process or from the map itself, which wasprinted on paper using a halftoning technique. Thecomputation of the new values on each of the colorchannels is accomplished by calculating a mean ofthe values in a neighborhood N. Local smoothing ofthe image can remove some of the impulse noise(salt and pepper), but it can also affect the thincontours, like the isolines. For this reason, thesmoothing has to be applied selectively, avoidingstrong filters, even though not all the noise would beremoved.
In color processing, one of the most commonfilters is the vector median filter. The algorithmimplies scanning the image with a fixed-sizewindow. At each iteration, the distance between eachpixel (x) and all the other pixels within the window iscomputed, the pixel which is “closest” to all theother pixels will be considered the “winning pixel”,thus replacing the central pixel. The distance is basedon a norm (L), which is often the Euclidean norm.
Another filter used for the same purpose is thegaussian filter, also known as gaussian blur. Afterapproximating a convolution matrix based on the2D-gaussian function, a convolution between thismatrix and the image is performed, the resultingimage being a smoothed, blurred version of theoriginal image. The blur level is proportional to the
size of the convolution matrix.For filtering the scanned image we chose a
selective gaussian filter, because it offered the bestresults without affecting the fine details, such as thecontour lines. The algorithm differs somewhat fromthe classical gaussian filter, because the convolutionis applied only between the mask and thecorresponding image pixels, which have a similarcolor with the central pixel. From a mathematicalpoint of view, similar colors means that theEuclidean distance between the two vectors from theRGB space is below a certain threshold:
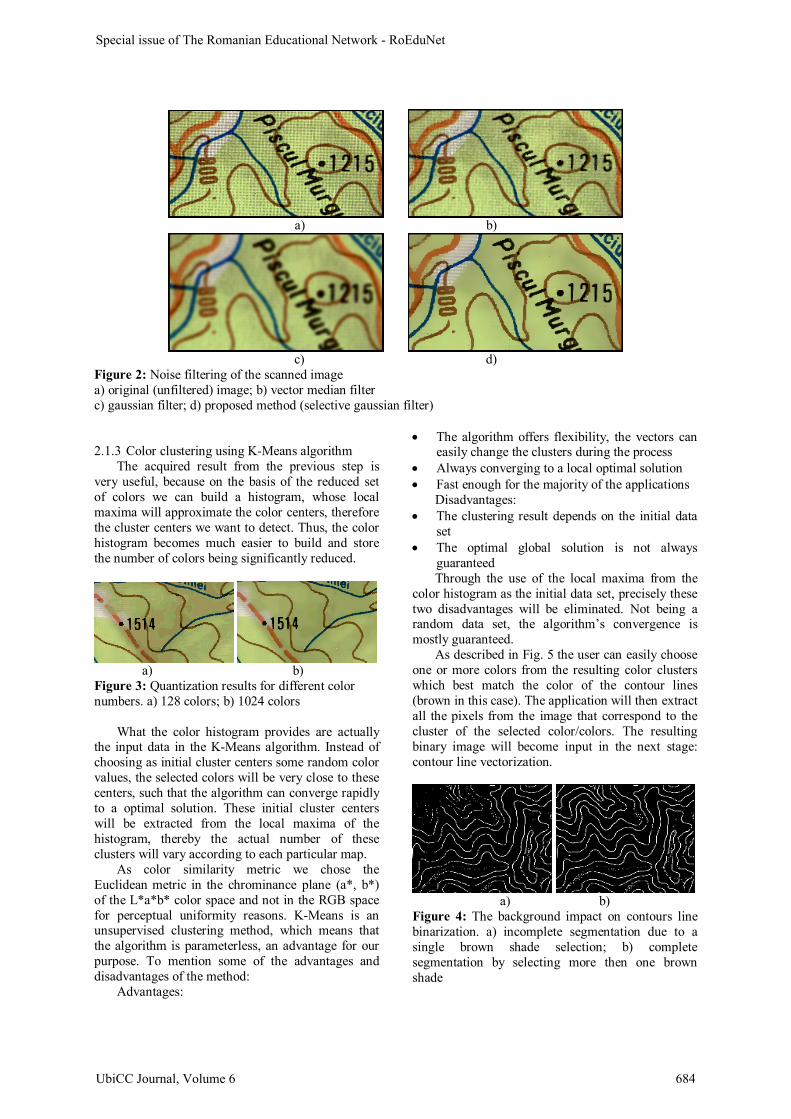
( ) ( ) ( )222 bgrd ∆+∆+∆= , with thresholdd ≤ ..Fig. 2 shows the smoothing results using the threefilters described above. As it can be noticed, the lastfilter has issued the best outcome, despite using amap strongly affected by halftoning.2.1.2 Color quantization of the filtered image
In many cases, the number of different colors inan image is far greater than necessary. In the case ofscanned maps, this feature becomes even moreevident, because unlike other images, maps consistedof a reduced set of colors before being saved in rasterformat. Moreover, in order to classify the colorsfrom the map, a reduced complexity of the process isessential.
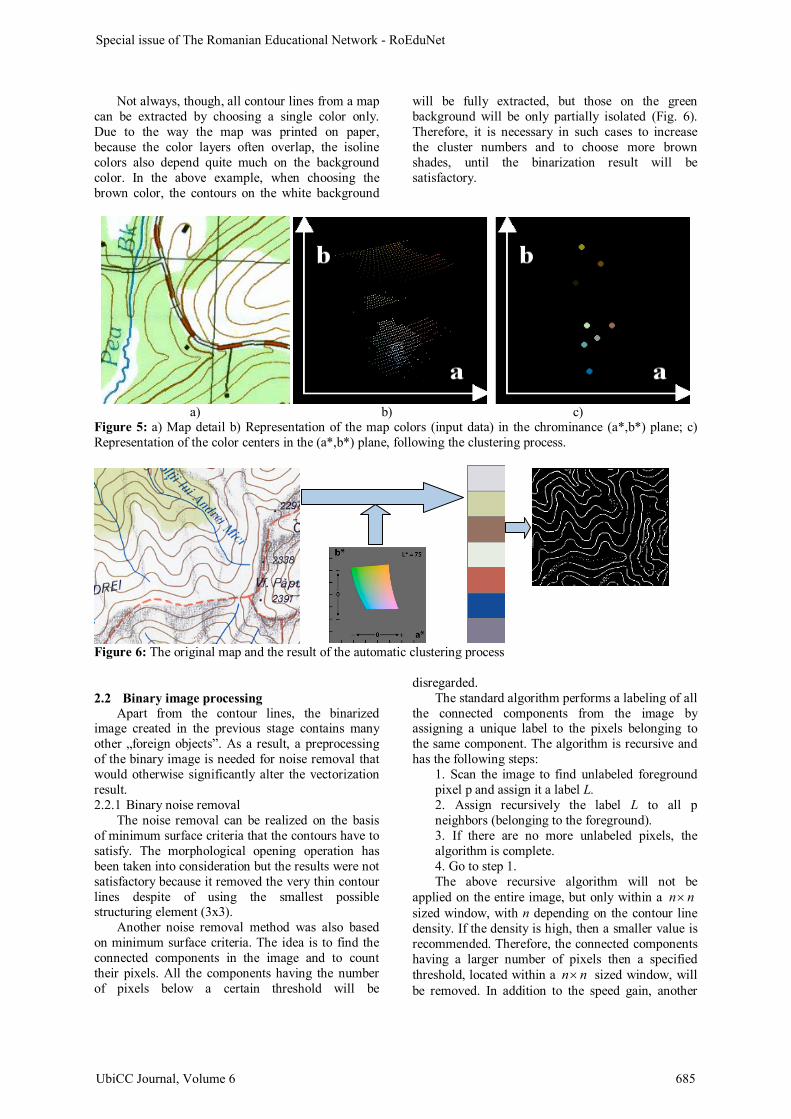
The idea behind all quantization algorithms is toobtain an image with a reduced set of colors asvisually similar with the original image as possible.A well-known algorithm, fast and with good resultson a large amount of images is Heckbert’s Median-Cut algorithm. Given a certain number of colorswanted to be obtained, the goal of this algorithm isthat each of the output colors should represent thesame number of pixels from the input image. Theresulting quantized images for 128 and 1024 colorsrespectively are shown below.
Special issue of The Romanian Educational Network - RoEduNet
UbiCC Journal, Volume 6 683
a) b)
c) d)Figure 2: Noise filtering of the scanned imagea) original (unfiltered) image; b) vector median filterc) gaussian filter; d) proposed method (selective gaussian filter)
2.1.3 Color clustering using K-Means algorithmThe acquired result from the previous step is
very useful, because on the basis of the reduced setof colors we can build a histogram, whose localmaxima will approximate the color centers, thereforethe cluster centers we want to detect. Thus, the colorhistogram becomes much easier to build and storethe number of colors being significantly reduced.
a) b)
Figure 3: Quantization results for different colornumbers. a) 128 colors; b) 1024 colors
What the color histogram provides are actuallythe input data in the K-Means algorithm. Instead ofchoosing as initial cluster centers some random colorvalues, the selected colors will be very close to thesecenters, such that the algorithm can converge rapidlyto a optimal solution. These initial cluster centerswill be extracted from the local maxima of thehistogram, thereby the actual number of theseclusters will vary according to each particular map.
As color similarity metric we chose theEuclidean metric in the chrominance plane (a*, b*)of the L*a*b* color space and not in the RGB spacefor perceptual uniformity reasons. K-Means is anunsupervised clustering method, which means thatthe algorithm is parameterless, an advantage for ourpurpose. To mention some of the advantages anddisadvantages of the method:
Advantages:
• The algorithm offers flexibility, the vectors caneasily change the clusters during the process
• Always converging to a local optimal solution• Fast enough for the majority of the applications
Disadvantages:• The clustering result depends on the initial data
set• The optimal global solution is not always
guaranteedThrough the use of the local maxima from the
color histogram as the initial data set, precisely thesetwo disadvantages will be eliminated. Not being arandom data set, the algorithm’s convergence ismostly guaranteed.
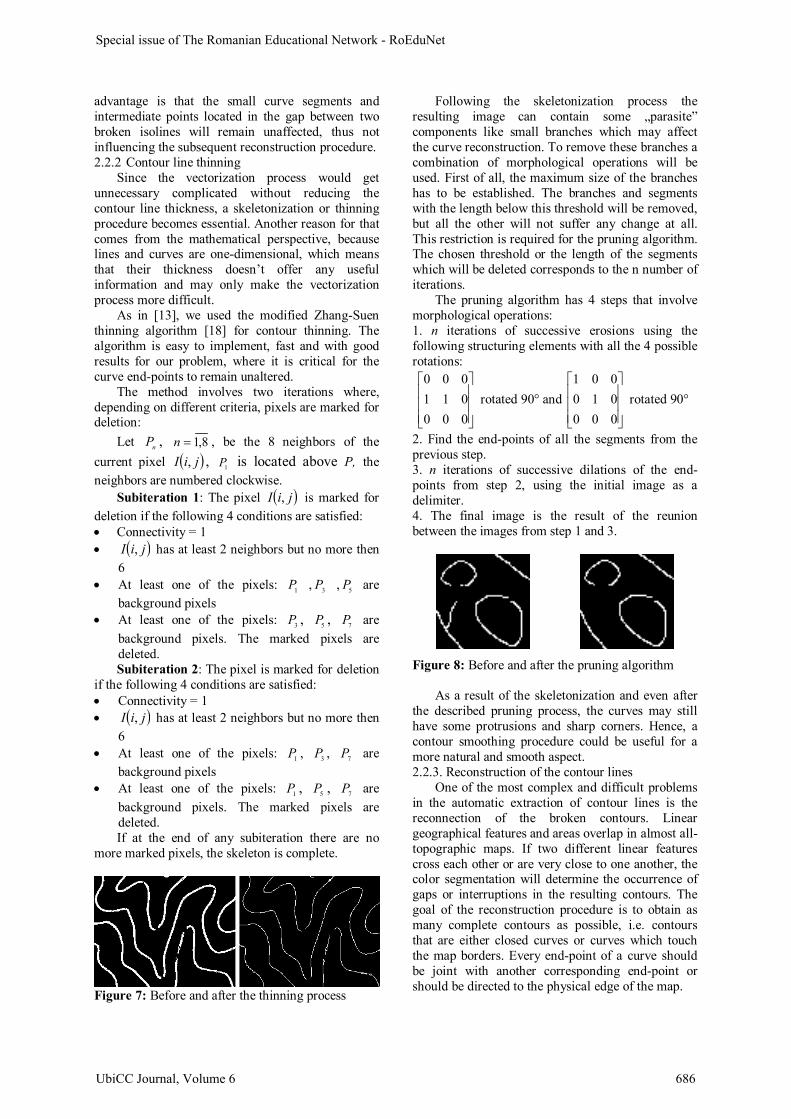
As described in Fig. 5 the user can easily chooseone or more colors from the resulting color clusterswhich best match the color of the contour lines(brown in this case). The application will then extractall the pixels from the image that correspond to thecluster of the selected color/colors. The resultingbinary image will become input in the next stage:contour line vectorization.
a) b)Figure 4: The background impact on contours linebinarization. a) incomplete segmentation due to asingle brown shade selection; b) completesegmentation by selecting more then one brownshade
Special issue of The Romanian Educational Network - RoEduNet
UbiCC Journal, Volume 6 684
Not always, though, all contour lines from a mapcan be extracted by choosing a single color only.Due to the way the map was printed on paper,because the color layers often overlap, the isolinecolors also depend quite much on the backgroundcolor. In the above example, when choosing thebrown color, the contours on the white background
will be fully extracted, but those on the greenbackground will be only partially isolated (Fig. 6).Therefore, it is necessary in such cases to increasethe cluster numbers and to choose more brownshades, until the binarization result will besatisfactory.
a) b) c)
Figure 5: a) Map detail b) Representation of the map colors (input data) in the chrominance (a*,b*) plane; c)Representation of the color centers in the (a*,b*) plane, following the clustering process.
Figure 6: The original map and the result of the automatic clustering process
2.2 Binary image processingApart from the contour lines, the binarized
image created in the previous stage contains manyother „foreign objects”. As a result, a preprocessingof the binary image is needed for noise removal thatwould otherwise significantly alter the vectorizationresult.2.2.1 Binary noise removal
The noise removal can be realized on the basisof minimum surface criteria that the contours have tosatisfy. The morphological opening operation hasbeen taken into consideration but the results were notsatisfactory because it removed the very thin contourlines despite of using the smallest possiblestructuring element (3x3).
Another noise removal method was also basedon minimum surface criteria. The idea is to find theconnected components in the image and to counttheir pixels. All the components having the numberof pixels below a certain threshold will be
disregarded.The standard algorithm performs a labeling of all
the connected components from the image byassigning a unique label to the pixels belonging tothe same component. The algorithm is recursive andhas the following steps:
1. Scan the image to find unlabeled foregroundpixel p and assign it a label L.2. Assign recursively the label L to all pneighbors (belonging to the foreground).3. If there are no more unlabeled pixels, thealgorithm is complete.4. Go to step 1.The above recursive algorithm will not be
applied on the entire image, but only within a nn ×sized window, with n depending on the contour linedensity. If the density is high, then a smaller value isrecommended. Therefore, the connected componentshaving a larger number of pixels then a specifiedthreshold, located within a nn × sized window, willbe removed. In addition to the speed gain, another
Special issue of The Romanian Educational Network - RoEduNet
UbiCC Journal, Volume 6 685
advantage is that the small curve segments andintermediate points located in the gap between twobroken isolines will remain unaffected, thus notinfluencing the subsequent reconstruction procedure.2.2.2 Contour line thinning
Since the vectorization process would getunnecessary complicated without reducing thecontour line thickness, a skeletonization or thinningprocedure becomes essential. Another reason for thatcomes from the mathematical perspective, becauselines and curves are one-dimensional, which meansthat their thickness doesn’t offer any usefulinformation and may only make the vectorizationprocess more difficult.
As in [13], we used the modified Zhang-Suenthinning algorithm [18] for contour thinning. Thealgorithm is easy to implement, fast and with goodresults for our problem, where it is critical for thecurve end-points to remain unaltered.
The method involves two iterations where,depending on different criteria, pixels are marked fordeletion:
Let nP , 8,1=n , be the 8 neighbors of thecurrent pixel ( )jiI , , 1P is located above P, theneighbors are numbered clockwise.
Subiteration 1: The pixel ( )jiI , is marked fordeletion if the following 4 conditions are satisfied:• Connectivity = 1• ( )jiI , has at least 2 neighbors but no more then
6• At least one of the pixels: 1P , 3P , 5P are
background pixels• At least one of the pixels: 3P , 5P , 7P are
background pixels. The marked pixels aredeleted.Subiteration 2: The pixel is marked for deletion
if the following 4 conditions are satisfied:• Connectivity = 1• ( )jiI , has at least 2 neighbors but no more then
6• At least one of the pixels: 1P , 3P , 7P are
background pixels• At least one of the pixels: 1P , 5P , 7P are
background pixels. The marked pixels aredeleted.If at the end of any subiteration there are no
more marked pixels, the skeleton is complete.
Figure 7: Before and after the thinning process
Following the skeletonization process theresulting image can contain some „parasite”components like small branches which may affectthe curve reconstruction. To remove these branches acombination of morphological operations will beused. First of all, the maximum size of the brancheshas to be established. The branches and segmentswith the length below this threshold will be removed,but all the other will not suffer any change at all.This restriction is required for the pruning algorithm.The chosen threshold or the length of the segmentswhich will be deleted corresponds to the n number ofiterations.
The pruning algorithm has 4 steps that involvemorphological operations:1. n iterations of successive erosions using thefollowing structuring elements with all the 4 possiblerotations:
000011000
rotated 90° and
000010001
rotated 90°
2. Find the end-points of all the segments from theprevious step.3. n iterations of successive dilations of the end-points from step 2, using the initial image as adelimiter.4. The final image is the result of the reunionbetween the images from step 1 and 3.
Figure 8: Before and after the pruning algorithm
As a result of the skeletonization and even afterthe described pruning process, the curves may stillhave some protrusions and sharp corners. Hence, acontour smoothing procedure could be useful for amore natural and smooth aspect.2.2.3. Reconstruction of the contour lines
One of the most complex and difficult problemsin the automatic extraction of contour lines is thereconnection of the broken contours. Lineargeographical features and areas overlap in almost all-topographic maps. If two different linear featurescross each other or are very close to one another, thecolor segmentation will determine the occurrence ofgaps or interruptions in the resulting contours. Thegoal of the reconstruction procedure is to obtain asmany complete contours as possible, i.e. contoursthat are either closed curves or curves which touchthe map borders. Every end-point of a curve shouldbe joint with another corresponding end-point orshould be directed to the physical edge of the map.
Special issue of The Romanian Educational Network - RoEduNet
UbiCC Journal, Volume 6 686
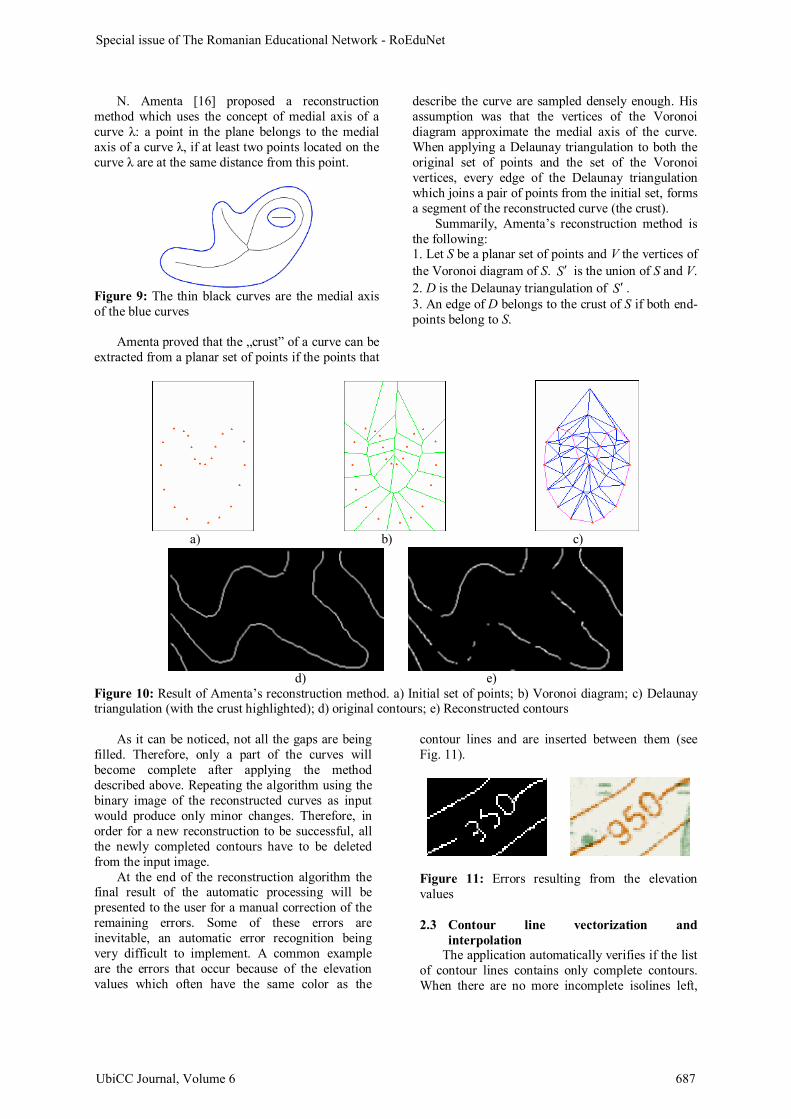
N. Amenta [16] proposed a reconstructionmethod which uses the concept of medial axis of acurve λ: a point in the plane belongs to the medialaxis of a curve λ, if at least two points located on thecurve λ are at the same distance from this point.
Figure 9: The thin black curves are the medial axisof the blue curves
Amenta proved that the „crust” of a curve can beextracted from a planar set of points if the points that
describe the curve are sampled densely enough. Hisassumption was that the vertices of the Voronoidiagram approximate the medial axis of the curve.When applying a Delaunay triangulation to both theoriginal set of points and the set of the Voronoivertices, every edge of the Delaunay triangulationwhich joins a pair of points from the initial set, formsa segment of the reconstructed curve (the crust).
Summarily, Amenta’s reconstruction method isthe following:1. Let S be a planar set of points and V the vertices ofthe Voronoi diagram of S. S ′ is the union of S and V.2. D is the Delaunay triangulation of S ′ .3. An edge of D belongs to the crust of S if both end-points belong to S.
a) b) c)
d) e)Figure 10: Result of Amenta’s reconstruction method. a) Initial set of points; b) Voronoi diagram; c) Delaunaytriangulation (with the crust highlighted); d) original contours; e) Reconstructed contours
As it can be noticed, not all the gaps are beingfilled. Therefore, only a part of the curves willbecome complete after applying the methoddescribed above. Repeating the algorithm using thebinary image of the reconstructed curves as inputwould produce only minor changes. Therefore, inorder for a new reconstruction to be successful, allthe newly completed contours have to be deletedfrom the input image.
At the end of the reconstruction algorithm thefinal result of the automatic processing will bepresented to the user for a manual correction of theremaining errors. Some of these errors areinevitable, an automatic error recognition beingvery difficult to implement. A common exampleare the errors that occur because of the elevationvalues which often have the same color as the
contour lines and are inserted between them (seeFig. 11).
Figure 11: Errors resulting from the elevationvalues
2.3 Contour line vectorization andinterpolation
The application automatically verifies if the listof contour lines contains only complete contours.When there are no more incomplete isolines left,
Special issue of The Romanian Educational Network - RoEduNet
UbiCC Journal, Volume 6 687
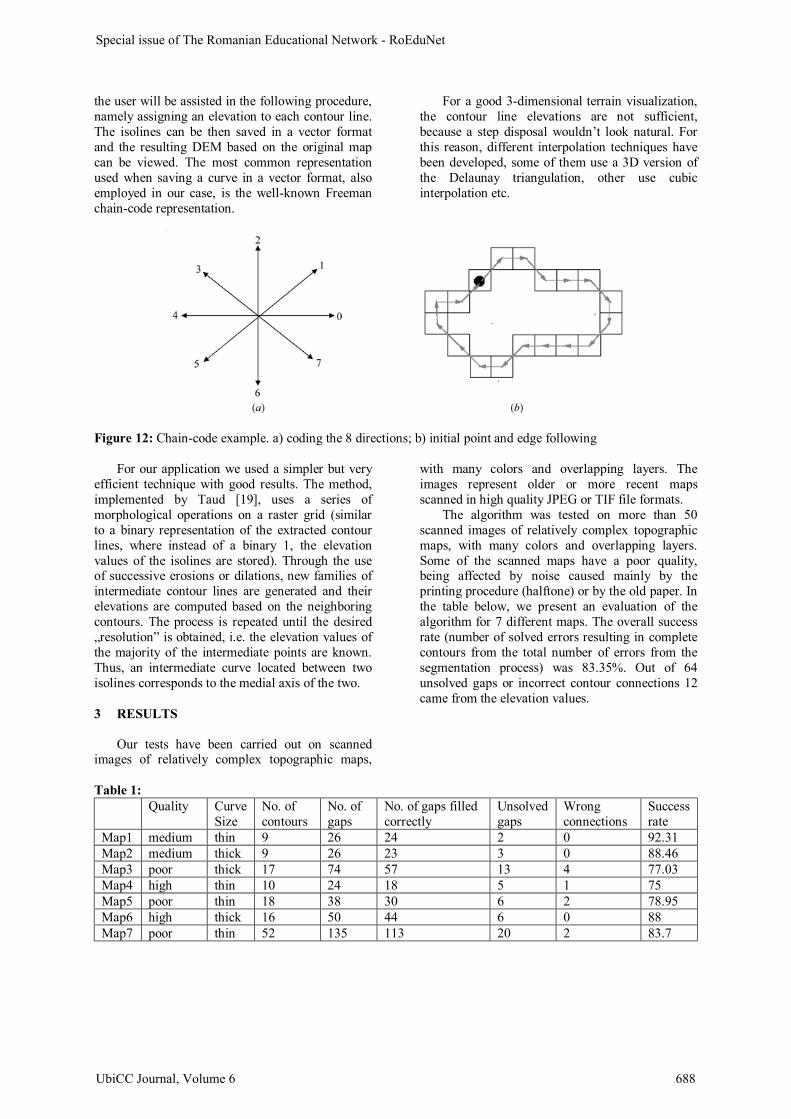
the user will be assisted in the following procedure,namely assigning an elevation to each contour line.The isolines can be then saved in a vector formatand the resulting DEM based on the original mapcan be viewed. The most common representationused when saving a curve in a vector format, alsoemployed in our case, is the well-known Freemanchain-code representation.
For a good 3-dimensional terrain visualization,the contour line elevations are not sufficient,because a step disposal wouldn’t look natural. Forthis reason, different interpolation techniques havebeen developed, some of them use a 3D version ofthe Delaunay triangulation, other use cubicinterpolation etc.
Figure 12: Chain-code example. a) coding the 8 directions; b) initial point and edge following
For our application we used a simpler but veryefficient technique with good results. The method,implemented by Taud [19], uses a series ofmorphological operations on a raster grid (similarto a binary representation of the extracted contourlines, where instead of a binary 1, the elevationvalues of the isolines are stored). Through the useof successive erosions or dilations, new families ofintermediate contour lines are generated and theirelevations are computed based on the neighboringcontours. The process is repeated until the desired„resolution” is obtained, i.e. the elevation values ofthe majority of the intermediate points are known.Thus, an intermediate curve located between twoisolines corresponds to the medial axis of the two.
3 RESULTS
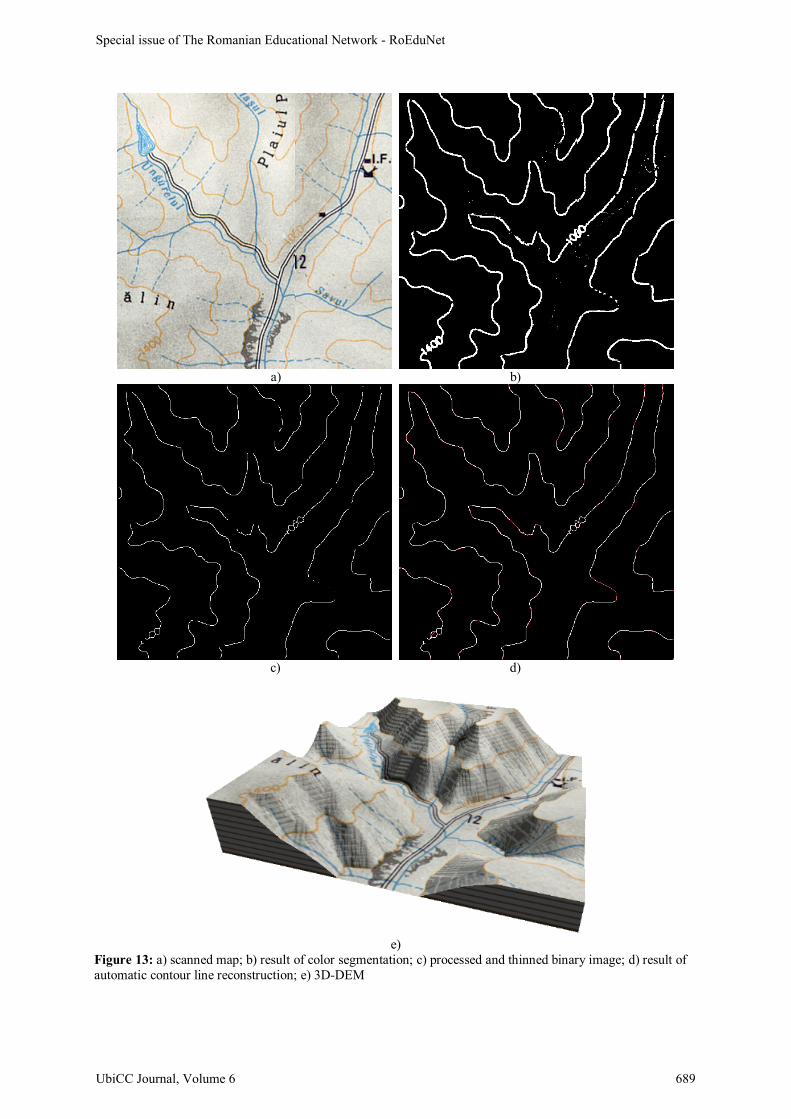
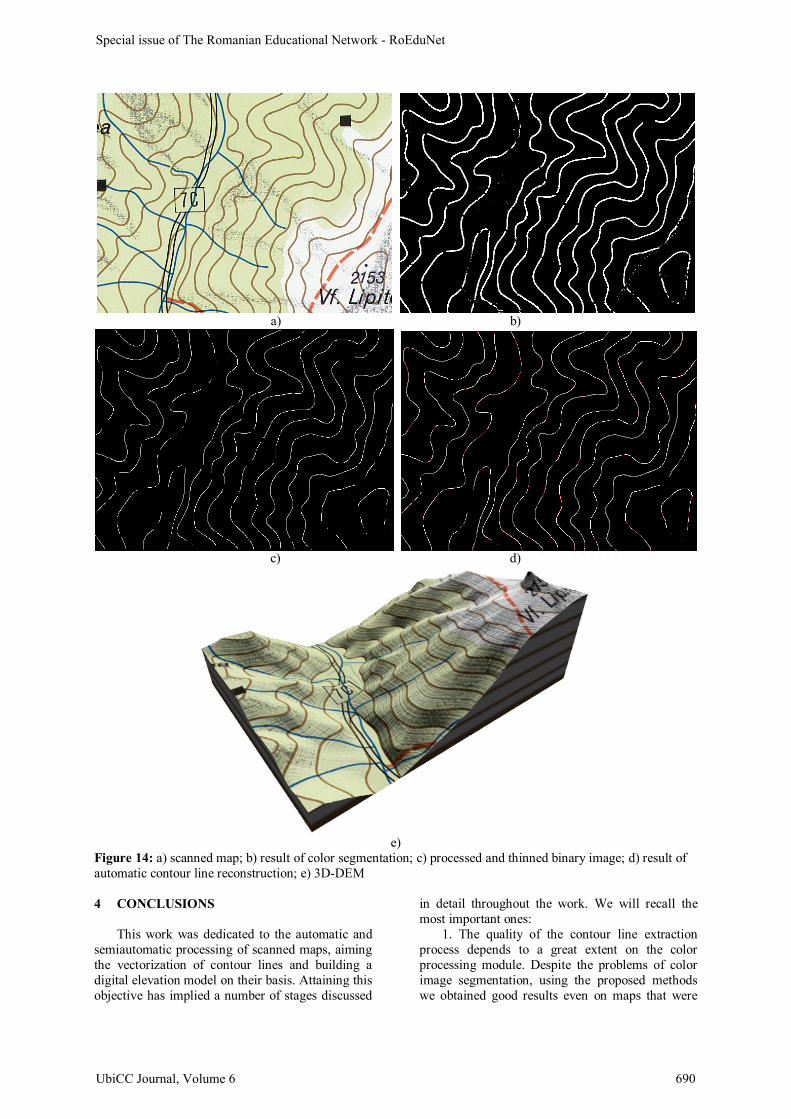
Our tests have been carried out on scannedimages of relatively complex topographic maps,
with many colors and overlapping layers. Theimages represent older or more recent mapsscanned in high quality JPEG or TIF file formats.
The algorithm was tested on more than 50scanned images of relatively complex topographicmaps, with many colors and overlapping layers.Some of the scanned maps have a poor quality,being affected by noise caused mainly by theprinting procedure (halftone) or by the old paper. Inthe table below, we present an evaluation of thealgorithm for 7 different maps. The overall successrate (number of solved errors resulting in completecontours from the total number of errors from thesegmentation process) was 83.35%. Out of 64unsolved gaps or incorrect contour connections 12came from the elevation values.
Table 1:Quality Curve
SizeNo. ofcontours
No. ofgaps
No. of gaps filledcorrectly
Unsolvedgaps
Wrongconnections
Successrate
Map1 medium thin 9 26 24 2 0 92.31Map2 medium thick 9 26 23 3 0 88.46Map3 poor thick 17 74 57 13 4 77.03Map4 high thin 10 24 18 5 1 75Map5 poor thin 18 38 30 6 2 78.95Map6 high thick 16 50 44 6 0 88Map7 poor thin 52 135 113 20 2 83.7
Special issue of The Romanian Educational Network - RoEduNet
UbiCC Journal, Volume 6 688
a) b)
c) d)
e)Figure 13: a) scanned map; b) result of color segmentation; c) processed and thinned binary image; d) result ofautomatic contour line reconstruction; e) 3D-DEM
Special issue of The Romanian Educational Network - RoEduNet
UbiCC Journal, Volume 6 689
a) b)
c) d)
e)Figure 14: a) scanned map; b) result of color segmentation; c) processed and thinned binary image; d) result ofautomatic contour line reconstruction; e) 3D-DEM
4 CONCLUSIONS
This work was dedicated to the automatic andsemiautomatic processing of scanned maps, aimingthe vectorization of contour lines and building adigital elevation model on their basis. Attaining thisobjective has implied a number of stages discussed
in detail throughout the work. We will recall themost important ones:
1. The quality of the contour line extractionprocess depends to a great extent on the colorprocessing module. Despite the problems of colorimage segmentation, using the proposed methodswe obtained good results even on maps that were
Special issue of The Romanian Educational Network - RoEduNet
UbiCC Journal, Volume 6 690
strongly affected by noise, coming either from thescanner or from the map itself (halftone, salt-and-pepper, false colors etc.). Reducing the complexitythrough a quantization of the color space andthrough the use of CIELab color space, moreperceptual uniform then RGB, a proper colorclustering has been attained. Nevertheless, if theoriginal map is poor an automatic colorclassification will fail.
2. The second stage implied a processing of theresulting binary image from the previous step andthe implementation of an automatic contourreconstruction method. The morphological filteringand thinning operations applied on the binary imagesucceeded to remove most of the noise andunnecessary elements. Because isolines are oftenthe lowest foreground layer of a map, many otherfeatures were superimposed on these, leading tointerruptions and broken contours. The efficiencyof the gap-filling algorithm consists in both a globaland local approach. Thus, using the geometricproperties of the curves, the achieved results weresatisfactory, most of the gaps being automaticallysolved.
Despite the good results obtained on a largeamount of scanned maps, a completely automaticmap processing technique is unrealistic and thesemiautomatic one remains an open problem.
The future development prospects are relatedmainly to two aspects:• Image segmentation (color processing)• Improvement of the automatic reconstruction
techniquesIt has been proven that the result of contour line
extraction is strongly related to the quality of thesegmentation process. The background color onwhich the contours have been printed also plays amajor role in the extraction, because it has a biginfluence on their color. In this respect, algorithmsthat take into account the background color forevery foreground pixel should be searched for, inorder to obtain a better segmentation technique.
As an improvement of contour linereconstruction, adding more global informationabout isolines and introducing OCR techniques forextracting elevation values, could be useful. Thus,some of the common causes that lead to brokencontours can be eliminated. At the same time, anautomatic or semiautomatic procedure for assigningaltitude information to the extracted isolines can betaken advantage of.
5 REFERENCES
[1] M. Hedley, H. Yan: Segmentation of colorimages using spatial and color spaceinformation, Journal of Electron. Imaging, Vol.1, pp. 374-380 (1992)
[2] R. Q. Wu, X. R. Cheng, C. J. Yang: Extractingcontour lines from topographic maps based on
cartography and graphics knowledge, Journalof Computer Science & Technology 9(2), pp.58-64 (2009)
[3] M. Lalonde, Y Li: Contour Line Extractionfrom Color Images of Scanned Maps, InProceedings of the 9th international Conferenceon Image Analysis and Processing, Vol. I, Ed.Lecture Notes In Computer Science, vol. 1310,Springer-Verlag, London, pp.111-118 (1997)
[4] S. Spinello, P. Guitton:. Contour LinesRecognition from Scanned Topographic Maps,Journal of Winter School of ComputerGraphics, Vol.12, No.1-3 (2004)
[5] F. Dupont, M. Deseilligny, M. Gondran:Terrain Reconstruction from ScannedTopographic Maps, Proceeding ThirdInternationl Workshop Graphics Recognition,pp. 53-60 (1999)
[6] N. Ebi, B. Lauterbach, W. Anheier: An image-analysis system for automatic dat:-acquisitionfrom colored scanned maps, Machine Visionand Applications, 7(3), pp. 148-164 (1994)
[7] L. W. Kheng: Color Spaces and Color-Difference Equations, Technical Report, Dept.of Computer Science, National University ofSingapore (2002)
[8] Y. Chen, Runsheng Wang, Jing Qian:Extracting contour lines from common-conditioned topographic maps. Geoscience andRemote Sensing, IEEE Transactions on, 44(4),pp. 1048-1057 (2006)
[9] A. Pezeshk, R. L. Tutwiler: Contour LineRecognition & Extraction from Scanned ColourMaps Using Dual Quantization of the IntensityImage, Proceedings of the 2008 IEEESouthwest Symposium on Image Analysis andinterpretation, pp. 173-176 (2008)
[10] P. Arrighi, P. Soille: From scanned topographicmaps to digital elevation models, Geovision'99, International Symposium on ImagingApplications in Geology, pp. 1-4 (1999)
[11] L. Eikvil, K. Aas, H. Koren: Tools forinteractive map conversion and vectorization,International Conference on DocumentAnalysis and Recognition, Third InternationalConference on Document Analysis andRecognition, Vol. 2, pp. 927-930 (1995)
[12] A. Soycan, M. Soycan: Digital ElevationModel Production from Scanned TopographicContour Maps Via Thin Plate SplineInterpolation, The Arabian Journal for Scienceand Engineering Science, 34(1A), pp. 121-134(2009)
[13] D. Xin, X. Zhou, H. Zhenz: Contour LineExtraction from Paper-based TopographicMaps, Journal of Information and ComputingScience, 1(275–283) (2006).
[14] J. Du, Y. Zhang: Automatic extraction ofcontour lines from scanned topographic map,.Geoscience and Remote Sensing Symposium,
Special issue of The Romanian Educational Network - RoEduNet
UbiCC Journal, Volume 6 691
IGARSS '04, Proceedings, IEEE International,Vol. 5, pp. 2886-2888 (2004)
[15] S. Shimada, K. Maruyama, A. Matsumoto andK. Hiraki: Agent-based parallel recognitionmethod of contour lines, In Proceedings of theThird international Conference on DocumentAnalysis and Recognition, Vol. 1, IEEEComputer Society, Washington, DC, pp. 154(1995)
[16] N. Amenta, M. Bern, D. Eppstein: The Crustand the Beta-Skeleton: Combinatorial CurveReconstruction, Graphical models and imageprocessing, 60(2), pp. 125-135 (1998)
[17] J. Pouderoux, S. Spinello: Global ContourLines Reconstruction in Topographic Maps, InProceedings of the Ninth internationalConference on Document Analysis andRecognition, Vol. 02, ICDAR, IEEE ComputerSociety, Washington, DC, pp. 779-783 (2007)
[18] T. Y. Zhang, C. Y. Suen: A fast parallelalgorithm for thinning digital patterns.Commun, ACM 27, 3, pp. 236-239 (1984)
[19] H. Taud, J. Parrot, R. Alvarez: DEMgeneration by contour line dilation, Comput.Geosci, 25, 7, pp. 775-783 (1999)
Special issue of The Romanian Educational Network - RoEduNet
UbiCC Journal, Volume 6 692


![A new framework for the extraction of contour lines …rbrad.ulbsibiu.ro/publications/papers/idc2010.pdflevel Chen et al. [9] are getting the contour line segments by extraction of](https://static.fdocuments.net/doc/165x107/5fc8ecb7edd25479712ad591/a-new-framework-for-the-extraction-of-contour-lines-rbrad-level-chen-et-al-9.jpg)