Continuous Wave Ultrasonic Doppler...
4
Continuous Wave Ultrasonic Doppler Tonometry Abraham Akinin, Joshua Yang, Alexander Williams, Andrew Lee, Pedram Pourhoseini, Arnost Fronek, Gert Cauwenberghs Department of Bioengineering, University of California San Diego La Jolla, California, USA Email: [email protected] Abstract— A variety of cardiovascular conditions such as hypertension are related to the decay in the mechanical properties of blood vessels. We combine continuous wave Doppler ultrasound measurement of blood velocity with high- resolution compressive force sensing to design a sensor to analyze the hemodynamic characteristics of blood vessels. We test the specifications of our device through an ultrasonic phantom we developed and a set of calibration routines for the tonometer, the Doppler velocity analysis and the design of a blood mimicking fluid. Finally we demonstrate the application of our Doppler tonometer in the analysis of veins and arteries. We show the change in hemodynamic parameters typical to a veins and artery during Doppler Tonometry. Keywords—sensors, ultrasound, hemodynamics, Doppler, medical devices, non-invasive, blood pressure I. INTRODUCTION Doppler ultrasound is a clinically useful diagnostic tool for a variety of cardiac conditions [1]. The principle of this technique relies on a shift in the frequency of a signal reflected from a moving object. This shift is proportional to the velocity of that object, and has found significant use in medical imaging diagnostics, with a variety of Doppler technologies currently in place. A current challenge in the use of this technology is that applied pressure due to operator usage of such devices can affect the hemodynamic properties of the vessel of interest, such as the pressure and velocity waveform [2]. These distortions can affect the measured parameters of interest, clouding derivable insight into a patient’s medical state. Current approaches to non-invasive Doppler ultrasound do not account for these potential errors despite the sustained popularity of this technique. One particular cardiac characteristic that has recently gained interest among healthcare professionals is the loss of compliance of the elastic arteries [3]. This increase in arterial stiffness has been associated with increases in the systolic arterial and pulse pressure, which are risk factors for serious cardiac complications, such as endothelial dysfunction. One current method of measuring stiffness is through the use of tonometry, which involves applying a force to applanate the vessel of concern with concurrent measurement of parameters such as the augmentation index and pulse wave velocity [4, 5]. However, accurate tonometry, as a single modality, remains challenging. Here, we present our combination Doppler tonometer system with the details of the calibration and data acquisition methods in relation to arterial and venous waveforms. The system is assembled using a Doppler ultrasound probe attached in serial to a force transducer. This device and corresponding analysis would allow physicians to perform routine Doppler ultrasound-related techniques while dynamically monitoring the applied force. Relationships between applied force and velocity waveform can then be elucidated. Additionally, the tonometer aspect of this device will enable for additional diagnostic abilities to detect increasing arterial stiffness before more serious complications arise. These two components can also act in concert to give confirmatory measurements [6]. Together, these independent techniques can establish with augmented accuracy the waveform of varying blood vessels and a gauge of vessel stiffness. II. IMPLEMENTATION AND VALIDATION A. Overview While making non-invasive hand-held hemodynamic measurements of surface blood vessels, it is necessary to manually apply pressure until the ultrasound transducer, the gel and the body make a tight contact. This pressure will inevitably affect the flow characteristics at the recording site. The operator usually attempts to maintain a constant and appropiate pressure on the blood vessel, though this is usually controlled through subjective audio or visual feedback. Our design combines continuous wave ultrasound doppler blood flow measurement with a high resolution force sensor to include the Fig. 1. Our current Doppler tonometer sensor system for continuous wave monitoring in venous and arterial vessels. 978-1-4799-2346-5/14/$31.00 ©2014 IEEE
Transcript of Continuous Wave Ultrasonic Doppler...

Continuous Wave Ultrasonic Doppler Tonometry Abraham Akinin, Joshua Yang, Alexander Williams, Andrew Lee, Pedram Pourhoseini, Arnost Fronek, Gert
Cauwenberghs Department of Bioengineering, University of California San Diego
La Jolla, California, USA Email: [email protected]
Abstract— A variety of cardiovascular conditions such as hypertension are related to the decay in the mechanical properties of blood vessels. We combine continuous wave Doppler ultrasound measurement of blood velocity with high-resolution compressive force sensing to design a sensor to analyze the hemodynamic characteristics of blood vessels. We test the specifications of our device through an ultrasonic phantom we developed and a set of calibration routines for the tonometer, the Doppler velocity analysis and the design of a blood mimicking fluid. Finally we demonstrate the application of our Doppler tonometer in the analysis of veins and arteries. We show the change in hemodynamic parameters typical to a veins and artery during Doppler Tonometry.
Keywords—sensors, ultrasound, hemodynamics, Doppler, medical devices, non-invasive, blood pressure
I. INTRODUCTION Doppler ultrasound is a clinically useful diagnostic tool for
a variety of cardiac conditions [1]. The principle of this technique relies on a shift in the frequency of a signal reflected from a moving object. This shift is proportional to the velocity of that object, and has found significant use in medical imaging diagnostics, with a variety of Doppler technologies currently in place. A current challenge in the use of this technology is that applied pressure due to operator usage of such devices can affect the hemodynamic properties of the vessel of interest, such as the pressure and velocity waveform [2]. These distortions can affect the measured parameters of interest, clouding derivable insight into a patient’s medical state. Current approaches to non-invasive Doppler ultrasound do not account for these potential errors despite the sustained popularity of this technique.
One particular cardiac characteristic that has recently gained interest among healthcare professionals is the loss of compliance of the elastic arteries [3]. This increase in arterial stiffness has been associated with increases in the systolic arterial and pulse pressure, which are risk factors for serious cardiac complications, such as endothelial dysfunction. One current method of measuring stiffness is through the use of tonometry, which involves applying a force to applanate the vessel of concern with concurrent measurement of parameters such as the augmentation index and pulse wave velocity [4, 5]. However, accurate tonometry, as a single modality, remains challenging.
Here, we present our combination Doppler tonometer system with the details of the calibration and data acquisition methods in relation to arterial and venous waveforms. The
system is assembled using a Doppler ultrasound probe attached in serial to a force transducer. This device and corresponding analysis would allow physicians to perform routine Doppler ultrasound-related techniques while dynamically monitoring the applied force. Relationships between applied force and velocity waveform can then be elucidated. Additionally, the tonometer aspect of this device will enable for additional diagnostic abilities to detect increasing arterial stiffness before more serious complications arise. These two components can also act in concert to give confirmatory measurements [6]. Together, these independent techniques can establish with augmented accuracy the waveform of varying blood vessels and a gauge of vessel stiffness.
II. IMPLEMENTATION AND VALIDATION
A. Overview While making non-invasive hand-held hemodynamic
measurements of surface blood vessels, it is necessary to manually apply pressure until the ultrasound transducer, the gel and the body make a tight contact. This pressure will inevitably affect the flow characteristics at the recording site. The operator usually attempts to maintain a constant and appropiate pressure on the blood vessel, though this is usually controlled through subjective audio or visual feedback. Our design combines continuous wave ultrasound doppler blood flow measurement with a high resolution force sensor to include the
Fig. 1. Our current Doppler tonometer sensor system for continuous wave monitoring in venous and arterial vessels.
978-1-4799-2346-5/14/$31.00 ©2014 IEEE

applied pressure information. This feature enables operator force to serve as an actuator probe of the hemodynamic parameters of the target blood vessel. Fig. 1 shows our sensor is portable and easy to use. Fig. 2 illustrates the functionality of our device in a block diagram.
B. Continuous Wave Doppler Ultrasound Piezoelectric Pair A pair of piezoelectric dual sensor/actuators are located at
the tip of a an aluminum cylinder 9.5mm in diameter. Our sensor is a modified version of a Parks Medical Electronics probe tested to mechanically resonate at 9.2 MHz. The probe has a focal length of a few mm. The probe has been machined into a shorter and more ergonomic shape to support simultaneous force/velocity measurement and to avoid torques on the force sensor.
C. High Resolution Force Sensor . A bridge based force sensor with an internal metal
cantilever was adapted from Vernier Dual Range Force Sensor. A special coupling joint was designed to fit the machined Doppler sensor to obtain mechanical stability during measurement. Aside from achieving sub 0.1N resolution the sensor is impervious to overforce damage by more than 50N.
D. Doppler Front End. An analog front end for Doppler ultrasound measurement
was acquired from Parks Medical (Doppler 842). This device provides the stimulation signal for the ultrasound emitter and analog signal processing of the frequency shifted Doppler signal. The device also contains an audio feedback system to confirm to the user that they have focused on a blood vessel.
E. Ultrasound Phantom and Blood Mimicking Fluid. We designed a physical system to calibrate the output
voltage of the Doppler system with the velocity of the fluid. Fig. 3 shows our phantom system calibration setup. We are
able to generate varying fluid speeds through thin Teflon tubing with 2.38mm internal diameter. The fluid was pumped manually through a syringe and the flow rate was analyzed by video capture of the syringe markings. We casted a well concentrated gelatin mold in a flexible container around a section of the tube to simulate the distance from the blood vessel. Additionally to simulate the Doppler reflectivity properties of blood we designed a biomimetic fluid using Cresol Red dye, Sepharose Microbeads 30-100μm diameter, and water. The fluid showed much better signal quality than pure water. Reference [7] has characterized a similar fluid.
F. Calibration Tests. The blood mimicking fluid was analyzed with a Discovery
HR2 Hybrid Rheometer (TA Instruments) to measure the fluid viscosity at different shear rates. Fig. 4A shows that the blood mimicking fluid is more viscous than water, more similar to blood, and generally Newtonian.
BMF Reservoir
Video Flow Rate Analysis
Or Syringe Pump
Gelatin Ultrasound Phantom
Doppler Tonometer
Fig. 2. Simplified functional block diagram of the Doppler tonometer system. Applied force exerts a pressure on the surface, causing deformations in the skin and, to a lesser degree, in the vessel of interest. Red blood cells and other particulate matter reflect the transmitted signal at a shifted frequency proportional to the velocity. Processed signals are relayed to an ADC/DSP and to a speaker, the latter of which provides audio cues for proper device positioning. Downstream analysis and data storage can be performed on the ADC/DSP.
Fig. 3. Doppler phantom system set-up for calibration of the Doppler ultrasound to velocity.
Angled PiezoelectricTransmitter +
Receiver
Force Sensor
Doppler Front End
Power5V 9V
9.1 MHz Sinusoid
ADC/DSP
AppliedForce
VelocityAppliedPressure
Audio Vessel Localization
Compression Force
Return Ultrasound Signal
SkinVessel
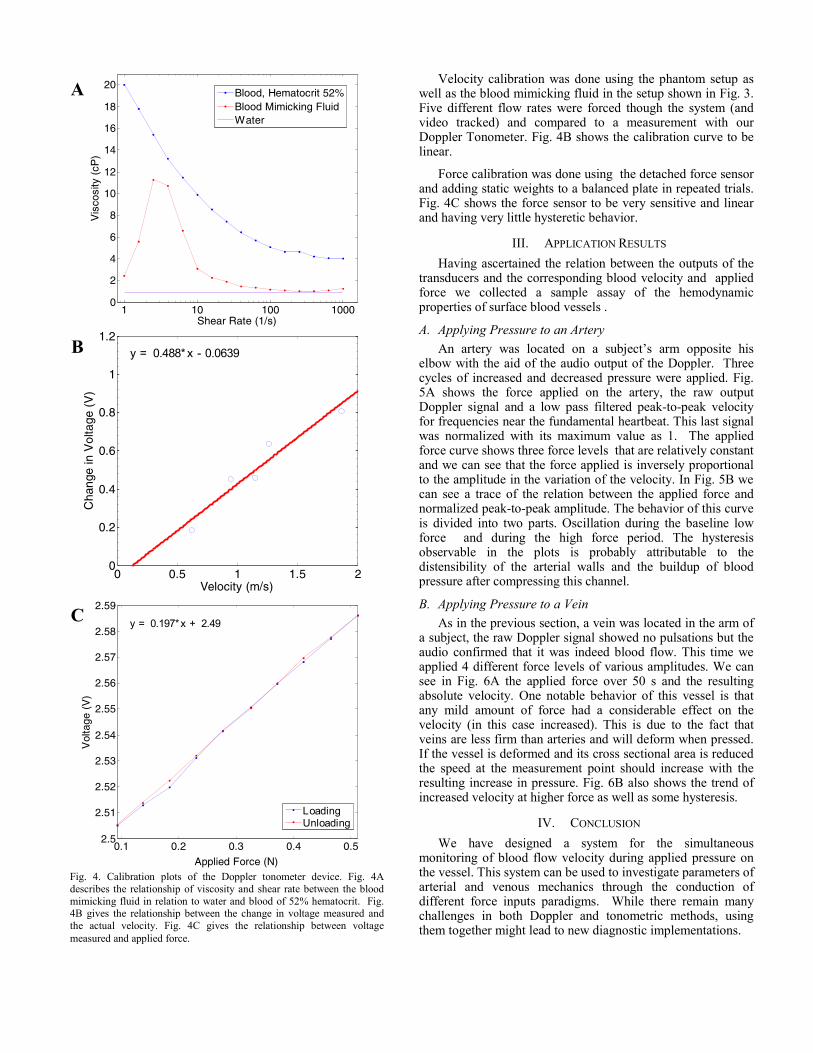
Velocity calibration was done using the phantom setup as well as the blood mimicking fluid in the setup shown in Fig. 3. Five different flow rates were forced though the system (and video tracked) and compared to a measurement with our Doppler Tonometer. Fig. 4B shows the calibration curve to be linear.
Force calibration was done using the detached force sensor and adding static weights to a balanced plate in repeated trials. Fig. 4C shows the force sensor to be very sensitive and linear and having very little hysteretic behavior.
III. APPLICATION RESULTS Having ascertained the relation between the outputs of the
transducers and the corresponding blood velocity and applied force we collected a sample assay of the hemodynamic properties of surface blood vessels .
A. Applying Pressure to an Artery An artery was located on a subject’s arm opposite his
elbow with the aid of the audio output of the Doppler. Three cycles of increased and decreased pressure were applied. Fig. 5A shows the force applied on the artery, the raw output Doppler signal and a low pass filtered peak-to-peak velocity for frequencies near the fundamental heartbeat. This last signal was normalized with its maximum value as 1. The applied force curve shows three force levels that are relatively constant and we can see that the force applied is inversely proportional to the amplitude in the variation of the velocity. In Fig. 5B we can see a trace of the relation between the applied force and normalized peak-to-peak amplitude. The behavior of this curve is divided into two parts. Oscillation during the baseline low force and during the high force period. The hysteresis observable in the plots is probably attributable to the distensibility of the arterial walls and the buildup of blood pressure after compressing this channel.
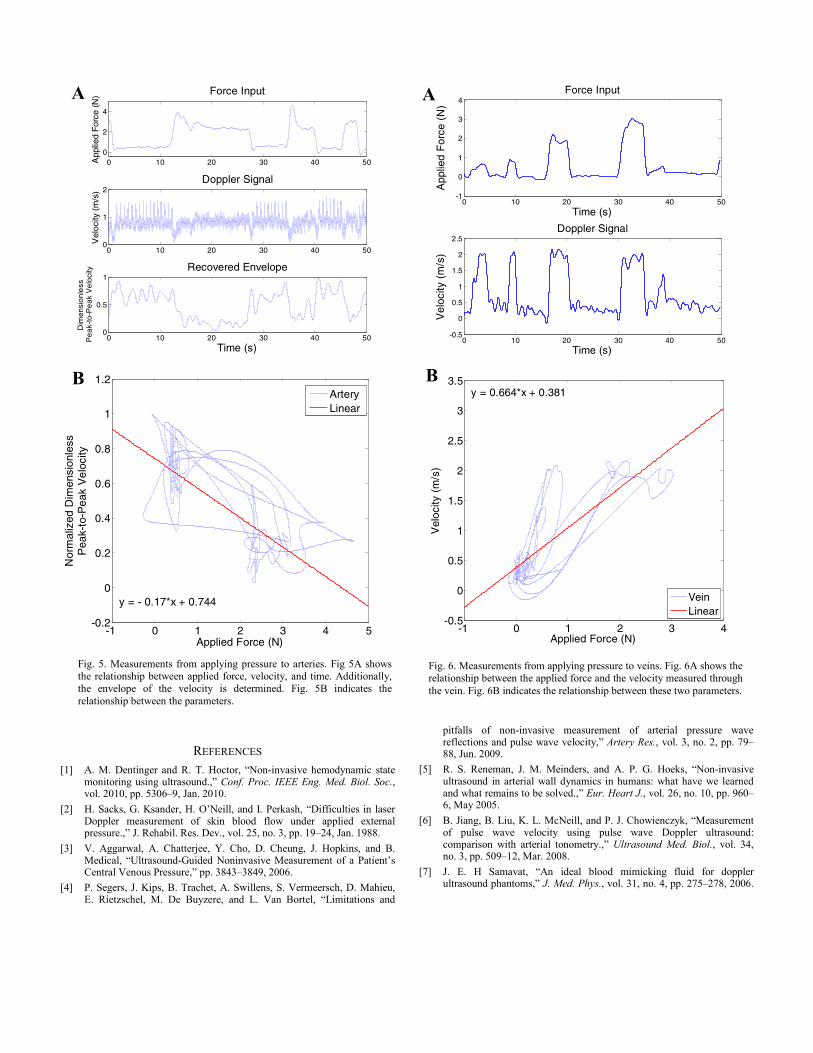
B. Applying Pressure to a Vein As in the previous section, a vein was located in the arm of
a subject, the raw Doppler signal showed no pulsations but the audio confirmed that it was indeed blood flow. This time we applied 4 different force levels of various amplitudes. We can see in Fig. 6A the applied force over 50 s and the resulting absolute velocity. One notable behavior of this vessel is that any mild amount of force had a considerable effect on the velocity (in this case increased). This is due to the fact that veins are less firm than arteries and will deform when pressed. If the vessel is deformed and its cross sectional area is reduced the speed at the measurement point should increase with the resulting increase in pressure. Fig. 6B also shows the trend of increased velocity at higher force as well as some hysteresis.
IV. CONCLUSION We have designed a system for the simultaneous
monitoring of blood flow velocity during applied pressure on the vessel. This system can be used to investigate parameters of arterial and venous mechanics through the conduction of different force inputs paradigms. While there remain many challenges in both Doppler and tonometric methods, using them together might lead to new diagnostic implementations.
Fig. 4. Calibration plots of the Doppler tonometer device. Fig. 4A describes the relationship of viscosity and shear rate between the blood mimicking fluid in relation to water and blood of 52% hematocrit. Fig. 4B gives the relationship between the change in voltage measured and the actual velocity. Fig. 4C gives the relationship between voltage measured and applied force.
1 10 100 10000
2
4
6
8
10
12
14
16
18
20
Shear Rate (1/s)
Vis
cosi
ty (
cP)
Blood, Hematocrit 52%Blood Mimicking FluidWater
0 0.5 1 1.5 20
0.2
0.4
0.6
0.8
1
1.2
Velocity (m/s)
Cha
nge
in V
olta
ge (
V)
y = 0.488*x - 0.0639
0.1 0.2 0.3 0.4 0.52.5
2.51
2.52
2.53
2.54
2.55
2.56
2.57
2.58
2.59
Applied Force (N)
Vol
tage
(V
)
LoadingUnloading
y = 0.197*x + 2.49
A
B
C
REFERENCES [1] A. M. Dentinger and R. T. Hoctor, “Non-invasive hemodynamic state
monitoring using ultrasound.,” Conf. Proc. IEEE Eng. Med. Biol. Soc., vol. 2010, pp. 5306–9, Jan. 2010.
[2] H. Sacks, G. Ksander, H. O’Neill, and I. Perkash, “Difficulties in laser Doppler measurement of skin blood flow under applied external pressure.,” J. Rehabil. Res. Dev., vol. 25, no. 3, pp. 19–24, Jan. 1988.
[3] V. Aggarwal, A. Chatterjee, Y. Cho, D. Cheung, J. Hopkins, and B. Medical, “Ultrasound-Guided Noninvasive Measurement of a Patient’s Central Venous Pressure,” pp. 3843–3849, 2006.
[4] P. Segers, J. Kips, B. Trachet, A. Swillens, S. Vermeersch, D. Mahieu, E. Rietzschel, M. De Buyzere, and L. Van Bortel, “Limitations and
pitfalls of non-invasive measurement of arterial pressure wave reflections and pulse wave velocity,” Artery Res., vol. 3, no. 2, pp. 79–88, Jun. 2009.
[5] R. S. Reneman, J. M. Meinders, and A. P. G. Hoeks, “Non-invasive ultrasound in arterial wall dynamics in humans: what have we learned and what remains to be solved.,” Eur. Heart J., vol. 26, no. 10, pp. 960–6, May 2005.
[6] B. Jiang, B. Liu, K. L. McNeill, and P. J. Chowienczyk, “Measurement of pulse wave velocity using pulse wave Doppler ultrasound: comparison with arterial tonometry.,” Ultrasound Med. Biol., vol. 34, no. 3, pp. 509–12, Mar. 2008.
[7] J. E. H Samavat, “An ideal blood mimicking fluid for doppler ultrasound phantoms,” J. Med. Phys., vol. 31, no. 4, pp. 275–278, 2006.
Fig. 5. Measurements from applying pressure to arteries. Fig 5A shows the relationship between applied force, velocity, and time. Additionally, the envelope of the velocity is determined. Fig. 5B indicates the relationship between the parameters.
0 10 20 30 40 500
2
4
Force InputA
pplie
d F
orce
(N
)
0 10 20 30 40 500
1
2Doppler Signal
Vel
ocity
(m
/s)
0 10 20 30 40 500
0.5
1Recovered Envelope
Time (s)
Dim
ensi
onl
ess
Pe
ak-t
o-P
eak
Ve
loci
ty
-1 0 1 2 3 4 5-0.2
0
0.2
0.4
0.6
0.8
1
1.2
Applied Force (N)
Nor
mal
ized
Dim
ensi
onle
ssP
eak-
to-P
eak
Vel
ocity
y = - 0.17*x + 0.744
ArteryLinear
A
B
0 10 20 30 40 50-1
0
1
2
3
4
App
lied
For
ce (
N)
Time (s)
Force Input
0 10 20 30 40 50-0.5
0
0.5
1
1.5
2
2.5
Vel
ocity
(m
/s)
Time (s)
Doppler Signal
-1 0 1 2 3 4-0.5
0
0.5
1
1.5
2
2.5
3
3.5
Applied Force (N)
Vel
ocity
(m
/s)
y = 0.664*x + 0.381
VeinLinear
A
B
Fig. 6. Measurements from applying pressure to veins. Fig. 6A shows the relationship between the applied force and the velocity measured through the vein. Fig. 6B indicates the relationship between these two parameters.