Continuous Crystallization of Pharmaceuticals Using a ... · point, however, nucleation and crystal...
7
Continuous Crystallization of Pharmaceuticals Using a Continuous Oscillatory Baffled Crystallizer Simon Lawton, † Gerry Steele, † and Phil Shering ‡ Process Engineering, Process R&D, AstraZeneca R&D Charnwood, Bakewell Road, Loughborough LE11 5RH, England, AstraZeneca Engineering, Alderley Park, Macclesfield, Cheshire SK10 4TF, England Lihua Zhao and Ian Laird NiTech Solutions Ltd, Scottish Enterprise Technology Park, Rankine AVenue, East Kilbride G75 0QF, Scotland Xiong-Wei Ni* School of Engineering and Physical Science, Heriot-Watt UniVersity, Edinburgh EH14 4AS, Scotland Abstract: In this paper, we report an investigation into the continuous crystallization of a model active pharmaceutical ingredient (API) using a continuous oscillatory baffled crystallizer (COBC). The results show that continuous crystallization offers significant advantages in terms of process, operation and costs, and delivers the isolation of the model API in just over 12 min compared to the 9 h and 40 min in a batch process. Introduction Solution crystallization is one of the most widely used separation processes in the chemical and pharmaceutical industries and it is well-known that the latter has traditionally operated in batch mode. 1 Whilst a batch process may appear superficially simple, the underlying science and its control are highly complex, which can lead to problems in achieving consistent product specifications, e.g. size distribution, correct polymorphic form and morphology. These factors have a direct impact on downstream processes such as filtration, and ulti- mately on formulation into medicines and their performance. Out-of-specification crystals are sometimes encountered, and therefore milling and recrystallization processes are other common unit operations in the pharmaceutical industry. Continuous reaction, workup and crystallization have been identified as key elements in improving manufacture in the chemical and pharmaceutical industries, through more efficient use of reagents, solvents, energy and space whilst minimising the production of waste materials and reactor downtime for reactor maintenance and cleaning. 2-7 Solution crystallization can generally be described in two stages: nucleation and crystal growth 8-10 and Figure 1 shows a schematic diagram describing the course of a typical solution cooling crystallization process. Basically, when a hot and under- saturated solution is cooled, it crosses the solubility curve, as shown in Figure 1, and becomes supersaturated. Between the supersolubility and solubility curves, there exists a metastable * Author for correspondence. Telephone: +44 131 451 3781. Fax: +44 131 451 3129. E-mail: [email protected]. † Process Engineering, Process R&D, AstraZeneca R&D. ‡ AstraZeneca Engineering. (1) Paul, E. L.; Tung, H.-H.; Midler, M. Organic Crystallization Processes. Powder Technol. 2005, 150, 133–143. (2) Pellek, A.; Arnum, P. V. Continuous Processing: Moving with or against the Manufacturing Flow. Pharm. Technol. 2008, 9 (32), 52– 58. (3) Swichtenberg, B. Moving Beyond the Batch. Pharm. Manuf. 2008, 7 (1), 24–26. (4) Vervaet, C.; Remon, J. P. Continuous Granulation in the Pharmaceuti- cal Industry. Chem. Eng. Sci. 2005, 60 (14), 3949–3957. (5) Gron, H.; Mougin, P.; Thomas, A.; White, G.; Wilkinson, D. Dynamic In-Process Examination of Particle Size and Crystallographic Form under Defined Conditions of Reactant Supersaturation as Associated with the Batch Crystallisation of Monosodium Glutamate from Aqueous Solution. Ind. Eng. Chem. Res. 2003, 42, 4888–4898. (6) Liu, D. H. F.; Lipta ´k, B. G.; Bouis, P. A. EnVironmental Engineers’ Handbook, 2nd ed.; Lewis Publishers, Inc.: Stamford, CA, U.S.A., 1997. (7) Crosby, T. Designing For the Future of Continuous Processing. Pharm. Process. 2006, 22,1. (8) Mullin, J. W. Crystallisation; Butterworth-Heinnemann: Woburn, MA, 1993. (9) Myerson, A. S. Handbook of Industrial Crystallisations; Butterworth- Heinemann: Boston, 2002. (10) Tung, H.-H.; Paul, E. L.; Midler, M.; McCauley, J. A. Crystallisation of Organic Compounds. An Industrial PerspectiVe; Wiley: New York, 2009. Figure 1. General schematic of a typical solution cooling crystallization process. Organic Process Research & Development 2009, 13, 1357–1363 10.1021/op900237x CCC: $40.75 2009 American Chemical Society Vol. 13, No. 6, 2009 / Organic Process Research & Development • 1357 Published on Web 10/27/2009
Transcript of Continuous Crystallization of Pharmaceuticals Using a ... · point, however, nucleation and crystal...
Continuous Crystallization of Pharmaceuticals Using a Continuous OscillatoryBaffled Crystallizer
Simon Lawton,† Gerry Steele,† and Phil Shering‡
Process Engineering, Process R&D, AstraZeneca R&D Charnwood, Bakewell Road, Loughborough LE11 5RH, England,AstraZeneca Engineering, Alderley Park, Macclesfield, Cheshire SK10 4TF, England
Lihua Zhao and Ian Laird
NiTech Solutions Ltd, Scottish Enterprise Technology Park, Rankine AVenue, East Kilbride G75 0QF, Scotland
Xiong-Wei Ni*
School of Engineering and Physical Science, Heriot-Watt UniVersity, Edinburgh EH14 4AS, Scotland
Abstract:
In this paper, we report an investigation into the continuouscrystallization of a model active pharmaceutical ingredient (API)using a continuous oscillatory baffled crystallizer (COBC). Theresults show that continuous crystallization offers significantadvantages in terms of process, operation and costs, and deliversthe isolation of the model API in just over 12 min compared tothe 9 h and 40 min in a batch process.
Introduction
Solution crystallization is one of the most widely usedseparation processes in the chemical and pharmaceuticalindustries and it is well-known that the latter has traditionallyoperated in batch mode.1 Whilst a batch process may appearsuperficially simple, the underlying science and its control arehighly complex, which can lead to problems in achievingconsistent product specifications, e.g. size distribution, correctpolymorphic form and morphology. These factors have a directimpact on downstream processes such as filtration, and ulti-mately on formulation into medicines and their performance.Out-of-specification crystals are sometimes encountered, andtherefore milling and recrystallization processes are othercommon unit operations in the pharmaceutical industry.
Continuous reaction, workup and crystallization have beenidentified as key elements in improving manufacture in thechemical and pharmaceutical industries, through more efficientuse of reagents, solvents, energy and space whilst minimisingthe production of waste materials and reactor downtime forreactor maintenance and cleaning.2-7
Solution crystallization can generally be described in twostages: nucleation and crystal growth8-10 and Figure 1 shows aschematic diagram describing the course of a typical solutioncooling crystallization process. Basically, when a hot and under-saturated solution is cooled, it crosses the solubility curve, asshown in Figure 1, and becomes supersaturated. Between thesupersolubility and solubility curves, there exists a metastable
* Author for correspondence. Telephone: +44 131 451 3781. Fax: +44 131451 3129. E-mail: [email protected].
† Process Engineering, Process R&D, AstraZeneca R&D.‡ AstraZeneca Engineering.
(1) Paul, E. L.; Tung, H.-H.; Midler, M. Organic Crystallization Processes.Powder Technol. 2005, 150, 133–143.
(2) Pellek, A.; Arnum, P. V. Continuous Processing: Moving with oragainst the Manufacturing Flow. Pharm. Technol. 2008, 9 (32), 52–58.
(3) Swichtenberg, B. Moving Beyond the Batch. Pharm. Manuf. 2008, 7(1), 24–26.
(4) Vervaet, C.; Remon, J. P. Continuous Granulation in the Pharmaceuti-cal Industry. Chem. Eng. Sci. 2005, 60 (14), 3949–3957.
(5) Gron, H.; Mougin, P.; Thomas, A.; White, G.; Wilkinson, D. DynamicIn-Process Examination of Particle Size and Crystallographic Formunder Defined Conditions of Reactant Supersaturation as Associatedwith the Batch Crystallisation of Monosodium Glutamate fromAqueous Solution. Ind. Eng. Chem. Res. 2003, 42, 4888–4898.
(6) Liu, D. H. F.; Liptak, B. G.; Bouis, P. A. EnVironmental Engineers’Handbook, 2nd ed.; Lewis Publishers, Inc.: Stamford, CA, U.S.A.,1997.
(7) Crosby, T. Designing For the Future of Continuous Processing. Pharm.Process. 2006, 22, 1.
(8) Mullin, J. W. Crystallisation; Butterworth-Heinnemann: Woburn, MA,1993.
(9) Myerson, A. S. Handbook of Industrial Crystallisations; Butterworth-Heinemann: Boston, 2002.
(10) Tung, H.-H.; Paul, E. L.; Midler, M.; McCauley, J. A. Crystallisationof Organic Compounds. An Industrial PerspectiVe; Wiley: New York,2009.
Figure 1. General schematic of a typical solution coolingcrystallization process.
Organic Process Research & Development 2009, 13, 1357–1363
10.1021/op900237x CCC: $40.75 2009 American Chemical Society Vol. 13, No. 6, 2009 / Organic Process Research & Development • 1357Published on Web 10/27/2009

zone, which provides a region of supersaturation (driving force)where spontaneous nucleation is unlikely to occur. At somepoint, however, nucleation and crystal growth take place, whilstthe concentration of the compound in the solution decreases(desupersaturation).
Whilst solubility of a compound in a solution can bedetermined experimentally, the supersolubility (Figure 1) or themetastable limit is not well-defined and depends for exampleon the rate of supersaturation generation (cooling rate), solutionhistory, impurities and fluid dynamics.11 Some of the parameterslisted above are scale dependent. This means that the super-solubility curve, and hence the metastable zone width (illustratedin Figure 1) will change when the reactor’s mixing/operation/process conditions vary and when scale up from laboratory toindustrial operation is involved. Therefore, on one hand, scaleup is necessary to increase production rate, and on the otherhand the science of solution crystallization makes it difficult toscale laboratory crystallizations into industrial scale batchoperations. An added complication is that our ability andunderstanding in scaling up a stirred tank crystallizer (STC),typically used in industrial crystallization, is limited as differentscale up criteria cannot be met simultaneously, leading to noagreement on a set of parameters to be kept constant in scaleup.
Table 1 lists methodologies that have all been used as thescale up parameter in STC. Consequently the process of scalingup STC is case specific. An overview of crystallization scaleup can be found elsewhere.24
From a fluid mechanics perspective, whilst good mixing canbe attained in laboratory reactors, mixing gradients are oftenfound in large scale operations, with better mixing achieved atand near the impeller regimes, and poorer mixing experiencedelsewhere.25-27 This leads to the situation that mixing cannotbe linearly scaled-up. In terms of crystallization process, mixinggradients will cause concentration gradients that have directimpact on crystallization process, e.g. supersaturation andmetastable zone width. In solution cooling crystallizationexcellent heat transfer is desirable; however, the specific areaper unit volume (m2/m3) for heat transfer decreases dramaticallywith scale. Therefore, the loss of heat transfer area together withnonuniform mixing on scale up of STCs makes cooling profiles(e.g., linear or parabolic) potentially problematic to implementin any industrial batch STC. Nonetheless open- and closed-loop control of batch crystallization processes have beenreported.28-30
In terms of monitoring and control, various in-line processanalytical technology (PAT) probes are routinely used inlaboratory crystallization experiments, e.g. optical turbidometricsfor the measurement of metastable zone width;31 Fouriertransform infrared spectroscopy (FTIR) and UV/vis forsupersaturation,32-34 and focused beam reflectance measurement(FBRM) for online chord length of crystals and crystal size
(11) Ulrich, J.; Strege, C. Some aspects of the importance of metastablezone width and nucleation in industrial crystallisers. J. Cryst. Growth2002, 237-239, 2130–2135.
(12) Nienow, A. W.; Edwards, M. F.; Harnby, N. Mixing in the ProcessIndustries, 2nd ed.; Butterworth-Heinemann: Woburn, MA, 1997.
(13) Couper, J. R.; Penney, W. R.; Fair, J. R. Chemical Process Equipment:Selection and Design; Elsevier: Amsterdam, Boston, 2004; pp 776-779.
(14) Nauman, E. B. Chemical Reactor Design, Optimization, and Scaleup;McGraw-Hill Professional: New York, 2002; pp 600-605.
(15) Smith, G. W.; Tavlarides, L. L.; Placek, J. Turbulent flow in stirredtanks: scale-up computations for vessel hydrodynamics. Chem. Eng.Commun. 1990, 93, 49–73.
(16) Kraume, M.; Zehner, P. Concept for scale-up of solids suspension instirred tanks. Can. J. Chem. Eng. 2002, 80 (4), 674–681.
(17) Thoenes, D. Chemical Reactor DeVelopment: From LaboratorySynthesis to Industrial Production; Kluwer Academic Publishers:Dordrecht, Boston, 1994; pp 347-354.
(18) Hoeks, F. W. J. M. M.; Boon, L. A.; Studer, F.; Wolff, M. O.; vander Schot, F.; Vrabel, P.; van der Lans, R. G. J. M.; Bujalski, W.;Manelius, A.; Blomsten, G.; Hjorth, S.; Prada, G.; Luyben, K. C. A. M.;Nienow, A. W. Scale up of stirring as foam disruption (SAFD) toindustrial scale. J. Ind. Microbiol. Biotechnol. 2003, 30 (2), 118–128.
(19) Shukla, V. B.; Parasu Veera, U.; Kulkarni, P. R.; Pandit, A. B. Scale-up of biotransformation process in stirred tank reactor using dualimpeller bioreactor. Biochem. Eng. J. 2001, 8 (1), 19–29.
(20) Whitton, M. J.; Nienow, A. W. Scale up correlations for gas holdupand mass transfer coefficients in stirred tank reactors. In Proceedingsof 3rd International Conference on Bioreactor and Bioprocess FluidDynamics; 3rd International Conference on Bioreactor and BioprocessFluid Dynamics, Cambridge, U.K., September 14-16, 1993, Nienow,A. W., Ed.; Mechanical Engineering Publications Ltd.: Cambridge,UK, 1993.
(21) Kim, J. K.; Kim, C. K.; Kawasaki, J. A Scale up of Stirred TankContactors for the Liquid Membrane Permeation of Hydrocarbons.Sep. Sci. Technol. 2001, 36 (16), 3585–3598.
(22) Evangelista, J. J.; Katz, S.; Shinnar, R. Scale-up criteria for stirredtank reactors. AIChE J. 2004, 15 (6), 843–853.
(23) Li, M.; White, G.; Wilkinson, D.; Roberts, K. J. Scale up study ofretreat curve impeller stirred tanks using LDA measurements and CFDsimulation. Chem. Eng. J. 2005, 108 (1-2), 81–90.
(24) Genck, W. J. Optimizing Crystallizer Scaleup. CEP Mag. 2003, 36–44.
(25) Rielly, C. D.; Marguis, A. J. A Particle’s Eye View of CrystallizerFluid Mechanics. Chem. Eng. Sci. 2001, 56, 2475–2493.
(26) Xie, L.; Rielly, C. D.; Eagles, W.; Ozcan-Taskin, G. Dispersion ofNano-Particle Clusters Using Mixed Flow and High Shear Impellersin Stirred Tanks. Chem. Eng. Res. Des. 2007, 85 (A5), 676–684.
(27) Xie, L.; Rielly, C. D.; Ozcan-Taskin, G. 1st International Conferenceon Industrial Processes for Nano and Micro Products, London, U.K.,April 3-4, 2007, Break-up of nano-particle agglomerates by hydro-dynamically limited processes; BHR Group: Cranfield, 2007; pp 79-91.
(28) Gron, H.; Borissova, A.; Roberts, K. J. In-Process ATR-FTIRSpectroscopy for Closed-Loop Supersaturation Control of a BatchCrystallizer Producing Monosodium Glutamate Crystals of DefinedSize. Ind. Eng. Chem. Res. 2003, 42, 198–206.
(29) Nagy, Z. K.; Braatz, R. D. Open-Loop and Closed-Loop RobustOptimal Control of Batch Processes Using Distributional and Worst-Case Analysis. J. Process Control 2004, 14, 411–422.
(30) Liotta, V.; Sabesan, V. Monitoring and Feedback Control of Super-saturation Using ATR-FTIR to Produce an Active PharmaceuticalIngredient of a Desired Crystal Size. Org. Process Res. DeV. 2004, 8,488–494.
(31) Hennessy, A.; Neville, A.; Roberts, K. J. In-Situ SAXS/WAXS andTurbidity Studies of the Structure and Composition of Multihomolo-gous n-Alkane Waxes Crystallised in the Absence and Presence ofFlow Improving Additive Species. Cryst. Growth Des. 2004, 4, 1069–1078.
(32) Borissova, A.; Dashova, Z.; Lai, X.; Roberts, K. J. Examination ofthe semi-batch crystallisation of benzophenone from saturated methanolsolution via aqueous anti-solvent drowning-out as monitored in-processusing ATR FTIR spectroscopy. Cryst. Growth Des. 2004, 4, 1053–1060.
Table 1. Scale up rules for mixing in STC
scale up constant reference
tip impellor velocity 12rotational speed of impellor 13, 14stirred tank Reynolds number 15power input 14, 16ratio of impellor to vessel diameters 17volume-averaged shear rate 18mass transfer coefficient 19, 20mean droplet size 21mixing time 22computational dynamic simulation 23
1358 • Vol. 13, No. 6, 2009 / Organic Process Research & Development

distribution.35,36 However, it is still rare to find these probes inindustrial-scale operation.
Oscillatory Baffled CrystallizerIdeally, a plug flow crystallizer is more desirable, since it
can ensure consistent fluid mechanical conditions and superiorheat transfer rates. In theory this should lead to a highly reliableenvironment for the formation of crystals with consistentproperties and should allow conditions developed in laboratoriesto be directly applied to industrial crystallizations. In additionto these advantages, high tonnage products (in pharmaceuticalterms >300tonnes/pa) can be achieved in continuous operationrather than a multibatch system, the typical of current operationof the industry.
There are two conventional methods of achieving plug flow:(a) to use a series of continuous stirred tank reactors (CSTR)and (b) to employ a tubular reactor operating under turbulentflow conditions. The first method consists of connecting anumber of well-stirred tanks of equal volume in series. In theory,when the number of CSTRs becomes infinite, plug flow isachieved. In practice, however, ∼5-10 CSTRs are the normof most industries. Obviously this arrangement significantlyincreases inventory in reactors with multiples of controllers,pressure sensors, probes, pumps, flow meters, etc., leading tosignificantly higher capital and running costs. In terms of thefluid mechanical conditions such an arrangement is still far fromplug flow. The pumping solutions in and out of CSTRs mayalso have serious repercussions on the crystallization products,e.g. by altering the cooling profile and in some cases damagingfragile crystals though attrition.
The second method is to employ a tubular reactor that isoperated at turbulent flow, i.e. very high flow rates. When theturbulent flow is reached, near plug flow conditions can beobtained. However, as the mixing in such tubular reactors isdriven by the net flow, this means that a very long tube lengthis required even to accommodate a residence time of just 15min. Hence, such an operation is practically impossible. As aconsequence of this condition, to date, batch STRs have beenpredominant for industrial crystallization of pharmaceuticals andfine chemicals.
The continuous oscillatory baffled crystallizer (COBC) is atubular crystallizer containing periodically spaced orifice baffleswith oscillatory motion superimposed on the net flow.37 Themixing in a COBC is provided by the generation and cessationof eddies when flow interacts with baffles, and is thus decoupled
from net flow driven turbulence. With the repeating cycles ofvortices, strong radial motions are created, giving uniformmixing in each interbaffle zone and cumulatively plug flowconditions along the length of the column at flows that wouldotherwise result in laminar flow regimes. The fluid mechanicalconditions in a COBC are governed by two dimensionlessgroups, namely, the oscillatory Reynolds number (Reo) and theStrouhal number (St), defined as by eqs 1 and 2, respectively
where D is the column diameter (m), F the fluid density (kgm-3), µ the fluid viscosity (kg m-1s-1), xo the oscillationamplitude (m) and f the oscillation frequency (Hz). Theoscillatory Reynolds number describes the intensity of mixingapplied to the column, while the Strouhal number is the ratioof column diameter to stroke length, measuring the effectiveeddy propagation.38
The motivation of this work was therefore to evaluate thetechnological and operational merits of continuous crystalliza-tion compared to a pharmaceutical batch operation. In particular,the delivery of consistent crystal quality in COBC, such as
• morphology• size• size distribution that cannot easily be achieved consis-
tently in large batch operations• the investigation of additional manufacturing advantages
(at development and pilot scale) using COBC,
O mproved filterabilityO reduced crystallization timeO reduced space usageO reduced utility and energy consumptionO provided seeding along the flow path if required.
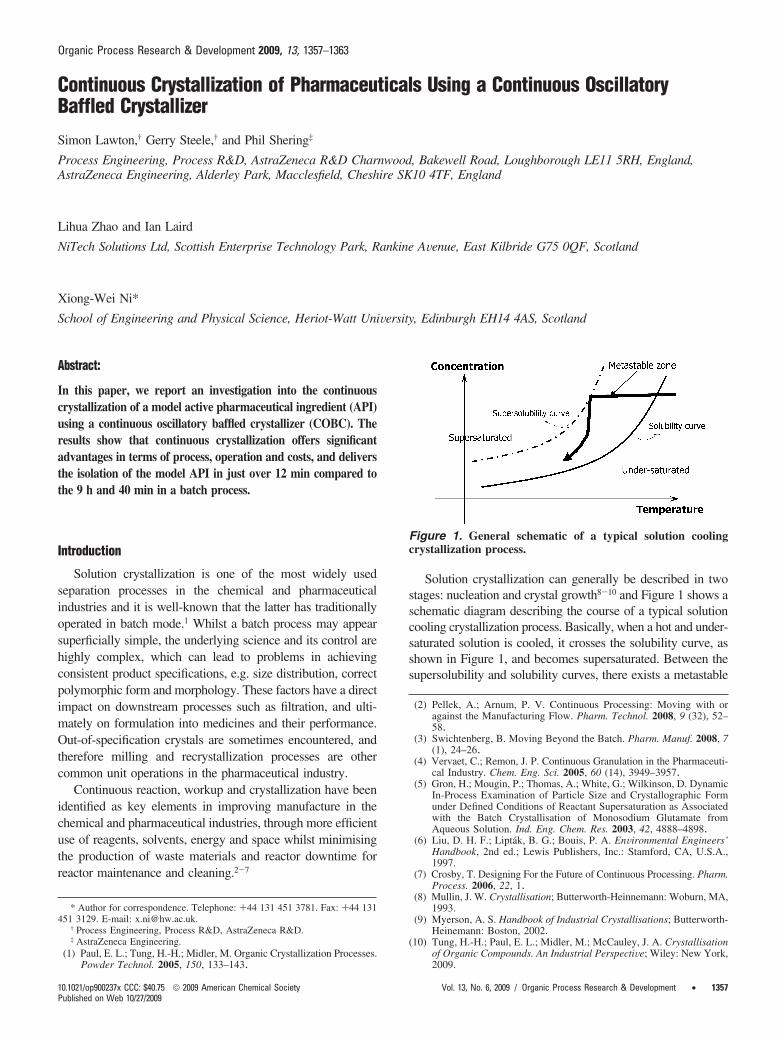
Materials and MethodsThe Oscillatory Baffled Crystallizer. Figure 2 shows a
photograph and a schematic of the COBC. The COBC wasconstructed from 25 m long DN25 jacketed glass tubes with aworking volume of about 12 L. Baffles were made of PVDFplates and placed periodically along the length of the COBCincluding bends. The insulation materials were wrapped aroundthe tubes in order to minimise heat loss to the surroundings.The fluid oscillation was achieved using a linear motor and acontrol box: oscillation frequencies of 1-4 Hz and centre-to-peak oscillation amplitudes of 10-40 mm can be selected,covering the oscillatory Reynolds number from 2300-6150 andStrouhal number of 0.05-0.13. A temperature control unit wasdesigned and used to deliver a cooling rate from 0.25 to 15°C/min for the process.
The API used in this study was provided by AstraZeneca,which for commercial reasons we are unable to name. The
(33) Yu, Z.; Chow, P. S.; Tan, R. B. H. Application of Attenuated TotalReflectance-Fourier Transform Infrared (ATR-FTIR) Technique in theMonitoring and Control of Anti-Solvent Crystallization. Ind. Eng.Chem. Res. 2006, 45 (1), 438–444.
(34) Deneau, E.; Steele, G. An In-Line Study of Oiling Out and Crystal-lization. Org. Process Res. DeV. 2005, 9, 943–950.
(35) Rousseau, R. W.; Barthe, S. Using FBRM Measurements, FinesDestruction and Varying Cooling Rates to Control Paracetamol CSDin a Batch Cooling Crystallizer. Annual Meeting of AIChE, Cincinnati,OH, U.S.A., 2005.
(36) Chew, J. W.; Chow, P. S.; Tan, R. B. H. Automated in-Line TechniqueUsing FBRM to Achieve Consistent Product Quality in CoolingCrystallization. Cryst. Growth Des. 2007, 7 (8), 1416–1422.
(37) Caldeira, R. L. F.; Ni, X. Evaluation and Establishment of a CleaningProtocol for the Production of Vanisal Sodium and Aspirin using aContinuous Oscillatory Baffled Reactor. Org. Process Res. DeV. 2009,DOI: 10.1021/op900120h.
(38) Ni, X.; Gough, P. On the Discussion of the Dimensionless GroupsGoverning Oscillatory Flow in a Baffled Tube. Chem. Eng. Sci. 1997,52, 3209–3212.
Reo )2πfxoFD
µ(1)
St ) D4πxo
(2)
Vol. 13, No. 6, 2009 / Organic Process Research & Development • 1359
current batch procedure used to manufacture this compound isas follows: the crude API was dissolved in a solvent and heldafter dissolution at reflux. After particulate screening, thecrystallizer contents were cooled at approximately 10 °C/h underagitation to 20 °C. After a holding period, the contents werecooled to 10 °C under reduced agitation, and held for somefurther time. The total cycle time of the crystallization processis 9 h and 40 min after which the crystals are filtered, washedwith solvent, and dried at 60 °C. The dried crystals are thenmilled to obtain desired size of the final product. The concentra-tion in the batch process was approximately 6% w/w.
Analytics. All of the crystals from the trials were analysedto ensure that they met the API specifications. Base strengthwas determined by nonaqueous titration using a Metrohm 785DMP Titrano (Metrohm UK Ltd., Buckingham, UK). Crystalchord length size distributions were measured using a Lasentecfocussed beam reflectance measurement (FBRM) probe (MettlerToledo, Leicester, UK) both in-line and off-line. Opticalmicroscopic images were recorded using the Motic DigitalMicroscope DMNB1-233 model with Motic Images Plus 2.0software. Scanning electron microscopic (SEM) images werecollected using a Quanta 200 environmental scanning electronmicroscope (ESEM) (FEI Co. Ltd., Cambridge, UK) and X-raypowder diffraction (XRPD) analysis on the crystals wasperformed using a Riguku Miniflex (Rigaku Instruments).Filtration studies were performed using a 1 L glass pocket filter(QVF Process Systems Ltd., UK) with a 50 mm diametersintered Hastelloy filter plate (20 µm). Filtration was monitoredusing a digital balance (Sartorius QC35EDE-s, Sartorius, UK)connected to a PC running labworldsoft (IKA, Germany) tocollect the weight/time data. Data was collected at three differentpressures to assess the dependence of cake resistance uponapplied pressure and, hence, compressibility. Data was then
processed offline using Microsoft Excel to determine specificcake resistance and medium resistance.
Results and DiscussionBatch Tests. Screening Tests. Prior to the continuous
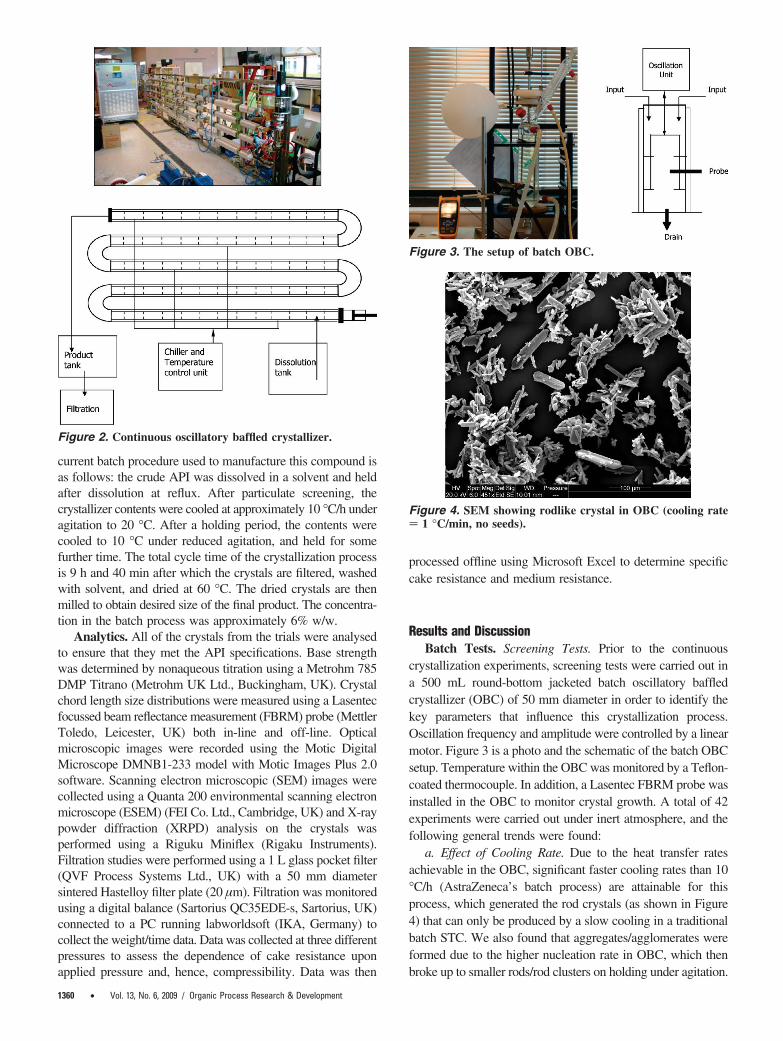
crystallization experiments, screening tests were carried out ina 500 mL round-bottom jacketed batch oscillatory baffledcrystallizer (OBC) of 50 mm diameter in order to identify thekey parameters that influence this crystallization process.Oscillation frequency and amplitude were controlled by a linearmotor. Figure 3 is a photo and the schematic of the batch OBCsetup. Temperature within the OBC was monitored by a Teflon-coated thermocouple. In addition, a Lasentec FBRM probe wasinstalled in the OBC to monitor crystal growth. A total of 42experiments were carried out under inert atmosphere, and thefollowing general trends were found:
a. Effect of Cooling Rate. Due to the heat transfer ratesachievable in the OBC, significant faster cooling rates than 10°C/h (AstraZeneca’s batch process) are attainable for thisprocess, which generated the rod crystals (as shown in Figure4) that can only be produced by a slow cooling in a traditionalbatch STC. We also found that aggregates/agglomerates wereformed due to the higher nucleation rate in OBC, which thenbroke up to smaller rods/rod clusters on holding under agitation.
Figure 2. Continuous oscillatory baffled crystallizer.
Figure 3. The setup of batch OBC.
Figure 4. SEM showing rodlike crystal in OBC (cooling rate) 1 °C/min, no seeds).
1360 • Vol. 13, No. 6, 2009 / Organic Process Research & Development

Agglomeration, as defined by Brunsteiner et al.,39 is theintergrowth of aggregates formed by particle collisions, througha cementation process that forms an agglomerative bond. Theagglomerates were easy to break down.40 As shown by the workof Alander et al.,41 supersaturation, particle concentration,hydrodynamics and the solvent all affect agglomeration pro-cesses. The agglomerates that form under these conditions inOBC are soft in nature. Platelike morphology was generatedas shown in Figure 5 above with a very fast cooling rate (crashcooling, dT/dt g 5 °C/min).
b. Effect of Oscillation Intensity. For mass transfer controlledsolution crystallization, one of the mechanisms of transportingthe solution to crystal surfaces and then taking part in surfacecrystallization process is by turbulent mixing.42 Consequently,the state of mixing in a given crystallizer is an important factorin controlling the uniformity of crystal sizes as well as servingto keep crystals in suspension throughout the process and insome cases preventing segregation of supersaturated solutionfrom causing excessive nucleation.43 Our results show that, bycontrolling the experimental conditions, different types ofcrystals were achieved in the OBC under different experimentalconditions as shown in Figure 6, with stronger oscillation givingsmaller particle sizes, e.g. the higher the oscillation amplitudeor frequency, the smaller the crystal sizes. Note that the verticalaxis of Figure 6 is the percentage (0-5.5%) of crystals in eachchannel of a given size range. Importantly narrow size distribu-tions were maintained (see Figure 6) for all conditions. Thisindicates that uniform crystal sizes were produced in the OBCfor different mean sizes of crystals. The result is unique forOBC, and generated by the uniform mixing environment withinthe crystallizer.
c. Effect of Concentration. In the AstraZeneca’s batchprocess, a ∼6% w/w concentration of the compound was used
for crystallization. It was found that the rod morphology couldbe generated at higher concentrations with relatively fast coolingrates in the OBC. This is advantageous as this leads to asignificant saving on solvent usage. It was also noted that thesolution concentration affects crystal sizes, i.e. higher concentra-tions afforded smaller crystal sizes and vice versa. As an aside,it is possible to elevate the boiling point of the solution by usingback-pressure in the flow system, thereby permitting higherconcentrations to be used, thus exploiting the power-lawbehavior of solubility with temperature.
d. Effect of Holding Time. From the Lasentec data, it seemsthat holding time had no significant effect on crystal sizedistribution at either the nucleation temperature or the endtemperature. This observation is again beneficial, since thistranslates to a substantial reduction in process time.
e. Effect of Seeding. Seeding increased the mean particlesize. In one experiment, it was found that large rod crystals, asshown in Figure 4, could be generated with crash cooling when5% w/w seed was added. This finding lends this crystallizationprocess to the adaptation of continuous operation.
All the products obtained were titrated for the measurementof base strength, and were shown to have purities close to thatof the seeds material. The XRPD analysis (data not shown)also confirmed that the desired polymorphic form was obtainedin all the cases.
Continuous Mode Trials. On the basis of the batch data, aCOBC was designed and built, and a series of continuouscrystallization trials were performed in order to validate thebatch results. Two 25 L batch OBCs were used to dissolve thecrude starting material and feed it to the COBC using twoperistaltic pumps to ensure that the residence time at reflux wasless than 40 min to avoid any decomposition. Similar to thebatch tests, base strength was analyzed for each run. Crystalsize distribution was monitored using a Lasentec probe off-line for samples taken at different temperatures, and opticalmicroscope images were taken at different temperatures in orderto follow the crystal growth. Table 2 shows that uniform crystalsize can be manipulated by controlling cooling rate, mixing,and concentration in the OBC.
Figure 7 shows an additional filtration study conducted atvarying pressures in order to mimic plant performance and thefiltration results. Specific cake resistance (a scale up parameterused to assess filtration performance) on the vertical axis isplotted against filtration pressure. Figure 7 also shows that somebatches of material (TE-04C and -05C) exhibited incompressiblebehaviour, indicated by an asymptotic increase in cake resis-tances with applied pressure once initial consolidation had beenovercome, whilst other batches (TE-01C and -02C) werecompressible. This behaviour is related to the degree ofagglomeration, and hence the applied cooling rate for thecrystallization phase, with the more agglomerated material fromthe faster cool being more compressible. It should be noted thateven though some of the material was seen to be compressible,the specific cake resistances observed were all significantlylower than those seen in many pharmaceutical developmentcompounds, being ∼106 m/kg compared to a typical values of107-109 m/kg.
(39) Brunsteiner, M.; Jones, A. G.; Pratola, F.; Price, S. L.; Simons, S. J. R.Toward a Molecular Understanding of Crystal Agglomeration. Cryst.Growth Des. 2005, 5 (1), 3–16.
(40) Nichols, G.; Bryard, S.; Bloxham, M. J.; Botterill, J.; Dawson, N. J.;Dennis, A.; Diart, V.; North, N. C.; Sherwood, J. D. A Review of theTerms Agglomerate and Aggregate with a Recommendation forNomenclature used Powder and Particle Characterization. J. Pharm.Sci. 2002, 91, 2103–2109.
(41) Alander, E. M.; Uusi-Penttilae, M. S.; Rasmuson, A. C. Agglomerationof Paracetamol during Crystallization in Pure and Mixed Solvents.Ind. Eng. Chem. Res. 2004, 43 (2), 629–637.
(42) Klug, D. L. Handbook of Industrial Crystallisation; Butterworths: NewYork, 1993.
(43) Weissbuch, I.; Leiserowitz, L.; Lahav, M. Crystallisation TechnologyHandbook; Marcel Dekker: New York, 1995.
Figure 5. SEM of crystals obtained in OBC. (a) Flakelikemorphology. (b) Platelike crystals (crash cool at 3 °C/min withno seeds) (crash cool at 5 °C/min with 5% seeds).
Vol. 13, No. 6, 2009 / Organic Process Research & Development • 1361

With COBC a model API was isolated in just over 12 mincompared to the 9 h and 40 min in a batch process. Therefore,it would be feasible to replace two 6.3 m3 dissolution vesselsand four 6.3 m3 crystallizers by two skid-mounted COBCs inan overall continuous process that could deliver acceptablematerial in a much faster time.
Comparing Investment and Operating Costs. Compari-sons can be made of both estimated capital costs and operatingcosts for a continuous isolation process exploiting COBC asopposed to a traditional batch isolation process.
For the model substance, flow sheets were developed for abatch process and also for an equivalent overall continuouspurification and isolation process incorporating continuous
dissolution and crystallization. Two dissolution vessels and fourcrystallizers on the batch process flow sheet were replaced bytwo COBC units, one for dissolution and one for crystallization,and appropriate materials charging, filtration, and drying equip-ment selected for the different scenarios. Where possible, similar
Figure 6. SEM of crystals and the corresponding crystal chord size distributions under three experimental conditions. (a) 1 °C/minwith 3 baffles; (b) 1 °C/min with two baffles; (c) 0.25 °C/min with two baffles (4 Hz and 40 mm), (4 Hz and 40 mm), (4 Hz and 20mm).
Table 2. Continuous crystallization trials design
target cooling agitation concentration seeding
small fast high high nonelarge rods slow low standard nonelarge
agglomeratesfast low standard none
mid size 1 °C/min standard high nonesmall fast high high 10% w/w @70 °C
Figure 7. Filtration performance for the experimental runs(TE-01C and -02C: cooling rate ) 5 °C/min; TE-04C and -05C:cooling rate ) 1 °C/min).
1362 • Vol. 13, No. 6, 2009 / Organic Process Research & Development

equipment was considered in both flow sheets, in order to ensurethat differences due to the COBC elements in the design wereemphasized.
a. A New Build. Approximate capital costs for a newinstallation were estimated using factorial methods based onknown capital equipment costs for major plant items, e.g. batchvessels, service requirements, significant ancillary equipment,and quoted equipment costs for COBC equipment.
This comparison for the purification and isolation steps onlyindicated that the capital costs for a new installation could beapprox 20% lower for the continuous option than a typical $3-5million batch process.
b. Infrastructure Consideration. The capital cost estimatingtechnique did not take into account other factors that wouldimpact favorably on the continuous option such as reduced assetfootprint, reduced complexity, and overall reduced number ofplant items. Some of these factors were, however, reflected inestimated operating costs for the two options. On the basis ofthe flow sheets, it was estimated that the operating team forthe continuous installation could be about half the size as thatrequired to run the batch operation. On the basis of the scaleand complexity of the batch plant this potential saving wasconsidered to be in excess of £300k per annum. Reduced energycosts and increased opportunities for heat recovery couldpotentially further enable a lower cost of goods to be achieved,although this was not quantified.
Other benefits quantified included operating the processunder slightly elevated pressure and temperatures, facilitatedby the equipment configuration and the reduced inventory ofthe continuous system. At scale, a predicted 10% solventconsumption reduction would result in £400k per annumsavings.
c. Crystal Engineering without Milling. A further costevaluation was carried out, considering the scenario where thecontinuous process exploiting COBC could be controlled toengineer the crystals, efficiently delivering a reproducible, rightsize and shape material, suitable for downstream processing andformulation without the need for milling. Whilst this capabilitywas not tested during the trials, observations during the trialsindicated potential opportunities in this area.
Avoiding the need for a milling processing plant usingCOBC, as opposed to the overall batch processing includingmilling, represented an estimated 50% reduction in capital costs,and further avoidance of >£300k per annum costs in personnel,milling losses and other inefficiencies. Table 3 below sum-marizes the comparison.
The biggest perceived benefits, however, were estimated tobe in areas of lean production. It was anticipated that the
continuous option would allow production to increase/decreaseoutput easily, with a fast response. Production could be linkedto a demand-driven lean supply chain, presenting differentoptions in operating modes, e.g. start/stop vs rate turndown. Itwas also anticipated that for a new facility a lower investmentcould be required for a unit with greater flexibility in terms ofincreasing capacity. The continuous option was estimated tohave a wider capacity range for a given equipment configuration.
In summary, for a new installation, significant reductions inboth capital outlay and operating costs were identified for thecontinuous option exploiting COBC as compared to the batchequivalent.
ConclusionsThe results from both batch and continuous experiments
using commercial drug substance demonstrated that the con-tinuous crystallization using COBC overcomes the problemsfacing traditional batch operations, due to the unique featuresof the increased specific area per volume for heat transfertogether with the plug flow conditions in the COBC. The scaleup of COBC is linear and involves very small changes indiameter of the tubular crystallization, which ensures that thegoverning science of solution crystallization remains the samein the scale up, a very important factor that cannot be achievedin the scaling up of batch STC. The combination of these aspectsin COBC offers more controls over crystallization process anddelivers the isolation of the model API in just over 12 mincompared to the 9 h and 40 min in current batch process.
NomenclatureD ) column diameter (m)f ) oscillation frequency (Hz)Reo ) the oscillatory Reynolds numberSt ) the Strouhal numberxo ) oscillation amplitude (m)µ ) fluid viscosity (kg m-1 s-1)F ) fluid density (kg m-3)
Received for review September 8, 2009.
OP900237X
Table 3. Summary of comparison
potential saving (£) fromtraditional batch operation
new build 20% loweroperating costs 300k per annumcrystal engineering without milling 50% lower + >300k per annum
Vol. 13, No. 6, 2009 / Organic Process Research & Development • 1363