Sec 2.5: CONTINUITY. Study continuity at x = 4 Sec 2.5: CONTINUITY Study continuity at x = 2.
Continuity and Change in Long-Lasting State Performance Funding Systems for Higher Education:
The Cases of Tennessee and Florida
Kevin J. Dougherty Rebecca S. Natow
February 2010
CCRC Working Paper No. 18 Address correspondence to: Kevin J. Dougherty Associate Professor of Higher Education and Senior Research Associate, Community College Research Center Teachers College, Columbia University 525 West 120th Street, Box 101 New York, NY 10027 212-678-8107 Email: [email protected] We thank Lumina Foundation for Education for its financial support of this research. The views expressed here are solely the authors’. We thank Brenda Albright, Grady Bogue, Michael McLendon, and Patricia Windham for comments on this paper; and Wendy Schwartz for ably editing it. Needless to say, all remaining errors are our own.
Abstract
One of the key ways that state governments pursue better higher education performance
is through performance funding. It ties state funding directly to specific indicators of
institutional performance, such as rates of graduation and job placement.
This report considers the ways that performance funding systems in states with long-
lasting systems have changed over time and what political and social conditions explain the
changes. We analyze the experiences of two states: Tennessee, which pioneered performance
funding in 1979; and Florida, which launched it in 1994.
Funding for Tennessee’s system has steadily increased over the years, whereas Florida’s
funding history has been more volatile and now provides much fewer dollars than when it was at
its peak. Both Tennessee and Florida have changed their performance indicators substantially.
But Florida added nine and dropped two in 12 years, while Tennessee added only six and
dropped four over 31 years. Moreover, in Tennessee, performance indicators are added at the end
of a regular five-year review, whereas in Florida they have been added irregularly, with no tie to
a cyclical process of program reappraisal.
Overall, Tennessee’s performance funding system has been considerably more stable
than Florida’s because its initial policy design delineated much more clearly how the system was
to be governed and changed over time, and provided for regular and systematic evaluation.
Moreover, Tennessee’s state legislature has played a smaller role in the ongoing development of
performance funding than Florida’s.
These differences in policy process carry important implications. A system where
funding levels do not oscillate greatly and indicators change more gradually and systematically is
more likely to allow institutions to plan effectively. Further, such a system will have a more
secure base of consent from institutions if it comes under attack.
Table of Contents
Introduction and Background ......................................................................................................... 1 Change and Stability in Performance Funding ......................................................................... 1 Research Questions................................................................................................................... 2
Theoretical Perspectives ................................................................................................................. 4 Implementation Theory............................................................................................................. 4 Program and Policy Sustainability Theory ............................................................................... 4
Research Methods........................................................................................................................... 6 Changes in Funding ........................................................................................................................ 8
Tennessee.................................................................................................................................. 8 Florida ..................................................................................................................................... 10
Changes in Performance Funding Indicators................................................................................ 14 Performance Indicators Added and Dropped.......................................................................... 14 Sources of Changes in Indicators............................................................................................ 17 State Differences in the Process of Changing Indicators........................................................ 23
Summary and Conclusions ........................................................................................................... 26 References..................................................................................................................................... 27

1
Introduction and Background
Increasingly, state governments are relying on higher education to be an engine of
economic development. But despite their awareness of the importance of a thriving higher
education system, states are finding it hard to adequately finance higher education in the face of
a declining economy and rising demands for funding for K-12 schooling, Medicaid, and the
prison system (Callan, 2002; Kane, Orszag, & Gunter, 2003; Zumeta, 2009). Hence, over the
past three decades state policy-makers have been seeking a way to secure better performance
from colleges and universities while keeping down the state’s higher education appropriations.
One of the key ways that state governments pursue better performance is through
performance funding for higher education. This strategy ties state funding directly to specific
indicators, such as rates of graduation and job placement. Typically, from 1 percent to as much
as 7 percent of state appropriations to public institutions are allocated on the basis of how well
institutions perform compared with specified benchmarks, their own past performance, or the
performance of other institutions (Albright, 1998; Burke, 2002, 2005; Dougherty & Hong, 2006;
Ewell & Jones, 2006; Gaither, Nedwek, & Neal, 1994; Layzell, 1999; McLendon, Hearn, &
Deaton, 2006; Ruppert, 1994; Shulock, 2003; Shulock & Moore, 2002, 2005; Zumeta, 2001). A
key rationale for performance funding is that it induces colleges and universities to be more
efficient, delivering “more bang for the buck” in a time of rising demands on higher education
but also increasingly strained state finances.1
Change and Stability in Performance Funding
It is tempting to regard policies and programs as set and meriting little further attention
once they are enacted or founded. However, as research on policy implementation and policy
1 The efficiency rationale came to the fore in the 1990s and was voiced less in earlier years. And even in the 1990s, other rationales were also present. States have also viewed performance funding as a way to clearly indicate to institutions what their priorities are. Meanwhile, for institutions, an important rationale for performance funding has been as a source of new funds as traditional enrollment-based funding has stagnated (Dougherty & Hong, 2006; Dougherty & Natow, 2008; Zumeta, 2001).
2
sustainability shows, policies and programs can change greatly over time as they adjust to
changing environmental circumstances and patterns of support (Daniels, 2001; Honig, 2006;
Matland, 1995; Scheirer, 2005). In fact, in the states that have used a performance funding
system over a long period of time, there have been considerable changes in the amount of dollars
devoted to performance funding and in the indicators used to allocate that funding.
Stability and change with respect to performance funding levels and indicators are
important to consider for reasons both of theory and practice. Theoretically, changes in funding
and indicators are a continuation of the politics of public policy-making. The operation of
political forces is not exhausted by the passage of legislation; those forces continue to shape
policy as it is being implemented. Hence, an analysis of the implementation process is integral to
the full analysis of the politics of public policy making (Anderson, 2006; Honig, 2006; Matland,
1995; McLaughlin, 1987, 2006; Sabatier and Jenkins-Smith, 1999).
Practically, stability and change in performance funding levels and indicators may be a
source of either ineffective performance or of program adaptation and survival. If changes are
too frequent and large, performance funding systems may not work very effectively. A survey in
the late 1990s of community college and four-year college officials in five states with
performance funding found that 40.1 percent rated budget instability as an extensive or very
extensive problem of performance funding in their state (Burke, 2002, p. 77; Burke &
Associates, 2000). When budgets and indicators are unstable, higher education leaders find it
hard to decide where to focus the efforts of their institutions. Conversely, if their funding levels
and performance indicators change in a regular and systematic way, performance funding
systems may be better able to adapt to changing circumstances, retain supporters, and survive.
Research Questions
We considered two research questions for the purpose of evaluating change in
performance funding systems. First, in what ways have long-lasting systems changed over time
in funding levels, indicators used to allocate funds, and measures used for those indicators?
Second, what political actors, actions, and socio-political conditions explain those changes?
Our analysis of initial variations and changes over time in state performance funding
systems is based on an investigation of the experience of two states with long-lasting

3
performance funding systems: Tennessee, which pioneered performance funding in 1979; and
Florida, which launched it in 1994.

4
Theoretical Perspectives
In order to understand the nature of, and reasons for, changes in higher education
performance funding, we draw on two bodies of research and theory: implementation theory and
program sustainability theory.
Implementation Theory
Policy implementation theory is useful in highlighting the fact that the politics of policy
do not end with enactment but continue thereafter. This reality has been particularly highlighted
by second- and third-generation theories in policy implementation, which pay as much attention
to the perspectives of those applying policy as to those designing it. Such later-generation
perspectives highlight the reactions of lower level policy implementers, and focus on an
examination of how the implementers’ interests, beliefs, knowledge schema, and experiences
shape their views of a policy and thus their willingness to support it and in what form (Elmore,
1979-80; Honig, 2006; Matland, 1995; McLaughlin, 1987, 2006; Spillane, Reiser, & Gomez,
2006). This “bottom-up” perspective is particularly useful in situations of “high ambiguity” of
policy ends or means, as is typical of educational policy-making (Matland, 1995, pp. 160, 165-
170). The implementation of performance funding is a good candidate for a bottom-up
perspective. Even if there were agreement on the policy goals, and even on the specific
performance indicators, there is great ambiguity about how tying funding to those indicators
should and does shape institutional practice.
Program and Policy Sustainability Theory
Public health and social welfare researchers have produced an extensive literature on
program and policy sustainability that can usefully add to our understanding of changes in
performance funding policies. Following the work of Shediac-Rizkallah and Bone (1998), the
sustainability literature identifies the following categories of factors that influence program
5
sustainability: program design and implementation, the organizational setting affecting
implementation, and the wider community environment (Savaya, Spiro, & Elran-Barak, 2008;
Scheirer, 2005; Shediac-Rizkallah, & Bone, 1998).2
In terms of program design, programs are more likely to persist if they have clearly
delineated designs, conformity with their institutional environments, seek feedback from
program constituents, and have provisions for both personnel training and policy evaluation
(Mancini & Marek, 2004; Racine, 2006; Savaya et al., 2008; Scheirer, 2005; Shediac-Rizkallah
& Bone, 1998). Clear delineation requires the unambiguous identification of a program’s “target
population,” requirements to be met, anticipated outcomes, and “interventions” to be used
(Savaya et al., 2008, p. 479). Conformity to the institutional environment means that policies and
practices take on conventional organizational forms. Allowing for feedback from program
constituents entails having a “negotiating process” between funders and implementing
organizations that is “mutually respectful” (Shediac-Rizkallah & Bone, 1998, p. 98).
With respect to aspects of the organizational setting, sustainability theory points to the
important role of the existence of a “champion” of the program, the “fit” of a program within an
organization’s culture, and “organizational capacity” for implementing the program (Scheirer,
2005, p. 339; see also Mancini & Marek, 2004; Pluye, Potvin, & Denis, 2004; Racine, 2006;
Savaya et al., 2008; Scheirer, 2005; Shediac-Rizkallah & Bone, 1998).The literature also
describes community characteristics that are key to program sustainability, especially
“community support” and available assets inside the community to meet the resource
requirements of the program (Savaya et al., 2008, p. 481; see also Mancini & Marek, 2004;
Racine, 2006; Savaya et al., 2008; Scheirer, 2005; Shediac-Rizkallah & Bone, 1998).
We will draw particularly on the points made about the importance of program design.
2 A variety of definitions of “sustainability” are used in this literature, but the focus is on program continuation and the maintenance of effectiveness. Program continuation does not require the survival of an entire program but can also involve the survival of its major elements (Scheirer, 2005: 324, 332-333, 336).
6
Research Methods
Our investigation focuses on analyzing the experience with performance funding of two
states that have had it for many years but whose systems vary greatly in their design and origin.
Tennessee, which pioneered the development of performance funding for higher education in
1978-1979, has a system that applies to both two-year and four-year colleges and universities. It
owes its origins primarily to the initiative of the Tennessee Higher Education Commission
(Banta, Rudolph, Van Dyke, & Fisher, 1996; Bogue, 2002; Bogue & Brown, 1982; Ewell, &
Jones, 2006).
Florida enacted performance funding in 1994. Its system has had two incarnations:
Performance Based Budgeting (PBB), which has operated since 1996, and the Workforce
Development Education Fund (WDEF), which operated between 1997 and 2002 (Wright, Dallet,
& Copa, 2002). Because the WDEF no longer exists, we focus here on the Performance Based
Budgeting system, which applies only to community colleges. PBB owed its origins primarily to
the efforts on the one hand of legislators who championed greater government efficiency and on
the other hand of the State Board for Community Colleges and a group of activist community
college presidents who sought more funds and greater legitimacy for community colleges
(Dougherty & Natow, 2008; Natow & Dougherty, 2008).
For both states, we analyzed publications issued by state agencies as well as by
researchers who have analyzed performance funding in each state. We also interviewed many
state policy actors, including top executive branch officials and staff, state legislators and staff,
officials of state higher education boards, presidents and other top officials of several colleges,
and state business leaders. We have conducted 17 interviews in Tennessee and 27 in Florida. For
purposes of confidentiality, statements by our research subjects are not directly attributed to
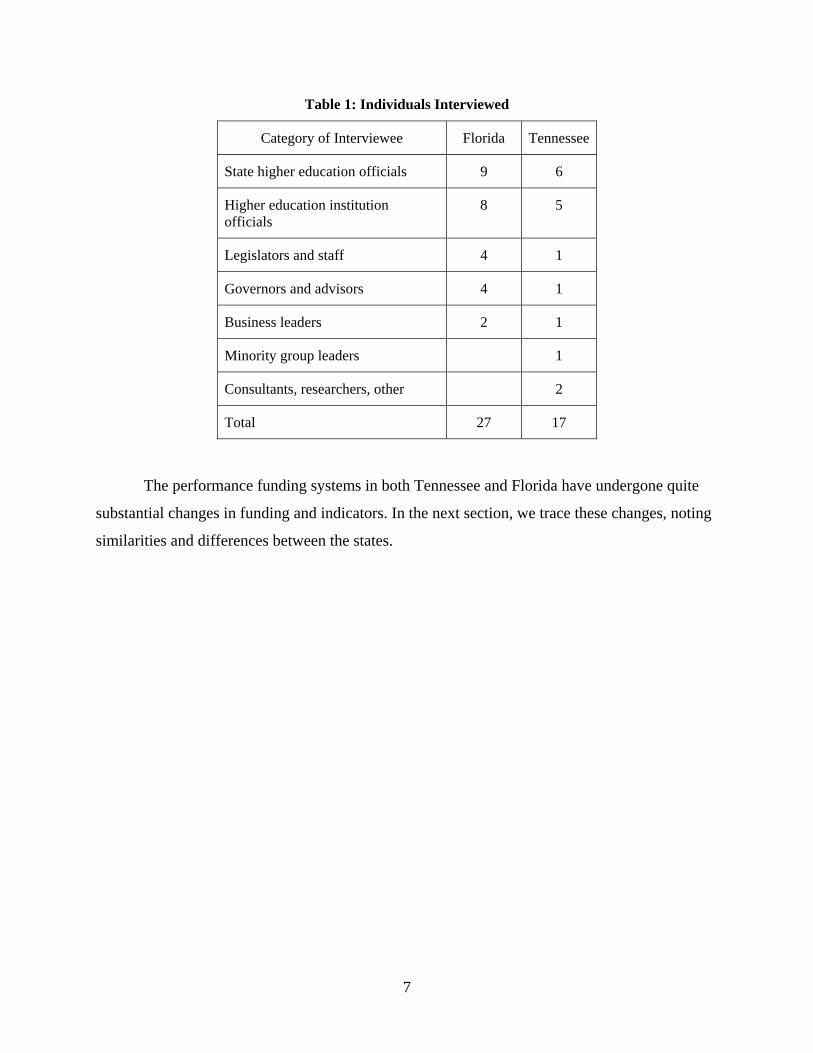
them. Table 1 categorizes our interviewees.
7
Table 1: Individuals Interviewed
Category of Interviewee Florida Tennessee
State higher education officials 9 6
Higher education institution officials
8 5
Legislators and staff 4 1
Governors and advisors 4 1
Business leaders 2 1
Minority group leaders 1
Consultants, researchers, other 2
Total 27 17
The performance funding systems in both Tennessee and Florida have undergone quite
substantial changes in funding and indicators. In the next section, we trace these changes, noting
similarities and differences between the states.

8
Changes in Funding
Tennessee’s performance funding system has exhibited a fairly steady increase in funding
over the years, while Florida’s system has exhibited a more volatile funding history.
Tennessee
Initially, performance funding in Tennessee amounted to a potential addition of 2 percent
to state appropriation for each public institution. In 1983 the amount was raised to 5 percent and
in 1987 to 5.45 percent, where it has remained (Bogue & Dandridge-Johnson, 2009; Levy, 1986,
p. 24). Performance funding is allocated on the basis of a point system, and institutions can earn
up to 100 points. Because not every college earns the maximum number of points, the actual
funds going to the colleges are less than the amounts authorized (Bogue and Dandridge-Johnson,
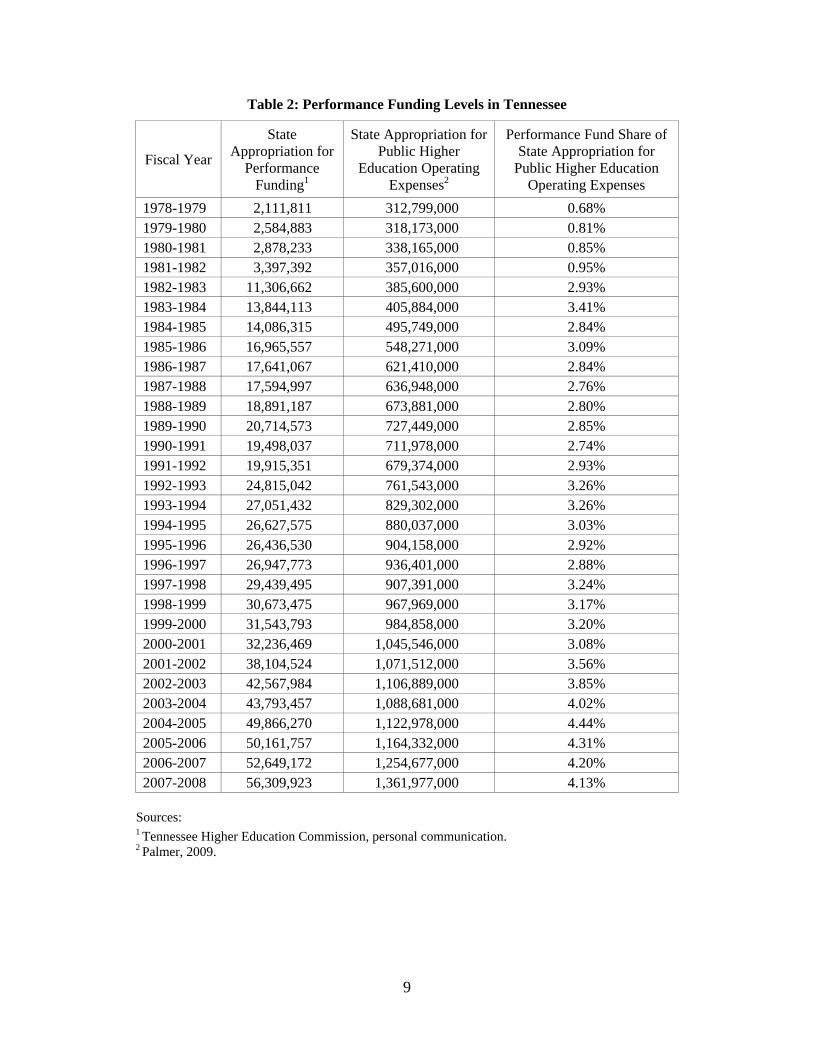
2009; Noland, 2006). The actual funds received by all the colleges and universities rose fairly
steadily from an average of 0.8 percent of state appropriations for higher education between
1978-79 and 1981-1982, to 3.0 percent between 1982-1983 and 2001-2002, and 4.2 percent since
2001-2002 (see Table 2).
9
Table 2: Performance Funding Levels in Tennessee
Fiscal Year
State Appropriation for
Performance Funding1
State Appropriation for Public Higher
Education Operating Expenses2
Performance Fund Share of State Appropriation for
Public Higher Education Operating Expenses
1978-1979 2,111,811 312,799,000 0.68% 1979-1980 2,584,883 318,173,000 0.81% 1980-1981 2,878,233 338,165,000 0.85% 1981-1982 3,397,392 357,016,000 0.95% 1982-1983 11,306,662 385,600,000 2.93% 1983-1984 13,844,113 405,884,000 3.41% 1984-1985 14,086,315 495,749,000 2.84% 1985-1986 16,965,557 548,271,000 3.09% 1986-1987 17,641,067 621,410,000 2.84% 1987-1988 17,594,997 636,948,000 2.76% 1988-1989 18,891,187 673,881,000 2.80% 1989-1990 20,714,573 727,449,000 2.85% 1990-1991 19,498,037 711,978,000 2.74% 1991-1992 19,915,351 679,374,000 2.93% 1992-1993 24,815,042 761,543,000 3.26% 1993-1994 27,051,432 829,302,000 3.26% 1994-1995 26,627,575 880,037,000 3.03% 1995-1996 26,436,530 904,158,000 2.92% 1996-1997 26,947,773 936,401,000 2.88% 1997-1998 29,439,495 907,391,000 3.24% 1998-1999 30,673,475 967,969,000 3.17% 1999-2000 31,543,793 984,858,000 3.20% 2000-2001 32,236,469 1,045,546,000 3.08% 2001-2002 38,104,524 1,071,512,000 3.56% 2002-2003 42,567,984 1,106,889,000 3.85% 2003-2004 43,793,457 1,088,681,000 4.02% 2004-2005 49,866,270 1,122,978,000 4.44% 2005-2006 50,161,757 1,164,332,000 4.31% 2006-2007 52,649,172 1,254,677,000 4.20% 2007-2008 56,309,923 1,361,977,000 4.13%
Sources: 1 Tennessee Higher Education Commission, personal communication. 2 Palmer, 2009.

10
The rise in the percentage of state appropriations that was composed of performance
funding dollars resulted from the Tennessee Higher Education Commission’s decision to make
performance funding “more important” within the higher education “funding structure”
(Authors’ interview TN #1). The Higher Education Commission was able to do this because the
Tennessee state higher education system did not experience budget problems of the magnitude of
many other states in the early 1990s and the early years of this decade. For example, state
appropriations for Tennessee public higher education institutions rose by 3.9 percent between
fiscal years 2001 and 2003, despite the fact that total state revenues dropped by 5.4 percent
between fiscal years 2000 and 2002 (U.S. Census Bureau, 2002, Table 429; 2006, Table 439).
Moreover, the Tennessee Higher Education Commission designed the performance
funding system in such a way that the performance share was insulated from fluctuations in the
state economy. Performance funding dollars are calculated for each institution and factored into
each institution’s overall budget before the Commission makes institutional budget requests.
Therefore, performance funds are not listed as a separate item in the budget request to the
legislature (Authors’ interview TN #2b). In the words of a former Higher Education Commission
official:
the performance element of funding is integrated into the basic institutional appropriation recommendation, and so that’s never been separated and what happens is if the budgets are cut, which they have been in recent years, the overall appropriation is reduced [but] not the performance funding part of it…the Higher Education Commission makes a line item appropriation and recommendation for each institution in the state, and that line item appropriation includes the part related to performance funding. (Authors’ interview TN #2b).
In light of this structure, Tennessee’s performance funding levels have remained
relatively stable over time, despite fluctuations in the state’s economy.
Florida
Funding for Florida’s Performance Based Budgeting system has been much more volatile
than for its Tennessee counterpart. It started at 2 percent of state appropriations for community

11
college operations in fiscal year 1996-1997, dropped below 1 percent in 2001-02, stayed at that
level until 2005-06, and then jumped to 1.8 percent (see Table 3).3
Table 3: Performance Funding Levels in Florida
Fiscal Year Performance Based Budgeting (PBB)
Appropriation
State Appropriation for Community
College Operations
PBB Share of State Appropriation for
Community College Operations
1996-97 12,000,000 596,260,000 2.00%
1997-98 12,000,000 663,639,000 1.80%
1998-99 4,800,000 706,595,000 0.70%
1999-2000 8,074,032 755,359,000 1.10%
2000-01 8,318,934 776,733,000 1.10%
2001-02 7,674,371 820,424,000 0.90%
2002-03 7,674,371 816,196,000 0.90%
2003-04 7,674,371 802,141,000 1.00%
2004-05 7,674,371 936,463,000 0.80%
2005-06 18,075,996 992,174,000 1.80%
2006-07 22,241,700 1,040,290,000 2.10%
2007-08 21,182,692 1,043,060,000 2.00% Sources: For total state appropriations for community college operations: 1996/97-2007/8: Palmer (2009). For Performance Based Budgeting funding: 1996/97-2000/01: Wright, Dallet, & Copa (2002, p. 161); Yancey (2002, pp. 57, 62). 2002-03: Florida Community College System (2003). Total includes $880,815 for College Prep Success program, which is separate from AA program. 2003-04: Florida Community College System (2004). Total includes $880,815 for College Prep Success. 2004-05: Florida Community College System (2005). Total includes $880,815 for College Prep Success. 2005-06: Florida Community College System (2006). Total includes $1,761,630 for College Prep Success. 2006-07: Florida Community College System (2007). Total includes $1,167,749 for College Prep Success program and $900,660 for time to degree.
3 If we include the Workforce Development Education Fund, which operated from 1999-2000 to 2001-2002, performance funding spiked at 7.1 percent of state community college appropriations in 2000-2001. These figures are derived from the WDEF figures reported by Wright, Dallet, & Copa (2002, p. 163) and the state appropriations for community college operating expenses reported in the Grapevine reports (Palmer, 2009) for fiscal years 2000, 2001, and 2002.
12
The drop between 1997-98 and 2005-06 in the share going to performance funding
stemmed from the budget pressures faced by Florida community colleges. Between fiscal years
2001 and 2004, state appropriations for community colleges rose by 5.1 percent. However, these
appropriations badly lagged behind rising enrollments, with the result that state spending per
full-time equivalent (FTE) student at community colleges dropped by 13.7 percent during those
years (Florida State Department of Education, 2009, table 19; National Center for Education
Statistics, 2007, table 339).
Faced with these budget constraints, the community colleges wanted to protect their main
enrollment-based funding and deemphasize performance funding (Authors’ interviews FL #20,
21). As a leading state community college official noted, “they [community colleges] had not
gotten any additional money in a long time, yet they had an open door policy, and so they were
taking more and more enrollments. So they wanted to go back on more of an enrollment basis
and de-emphasize performance” (Authors’ interview FL #21).
In turn, the jump in the share of state appropriations distributed through the Performance
Based Budgeting system in 2005-06 also owed its origins to the actions of the community
colleges. The legislature and the Department of Education had largely ceded control over the
PBB system to the Council of Presidents of the community colleges. The Council decided to
increase the PBB share of total state funding for community colleges over ten years to 10 percent
(Authors’ interviews FL# 6c, 8). A state official with close ties to the Presidents Council noted:
It was a policy decision by the Presidents to come up with a process or some target goals by which performance funding as a percentage of the budget would rise. We actually had a schedule that we were phasing it in and we actually stayed on track until we had a major decline in state revenue and then it just fell apart. (Authors’ FL interview #6c)
Some of the members of the Presidents Council were nervous about premising this much
of their state appropriations on performance criteria but they saw the political benefits of doing
so. As a vice president of a community college, who has had many different positions in state
government, noted,
The Presidents who are real active with the formula and the division have always felt that the percentage should increase….So I think there was a feeling …that the PBB measures have matured to the point where some really help some colleges and some help other colleges and it kind of is a wash and [that] we would be in a better position with the budget and politically to have performance drive more. (Authors’ FL interview #8)

13
As we can see, the funding levels for performance funding were products not just of
legislative action but also of initiatives taken by the higher education system. We will see this
pattern again when we consider changes in which indicators were used for performance funding.

14
Changes in Performance Funding Indicators
In both Tennessee and Florida, the state performance funding systems experienced
considerable changes in the indicators used. By indicators we mean specific characteristics of a
college that are deemed important, such as its enrollment of certain types of students or the
number of students it graduates, and that are used to condition state funding.4 Florida added nine
performance indicators and dropped two in the 12 years between 1996-1997 and 2007-2008.
Meanwhile, Tennessee added six and dropped four in the 31 years between 1979-80 and 2009-
2010. Let us examine these changes and then step back to analyze the different ways that the two
states have approached the reform of performance funding.
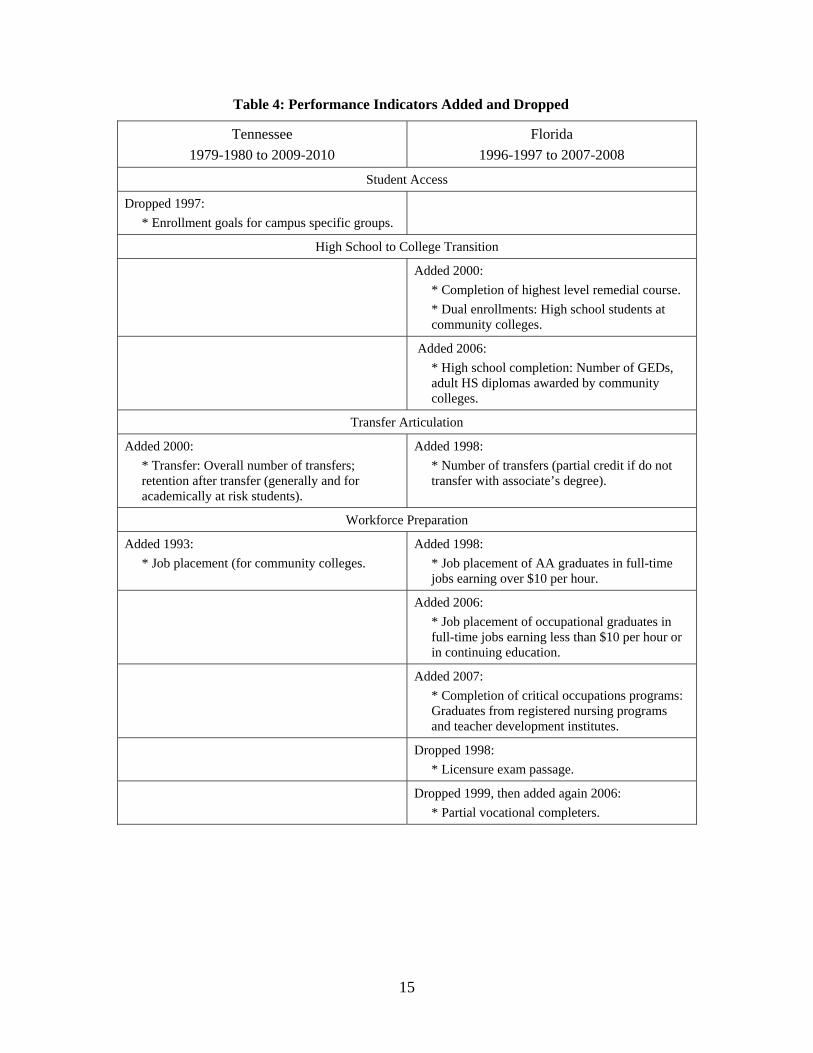
Performance Indicators Added and Dropped
Besides their differences in the amount of indicators added and dropped, the two states
also differed in their emphases. Table 4 categorizes the indicators that each state adopted and
dropped at one time or another. Florida changed 11 indicators (nine additions and two deletions)
over the course of 12 years. Indicators fell in two main areas: high school to college transition
(high school completion, dual enrollments, and remedial success) and workforce preparation
(completion of occupational programs and job placement). Tennessee changed indicators only a
third as often as Florida (10 changes spread over 31 years). Tennessee’s changes focused on
student achievement in college, institutional improvement, and other goals. It made no changes
with respect to high school-to-college transition and only minimal changes with regard to
workforce preparation. In addition to changing indicators, Tennessee has changed the weight
given to particular indicators. Over the years it reduced the weight it gave to program
accreditation (from 20 points to 5), general education assessment (20 to 15), and graduate
performance in major fields (20 to 10) (Bogue & Dandridge-Johnson, 2009).
4 We differentiate indicators from measures. By measures we mean the particular way that an indicator is operationalized. For example, does the graduation indicator take the form of the gross number of graduates or the rate of graduation?
15
Table 4: Performance Indicators Added and Dropped
Tennessee 1979-1980 to 2009-2010
Florida 1996-1997 to 2007-2008
Student Access
Dropped 1997: * Enrollment goals for campus specific groups.
High School to College Transition
Added 2000: * Completion of highest level remedial course. * Dual enrollments: High school students at community colleges.
Added 2006: * High school completion: Number of GEDs, adult HS diplomas awarded by community colleges.
Transfer Articulation
Added 2000: * Transfer: Overall number of transfers; retention after transfer (generally and for academically at risk students).
Added 1998: * Number of transfers (partial credit if do not transfer with associate’s degree).
Workforce Preparation
Added 1993: * Job placement (for community colleges.
Added 1998: * Job placement of AA graduates in full-time jobs earning over $10 per hour.
Added 2006: * Job placement of occupational graduates in full-time jobs earning less than $10 per hour or in continuing education.
Added 2007: * Completion of critical occupations programs: Graduates from registered nursing programs and teacher development institutes.
Dropped 1998: * Licensure exam passage.
Dropped 1999, then added again 2006: * Partial vocational completers.
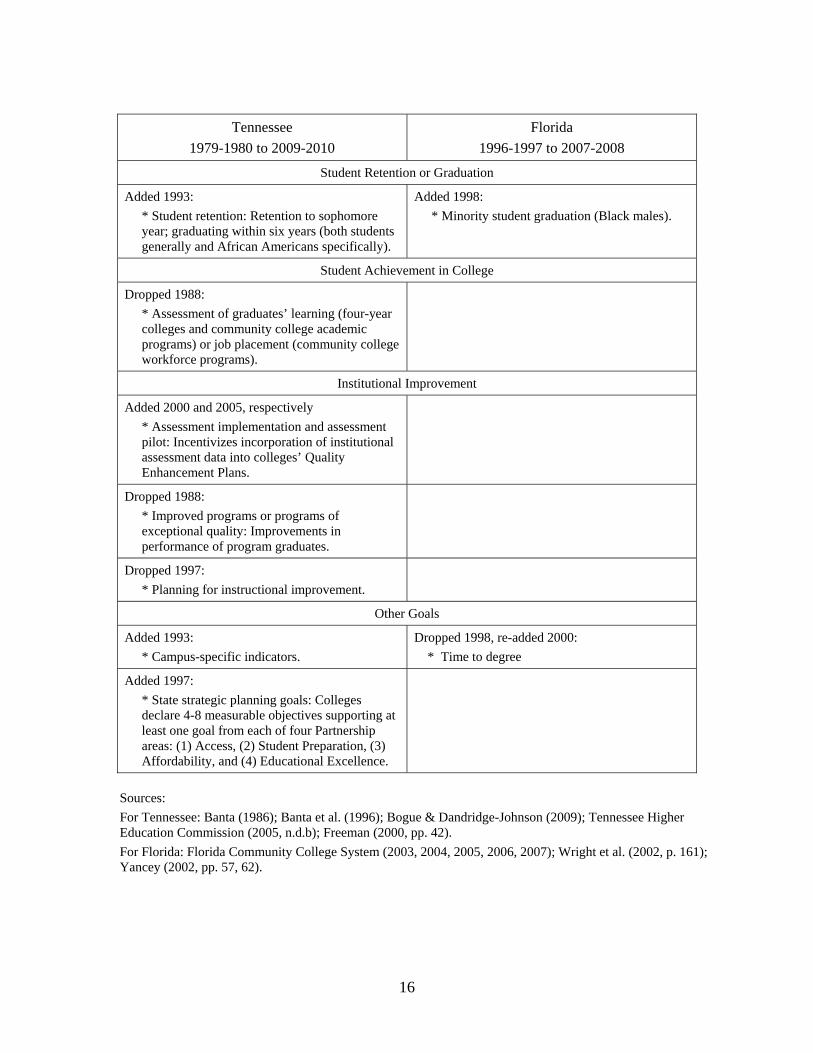
16
Tennessee
1979-1980 to 2009-2010 Florida
1996-1997 to 2007-2008
Student Retention or Graduation
Added 1993: * Student retention: Retention to sophomore year; graduating within six years (both students generally and African Americans specifically).
Added 1998: * Minority student graduation (Black males).
Student Achievement in College
Dropped 1988: * Assessment of graduates’ learning (four-year colleges and community college academic programs) or job placement (community college workforce programs).
Institutional Improvement
Added 2000 and 2005, respectively * Assessment implementation and assessment pilot: Incentivizes incorporation of institutional assessment data into colleges’ Quality Enhancement Plans.
Dropped 1988: * Improved programs or programs of exceptional quality: Improvements in performance of program graduates.
Dropped 1997: * Planning for instructional improvement.
Other Goals
Added 1993: * Campus-specific indicators.
Dropped 1998, re-added 2000: * Time to degree
Added 1997: * State strategic planning goals: Colleges declare 4-8 measurable objectives supporting at least one goal from each of four Partnership areas: (1) Access, (2) Student Preparation, (3) Affordability, and (4) Educational Excellence.
Sources: For Tennessee: Banta (1986); Banta et al. (1996); Bogue & Dandridge-Johnson (2009); Tennessee Higher Education Commission (2005, n.d.b); Freeman (2000, pp. 42). For Florida: Florida Community College System (2003, 2004, 2005, 2006, 2007); Wright et al. (2002, p. 161); Yancey (2002, pp. 57, 62).
17
Sources of Changes in Indicators
The changes itemized in Table 4 had two principal origins. One main source of changes
was external pressure, whether from students and their parents or from legislators. Initiatives
from within higher education itself, which were not the product primarily of external pressure,
comprised the other main source. Sometimes these internal initiatives came from the top: the
higher education coordinating body. But still other internal initiatives were the product of
pressure from lower level implementers, namely higher education institutions, as the bottom-up
perspective in implementation theory would predict.5
Pressure from Outside the Higher Education System
Both Tennessee and Florida evidence the impact of external pressure in changing the
indicators used in their performance funding system. Tennessee added indicators for transfer and
articulation and for the retention of minority students, and Florida added indicators for minority
student graduation and remedial student success.
Florida. Demands from the legislature prompted the addition of an indicator for minority
student graduation rates, beginning fiscal year 1998-99 (Authors’ FL interview #6c, 29). One
legislator had raised the issue of providing incentives to colleges to improve college access and
success for African American males. This prompted the State Division of Community Colleges
to add African American males to a category of “special populations” whose graduation rates
were given greater weight in the calculation of performance based budgeting funding. A state
community college official with intimate knowledge of the development of PBB noted:
It was actually a member of the legislature who [was] looking at special populations…There had been some discussion going on about how under-represented Black males were among our graduates…and he felt that if perhaps we put some economic incentives in there, that would change things (Authors’ interview FL #6c).
5 This distinction between internal initiative and external pressure can be conceptualized in terms of different perspectives with regard to bureaucratic politics, whether bureaucratic autonomy on the one hand or agency capture by external interest groups or principal-agent subordination to elected officials on the other hand (Hill, 1991; Kerwin, 2003; Makkai & Braithwaite, 1992; Rourke, 1969; Waterman & Meier, 1998; Yackee, 2003).
18
The addition in 2000 of an indicator for remediation completion was prompted by
complaints from the legislature about the high rates of remediation in the community colleges
(Authors’ interviews FL #2g, 6c, 28).6 A state community college official noted:
The Postsecondary Feedback Report came in about that time, and so we started looking at how many previous year high school graduates had to take remediation. And then the legislature was saying, “Well, if remediation is just for previous year high school graduates, we’re not going to pay for it, because they should have learned it”….The legislature was upset because of all the money that was going into remedial, and we were trying to show it wasn’t just prior year high school graduates, but we also recognized it’s important to get people out [graduated], and so the [performance funding] incentive came in to get people out. (Authors’ interview FL #2g)
Tennessee. In Tennessee, external pressures have tended to be less direct. Rather than
responding to demands for specific changes by the legislature, governor’s office, or interest
groups, we see evidence that the Tennessee Higher Education Commission — aware of issues
circulating within the higher education policy community — added performance funding
indicators that address those issues (Authors’ interview TN #6b). A university official told us:
[D]irectly linking legislators to performance funding, I don’t think you will see that. But the Higher Education Commission has the pulse of the legislature. So what they see the legislators wanting, they kind of anticipate that and put it in the performance funding (Authors’ interview TN #6b).
For example, state higher education officials and university administrators noted how
student and parent complaints about transfer problems reached the ears of legislators, who then
relayed these concerns to the Tennessee Higher Education Commission. This prompted the
Commission to add transfer rates to the indicators that applied to the public four-year colleges
(Authors’ interviews TN #3, 3b, 5, 6a,b). A state university administrator noted how the
legislative concerns sparked action by the Higher Education Commission:
6 In 1996 Florida legislators had started voicing concerns that too many unprepared students were graduating from high schools and too much money was being spent on remediating them in community college (Bousquet, 1996; Date, 1996).
19
legislators get lots of complaints from students who say that “I went to Chattanooga State and transferred to the University of Memphis but they would not take the courses”….And [legislators] may not say, “put this in performance funding,” but the Higher Education Commission says this is the way in which we are going to see that we can improve it. (Authors’ interview TN #6a)
External pressure also played an important role in Tennessee’s addition of a performance
indicator addressing minority student retention in 1993. This action certainly reflected a rising
interest on the part of the state’s higher education system in focusing on minority persistence
(Authors’ interviews TN #1, 3). A former state university official noted that this indicator was:
something that the state was interested in…, and the campuses understood that that would be of benefit to them…if you could increase your minority enrollment then you were enhancing your performance…both the state and the campuses began to see that as a priority because it would enhance the quality of undergraduate education. (Authors’ interview TN #1)
However, this state interest in minority performance was also clearly shaped by the fact
that the state had been subject to a longstanding court order to desegregate its public higher
education system (Authors’ interviews TN #4, 8, 16, 17). According to a former state higher
education official, the minority persistence measure was included for the four-year colleges
because “the state was under the auspices of a federal court decision” (Authors’ interview TN
#4). Another state higher education official explained that the inclusion of this measure
may be an outgrowth of the…state’s desegregation lawsuit that had been going on for decades….There was an apparatus in place that would provide funding across the state for certain desegregation activities…and there was just a general focus across lots of different policies on those types of issues. My guess is that its inclusion in the performance funding program is consistent…with the other desegregation stuff we were doing at the time. (Authors’ interview TN #8)
Internal Initiatives to Revise Performance Funding
Internal initiatives to revise performance funding indicators and weights also played a
key role in the development of the performance funding systems in Florida and Tennessee. They
derived from the autonomous concerns of state coordinating or governing boards or of higher
education institutions themselves.

20
Florida. The decision to eliminate the indicator for passage of licensure exams was made
by the State Board for Community Colleges on its own volition. The Board came to the
conclusion that it had become simply too difficult to collect data for this indicator from the state
licensure boards (Authors’ interview FL #2d,g). A state community college official noted:
A lot of the licensure boards are becoming an independent entity in keeping the data a bit closer to the chest than they had in the past and so we find it extremely difficult to get licensure information for some of our groups….So now is our opportunity to say, okay, that wasn’t working as well. We’ll come up with something else. (Authors’ interview FL #2d)
Internal initiative also determined how Florida chose to operationalize a key performance
indicator: graduation. It was a decision made by the State Division of Community Colleges,
which chose to use numbers of graduates rather than rates of graduation as its measure of
graduation because data on the former were easier to collect (Authors’ interview FL #28). A
state community college official noted:
we tried to use data that we were already collecting and certainly, numbers of degrees awarded were handy. Graduation rates were not only harder to obtain, but even harder to define… You were talking about whether you count everybody who comes to the school and did they graduate or whether you’d look at somebody who professed to be pursuing a degree or somebody who actually had gone so far as to take 15 or 18 hours as evidence that they were going to pursue a degree. (Authors’ interview FL #28)
Tennessee. The Tennessee Higher Education Commission and higher education
institutions together influence the performance funding system through their joint participation in
the periodic review of indicators and weights (Authors’ interviews; Bogue & Dandridge-
Johnson, 2009). Commission staff, governing board staff, and institutional officials participate in
the review and revision of the performance funding indicators every five years (Authors’
interviews; Tennessee Higher Education Commission, 2005). According to a state-level higher
education official:
Whenever we go through a new PF cycle, our folks engage in an 18-month period where they develop the new goals, the new metrics, make any changes to it, and there’s heavy involvement from the two systems and campuses and we really do sort of try to come to some consensus around what’s a good idea and worthy of pursuit. (Authors’ interview TN #8)

21
Another state higher education official agreed: “The majority of the members of the task
force are campus folks. We’re talking about presidents. We’re talking about chief academic
officers. We’re talking about deans. So you know they are the voice of the campus” (Authors’
interview TN # 3b). And a campus official said:
[T]here is a committee that has campus representatives on it…I am on it…We try to get the feel of what people, the other institutions [want] when we are working up changes. And also the drafts get distributed for comments prior to being implemented…to all of the different institutions (Authors’ interview TN #6b).
State colleges and universities influence the Tennessee performance funding program
through other mechanisms as well. A state-level higher education official told us that even
outside the formal revision period, the Higher Education Commission keeps in touch with the
institutions and solicits their input about performance funding indicators:
[T]here’s just sort of a constant feedback loop that occurs between [the Higher Education Commission] and the governing boards and the campuses and so…it just seems to work well and I think it, again, encourages that level of buy-in and sort of an ownership among the campuses for the program. (Authors’ interview TN # 8)
The Tennessee Higher Education Commission also receives feedback from institutions
through surveys (Authors’ interview TN #3b). A state higher education official told us: “We
have done surveys. We did one prior to this cycle, the 2005-10 cycle, and surveyed the
performance funding coordinators just in terms of...just getting their feedback on the program”
(Authors’ interview TN # 3b). Thus, higher education institutions provide substantial feedback to
the Higher Education Commission regarding the performance funding system, and institutional
representatives are consistently involved in the reform of performance funding indicators and
weights in Tennessee.
Our data indicate that the state Higher Education Commission and representatives of
institutions together have pursued the inclusion of a couple of indicators in the performance
funding system. Both the Higher Education Commission and the higher education institutions
were instrumental in adding the assessment implementation indicator (Authors’ interview TN
#2b, 4, 6b), which “challenged institutions to demonstrate how they were using all of this
information that they collected through performance funding to improve course structure, course
delivery, and faculty activities at the base level” (Authors’ interview TN #4). According to a

22
former state higher education official, the Higher Education Commission supported the inclusion
of an indicator for assessment implementation as a “means through which to keep the
[performance funding system] relevant” to “state policy makers” and “faculty members.”
However, some institutional representatives were also interested in including the assessment
implementation indicator. A university representative said that this indicator was “pushed
forward” by institutions because
some of us thought it might be good to tie [the assessment implementation indicator] to part of our regional accreditation, which is called the QEP, Quality Enhancement Plan, part of the SACS [Southern Association of Colleges and Schools] accreditation… We thought it might make things easier to use the QEP work in that assessment implementation and then that’s one thing that we got changed (Authors’ interview TN #6b).
Another change that appears to have been commonly pursued by institutions and the
Commission is the inclusion of campus-specific indicators in the Tennessee performance funding
program (Authors’ interviews TN #1,4). A former campus-level official said that the assessment
implementation indicator was designed to
let institutions decide what was important to them, and related to their mission, and put it [on the list of indicators]. And of course that would differ from campus to campus, and so putting in something that would permit institutional mission to influence the system was a good thing. (Authors’ interview TN #1).
According to a former state higher education official, the impetus behind adding campus-specific
indicators “was a combination of institution and the state” (Authors’ interview TN #4). When
asked about their origins, a community college official said: “I would suspect that there was
probably some institutional nudging towards having those included” (Authors’ interview TN
#11). But a former Higher Education Commission official opined: “My suspicion is that [the
inclusion of campus-specific indicators] was something that [the Higher Education Commission]
may have tossed on the table…” (Authors’ interview TN # 2b). Thus, the responses suggest that
both institutions and the Higher Education Commission sought the inclusion of campus-specific
measures in the Tennessee performance funding program.

23
State Differences in the Process of Changing Indicators
A striking difference between Florida’s and Tennessee’s performance funding programs
is that the process of addition and deletion of indicators has been smoother and more regularized
in the latter than in the former. In Tennessee, performance indicators are added at the end of a
regular five-year review, whereas in Florida they have been added irregularly, with no tie to a
cyclical process of program reappraisal. These practices reflect differences in how the
performance funding system has been designed in each state, a program feature that is
highlighted by program sustainability theory (Racine, 2006; Scheirer, 2005; Shediac-Rizkallah
and Bone, 1998).
Tennessee
The more gradual and stable process in Tennessee for changing the performance funding
system (with fewer changes of indicators and a more stable funding history) reflects the way the
policy was designed from the beginning. Performance funding emerged under the aegis of the
Tennessee Higher Education Commission, which pilot tested it for a number of years and
designed a system with several key features. First, as noted above, the performance funding
system was made subject to regular review by advisory committees with representatives from the
higher education institutions as well as the Commission itself (Tennessee Higher Education
Commission, n.d.a; Authors’ interviews TN #2, 12, 14).7 A former state higher education official
noted:
That policy has now been in effect, it is getting very close to 30 years…And I think one of the reasons is that it has a five-year revision built into it so that campus and board and state folks come together to look at the policy and how it is functioning every five years. (Authors’ interview TN #2)
Second, the five-year cycle for reviewing performance funding indicators was created to
coincide with the state higher education system’s strategic planning cycle (Authors’ interviews
TN #12, 14). As a former community college official told us, “performance funding is a building
block of strategic planning.…I think by making performance funding a component of strategic
7 The Commission has also made sure to involve the campus governing boards: the University of Tennessee and the Tennessee Board of Regents.

24
planning, it made a big difference in making it stabilized and retained all these years” (Authors’
interview TN #12).
As a result of these two features, the performance funding system has gained the
confidence of the institutions. The participation of college and university representatives in the
periodic reevaluation of the program gives institutions an active voice in developing the
indicators on which their performance will be measured and therefore breeds confidence in the
performance funding system. One community college representative told us that the program’s
features have remained stable over time:
…because I think it works. I think in general the standards make sense… the student success standards, … general education outcomes and job placement, accreditation of … programs, major field assessment in terms of pass rates on licensure exams and things like that, program review. Those are all the right things to be doing from an assessment standpoint, so why would you change that? (Authors’ interview TN # 11)
Although they have a significant voice in the performance funding program, Tennessee’s
higher education institutions are not universally supportive of all aspects of performance
funding. They voice criticisms of a “one-size-fits-all notion of many programmatic
components,” the focus on test performance, and the costs involved in conducting assessments
(Noland, 2006, pp. 63-64; see also Authors’ Interviews TN # 1, 4, 6, 8, 9, 10). Still,
performance funding has become institutionalized in Tennessee (Authors’ Interviews TN # 4,
14). A higher education official explained:
It's very much a part of our culture… So yes there are things that people feel are problematic… but I think that … when I interface with the representatives on the campuses who will administer and coordinate the performance funding process that it’s very much part of their culture, and it provides... a way to consolidate their own institutional goals. It frames their initiatives to some degree. (Authors’ Interview TN # 14)
Florida
As noted, Florida has had a less institutionalized performance funding system than
Tennessee. There are no periodic reviews tied to a strategic planning process, so changes in
funding levels and indicators have come more erratically. Moreover, external pressure –
particularly from the legislature – seems to have played a bigger role in leading to changes in
funding levels and indicators in Florida.

25
These differences are traceable to the different political context in which Florida
performance funding operates. Unlike Tennessee, there have been big shifts in control of
performance funding, from the State Community College Board to the State Education Board
and most recently, the Council of Presidents of community colleges (Authors’ interviews FL #2,
6a). In addition, the Florida legislature is a particularly activist one, with a history of micro-
managing educational policy and compelling administrative agencies to adopt specific policies.
A higher education consultant who has worked in many states, including Florida and Tennessee,
noted the difference in the governmental cultures of the two states:
States develop legislative cultures….Florida is a very top-down state and it’s always been that way. The legislature actually legislates things… One of the things that’s interesting about Tennessee is that there is no law on the books that is performance funding. It’s entirely a product of the Tennessee Higher Education Commission. (Authors’ interview SC #6)
This point about Florida fits the observation made by Alan Rosenthal (1990), a well
known analyst of state politics:
[I]n a number of places legislative leadership in education has become institutionalized. Florida is one such state. Here since the 1970s the legislature has made major changes or tinkered with education…It has exerted strong policy leadership, enacting mandate after mandate and specifying requirements, because of a continuing distrust of the department of education. (pp. 119-120)
26
Summary and Conclusions
As we have seen, performance funding systems are anything but static. As two states with
long-lasting systems (Tennessee and Florida) demonstrate, performance funding systems can
change considerably over time in funding level and performance indicators used. Tennessee has
seen a steady growth in funding and has added several measures while dropping others. Florida,
meanwhile, has had a more erratic funding history and has added and dropped even more
measures, doing so over a shorter period of time. Behind these changes have been both initiatives
from the higher education coordinating boards and pressures from legislators and the public, but
also — as the bottom-up perspective in policy implementation theory suggests — pressures from
lower level implementing organizations (in this case, the colleges).
The differences between Tennessee and Florida in the way that they have approached
performance indicator changes are attributable to important differences in their policy process,
which conform to the insights of program sustainability theory. The contrasting policy processes
in Tennessee and Florida fit the tenet of sustainability theory that policies and programs are more
likely to be sustainable if their designs are clearly delineated and provide for regular evaluation
(Mancini & Marek, 2004; Racine, 2006; Savaya et al., 2008; Scheirer, 2005; Shediac-Rizkallah
& Bone, 1998). Tennessee’s performance funding system has been considerably more stable than
Florida’s because its initial policy design much more clearly delineated how the system was to
be governed and changed over time, and provided for regular and systematic evaluation.8
Moreover, the state legislature has played a smaller role in the ongoing development of
performance funding in Tennessee than in Florida.
These differences in policy process carry important implications. A system where
funding levels do not oscillate greatly and indicators change more gradually and systematically is
more likely to allow institutions to plan effectively. It is also a system that will have a more
secure base of consent from institutions if it comes under attack.
8 A key marker of the greater instability of the Florida system is that it abandoned an entire program of performance funding focused on workforce education, the Workforce Development Education Fund. For more on this matter, see Dougherty & Natow (2009).
27
References
Albright, B. (1998). The transition from business as usual to funding for results: State efforts to integrate performance measures into the higher education budgetary process. Denver, CO: State Higher Education Executive Officers. (ERIC Document Reproduction Service Number 418 652)
Anderson, J. E. (2006). Public policymaking (6th ed.) Boston: Houghton-Mifflin.
Banta, T. W. (Ed.). (1986). Performance funding in higher education: A critical analysis of Tennessee’s experience. Boulder, CO: National Center for Higher Education Management Systems (ERIC Document Reproduction Service Number 310 655)
Banta, T. W., Rudolph, L. B., Van Dyke, J., & Fisher, H. S. (1996). Performance funding comes of age in Tennessee. Journal of Higher Education 67(1), 23-45.
Bogue, E. G. (2002). Twenty years of performance funding in Tennessee: A case study of policy intent and effectiveness. In Joseph C. Burke (ed.), Funding public colleges and universities: Popularity, problems, and prospects (pp. 85-105). Albany: SUNY Press.
Bogue, E. G., & Brown, W. (1982). Performance incentives for state colleges. Harvard Business Review, 60(6), 123-128.
Bogue, E. G., & Dandridge-Johnson, B. (2009). Performance incentives and public college accountability: A quarter century policy audit. Paper presented at the 2009 annual meeting of the Association for the Study of Higher Education, Vancouver, Canada.
Bogue, E. G., & Hall, K. B. (2003). Quality and accountability in higher education: Improving policy, enhancing performance. New York: Praeger.
Bousquet, S. (1996, Jan. 7). Florida may slam “open doors” community colleges stretched thin. Miami Herald, p. A1.
Burke, J. C. (Ed.). (2002). Funding public colleges and universities: Popularity, problems, and prospects. Albany: SUNY Press.
Burke, J. C. (Ed.). (2005). Achieving accountability in higher education. San Francisco: Jossey-Bass.
Burke, J. C., & Associates. (2000). Performance funding opinion survey of campus groups (1999-2000). Albany, NY: Rockefeller Institute.
Callan, P. (2002). Coping with recession. San Jose, CA: National Center for Public Policy and Higher Education.
28
Daniels, M. R. (2001). Policy and organizational termination. International Journal of Public Administration, 24(3), 249-262.
Date, S. (1996, July 21). Higher standards mean more remedial classes. Miami Herald, p. B7.
Dougherty, K. J., & Hong, E. (2006). Performance accountability as imperfect panacea: The community college experience. In T. Bailey & V. S. Morest (Eds.), Defending the community college equity agenda (pp. 51-86). Baltimore: Johns Hopkins University Press.
Dougherty, K. J., & Natow, R. S. (2008). The political origins of state-level performance funding: The cases of Florida, Illinois, and Washington State. New York: Columbia University, Teachers College, Community College Research Center.
Dougherty, K. J., & Natow, R. S. (2009). The demise of higher education performance funding systems in three states (CCRC Working Paper #17). New York: Community College Research Center, Teachers College, Columbia University. Retrieved from http://ccrc.tc.columbia.edu/Publication.asp?UID=693
Elmore, R. F. (1979-1980). Backward mapping: Implementation research and policy decisions. Political Science Quarterly, 94(4), 601-616.
Ewell, P. T. (1994, June). Tennessee. In S. S. Ruppert (Ed.), Charting higher education accountability: A sourcebook on state-level performance indicators (pp.83-93). Denver, CO: Education Commission of the States. (ERIC Document Reproduction Service Number 375 789)
Ewell, P. T., & Jones, D. P. (2006, Fall). State-level accountability for higher education: On the edge of a transformation. New Directions for Higher Education, 135, 9-16.
Florida Community College System. (2003). 2002-03 performance based budget totals. Tallahassee, FL: Author.
Florida Community College System. (2004). 2003-04 performance based budget totals. Tallahassee, FL: Author.
Florida Community College System. (2005). 2004-05 performance based budget totals. Tallahassee, FL: Author.
Florida Community College System. (2006). 2005-06 performance based budget totals. Tallahassee, FL: Author.
Florida Community College System. (2007). 2006-07 performance incentive funding. Tallahassee, FL: Author.
Florida State Department of Education. (2009). The fact book: Report for the Florida college system. Tallahassee: Author. Retrieved from http://www.fldoe.org/arm/cctcmis/pubs/factbook/fb2009/fb2009.pdf
29
Florida State University System. (2008). 2007-2008 fact book. Tallahassee: Author. Retrieved from http://www.flbog.org/resources/factbooks/2007-2008/xls/t40_00_0708_F.xls
Freeman, M. S. (2000). The experience of performance funding on higher education at the campus level in the past 20 years. Doctoral dissertation, University of Tennessee at Knoxville. (ERIC Document Reproduction Service Number 466 845)
Gaither, G., Nedwek, B. P., & Neal, J. E. (1994). Measuring up: The promises and pitfalls of performance indicators in higher education (ASHE/ERIC Higher Education Research Report, No. 5). San Francisco: Jossey-Bass.
Hill, L. B. (1991). Who governs the American administrative state? A bureaucratic-centered image of governance. Journal of Public Administration Research and Theory, 1(3), 261-294.
Honig, M. I. (Ed.) (2006). New directions in educational policy implementation. Albany, NY: State University of New York.
Kane, T. J., Orszag, P. S., & Gunter, D. L. (2003). State fiscal constraints and higher education spending: The role of Medicaid and the business cycle. Washington, DC: Brookings Institution.
Kerwin, C.M. (2003) Rulemaking: How government agencies write law and make policy (3d ed.) Washington, DC: CQ Press.
Layzell, D. (1999). Linking performance to funding outcomes at the state level for public institutions of higher education: Past, present, and future. Research in Higher Education, 40(2), 233-246.
Levy, R. A. (1986). Development of performance funding criteria by the Tennessee Higher Education Commission. In T. W. Banta (Ed.), Performance funding in higher education: A critical analysis of Tennessee’s Experience (pp. 13-26). Boulder, CO: National Center for Higher Education Management Systems. (ERIC Document Reproduction Service Number 310 655)
Makkai, T., & Braithwaite, J. (1992). In and out of the revolving door: Making sense of agency capture. Journal of Public Policy, 12(1), 61-78.
Mancini, J. A., & Marek, L. L. (2004). Sustaining community-based programs for families: Conceptualization and measurement. Family Relations, 53(4), 339-347.
Matland, J. (1995). Synthesizing the implementation literature. Journal of Public Administration Research and Theory, 5(2), 145-174.
McLaughlin, M. W. (1987). Learning from experience: Lessons from policy implementation. Educational Evaluation and Policy Analysis, 9(2), 171-78.
30
McLaughlin, M. W. (2006). Implementation research in education: Lessons learned, lingering questions and new opportunities. In M. I. Honig (Ed.), New directions in education policy implementation (pp. 209-228). Albany, NY: State University of New York Press.
McLendon, M. K., Hearn, J. C., & Deaton, R. (2006). Called to account: Analyzing the origins and spread of state performance-accountability policies for higher education. Educational Evaluation and Policy Analysis, 28(1), 1-24.
National Center for Education Statistics (2007). Digest of education statistics, 2006. Washington, DC: Author.
Natow, R. S., & Dougherty, K. J. (2008, November). Performance funding through theoretical lenses: Examining the applicability of the advocacy coalition framework. Presentation to the annual meeting of the Association for the Study of Higher Education.
Noland, B. E. (2006, Fall). Changing perceptions and outcomes: The accountability paradox in Tennessee. New Directions for Higher Education, 135, 59-67.
Palmer, J. C. (Ed.). (2009). Historical data. Grapevine: An annual compilation of data on state tax appropriations for the general operation of higher education. Retrieved from documents linked at http://www.grapevine.ilstu.edu/historical/index.htm
Pluye, P., Potvin, L., & Denis, J-L. (2004). Making public health programs last: Conceptualizing sustainability. Evaluation and Program Planning, 27, 121-133.
Racine, D. P. (2006). Reliable effectiveness: A theory on sustaining and replicating worthwhile innovations. Administration and Policy in Mental Health and Mental Health Services Research, 33(3), 356-387.
Rourke, F.E. (1969). Bureaucracy, politics, and public policy. Boston, MA: Little, Brown and Company.
Rosenthal, A. (1990). Governors and legislatures: Contending powers. Washington, DC: CQ Press.
Ruppert, S. (Ed.). (1994, Fall). Charting higher education accountability: A sourcebook on state-level performance indicators. Denver, CO: Education Commission of the States.
Sabatier, P. A, & Jenkins-Smith, H. (1999). The advocacy coalition framework: An assessment. In P. A. Sabatier (Ed.), Theories of the policy process (pp. 117-166). Boulder, CO: Westview Press.
Savaya, R., Spiro, S., & Elran-Barak, R. (2008). Sustainability of social programs: A comparative case study analysis. American Journal of Evaluation, 29(4), 478-493.
Scheirer, M. A. (2005). Is sustainability possible? A review and commentary on empirical studies of program sustainability. American Journal of Evaluation, 26, 320-347.

31
Shediac-Rizkallah, M. C., & Bone, L. R. (1998). Planning for the sustainability of community-based health programs: Conceptual frameworks and future directions for research, practice and policy. Health Education Research, 13(1), 87-108.
Shulock, N. (2003, November). A fundamentally new approach to accountability: Putting state policy issues first. Paper presented at 2003 ASHE Forum on Public Policy and Higher Education, Portland, OR: California State University at Sacramento, Institute for Higher Education Leadership and Policy.
Shulock, N., & Moore, C. (2002). An accountability framework for California higher education: Informing public policy and improving outcomes. Sacramento, CA: California State University at Sacramento, Center for California Studies.
Shulock, N., & Moore, C. (2005). A framework for incorporating public trust issues in states’ higher education accountability plans. Sacramento, CA: California State University at Sacramento, Institute for Higher Education Leadership and Policy.
Spillane, J. P., Reiser, B. J., & Gomez, L. M. (2006). Policy implementation and cognition. In M. I. Honig (Ed.), New directions in educational policy implementation (pp. 47-64). Albany: State University of New York.
Tennessee Higher Education Commission. (2005, July). Performance funding 2005-2010 cycle. Nashville, TN: Author (Revised June 2009). Retrieved from http://www.state.tn.us/thec/Divisions/AcademicAffairs/PerformanceFunding/performance_pdfs/PF%202005-10%20Cycle%20Standards%20FINAL%207-25-05%20Revised%206-1-09.pdf
Tennessee Higher Education Commission. (n.d.a). Performance funding. Retrieved from http://www.state.tn.us/thec/Divisions/AcademicAffairs/PerformanceFunding/performance_funding.html
Tennessee Higher Education Commission. (n.d.b). Performance funding standards 2000-01 through 2004-05. Retrieved from http://www.state.tn.us/thec/Divisions/AcademicAffairs/PerformanceFunding/performance_pdfs/Performance%20Funding%20Standards%202000-05%20Cycle.pdf
United States Census Bureau. (2002). Statistical abstract of the United States, 2002. Washington, DC: Government Printing Office.
United States Census Bureau. (2006). Statistical abstract of the United States, 2006. Washington, DC: Government Printing Office.
Waterman, R. W., & Meier, K. J. (1998). Principal-agent models: An expansion? Journal of Public Administration Research & Theory, 8(2), 173-202.
32
Wright, D. L., Dallet, P. H., & Copa, J. C. (2002). Ready, fire, aim: Performance funding policies for postsecondary education in Florida. In J. C. Burke (Ed.), Funding public colleges and universities: Popularity, problems, and prospects (pp. 137-168). Albany: SUNY Press.
Yackee, S. W. (2003). An agent, but an agent of whom? Organized interests and the U.S. bureaucracy. Ph.D. Dissertation, University of North Carolina at Chapel Hill. Available from ProQuest Digital Dissertations and Theses database.
Yancey, G. W. (2002). Fiscal equity change in the Florida community college system during the first five years after the implementation of performance funding. Doctoral dissertation, University of Florida. Available from ProQuest Digital Dissertations and Theses database.
Zumeta, W. (2001). Public policy and accountability in higher education: Lessons from the past and present for the new millennium. In D. E. Heller (Ed.). The states and public higher education policy: Affordability, access, and accountability (pp. 155-197). Baltimore: Johns Hopkins University Press.
Zumeta, W. (2009). State support of higher education: The roller coaster plunges downward yet again.” In H. Wechsler (Ed.), The 2009 almanac of higher education (pp. 29-43). Washington, DC: National Education Association.