Contingent Worker Surveys and related projects COPAFS ... · Michael W. Horrigan Associate...
28
1 — U.S. BUREAU OF LABOR STATISTICS • bls.gov COPAFS Michael W. Horrigan Associate Commissioner June 17, 2016 Contingent Worker Surveys and related projects
Transcript of Contingent Worker Surveys and related projects COPAFS ... · Michael W. Horrigan Associate...

1 — U.S. BUREAU OF LABOR STATISTICS • bls.gov
COPAFS
Michael W. HorriganAssociate Commissioner
June 17, 2016
Contingent Worker Surveysand related projects

2 — U.S. BUREAU OF LABOR STATISTICS • bls.gov
Outline
What is the ‘Gig’ economy and how big is it?
BLS Contingent Worker Surveys
Survey of Employer Provided Training
Data Gaps
3 — U.S. BUREAU OF LABOR STATISTICS • bls.gov
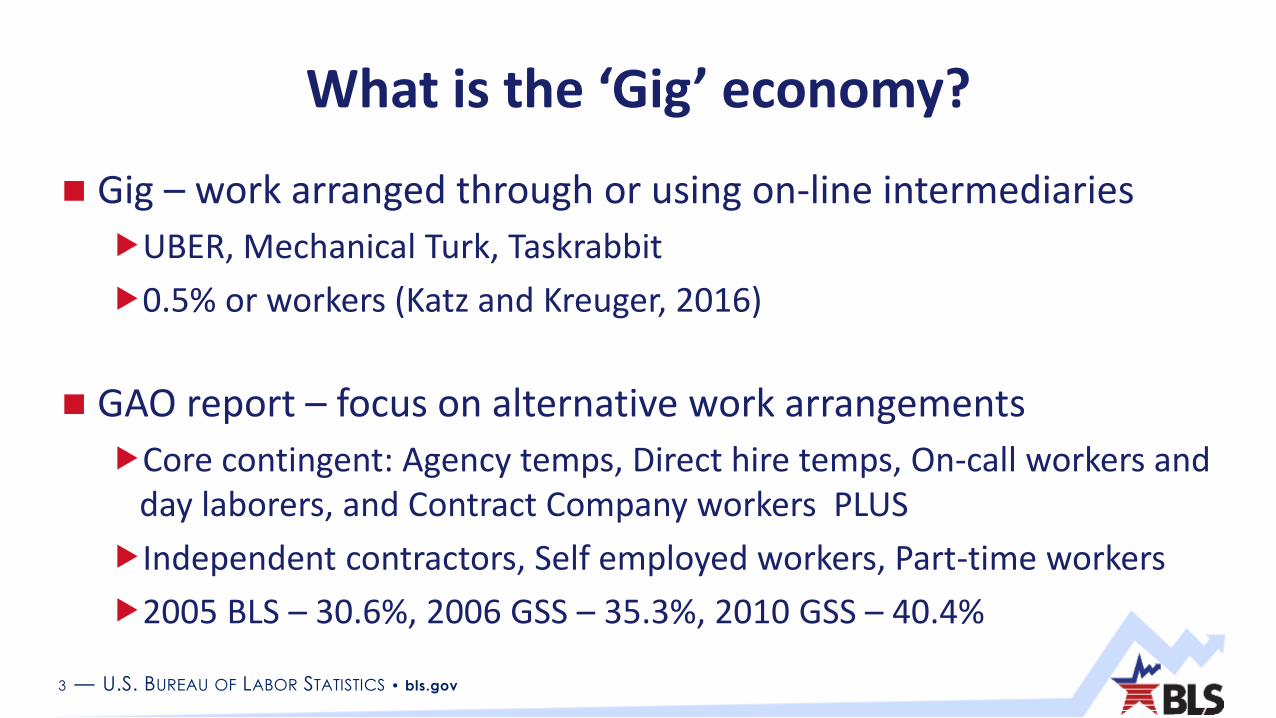
What is the ‘Gig’ economy?
Gig – work arranged through or using on-line intermediaries
UBER, Mechanical Turk, Taskrabbit
0.5% or workers (Katz and Kreuger, 2016)
GAO report – focus on alternative work arrangements
Core contingent: Agency temps, Direct hire temps, On-call workers and day laborers, and Contract Company workers PLUS
Independent contractors, Self employed workers, Part-time workers
2005 BLS – 30.6%, 2006 GSS – 35.3%, 2010 GSS – 40.4%

4 — U.S. BUREAU OF LABOR STATISTICS • bls.gov
BLS Contingent Worker Surveys
BLS Contingent Worker Surveys
1995, 1997, 1999, 2001, 2005 and 2017
Contingent work
Alternative work
Temporary help agency workers
On call workers
Independent contractors
Contract company workers
5 — U.S. BUREAU OF LABOR STATISTICS • bls.gov
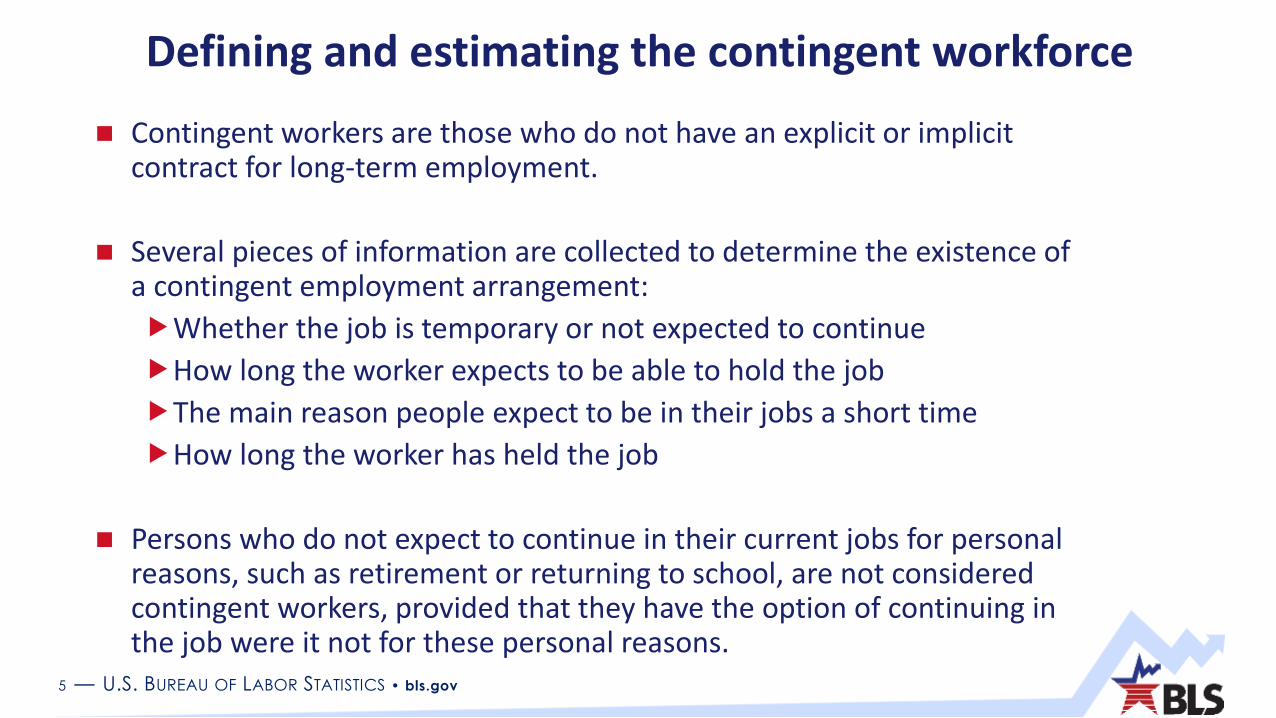
Defining and estimating the contingent workforce
Contingent workers are those who do not have an explicit or implicit contract for long-term employment.
Several pieces of information are collected to determine the existence of a contingent employment arrangement:
Whether the job is temporary or not expected to continue
How long the worker expects to be able to hold the job
The main reason people expect to be in their jobs a short time
How long the worker has held the job
Persons who do not expect to continue in their current jobs for personal reasons, such as retirement or returning to school, are not considered contingent workers, provided that they have the option of continuing in the job were it not for these personal reasons.

6 — U.S. BUREAU OF LABOR STATISTICS • bls.gov
Table 1. Defining and estimating the contingent workforce, February 2005
Alternative estimates of contingent workers TotalPercent of total
employed
Estimate 1: Wage and salary workers who expect their jobs will
last for an additional year or less and who had worked at their
jobs for 1 year or less.
2.5 million 1.8
Estimate 2: Workers, including the self-employed and
independent contractors, who expect their employment to last for
an additional year or less and who had worked at their jobs (or
been self-employed) for 1 year or less.
3.2 million 2.3
Estimate 3: Workers who do not expect their jobs to last.
(Unless otherwise noted, the following charts all focus on this
estimate.)
5.7 million 4.1
Source: February 2005 Contingent Work Supplement, Current Population Survey, Bureau of Labor Statistics
7 — U.S. BUREAU OF LABOR STATISTICS • bls.gov
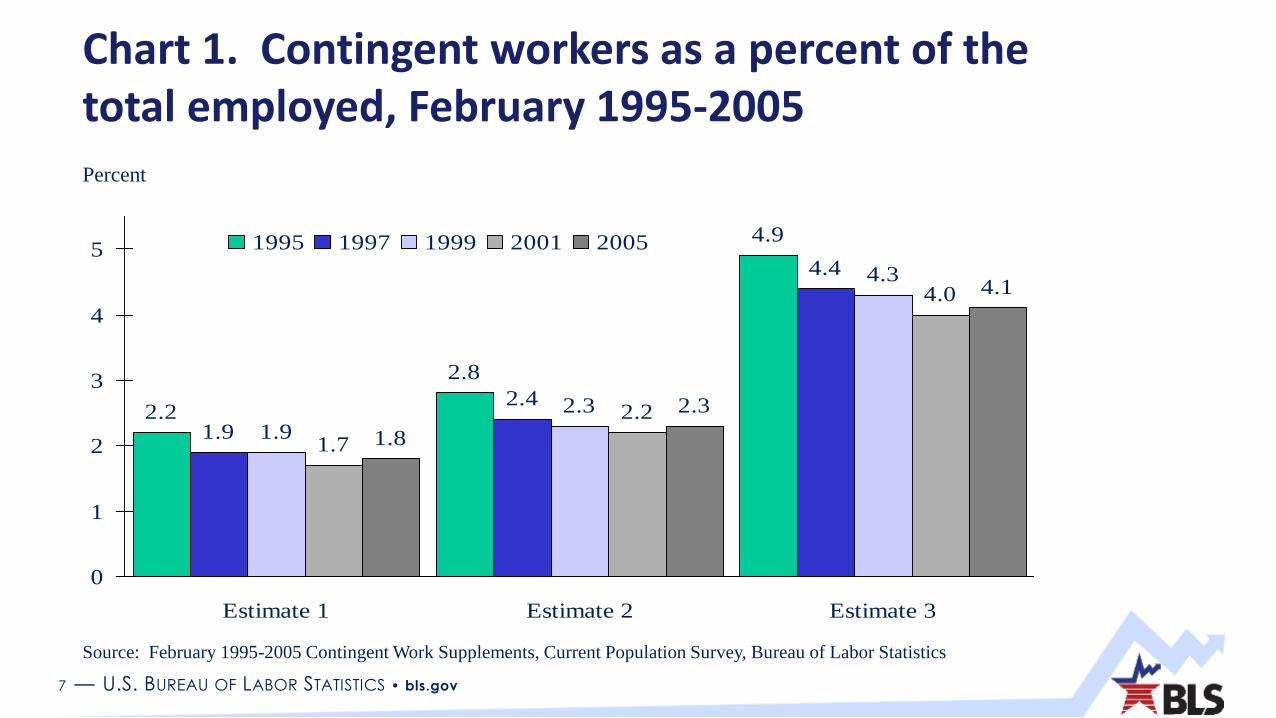
2.2
2.8
4.9
1.9
2.4
4.4
1.9
2.3
4.3
1.7
2.2
4.0
1.8
2.3
4.1
0
1
2
3
4
5
Estimate 1 Estimate 2 Estimate 3
1995 1997 1999 2001 2005
Chart 1. Contingent workers as a percent of the total employed, February 1995-2005
Percent
Source: February 1995-2005 Contingent Work Supplements, Current Population Survey, Bureau of Labor Statistics

8 — U.S. BUREAU OF LABOR STATISTICS • bls.gov
Chart 2. In 2005, contingent workers were younger
Source: February 2005 Contingent Work Supplement, Current Population Survey, Bureau of Labor Statistics
2713
7387
0%
10%
20%
30%
40%
50%
60%
70%
80%
90%
100%
Contingent workers Noncontingent workers
25 years and over
16 to 24 years

9 — U.S. BUREAU OF LABOR STATISTICS • bls.gov
15.5
24.5 23.3
36.6
8.6
29.7 28.5
33.1
0
5
10
15
20
25
30
35
40
Less than a high
school diploma
High school
graduates, no college
Some college, no
degree
Bachelor's degree or
higher
Contingent workers Noncontingent workersPercent
Chart 3. In 2005, contingent workers were more likely to be either less educated or highly educated
Source: February 2005 Contingent Work Supplement, Current Population Survey, Bureau of Labor Statistics

10 — U.S. BUREAU OF LABOR STATISTICS • bls.gov
Chart 4. In 2005, contingent workers more likely to be part time
Source: February 2005 Contingent Work Supplement, Current Population Survey, Bureau of Labor Statistics
60
83
40
17
0%
10%
20%
30%
40%
50%
60%
70%
80%
90%
100%
Contingent workers Noncontingent workers
Part time
Full time

11 — U.S. BUREAU OF LABOR STATISTICS • bls.gov
It depends
5.7%
Prefer contingent
employment
35.5%
Prefer
noncontingent
employment
55.3%
Chart 5. In 2005, only 36% of contingent workers preferred a contingent work arrangements
Not available
3.5%
Source: February 2005 Contingent Work Supplement, Current Population Survey, Bureau of Labor Statistics

12 — U.S. BUREAU OF LABOR STATISTICS • bls.gov
Percent
Chart 6. In 2005, contingent workers were less likely to have health coverage or pension plans
Source: February 2005 Contingent Work Supplement, Current Population Survey, Bureau of Labor Statistics
59.1
18.1 18.612.4
79.4
52.1 49.644.7
0
10
20
30
40
50
60
70
80
90
Health insurance
coverage from any
source
Employer-provided
health insurance
coverage
Eligible for employer-
provided pension plan
Included in employer-
provided pension plan
Contingent workers Noncontingent workers

13 — U.S. BUREAU OF LABOR STATISTICS • bls.gov
Alternative work arrangements

14 — U.S. BUREAU OF LABOR STATISTICS • bls.gov
6.7
1.7
1.00.5
6.7
1.61.0
0.6
6.3
1.50.9
0.6
6.4
1.6
0.90.5
7.4
1.8
0.90.6
0
1
2
3
4
5
6
7
8
9
10
Independent
contractors
On-call workers Temporary help
agency workers
Workers provided by
contract firms
1995 1997 1999 2001 2005
Chart 7. Workers with alternative arrangements as a percent of the total employed, February 1995-2005
Source: February 1995-2005 Contingent Work Supplements, Current Population Survey, Bureau of Labor Statistics
Percent

15 — U.S. BUREAU OF LABOR STATISTICS • bls.gov
Estimates of alternative work arrangements
BLS – 10.8% of workers were in any of the four alternative work arrangements in 2005.
Katz and Krueger estimate the percentage of workers in alternative work arrangements in a way that is similar but not exactly identical to BLS:
Temporary help agency, on-call, contract company workers, independent contractors or freelancers
10.1% in 2005
15.8 % in 2015

16 — U.S. BUREAU OF LABOR STATISTICS • bls.gov
95.7
80.1 80.788.4 86.1
4.3
19.9 19.311.6 13.9
0%
10%
20%
30%
40%
50%
60%
70%
80%
90%
100%
Independent
contractors
On-call workers Temporary help
agency workers
Workers provided by
contract firms
Workers with
traditional
arrangements
Chart 8. In 2005, on-call and temporary help agency workers were more likely to be younger
16 to 24 years
25 years and over
Source: February 2005 Contingent Work Supplement, Current Population Survey, Bureau of Labor Statistics

17 — U.S. BUREAU OF LABOR STATISTICS • bls.gov
Percent
9.1
44.6
56.2
82.3
46.1
32.1
0
10
20
30
40
50
60
70
80
90
Independent contractors On-call workers Temporary help agency
workers
Prefer traditional arrangement Prefer alternative arrangement
Chart 9. In 2005, independent contractors preferred their arrangement while temporary help agency workers preferred a traditional arrangement
Source: February 2005 Contingent Work Supplement, Current Population Survey, Bureau of Labor StatisticsNote: Workers provided by contract firms were not asked about their preference for a traditional arrangement.

18 — U.S. BUREAU OF LABOR STATISTICS • bls.gov
Percent
39.7
8.3 8.93.8
80.2
48.942.6
33.5
80.0
56.0 52.947.7
0
10
20
30
40
50
60
70
80
90
Health insurance coverage
from any source
Employer-provided health
insurance coverage
Eligible for employer-
provided pension plan
Included in employer-
provided pension plan
Temporary help agency workers Workers provided by contract firms
Workers with traditional arrangements
Chart 10. In 2005, temporary help agency workers were far less likely to have health insurance or have pension coverage
Source: February 2005 Contingent Work Supplement, Current Population Survey, Bureau of Labor Statistics

19 — U.S. BUREAU OF LABOR STATISTICS • bls.gov
Chart 11. Median usual weekly earnings of full-time workers with alternative work arrangements, February 2005
Source: February 2005 Contingent Work Supplement, Current Population Survey, Bureau of Labor Statistics
*Total estimate is for 1st quarter 2005 full-time wage and salary workers.
$716
$519
$414
$756
$651
$0
$100
$200
$300
$400
$500
$600
$700
$800
Independent
contractors
On-call workersTemporary help
agency workers
Workers
provided by
contract firms
*Total full-time
workers

20 — U.S. BUREAU OF LABOR STATISTICS • bls.gov
May 2017 Contingent Worker Supplement

21 — U.S. BUREAU OF LABOR STATISTICS • bls.gov
May 2017 CWS - Timeline
2 distinct types of changes to the survey are
being considered
Minor changes to the 2005 survey question
wording
Adding a limited number of new questions (4)
to the end of the survey

22 — U.S. BUREAU OF LABOR STATISTICS • bls.gov
May 2017 CWS- new questions
Do individuals obtain customers or in-person tasks through companies that electronic match them, often through apps
Main job, Second job (if identified previously as a multiple job holder), Additional work for pay
Do workers complete short, online only tasks posted on electronic lists for pay

23 — U.S. BUREAU OF LABOR STATISTICS • bls.gov
May 2017 Contingent Worker Survey - timeline
Change to wording of existing instrument - completed
Cognitive testing of new questions – Jun/Jul 2016
Federal Register Notice – Sep/Nov 2016
Reprogramming the instrument - ongoing

24 — U.S. BUREAU OF LABOR STATISTICS • bls.gov
Surveys of Employer Provided Training

25 — U.S. BUREAU OF LABOR STATISTICS • bls.gov
Surveys of Employer Provided Training
SEPT 1993
Incidence
SEPT 1995
Incidence and Intensity
Hours, number of staff training
Limited measures of employer costs
Formal and informal training
– Wage and salary opportunity costs

26 — U.S. BUREAU OF LABOR STATISTICS • bls.gov
Surveys of Employer Provided Training
Interest by foundations
DOL funding for cognitive research
Record keeping practices of firms
Extensive consultation with stakeholders
Questionnaire design
Selection of data collection methodology

27 — U.S. BUREAU OF LABOR STATISTICS • bls.gov
Data Gaps
Establishment based surveys
How businesses produce their product or provide their service
Wage and salary and self employed
– Traditional workers
– Alternative work arrangements
– Contingent workers
– Gig workers
Other margins of adjustment
– Overtime, formal training

28 — U.S. BUREAU OF LABOR STATISTICS • bls.gov
Contact Information
Mike HorriganAssociate Commissioner
Office of Employment and Unemployment Statistics
www.bls.gov202-691-5735