
Context sensitivity and invariance in perception of octave...
20
Psychological Research DOI 10.1007/s00426-009-0264-9 123 ORIGINAL ARTICLE Context sensitivity and invariance in perception of octave-ambiguous tones Bruno H. Repp · Jacqueline M. Thompson Received: 4 June 2009 / Accepted: 30 October 2009 © Springer-Verlag 2009 Abstract Three experiments investigated the inXuence of unambiguous (UA) context tones on the perception of octave-ambiguous (OA) tones. In Experiment 1, pairs of OA tones spanning a tritone interval were preceded by pairs of UA tones instantiating a rising or falling interval between the same pitch classes. Despite the inherent ambi- guity of OA tritone pairs, most participants showed little or no priming when judging the OA tritone as rising or falling. In Experiments 2 and 3, participants compared the pitch heights of single OA and UA tones representing either the same pitch class or being a tritone apart. These judgments were strongly inXuenced by the pitch range of the UA tones, but only slightly by the spectral center of the OA tones. Thus, the perceived pitch height of single OA tones is context sensitive, but the perceived relative pitch height of two OA tones, as described in previous research on the “tritone paradox,” is largely invariant in UA tone contexts. Introduction The phenomenon of multistable perception has long fasci- nated researchers in vision, as it can reveal endogenous determinants of perception, brain dynamics, and even neu- ral correlates of consciousness (for reviews, see Blake & Logothetis, 2002; Leopold & Logothetis, 1999; Sterzer, Kleinschmidt, & Rees 2009). Paradigms such as ambiguous Wgures (e.g., face/vase, Necker cube) and binocular rivalry are familiar and widely used. Research on multistable audi- tory perception is much less developed because of a relative paucity of appropriate paradigms, but underlying principles may be similar in audition and vision (Pressnitzer & Hupé, 2006). One paradigm that deserves attention in that regard is the perception of octave-ambiguous tones, an invention of the 1960s. To demonstrate that the psychological dimensions of pitch quality (chroma) and pitch height can be dissociated, Shepard (1964) ingeniously created tones that are com- posed of a series of partials spaced an octave apart, with the amplitude of the partials being governed by a Wxed spectral envelope. These tones, which have a deWnite chroma but are ambiguous with regard to the octave their dominant pitch resides in, are now known as octave-ambiguous (OA) or Shepard tones. Figure 1 gives an illustration of the slightly modiWed OA tones used by Deutsch (1987, 1991) and in many subsequent studies, including the present investigation. They consist of six partials whose amplitudes are governed by a cosine-shaped amplitude envelope over a logarithmic frequency axis. The Wgure shows the partials of two tones, representing the musical pitch classes D# and A, under each of two envelopes, one centered on 262 Hz (C4) and the other centered on 370 Hz (F#4). The frequencies of the partials determine the perceived chroma or pitch class, whereas the envelope aVects the perceived timbre (bright- ness) of these organ-like sounds. The envelope peak (or weighted mean log frequency) represents the spectral cen- ter of the tones. Tones with an envelope centered on F#4 can be said to be six semitones (st) higher than tones with an envelope centered on C4. A set of OA tones with the same envelope, which typi- cally includes 12 tones representing the 12 musical pitch classes, has a circular structure because all tones are in the- ory equally high and diVer only in chroma. In the Shepard B. H. Repp (&) Haskins Laboratories, 300 George Street, New Haven, CT 06511-6624, USA e-mail: [email protected] J. M. Thompson Yale University, New Haven, CT, USA
Transcript of Context sensitivity and invariance in perception of octave...

Psychological Research
DOI 10.1007/s00426-009-0264-9ORIGINAL ARTICLE
Context sensitivity and invariance in perception of octave-ambiguous tones
Bruno H. Repp · Jacqueline M. Thompson
Received: 4 June 2009 / Accepted: 30 October 2009© Springer-Verlag 2009
Abstract Three experiments investigated the inXuence ofunambiguous (UA) context tones on the perceptionof octave-ambiguous (OA) tones. In Experiment 1, pairs ofOA tones spanning a tritone interval were preceded by pairsof UA tones instantiating a rising or falling intervalbetween the same pitch classes. Despite the inherent ambi-guity of OA tritone pairs, most participants showed little orno priming when judging the OA tritone as rising or falling.In Experiments 2 and 3, participants compared the pitchheights of single OA and UA tones representing either thesame pitch class or being a tritone apart. These judgmentswere strongly inXuenced by the pitch range of the UAtones, but only slightly by the spectral center of the OAtones. Thus, the perceived pitch height of single OA tonesis context sensitive, but the perceived relative pitch heightof two OA tones, as described in previous research on the“tritone paradox,” is largely invariant in UA tone contexts.
Introduction
The phenomenon of multistable perception has long fasci-nated researchers in vision, as it can reveal endogenousdeterminants of perception, brain dynamics, and even neu-ral correlates of consciousness (for reviews, see Blake &Logothetis, 2002; Leopold & Logothetis, 1999; Sterzer,Kleinschmidt, & Rees 2009). Paradigms such as ambiguousWgures (e.g., face/vase, Necker cube) and binocular rivalry
are familiar and widely used. Research on multistable audi-tory perception is much less developed because of a relativepaucity of appropriate paradigms, but underlying principlesmay be similar in audition and vision (Pressnitzer & Hupé,2006). One paradigm that deserves attention in that regardis the perception of octave-ambiguous tones, an inventionof the 1960s.
To demonstrate that the psychological dimensions ofpitch quality (chroma) and pitch height can be dissociated,Shepard (1964) ingeniously created tones that are com-posed of a series of partials spaced an octave apart, with theamplitude of the partials being governed by a Wxed spectralenvelope. These tones, which have a deWnite chroma butare ambiguous with regard to the octave their dominantpitch resides in, are now known as octave-ambiguous (OA)or Shepard tones. Figure 1 gives an illustration of theslightly modiWed OA tones used by Deutsch (1987, 1991)and in many subsequent studies, including the presentinvestigation. They consist of six partials whose amplitudesare governed by a cosine-shaped amplitude envelope over alogarithmic frequency axis. The Wgure shows the partials oftwo tones, representing the musical pitch classes D# and A,under each of two envelopes, one centered on 262 Hz (C4)and the other centered on 370 Hz (F#4). The frequencies ofthe partials determine the perceived chroma or pitch class,whereas the envelope aVects the perceived timbre (bright-ness) of these organ-like sounds. The envelope peak (orweighted mean log frequency) represents the spectral cen-ter of the tones. Tones with an envelope centered on F#4can be said to be six semitones (st) higher than tones withan envelope centered on C4.
A set of OA tones with the same envelope, which typi-cally includes 12 tones representing the 12 musical pitchclasses, has a circular structure because all tones are in the-ory equally high and diVer only in chroma. In the Shepard
B. H. Repp (&)Haskins Laboratories, 300 George Street, New Haven, CT 06511-6624, USAe-mail: [email protected]
J. M. ThompsonYale University, New Haven, CT, USA
123

Psychological Research
scale illusion, a continuous series of OA tones with thesame envelope but with frequencies of partials increasing insteps of 1 st is heard by many listeners as endlessly increas-ing in pitch, even though the same 12 tones are repeatedover and over by going around the pitch class circle. Twosuccessive OA tones with the same envelope are generallyheard as a rising interval when the pitch class of the secondtone is <6 st “above” that of the Wrst tone, and as a fallinginterval when the second pitch class is <6 st “below” theWrst (i.e., according to proximity along the circumference ofthe pitch class circle). However, when two OA tones span atritone (6 st, half an octave) and thus lie opposite each otheron the pitch class circle, the direction of the interval is max-imally ambiguous and is heard sometimes as rising, some-times as falling, though often with great conWdence(Shepard, 1964). In this respect, OA tritone pairs seemsomewhat analogous to perceptually bistable visual Wguressuch as the Necker cube.
Actually, however, they represent a considerably morecomplex phenomenon. Given 12 OA tones having the samespectral envelope and representing the 12 pitch classes ofthe equal-tempered chromatic scale of Western music, thereare 12 diVerent tritone pairs, each starting with one of the
pitch classes and ending with the pitch class 6 st away.Although all of these pairs are in theory equally ambiguous,Deutsch (1986, 1987) discovered that listeners tend to hearsome pairs consistently as rising and others (those with theopposite order of pitch classes) consistently as falling; theremaining pairs (if any) are less consistently judged. Fromthe pattern of individual responses to the 12 tritone pairs asubjectively highest pitch class (SHPC) can usually beinferred (see Fig. 2, explained in the caption): tritone pairsstarting with that pitch class, or with one nearby, areconsistently heard as falling in pitch (high response per-centages in Fig. 2), whereas pairs with these tones inopposite order are consistently heard as rising (lowresponse percentages in Fig. 2). However, which pairs areperceived most consistently as rising or falling dependsvery much on the listener. These Wndings constitute thetritone paradox.
It might be suggested that the tones in a tritone pair arenot perceived as equally high because their individualdiscrete spectral envelopes (line spectra) are not identical:their most prominent partial, which constitutes theindividual envelope peak, varies in both frequency andamplitude. As can be seen in Fig. 1a, among tones with anenvelope centered on C4 there are some (D# and itsneighbors) whose strongest partial is above C4 and others
Fig. 1 Spectral structure of octave-ambiguous tones D# and Awith amplitude envelopes centered on C4 (262 Hz, a) and on F#4(370 Hz, b)
0
0.1
0.2
0.3
0.4
0.5
0.6
0.7
0.8
0.9
1
10 100 1000 5000
Rel
ativ
e am
plitu
de
Frequency (Hz)
Envelope
D#
A
0
0.1
0.2
0.3
0.4
0.5
0.6
0.7
0.8
0.9
1
10 100 1000 5000
Rel
ativ
e am
plitu
de
Frequency (Hz)
Envelope
D#
A
C4
F#4
262
370
A
B
Fig. 2 Radial response graph illustrating the concept of subjectivelyhighest pitch class (SHPC). Labels on the pitch class circle refer to theWrst tone in a tritone pair. Percentages of “falling” responses are plottedfor each pair; concentric circles represent increments of 20%. Thehighest percentages are centered on pitch class B, which thus is theSHPC in this example. A more precise, continuously varying measureof the SHPC can be obtained by calculating the radial angle of theresultant vector of the data points (Fisher, 1993). In this example, thevector (arrow) points almost exactly to B
CC#
D
D#
E
FF#
G
G#
A
A#
B
SHPC
123

Psychological Research
(A and its neighbors) whose strongest partial is below C4.If the strongest partial alone determined perceived pitchheight, then the SHPC of tones with a C4 envelope shouldbe D#, whereas the SHPC of tones with an F#4 envelope(Fig. 1b) should be A. This prediction is not conWrmed bydata, however. In most studies of the tritone paradox, theSHPC has been nearly invariant across tone sets withdiVerent spectral envelopes (e.g., Dawe, Platt, & Welsh1998; Deutsch, 1987, 1991; Deutsch, Kuyper, & Fisher,1987; Giangrande, 1998), and in those studies in whichthe SHPC was found to change along with the envelope(Repp, 1994, 1997), the mean SHPC was not the pitchclass 3 st above the envelope center but rather the one 6 staway. In all studies, moreover, there were substantial indi-vidual diVerences in the SHPC, which Deutsch (1991)attributed to an inXuence of long-term auditory experi-ence, particularly with linguistic pitch patterns, an intrigu-ing hypothesis that has been the subject of a number ofsubsequent studies (Deutsch, 1994; Deutsch, Henthorn, &Dolson 2004; Giangrande, 1998; Ragozzine & Deutsch,1994; Repp, 1994). However, the present research is notconcerned directly with this hypothesis or with the tritoneparadox as such. Rather, our study uses variants of the tri-tone paradox paradigm to investigate whether the percep-tion of OA tones is context dependent, or whether it isinvariant.
The issue we address is of both theoretical and method-ological interest. The tritone paradox rests on perceptualjudgments of relative pitch height within a set of OAtones; these judgments yield an estimate of the SHPC. Onone hand, individual diVerences in SHPC are believed tobe stable because they are attributed to long-term auditoryexperience (Deutsch, 1991). On the other hand, we Wndthat listeners often complain about the ambiguity of tri-tone pairs and feel they could hear them as either rising orfalling at will. Reports of percepts of a simultaneous riseand fall in pitch, evidently caused by relationshipsbetween individual partials of successive tones, are quitecommon (though not well documented in the tritone para-dox literature). These informal observations suggest thatit should be easy to sway listeners’ relative pitch judg-ments through instructions or contextual manipulationsand thereby perhaps also to change their SHPC. Weattempted to do this in Experiment 1 by preceding OA tri-tone pairs with tritone pairs composed of unambiguous(UA) complex tones that clearly instantiated a rising orfalling interval between the same pair of pitch classes.Our expectation was that substantial positive primingwould occur.
One might also ask what the perceived pitch height ofindividual OA tones would be relative to an unambiguousreference, and whether tones corresponding to the SHPCwould be judged as relatively higher than tones from the
opposite side of the pitch class circle. This is an interestingand under-researched topic. Although an OA tone exhibitsoctave ambiguity, all of its partials are not equally likely tocoincide with its dominant perceived pitch(es). One seem-ingly obvious hypothesis is that the strongest partials deter-mine the perceived pitch height of the tones. In otherwords, tones with envelopes centered on C4 and F#4 mightbe expected to be perceived, on average, as being as high asC4 (262 Hz) and F#4 (370 Hz), respectively. However, thatdoes not appear to be the case. Terhardt, Stoll, Schermbach,and Parncutt (1986) obtained evidence that the dominantvirtual pitch (i.e., the most salient of several candidate“fundamental” frequencies) of OA tones tends to be in abroad region around 300 Hz, apparently regardless of theshape of the spectral envelope. Terhardt (1991) proposedthat the SHPC in the tritone paradox is due to an internalspectral weighting function that varies according to individ-uals’ auditory experience, in agreement with Deutsch’s(1991) similar hypothesis (see also Cohen, Grossberg, &Wyse 1995). It could then be argued that certain tones areheard as higher than others because their most stronglyweighted partial is above the center of the weighting func-tion. (Imagine that the spectral envelopes in Fig. 1 representdiVerent internal spectral weighting functions.) Because theweighting function is internal to the listener’s auditory sys-tem, it can account in principle for individual diVerences inSHPC. Terhardt’s hypothesis suggests that it might be pos-sible to assess the SHPC by judging the pitch heights ofindividual OA tones relative to UA tones. However, thisimmediately raises the question of whether the perceivedpitch heights of individual OA tones are contextually sta-ble. They would need to be stable in order to provide a sta-ble estimate of the SHPC. Experiments 2 and 3 investigatedthese questions by using matching tasks and relative pitchjudgment tasks that pitted OA and UA tones against eachother.1
Experiment 1: priming OA tritone pairswith UA tritone pairs
Several previous studies have shown that perceptual judg-ment of a tritone pair composed of OA tones depends notsolely on the pitch classes the pair contains and on the lis-tener but also on preceding context of OA tones. In thestandard tritone paradox paradigm, 12 diVerent tritonepairs occur in various random orders, and it is diYcult todisentangle sequential context eVects from the SHPC-related fact that similar pairs tend to be judged similarly(but see the appendix in Repp, 1994, for one special case).
1 Experiments 1 and 2 had two sub-experiments each. The chronologi-cal sequence of experiments was 1A, 2A, 3, 2B, 1B.
123

Psychological Research
However, when a tritone pair is preceded by an orderlysequence of OA tone pairs that span rising or fallingintervals of steadily increasing magnitude (e.g., C-C#, C-D,C-D#, C-E, C-F, C-F# vs. C-B, C-A#, C-A, C-G#, C-G,C-F#), the tritone C-F# is very likely to be perceived inaccord with the preceding intervals (Giangrande, Tuller,& Kelso, 2002; Repp, 1994). Dawe et al. (1998) foundthat a preceding rising or falling Shepard scale can alsobias perception of tritone pairs. Repp (1997) precededeach tritone pair with a single OA tone whose pitch classwas halfway between the pitch classes of the tritone pair(see also Shepard, 1983). Listeners’ perception of the tri-tone tended to minimize the total pitch range of the triplet(e.g., C-F# tended to be perceived as rising when pre-ceded by D# but as falling when preceded by A). Reppalso found that when single tritone pairs are presented outof context, on separate days, some listeners perceivenearly all pairs as rising or falling, even though they showa balanced response pattern in the standard tritone para-dox paradigm. Thus, a perceptual calibration seems tooccur when OA tritone pairs are presented in randomorder, and this calibration may well be mediated bysequential context eVects.
It is currently not known whether perception of therelative pitch height of OA tones can also be inXuencedby a preceding context of UA tones. Considering theinherent ambiguity of OA tritone pairs, and also consid-ering that in our experience an OA tritone pair is nearlyalways perceived the same way (either as rising or asfalling) when it is repeated, it seems that it should beeasy to prime listeners’ perceptual judgments with dem-onstrations of clearly rising or falling intervals betweenthe same pair of pitch classes. However, several recentstudies of discretely presented visual ambiguous Wgureshave found that, surprisingly, perception of these Wguresis sometimes resistant to priming by similar but disam-biguated Wgures, whereas the percept derived from a pre-ceding ambiguous Wgure tends to persevere (Braun &Pastukhov, 2007; Kanai & Verstraten, 2005; Pearson &CliVord, 2005; Sterzer & Rees, 2008). If this applies toaudition as well, OA tritone pairs might be resistant topriming by UA tritone pairs. The purpose of Experiment1 was to test these predictions. We report two separatestudies, an initial experiment (Experiment 1A) and a fol-low-up experiment with an expanded design (Experi-ment 1B).
Experiment 1A: methods
Participants
Nine graduate students from the Yale School of Music(ages 22–28, 5 women), who were paid for their time, and
both authors (ages 63 and 21, respectively) participated.2
The graduate students played at least one instrument at aprofessional level (3 piano, 3 clarinet, 1 oboe, 1 cello, 1harp). Both authors are active amateur musicians (BHR:piano, JMT: voice).3
Materials
OA tones corresponding to the 12 chromatic pitch clas-ses were synthesized online by a program written inMAX/MSP 4.6.3 according to the speciWcations ofDeutsch et al. (1987). Each tone consisted of six octave-spaced partials whose relative amplitudes were governedby a Wxed cosine envelope centered on C4 (MIDI pitch60, 262 Hz; see Fig. 1a). Twelve tritone pairs were cre-ated by pairing each tone with its exact opposite on thepitch class circle.
Eighteen UA tones were likewise synthesized in MAX/MSP. Each consisted of the Wrst four harmonics of a com-plex tone, all at the same amplitude. This particular spectralstructure was arbitrary but suYcient to ensure an unambig-uous pitch percept corresponding to the fundamental fre-quency (the Wrst harmonic). The tones represented MIDIpitches 46 through 63 (A#2–D#4, 117–311 Hz). This rangewas selected because it encompasses the peak of the spec-tral envelope of the OA tones as well as their presumedrange of dominant pitches, according to Terhardt et al.(1986) and as judged informally by author BHR. Thechoice of a range of 18 st allowed the creation of two UAtritone pairs, one rising and one falling, for each pair ofpitch classes. Rising pairs started on MIDI pitches 46–57and ended on 52–63, whereas falling pairs started on 52–63and ended on 46–57.
Each trial consisted of a UA tritone pair followed by anOA tritone pair representing the same sequence of pitchclasses. Each tone was 500 ms long and of constant ampli-tude, except for 5 ms ramps at onset and oVset to preventclicks. There was a 1 s inter-onset interval between the twotones of each pair, and a 2 s inter-onset interval between thesecond tone of the UA pair and the Wrst tone of the OA pair.The loudness levels of UA and OA tones were not matchedprecisely but roughly similar and comfortable. In the courseof a block of 24 trials, each of the 12 OA pairs was
2 We used musicians as participants because they happened to be read-ily available, being regular research participants in rhythm and timingexperiments in BHR’s lab.3 Although we are not concerned here with eVects of linguistic back-ground, we might mention that the group was very heterogeneous inthat respect: It included native speakers of Cantonese (2), Mandarin(1), Korean (1), German (1), and British English (1), as well as nativespeakers of American or Canadian English with Chinese, Indian, orpartially British parents; only two participants had a purely Americanlinguistic background.
123

Psychological Research
preceded once by a rising and once by a falling UA pair.The order of trials was semi-random. Intertrial intervalswere variable (self-paced).
Equipment and procedure
The experiment was run on an Intel iMac computer, andparticipants listened over Sennheiser HD540 reference IIearphones while interacting with programs written inMAX/MSP. (All subsequent experiments used the sameequipment.) The session lasted about one hour and beganand ended with a brief matching task that is described lateras Experiment 2A. In between, each participant completedeight blocks of trials. Participants started each trial byclicking a button on the computer screen. The trial startedafter a delay of 1 s, and participants could replay it if theywished. Then they gave two responses, one for the UA pairand another for the OA pair, by clicking one of threechoices (“rising,” “falling,” or “not sure”) for each on thecomputer screen. After each block of 24 trials, there was abrief pause during which the data were saved and the nextblock was selected.
Experiment 1A: results
Participants nearly always identiWed the UA interval cor-rectly as rising or falling and never gave a “not sure”response. Only four trials had incorrect responses, probablydue to inattention, and we discarded those. OA pairsreceived a total of 11.4% “not sure” responses, each ofwhich we counted as half a “rising” or “falling” response.We then calculated the percentage of “falling” responsesfor each of the 12 OA pairs when preceded by a falling UAprime and when preceded by a rising UA prime. If positivepriming occurred, the mean percentage should be higher inthe Wrst case than in the second (a positive diVerencescore). An alternative, unpredicted possibility is that ofnegative priming or contrast (a negative diVerence score).
A t test on the individual diVerence scores showed thatthey did not diVer signiWcantly from zero, t(10) = 1.23,P = 0.247 (two-tailed), which suggests that perception ofOA pairs was not aVected by the preceding UA pairs. How-ever, this strong conclusion would be justiWed only if noindividual participant showed any priming. We assessed thesigniWcance of individual priming eVects by conductingt tests on diVerence scores calculated separately for eachblock of trials. Out of 11 participants, 3 (1 pianist and bothauthors)4 showed signiWcant positive priming (2 atP < 0.001, 1 at P < 0.01), 2 (1 pianist, 1 cellist) showed sig-niWcant negative priming (1 at P < 0.01, 1 at P < 0.05), and
6 (1 pianist, 3 clarinetists, 1 oboist, 1 harpist) showed noreliable eVects, though the pianist showed a tendencytowards positive priming. Curiously, all four wind instru-ment players were unaVected by the primes.
The foregoing results concern only the overall responsepercentages and do not prove that the speciWc pattern ofresponses across the 12 tritone pairs, from which the SHPCcan be inferred, was unaVected by the primes. Radial graphsof individual percentages of “falling” responses as well asthe mean percentages for rising and falling primes are shownin Fig. 3. The three participants who exhibited signiWcantpositive priming and the one with a mere tendency (Pi2) arein the left column; the two participants showing signiWcantnegative priming are above the horizontal line in the centercolumn; and the remaining participants are the ones whoshowed no eVects. Apart from the individual diVerences inpriming eVects, which are evident in diVerent-sized areasbeing enclosed by the two radial response functions, a vari-ety of orientations of the response functions can be seen.5
Each participant gave more “falling” responses to some OApairs than to others, but these response patterns diVeredamong participants, as is typically found in the tritone para-dox. However, all Wve participants who were immune to OAcontext also showed similar response patterns, even thoughthey had diVerent language backgrounds (Mandarin,Korean, British, American).
In those participants who showed priming, the orienta-tion of the response pattern in the pitch class circle was notchanged much by diVerent contexts. To quantify the eVectof UA context on the SHPC for each participant, the angleof the resultant vector of the response percentages (seeFig. 2) was calculated for each context condition and con-verted into semitones relative to C (analogous to clock timein hours). These results are shown in columns 2 and 3 ofTable 1. The largest individual shift as a function of UAcontext was 1.54 st (Pi2), and 9 of 11 participants showedshifts of less than 1 st. The shift in the mean SHPC was0.16 st, and the linear correlation between the individualresultant vector angles in the two priming contexts was0.97. Thus, the SHPC was basically unaVected by diVerentprimes.
Because the axis labels in Fig. 3 represent the Wrst pitchclass in the OA pair, the SHPC of each participant is at thecenter of the peak region of “falling” responses. This pitchclass (or pair of pitch classes, in the case of a near tie) isalso indicated for each participant in Table 1. On average, it
4 Both authors also had shown positive priming in an earlier pilot run.
5 One participant (JMT) gave predominantly “falling” responses,whereas two (Ce, Cl1) gave predominantly “rising” responses. Suchstrong biases towards one or another response are rarely found in thetritone paradox. By intervening between successive OA pairs, the UApairs may have reduced sequential context eVects among OA pairs andthereby disrupted the perceptual calibration that usually occurs duringexposure to a set of OA tones.
123

Psychological Research
was G and/or G#, a pattern shared by the Wve participantswho showed no priming eVect and also by one (JMT) whoshowed positive priming. The remaining participants haddiVerent SHPCs. There is no obvious explanation for theseindividual diVerences in terms of the participants’ languagebackgrounds.6
Experiment 1B: rationale
The surprising result of immunity to priming in a number ofparticipants and the somewhat limited design of Experiment1A led us to conduct a second experiment with an expandeddesign, one change in method, and partially diVerent partici-pants. First, Experiment 1B included a no-context baselinecondition, because it could be that UA primes, regardless ofwhether they are rising or falling, change the SHPC relativeto the standard tritone paradox condition in which OA pairsfollow immediately upon each other. Second, we employed
Fig. 3 Experiment 1A: percentages of “falling” responses to individual OA tritone probe pairs when preceded by rising and falling UA primes, for 11 individual participants and the mean. Pitch class labels refer to the Wrst tone in tritone pairs. Radial axes go from 0 to 100% in 20% steps. Participants are identiWed by their instrument (Pi piano, Ce cello, Cl clarinet, Ob oboe, Ha harp), the authors by initials (BHR, JMT)
CC#
D
D#
E
FF#
G
G#
A
A#
B
rising prime falling prime
CC#
D
D#
E
FF#
G
G#
A
A#
B
CC#
D
D#
E
FF#
G
G#
A
A#
B
CC#
D
D#
E
FF#
G
G#
A
A#
B
CC#
D
D#
E
FF#
G
G#
A
A#
B
CC#
D
D#
E
FF#
G
G#
A
A#
B
CC#
D
D#
E
FF#
G
G#
A
A#
B
CC#
D
D#
E
FF#
G
G#
A
A#
B
MEAN
CC#
D
D#
E
FF#
G
G#
A
A#
B
CC#
D
D#
E
FF#
G
G#
A
A#
B
CC#
D
D#
E
FF#
G
G#
A
A#
B
CC#
D
D#
E
FF#
G
G#
A
A#
B
Pi1
JMT
BHR
Pi2
Ce
Pi3
Cl1
Ob
Cl2
Ha
Cl3
6 Although only one participant (Cl2) was a native speaker of BritishEnglish, the average pattern curiously resembles that found previouslywith Southern British listeners (Deutsch, 1991) and also with a linguis-tically heterogeneous group of students in Canada (Dawe et al., 1998).
123

Psychological Research
two diVerent sets of OA tones with diVerent spectral enve-lopes. This gave us an opportunity to re-investigate theeVect of envelope center on the SHPC, a contentious issue inthe past, and also to examine whether priming diVers acrossenvelope sets. Third, we used two diVerent pitch ranges ofUA tones as primes because it could be that the UA primesin Experiment 1A were ineVective because they were notwell matched to the dominant pitches of the OA tones. Also,UA pitch range might have an eVect on the SHPC of OAtones, which would be interesting to know. Finally, wechanged the kinds of responses given by participants:instead of judging both UA and OA tone pairs as rising orfalling, they judged whether the two pairs represented pitchchanges in the same direction or in diVerent directions. Thismade the purpose of the experiment less transparent, andbecause we could be conWdent that the UA tone pair wouldbe perceived as intended we could infer from the responseshow the OA pair was perceived.
Experiment 1B: methods
Participants
Five participants (Pi3, Cl2, Ha, BHR, JMT) were the sameas in Experiment 1A. Five additional paid musicians partic-ipated, including 1 pianist/composer, 1 violinist, 1 violist, 1double bassist, and 1 bassoonist. Altogether there were 6women and 4 men, and ages ranged from 22 to 29, exceptfor BHR who was 64.7
Materials
We synthesized two sets of OA tones, with envelopes cen-tered on C4 (as in Experiment 1A) and F#4, respectively(as shown in Fig. 1), and two sets of UA tones, one withMIDI pitches ranging from 46 to 63 (low range; as inExperiment 1A) and the other with pitches ranging from 52to 69 (high range). The two ranges thus represented a rela-tive shift of 6 st, just like the two envelope centers. Each setof OA tones was combined with each set of UA primes,which yielded four conditions. Conditions in which OAtones with the same envelope were combined with UAprimes from diVerent ranges shared half their UA–OA pairs(6 with rising primes, 6 with falling primes), whereas theother half of the pairs had UA primes that were an octavehigher in the high range than in the low range.
Procedure
Participants came for two sessions on diVerent days. Ineach session, envelope was constant; some participantswere assigned the C4 envelope in the Wrst session, othersthe F#4 envelope. Each session had three parts: a baselinecondition (no primes) followed by two priming conditions(low and high ranges of UA primes). The order of the twopriming conditions was counterbalanced across partici-pants. In each condition, participants listened to 6 blocks of24 trials each. The semi-random order of the trials was thesame in all six conditions, to rule out any diVerences due tosequential eVects among the OA tone pairs. The timing ofthe tones within each trial was the same as in Experiment1A. In the baseline condition, the timing of OA pairs was
7 Linguistic backgrounds were now as follows: Mandarin (2), Canton-ese (1), Korean (1), German (1), British (2), American (3).
Table 1 Individual results from three experiments
Columns 2–4: mean resultant angle of radial response graphs (Figs. 3, 6) converted into semitone distance from C, and nearest pitch class(es) (PC).Column 5: mean MIDI pitch of all matches and nearest musical pitch(es). Columns 6 and 7: MIDI pitch (rounded) and musical pitch of 50% cross-over of individual response functions (Fig. 9)
Ptcpt Experiment 1A Experiment 2A Experiment 3
Rising prime Falling prime Highest PC Mean pitch Low range High range
Pi1 0.27 (C) ¡0.24 (C) 7.19 (G) 55.9 (G#3) 51 (D#3) 54 (F#3)
JMT 7.83 (G#) 7.42 (G/G#) 2.76 (D#) 58.3 (A#3) 57 (A3) 60 (C4)
BHR 9.53 (A/A#) 9.12 (A) 10.85 (B) 51.6 (D#3/E3) 54 (F#3) 57 (A3)
Pi2 1.95 (D) 3.49 (D#/E) ¡1.68 (A#) 56.6 (G#3/A3) 56 (G#3) 58 (A#3)
Ce 4.09 (E) 2.78 (D#) 3.82 (E) 60.0 (C4) 58 (A#3) 64 (E4)
Pi3 5.56 (F/F#) 5.98 (F#) 8.09 (G#) 56.9 (A3) 51 (D#3) 59 (B3)
Cl1 8.52 (G#/A) 8.35 (G#) 11.26 (B) 52.8 (F3) – 65 (F4)
Ob 7.37 (G) 7.51 (G/G#) 3.91 (E) 55.8 (G#3) 54 (F#3) 55 (G3)
Cl2 6.73 (G) 6.93 (G) 7.81 (G#) 58.0 (A#3) – 65 (F4)
Ha 7.44 (G/G#) 7.27 (G) 6.69 (G) 59.0 (B3) – 65 (F4)
Cl3 6.54 (G) 7.05 (G) 11.67 (C) 47.5 (B2/C3) – 64 (E4)
Mean 7.26 (G) 7.42 (G/G#) 8.29 (G#) 56.1 (G#3)
123

Psychological Research
approximately the same as in the priming conditions; thatis, there was silence instead of a UA prime, though trialswere self-paced. Participants chose from the responses“rising,” “falling,” and “not sure” in the baseline condition.In the priming conditions, participants chose from theresponses “same,” “diVerent,” and “not sure,” whichreferred to the directions of the UA and OA tritone intervalsin a trial.
Experiment 1B: results
The mean percentage of “not sure” responses across allconditions was 11.9%.8 The percentage was larger (16.6%)for OA tones with the C4 envelope than for those with theF#4 envelope (7.2%), t(9) = 2.40, P = 0.040. There werelarge individual diVerences, ranging from hardly any “notsure” responses to nearly 50%. We again counted each suchresponse as half a “falling” response.
Percentages of implicit “falling” responses to OA tonepairs in the priming conditions were obtained by consider-ing “same” responses when the UA prime was falling but“diVerent” responses when the UA prime was rising. Herethe results of author BHR presented an unexpected anom-aly: although he again showed positive priming, as inExperiment 1A, he perceived the OA pairs with the C4envelope almost always as rising in both priming condi-tions, though not in the baseline condition. Because noother participant showed any similar pattern, it seemed pru-dent to exclude BHR’s data from further analyses. Thecause of the radical diVerence in his responses compared tothe identical stimuli in Experiment 1A (Fig. 3) remainsunclear.
A repeated measures ANOVA with the variables ofenvelope (C4, F#4), prime direction (rising, falling), andUA pitch range (high, low) was conducted on the overallpercentages of “falling” responses in the priming condi-tions. There was only one eVect that approached signiW-cance, namely the main eVect of prime direction,F(1,8) = 5.19, P = 0.052. It reXected a weak overall ten-dency toward positive priming. We did not conduct signiW-cance tests on individual data in this experiment. Clearly,only some participants showed positive priming; othersshowed hardly any priming or even a negative tendency.
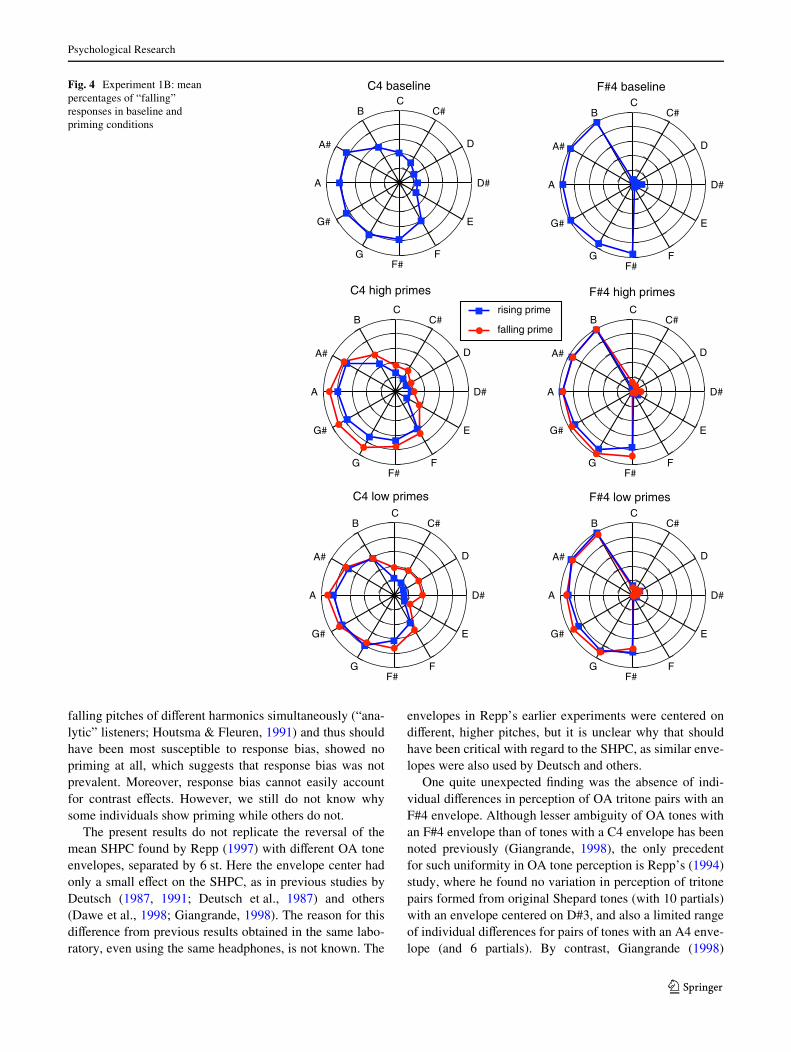
The average response patterns in all conditions, includ-ing the baselines, are shown in Fig. 4. First, it can be seenthat the overall positive priming eVect was small and morepronounced with the C4 envelope than with the F#4 enve-lope, though that interaction was not signiWcant. Second, asthe ANOVA suggested, there was no eVect of UA pitchrange on priming. Third, it is evident that there was little
change in response pattern between baseline and primingconditions, apart from BHR’s excluded results. This meansthe SHPC was not aVected by priming or the presence ofpriming stimuli.
Two further results do not concern priming but the eVectof envelope on the response distributions. First, it is evidentthat there was greater response uncertainty with the C4envelope than with the F#4 envelope. Indeed, the meanresults obtained with the F#4 envelope are nearly categori-cal, with half the OA pairs being judged as falling and theother half as rising. This means that individual diVerencesin tritone perception were minimal with the F#4 envelope;all participants basically had the same SHPC. Second, theSHPCs suggested by the response patterns for the twoenvelopes are similar, the diVerence being about 1 st. Theresponse pattern obtained with the C4 envelope is very sim-ilar to that of Experiment 1A, suggesting mean SHPCs ofG#/G, whereas the response pattern for the F#4 envelopesuggests SHPCs of A/G#. We did not conduct detailedanalyses of individual SHPCs in this experiment becausethe foregoing qualitative observations suYce for our pur-pose.
Discussion
Contrary to what one might have expected given the theo-retical ambiguity of all OA tritone pairs and the manifestambiguity of at least some pairs for some listeners, OA tri-tone perception was not easily swayed by UA primes. Onlysome participants exhibited a positive priming eVect,whereas others showed no eVect or even a contrast eVect.This result suggests that perception of the relative pitchheight of OA tones is governed to a large extent by internalperceptual criteria that are resistant to contextual bias, con-sistent with the claim that the SHPC is determined primar-ily by long-term auditory experience (Deutsch, 1991;Terhardt, 1991). The Wnding also seems consistent withresults from vision research showing little or no priming ofambiguous Wgures by unambiguous Wgures under certainconditions (Braun & Pastukhov, 2007; Kanai & Verstraten,2005; Pearson & CliVord, 2005; Sterzer & Rees, 2008). It ispossible that in audition, too, percepts derived from ambig-uous and unambiguous stimuli are processed in diVerentneural circuits. However, the fact that some individual par-ticipants did show substantial priming eVects weakens thisparallel.
The observed individual priming eVects were most likelyperceptual, not just a response bias. For example, authorBHR hardly ever perceived any ambiguity in OA pairs,being a strongly “synthetic” listener (cf. Houtsma &Fleuren, 1991), yet showed reliable positive priming.Among other participants, some of those with high percent-ages of “not sure” responses, who often heard rising and
8 A few responses that failed to register were also treated as “not sure”responses.
123
Psychological Research
falling pitches of diVerent harmonics simultaneously (“ana-lytic” listeners; Houtsma & Fleuren, 1991) and thus shouldhave been most susceptible to response bias, showed nopriming at all, which suggests that response bias was notprevalent. Moreover, response bias cannot easily accountfor contrast eVects. However, we still do not know whysome individuals show priming while others do not.
The present results do not replicate the reversal of themean SHPC found by Repp (1997) with diVerent OA toneenvelopes, separated by 6 st. Here the envelope center hadonly a small eVect on the SHPC, as in previous studies byDeutsch (1987, 1991; Deutsch et al., 1987) and others(Dawe et al., 1998; Giangrande, 1998). The reason for thisdiVerence from previous results obtained in the same labo-ratory, even using the same headphones, is not known. The
envelopes in Repp’s earlier experiments were centered ondiVerent, higher pitches, but it is unclear why that shouldhave been critical with regard to the SHPC, as similar enve-lopes were also used by Deutsch and others.
One quite unexpected Wnding was the absence of indi-vidual diVerences in perception of OA tritone pairs with anF#4 envelope. Although lesser ambiguity of OA tones withan F#4 envelope than of tones with a C4 envelope has beennoted previously (Giangrande, 1998), the only precedentfor such uniformity in OA tone perception is Repp’s (1994)study, where he found no variation in perception of tritonepairs formed from original Shepard tones (with 10 partials)with an envelope centered on D#3, and also a limited rangeof individual diVerences for pairs of tones with an A4 enve-lope (and 6 partials). By contrast, Giangrande (1998)
Fig. 4 Experiment 1B: mean percentages of “falling” responses in baseline and priming conditions
CC#
D
D#
E
FF#
G
G#
A
A#
B
CC#
D
D#
E
FF#
G
G#
A
A#
Brising prime
falling prime
CC#
D
D#
E
FF#
G
G#
A
A#
B
CC#
D
D#
E
FF#
G
G#
A
A#
B
CC#
D
D#
E
FF#
G
G#
A
A#
B
CC#
D
D#
E
FF#
G
G#
A
A#
B
C4 baseline
C4 high primes
C4 low primes
F#4 baseline
F#4 high primes
F#4 low primes
123

Psychological Research
reported SHPC distributions for tones generated under fourdiVerent envelopes that show substantial individual diVer-ences with F#4 and F#5 envelopes, though even greaterdiVerences with C4 and C5 envelopes. Moreover, in thatstudy the most frequent SHPCs with the F#4 envelope wereC and C#, whereas in the present study the mean SHPCswere G#/A, a diVerence of 4 st. The present results are sim-ilar to those reported for native speakers of Southern BritishEnglish (Deutsch, 1991), although only one participantbelonged to that group. Thus, there are still many unsolvedpuzzles in connection with the tritone paradox.
Experiment 2: matching OA tones with UA tones
The main result of Experiment 1 is that the perceived rela-tive pitch height of OA tones in tritone pairs is fairly resis-tant to bias by a context of UA primes. What could providethe internal criteria on which the context independent per-ceptual judgment of OA tritone pairs is based? One possi-bility is that a SHPC is speciWed abstractly, based perhapson language experience (Deutsch, 1991; Deutsch,Henthorn, & Dolson, 2004)—a form of implicit absolutepitch. Judgments would then be made based on the pitchclasses of the OA tones relative to the internally repre-sented SHPC, and it would not be necessary that individualOA tones actually diVer in perceived pitch height. In otherwords, tones might only seem to be judged as being diVer-ent in height when in fact they are perceived to be equallyhigh and are judged based on pitch class. This is essentiallythe view associated with Diana Deutsch. An alternativepossibility is that individual OA tones do diVer in perceivedheight, despite their Wxed spectral envelope. A possiblemechanism for this is the internal spectral weighting func-tion proposed by Terhardt (1991) and also by Cohen et al.(1995): if the weighting function peaks in a certain fre-quency region, and if the spectral component with thestrongest weight is most likely to be perceived as the domi-nant virtual pitch, then OA tones having their strongest par-tial above the peak of the weighting function will tend to beheard as higher than OA tones that have their strongest par-tial below the peak. If that were the case, and if the internalweighting function is contextually stable, it might be possi-ble to assess the SHPC by determining the perceived pitchheight of individual OA tones against a UA pitch reference.Experiments 2 and 3 explored this possibility.
Ragozzine (2001) conducted an experiment in which hepresented single OA tones and asked participants to judgewhether they were the Wrst tone of a potentially rising orfalling tritone pair. Participants could do this, but only ifthey had previously been exposed to a series of OA tritonepairs. However, this is not exactly what we are afterbecause the judgments basically still concerned relative
pitch height of OA tones (i.e., relative to a memory refer-ence of pitch range or average pitch height derived fromexposure to a set of OA tones) and resembled judgments ofcomplete OA tritone pairs.
The only study we know in which individual OA toneswere compared with UA tones was conducted by Terhardtet al. (1986). They asked participants to adjust a pure-toneoscillator to the frequency that corresponded to the per-ceived dominant virtual pitch of OA tones. The tones hadeight octave-spaced partials and rectangular or sloping(equal loudness) spectral envelopes, unlike typical Shepardtones. Across a number of participants and repetitions, eachtone elicited pure-tone matches in several octaves, but notwith equal likelihood: the overall distribution of matchespeaked in the vicinity of 300 Hz, regardless of envelope.This result was also predicted approximately by a model ofpitch perception that derives several virtual pitches ofdiVerent salience from the spectrum of any complex tone(Terhardt, Stoll, & Seewann, 1982a, b). Terhardt (1991)used these modeling results to explain the SHPC in the tri-tone paradox, as described in “Introduction” (see alsoCohen et al., 1995).
The method of matching pure tones to perceived virtualpitches has the potential drawback of drawing undue atten-tion to individual partials of the OA tones (spectral pitches,in Terhardt’s terminology). Although Terhardt et al. (1986)instructed participants to match virtual, not spectral pitches,the distinction becomes unclear if analytic listening isencouraged by the paradigm. In a pure tone, there is no dis-tinction between spectral and virtual pitch. Therefore, wechose instead to ask participants to match the virtual pitchof UA complex harmonic tones (corresponding to their fun-damental frequency) to the perceived dominant virtualpitch of OA tones. Complex harmonic tones tend to be per-ceived synthetically, so that the physical match of their fun-damental frequency with one of the partials of the OA tonesshould be less obvious. We also thought that OA tones withbell-shaped spectral envelopes might have a narrowerregion of salient virtual pitches than the broad-envelopeOA tones investigated by Terhardt et al. (1986).
We conducted two matching experiments. In Experi-ment 2A, we were interested primarily in conWrming thedistribution of pitch matches reported by Terhardt et al.(1986). However, we also wondered whether the results ofthe matching task would reveal diVerences in perceivedpitch height among individual OA tones that correspond tothe SHPCs found for the same participants in Experiment1A. If a signiWcant relationship were found, the pitchmatching task might constitute a possible alternativemethod to the standard tritone paradox paradigm for assess-ing individual diVerences in SHPC.
In Experiment 2B, we used a modiWed matching proce-dure and compared results for two sets of OA tones with
123
Psychological Research
diVerent spectral envelopes. Terhardt et al. (1986) did notWnd any eVects of spectral envelope, which could be takento suggest that the dominant pitch of OA tones dependsentirely on an internal weighting function and not on thephysical structure of the sound. However, that cannot liter-ally be true, and Terhardt et al. did not vary the envelopecenter while keeping the envelope shape invariant. It seemsmore likely that perception of pitch height would dependboth on sound structure and internal weighting. A hypothe-sis based only on spectral sound structure would predictthat OA tones with an F#4 envelope should be perceived as6 st higher than tones with a C4 envelope.
Experiment 2A: methods
Participants
The participants were the same as in Experiment 1A.
Materials
The OA (with C4 envelope) and UA tones were the same asin Experiment 1A, but the pitch range of UA tones waswider, extending from C2 (65 Hz, MIDI pitch 36) to B5(988 Hz, MIDI pitch 83).
Procedure
Experiment 2A was performed at the beginning of the ses-sion of Experiment 1A and repeated at the end of the ses-sion. The computer screen showed a small four-octavepiano keyboard template on which UA tones could beplayed by clicking on the keys. A single OA tone could beplayed by clicking on a separate button. Participants werepresented with the 12 OA tones one by one, in randomorder. For each tone, they were asked to Wnd the best matchamong the UA tones of the same pitch class. They couldplay the OA tone and the four possible UA comparisontones as often as they wished. Once they had selected a bestmatch, they answered two additional questions on thescreen: whether any other tone matched equally well (towhich they could answer yes, perhaps, or no), and whetherthat other tone was one octave higher or lower than the cho-sen tone.
Experiment 2A: results
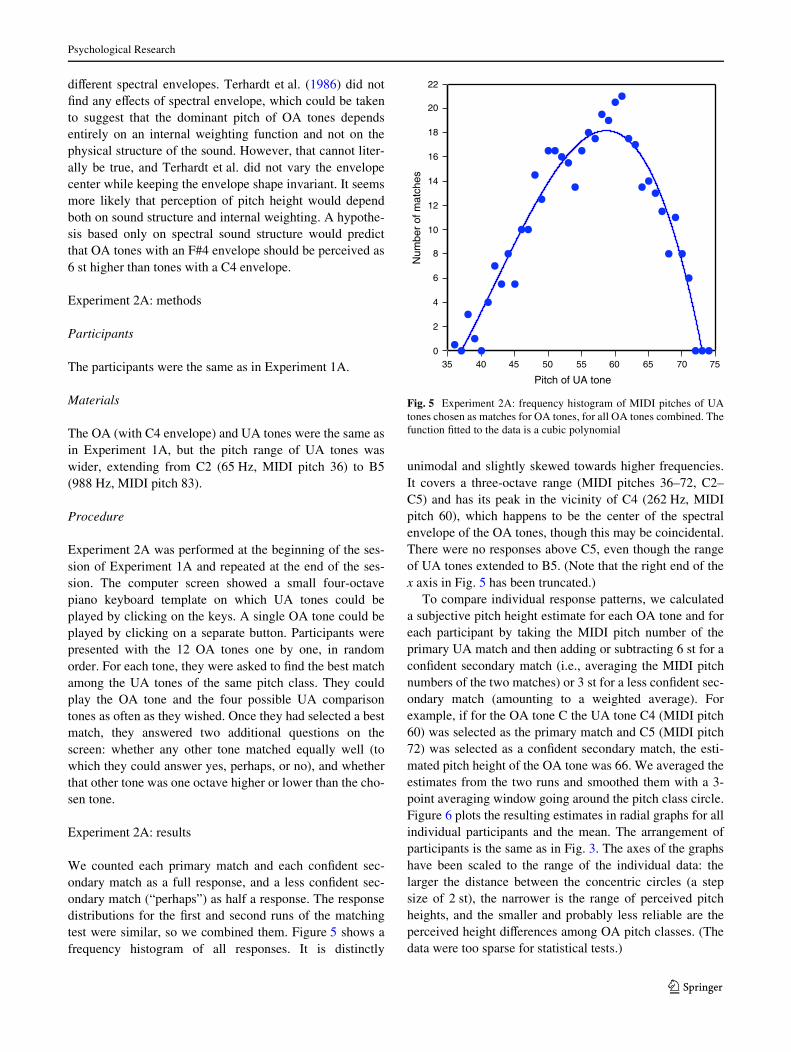
We counted each primary match and each conWdent sec-ondary match as a full response, and a less conWdent sec-ondary match (“perhaps”) as half a response. The responsedistributions for the Wrst and second runs of the matchingtest were similar, so we combined them. Figure 5 shows afrequency histogram of all responses. It is distinctly
unimodal and slightly skewed towards higher frequencies.It covers a three-octave range (MIDI pitches 36–72, C2–C5) and has its peak in the vicinity of C4 (262 Hz, MIDIpitch 60), which happens to be the center of the spectralenvelope of the OA tones, though this may be coincidental.There were no responses above C5, even though the rangeof UA tones extended to B5. (Note that the right end of thex axis in Fig. 5 has been truncated.)
To compare individual response patterns, we calculateda subjective pitch height estimate for each OA tone and foreach participant by taking the MIDI pitch number of theprimary UA match and then adding or subtracting 6 st for aconWdent secondary match (i.e., averaging the MIDI pitchnumbers of the two matches) or 3 st for a less conWdent sec-ondary match (amounting to a weighted average). Forexample, if for the OA tone C the UA tone C4 (MIDI pitch60) was selected as the primary match and C5 (MIDI pitch72) was selected as a conWdent secondary match, the esti-mated pitch height of the OA tone was 66. We averaged theestimates from the two runs and smoothed them with a 3-point averaging window going around the pitch class circle.Figure 6 plots the resulting estimates in radial graphs for allindividual participants and the mean. The arrangement ofparticipants is the same as in Fig. 3. The axes of the graphshave been scaled to the range of the individual data: thelarger the distance between the concentric circles (a stepsize of 2 st), the narrower is the range of perceived pitchheights, and the smaller and probably less reliable are theperceived height diVerences among OA pitch classes. (Thedata were too sparse for statistical tests.)
Fig. 5 Experiment 2A: frequency histogram of MIDI pitches of UAtones chosen as matches for OA tones, for all OA tones combined. Thefunction Wtted to the data is a cubic polynomial
0
2
4
6
8
10
12
14
16
18
20
22
35 40 45 50 55 60 65 70 75
Num
ber
of m
atch
es
Pitch of UA tone
123

Psychological Research
The mean estimates show a tendency for pitch classes G,G#, and A to be subjectively higher than the others, whichis consistent with the mean SHPC in Experiment 1A(Fig. 3); the mean resultant vector angles in the two experi-ments diVer only by about 1 st. However, the trend is quitesmall, amounting to a mean diVerence in subjective pitchheight of only about 1 st between subjectively high and lowOA tones. Moreover, there is little agreement betweenexperiments at the individual level, as can be seen inTable 1 (column 4). Only a few of the individual SHPCs(for BHR, Ce, Cl2, Ha) resemble those in Experiment 1,with a diVerence of less than 2 st. Other SHPCs are radi-cally diVerent, even in the case of individuals whose pitch
matches cover a wide range and thus are presumably morereliable than others (Pi3, Cl3).
The mean of each participant’s pitch height estimates isalso shown in Table 1 (column 5). The means range from47.5 (B2/C3) to 60 (C4), with a grand mean of 56.1 (G#3).Thus, there were individual diVerences in the mean absoluteperceived pitch height of the OA tones, but these diVerencesbear no obvious relation to the results of Experiment 1A.
To our surprise, several participants mentioned that theywished they had been able to select as their secondarychoice a UA tone two octaves higher or lower than the pri-mary choice (skipping the tone in the octave in between).This observation motivated Experiment 2B.
Fig. 6 Experiment 2A: mean subjective pitch height estimates of OA tones derived from the matching task, for 11 individual participants and the mean (labels and arrangement as in Fig. 3). The radial axes of each graph are scaled to the range of the data; the step size is 2 st. Pitch class labels refer to individual OA tones
CC#
D
D#
E
FF#
G
G#
A
A#
BPi1C
C#
D
D#
E
FF#
G
G#
A
A#
BCeC
C#
D
D#
E
FF#
G
G#
A
A#
BOb
CC#
D
D#
E
FF#
G
G#
A
A#
BJMTC
C#
D
D#
E
FF#
G
G#
A
A#
BPi3C
C#
D
D#
E
FF#
G
G#
A
A#
BCl2
CC#
D
D#
E
FF#
G
G#
A
A#
BBHRC
C#
D
D#
E
FF#
G
G#
A
A#
BCl1C
C#
D
D#
E
FF#
G
G#
A
A#
BHa
CC#
D
D#
E
FF#
G
G#
A
A#
BPi2C
C#
D
D#
E
FF#
G
G#
A
A#
B
CC#
D
D#
E
FF#
G
G#
A
A#
B
MEAN Cl3
123

Psychological Research
Experiment 2B: methods
Participants
The participants in Experiment 2B were the same as inExperiment 1B plus one additional musician, a violinist.
Materials
Experiment 2B used two sets of OA tones, with spectralenvelopes centered on C4 and F#4 respectively, as inExperiment 1B. UA tones ranged from C1 (33 Hz, MIDIpitch 24) to B5 (988 Hz, MIDI pitch 83).
Procedure
Experiment 2B was performed at the beginning and end ofan experimental session that was unrelated to the presentstudy and did not use similar materials. One run used theOA tones with the C4 envelope, and the other run used thetones with the F#4 envelope, with the order counterbal-anced across participants. As in Experiment 2A, the OAtones were presented singly in random order and could belistened to repeatedly by clicking a button. For each OAtone there were Wve UA comparison tones from diVerentoctaves, which could be played repeatedly by clicking onWve buttons. The task was to assign each comparison tone arating between 1 and 5 that reXected how well it matchedthe perceived dominant pitch of the OA tone. It was permit-ted to give the same rating to more than one comparisontone.
Experiment 2B: results
Some participants indeed gave ratings in this experimentindicating that UA tones two octaves apart matched an OAtone better than did the UA tone in the octave in between.However, the surprising main result of this experimenteradicates any concern with detailed response patterns. Foreach OA tone and each participant, we calculated aweighted mean subjective pitch height from the MIDI pitchnumbers of the Wve UA comparison tones, using the ratingsas weights. These data are plotted in Fig. 7 as a function ofOA pitch class.
The data are plotted on a linear (semitone) rather than acircular scale because, remarkably and quite unexpectedly,the subjective pitch height of OA tones increased steeplyand linearly from C to B, F(11,110) = 52.53, P < 0.001.This eVect was shown by all participants and was clearlyrelated to the fact that the mean pitch of the Wve UA com-parison tones in the test increased linearly from C to B.Although the choice of C as the lowest pitch class was arbi-trary, the pitches of the Wve UA comparison tones necessar-
ily had to increase with the pitch class of the OA tone. Themean increase in judged pitch height from C to B was about8 st, compared to an increase of 11 st in the mean pitchheight of UA comparison tones. The range of mean pitchheights (roughly, MIDI pitches 50–60, or D3–C4) isslightly below the peak of the response distribution inExperiment 2A but basically consistent with it.
In addition, Fig. 7 shows that the spectral envelope ofthe OA tones had but a small eVect on judged pitch height:OA tones with an F#4 envelope were perceived as beingonly about 1 st higher than OA tones with a C4 envelope.This eVect was signiWcant, F(1,10) = 9.64, P = 0.011, anddid not interact with pitch class.
Because of the unexpected strong dependency of thesubjective pitch height of OA tones on the mean pitchheight of the UA comparison tones, it was not possible toinfer any SHPC from these data.
Discussion
The overall distribution of pitch matches in Experiment 2A,with its mode near 260 Hz, is consistent with, thoughslightly lower than, the distribution obtained by Terhardtet al. (1986). Although it might be argued that this distribu-tion simply reXects the spectral energy in tones with a C4envelope, it should be remembered that Terhardt et al.found no systematic eVect of varying the spectral envelope.Also, the results of Experiment 2B suggest that a 6-st shiftin spectral envelope has only a small (1-st) eVect on thesubjective pitch height of OA tones. This result is consis-tent with the hypothesis that the dominant virtual pitch is
Fig. 7 Experiment 2B: mean subjective pitch heights (weighted meanof MIDI pitches of UA comparison tones) of OA tones with two diVer-ent spectral envelope centers (C4 and F#4)
C C# D D# E F F# G G# A A# B48
50
52
54
56
58
60
62
Wei
ghte
d m
ean
MID
I pitc
h of
UA
tone
s
Pitch class of OA tone
C4 envelope
F#4 envelope
123

Psychological Research
determined primarily by an internal spectral weightingfunction, not by the objective spectral height of the tones. Itis well known that the dominant virtual pitch of a harmoniccomplex tone, which usually corresponds to the fundamen-tal frequency, can still be perceived when the sound isband-pass Wltered so that only several higher harmonicsremain (e.g., Schouten, Ritsma, & Cardozo, 1962). Also,tones with a higher spectrum (brighter timbre) can be per-ceived as having a lower pitch than sounds with a lowerspectrum (Seither-Preisler et al., 2007). Similarly, the dom-inant virtual pitch of OA tones need not reXect the spectralenergy distribution directly.
The response distribution in Experiment 2A, whichranges roughly from 60 to 500 Hz, is narrower than thatfound by Terhardt et al. (1986), which ranged from 125 to2,000 Hz. This may be due in part to the convex spectralenvelope of our OA tones, which concentrated spectralenergy in a narrower region (assuming that gross character-istics of the spectral envelope do have some impact on pitchheight judgments). In addition, the pure comparison tonesof Terhardt et al. may have encouraged matches to individ-ual partials (spectral pitches), despite instructions to focusattention on virtual pitches. Our method of using complexharmonic comparison tones may have been more successfulin restricting matches to the virtual pitches of the OAtones.9
Even though Experiments 2A and 2B diVered by only aminor change in procedure, their results were radicallydiVerent. In Experiment 2A, participants played compari-son UA tones by clicking on a horizontal miniature key-board, whereas in Experiment 2B they played them byclicking on vertically arrayed buttons, which seemsunlikely as a cause of the diVerence in results. In bothexperiments, the mean pitch height of the available compar-ison tones increased from C to B, and participants couldplay both OA and UA tones as often as they liked. The cru-cial diVerence may have been that in Experiment 2A partic-ipants were not obliged to listen to all UA comparisontones; they could select a best match by just focusing on themost likely candidate(s) and ignoring other choices. InExperiment 2B, however, they had to listen to each tone atleast once in order to give it a rating (at least they had beeninstructed to do so), and perhaps they did listen to each UAtone just once, whereas in Experiment 2A they may haveplayed the preferred UA candidate tones repeatedly. What-ever the case may have been, a small diVerence in proce-
dure brought about a strong context dependency of thesubjective pitch height of the OA tones. It could also beargued that participants in Experiment 2B were simply lazyand gave the same ratings to the Wve comparison tones foreach OA tone. However, in that case the subjective pitchheight of the OA tones should have increased by 11 st fromC to B, whereas in fact it increased only by 8 st. Thus, thepitch range of the UA comparison tones was not the onlydeterminant of participants’ ratings, though it was thestrongest one.
One motivation for these matching experiments was toWnd out whether judgments of the subjective pitch height ofOA tones could be used to infer a SHPC. In that respect,both experiments were unsuccessful. Experiment 2Ayielded individual diVerences in response patterns, but fewparticipants showed suYciently large diVerences in subjec-tive pitch height among OA tones, and the individual diVer-ences were unrelated to those observed in Experiment 1A.Experiment 2B, of course, failed completely in this regardbecause all participants showed similarly large contexteVects and no other systematic diVerences among OAtones. It seems that matching tasks are either not sensitiveenough or are in principle unsuited for the assessment ofSHPCs. Perhaps SHPCs are indeed an emergent property ofpitch-class-based judgments of OA tritone pairs and not aconsequence of diVerences in subjective pitch heightamong single OA tones. Before concluding this, however,we made another attempt to assess SHPCs by juxtaposingUA and OA tones in a diVerent way.
Experiment 3: judging “mixed” tritone pairs
In Experiment 3, instead of asking participants to matchUA and OA tones of the same pitch class, we paired UAand OA tones whose pitch classes were separated by a tri-tone—a “mixed pairs” version of the tritone paradox para-digm. We thought that judging the relative pitch height ofUA and OA tones of diVerent pitch classes might be easierthan direct comparisons of UA and OA tones of the samepitch class and might yield more consistent informationabout the dominant pitches participants perceive in the OAtones. If OA tones (ordered here by ascending pitch classfor the sake of argument but randomly ordered in the actualexperiment) are paired with increasingly higher UA tones(e.g., C-F#3, C#-G3, D-G#3,…, C-F#4, C#-G4,…), then atsome point there should be a more or less abrupt transitionfrom “OA > UA” (OA tone higher than UA tone) to“OA < UA” (OA tone lower than UA tone) judgments.This transition should occur about 3 st below the SHPC,keeping in mind that the OA pitch class continuum is circu-lar whereas the UA pitch continuum is linear. (EVectively,in pairing OA with UA tones we are rolling the OA pitch
9 It could also be argued that we did not give participants an opportu-nity to report high-frequency matches because the fundamental fre-quency range of our comparison tones extended only to about1,000 Hz. However, the fact that no UA tone with a fundamental fre-quency between 500 and 1,000 Hz was ever chosen as a match for anOA tone makes it seem unlikely that even higher tones would havebeen selected if they had been available as choices.
123

Psychological Research
class circle along the UA pitch line.) For example, if theSHPC is G, the mixed pair G-C#3 (or G-C#4, if the domi-nant pitch of G happens to be an octave higher) should bejudged as clearly falling (OA > UA), whereas C#-G3 (orC#-G4) should be judged as clearly rising (OA < UA). Thetransition then would occur around E3 (or E4) on the UApitch continuum. That point might also mark the peak ofthe internal spectral weighting function hypothesized byTerhardt et al. (1986), because according to our interpreta-tion of that theory the subjectively highest OA tone wouldbe the one that has its strongest partial about 3 st above thepeak frequency of the weighting function (if the SHPCdepended only on internal spectral weighting). If these pre-dictions are correct, the individual SHPCs estimated by thetransition points should agree with those found for the sameparticipants in Experiment 1A.
We also investigated the potential inXuence of UApitch range and OA spectral envelope on the hypothesizedtransition point. If the perception of the dominant pitch ofOA tones is based on a stable internal weighting functionthat reXects past auditory experience (e.g., with speech;Deutsch, 1991; Terhardt, 1991), it should not matterwhether the tones are being compared more often to highthan to low UA tones or the reverse; the transition pointon the UA pitch continuum should stay in the same place.However, if perception of the dominant pitch of OA tonesis context sensitive (as Experiment 2B indicated, althoughthese results were not yet known when Experiment 3 wasconducted), the transition point might shift with the rangeof comparison tones. Similarly, if the dominant pitch isindependent of the spectral envelope of OA tones, at leastfor spectral envelopes whose peaks diVer by only 6 st,then the transition point should be the same for both enve-lopes. By contrast, if envelope has a strong eVect on theSHPC, as in Repp’s (1994, 1997) studies, the transitionpoint should be 6 st higher for the tones having the higherenvelope.
Finally, we also varied the order of the UA and OA toneswithin a tritone pair. We thought it possible that UA toneswould aVect perception of OA tones more when they pre-cede them than when they follow them. If the UA tonecomes Wrst, it can inXuence perception of the OA tone atevery stage of the process. If the UA tone comes second, itcan aVect perception of the OA tone only retroactively,after a dominant pitch percept has already been formed forthe OA tone and stored in memory.
Methods
Participants
The participants were the same as in Experiment 1A.Several months elapsed between the experiments, during
which the participants were occupied with other experi-ments not involving OA tones.
Materials
Two sets of OA tones were used whose spectral envelopeswere centered on C4 and on F#4, respectively, as in Experi-ments 1B and 2B. The UA tones here comprised 30 diVer-ent tones ranging from E2 to A4 (MIDI pitches 40–69; 82–440 Hz). They were divided into two overlapping sets of 24tones each, one ranging from E2 to D#4 (“low range”), andthe other one ranging from A#3 to A4 (“high range”), rep-resenting an upward frequency shift of 6 st. Each UA tonein each pitch range was paired with an OA tone whose pitchclass diVered by 6 st. (Thus, each OA tone was paired withtwo UA tones, an octave apart, in each pitch range condi-tion.) The factorial combination of two sets of UA tones(low or high range), two sets of OA tones (C4 or F#4 enve-lope), and two orders of the tones within a pair (UA–OA orOA–UA) resulted in 8 sets of 24 tritone pairs each.
Procedure
Each participant completed 3 blocks of 24 randomlyordered trials for each of the eight conditions before goingonto the next condition (24 blocks total). The order of con-ditions was approximately counterbalanced across the 11participants according to a 2 £ 2 £ 2 Latin square, withthree orders occurring twice. Range of UA tones variedmost slowly (Wrst vs. second half of the session), and orderof UA and OA tones varied most rapidly (alternating fromone condition to the next). Participants sat in front of acomputer monitor that displayed a “start block” button,three response buttons, and a “next trial” button. Each trialstarted with an onset delay of 1 s after the “start block” or“next trial” button was clicked. Each tone sounded for500 ms, with an inter-onset interval of 1 s between the twotones. Participants selected one of three answer choices,“rising,” “falling,” or “not sure,” before clicking the “nexttrial” button. After each block of 24 trials, there was a briefpause during which the data were saved and the next blockwas selected.
Results
Participants had little diYculty judging the relative pitchheight of UA and OA tones in mixed tritone pairs. The totalpercentage of “not sure” responses was 9.6%. As in Experi-ment 1, we counted each of these responses as half a “ris-ing” or “falling” response. To be able to compare theresults for the two order conditions, we analyzed“OA < UA” responses (“rising” for OA–UA and “falling”for UA–OA).
123

Psychological Research
With regard to the eVect of the pitch range of the UAtones, we considered several possible ways of analyzing thedata. One was to focus on the mixed tritone pairs that wereshared between the two UA ranges and to ignore responsesto pairs that occurred in only one of the ranges. The resultsof that analysis were very similar to those obtained from analternative analysis that we will describe instead. In thatanalysis, we considered the responses to all tritone pairsand estimated the transition point (deWned as the point atwhich cumulative “OA < UA” responses as a function ofincreasing UA pitch reach 50%) for each of the eight condi-tions and each participant as follows: Wrst we computed theproportion of “OA < UA” responses for each tritone pairacross the three blocks of trials; then we summed these pro-portions across the 12 tritone pairs and subtracted the sumfrom the highest MIDI pitch number in the range of UAtones; Wnally, we added 0.5 to the result because, if exactlyhalf of all responses were “OA < UA,” the transition pointshould be halfway between the 12th and 13th MIDI pitch inthe UA range of 24 pitches. This method yields a transitionpoint estimate regardless of how the responses are distrib-uted or whether they ever reach 50%.
The mean transition point estimates for the eight condi-tions are shown in Fig. 8. They fall between MIDI pitchnumbers 55 and 62 (G3-D4, 196–294 Hz), consistent withExperiment 2. A 2 £ 2 £ 2 repeated measures ANOVArevealed three signiWcant eVects. First, there was a strongmain eVect of UA pitch range, F(1, 10) = 91.52, P < 0.001,due to higher transition points in the high-range conditionthan in the low-range condition; the mean diVerence was3.7 st. The diVerence indicates that OA tones were per-ceived as relatively higher when they occurred in the con-text of a higher range of UA pitches (i.e., an assimilativecontext eVect, as in Experiment 2B). The second signiWcanteVect was a main eVect of envelope, F(1, 10) = 12.94,P = 0.005: OA tones with the F#4 envelope were heard asrelatively higher than those with the C4 envelope; however,the eVect was small, a mean diVerence of 1.3 st, again simi-lar to Experiment 2B. Finally, there was an interaction oforder and envelope that just barely reached signiWcance,F(1, 10) = 5.02, P = 0.049: the eVect of envelope wasslightly larger when the OA tones occurred second in thetritone pairs than when they occurred Wrst. Figure 8 alsosuggests that OA tones tended to be heard as higher whenthey occurred Wrst than when they occurred second in a tri-tone pair (a mean diVerence of 1.6 st), but the main eVect oforder did not reach signiWcance, F(1, 10) = 3.21, P = 0.103,due to large individual diVerences.
A third way of analyzing the data would have been to Wtsigmoid curves to the individual cumulative response func-tions in each condition and estimate the individual 50%crossovers. However, for some participants the responsepercentages stayed below 50% in the low-range condition.
Also, the individual response functions were rather noisydue to the small amount of data in each condition, andsometimes they were non-monotonic. Nevertheless, theyrevealed some interesting individual diVerences. In Fig. 9we have plotted two response functions for each individualparticipant. They are for the two range conditions, with theresponses pooled across envelope and order conditions.Instead of curve Wtting, the functions were smoothed with a3-point window. Their literal 50% crossovers are indicated,with the closest UA pitch number shown next to each (seealso Table 1, last two columns).
First, it can be seen that all participants showed UArange eVects, though of varying magnitude. Curiously, thetwo participants showing the largest (assimilative) rangeeVects were the ones who had shown contrastive contexteVects in Experiment 1A (Ce, Pi3). Other participants’range eVects show no obvious relation to priming eVects inExperiment 1A.
Next, we note the remarkably similar results of the fourparticipants in the lower right-hand part of Fig. 9 (Cl1, Cl2,Ha, and Cl3). These same individuals had shown very simi-lar results in Experiment 1A as well. Their present resultsindicate that they perceived the OA tones as rather high.(There had been no indication of this in Experiment 2A,however.) Their 50% crossovers were outside the low UArange, near MIDI pitches 64 and 65 (E4 and F4, 330–349 Hz). This agrees quite well with these participants’SHPCs in Experiment 1A, which were G or G# (see Fig. 3;Table 1), 2–3 st above the crossover, as predicted. Theremaining six participants generally had monotonicresponse functions with 50% crossovers ranging from aslow as 51 (D#3, 156 Hz) to as high as 64 (E4, 330 Hz).Some of the crossovers agree roughly with the Experiment
Fig. 8 Experiment 3: mean transition points between “OA > UA” and“OA < UA” responses on the UA pitch continuum in eight conditions,with standard error bars
52
54
56
58
60
62
64
Tra
nsiti
on p
oint
(U
A M
IDI p
itch)
UA: 1st 2nd 1st 2nd 1st 2nd 1st 2nd
OA env: C4 F#4 C4 F#4
UA range: High Low
OA
< U
AO
A >
UA
123

Psychological Research
1A data, but most do not (see Table 1). In general, the pres-ence of range eVects (as well as of envelope and ordereVects) in the present data makes it diYcult to establishclear relationships with the data of Experiment 1A.
Discussion
In this experiment we used a novel “mixed tritone pairs”paradigm to assess perception of the dominant pitch of OAtones. Participants clearly were able to judge the relativepitch height of OA and UA tones when their pitch classeswere a tritone apart, which validates the concept of a domi-nant virtual pitch for OA tones.
We examined the eVects of three independent variables:the pitch range of the UA tones, the spectral envelope of theOA tones, and the order of the two types of tone within thetritone pairs. Pitch range had the clearest eVect: participants
perceived the same OA tones as higher when they occurredin the broader experimental context (half a session) of ahigh range of UA tones than when they occurred in the con-text of a low range of UA tones. However, the diVerencebetween the high and low UA ranges was 6 st, whereas theaverage eVect on OA tone perception was only 3.7 st. Thus,UA tone range did not completely determine the perceivedpitch height of OA tones, consistent with the results ofExperiment 2B. It should be noted that the range eVectcould have been due to the timbre (spectral content) as wellas, or even instead of, the pitch (fundamental frequency) ofthe UA tones because the frequency content of unWlteredharmonic complex tones necessarily gets higher as the fun-damental frequency increases. For example, the higherspectral center of gravity of high-range UA tones may haveraised participants’ internal spectral weighting function forOA tones.
Fig. 9 Experiment 3: individual percentages of “OA < UA” responses as a function of increasing UA pitch (labels and arrangement as in Figs. 3, 5). Individual response functions have been smoothed and averaged across envelope and order conditions. Gray lines indicate 50% crossovers of functions; numbers are the corresponding UA pitches (rounded to the nearest semitone)
0
20
40
60
80
100
38 42 46 50 54 58 62 66 70
"OA
< U
A"
resp
onse
s (%
)
Pi1
38 42 46 50 54 58 62 66 70
Ce
38 42 46 50 54 58 62 66 70
Ob
0
20
40
60
80
100
38 42 46 50 54 58 62 66 70
"OA
< U
A"
resp
onse
s (%
)JMT
38 42 46 50 54 58 62 66 70
Pi3
38 42 46 50 54 58 62 66 70
Cl2
0
20
40
60
80
100
38 42 46 50 54 58 62 66 70
"OA
< U
A"
resp
onse
s (%
)
BHR
38 42 46 50 54 58 62 66 70
UA pitch
Cl1
38 42 46 50 54 58 62 66 70
Ha
0
20
40
60
80
100
38 42 46 50 54 58 62 66 70
"OA
< U
A"
resp
onse
s (%
)
UA pitch
High range
Low range
Pi2
0
20
40
60
80
100
38 42 46 50 54 58 62 66 70
UA pitch
Cl3
51
54
58
6454
55
56
60
51
59 65
54
56 65 65
64
55
58
123

Psychological Research
The spectral envelope of the OA tones also had a reli-able eVect: OA tones with an envelope centered on F#4were perceived as higher than OA tones with an envelopecentered on C4. The eVect was only 1.3 st, however,whereas the envelope was shifted by 6 st. Clearly, it is notthe case that the dominant pitch of OA tones is deter-mined by the spectral envelope, and in that respect thepresent results are consistent with those of Terhardt et al.(1986) as well as with various studies of the tritone para-dox that have found little or no eVect of diVerent spectralenvelopes on judgments of OA tritone pairs (Dawe et al.,1998; Deutsch, 1987, 1991; Deutsch et al., 1987;Giangrande, 1998).
The order of the OA and UA tones within a pair did nothave a reliable eVect, due to large individual diVerences.However, spectral envelope had a greater eVect when theOA tone occurred second than when it occurred Wrst in apair. This is diYcult to explain because the envelope is aproperty of the OA tone alone, and it is unclear how a pre-ceding UA tone might have increased the envelope eVect.Perhaps having to remember the dominant pitch of the OAtone when it occurred Wrst enabled participants to achieve abetter separation of pitch and timbre.
General discussion
Research on the tritone paradox has given rise to the con-cept of a subjectively highest pitch class (SHPC) among the12 pitch classes represented by a set of OA tones with thesame spectral envelope. The concept is based on the Wndingthat most participants judge some OA tones to be higherthan others from the same envelope set when they are pre-sented as tritone pairs. The SHPC is an abstraction; it is theweighted center of the six adjacent pitch classes that tend tobe judged as higher than the other six. The SHPC diVersamong individuals but is generally considered stable foreach individual and almost independent of the spectralenvelope of the OA tones (Deutsch, 1987).
If one OA tone is judged as higher than another OA tonewhose pitch class diVers by 6 st, this seems to imply thatthe dominant pitch of the Wrst tone is higher than that of thesecond tone, at least at the time the judgment is made.According to Terhardt (1991; Terhardt et al., 1986), the rel-ative salience of an OA tone’s candidate virtual pitches isdetermined by a perceptual weighting scheme that favorsfrequencies near 300 Hz. Individuals may diVer in the pre-cise location of the peak of the weighting function, but foreach individual the location of the peak, which determinesthe SHPC, is assumed to be determined by past auditoryexperience and therefore presumably stable.
In the present study, we were concerned mainly withthese stability assumptions. Both individual OA tones and
tritone pairs of OA tones are perceptually multistable: indi-vidual tones, in that they can be perceived as having theirdominant pitch (“fundamental frequency”) in two or threediVerent octaves, and tritone pairs, in that they can be per-ceived as rising or falling in pitch, or even as rising andfalling at the same time. In Experiment 1, we attempted tobias relative pitch judgments of pairs of OA tones by pre-ceding them with a pair of UA tones that clearly instanti-ated a rising or falling tritone interval. About half of theparticipants proved to be immune to such priming. Of theother half, some showed positive priming, others showednegative priming. Thus, some individuals’ perception ofrelative pitch height in OA tritone pairs is not stable andcan be inXuenced by UA context. The SHPC, however,changed little in all cases. This suggests that contextualinXuences, when they did occur, indeed took place at thelevel of relative pitch judgment, not at the level of absolute(dominant) pitch perception because changes at that levelwould entail changes in the SHPC.
In Experiment 2A we asked participants to match individ-ual OA tones to UA tones, in order to Wnd out what the dom-inant pitch of the OA tones might be. The general responsedistribution showed a peak around 260 Hz, which is roughlyconsistent with the Wndings of Terhardt et al. (1986). Ourresponse distribution was narrower than theirs, however,which we attribute to our use of complex harmonic tones asUA comparison stimuli and to the narrower spectral enve-lope of our OA tones. The OA tones judged to be highest inpitch were close to the mean SHPC in Experiment 1. How-ever, there was not much diVerentiation among OA tonesand little agreement at the individual level between theresults of Experiments 1A and 2A. Thus, the matching taskdoes not seem well suited to assessing SHPCs.
This impression was reinforced by Experiments 2B and3, both of which demonstrated strong contextual inXuencesof UA tones on the judged dominant pitch of OA tones. Thehigher the pitch of UA comparison tones, the higher the OAtones were judged to be. This Wnding indicates that thehypothetical spectral weighting function that governs theperceived dominant pitch of OA tones is Xexible and con-text dependent. Changes in the weighting function imply achange in SHPC. Thus, to assess SHPCs, OA–UA match-ing or comparison paradigms are not suitable alternatives tothe standard tritone paradox paradigm in which only OAtones occur. Whether the SHPC in the standard paradigmdepends on perceived pitch height at all remains uncertain.It is possible that the SHPC is an emergent property of aself-organizing perceptual process within a closed set ofOA tones (cf. Giangrande et al., 2002) and has nothing todo with the judgment of single OA tones in relation to UAtones. Although the experiential determinants of the SHPChypothesized by Deutsch (1991) are essentially the onesthat Terhardt (1991) hypothesized to underlie the internal
123

Psychological Research
spectral weighting function (i.e., exposure to speech), theapparent stability of the SHPC (Experiment 1 and previoustritone paradox research) contrasts with the apparent mal-leability of the internal weighting function (Experiments2B and 3). This malleability may come about through auto-matic inclusion of all tones heard, whether UA or OA, in aprocess of perceptual calibration.
Experiments 2B and 3 also investigated the role of thespectral envelope of OA tones by contrasting tones withenvelopes centered on pitches 6 st apart. In both experi-ments, envelope had a signiWcant but small eVect on judgedpitch height relative to UA tones. Thus, tones with a spec-tral content of higher frequencies were perceived as slightlyhigher in pitch, which is consistent with interactionsbetween timbre and pitch perception found in other para-digms, though mainly in non-musicians (Krumhansl &Iversen 1992; Pitt, 1994; Preisler, 1993; Seither-Preisleret al., 2007). The relatively small size of the envelope eVectis consistent with Wndings of similarly small or nonexistentenvelope eVects in the tritone paradox by Deutsch (1987)and others, and in a pure-tone matching task by Terhardtet al. (1986). It appears that the judged pitch height of OAtones indeed depends more on (context dependent) internalspectral weighting than on the physical structure of thetones, although it remains to be seen whether that is stilltrue when envelope diVerences much larger than 6 st areintroduced.
This study was not intended as an investigation of theexperiential determinants of the individual SHPC, whichDeutsch (1991) famously hypothesized to be linguistic innature—a hypothesis much in need of further supportivedata. Our data contribute little to this issue save for a sug-gestion that experience with musical instruments may mat-ter, too: four players of wind instruments and a harpistshowed strikingly similar results, in both Experiments 1Aand 3. Perhaps the SHPC and the internal spectral weight-ing function are reXections of the total auditory history ofindividuals, which has shaped their auditory systems in thecourse of many years. This hypothesis gains plausibilityfrom recent Wndings of neural plasticity at even very earlylevels of auditory processing (e.g., Kraus & Banai, 2007;Luo et al., 2008).
Acknowledgments Research supported by National Science Foun-dation Grant BCS-0642506 to BHR. Coauthor JMT was involved inthis research as a volunteer research assistant during her senior year inYale College. She helped design the experiments, performed data anal-yses, and wrote a report that was the germ of this article.
References
Blake, R., & Logothetis, N. K. (2002). Visual competition. NatureReviews Neuroscience, 3, 13–21.
Braun, J., & Pastukhov, A. (2007). Further diVerences betweenpositive and negative priming in the perception of ambiguouspatterns. Journal of Vision, 7(9), 368 [abstract].
Cohen, M. A., Grossberg, S., & Wyse, L. L. (1995). A spectral networkmodel of pitch perception. Journal of the Acoustical Society ofAmerica, 98, 862–879.
Dawe, L. A., Platt, J. R., & Welsh, E. (1998). Spectral-motion after-eVects and the tritone paradox among Canadian subjects. Percep-tion & Psychophysics, 60, 209–220.
Deutsch, D. (1986). A musical paradox. Music Perception, 3, 275–280.Deutsch, D. (1987). The tritone paradox—eVects of spectral variables.
Perception & Psychophysics, 41, 563–575.Deutsch, D. (1991). The tritone paradox: An inXuence of language on
music perception. Music Perception, 8, 335–347.Deutsch, D. (1994). The tritone paradox: Some further geographical
correlates. Music Perception, 12, 125–136.Deutsch, D., Henthorn, T., & Dolson, M. (2004). Speech patterns heard
early in life inXuence later perception of the tritone paradox.Music Perception, 21, 357–372.
Deutsch, D., Kuyper, W. L., & Fisher, Y. (1987). The tritone paradox:Its presence and form of distribution in a general population.Music Perception, 5, 79–92.
Fisher, N. I. (1993). Statistical analysis of circular data. New York:Cambridge University Press.
Giangrande, J. (1998). The tritone paradox: EVects of pitch class andposition of the spectral envelope. Music Perception, 15, 253–264.
Giangrande, J., Tuller, B., & Kelso, J. A. S. (2002). Perceptual dynam-ics of circular pitch. Music Perception, 20, 241–262.
Houtsma, A. J. M., & Fleuren, J. F. M. (1991). Analytic and syntheticpitch of two-tone complexes. Journal of the Acoustical Society ofAmerica, 90, 1674–1676.
Kanai, R., & Verstraten, F. A. J. (2005). Perceptual manifestations offast neural plasticity: Motion priming, rapid motion aftereVectand perceptual sensitization. Vision Research, 45, 3109–3116.
Kraus, N., & Banai, K. (2007). Auditory-processing malleability:Focus on language and music. Current Directions in Psychologi-cal Science, 16, 105–110.
Krumhansl, C. L., & Iversen, P. (1992). Perceptual interactionsbetween musical pitch and timbre. Journal of ExperimentalPsychology: Human Perception and Performance, 18, 739–751.
Leopold, D. A., & Logothetis, N. K. (1999). Multistable phenomena:changing views in perception. Trends in Cognitive Science, 3,254–264.
Luo, F., Wang, Q., Kashani, A., & Yan, J. (2008). Corticofugal modu-lation of initial sound processing in the brain. Journal of Neuro-science, 28, 11615–11621.
Pearson, J., & CliVord, C. W. G. (2005). Mechanisms selectivelyengaged in rivalry: normal vision habituates, rivalrous visionprimes. Vision Research, 45, 707–714.
Pitt, M. A. (1994). Perception of pitch and timbre by musically trainedand untrained listeners. Journal of Experimental Psychology:Human Perception and Performance, 20, 976–986.
Preisler, A. (1993). The inXuence of spectral composition of complextones and of musical experience on the perceptibility of virtualpitch. Perception & Psychophysics, 54, 589–603.
Pressnitzer, D., & Hupé, J. M. (2006). Temporal dynamics of auditoryand visual bistability reveal common principles of perceptualorganization. Current Biology, 16, 1351–1357.
Ragozzine, F. (2001). The tritone paradox and perception of singleoctave-related complexes. Music Perception, 19, 155–168.
Ragozzine, F., & Deutsch, D. (1994). A regional diVerence in percep-tion of the tritone paradox within the United States. MusicPerception, 12, 213–226.
Repp, B. H. (1994). The tritone paradox and the pitch range of thespeaking voice: A dubious connection. Music Perception, 12,227–255.
123

Psychological Research
Repp, B. H. (1997). Spectral envelope and context eVects in the tritoneparadox. Perception, 26, 645–665.
Schouten, J., Ritsma, R., & Cardozo, B. (1962). Pitch of the residue.Journal of the Acoustical Society of America, 34, 1418–1424.
Seither-Preisler, A., Johnson, L., Krumbholz, K., Nobbe, A., Patterson,R., Seither, S., et al. (2007). Tone sequences with conXicting fun-damental pitch and timbre changes are heard diVerently by musi-cians and nonmusicians. Journal of Experimental Psychology:Human Perception and Performance, 33, 743–751.
Shepard, R. (1964). Circularity in judgments of relative pitch. Journalof the Acoustical Society of America, 36, 2346–2353.
Shepard, R. N. (1983). Demonstrations of circular components ofpitch. Journal of the Audio Engineering Society, 31, 641–649.
Sterzer, P., Kleinschmidt, A., & Rees, G. (2009). The neural bases ofmultistable perception. Trends in Cognitive Science, 13, 310–318.
Sterzer, P., & Rees, G. (2008). A neural basis for percept stabilization inbinocular rivalry. Journal of Cognitive Neuroscience, 20, 389–399.
Terhardt, E. (1991). Music perception and sensory information acqui-sition: Relationships and low-level analogies. Music Perception,8, 217–240.
Terhardt, E., Stoll, G., Schermbach, R., & Parncutt, R. (1986). Ton-höhenmehrdeutigkeit, Tonverwandtschaft und IdentiWkation vonSukzessivintervallen [Pitch ambiguity, pitch relatedness, andidentiWcation of successive intervals]. Acustica, 61, 57–66.
Terhardt, E., Stoll, G., & Seewann, M. (1982a). Pitch of complex signalsaccording to virtual-pitch theory: Tests, examples, and predictions.Journal of the Acoustical Society of America, 71, 671–678.
Terhardt, E., Stoll, G., & Seewann, M. (1982b). Algorithm for extrac-tion of pitch and pitch salience from complex tonal signals.Journal of the Acoustical Society of America, 71, 679–688.
123


![NOTES ON SCALE-INVARIANCE AND BASE-INVARIANCE FOR … · arXiv:1307.3620v1 [math.PR] 13 Jul 2013 NOTES ON SCALE-INVARIANCE AND BASE-INVARIANCE FOR BENFORD’S LAW MICHAŁ RYSZARD](https://static.fdocuments.net/doc/165x107/5aee16367f8b9a45569086fd/notes-on-scale-invariance-and-base-invariance-for-13073620v1-mathpr-13-jul.jpg)