CONTENTS · year 2016, ISHRAE released India’s first Indoor Environmental Quality (IEQ) Standard...
215
Transcript of CONTENTS · year 2016, ISHRAE released India’s first Indoor Environmental Quality (IEQ) Standard...


CONTENTS
Description Page No.
List of Figures
List of Tables
Nomenclature
Chapter 1- Introduction 1-16 1.1 Indoor Environment Quality i 1.2 Objective i 1.3 Approach i 1.4 Organisation i 1.5 Literature Review i Chapter-2 Erratum and Addendum 17-34 2.1 Introduction 17 2.2 Erratum 17 2.2.1 Major Correction 17 2.2.2 Threshold Values for Lighting Comfort 20 2.2.3 Noise Isolation Class 21 2.2.4 Light Source and Melanopic Ratio 22 2.3 Addendum 23 2.3.1 Major Additions 23 2.3.2 Ooccupant Satisfaction Survey 29 2.3.3 Lighting Areas 30 2.3.4 Glare 30 2.3.5 Lighting Calculation Method 32 2.3.6 Sound Isolation Class 33 2.3.7 Reverberation Time 34 Chapter-3 Availability of Instruments 35-41 3.1 Introduction 35 3.2 Thermal comfort 35 3.2.1 Air Temperature and Mean Radiant Temperature 35 3.2.2 Floor Surface Temperature 35
3.2.3 Plane Radiant Temperature 36 3.3 Lighting Comfort 36
3.3.1 Illuminance 36 3.4 Acoustic Comfort 36
3.4.1 Sound 36
Description Page No.
3.5 Indoor Air Quality 36 3.5.1 CO2 36 3.5.2 CO 37 3.5.3 PM 2.5 and PM 10 37 3.5.4 TVOC 38 3.5.5 CH2O 38 3.5.6 SO2 39 3.5.7 NO2 40 3.5.8 O3 40 3.5.9 Total Microbial Count 41
3.6 Overall Summary 41 Chapter- 4 IEQ Assessment Methodology 42-54 4.1 Measurement Protocols 42 4.2 Site Description 43
4.2.1 MNIT Jaipur 43 4.2.2 IITM Chennai 45
4.3 Measurement Location Selection 48
4.3.1 MNIT Jaipur 48
4.3.2 IITM Chennai 50
4.4 Instruments 51 4.5 Occupant Response and Sample size 54 Chapter 5 Results and Discussions 55-109 5.1 Introduction 55 5.2 Thermal comfort 55 5.2.1 Introduction 55 5.2.2 Operative Temperature and Air Velocity 55 5.2.3 Relative Humidity 60 5.2.4 Floor Surface Temperature 62 5.3 Indoor Air Quality 64
5.3.1 Introduction 64 5.3.2 CO2 Concentrations 65 5.3.3 PM Concentrations 67 5.3.4 TVOC and CH2O Concentrations 71 5.3.5 SO2 and NO2 Concentrations 74 5.3.6 CO and O3 Concentrations 77 5.3.7 Total Microbial Count 80
Description Page No.
5.3.8 Variation of IAQ Parameters within Room 82 5.3.9 Variation in IAQ Parameters between Indoor and Air Intake 84
5.4 Lighting Comfort 96 5.4.1 Introduction 96 5.4.2 Illuminance and Circadian Lighting Design 96 5.4.3 Uniformity and Ratio of Task Area to Adjacent Surroundings 101 5.5 Acoustic Comfort 104
5.5.1 Overall Sound Level 104
5.6 Occupant Satisfaction Survey 106 Chapter 6 Conclusions and Future Scope 110-113 6.1 Conclusion 110
6.1.1 Instrumentations 110 6.1.2 Measurement Protocol 110 6.1.3 IEQ Assessment 112
6.2 Future Scope 113 REFERENCES 114-118 ANNEXURE 119-195


LIST OF FIGURES
Figure No.
Description Page No.
1.1 Elements of IEQ 3 1.2 Levels of threshold values 4
2.1 Task, immediate surrounding and background areas 30 2.2 Direct glare 31 2.3 Reflected glare 31
4.1 (a) Pictorial view (b) Geographical view of CEEB and OAB Jaipur
45
4.2 (a) Pictorial view (b) Geographical view of buildings Chennai
47
4.3 Floor plan and potential occupant location (a) Old administration (b) CEE building (c) Residential Building.
49
4.4 Floor plan and potential occupant location in Chennai (a – i) 51 5.1 Monthly variations in (a) operative temperature and (b) air
velocity in Jaipur 56
5.2 Location wise variations in (a) operative temperature and (b) air velocity for summer, monsoon and winter seasons respectively in Chennai
59
5.3 Monthly variations in relative humidity in Jaipur 61 5.4 Location wise variations in relative humidity for summer,
monsoon, and winter respectively in Chennai 62
5.5 Monthly variations in floor surface temperature in Jaipur 63
5.6 Location wise variations in surface temperature for summer, monsoon, and winter respectively in Chennai
64
5.7 Monthly variations in CO2 concentration in Jaipur 65
5.8 Location wise variations in CO2 concentration for summer, monsoon, and winter respectively in Chennai
66
5.9 Monthly variations in (a) PM 2.5 (b) PM 10 concentration in Jaipur
68
5.10 Location wise variations in (a) PM 2.5 (b) PM 10 concentration for summer, monsoon and winter respectively in Chennai
70
5.11 Monthly variations in TVOC and CH2O concentrations in Jaipur
71
5.12 Location wise variations in (a) TVOC and (b) CH2O concentration for summer, monsoon and winter respectively in Chennai
73
Figure No.
Description Page No.
5.13 Monthly variations in SO2 and NO2 concentrations in Jaipur 74
5.14 Location wise variations in (a) SO2 and (b) NO2 concentration for summer, monsoon and winter respectively in Chennai
76
5.15 Monthly variations in CO and O3 concentrations in Jaipur 77
5.16 Location wise variations in (a) CO and (b) O3 concentration for summer, monsoon and winter respectively in Chennai
79
5.17 Location wise variations in Total Microbial Count concentration for summer, monsoon and winter respectively in Chennai
81
5.18 Monthly variations in standard deviation for CO2 and CO concentrations in Jaipur
82
5.19 Monthly variations in standard deviation for PM 2.5 and PM 10 concentrations in Jaipur
83
5.20 Monthly variations in standard deviation for TVOC and CH2O concentrations in Jaipur
83
5.21 Monthly variations in standard deviation for SO2 and NO2 concentrations in Jaipur
83
5.22 Monthly variations in standard deviation for O3 concentrations in Jaipur
84
5.23 Monthly variations in CO2 concentrations between indoor and air intake in Jaipur
85
5.24 Monthly variations in (a) PM 2.5 (b) PM 10 concentrations between indoor and air intake in Jaipur
86
5.25 Monthly variations in SO2 and NO2 concentrations between indoor and air intake in Jaipur
86
5.26 Monthly variations in CO and O3 concentrations between indoor and air intake in Jaipur
87
5.27 Location wise variations in indoor and outdoor CO2 concentration for summer, monsoon and winter season in Chennai
88
5.28 Location wise variations in indoor and outdoor PM 2.5 concentration for summer, monsoon and winter season in Chennai
89
5.29 Location wise variations in indoor and outdoor PM 10 concentration for summer, monsoon and winter season in Chennai
90
5.30 Location wise variations in indoor and outdoor SO2 concentration for summer, monsoon and winter season in Chennai
91
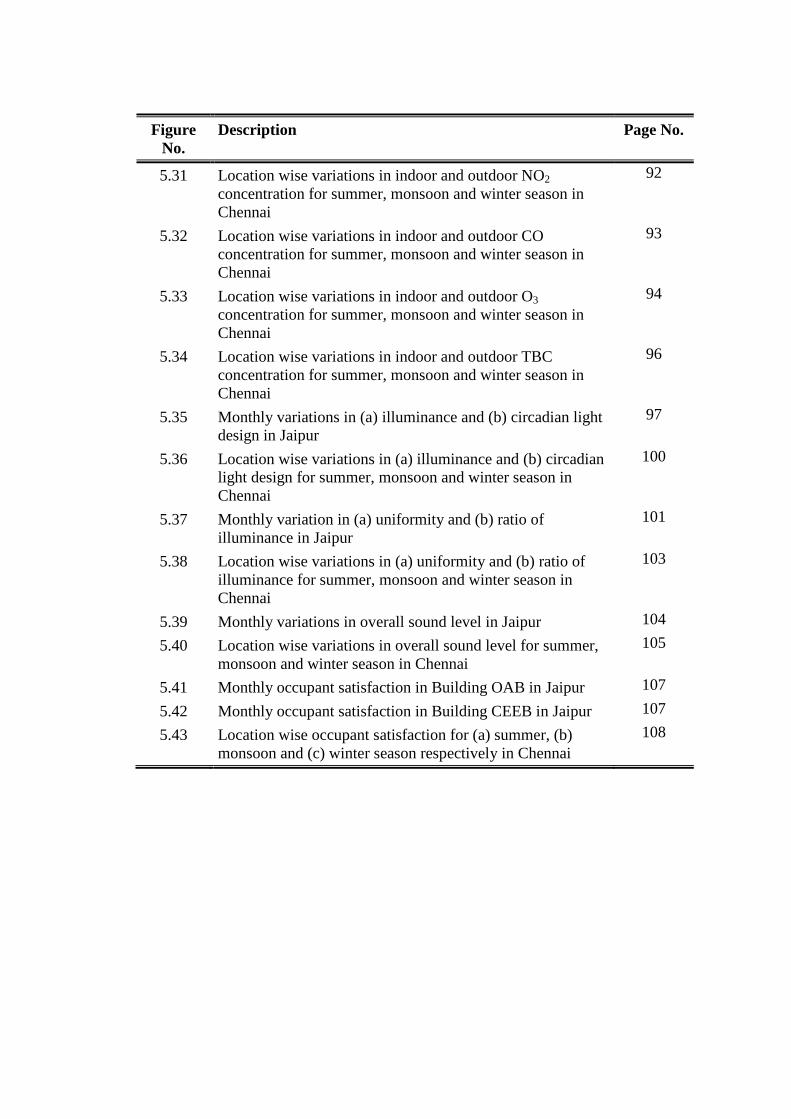
Figure No.
Description Page No.
5.31 Location wise variations in indoor and outdoor NO2 concentration for summer, monsoon and winter season in Chennai
92
5.32 Location wise variations in indoor and outdoor CO concentration for summer, monsoon and winter season in Chennai
93
5.33 Location wise variations in indoor and outdoor O3 concentration for summer, monsoon and winter season in Chennai
94
5.34 Location wise variations in indoor and outdoor TBC concentration for summer, monsoon and winter season in Chennai
96
5.35 Monthly variations in (a) illuminance and (b) circadian light design in Jaipur
97
5.36 Location wise variations in (a) illuminance and (b) circadian light design for summer, monsoon and winter season in Chennai
100
5.37 Monthly variation in (a) uniformity and (b) ratio of illuminance in Jaipur
101
5.38 Location wise variations in (a) uniformity and (b) ratio of illuminance for summer, monsoon and winter season in Chennai
103
5.39 Monthly variations in overall sound level in Jaipur 104 5.40 Location wise variations in overall sound level for summer,
monsoon and winter season in Chennai 105
5.41 Monthly occupant satisfaction in Building OAB in Jaipur 107
5.42 Monthly occupant satisfaction in Building CEEB in Jaipur 107 5.43 Location wise occupant satisfaction for (a) summer, (b)
monsoon and (c) winter season respectively in Chennai 108

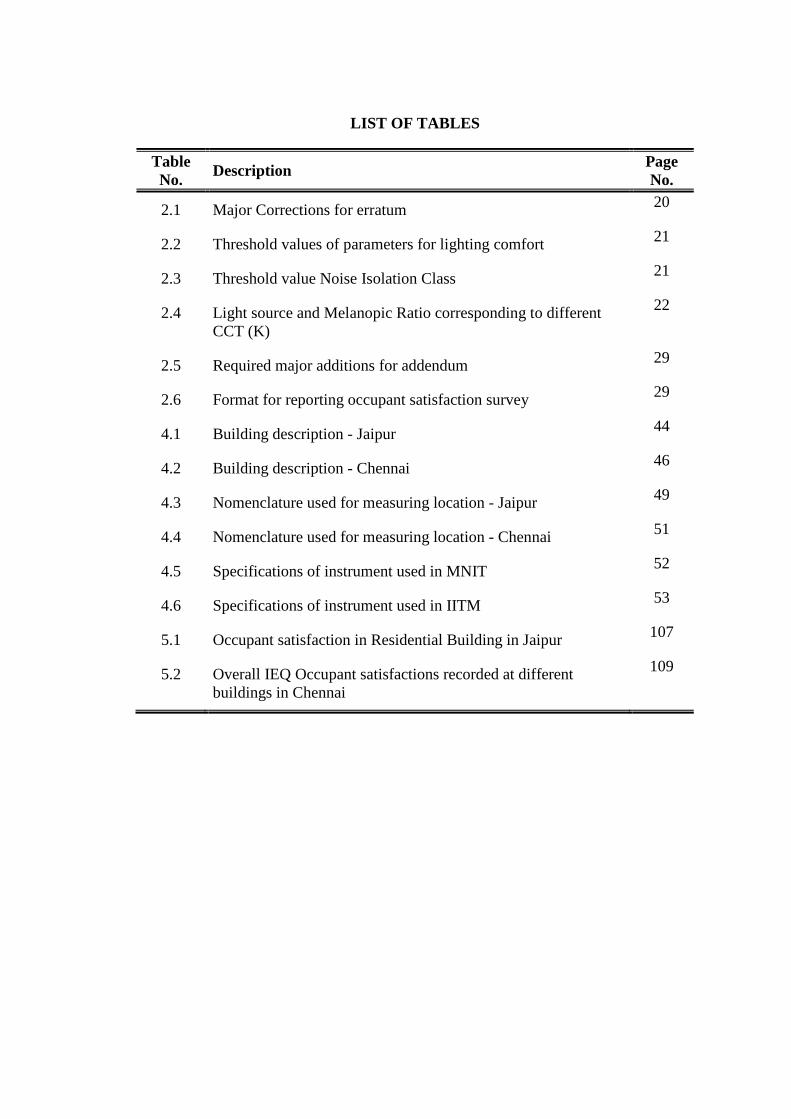
LIST OF TABLES
Table No. Description Page
No.
2.1 Major Corrections for erratum 20
2.2 Threshold values of parameters for lighting comfort 21
2.3 Threshold value Noise Isolation Class 21
2.4 Light source and Melanopic Ratio corresponding to different CCT (K)
22
2.5 Required major additions for addendum 29
2.6 Format for reporting occupant satisfaction survey 29
4.1 Building description - Jaipur 44
4.2 Building description - Chennai 46
4.3 Nomenclature used for measuring location - Jaipur 49
4.4 Nomenclature used for measuring location - Chennai 51
4.5 Specifications of instrument used in MNIT 52
4.6 Specifications of instrument used in IITM 53
5.1 Occupant satisfaction in Residential Building in Jaipur 107
5.2 Overall IEQ Occupant satisfactions recorded at different buildings in Chennai
109


NOMENCLATURE
Abbreviations
AHU Air Handling Unit
ASHRAE
American Society of Heating, Refrigerating, and Air-Conditioning Engineers
BS British Standard
CEEB Centre for Energy and Environment Building
CCT Correlated Colour Temperature
CFL Compact Fluorescent Lamp
EML Equivalent Malanopic Ratio
HVAC Heating, Ventilation, and Air-Conditioning
IAQ Indoor Air Quality
IEC International Electrotechnical Commission
IEQ Indoor Environmental Quality
IS Indian Standard
ISHRAE
Indian Society of Heating, Refrigerating, and Air-Conditioning Engineers
ISO International Orgnisation for Standarisation
NBC National Building Code
NC Noise Criteria
NIC Noise Isolation Class
OAB Old Administrative Building
PM Particulate Matter
RB Residential Building
RH Relative Humidity
RSPM Respirable Suspended Particulate Matter
SBS Sick Building Syndrome
TVOC Total Volatile Organic Compound
Symbols
CH2O Formaldehyde
CO Carbon Monoxide
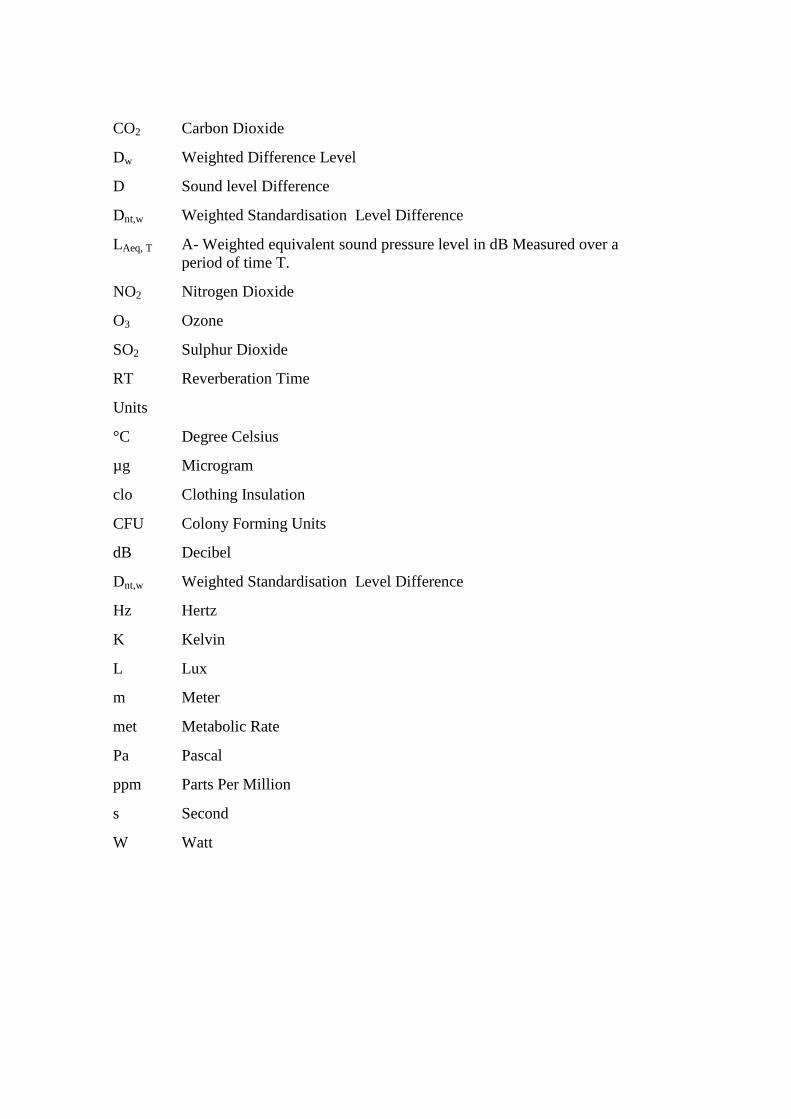
CO2 Carbon Dioxide
Dw Weighted Difference Level
D Sound level Difference
Dnt,w Weighted Standardisation Level Difference
LAeq, T A- Weighted equivalent sound pressure level in dB Measured over a period of time T.
NO2 Nitrogen Dioxide
O3 Ozone
SO2 Sulphur Dioxide
RT Reverberation Time
Units
°C Degree Celsius
µg Microgram
clo Clothing Insulation
CFU Colony Forming Units
dB Decibel
Dnt,w Weighted Standardisation Level Difference
Hz Hertz
K Kelvin
L Lux
m Meter
met Metabolic Rate
Pa Pascal
ppm Parts Per Million
s Second
W Watt
ABSTRACT
Indoor environmental quality indicates the condition of environment inside
the building which is defined and determined by factors such as thermal comfort,
indoor air quality, acoustic comfort and lighting comfort. These factors significantly
affect the productivity and well-being of occupants in an indoor environment. In the
year 2016, ISHRAE released India’s first Indoor Environmental Quality (IEQ)
Standard (ISHRAE Standard-100001:2016). Above mentioned factors as referred as
elements in the standard. The IEQ standard includes definitions for the elements
affecting human health and comfort, threshold values of parameters contributing to
these elements, specifications of measurement instruments and measurement
methodology.
The present research project demonstrates review of India’s IEQ standard,
incorporate preliminary findings from a pilot study to understand and evaluate
implementation methodology in buildings and also review the availability of
instruments at Indian as well as international market. The pilot study is being
investigated at Jaipur and Chennai for a year (June 2017 to May 2018) to cover all
seasons. Experimental investigation of IEQ parameters at Jaipur are being carried
out at three buildings, located in composite climatic zone. The first building is
situated in an area with rich natural vegetation, away from heavy traffic and the
second one is nearer to the roadway. The first building covers a total area of 1400
square meters distributed over 3 floors, having 25 rooms, and offer 66 types of
potential occupant locations. Whereas, the second building covers a total area of 162
square meters with only 1 floor, 3 rooms, and 10 types of potential occupant
locations. Both buildings are situated within MNIT Jaipur campus have shared as
well as individual offices, laboratories and classrooms in which some are air-
conditioned, and others are unconditioned spaces. The third building is residential
apartments have 3 floors, only top floor apartment is used for the study, covers a
total area of 125 square meters with 2 bedrooms, 1 livingroom, 1 kitchen and 6 types
of potential occupant locations. Whereas the IEQ investigations at Chennai were
carried out in diverse end-use buildings which include commercial, office,
residential and institutional buildings. A total of 10 different buildings were selected

which included 2 commercial buildings (one computational room and one
departmental stores), 3 institutional rooms (2 student offices and a laboratory), 4
office buildings (including 2 conference halls) and 3 residences. Out of the different
buildings, one office (O2) and two residences (R2 & R3) were located near roadway
and rest all buildings were located away from road traffic in a thickly vegetated area.
As suggested in ISHRAE’s IEQ standard, an occupant satisfaction survey was also
conducted by using a seven-point scale for all IEQ parameters along with
measurements.
The results show the majority of the IEQ parameters at both locations in all
buildings have been found to be meeting the minimum threshold. This research
project, besides, raising and offering clarity about the method of taking
measurements, also presents comments on the availability of instruments required as
per the standard. It suggests the necessity of some clarifications and revisiting
accuracy and resolution of some measuring instrument with justifications.
Keywords: Indoor environmental quality, indoor air quality, thermal comfort,
lighting comfort, field study, occupant survey
1
CHAPTER 1
INTRODUCTION 1.1 Indoor Environmental Quality The healthy and comfortable indoor environment is primary requirement of
the occupants as they spent most of their time in indoor. IEQ is affected by building
location, orientation, climatic conditions, occupant behavior and building systems
and typology. There has been a clear association between IEQ and the sense of well-
being, health, productivity. Indoor air quality (IAQ) has gained much interest in the
recent years as it can result in variety of adverse health outcomes ranging from
headache and allergies to respiratory illness and even cancer. Furthermore,
temperature and humidity at too high and low level, excessively bright or dim and
deficient lighting system, interrupting high noise level leads to increase in mental
and physical stress level in the human body which causes health problems such as
concentration impairment, memory loss, digestive problem, sleep disorder etc.
Thermal Comfort is defined by ASHARE 55 as “the state of mind which
express the satisfaction with thermal environment” (ASHRAE Std. 55, 2013). It
relates to the physical factors in conditioned as well as naturally ventilated
environments. Thermal comfort is strongly correlated with building energy
consumption (Djongyang et al., 2010). Thermal comfort constitutes of physical
environmental parameters such as mean radiant temperature, room air temperature,
relative humidity, air movement, floor surface temperature etc. Further personal
parameters metabolic rate and clothing valve also affect thermal comfort. It is the
most preferred element in comparison to indoor air quality, acoustic comfort and
lighting comfort (Frontczak et al., 2011).
According to ASHRAE (Standard 62-1989), an acceptable IAQ can be
defined as (a) air in which there are no known contaminants at harmful
concentrations, and (b) air with which a substantial majority (80% or more) of the
people exposed do not express dissatisfaction. The level of satisfaction and
acceptability (80%) indicates that conditions do not have to be unanimously or
universally applicable. IAQ is recognized to cause chronic and acute effects on
2
occupant health. It is directly related to the concentration of pollutants and
ventilation rates, which is in turn in causes Sick Building Syndrome (SBS)
symptom. Indoor air pollutants mainly consist of particulate pollutants (PM2.5,
PM10), gaseous pollutants (CO2, CO, volatile organic compounds, formaldehyde,
SO2, NO2, and O3 etc.) and biological pollutants (bacteria, fungi, mould, pollen,
animal dander, mites, virus etc.). IAQ standards have been set by both national and
international organizations like Occupational Safety & Health Administration
(OSHA), American Society of Heating, Refrigerating, and Air-Conditioning
Engineers (ASHRAE), National Institute for Occupational Safety and Health
(NIOSH), World Health Organization (WHO) which is used in many countries.
Outdoor air plays a significant role on IAQ when no major indoor pollutant sources
are present.
Improper lighting conditions such as too bright or too dark can create visual
discomfort. Lighting comfort directly affects the occupant's work productivity and
efficiency. It is a subjective measure and directly dependent on factors like
illumination, the risk of glare, luminous spectrum, brightness and luminance (CEN,
2012). A proper visual environment condition causes an increment in the
productivity and well-being of the building occupants (Serghides et al., 2015). The
parameters of lighting comfort are illuminance, circadian lighting design, uniformity
of illuminance and ratio of illuminance of task area to immediately adjacent
surroundings. Useful Daylight Illuminance (UDI) and Daylight Autonomy (sDA)
also affect the lighting comfort and energy consumption.
The acoustic comfort can be defined as absence of any uncomfortable noise
within the indoor environment. The background or unnecessary noise must be
minimized so as to support the acoustics in order to provide high speech
intelligibility. For commercial buildings, it is considered as a critical IEQ element.
Further, it is given higher preference by the occupants in classrooms and offices.
Comfortable sound levels and speech privacy are considered as main requirements
for occupants’ satisfaction in work-places because it directly affects the work
productivity and well-being (Jensen et al., 2005). Acoustic comfort is indirectly
related to energy consumption. For example, to achieve more external and internal

3
sound insulation building occupants have a tendency to close the window and this
could reduce the natural ventilation effect and causes higher cooling energy required
to keep thermal comfort. Noise criteria, noise isolation class and reverberation time
are the parameters of acoustic comfort.
In the year 2016, ISHRAE released India’s first IEQ Standard. In this
standard thermal comfort, indoor air quality, acoustic comfort, and lighting comfort
are defined as elements of IEQ and they have been further divided into parameters.
Figure 1.1 Elements of IEQ
Standard includes definitions for the elements affecting health and comfort,
threshold values of parameters contributing to these elements, measurement
methodology, specifications of measurement instruments and satisfaction survey.
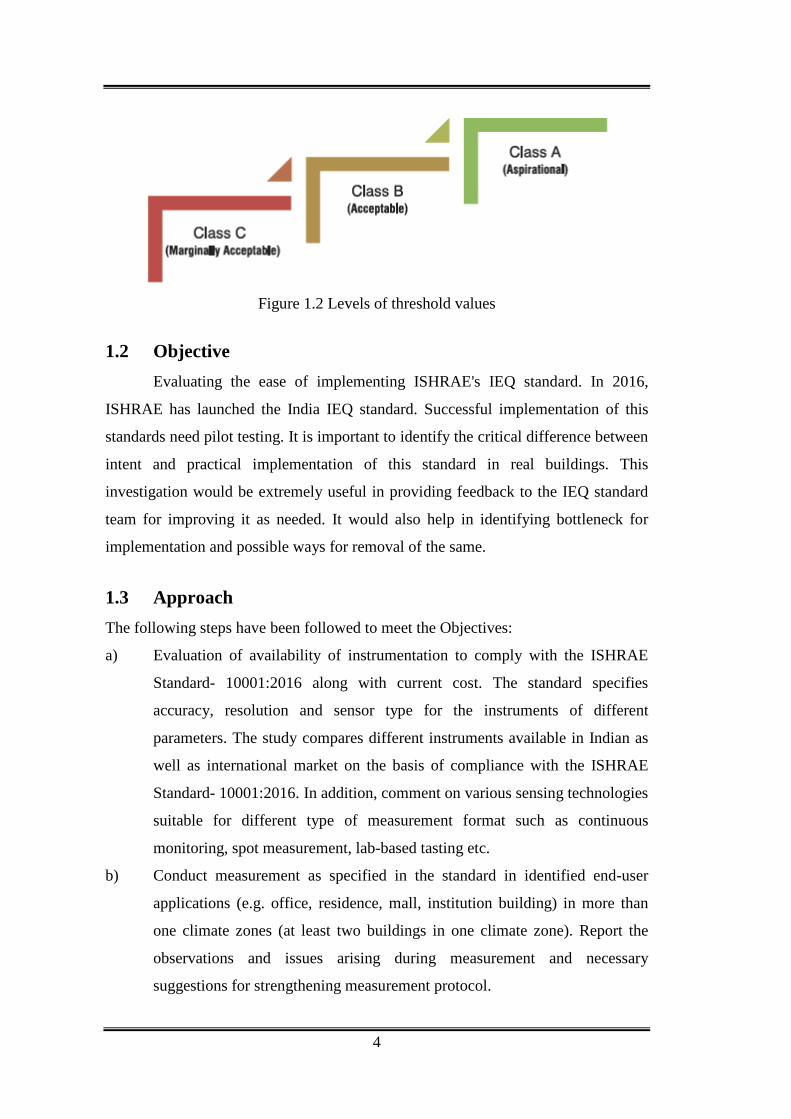
The threshold values of parameters have been defined as three levels such as Class
A (aspirational), Class B (acceptable) and Class C (marginally acceptable). Class A
level is comparable with the worldwide accepted international standard. Since this
standard has been applicable to a diverse range of buildings from unconditional
residence units to large air-conditioned commercial complexes so some of the
parameters are excluded in Class B and Class C.
4
Figure 1.2 Levels of threshold values
1.2 Objective Evaluating the ease of implementing ISHRAE's IEQ standard. In 2016,
ISHRAE has launched the India IEQ standard. Successful implementation of this
standards need pilot testing. It is important to identify the critical difference between
intent and practical implementation of this standard in real buildings. This
investigation would be extremely useful in providing feedback to the IEQ standard
team for improving it as needed. It would also help in identifying bottleneck for
implementation and possible ways for removal of the same.
1.3 Approach
The following steps have been followed to meet the Objectives:
a) Evaluation of availability of instrumentation to comply with the ISHRAE
Standard- 10001:2016 along with current cost. The standard specifies
accuracy, resolution and sensor type for the instruments of different
parameters. The study compares different instruments available in Indian as
well as international market on the basis of compliance with the ISHRAE
Standard- 10001:2016. In addition, comment on various sensing technologies
suitable for different type of measurement format such as continuous
monitoring, spot measurement, lab-based tasting etc.
b) Conduct measurement as specified in the standard in identified end-user
applications (e.g. office, residence, mall, institution building) in more than
one climate zones (at least two buildings in one climate zone). Report the
observations and issues arising during measurement and necessary
suggestions for strengthening measurement protocol.
5
c) Record, analyzed and report the IEQ parameter measurements.
d) Reporting the comments and necessary suggestions with clarifications on
IEQ assessment.
1.4 Organisation Some clarifications and corrections regarding some possible typos have been
identified and purposed as erratum and addendum for the ISHRAE Standard-
10001:2016. Erratum and addendum are specified in chapter 2. Availability of
instruments is discussed in chapter 3. Methodology adopted along with site as well
as measurement location selection, and instruments used for IEQ pilot investigation
are presented in chapter 4. IEQ pilot investigation results are discussed in chapter 5.
Results based on both monthly and seasonal variation of IEQ parameters are
presented. Chapter 6 contains conclusions and recommendations for measurement
methodology. Further, future study requirements are also presented in Chapter 6.
1.5 Literature Review
1.5.1 Ahn et al.
Ahn et al., (2017) examined the indoor air quality and working performance
of cooling system of partition room (in terms of temperature distribution, ventilation
effectiveness, energy consumption and thermal comfort) under different ventilation
strategies (mixing and displacement). Simulation result reported the strong influence
of ventilation strategy on temperature distribution and air freshness. As compared to
mixing ventilation, the energy consumption in displacement ventilation (for single
diffuser) was observed lower. However, mixing ventilation was also found energy
saver
for separate diffuser for each partitioned space.
1.5.2 Al-hemoud et al.
Al-hemoud et al., (2017) compared the indoor air quality in schools for urban
and industrial sectors, in terms of CO2, NO2, SO2, H2S, formaldehyde and
acetaldehyde, TVOC and PM10. The data thus obtained was analysed for seasonal,
6
zone and climate variations using different statistical tools (T-test, one-way
ANOVA, two-way ANOVA and linear regression). One-way ANOVA reported
significant seasonal variations in NO2, H2S, formaldehyde, and acetaldehyde
whereas two-way ANOVA identified significant location variations in TVOC,
PAHs, and BDE-209. AC filters were recommended for dust analysis and
measurement of typical indoor pollutants.
1.5.3 Cheng et al.
Cheng et al., (2017) investigated indoor air quality in nine buildings
equipped with central air conditioning system operating under different climate
zones (cold, hot summer and winter, mild) of China. The performance of buildings
was assessed in terms of indoor thermal environment, CO2 concentration (560-997
ppm), formaldehyde (0.02-0.31 mg/m3) and TVOC (0.074-0.636 mg/m3). Based on
theoretical analysis, a mathematical model was also proposed providing quantitative
analysis of the requirement of fresh air of underground floor with reference to above
ground floor of same building.
1.5.4 Irshad et al.
Irshad et al., (2017) evaluated the performance of thermal comfort system in
terms of subjective and objective measurement for a test room equipped with PV
and thermoelectric air duct system. For the current variation 2A-6A, the thermal
response of occupants was observed to change from slightly warm to cool. Also, the
overall PMV predicted %, dissatisfied indices and acceptability vote obtained from
more 90% of the occupants were reported thermally satisfied. Moreover, the cooling
system was found efficient in terms of energy consumption, reliability, and
maintenance.
1.5.5 Kontes et al.
Kontes et al., (2017) discussed the role of thermostats in monitoring of
thermal comfort in indoor spaces and based on the outcomes, an experimental
simulation protocol was developed to meeting the required thermal environment via
real-time measurements considering various controlled parameters (Relative
humidity, illuminations, CO2 level, flow velocity, building design etc.) and

7
boundary conditions. Various comfort indices and models were analysed for the
assessment and development of thermal comfort standards and their implications in
real practice.
1.5.6 Mishra et al.
Mishra et al., (2017) studied thermal comfort perception of students in a
classroom during the heating season. Based on two weeks’ observations, the thermal
sensation vote was reported to be different (p < 0.05) for different time points (10,
20 and 45 min.). Prior to the lecture, the student’s perception was found varying
based on the outside and operative temperature, gender and occupant origin.
However, a significant difference was observed after indoor-outdoor transition
during the second week of observations at 1.5°C lower set point. Moreover, the
thermal environment was adopted gradually at 20 minutes of post-transition.
1.5.7 Sheng et al.
Sheng et al., (2017) studied air purification effect of clean air heat pump
through sensory monitoring of air quality and chemical measurement of TVOC in a
room having combined polluting effects of human bio-effluents and building
materials. The outdoor air supply rate was reported to reduce by 76% whereas the
single pass efficiency of removal of indoor air pollutants was calculated to be 92%
at regeneration temperature of 60°C. Further, no TVOC was observed on desiccant
wheel of clean air heat pump.
1.5.8 Sun et al.
Sun et al., (2017) carried out indoor air quality in residential area of Tianjin
(China), in terms of formaldehyde, PM 2.5, PM 1, PM 0.1 and TVOC under normal
and closed conditions. As compared to normal conditions, the average values of all
pollutants were observed higher in closed conditions. Moreover, the outdoor
particles and indoor activities were reported to have a significant impact on indoor
PM.

8
1.5.9 Vilčeková et al.
Vilčeková et al., (2017) conducted the experimental assessment of IEQ
parameters such as relative humidity, indoor temperature, and CO2 along with
occupant satisfaction survey. The study was conducted in university classrooms for
9 weeks of summer semester as well as 9 weeks of the winter semester. The
instruments were fixed 1.1 above ground and placed at the center of the classroom.
The mean values of air temperature found for winter and summer season were
23.1°C and 24.8°C respectively. Similarly, mean values of relative humidity found
for winter and summer season were 41.15 % and 36.28 % respectively. Also, the
mean values of CO2 concentration found for winter and summer season were
1315.88 ppm and 1094.62 ppm (5% reduction) respectively.
1.5.10 Kumar et al.
Kumar et al., (2016) conducted field study to investigate the comfort
boundaries given by ASHRAE at three different ranges of indoor air velocities (up
to 0.2 m/s, 0.2 m/s - 0.5 m/s, 0.5 m/s – 1.5 m/s) in composite climate of India. The
field study was done on 32 naturally ventilated buildings, 2610 total samples were
collected over a span of 4 years. Class-II protocol of field measurement was used to
record the surrounding conditions of occupants. Extended comfort temperature at
elevated airspeed was calculated by the method given by ISO-7730 and ASHRAE
55-2013. The results showed new extended boundaries of acceptable zone by taking
into account diverse adaptations including the part of air velocity to increase comfort
temperature.
1.5.11 Aries et al.
Aries et al., (2015) presented the review of the effects of daylight on
occupant health. The results showed the effect of daylight can be psychological and
physiological. Also, the occupant health significantly associated with daylight
potential. Further, the study stated that the building occupant spends the 90% of their
time in indoors and often in contact with poor lighting conditions. The amount of
daylight at the indoor (open window) was found to be higher than outdoor, which
affects the occupant health more.
9
1.5.12 Dhaka et al.
Dhaka et al., (2015) conducted the field study in 30 naturally ventilated
buildings on the basis of thermal comfort at composite climate of India. The
buildings included office as well as residential buildings. The occupant satisfaction
survey also conducted to analysed preference and sensation for relative humidity air
velocity and room temperature. Class-II protocol of field measurement was used to
record the surrounding conditions of occupants. The results showed a strong
correlation between indoor temperature condition with outdoor temperature
condition. Including all data for every season gave the neutral temperature at 27.2
°C and it was directly affected by the seasonal difference. Occupant satisfaction for
thermal comfort was found to be 80% and 90% which was found to be higher as
compared with limit defined by ASHRAE.
1.5.13 Fabbria et al.
Fabbria et al., (2015) stated that improve in relationship between building
IEQ and energy performance is an important factor. Fabbria (2015) conduct IEQ
investigation in low energy performance building which consumes less than 25
kWh/m2year and lays in Class A+ (according to STN EN 15251). The instrument
was placed at center of each room and also conditions of both heating and cooling
season was covered. The results showed that it not necessary that low energy
performance building can give a better IEQ, especially for the summer season.
1.5.14 Sakhare et al.
Sakhare et al., (2014) reviewed and analysed different standard of IEQ and
investigated the different assessment models and IEQ contributing elements. The
study also analysed the multiparametric comfort to enhance the work productivity
and occupant’s health. The study concluded the prioritization of IEQ elements on the
basis of different literature and stats the priority of IEQ elements in descending order
was found to be thermal comfort, acoustic comfort, IAQ and lighting comfort.
Furthermore, Assessment of thermal comfort, acoustic comfort, IAQ and lighting
comfort was found to be necessary to achieve comfort on the basis of IEQ. The
occupant satisfaction survey along with physical measurement of parameters was
found to be the most effective way to examine the IEQ elements.
10
1.5.15 Chithra et al.
Chithra et al., (2012) conducted an investigation of IAQ parameters in
naturally ventilated classrooms of school building situated near to roadway at
Chennai city for both winter and summer season. The instruments were placed at
center of room and 1 m above the ground level. The average value of indoor CO,
PM 1, PM 2.5 and PM 10 for winter and summer seasons found to be 0.10 ± 0.18,
43 ± 24, 61 ± 29, 149 ± 69 µg/m3 and 0.11 ± 0.14, 18 ± 9, 32 ± 16, 95 ± 61 µg/m3
respectively. The RSPM found to higher in winter season as compared to summer
season. The higher value of PM 10 was found in indoor as compare to outdoor
which was found to be due to indoor activities of occupants in the classrooms. PM 1,
PM 10 and CO concentration were found too high due to higher contribution of
outdoor concentrations.
1.5.16 Huang et al.
Huang et al., (2012) conducted field survey study to investigate the comfort
range of IEQ elements such as indoor thermal, lux level, and acoustic comfort along
with occupant satisfaction survey. The study was carried out at Office room size
3×3×3 m3 with center table of Tsinghua University in Beijing with 120 different
occupants. The measurements were taken 1 m away from the walls and close to
occupant sitting. The results showed that the thermal comfort and acoustic comfort
plays major role in acceptance of IEQ. The range of comfortable operative
temperature, illuminance, and noise level were found to be 20.9°C to 30.4°C, above
300 Lux and below 49.6 dB reactively.
1.5.17 Kulshreshtha et al.
Kulshreshtha et al., (2010) conducted a competitive investigation of the IAQ
parameters such as respirable suspended particulate matter, NO2, CO and SO2 in
households of urban slums and controlled sites in Delhi. Further, a spirometry test
was conducted on occupant to find the incidence of ARI. Measurements were
conducted in both summer and winter seasons. Measurement time was between
10:00 to 16:00 during a day. To find the symptoms of sick building syndrome
occupant interview surveys were also conducted. The results showed that the
11
maximum indoor air pollutants concentrations were found during winters in
households which associated respiratory diseases like wheezing, breathlessness,
phlegm, and coughs among occupants, especially in women. Due to the efficient
dispersion of pollutants in summer the concentrations of pollutants were found to be
lower. The NOx concentration sources were found to be gas and kerosene stoves in
indoor and vehicular exhausts in outdoor.
1.5.18 Lee et al.
Lee et al., (2010) conducted the study compared IEQ elements such as
thermal comfort, lighting comfort, and IAQ within the 5 different office types in
LEED certified buildings. The study also related the job performance and
environmental satisfaction of employees. The five different types of offices were
private shared, private enclosed, open-plan with low cubicle less than 50 and open-
plan with higher cubicle over 50, and open-plan without partitions. This study took
data from CBE database along with online occupant satisfaction. Total 3533 surveys
were conducted. Job performance was found to be enhanced by good IAQ in
individual office as compared with both lower and higher cubical. Higher cubical
showed the less satisfaction on the basis of lighting comfort as compared to
remaining four office types. Also, thermal comfort was found to be equally affected
the job performance and environmental satisfaction in all 5 types of offices.
1.5.19 Lai et al.
Lai et al., (2009) investigated the IEQ parameters on32 residential
apartments with 125 occupants in Hong Kong. Four IEQ parameters including
carbon dioxide concentration operative temperature, illumination level, and
equivalent noise level analyzed at the sampling locations which were the activity
area of each occupant. Measurements were conducted for 15 minutes at each
measurement locations. Based on the total occupant's response both indoor thermal
comfort and acoustic comfort have dominantly affected the acceptance of IEQ as
compare with lighting comfort and IAQ. The acceptable range of operative
temperature was found to be up to 29.8 °C by using clothing adjustment. The
acceptance of equivalent noise level and Lux level were found to be up to 70 dBA
and increase gradually 100 Lux to 500 Lux respectively.
12
1.5.20 Wong et al.
Wong et al., (2008) investigated the IEQ parameters in offices in Hang Kong
with 293 different occupants. The IEQ parameters such as operative temperature,
equivalent noise level, carbon dioxide concentration, and illumination level along
with occupant satisfaction were analysed using multivariate logistic regression
model. The results represented that the above four parameters had significantly
affect the overall comfort in IEQ. The relative significance of IEQ elements on the
basis occupant questionnaire stats the priority of IEQ elements in descending order
was found to be thermal comfort, air quality, and acoustic comfort illuminance
level. Occupant satisfaction was found to be 80% for good IEQ conditions and it
can drop to 40%.
1.5.21 Nasrollahi et al.
Nasrollahi et al., (2007) investigated the Indoor Environment Quality at 6
office building in Tehran (Iran). The main focus of the study was thermal comfort
and did only occupant satisfaction based study. The occupant satisfaction
questionnaire was prepared on the basis of survey questionnaire of Sick Building
Syndrome (SBS) used by the Building Research Establishment (BRE) and Centre of
the Built Environment (CBE) at the University of California, Berkeley. In the
questionnaire satisfaction with a condition such as temperature, the condition of
different seasons, ambient conditions, office layout and personal adjust and control
in workplace were added. The results show overall satisfaction in different buildings
were 25% and 22% in winter and summers reactively and concluded that the thermal
comfort directly affects the overall IEQ satisfaction.
1.5.22 Begemann et al.
Begemann et al., (1997) investigated long-term responses of occupant of
window zone of typical office buildings. The results showed that most occupants
prefer the day-light over artificial light. Also, occupant prefers most lighting as
compared with threshold defined the different standards. Further, the biological light
requirement and visual light requirement were found to be different from one
another. The effects of visual performance and circadian cycles affect differently to
different occupants.
13
1.5.23 A. R. M. Nasir et al.
A. R. M. Nasir et.al (2011) investigated the indoor environment Quality at
different places. The main focus of the study was on noise pollution. Noise pollution
from a scientific definition is the signal that does not give any information and the
strength that changes dramatically over time, while the general definition is a sound
that is not preferred that causes discomfort. This is when the sound reproduction
occurs in places that are not appropriate with more than 80 decibels (dB). In
addition, the effects of noise pollutions are also affecting the ears (auditory effect)
and the outer ear (non-auditory effect). Effects of noise pollution caused by noise
that is too loud in excess of 120 decibels (dB) can cause damage to the small hearing
bones and can impair hearing permanently. It can also cause personal pain,
dizziness, nausea and vomit, speech disturbances and behavior that can deteriorate
the quality and efficiency of their work. Among the methods to achieve a
comfortable sound level is to provide sound absorbing materials transferrable either
through air or activity. Good design during construction could reduce noise through
the use of appropriate materials.
1.5.24 Tiberiu Catalina et al.
Tiberiu Catalina et.al (2011) investigated the indoor environment Quality at
different schools and study centers. The main focus of the study was on noise
pollution. Noise may be very disturbing and may even weaken the student’s
intellectual performances. Noise pollution can originate from the outdoor
environment (through the glazing area), from the ventilation system (noisy fans,
high ventilation rate) or other adjacent interior spaces (corridors stepping noise or
loud talking). The building envelope should ensure required sound insulation against
both airborne noise and structure-borne noise. In general, sound insulation against
airborne noise that is expected from the building envelope is of primary importance
while the weak parts are the windows. Numerous studies have analyzed the sound
transmission through closed or opened windows and the impact on the room
acoustics. Most of them were orientated toward the sound insulation of the glazing
or the impact of street noise on the indoor conditions. American National Standards
Institute (ANSI) and EN15215 standard suggest that the background noise in the
14
classroom should be below 35 dB(A). The indoor acoustical comfort is generally
evaluated by using the indoor sound pressure level (Lpi) as it was found in different
research studies and it is considered the output parameter of the acoustic model
prediction. A 100% fulfillment of the acoustic comfort is 30 dB(A) while the
minimum comfort is of 60 dBA (value from where the study process cannot be
accomplished anymore).
1.5.25 Tiberiu Catalina et al.
Tiberiu Catalina et al. (2011) investigated the indoor environment Quality,
the main focus of the study was on Visual comfort. It is defined as “a subjective
condition of visual well-being induced by the visual environment”. Although the
definition implies that there is a psychological dimension of comfort, a number of
physical properties of the visual environment are defined and used to evaluate its
quality in an objective way. Visual conditions are characterized by such parameters
as luminance distribution, illuminance and its uniformity, glare, colour of light,
colour rendering, flicker rate and amount of daylight. Daylighting contributes to a
better IEQ and has a positive effect on an occupant’s perception of productivity and
performance. Daylight design requires a number of variable resources, among which
the fenestration is the key piece. Design decisions need to be made early, so easy
models are needed to be used for predicting the daylighting potential and to explore
different scenarios of building design. The required lighting level is independent of
season and its design value. The monthly average illuminance level (Ea) is
considered the output parameter for the visual comfort. This level is established
based on the average value obtained by the lux meter.
1.5.26 Li Huang et al.
Li Huang et al. (2011) investigated the indoor environment Quality, the main
focus of the study was on thermal comfort. During the survey, mean daily outdoor
temperatures ranged from 25.1°C to 28.8°C. Operative temperature was used as the
indoor temperature index since it is comprised of both convection and radiation. The
operative temperature in the survey ranged from 17.8°C to 31.4°C. The relative
humidity ranged from 40% to 65%, with an average of 51%. The air velocity was
0.02 m/se0.42 m/s; among all the samples, the average value was 0.16 m/s and most

15
samples had an air velocity lower than 0.2 m/s. When the satisfaction level of the
thermal environment was greater than 0, which indicated that subjects felt satisfied
with the thermal environment, the operative temperature ranged from 20.9°C to
30.4°C. The highest level of satisfaction with the thermal environment occurred
when the operative temperature was 25.7°C. From these results, it can be seen that
even in an air-conditioned environment, subjects had a wide range of acceptable
temperatures. The upper limit of 30.4°C was higher than the 28°C which was set as
the upper limit in the Chinese design code for air-conditioned rooms in summer.
1.5.27 A.C.K. Lai et al.
A.C.K. Lai et al. (2009) investigated the indoor environment Quality, the
main focus of the study was on carbon dioxide (CO2). The measured ranges of CO2
concentration (330–1500 ppm), horizontal illumination level (187–1522 lx) and
equivalent sound pressure level (67–78 dBA) were approximated by geometric
distributions. The geometric means (GMs) as well as geometric standard deviations
(GSDs) for the levels of CO2, horizontal illumination, and equivalent sound
pressure respectively were: GM = 600 ppm, GSD = 1.6 ppm; GM = 112 lx, GSD =
2.9 lx; and GM = 67 dBA, GSD = 1.1 dBA. Based on the regression coefficients
determined from the field measurements, the correlations between the occupant
acceptance and each of the environmental parameters were studied and found to be
statistically significant. According to the survey results from 125 interviewees, 118
of them were satisfied with the IAQ, 115 with the visual environment, and 113 with
the aural environment. For unsatisfactory CO2 levels, the occupants would open a
window or turn on an extraction fan for fresh air supply. The choice of illumination
level was task-related and dependent on the energy cost. As occupants had little
control over the noise source outside their residential buildings, they expressed
significant concerns about the noise control measures. Traffic noise and noises from
neighborhood activities were the typical sources causing unsatisfactory aural
environmental quality.
1.5.28 A. R. M. Nasir et al.
A. R. M. Nasir et.al (2011) investigated the indoor environment Quality, the
main focus of the study was on particulate matter in Klang Valley. Suspended
particles (PM10) are the particles with the size less than 10 1J. M, which could be

16
sucked into the lungs. PM, is a mixture of solids and liquid droplets floating in the
air. PM10 are so small that they can get into the lungs, potentially causing serious
health problems. It is an important indicator for assessing air quality in the Klang
Valley. The guidelines have been proposed for air quality control in Malaysia which
150 μg/m3. Hazy conditions are said, when the level of suspended particles is twice
greater than normal condition, while visibility or visible distance is less than 1 km
and a relative humidity of less than 95%. Among the diseases often associated with
the occurring haze problem is asthma attack. Asthma is a disease that occurs in the
airways of individuals who are sensitive to stimuli from external factors. The disease
is caused by the narrowness of the respiratory tract as a result of the movement of
spastic bronchitis, swelling of the bronchial branches and excess mucus production.
There are two types of asthma, extrinsic asthma caused by external factors such as
eating dirt or dust in the air or the weather. Meanwhile, intrinsic asthma is caused by
Indoor factors such as genetics, emotional tension or fatigue.
17
CHAPTER 2 ERRATUM AND ADDENDUM
2.1 Introduction While reviewing ISHRAE IEQ standard, the research team found requirement of some clarifications and corrections regarding
some possible typos. Also, there are some parts where some additional information is required. So both corrections and addition are
purposed as erratum and addendum for the ISHRAE Standard-10001:2016.
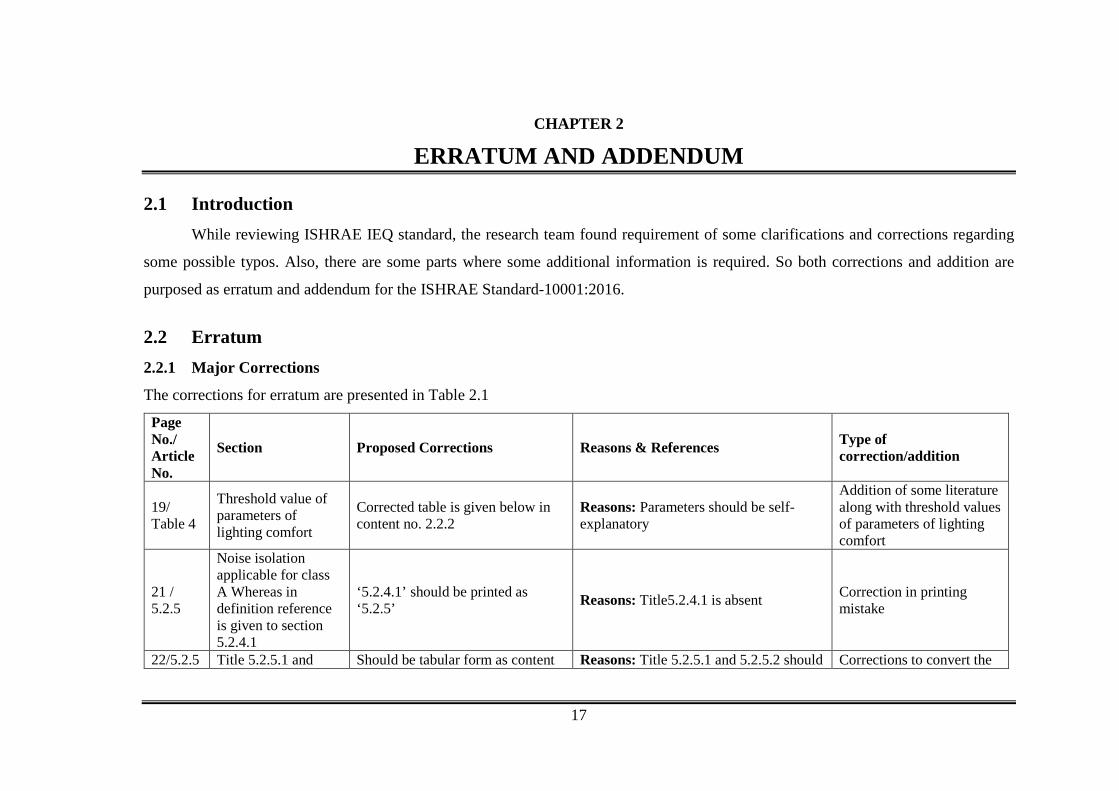
2.2 Erratum 2.2.1 Major Corrections
The corrections for erratum are presented in Table 2.1
Page No./ Article No.
Section Proposed Corrections Reasons & References Type of correction/addition
19/ Table 4
Threshold value of parameters of lighting comfort
Corrected table is given below in content no. 2.2.2
Reasons: Parameters should be self-explanatory
Addition of some literature along with threshold values of parameters of lighting comfort
21 / 5.2.5
Noise isolation applicable for class A Whereas in definition reference is given to section 5.2.4.1
‘5.2.4.1’ should be printed as ‘5.2.5’ Reasons: Title5.2.4.1 is absent Correction in printing
mistake
22/5.2.5 Title 5.2.5.1 and Should be tabular form as content Reasons: Title 5.2.5.1 and 5.2.5.2 should Corrections to convert the
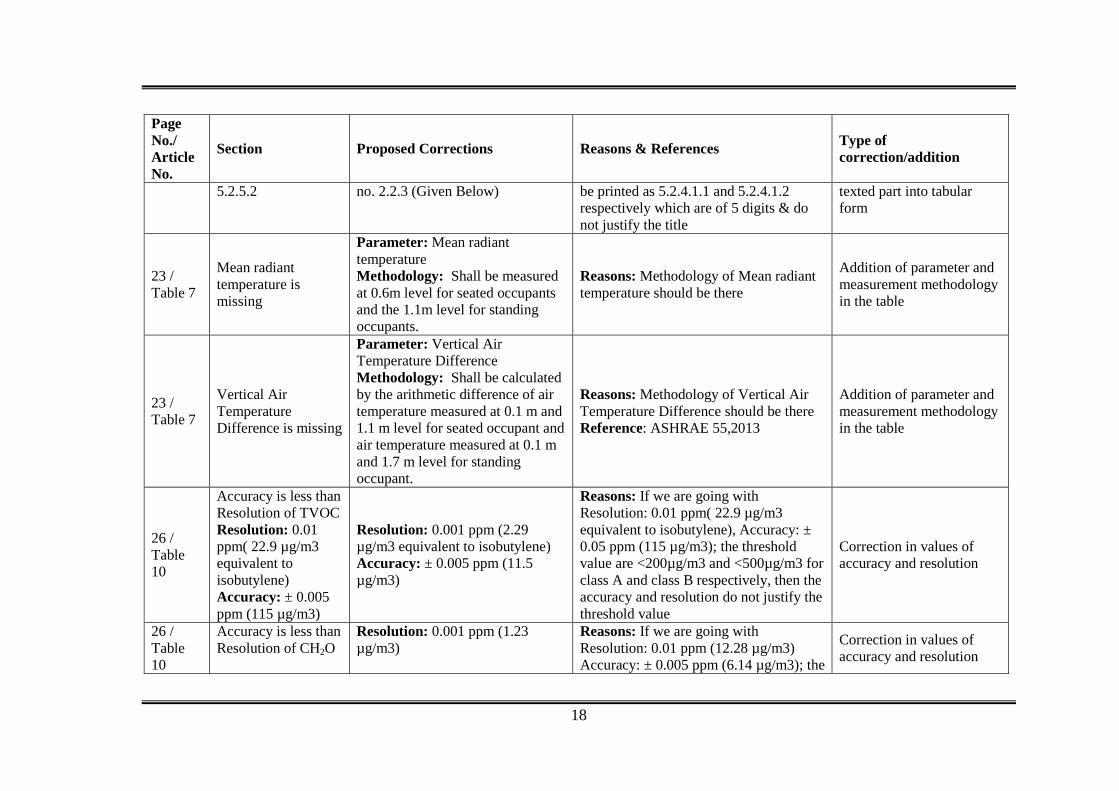
18
Page No./ Article No.
Section Proposed Corrections Reasons & References Type of correction/addition
5.2.5.2 no. 2.2.3 (Given Below) be printed as 5.2.4.1.1 and 5.2.4.1.2 respectively which are of 5 digits & do not justify the title
texted part into tabular form
23 / Table 7
Mean radiant temperature is missing
Parameter: Mean radiant temperature Methodology: Shall be measured at 0.6m level for seated occupants and the 1.1m level for standing occupants.
Reasons: Methodology of Mean radiant temperature should be there
Addition of parameter and measurement methodology in the table
23 / Table 7
Vertical Air Temperature Difference is missing
Parameter: Vertical Air Temperature Difference Methodology: Shall be calculated by the arithmetic difference of air temperature measured at 0.1 m and 1.1 m level for seated occupant and air temperature measured at 0.1 m and 1.7 m level for standing occupant.
Reasons: Methodology of Vertical Air Temperature Difference should be there Reference: ASHRAE 55,2013
Addition of parameter and measurement methodology in the table
26 / Table 10
Accuracy is less than Resolution of TVOC Resolution: 0.01 ppm( 22.9 µg/m3 equivalent to isobutylene) Accuracy: ± 0.005 ppm (115 µg/m3)
Resolution: 0.001 ppm (2.29 µg/m3 equivalent to isobutylene) Accuracy: ± 0.005 ppm (11.5 µg/m3)
Reasons: If we are going with Resolution: 0.01 ppm( 22.9 µg/m3 equivalent to isobutylene), Accuracy: ± 0.05 ppm (115 µg/m3); the threshold value are <200µg/m3 and <500µg/m3 for class A and class B respectively, then the accuracy and resolution do not justify the threshold value
Correction in values of accuracy and resolution
26 / Table 10
Accuracy is less than Resolution of CH2O
Resolution: 0.001 ppm (1.23 µg/m3)
Reasons: If we are going with Resolution: 0.01 ppm (12.28 µg/m3) Accuracy: ± 0.005 ppm (6.14 µg/m3); the
Correction in values of accuracy and resolution
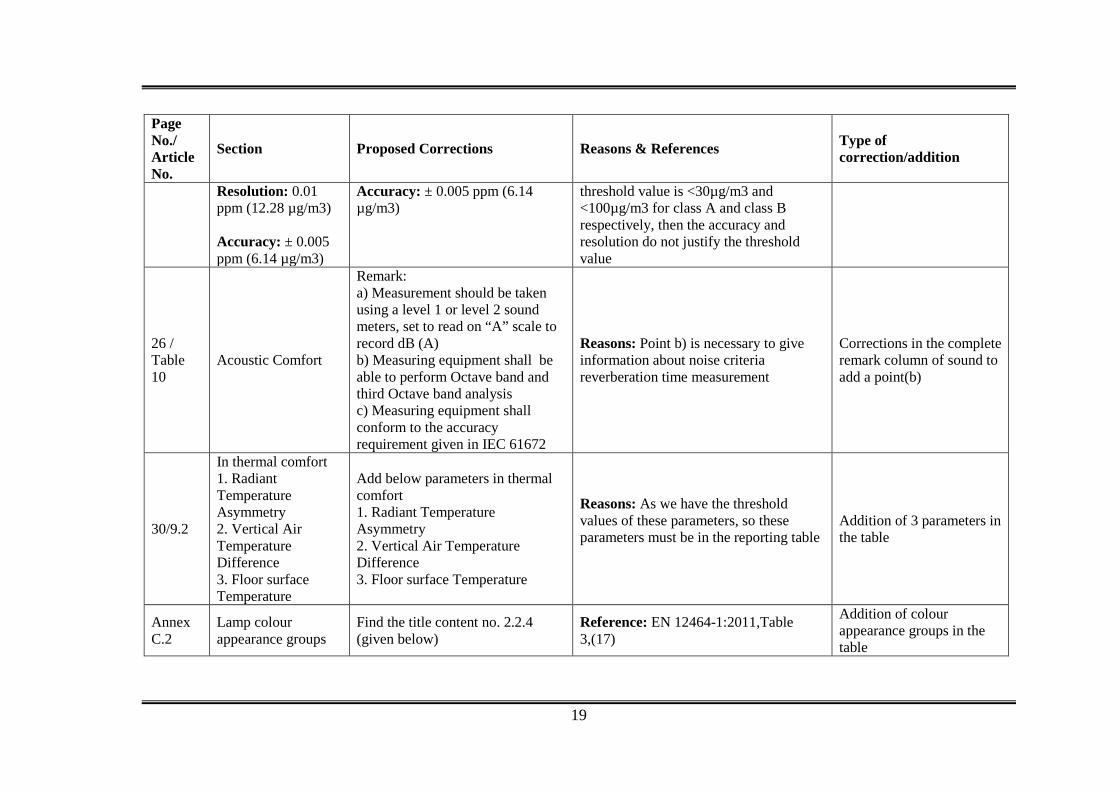
19
Page No./ Article No.
Section Proposed Corrections Reasons & References Type of correction/addition
Resolution: 0.01 ppm (12.28 µg/m3) Accuracy: ± 0.005 ppm (6.14 µg/m3)
Accuracy: ± 0.005 ppm (6.14 µg/m3)
threshold value is <30µg/m3 and <100µg/m3 for class A and class B respectively, then the accuracy and resolution do not justify the threshold value
26 / Table 10
Acoustic Comfort
Remark: a) Measurement should be taken using a level 1 or level 2 sound meters, set to read on “A” scale to record dB (A) b) Measuring equipment shall be able to perform Octave band and third Octave band analysis c) Measuring equipment shall conform to the accuracy requirement given in IEC 61672
Reasons: Point b) is necessary to give information about noise criteria reverberation time measurement
Corrections in the complete remark column of sound to add a point(b)
30/9.2
In thermal comfort 1. Radiant Temperature Asymmetry 2. Vertical Air Temperature Difference 3. Floor surface Temperature
Add below parameters in thermal comfort 1. Radiant Temperature Asymmetry 2. Vertical Air Temperature Difference 3. Floor surface Temperature
Reasons: As we have the threshold values of these parameters, so these parameters must be in the reporting table
Addition of 3 parameters in the table
Annex C.2
Lamp colour appearance groups
Find the title content no. 2.2.4 (given below)
Reference: EN 12464-1:2011,Table 3,(17)
Addition of colour appearance groups in the table
20
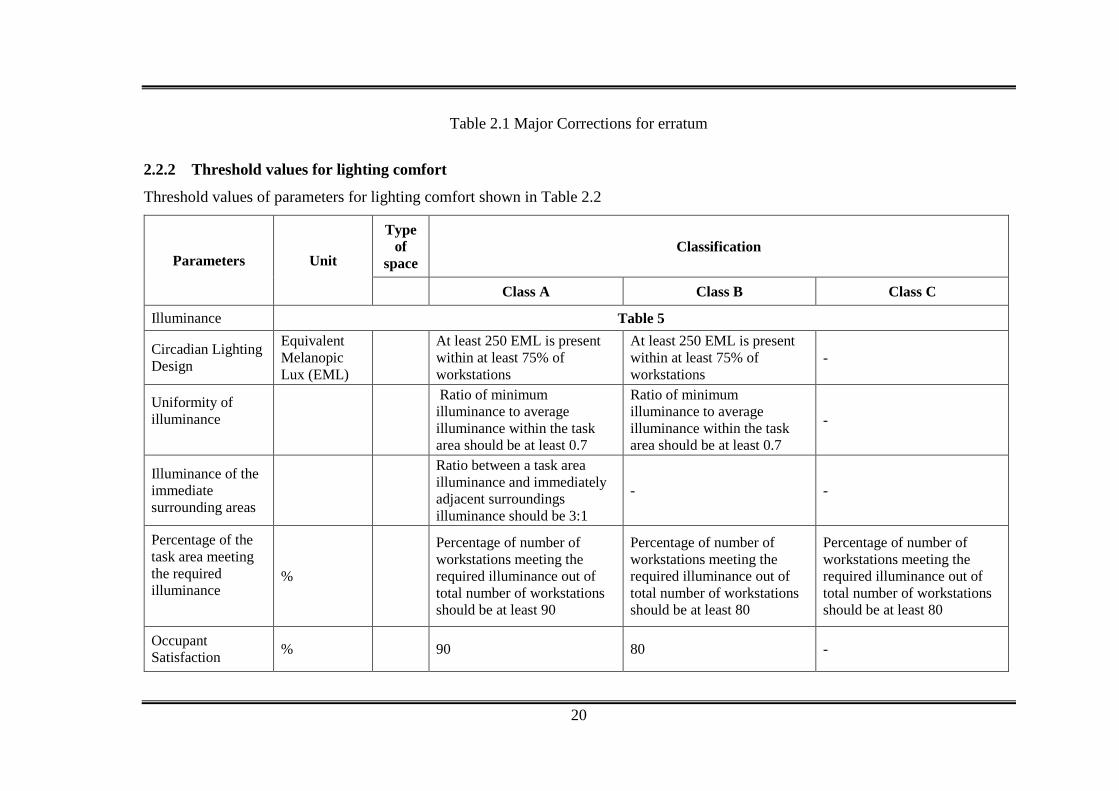
Table 2.1 Major Corrections for erratum
2.2.2 Threshold values for lighting comfort
Threshold values of parameters for lighting comfort shown in Table 2.2
Parameters Unit
Type of
space Classification
Class A Class B Class C
Illuminance Table 5
Circadian Lighting Design
Equivalent Melanopic Lux (EML)
At least 250 EML is present within at least 75% of workstations
At least 250 EML is present within at least 75% of workstations
-
Uniformity of illuminance
Ratio of minimum illuminance to average illuminance within the task area should be at least 0.7
Ratio of minimum illuminance to average illuminance within the task area should be at least 0.7
-
Illuminance of the immediate surrounding areas
Ratio between a task area illuminance and immediately adjacent surroundings illuminance should be 3:1
- -
Percentage of the task area meeting the required illuminance
%
Percentage of number of workstations meeting the required illuminance out of total number of workstations should be at least 90
Percentage of number of workstations meeting the required illuminance out of total number of workstations should be at least 80
Percentage of number of workstations meeting the required illuminance out of total number of workstations should be at least 80
Occupant Satisfaction % 90 80 -

21
Table 2.2 Threshold values of parameters for lighting comfort
2.2.3 Noise Isolation Class
Building Type of space Noise Isolation Class(NIC)
Office Between two offices Dw of at least 38dB
Where privacy is important Dw of at least 48dB
Cellular offices NIC of at least 40dB
Residential Partitions separating a water closet (WC) from a noise sensitive room Dnt,w of at least 38 dB
Hotels Partitions and floors between rooms and corridors Dnt,w of at least 50 dB
Table 2.3 Threshold value Noise Isolation Class
2.2.4 Light Source and Melanopic Ratio
Light source and Melanopic Ratio corresponding to different CCT (K) shown in Table 2.4
CCT(K) Colour Appearance Light Source Melanopic Ratio
2950
Warm
Fluorescent 0.43
2700 LED 0.45
2800 Incandescent 0.54
4000 Intermediate Fluorescent 0.58

22
4000 LED 0.76
5450
Cool
CIE E (Equal Energy) 1.00
6500 Fluorescent 1.02
6500 Daylight 1.10
7500 Fluorescent 1.11
Table 2.4 Light source and Melanopic Ratio corresponding to different CCT (K)
23
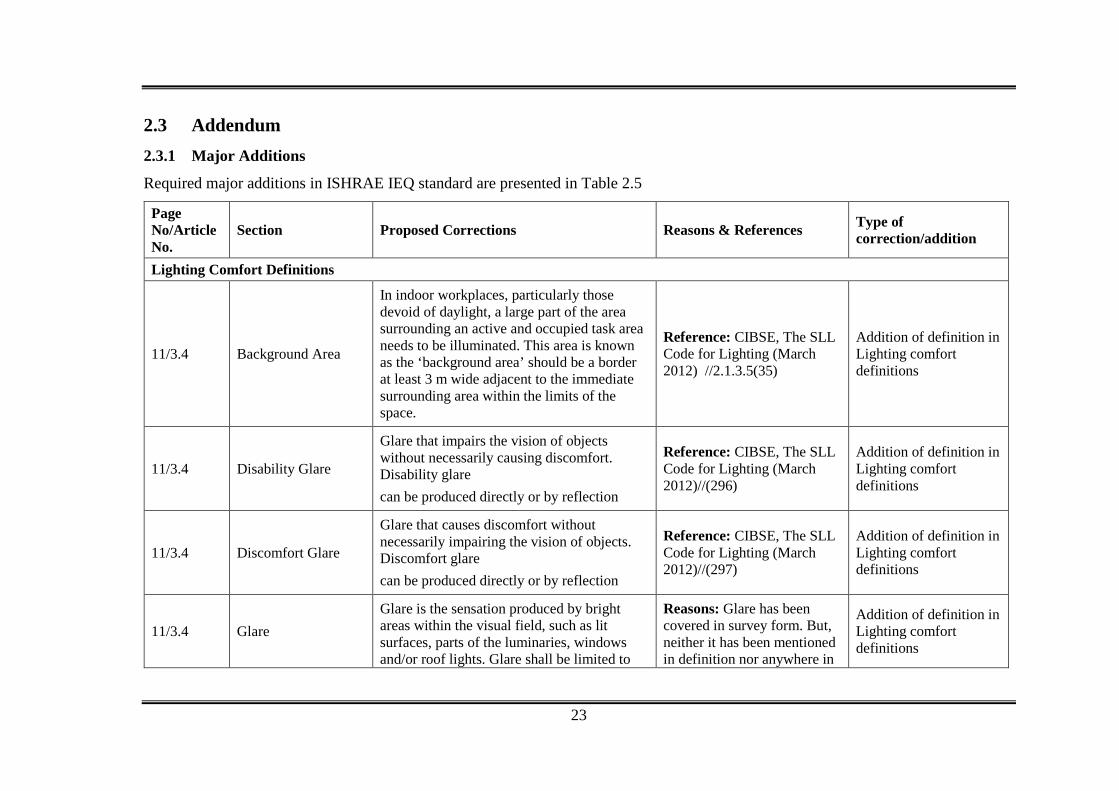
2.3 Addendum 2.3.1 Major Additions
Required major additions in ISHRAE IEQ standard are presented in Table 2.5
Page No/Article No.
Section Proposed Corrections Reasons & References Type of correction/addition
Lighting Comfort Definitions
11/3.4 Background Area
In indoor workplaces, particularly those devoid of daylight, a large part of the area surrounding an active and occupied task area needs to be illuminated. This area is known as the ‘background area’ should be a border at least 3 m wide adjacent to the immediate surrounding area within the limits of the space.
Reference: CIBSE, The SLL Code for Lighting (March 2012) //2.1.3.5(35)
Addition of definition in Lighting comfort definitions
11/3.4 Disability Glare
Glare that impairs the vision of objects without necessarily causing discomfort. Disability glare can be produced directly or by reflection
Reference: CIBSE, The SLL Code for Lighting (March 2012)//(296)
Addition of definition in Lighting comfort definitions
11/3.4 Discomfort Glare
Glare that causes discomfort without necessarily impairing the vision of objects. Discomfort glare can be produced directly or by reflection
Reference: CIBSE, The SLL Code for Lighting (March 2012)//(297)
Addition of definition in Lighting comfort definitions
11/3.4 Glare Glare is the sensation produced by bright areas within the visual field, such as lit surfaces, parts of the luminaries, windows and/or roof lights. Glare shall be limited to
Reasons: Glare has been covered in survey form. But, neither it has been mentioned in definition nor anywhere in
Addition of definition in Lighting comfort definitions

24
Page No/Article No.
Section Proposed Corrections Reasons & References Type of correction/addition
avoid errors, fatigue and accidents. main section. Reference: CIBSE, The SLL Code for Lighting (March 2012)//2.1.5
11/3.4 Reflected Glare The variety of ill effects on visual efficiency and comfort produced by unwanted reflection in and the task area
Reference: NBC 2016 Part 8 BUILDING SERVICE – SECTION 1 LIGHTING AND NATURAL VENTILATION
Addition of definition in Lighting comfort definitions
11/3.4
Task Area
Partial area in the workplace in which the visual task is carried out. For places where the size and location of the task area are unknown, the area where the task may occur shall be taken as the task area.
Reference: EN 12464-1:2002 /3.2/5
Addition of definition in Lighting comfort definitions
11/3.4 Veiling Reflections Specular reflections that appear on the object viewed and that partially or wholly obscure the details by reducing contrast
Reference: CIBSE, The SLL Code for Lighting (March 2012)//(314)
Addition of definition in Lighting comfort definitions
Acoustic Comfort Definitions
11/3.5 Background noise
The sound pressure levels in a given environment from all sources excluding a specific sound source being investigated or measured
Reference: NBC 2016 Part 8 BUILDING SERVICE – SECTION 4 ACOUSTICS, SOUND INSULATION AND NOISE CONTROL
Addition of definition in acoustic comfort definitions
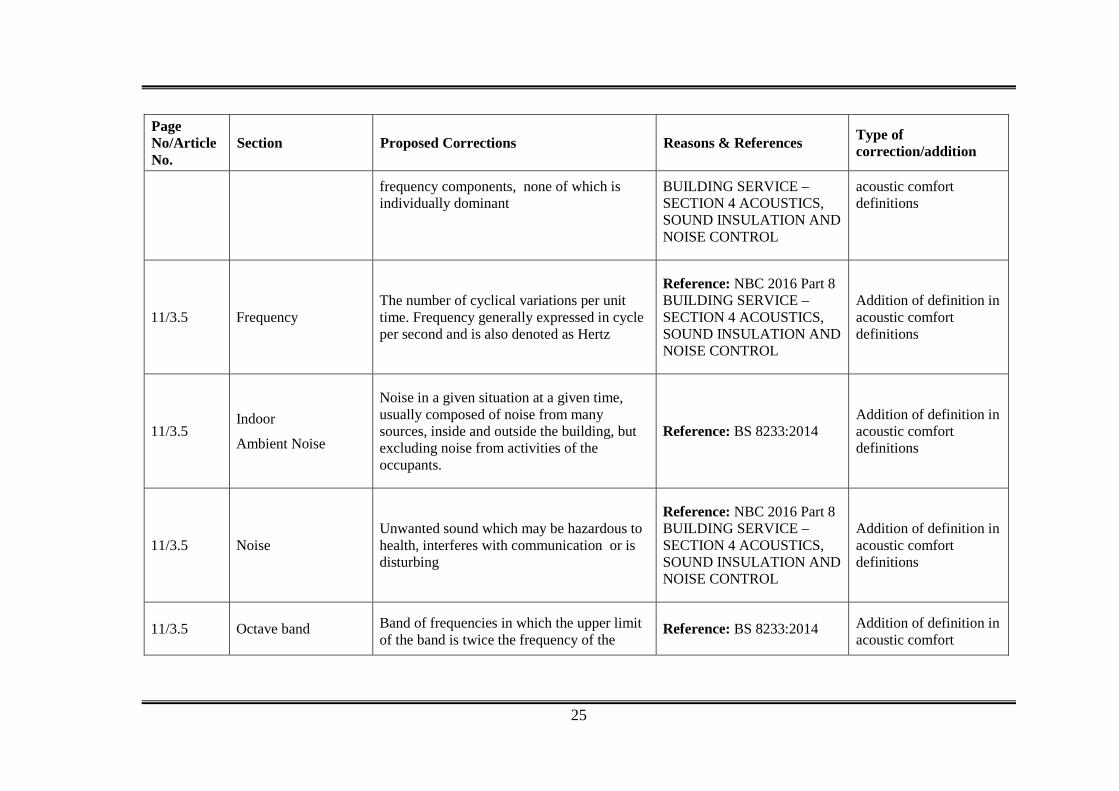
11/3.5 Broad Band Noise Spectrum consisting of a large number of Reference: NBC 2016 Part 8 Addition of definition in
25
Page No/Article No.
Section Proposed Corrections Reasons & References Type of correction/addition
frequency components, none of which is individually dominant
BUILDING SERVICE – SECTION 4 ACOUSTICS, SOUND INSULATION AND NOISE CONTROL
acoustic comfort definitions
11/3.5 Frequency The number of cyclical variations per unit time. Frequency generally expressed in cycle per second and is also denoted as Hertz
Reference: NBC 2016 Part 8 BUILDING SERVICE – SECTION 4 ACOUSTICS, SOUND INSULATION AND NOISE CONTROL
Addition of definition in acoustic comfort definitions
11/3.5 Indoor
Ambient Noise
Noise in a given situation at a given time, usually composed of noise from many sources, inside and outside the building, but excluding noise from activities of the occupants.
Reference: BS 8233:2014 Addition of definition in acoustic comfort definitions
11/3.5 Noise Unwanted sound which may be hazardous to health, interferes with communication or is disturbing
Reference: NBC 2016 Part 8 BUILDING SERVICE – SECTION 4 ACOUSTICS, SOUND INSULATION AND NOISE CONTROL
Addition of definition in acoustic comfort definitions
11/3.5 Octave band Band of frequencies in which the upper limit of the band is twice the frequency of the
Reference: BS 8233:2014 Addition of definition in acoustic comfort
26
Page No/Article No.
Section Proposed Corrections Reasons & References Type of correction/addition
lower limit definitions
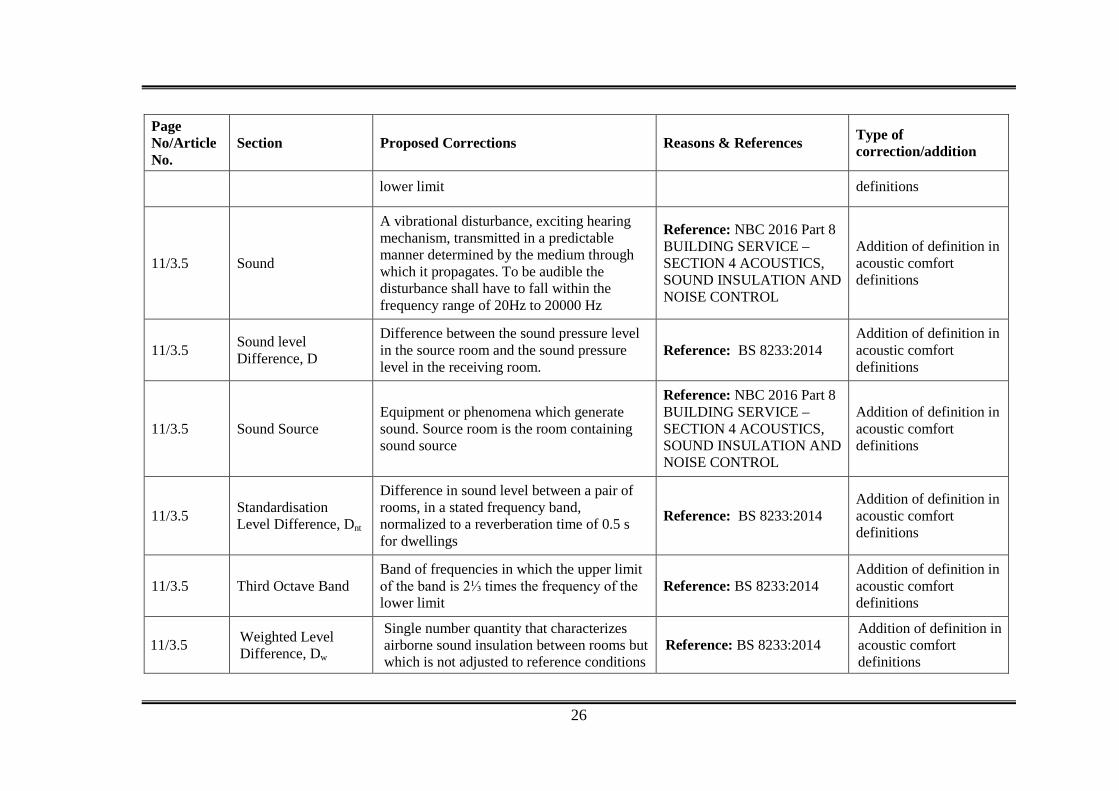
11/3.5 Sound
A vibrational disturbance, exciting hearing mechanism, transmitted in a predictable manner determined by the medium through which it propagates. To be audible the disturbance shall have to fall within the frequency range of 20Hz to 20000 Hz
Reference: NBC 2016 Part 8 BUILDING SERVICE – SECTION 4 ACOUSTICS, SOUND INSULATION AND NOISE CONTROL
Addition of definition in acoustic comfort definitions
11/3.5 Sound level Difference, D
Difference between the sound pressure level in the source room and the sound pressure level in the receiving room.
Reference: BS 8233:2014 Addition of definition in acoustic comfort definitions
11/3.5 Sound Source Equipment or phenomena which generate sound. Source room is the room containing sound source
Reference: NBC 2016 Part 8 BUILDING SERVICE – SECTION 4 ACOUSTICS, SOUND INSULATION AND NOISE CONTROL
Addition of definition in acoustic comfort definitions
11/3.5 Standardisation Level Difference, Dnt
Difference in sound level between a pair of rooms, in a stated frequency band, normalized to a reverberation time of 0.5 s for dwellings
Reference: BS 8233:2014 Addition of definition in acoustic comfort definitions
11/3.5 Third Octave Band Band of frequencies in which the upper limit of the band is 2⅓ times the frequency of the lower limit
Reference: BS 8233:2014 Addition of definition in acoustic comfort definitions
11/3.5 Weighted Level Difference, Dw
Single number quantity that characterizes airborne sound insulation between rooms but which is not adjusted to reference conditions
Reference: BS 8233:2014 Addition of definition in acoustic comfort definitions
27
Page No/Article No.
Section Proposed Corrections Reasons & References Type of correction/addition
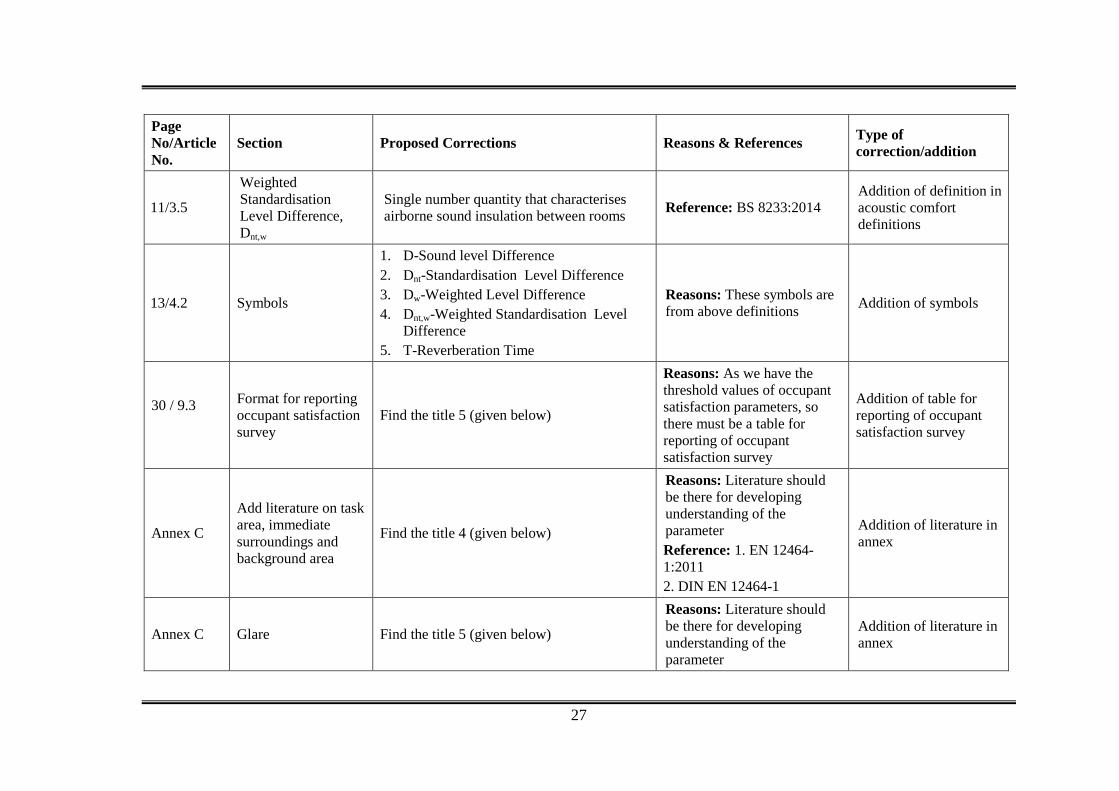
11/3.5
Weighted Standardisation Level Difference, Dnt,w
Single number quantity that characterises airborne sound insulation between rooms Reference: BS 8233:2014
Addition of definition in acoustic comfort definitions
13/4.2 Symbols
1. D-Sound level Difference 2. Dnt-Standardisation Level Difference 3. Dw-Weighted Level Difference 4. Dnt,w-Weighted Standardisation Level
Difference 5. T-Reverberation Time
Reasons: These symbols are from above definitions Addition of symbols
30 / 9.3
Format for reporting occupant satisfaction survey
Find the title 5 (given below)
Reasons: As we have the threshold values of occupant satisfaction parameters, so there must be a table for reporting of occupant satisfaction survey
Addition of table for reporting of occupant satisfaction survey
Annex C
Add literature on task area, immediate surroundings and background area
Find the title 4 (given below)
Reasons: Literature should be there for developing understanding of the parameter Reference: 1. EN 12464-1:2011 2. DIN EN 12464-1
Addition of literature in annex
Annex C Glare Find the title 5 (given below)
Reasons: Literature should be there for developing understanding of the parameter
Addition of literature in annex

28
Page No/Article No.
Section Proposed Corrections Reasons & References Type of correction/addition
Reference: 1. NBC 2016 Part 8 BUILDING SERVICE – SECTION 1 LIGHTING AND NATURAL VENTILATION 2. CIBSE, The SLL Code for Lighting (March 2012) //2.1.3.4(34-35) 3. ‘The lighting handbook’ by ‘Zumtobel lighting GmbH’ 4. Lighting handbook INDALUX 2002
Annex C
Recommended methodology to calculate lighting parameters
Find the title 7 (given below)
Reasons: An example is needed for clarification of methodology to calculate lighting parameters
Addition of an example in annex
Annex D Sound Isolation Find the title 8 (given below)
Reasons: Literature should be there for developing understanding of the parameter Reference: ISO 16283-1:2014(E)
Addition of formulas along with some methodology in annex
Annex D Reverberation Time Find the title 9 (given below)
Reasons: Literature should be there to developing understanding about the parameter
Addition of literature for calculation methodology in annex
29
Page No/Article No.
Section Proposed Corrections Reasons & References Type of correction/addition
Reference: ISO 3382-1:2009(E)
Table 2.5 Required major additions for addendum
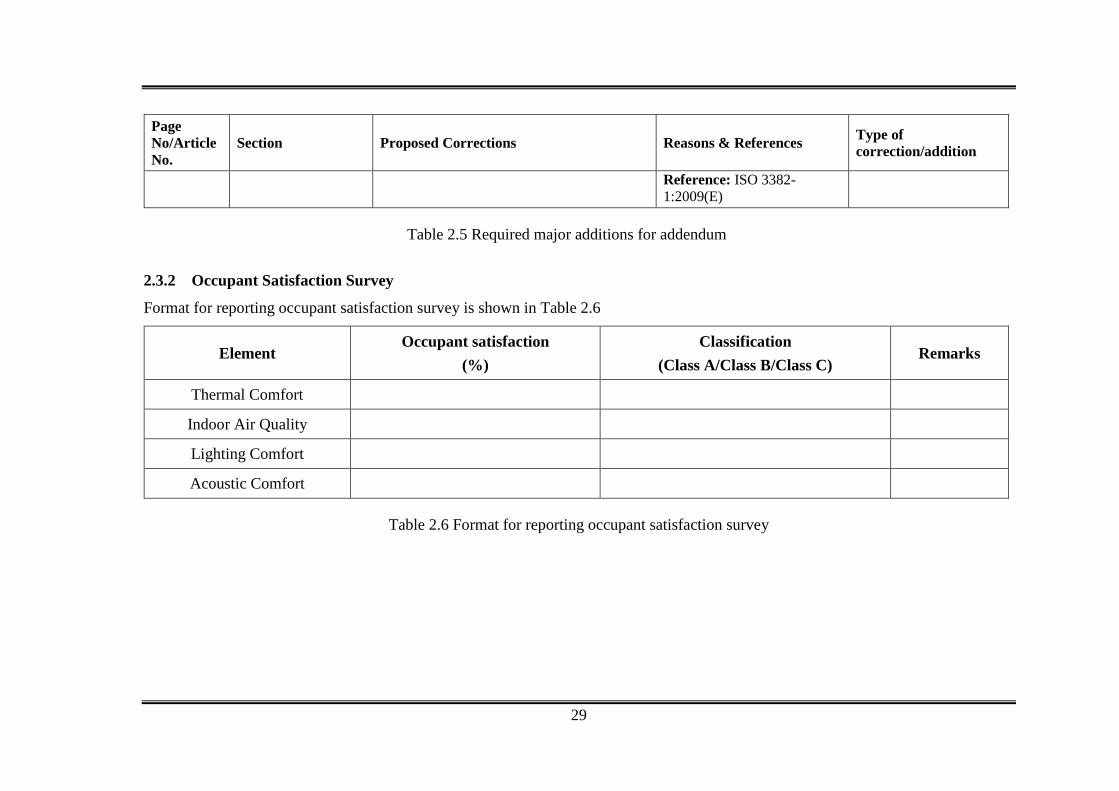
2.3.2 Occupant Satisfaction Survey
Format for reporting occupant satisfaction survey is shown in Table 2.6
Element Occupant satisfaction
(%) Classification
(Class A/Class B/Class C) Remarks
Thermal Comfort
Indoor Air Quality
Lighting Comfort
Acoustic Comfort
Table 2.6 Format for reporting occupant satisfaction survey
30
2.3.3 Lighting Area
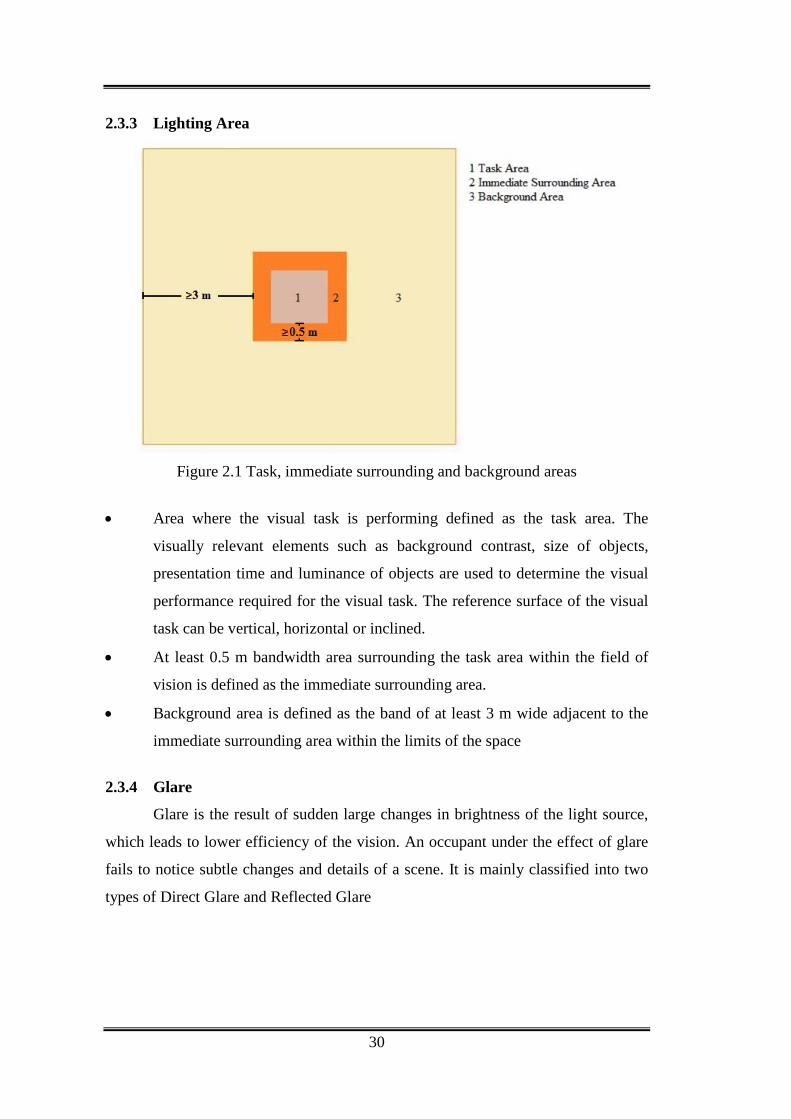
Figure 2.1 Task, immediate surrounding and background areas
• Area where the visual task is performing defined as the task area. The
visually relevant elements such as background contrast, size of objects,
presentation time and luminance of objects are used to determine the visual
performance required for the visual task. The reference surface of the visual
task can be vertical, horizontal or inclined.
• At least 0.5 m bandwidth area surrounding the task area within the field of
vision is defined as the immediate surrounding area.
• Background area is defined as the band of at least 3 m wide adjacent to the
immediate surrounding area within the limits of the space
2.3.4 Glare
Glare is the result of sudden large changes in brightness of the light source,
which leads to lower efficiency of the vision. An occupant under the effect of glare
fails to notice subtle changes and details of a scene. It is mainly classified into two
types of Direct Glare and Reflected Glare
31
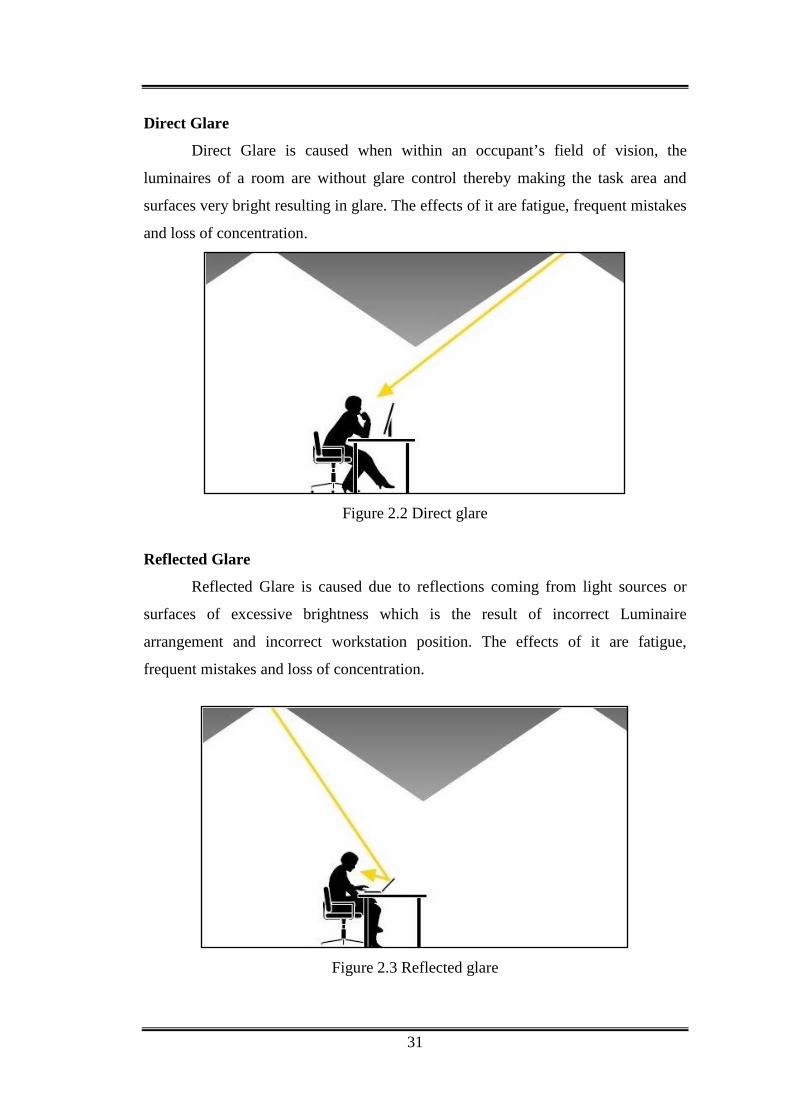
Direct Glare
Direct Glare is caused when within an occupant’s field of vision, the
luminaires of a room are without glare control thereby making the task area and
surfaces very bright resulting in glare. The effects of it are fatigue, frequent mistakes
and loss of concentration.
Figure 2.2 Direct glare
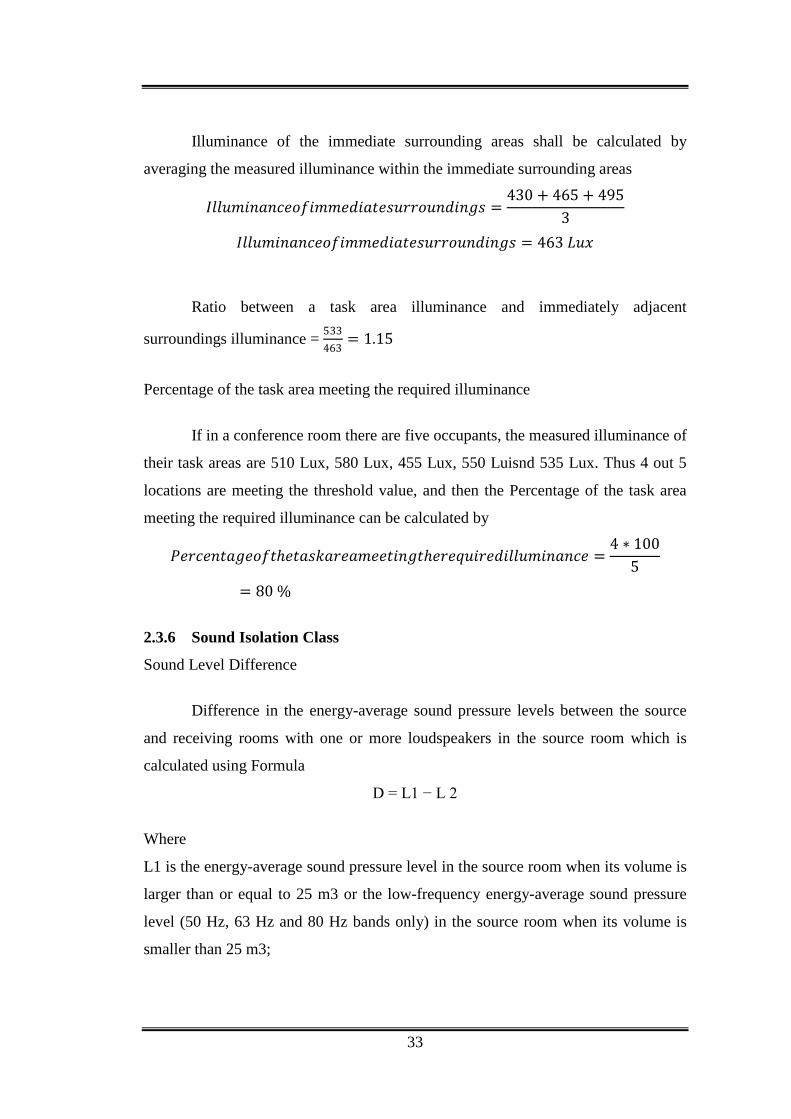
Reflected Glare
Reflected Glare is caused due to reflections coming from light sources or
surfaces of excessive brightness which is the result of incorrect Luminaire
arrangement and incorrect workstation position. The effects of it are fatigue,
frequent mistakes and loss of concentration.
Figure 2.3 Reflected glare

32
In general, Glare mainly experienced either as physiological effect known as
Disability glare or psychological glare known as Discomfort glare
Disability glare
Disability glare is direct impairment of visibility and visual capacity by the
effect of glare. As an effect of glare occurs due to luminance from immediate
background light source disability glare is happed. Discomfort does not necessarily
cause by disability glare.
Discomfort glare
Discomfort glare is disturbance, which impairs our sense of wellbeing by the
effect of glare. The level of discomfort occurs due to glare is depends upon size of
glare source and the luminance. Discomfort glare does not necessarily impair object
observation. As passing of time discomfort tends to increase and causes nervous
tension and fatigue. Object observation impairment does not necessarily cause by
discomfort glare
2.3.5 Calculation Method
Methodology to calculate lighting parameters
If the Illuminance at three points of task area are 515 Lux, 535 Lux, and 550
Lux, further the Illuminance at three points of immediate surrounding area are 430
Lux, 465 Lux and 495 Lux then
Illuminance of task area shall be calculated by averaging the measured
illuminance within the task area
𝐼𝐼𝐼𝐼𝐼𝐼𝐼𝐼𝐼𝐼𝐼𝐼𝐼𝐼𝐼𝐼𝐼𝐼𝐼𝐼𝐼𝐼 =515 + 535 + 550
3
𝐼𝐼𝐼𝐼𝐼𝐼𝐼𝐼𝐼𝐼𝐼𝐼𝐼𝐼𝐼𝐼𝐼𝐼𝐼𝐼𝐼𝐼 = 533 𝐿𝐿𝐼𝐼𝐿𝐿
Uniformity of Illuminance shall be calculated by ratio of minimum
illuminance to average illuminance within the task area
𝑈𝑈𝐼𝐼𝐼𝐼𝑈𝑈𝑈𝑈𝑈𝑈𝐼𝐼𝐼𝐼𝑈𝑈𝑈𝑈𝑈𝑈𝑈𝑈𝐼𝐼𝐼𝐼𝐼𝐼𝐼𝐼𝐼𝐼𝐼𝐼𝐼𝐼𝐼𝐼𝐼𝐼𝐼𝐼𝐼𝐼 =515533
𝑈𝑈𝐼𝐼𝐼𝐼𝑈𝑈𝑈𝑈𝑈𝑈𝐼𝐼𝐼𝐼𝑈𝑈𝑈𝑈𝑈𝑈𝑈𝑈𝐼𝐼𝐼𝐼𝐼𝐼𝐼𝐼𝐼𝐼𝐼𝐼𝐼𝐼𝐼𝐼𝐼𝐼𝐼𝐼𝐼𝐼 = 0.9
33
Illuminance of the immediate surrounding areas shall be calculated by
averaging the measured illuminance within the immediate surrounding areas
𝐼𝐼𝐼𝐼𝐼𝐼𝐼𝐼𝐼𝐼𝐼𝐼𝐼𝐼𝐼𝐼𝐼𝐼𝐼𝐼𝐼𝐼𝑈𝑈𝑈𝑈𝐼𝐼𝐼𝐼𝐼𝐼𝐼𝐼𝐼𝐼𝐼𝐼𝐼𝐼𝑈𝑈𝐼𝐼𝐼𝐼𝐼𝐼𝑈𝑈𝑈𝑈𝑈𝑈𝐼𝐼𝐼𝐼𝐼𝐼𝐼𝐼𝐼𝐼𝐼𝐼𝐼𝐼 =430 + 465 + 495
3
𝐼𝐼𝐼𝐼𝐼𝐼𝐼𝐼𝐼𝐼𝐼𝐼𝐼𝐼𝐼𝐼𝐼𝐼𝐼𝐼𝐼𝐼𝑈𝑈𝑈𝑈𝐼𝐼𝐼𝐼𝐼𝐼𝐼𝐼𝐼𝐼𝐼𝐼𝐼𝐼𝑈𝑈𝐼𝐼𝐼𝐼𝐼𝐼𝑈𝑈𝑈𝑈𝑈𝑈𝐼𝐼𝐼𝐼𝐼𝐼𝐼𝐼𝐼𝐼𝐼𝐼𝐼𝐼 = 463 𝐿𝐿𝐼𝐼𝐿𝐿
Ratio between a task area illuminance and immediately adjacent
surroundings illuminance = 533463
= 1.15
Percentage of the task area meeting the required illuminance
If in a conference room there are five occupants, the measured illuminance of
their task areas are 510 Lux, 580 Lux, 455 Lux, 550 Luisnd 535 Lux. Thus 4 out 5
locations are meeting the threshold value, and then the Percentage of the task area
meeting the required illuminance can be calculated by
𝑃𝑃𝐼𝐼𝑈𝑈𝐼𝐼𝐼𝐼𝐼𝐼𝑈𝑈𝐼𝐼𝐼𝐼𝐼𝐼𝑈𝑈𝑈𝑈𝑈𝑈ℎ𝐼𝐼𝑈𝑈𝐼𝐼𝐼𝐼𝑒𝑒𝐼𝐼𝑈𝑈𝐼𝐼𝐼𝐼𝐼𝐼𝐼𝐼𝐼𝐼𝑈𝑈𝐼𝐼𝐼𝐼𝐼𝐼𝑈𝑈ℎ𝐼𝐼𝑈𝑈𝐼𝐼𝑒𝑒𝐼𝐼𝐼𝐼𝑈𝑈𝐼𝐼𝐼𝐼𝐼𝐼𝐼𝐼𝐼𝐼𝐼𝐼𝐼𝐼𝐼𝐼𝐼𝐼𝐼𝐼𝐼𝐼𝐼𝐼𝐼𝐼 =4 ∗ 100
5= 80 %
2.3.6 Sound Isolation Class
Sound Level Difference
Difference in the energy-average sound pressure levels between the source
and receiving rooms with one or more loudspeakers in the source room which is
calculated using Formula
D = L1 − L 2
Where
L1 is the energy-average sound pressure level in the source room when its volume is
larger than or equal to 25 m3 or the low-frequency energy-average sound pressure
level (50 Hz, 63 Hz and 80 Hz bands only) in the source room when its volume is
smaller than 25 m3;
34
L2 is, he energy-average sound pressure level in the receiving room when its volume
is larger than or equal to 25 m3 or the low-frequency energy-average sound pressure
level (50 Hz, 63 Hz and 80 Hz bands only) in the receiving room when its volume is
smaller than 25 m3
Stan, ardized Level Difference
Level difference that is standardized to a reference value of the reverberation
time in the receiving room and calculated using Formula
Dnt= D+10 log (T/T0)
Where
T is the reverberation time in the receiving room;
T0 is the reference reverberation time; for dwellings, T0 = 0.5 s.
(The above article is same as specified in ISO 16283-1:2014 (E))
2.3.7 Reverberation Time
Reverberation is a phenomenon where the sounds bouncing off the reflective
surfaces such as tables, windows, walls, floor and ceiling of a room intermix with
each other. The time taken by these continuously bouncing off sounds to eventually
fade away from the room is known as the Reverberation time and it is measured in
octave or third-octave bands.
For the evaluation of the sound band it is not necessary to analyse the decay
time till 60 dB, and can be analysed on a smaller dynamic ranges, such as the range
of 5dB to 35dB below the initial level being labeled as T30 and the range of 5dB to
25dB below the initial level being labeled as T20. The evaluation of these smaller
ranges can be further analysed to extrapolate to measure the decay time over the full
60 dB ranges. So if we have to measure the decay time over 60 dB it will be
calculated by the following arithmetic expressions: 3 x (time decay over 20dB) or 2
x (time decay over 30 dB).
(The above article is same as specified in ISO 3382-1:2009 (E))
35
CHAPTER 3
AVAILABILITY OF INSTRUMENTS
3.1 Introduction The team has gone through various equipments available in India as well as
world over. Specifications of these equipment have been examined and compared
with the requirements spelled out in ISHRAE Standard 10001:2016. A master sheet
of availability of instruments is presented in Annexure A.1. In many cases, MNIT
and IIT Madras already are in possession of equipment complying with the
requirements, which has been mentioned in the report as well. Narrative of the same
is presented below:
3.2 Thermal Comfort 3.2.1 Air Temperature, Mean Radiant Temperature, Relative Humidity, Air
Velocity
There are several instruments available at reasonable cost, for this purpose.
MNIT Jaipur used Testo480, because it is fulfilling accuracy and resolution
requirement and it is a single set of instrument along with tripod stand, can measure
above parameters and includes Indoor Air Quality parameters like CO2 and
Illuminance also. Testo-480 is also suitable for long-term measurement with data
logging in internal memory and SD card storage.
3.2.2 Floor Surface Temperature
There are several instruments available at reasonable cost, for this purpose.
MNIT Jaipur used Testo 905-T2 because it is fulfilling accuracy and resolution
requirement and is suitable for measurements on uneven surfaces, large measuring
range: Temperature measurements up to +500 °C is possible for a short time,
extremely quick response time, convenient reading of measurement results on the
swivel display.
36
3.2.3 Plane Radiant Temperature
This instrument is having limited availability. One product is found with
Indian supplier is Lumasence Technology Denmark’s product Radiant Temperature
Asymmetry Transducer – INNOVA MM0036.
3.3 Lighting Comfort 3.3.1 Illuminance
There are several instruments available at reasonable cost, for this purpose.
Testo480 and Lutron LX103 MNIT Jaipur have been used for our purpose because
it is fulfilling our accuracy and resolution requirements. Testo480 is a single set of
instrument along with tripod stand, can measure above parameter and includes
Indoor Air Quality parameters like CO2 and thermal comfort parameters like air
temperature, air temperature, relative humidity, air velocity also. Testo480 is
suitable for long-term measurement with data logging in internal memory and SD
card storage. Lutron LX103 is pocket-sized and has a separate light sensor probe
which allows user to measure the light at optimum position.
3.4 Acoustic Comfort 3.4.1 Sound
MNIT used Lutron SL-4010. IEQ standards preferred that measuring
instrument shall conform to the accuracy requirement given in IEC 60804. It may
be noted that IEC 60804 code is replaced by IEC 61672. The same change needs
to be made in the ISHRAE Standard. In IEC 61672 accuracy is not in %, it is in
terms of dB for different Frequencies (Hz). Accuracy and resolution of Lutron SL-
4010 are according to IEC 61672-1: 2013 Class 2. Equipment for measurement of
Noise Criteria (NC value calculation) and Reverberation time measurement are quite
costly (around Rs. 2,40,000) and could not be procured within the allocated budget.
3.5 Indoor Air Quality
3.5.1 CO2
Finding instruments for CO2 is not an issue, several options are available.
MNIT used Testo480 because it is fulfilling our accuracy and resolution
requirements. Testo480 is a single set of instrument along with tripod stand can
37
measure above parameters and includes lighting comfort parameter like illuminance
and thermal comfort parameters like air temperature, air temperature, relative
humidity, air velocity also. Testo480 is suitable for long-term measurement with
data logging in internal memory and SD card storage.
3.5.2 CO
Finding instruments for CO is not an issue, several options are available.
Testo350 available in MNIT and meet required accuracy and resolution. Testo 350
used for flue gases analysis and for flue gas analysis we have to fill which kind of
fuel is burning, so Testo350 we cannot use for Indoor conditions.
ATS 103M by Applied Techno Systems Ltd. is most suitable option because
it is fulfilling accuracy, resolution requirement but it is not according to preferred
measuring principle. Its price is also reasonable
3.5.3 PM 2.5 and PM 10
Finding suitable low-cost instrument for PM is a bit of challenge. Many
manufacturers offer products meeting the accuracy, resolution and recommended
technologies as per ISHRAE IEQ Standard. It has been noted that leading
manufacturer, Graywolf and most of other companies are mentioning Counting
Efficiency and Zero Count Level instead of accuracy and resolution.
Some product of other companies like BRAMC etc. are offering required
resolution with reasonable price, but Accuracy is not according to requirement.
1080-A Professional is giving required resolution but the measuring
principle and accuracy are not mentioned on brochures and supplies have not the
information, it can also measure the CH2O, SO2, NO2, and O3, its cost is very high
(Rs. 3,720,126).
Handheld Area Monitor by Applied Techno Systems Ltd. is most suitable
option because it is fulfilling our accuracy, resolution requirements and it is
according to preferred measuring principle. Its price is also reasonable.

38
Note: Most of the companies use terms like Counting Efficiency, Zero Count level,
and Lowest Detection Limit etc. instead of accuracy and resolution. Gravimetric
and beta attenuation methods are not available in handheld instruments.
3.5.4 TVOC
Finding a suitable low-cost instrument for TVOC is quite challenging. Many
manufacturers offer products meeting the accuracy, resolution and recommended
technologies as per ISHRAE IEQ Standard.
Gray Wolf’s product (IQ610 Probe + Advance Sense PRO Display) also
fulfilling accuracy, resolution requirement and it is according to preferred measuring
principle but its cost is high (Rs.3,75,000).
Some product of other companies like BRAMC etc. giving required
resolution and price is reasonable but Accuracy is not according to requirement.
Portable VOC Monitor in PID by Applied Techno Systems ltd.is the most suitable
option because it is fulfilling our accuracy, resolution requirements and it is
according to preferred measuring principle. Its price is also reasonable.
Note: Gas chromatography (GC) method is not available in handheld instruments.
3.5.5 CH2O
Finding a suitable low-cost instrument for CH2O is a bit of challenge. Many
manufacturers offer products meeting the accuracy, resolution, but not as per the
technology recommended in the ISHRAE IEQ Standard. Most of the products
other companies are giving Electrochemical Sensor which is not according to
preferred measuring principle. Gray Wolf’s product PM801 also fulfilling accuracy,
resolution requirement but it is not according to preferred measuring principle.
Some product of other companies like BRAMC etc. giving required
resolution and price is reasonable but Accuracy and is not according to requirement.
1080-A Professional is giving required resolution but the measuring
principle and accuracy are not mentioned on brochures and supplies have not given
39
the information, it can also measure the PM 2.5, PM 10, SO2, NO2 and O3, its cost is
very high (Rs.37,20,126).
ATS 103M by Applied Techno Systems Ltd.is most suitable option because
it is fulfilling accuracy, resolution requirement but it is not according to preferred
measuring principle. Its price is also reasonable.
Note: The major problem in comparing different products occur when accuracy is
not mentioned in their brochure. Moreover, the measuring principle followed by
most companies is not according to the standards. Even if it is as per the standards,
the instruments are bigger in size and hence not portable. This should be relooked.
Gas chromatography (GC) method is not available in handheld instruments.
3.5.6 SO2
Most of the products of other companies are giving Electrochemical Sensor
which is not according to preferred measuring principle. Most of the products of
other companies like Gray Wolf, Uniphos etc. are not fulfilling accuracy, resolution
requirement and it is not according to preferred measuring principle.
1080-A Professional is giving required resolution but the measuring
principle and accuracy are not mention on brochures and supplies have not the
information, it can also measure the PM2.5, PM10, CH2O, NO2, and O3, its cost is
very high (Rs.37,20,126).
ATS 103M by Applied Techno Systems Ltd. is a most suitable option because it is
fulfilling accuracy, resolution requirement but it is not according to preferred
measuring principle. Its price is also reasonable.
Note: Most of the products do not fulfill our criteria for accuracy and resolution.
Moreover, the measuring principle followed by most companies is not according to
the standards. Even if it is as per the standards, the instruments are bigger in size and
hence not portable. This needs to be relooked.
40
3.5.7 NO2
Most of the products of other companies are giving Electrochemical Sensor
which is not according to the preferred measuring principle.
Most of the products of companies like Gray Wolf, Uniphos etc. are not
fulfilling accuracy, resolution requirement and it is not according to preferred
measuring principle.
1080-A Professional is giving required resolution but the measuring principle and
accuracy are not mention on brochures and supplies have not the information, it can
also measure the PM2.5, PM10, CH2O, NO2, and O3, its cost is very high
(Rs.37,20,126).
ATS 103M by Applied Techno Systems Ltd. is most suitable option because it is
fulfilling accuracy, resolution requirement but it is not according to preferred
measuring principle. Its price is also reasonable.
Note: Most of the products do not fulfill our criteria for accuracy and resolution.
Moreover, the measuring principle followed by most companies is not according to
the standards. Even if it is as per the standards, the instruments are bigger in size and
hence not portable. This needs to be relooked.
3.5.8 O3
Most of the products of other companies are giving Electrochemical Sensor
which is not according to preferred measuring principle.
Most of the products companies like Gray Wolf, Uniphos etc. are not
fulfilling accuracy, resolution requirement and it is not according to preferred
measuring principle.
1080-A Professional is giving required resolution but the measuring
principle and accuracy are not mentioned on brochures and supplies have not the
information, it can also measure the PM2.5, PM10, CH2O, NO2, and O3, its cost is
very high (Rs.37,20,126).
41
2B technology ltd.’s Personal Ozone Monitor™ (POM™) is fulfilling
accuracy, resolution requirement and it is not according to preferred measuring
principle but its price is very high (Rs.3,48,000). Some products of other companies
are mentioning the accuracy in terms of %.
ATS 103M by Applied Techno Systems Ltd. is a most suitable option for
our project, because it is fulfilling accuracy, resolution requirement but it is not
according to preferred measuring principle. Its price is also reasonable.
Note: Most of the products do not fulfill our criteria for accuracy and resolution.
3.5.9 Total Microbial Count
There is no instrument available for on the spot measurement of the
microbial count. Samples need to be taken for lab testing. This parameter needs to
be relooked under the light of and a number of samples required to being tested and
targeted large adaption of IEQ Standard.
3.6 Overall Summary Considering the equipment availability and difficulty in finding equipment
matching requirements specified in ISHRAE IEQ. As interim finding and
recommendation, it is required to revisit the specifications mentioned in the
standard. Where the threshold value of any parameter such as TVOC and CH2O is
much higher as compared to the least count, the stringency of measurement may be
considered.

42
CHAPTER 4
IEQ ASSESSMENT METHODOLOGY 4.1 Measurement Protocols Following ISHRAE IEQ Standard, the measurements are carried out once in
a month and thrice a day (10:00, 14:00 and 16:30 hrs) to assess all climate changes
during different seasons. In thermal comfort measurements, the mean radiant
temperature, room air temperature, air velocity and relative humidity are recorded at
0.6 m and 1.1 m for seating and standing positions, respectively. Operative
temperatures for the above measurements are calculated to be average of the mean
values of mean radiant and room air temperature. IAQ parameters such as
concentrations of CO2, CO, Particulate matter (PM 2.5, PM 10), total volatile
organic compounds, formaldehyde, SO2, NO2, and O3 are measured at different
occupant locations and also at possible fresh air inlet of the rooms. CO2
concentration is measured when there is at least 90% occupancy in the building
space. In lighting comfort parameters like illuminance, circadian lighting design,
uniformity of illuminance and ratio of illuminance of task area to immediately
adjacent surroundings are monitored at different potential occupant locations.
Illuminance of task area is calculated by taking mean values of illuminance at
different points within the task area. The equivalent melanopic lux as the
measurement of circadian lighting design is calculated by multiplying the
illuminance and melanopic ratio (which relates the correlated colour temperature
(CCT) and type of light source). Also, uniformity of illuminance is calculated as the
ratio of minimum illuminance to average illuminance of different points within the
task area. Further, the acoustic comfort in terms of overall sound level is observed at
different locations. Detailed reasons and clarification of measurement protocols are
presented in Annexure A.2. All IEQ measurements done by IITM were carried out for 24 h period for
instruments having data logging facility and measurements using instruments that
had no data logging option was done thrice a day for two consecutive days. The
measurements were done for different seasons; winter (Dec 2017-Feb 2018),

43
summer (March-June, 2018) and monsoon (July 2018). All the parameters were
measured at occupant level and no outdoor measurements were taken. Light
measurements were done according to the procedure explained in the above
paragraph.
4.2 Site Description 4.2.1 MNIT Jaipur
The assessment has been carried out in Jaipur city (26.9124°N, 75.7873°E)
located under composite climate in northern India. The present investigation has
been performed at Malaviya National Institute of Technology, Jaipur (IGBC
Platinum Rated Green Campus). In the composite climate of Jaipur mainly four
seasons are considered. April to June is regarded as summer season, July to August
as monsoon season, September as post-monsoon season, November to February as
winter season and October and March regarded as moderate season. Two dwellings
in the campus have been selected for IEQ investigations. The first building (named
as old administration), away from the heavy traffic is situated in an area with rich
natural vegetation. While the second one (named as Centre for Energy &
Environment (CEEB)) is only 65 m away from the roadway. Both buildings have
shared as well as individual offices, classrooms, conference halls and waiting rooms
in which some are air-conditioned and others are unconditioned areas.
The third building selected is a residential apartment Building at Jaipur. This
building is situated in the highly dense urban area having 3 floors in which only
third floor is used for measurement, covers a total area of 125 square meters, 2
Bedrooms, 1 Livingroom and 1 Kitchen and 6 types of potential occupant locations.
The detailed descriptions of each building are shown in Table 4.1.
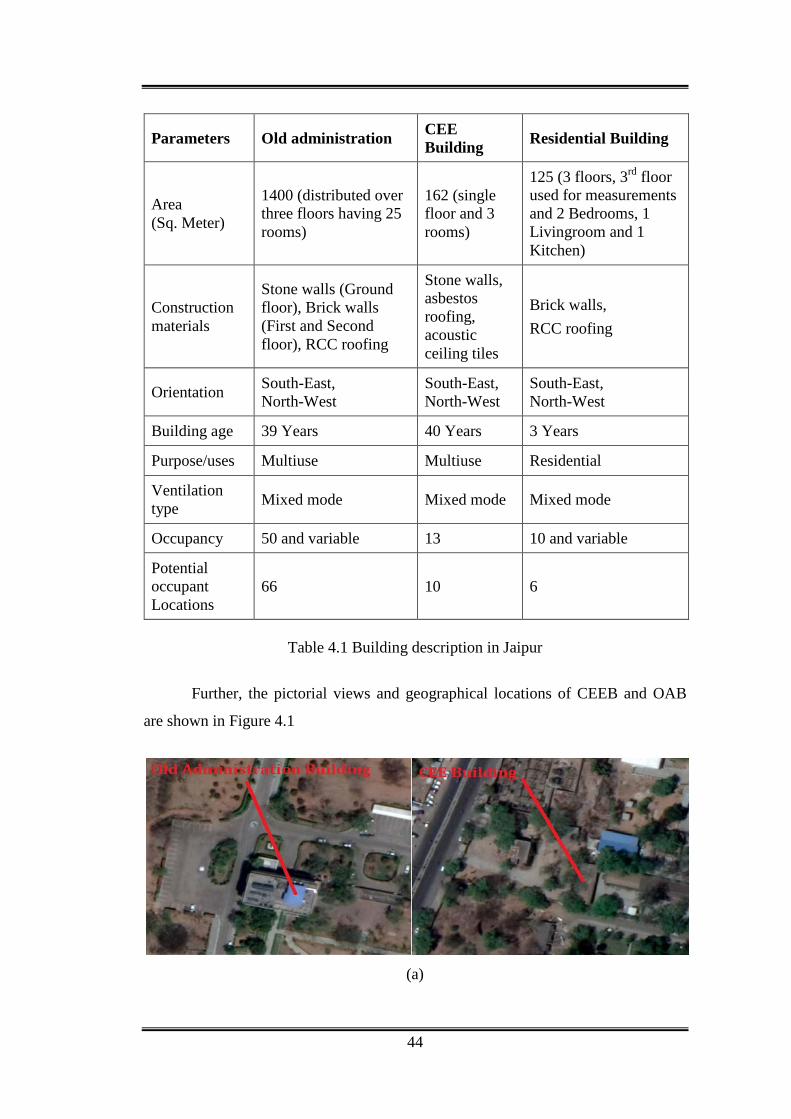
44
Parameters Old administration CEE Building Residential Building
Area (Sq. Meter)
1400 (distributed over three floors having 25 rooms)
162 (single floor and 3 rooms)
125 (3 floors, 3rd floor used for measurements and 2 Bedrooms, 1 Livingroom and 1 Kitchen)
Construction materials
Stone walls (Ground floor), Brick walls (First and Second floor), RCC roofing
Stone walls, asbestos roofing, acoustic ceiling tiles
Brick walls, RCC roofing
Orientation South-East, North-West
South-East, North-West
South-East, North-West
Building age 39 Years 40 Years 3 Years
Purpose/uses Multiuse Multiuse Residential
Ventilation type Mixed mode Mixed mode Mixed mode
Occupancy 50 and variable 13 10 and variable
Potential occupant Locations
66 10 6
Table 4.1 Building description in Jaipur
Further, the pictorial views and geographical locations of CEEB and OAB
are shown in Figure 4.1
(a)
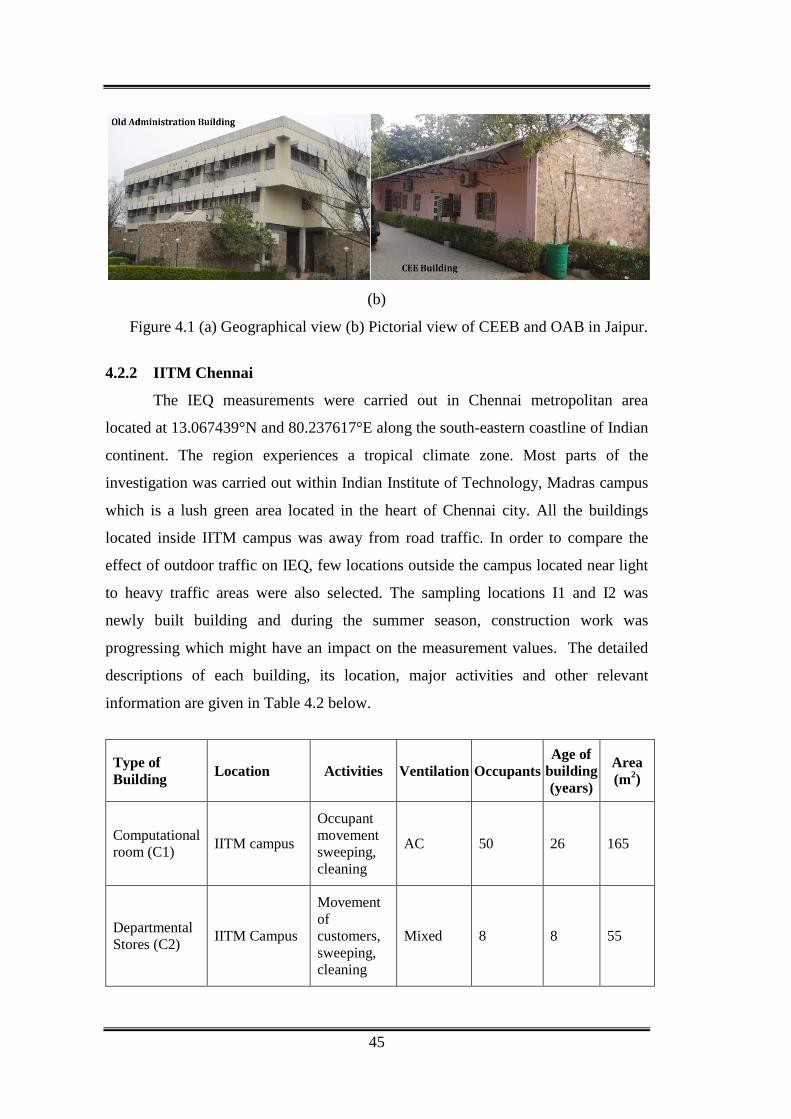
45
(b)
Figure 4.1 (a) Geographical view (b) Pictorial view of CEEB and OAB in Jaipur.
4.2.2 IITM Chennai
The IEQ measurements were carried out in Chennai metropolitan area
located at 13.067439°N and 80.237617°E along the south-eastern coastline of Indian
continent. The region experiences a tropical climate zone. Most parts of the
investigation was carried out within Indian Institute of Technology, Madras campus
which is a lush green area located in the heart of Chennai city. All the buildings
located inside IITM campus was away from road traffic. In order to compare the
effect of outdoor traffic on IEQ, few locations outside the campus located near light
to heavy traffic areas were also selected. The sampling locations I1 and I2 was
newly built building and during the summer season, construction work was
progressing which might have an impact on the measurement values. The detailed
descriptions of each building, its location, major activities and other relevant
information are given in Table 4.2 below.
Type of Building Location Activities Ventilation Occupants
Age of building (years)
Area (m2)
Computational room (C1) IITM campus
Occupant movement sweeping, cleaning
AC 50 26 165
Departmental Stores (C2) IITM Campus
Movement of customers, sweeping, cleaning
Mixed 8 8 55
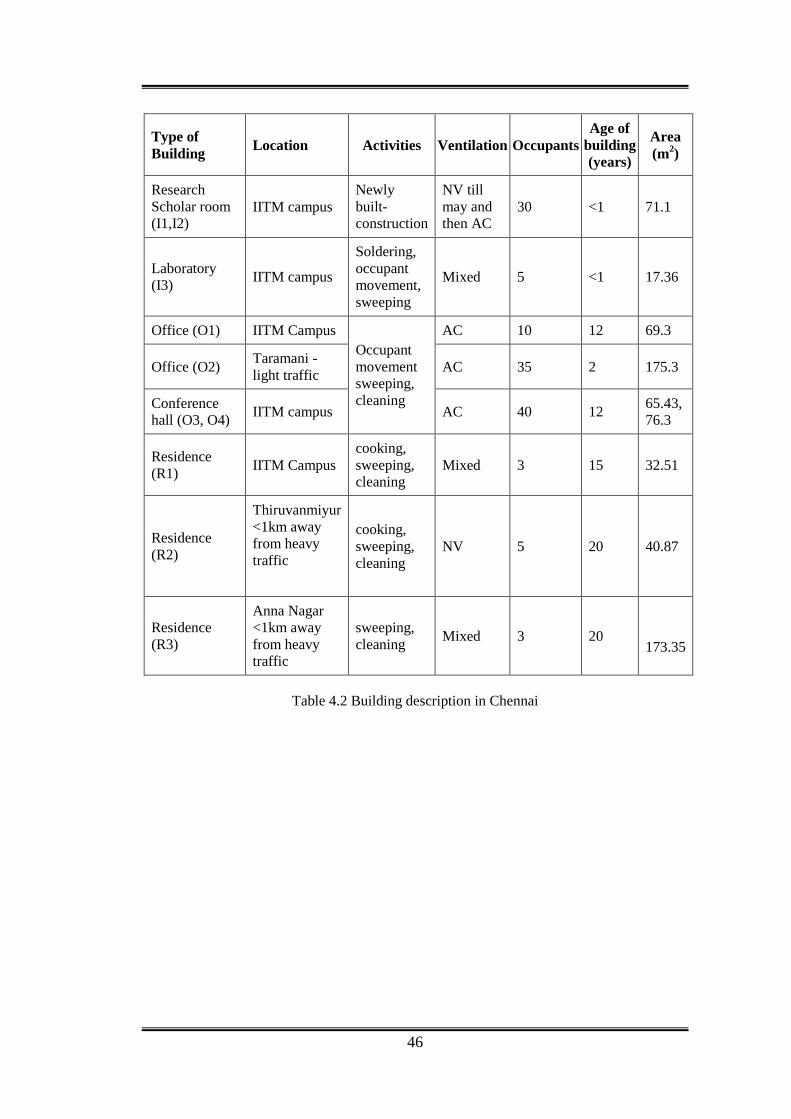
46
Type of Building Location Activities Ventilation Occupants
Age of building (years)
Area (m2)
Research Scholar room (I1,I2)
IITM campus Newly built-construction
NV till may and then AC
30 <1 71.1
Laboratory (I3) IITM campus
Soldering, occupant movement, sweeping
Mixed 5 <1 17.36
Office (O1) IITM Campus Occupant movement sweeping, cleaning
AC 10 12 69.3
Office (O2) Taramani - light traffic AC 35 2 175.3
Conference hall (O3, O4) IITM campus AC 40 12 65.43,
76.3
Residence (R1) IITM Campus
cooking, sweeping, cleaning
Mixed 3 15 32.51
Residence (R2)
Thiruvanmiyur <1km away from heavy traffic
cooking, sweeping, cleaning
NV 5 20 40.87
Residence (R3)
Anna Nagar <1km away from heavy traffic
sweeping, cleaning Mixed 3 20
173.35
Table 4.2 Building description in Chennai
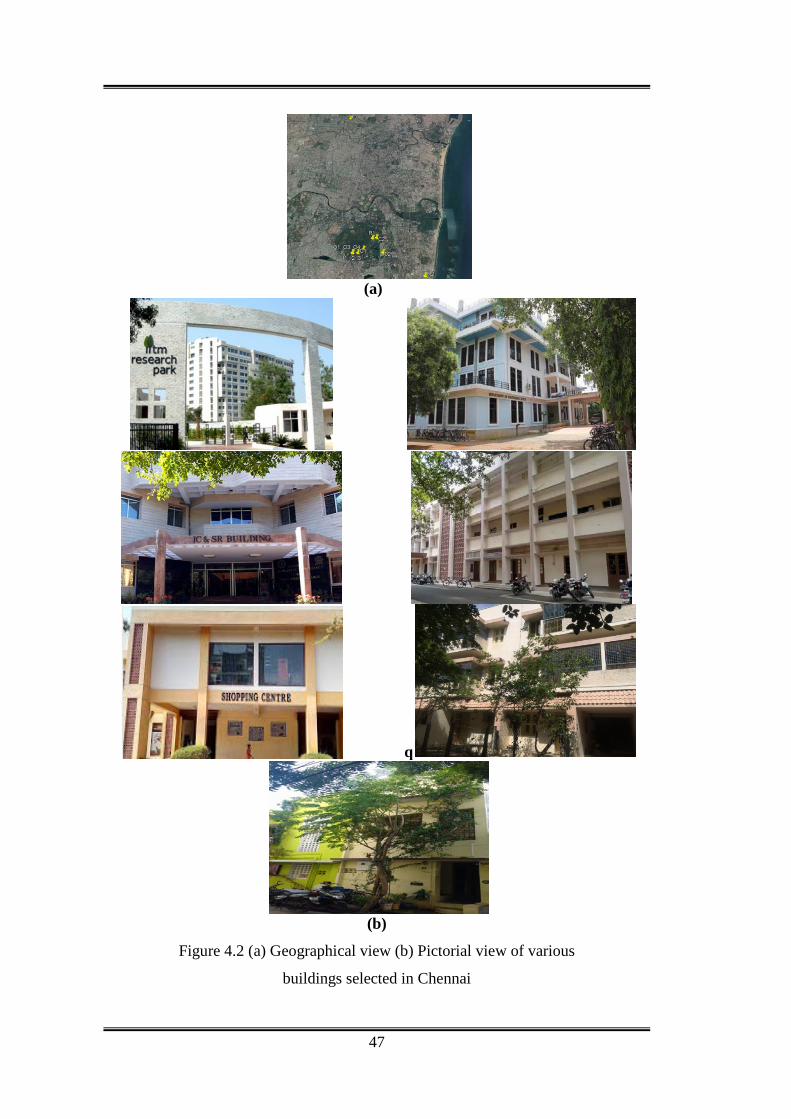
47
(a)
q
(b)
Figure 4.2 (a) Geographical view (b) Pictorial view of various
buildings selected in Chennai

48
4.3 Measurement Location Selection 4.3.1 MNIT Jaipur
Potential occupant locations are selected for specific positions such as centre
of the room, near to window (open/close), away from ventilation, near to the
artificial light source, under ceiling fan and air conditioning unit. Detailed reasons
for building selection are presented in Annexure A.3.
(a)
(b)
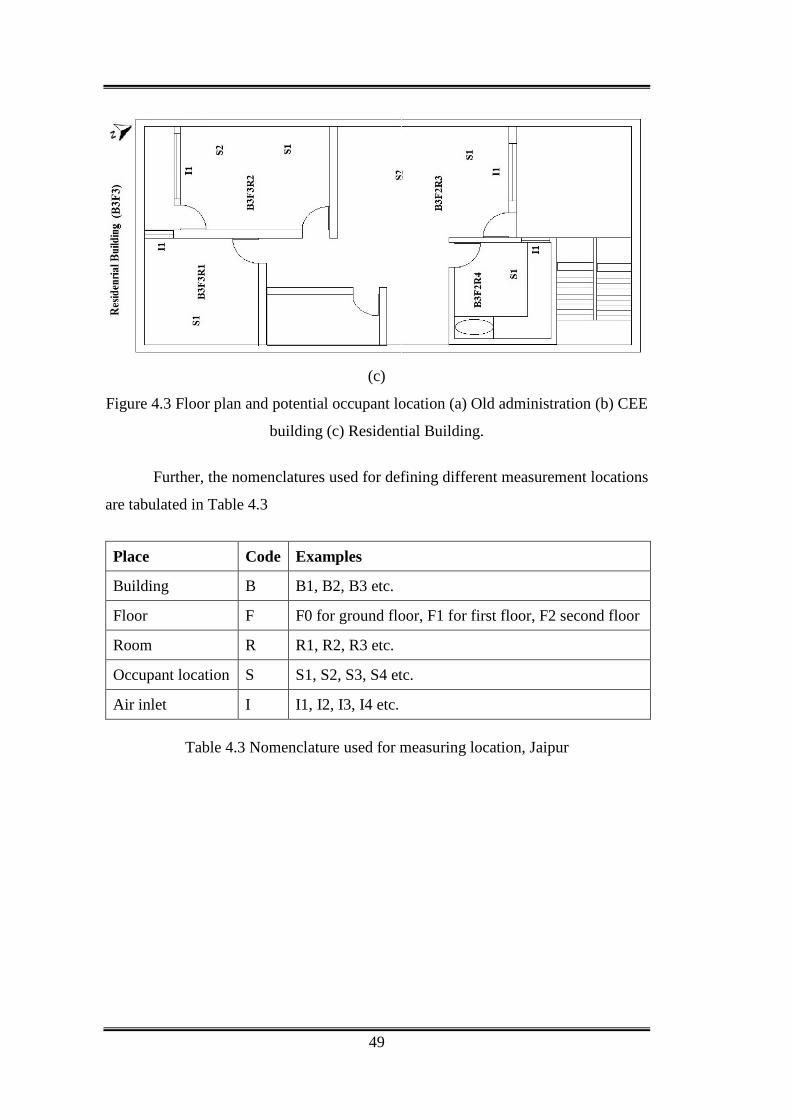
49
(c)
Figure 4.3 Floor plan and potential occupant location (a) Old administration (b) CEE
building (c) Residential Building.
Further, the nomenclatures used for defining different measurement locations
are tabulated in Table 4.3
Place Code Examples
Building B B1, B2, B3 etc.
Floor F F0 for ground floor, F1 for first floor, F2 second floor
Room R R1, R2, R3 etc.
Occupant location S S1, S2, S3, S4 etc.
Air inlet I I1, I2, I3, I4 etc.
Table 4.3 Nomenclature used for measuring location, Jaipur
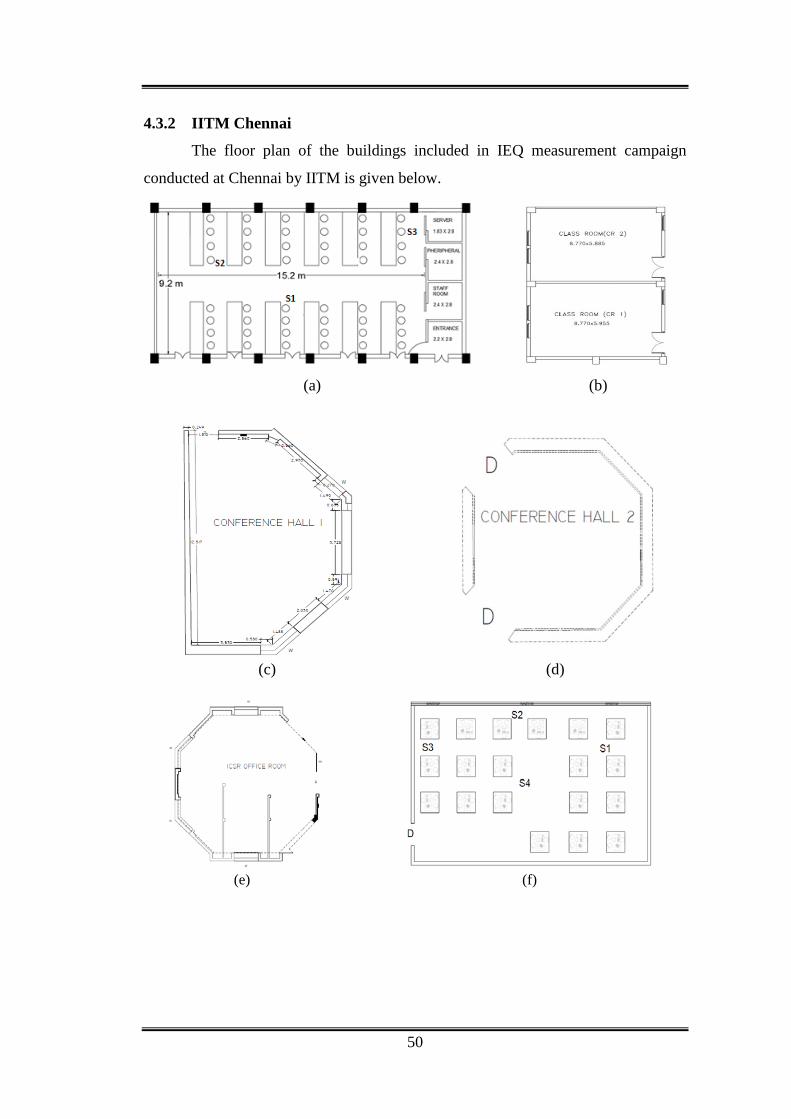
50
4.3.2 IITM Chennai
The floor plan of the buildings included in IEQ measurement campaign
conducted at Chennai by IITM is given below.
(a) (b)
(c) (d)
(e) (f)

51
(g) (h) (i)
Figure 4.4 Floor plan showing sampling occupant location of a) C1; b) I1, I2; c) O3;
d) O4; e) O1; f) O2; g) R1; h) R2 and i) R3
The nomenclatures used for defining different measurement locations are
tabulated in Table 4.3
Place Code Examples Commercial building C C1, C2, C3 etc. Office building O O1, O2, O3 etc. Residential building R R1,R2,R3 etc. Institutional building I I1,I2,I3,I4 etc. Sampling points S S1,S2,S3,S4 etc. Floor F F1, F2, F3 etc.
Table 4.4 Nomenclature used for measuring location, Chennai
4.4 Instruments ISHRAE IEQ recommended various instruments to be used for the
measurements of different IEQ parameters. The instruments are procured from the
standard manufacturers and the details of the instruments used by MNIT and IITM
are given in Table 4.3 and Table 4.4 respectively.
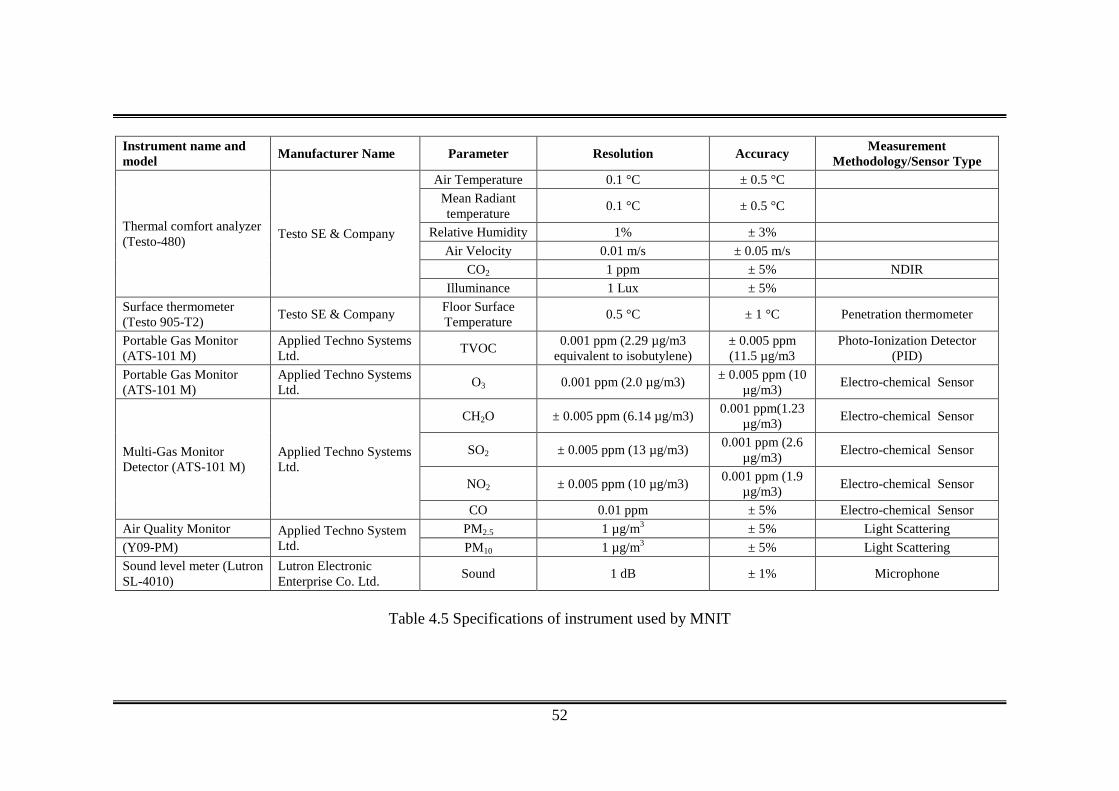
52
Instrument name and model Manufacturer Name Parameter Resolution Accuracy Measurement
Methodology/Sensor Type
Thermal comfort analyzer (Testo-480) Testo SE & Company
Air Temperature 0.1 °C ± 0.5 °C Mean Radiant temperature 0.1 °C ± 0.5 °C
Relative Humidity 1% ± 3% Air Velocity 0.01 m/s ± 0.05 m/s
CO2 1 ppm ± 5% NDIR Illuminance 1 Lux ± 5%
Surface thermometer (Testo 905-T2) Testo SE & Company Floor Surface
Temperature 0.5 °C ± 1 °C Penetration thermometer
Portable Gas Monitor (ATS-101 M)
Applied Techno Systems Ltd. TVOC 0.001 ppm (2.29 µg/m3
equivalent to isobutylene) ± 0.005 ppm (11.5 µg/m3
Photo-Ionization Detector (PID)
Portable Gas Monitor (ATS-101 M)
Applied Techno Systems Ltd. O3 0.001 ppm (2.0 µg/m3) ± 0.005 ppm (10
µg/m3) Electro-chemical Sensor
Multi-Gas Monitor Detector (ATS-101 M)
Applied Techno Systems Ltd.
CH2O ± 0.005 ppm (6.14 µg/m3) 0.001 ppm(1.23 µg/m3) Electro-chemical Sensor
SO2 ± 0.005 ppm (13 µg/m3) 0.001 ppm (2.6 µg/m3) Electro-chemical Sensor
NO2 ± 0.005 ppm (10 µg/m3) 0.001 ppm (1.9 µg/m3) Electro-chemical Sensor
CO 0.01 ppm ± 5% Electro-chemical Sensor Air Quality Monitor Applied Techno System
Ltd. PM2.5 1 µg/m3 ± 5% Light Scattering
(Y09-PM) PM10 1 µg/m3 ± 5% Light Scattering Sound level meter (Lutron SL-4010)
Lutron Electronic Enterprise Co. Ltd. Sound 1 dB ± 1% Microphone
Table 4.5 Specifications of instrument used by MNIT

53
Instrument Name Instrument Make
Instrument Model Parameters Resolution Accuracy Measurement
Methodology/Sensor Type Air Quality Monitor
Applied Techno Systems Y09-PM
PM2.5 1 µg/m3 5% Light Scattering PM10 1 µg/m3 5% Light Scattering
Phocheck Tiger Ion Science
TVOC 0.001 ppm (2.29 µg/m3 equivalent to isobutylene)
± 0.005 ppm (11.5 µg/m3) Photo-Ionization Detector (PID)
Portable Gas Monitor
Applied Techno Systems ATS-101 M O3 0.001 ppm (2.0 µg/m3) ± 0.005 ppm (10
µg/m3) Electro-chemical Sensor
Multi-Gas Detector
Applied Techno Systems ATS-103 M
CH2O ± 0.005 ppm (6.14 µg/m3) 0.001 ppm(1.23 µg/m3) Electro-chemical Sensor
SO2 ± 0.005 ppm (13 µg/m3) 0.001 ppm (2.6 µg/m3) Electro-chemical Sensor
NO2 ± 0.005 ppm (10 µg/m3) 0.001 ppm (1.9 µg/m3) Electro-chemical Sensor
Thermal Environment meter
Delta Ohm Srl HD32.3 Ta, RH, Tr, Va
0.1°C ±0.5°C Ta Thinfilm Pt100 0.1% ±2.5% RH Capacitive Sensor 0.1°C ±0.5°C Tr Pt100
0.01m/s ±0.05m/s Va Probe with Omnidirectional Hotwire (NTC 10Kohm)
Indoor air quality meter TSI IAQ CALC
7545 CO, CO2, Ta,
RH
0.1°C ±0.6°C T: Thermistor 0.1% ±3% RH: Thin film capacitive type
0.1ppm ±3% CO: Electrochemical 1ppm ±3% CO2: NDIR
Noise level meter Envirotech SLM 100 SPL 1 dB ±5% Microphone
Lux meter Work Zone LX101 Light intensity 1 Lux ±5% Light sensor
Surface temperature Testo 905-T2 Ts 0.1°C ±1% Penetration thermometer
Bio sampler Merck MAS100 TBC - - Impaction
Table 4.6 Details of the instrumentation used by IITM
54
4.5 Occupant Response and Sample Size Subjective method is used to record the responses from occupants using a
7-point subjective scale for the given environment as specified in the ISHARE IEQ
standard. Questionnaire is designed to record the various effects (sensation, comfort,
preference, annoyance, stiffness, and smell) to perform subjective assessment of
occupant comfort. Qualitative impact of parameters such as room temperature, RH,
air flow, stale air, overall lighting, external view and daylight availability are
recorded in the questionnaire. The questionnaire is developed in such a way that all
the responses can be recorded with easiness using a 7-point scale. Where it
represents 1 as the worst unsatisfactory response and 7 as the best satisfactory
response. Each parameter is represented in term of % satisfaction, where the
response 1, 2 and 3 as unsatisfactory response and 4, 5, 6 and 7 as satisfactory
response. Further, many other parameters such as gender, weight, age, height and
native place representing occupant anonymity are also recorded in the same
questionnaire, as suggested by (Dhaka et al., 2013). The total responses collected
through the occupants are 2790 (2466 M + 324 F) for the month of June 2017 to
May 2018. The average weight, age, height and body surface area of occupants are
observed to be 59.94 Kg, 24 years, 1.61 m and 1.62 m2, respectively.
The same procedure for subjective measurement was carried out by both
MNIT and IITM. Whereas in Chennai the total number of questionnaire collected
was 1100 (752 M + 348 F) during the period from December 2017 to July 2018. The requirement of a standardized data collection form was felt during the
initial days of measurement. The same has been developed and used for subsequent
readings. The same is placed at Annexure A.4.


55
CHAPTER 5 RESULTS AND DISCUSSION
5.1 Introduction Various surveys and measurements are conducted during the months of June
2017 to Jan 2018 enabling us to assess the indoor environmental quality of mixed
mode buildings located in the composite climate of Jaipur. Thus, the data obtained is
used to calculate the various parameters of IEQ elements and the same are presented
in this section. Detail IEQ measurement results for 12 months are placed at
Annexure A.5
5.2 Thermal comfort 5.2.1 Introduction
In this section, several parameters of thermal comfort such as operative
temperature, air velocity, relative humidity and floor surface temperature are
measured at different potential occupant locations.
5.2.2 Operative Temperature and Air Velocity
Since operative temperature represents the combined effects of room air
temperature, mean radiant temperature and air velocity recorded for the specified
potential occupant location. It measures the effects of radiation and convection heat
transfers in the actual non-uniform indoor climate. In general, the operative
temperature can be obtained as the average value of room air temperature and mean
radiant temperature for occupants involved in sedentary physical activity (1.0 < met
< 1.3) provided the occupant is not exposed to direct sunlight and higher air
velocities (> 0.2 m/s). For air velocity up to 0.2 m/s, the acceptable range of
operative temperature is given in ISHRAE IEQ standard (10001:2016). For higher
air velocities attributed towards an increase in comfort temperature, the required
acceptable range can be obtained by using approach given in ISO 7730.
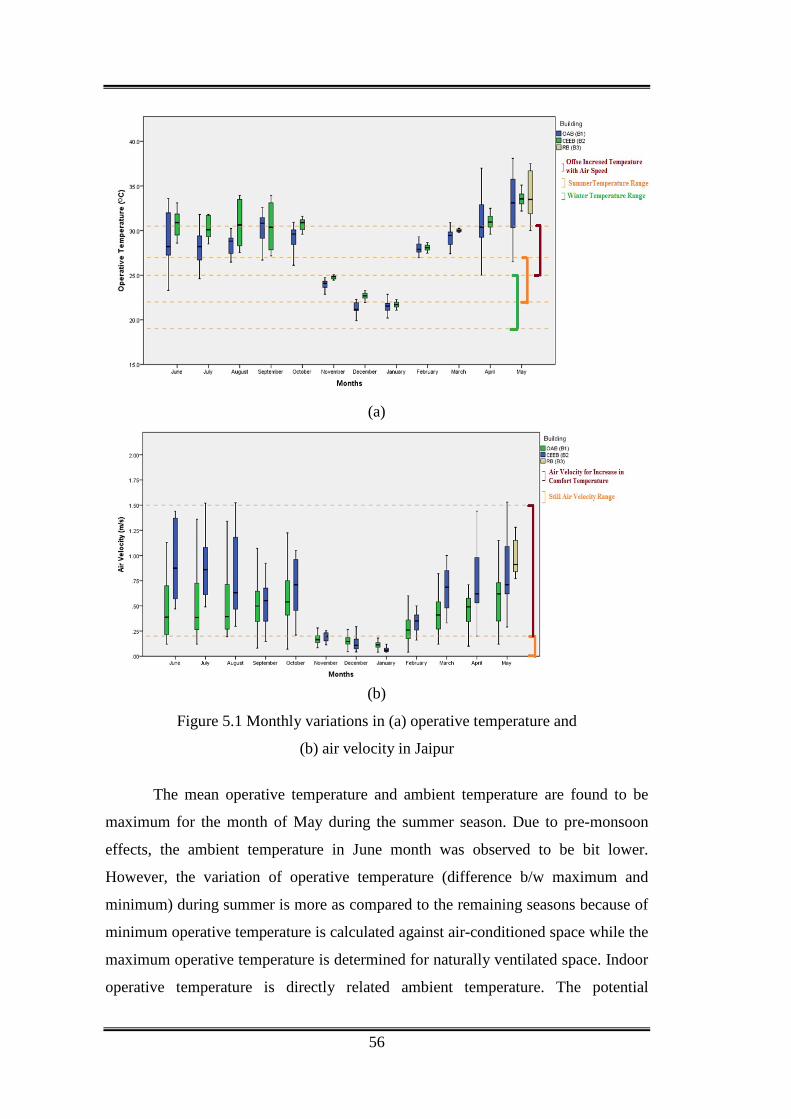
56
(a)
(b)
Figure 5.1 Monthly variations in (a) operative temperature and
(b) air velocity in Jaipur
The mean operative temperature and ambient temperature are found to be
maximum for the month of May during the summer season. Due to pre-monsoon
effects, the ambient temperature in June month was observed to be bit lower.
However, the variation of operative temperature (difference b/w maximum and
minimum) during summer is more as compared to the remaining seasons because of
minimum operative temperature is calculated against air-conditioned space while the
maximum operative temperature is determined for naturally ventilated space. Indoor
operative temperature is directly related ambient temperature. The potential

57
occupant locations (for both air-conditioned and naturally ventilated space)
complying acceptable operative temperature during summer, monsoon, post
monsoon, winter, and moderate are found to be 31 %, 62 %, 65 %, 99% and 91 %
respectively. However, due to high air velocity, some of the potential occupant
locations are found in an acceptable range even at a higher operative temperature (up
to 30.5°C) in naturally ventilated space during summer, monsoon and post-monsoon
seasons.
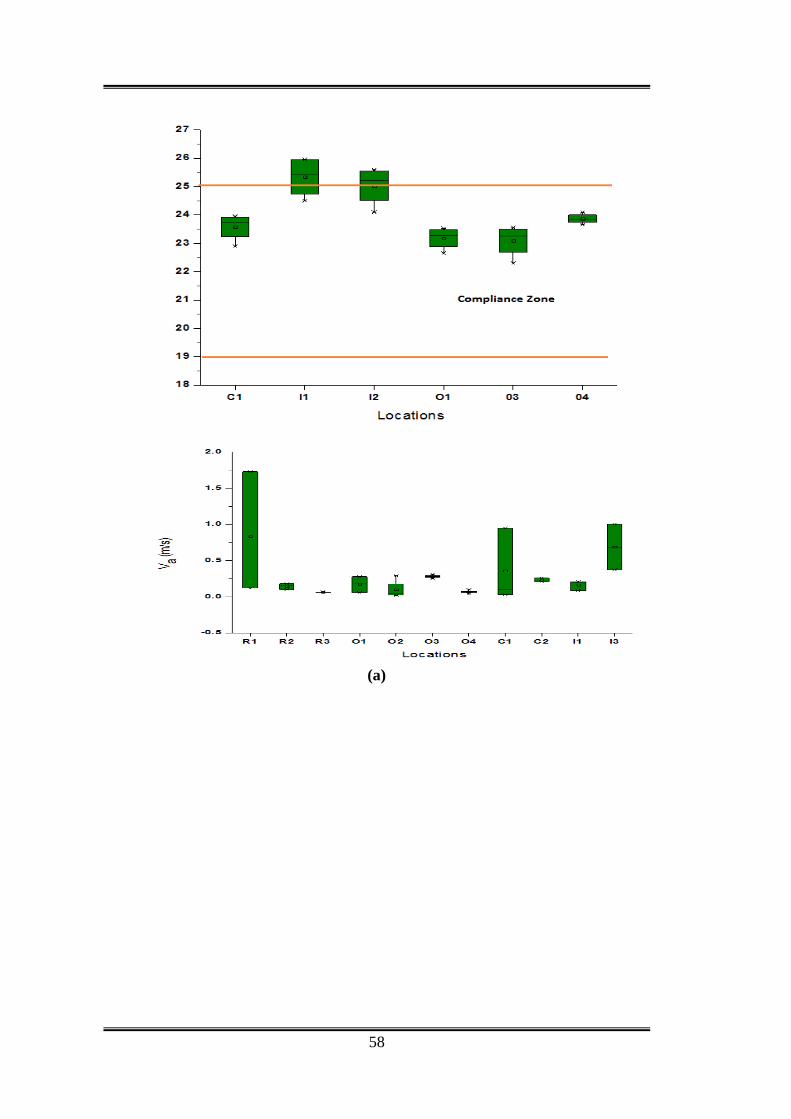
58
(a)
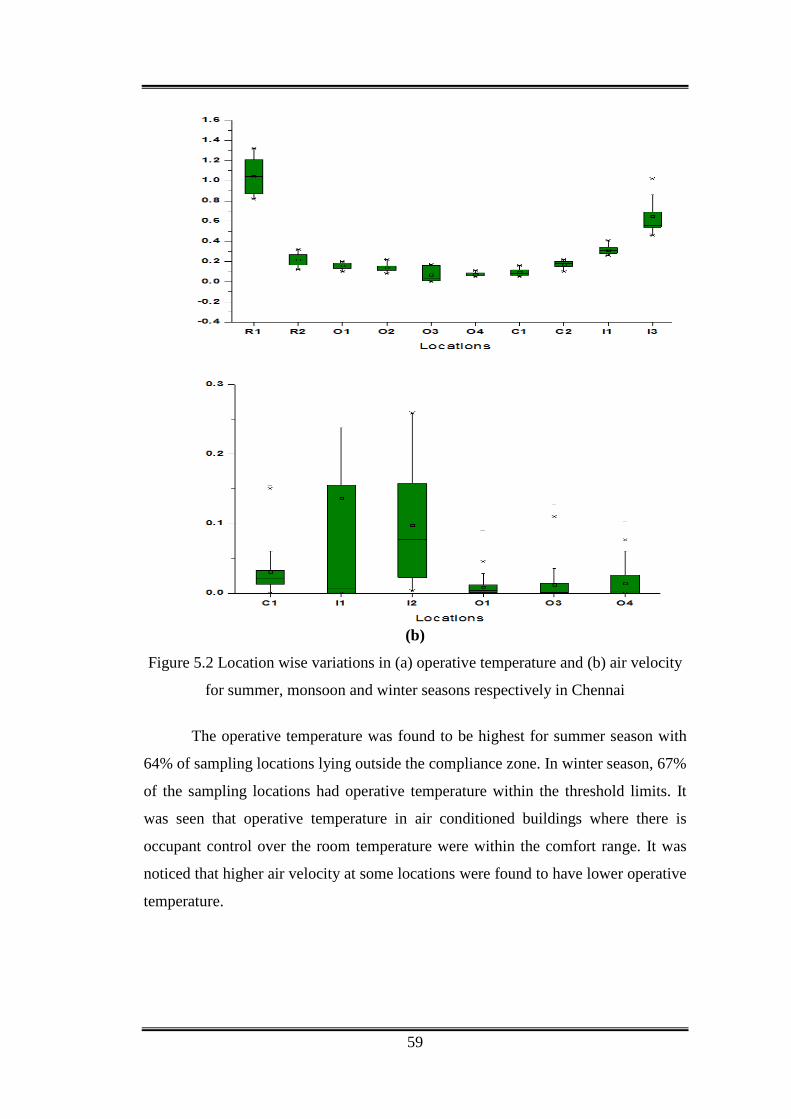
59
(b)
Figure 5.2 Location wise variations in (a) operative temperature and (b) air velocity
for summer, monsoon and winter seasons respectively in Chennai
The operative temperature was found to be highest for summer season with
64% of sampling locations lying outside the compliance zone. In winter season, 67%
of the sampling locations had operative temperature within the threshold limits. It
was seen that operative temperature in air conditioned buildings where there is
occupant control over the room temperature were within the comfort range. It was
noticed that higher air velocity at some locations were found to have lower operative
temperature.
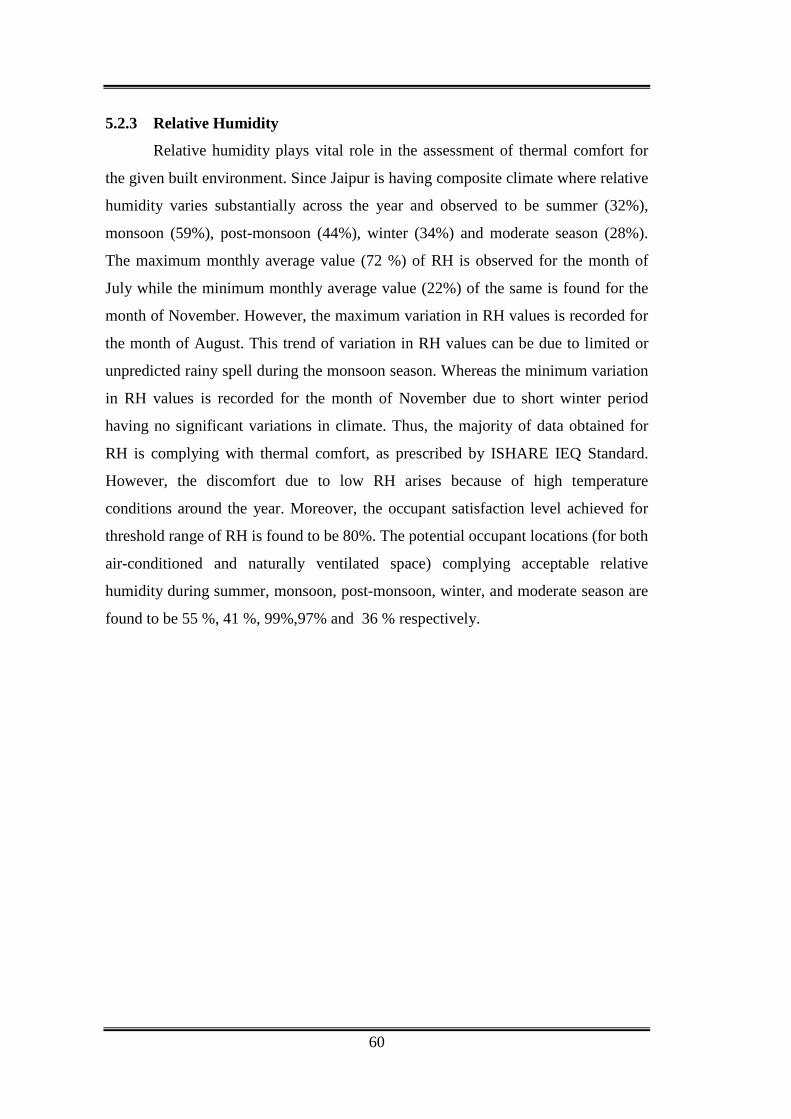
60
5.2.3 Relative Humidity
Relative humidity plays vital role in the assessment of thermal comfort for
the given built environment. Since Jaipur is having composite climate where relative
humidity varies substantially across the year and observed to be summer (32%),
monsoon (59%), post-monsoon (44%), winter (34%) and moderate season (28%).
The maximum monthly average value (72 %) of RH is observed for the month of
July while the minimum monthly average value (22%) of the same is found for the
month of November. However, the maximum variation in RH values is recorded for
the month of August. This trend of variation in RH values can be due to limited or
unpredicted rainy spell during the monsoon season. Whereas the minimum variation
in RH values is recorded for the month of November due to short winter period
having no significant variations in climate. Thus, the majority of data obtained for
RH is complying with thermal comfort, as prescribed by ISHARE IEQ Standard.
However, the discomfort due to low RH arises because of high temperature
conditions around the year. Moreover, the occupant satisfaction level achieved for
threshold range of RH is found to be 80%. The potential occupant locations (for both
air-conditioned and naturally ventilated space) complying acceptable relative
humidity during summer, monsoon, post-monsoon, winter, and moderate season are
found to be 55 %, 41 %, 99%,97% and 36 % respectively.

61
Figure 5.3 Monthly variations in relative humidity in Jaipur
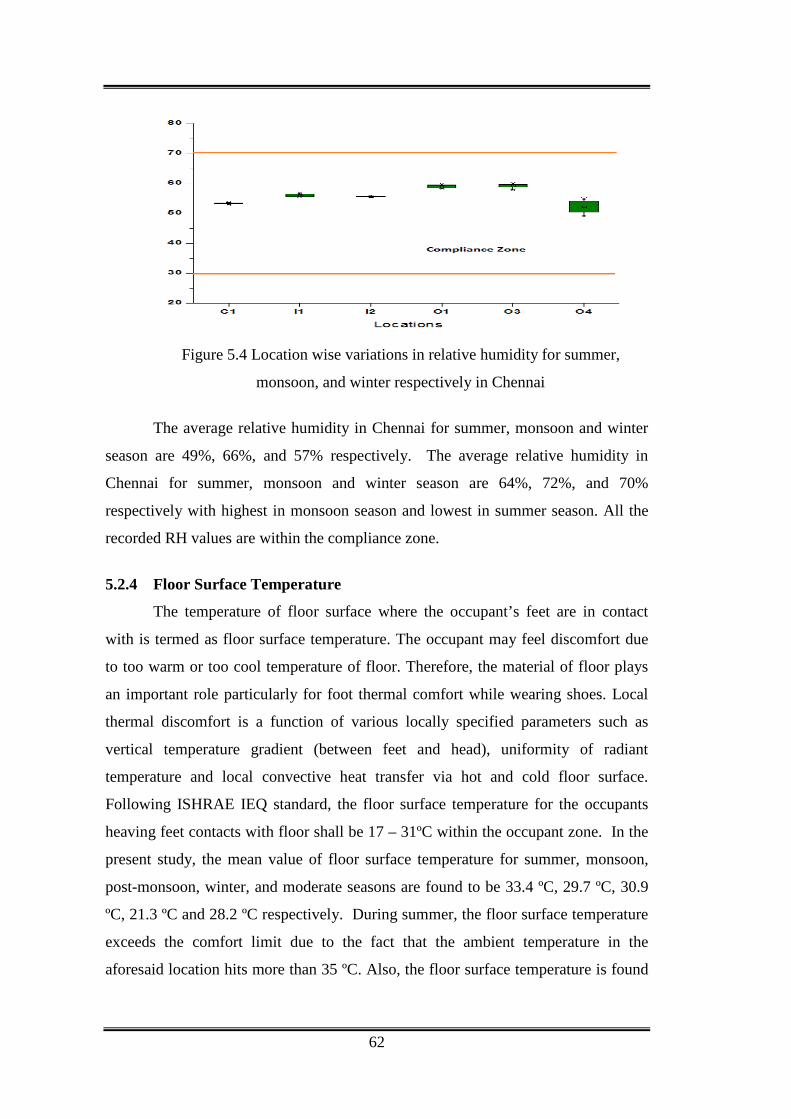
62
Figure 5.4 Location wise variations in relative humidity for summer,
monsoon, and winter respectively in Chennai
The average relative humidity in Chennai for summer, monsoon and winter
season are 49%, 66%, and 57% respectively. The average relative humidity in
Chennai for summer, monsoon and winter season are 64%, 72%, and 70%
respectively with highest in monsoon season and lowest in summer season. All the
recorded RH values are within the compliance zone.
5.2.4 Floor Surface Temperature
The temperature of floor surface where the occupant’s feet are in contact
with is termed as floor surface temperature. The occupant may feel discomfort due
to too warm or too cool temperature of floor. Therefore, the material of floor plays
an important role particularly for foot thermal comfort while wearing shoes. Local
thermal discomfort is a function of various locally specified parameters such as
vertical temperature gradient (between feet and head), uniformity of radiant
temperature and local convective heat transfer via hot and cold floor surface.
Following ISHRAE IEQ standard, the floor surface temperature for the occupants
heaving feet contacts with floor shall be 17 – 31ºC within the occupant zone. In the
present study, the mean value of floor surface temperature for summer, monsoon,
post-monsoon, winter, and moderate seasons are found to be 33.4 ºC, 29.7 ºC, 30.9
ºC, 21.3 ºC and 28.2 ºC respectively. During summer, the floor surface temperature
exceeds the comfort limit due to the fact that the ambient temperature in the
aforesaid location hits more than 35 ºC. Also, the floor surface temperature is found

63
to be relatively higher near the wall exposed to direct solar. In the old administrative
building, since the floor material of first and second floors are made up of RCC and
therefore, attributed to conduct more heat (due to high conductive steel rods) causing
higher floor surface temperature as compared to the floor having underneath ground
surface.
Figure 5.5 Monthly variations in floor surface temperature in Jaipur
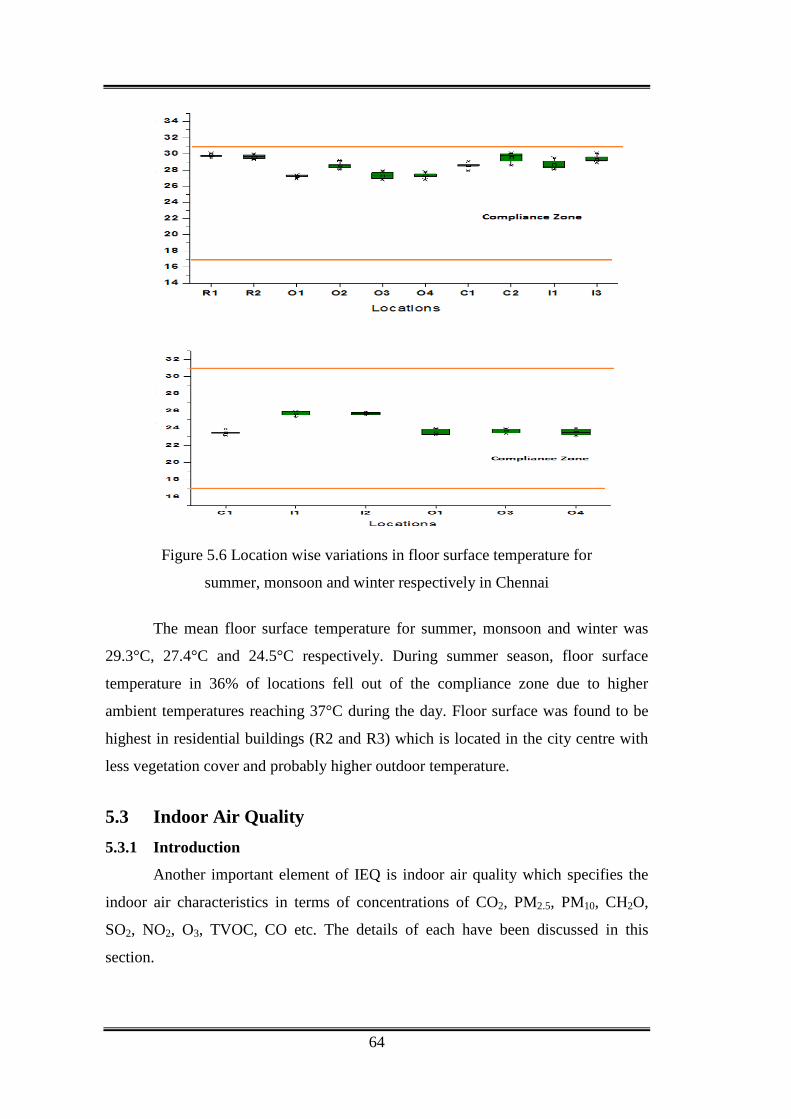
64
Figure 5.6 Location wise variations in floor surface temperature for
summer, monsoon and winter respectively in Chennai
The mean floor surface temperature for summer, monsoon and winter was
29.3°C, 27.4°C and 24.5°C respectively. During summer season, floor surface
temperature in 36% of locations fell out of the compliance zone due to higher
ambient temperatures reaching 37°C during the day. Floor surface was found to be
highest in residential buildings (R2 and R3) which is located in the city centre with
less vegetation cover and probably higher outdoor temperature.
5.3 Indoor Air Quality 5.3.1 Introduction
Another important element of IEQ is indoor air quality which specifies the
indoor air characteristics in terms of concentrations of CO2, PM2.5, PM10, CH2O,
SO2, NO2, O3, TVOC, CO etc. The details of each have been discussed in this
section.
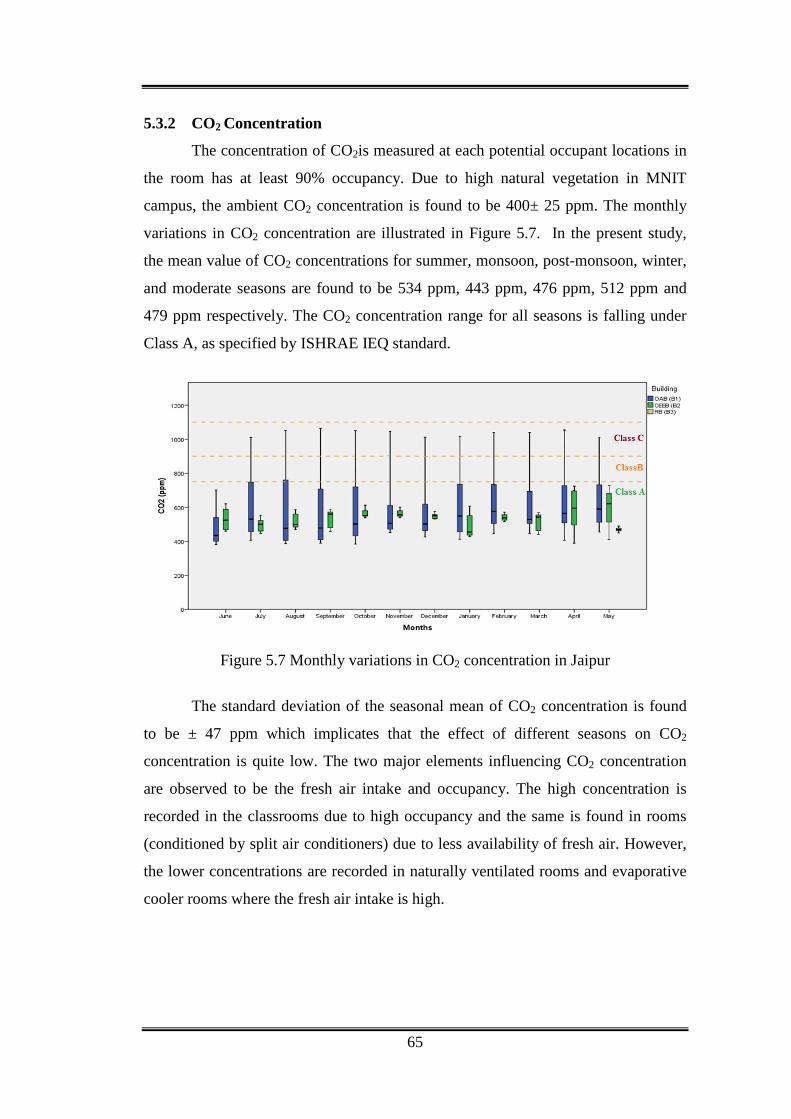
65
5.3.2 CO2 Concentration
The concentration of CO2is measured at each potential occupant locations in
the room has at least 90% occupancy. Due to high natural vegetation in MNIT
campus, the ambient CO2 concentration is found to be 400± 25 ppm. The monthly
variations in CO2 concentration are illustrated in Figure 5.7. In the present study,
the mean value of CO2 concentrations for summer, monsoon, post-monsoon, winter,
and moderate seasons are found to be 534 ppm, 443 ppm, 476 ppm, 512 ppm and
479 ppm respectively. The CO2 concentration range for all seasons is falling under
Class A, as specified by ISHRAE IEQ standard.
Figure 5.7 Monthly variations in CO2 concentration in Jaipur
The standard deviation of the seasonal mean of CO2 concentration is found
to be ± 47 ppm which implicates that the effect of different seasons on CO2
concentration is quite low. The two major elements influencing CO2 concentration
are observed to be the fresh air intake and occupancy. The high concentration is
recorded in the classrooms due to high occupancy and the same is found in rooms
(conditioned by split air conditioners) due to less availability of fresh air. However,
the lower concentrations are recorded in naturally ventilated rooms and evaporative
cooler rooms where the fresh air intake is high.
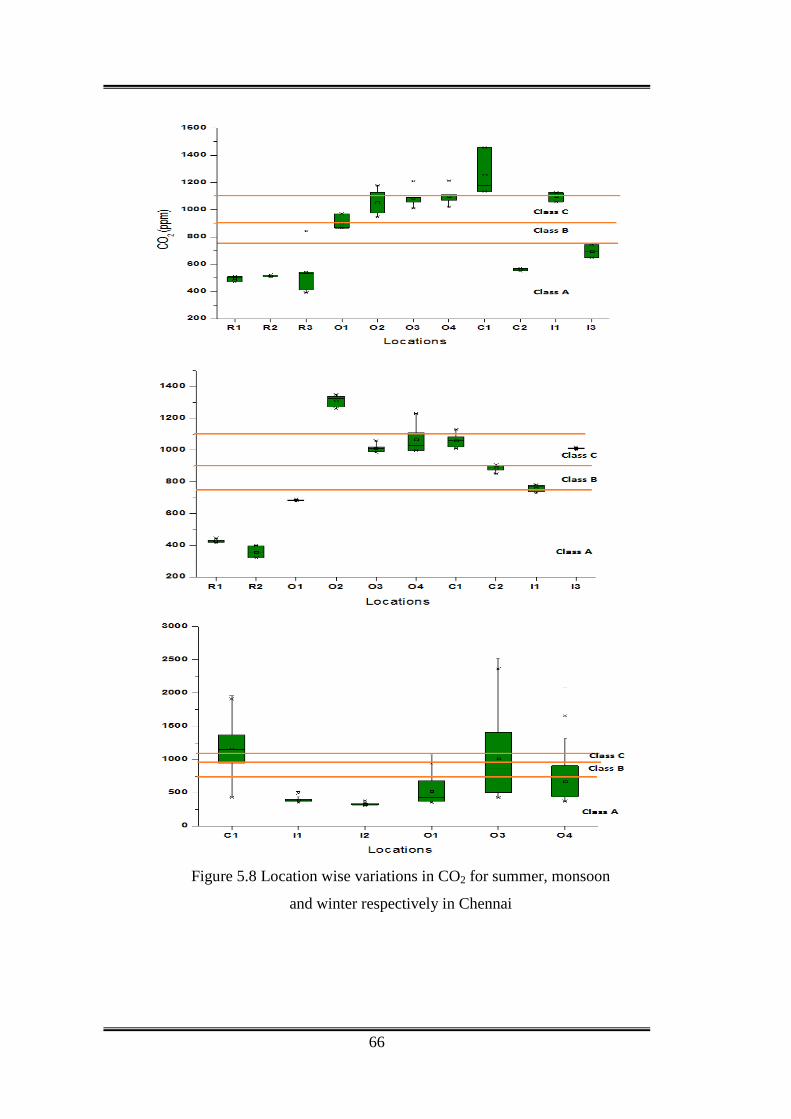
66
Figure 5.8 Location wise variations in CO2 for summer, monsoon
and winter respectively in Chennai

67
Higher CO2 concentration was observed in air conditioned institutional
buildings and offices. As pointed out previously ventilation and occupancy are two
main factors that affect the CO2 concentration. Lowest CO2 levels were recorded at
residential buildings were number of occupants are less whereas highest CO2
concentration was noted at air conditioned office building irrespective of the
monitoring season.
5.3.3 RSPM Concentration
The presence of particulate matter in environment affects the indoor air
quality to large extent and thus it has always been of great interest to the scientific
community. The monthly variations in PM2.5 and PM10 concentration are
illustrated in Figure 5.9. The mean value of PM2.5 concentrations for summer,
monsoon, post-monsoon, winter, and moderate seasons are found to be 33 µg/m3, 30
µg/m3, 34 µg/m3, 61 µg/m3and 44 µg/m3respectively. Further, the mean value of PM
10 concentration for summer, winter, and moderate seasons are found to be 81
µg/m3, 121 µg/m3,123 µg/m3and 97 µg/m3respectively.
(a)
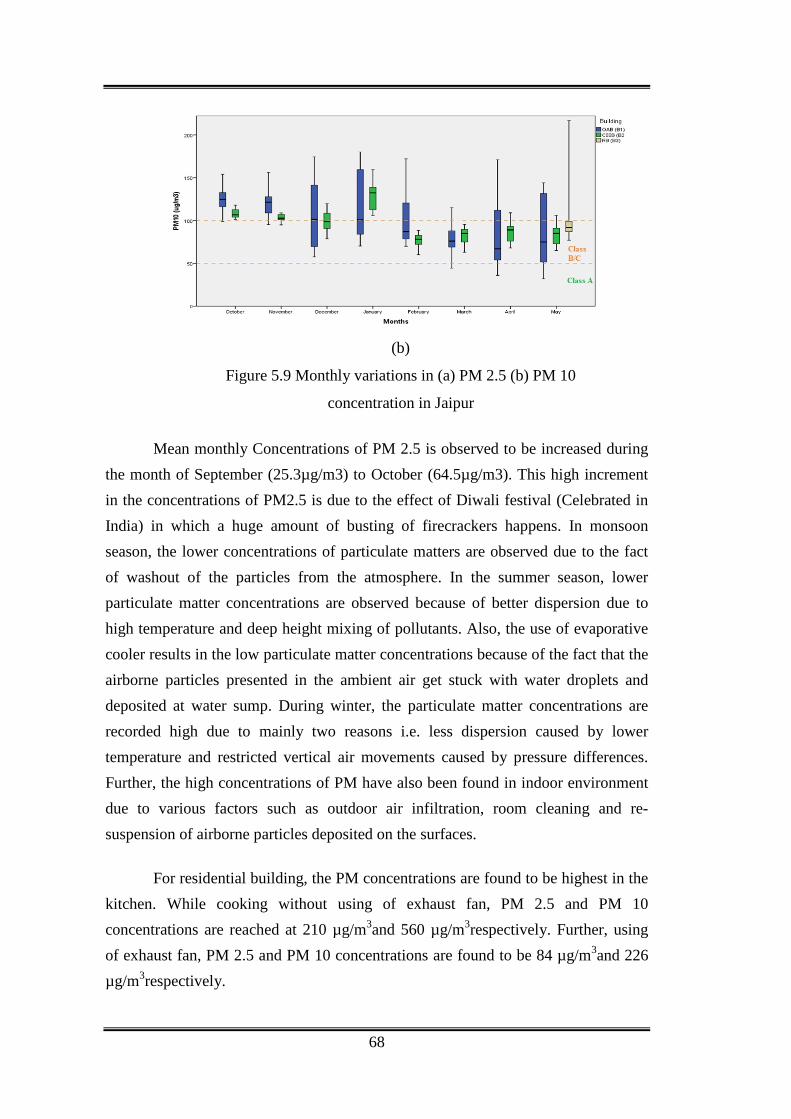
68
(b)
Figure 5.9 Monthly variations in (a) PM 2.5 (b) PM 10
concentration in Jaipur
Mean monthly Concentrations of PM 2.5 is observed to be increased during the month of September (25.3µg/m3) to October (64.5µg/m3). This high increment in the concentrations of PM2.5 is due to the effect of Diwali festival (Celebrated in India) in which a huge amount of busting of firecrackers happens. In monsoon season, the lower concentrations of particulate matters are observed due to the fact of washout of the particles from the atmosphere. In the summer season, lower particulate matter concentrations are observed because of better dispersion due to high temperature and deep height mixing of pollutants. Also, the use of evaporative cooler results in the low particulate matter concentrations because of the fact that the airborne particles presented in the ambient air get stuck with water droplets and deposited at water sump. During winter, the particulate matter concentrations are recorded high due to mainly two reasons i.e. less dispersion caused by lower temperature and restricted vertical air movements caused by pressure differences. Further, the high concentrations of PM have also been found in indoor environment due to various factors such as outdoor air infiltration, room cleaning and re-suspension of airborne particles deposited on the surfaces. For residential building, the PM concentrations are found to be highest in the kitchen. While cooking without using of exhaust fan, PM 2.5 and PM 10 concentrations are reached at 210 µg/m3and 560 µg/m3respectively. Further, using of exhaust fan, PM 2.5 and PM 10 concentrations are found to be 84 µg/m3and 226 µg/m3respectively.
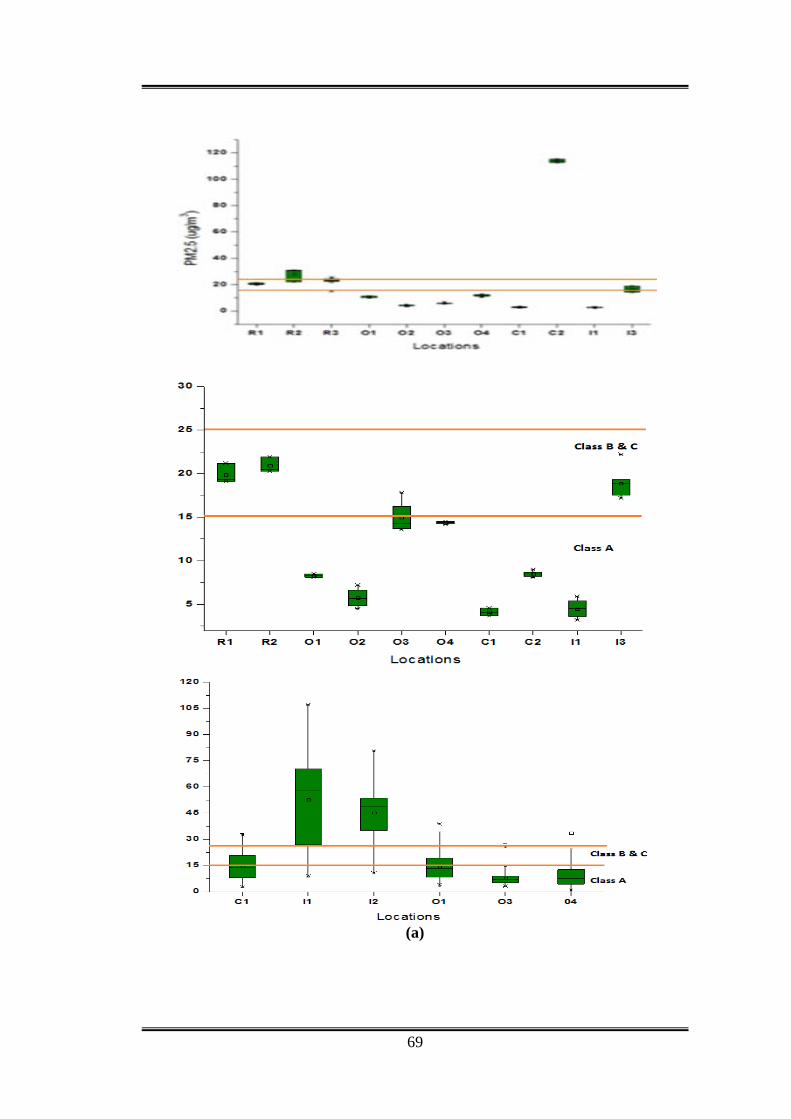
69
(a)
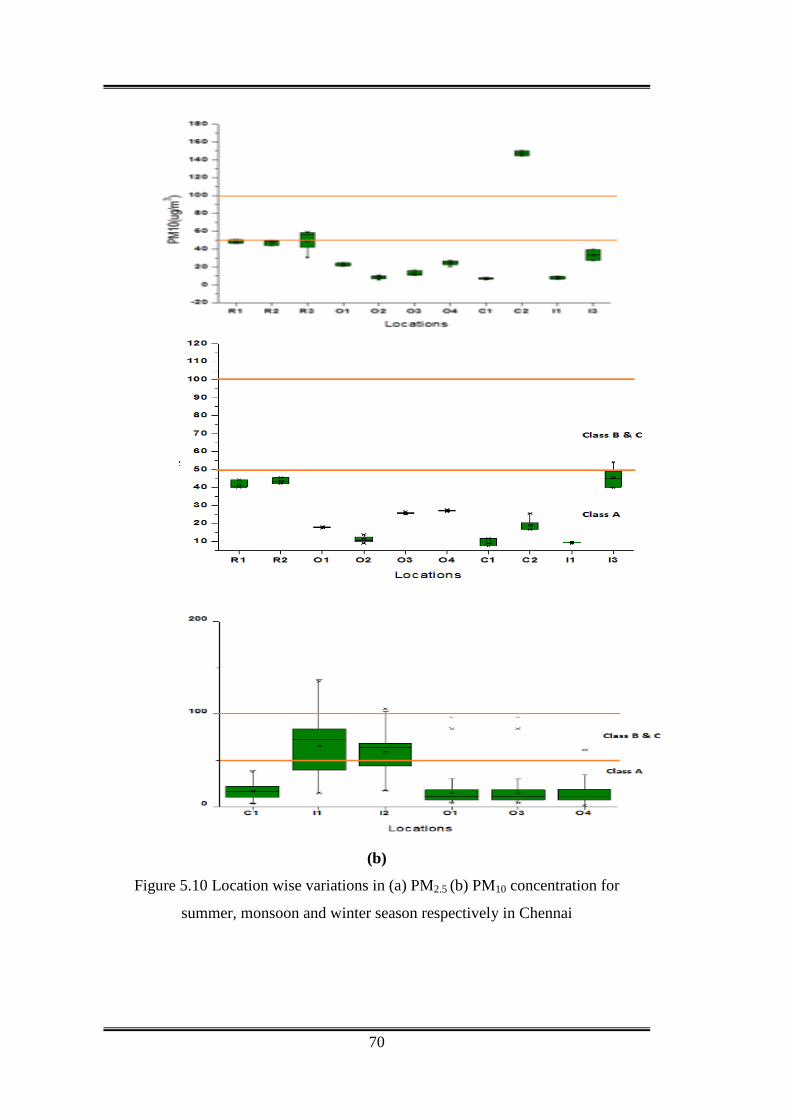
70
(b)
Figure 5.10 Location wise variations in (a) PM2.5 (b) PM10 concentration for
summer, monsoon and winter season respectively in Chennai
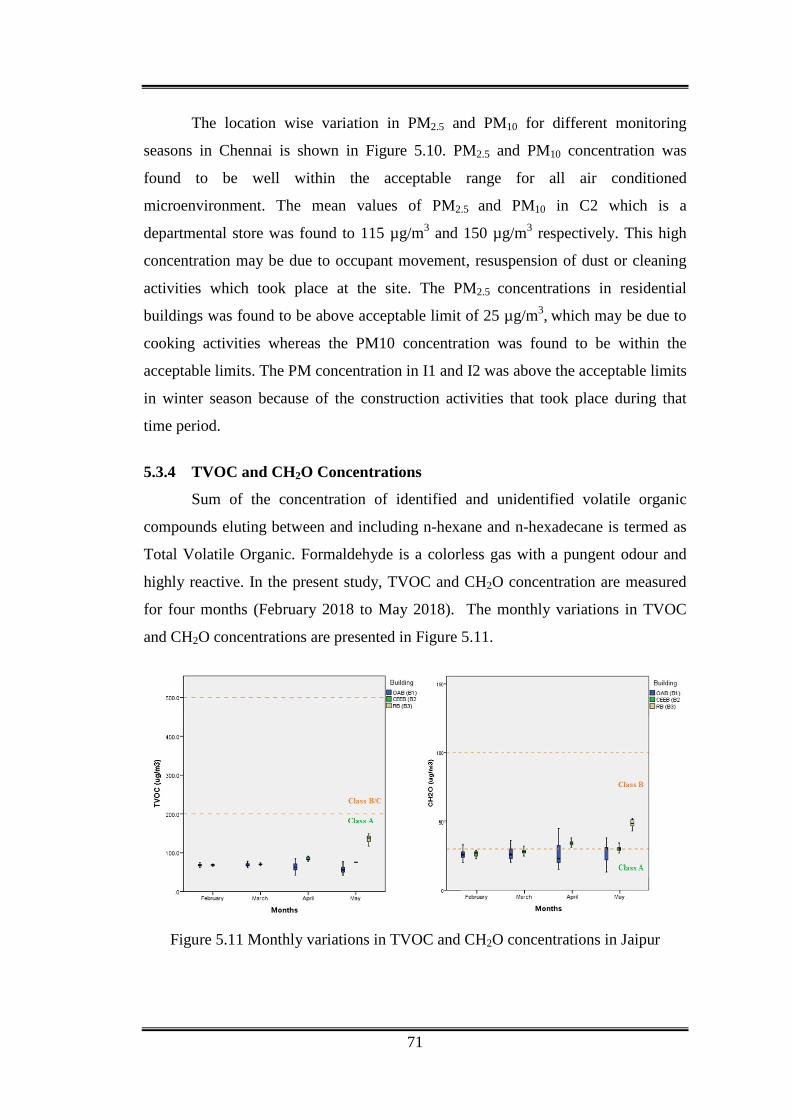
71
The location wise variation in PM2.5 and PM10 for different monitoring
seasons in Chennai is shown in Figure 5.10. PM2.5 and PM10 concentration was
found to be well within the acceptable range for all air conditioned
microenvironment. The mean values of PM2.5 and PM10 in C2 which is a
departmental store was found to 115 µg/m3 and 150 µg/m3 respectively. This high
concentration may be due to occupant movement, resuspension of dust or cleaning
activities which took place at the site. The PM2.5 concentrations in residential
buildings was found to be above acceptable limit of 25 µg/m3, which may be due to
cooking activities whereas the PM10 concentration was found to be within the
acceptable limits. The PM concentration in I1 and I2 was above the acceptable limits
in winter season because of the construction activities that took place during that
time period.
5.3.4 TVOC and CH2O Concentrations
Sum of the concentration of identified and unidentified volatile organic
compounds eluting between and including n-hexane and n-hexadecane is termed as
Total Volatile Organic. Formaldehyde is a colorless gas with a pungent odour and
highly reactive. In the present study, TVOC and CH2O concentration are measured
for four months (February 2018 to May 2018). The monthly variations in TVOC
and CH2O concentrations are presented in Figure 5.11.
Figure 5.11 Monthly variations in TVOC and CH2O concentrations in Jaipur
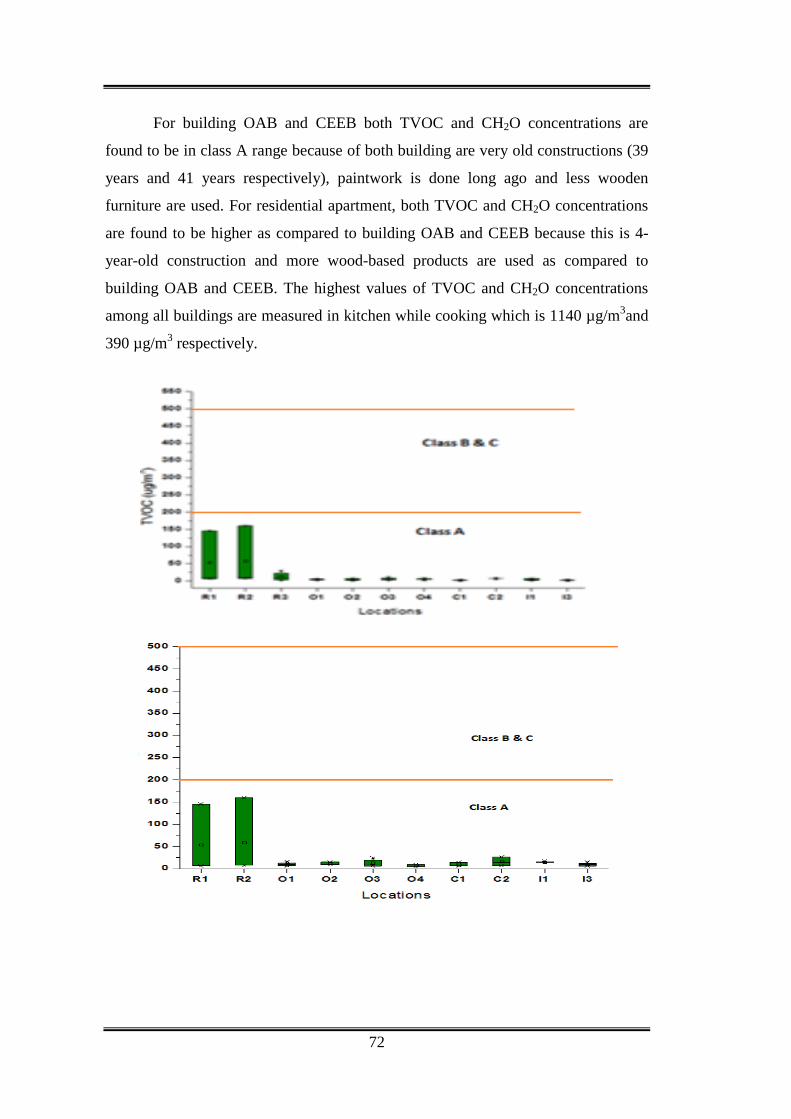
72
For building OAB and CEEB both TVOC and CH2O concentrations are
found to be in class A range because of both building are very old constructions (39
years and 41 years respectively), paintwork is done long ago and less wooden
furniture are used. For residential apartment, both TVOC and CH2O concentrations
are found to be higher as compared to building OAB and CEEB because this is 4-
year-old construction and more wood-based products are used as compared to
building OAB and CEEB. The highest values of TVOC and CH2O concentrations
among all buildings are measured in kitchen while cooking which is 1140 µg/m3and
390 µg/m3 respectively.
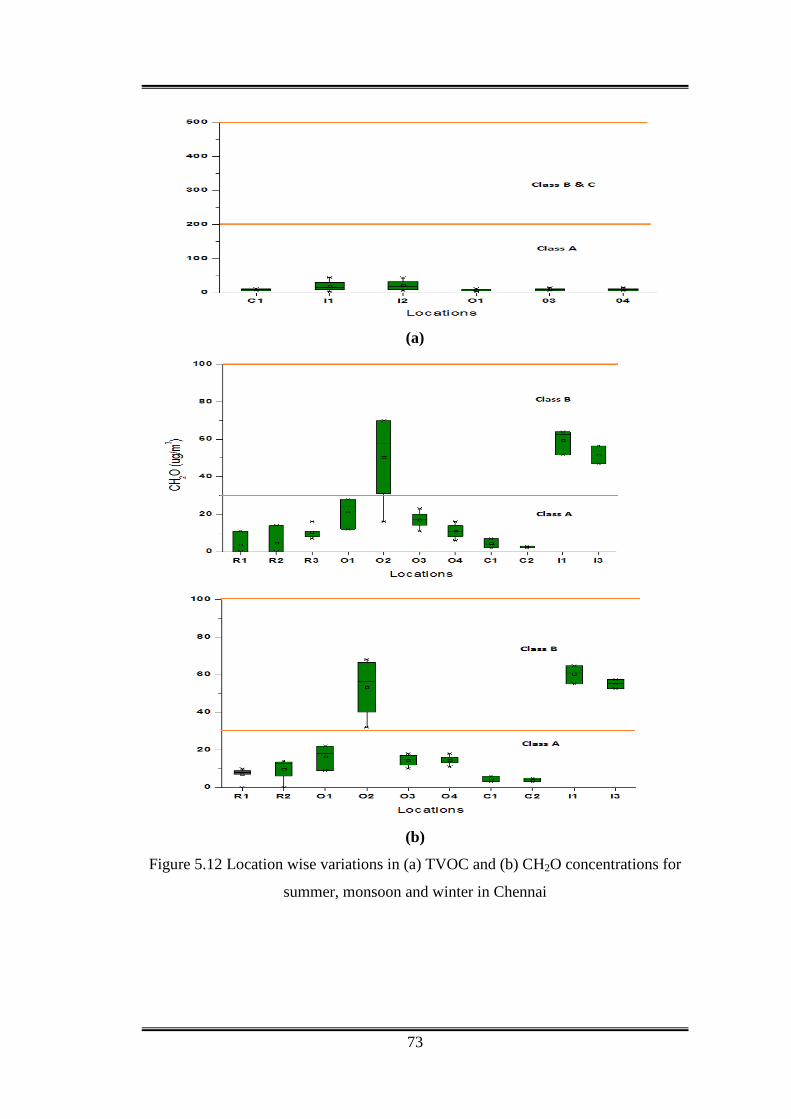
73
(a)
(b)
Figure 5.12 Location wise variations in (a) TVOC and (b) CH2O concentrations for
summer, monsoon and winter in Chennai

74
The location wise variation in TVOC and CH2O for different monitoring
seasons in Chennai is shown in Figure 5.12. The TVOC and CH2O concentration in
all locations was found to be within the compliance zone. The CH2O concentrations
in newly built locations (O2, I1 and I3) was found to be high in all the seasons.
However, the CH2O values for winter season was not monitored due to lack of
instrument availability.
5.3.5 SO2 and NO2 Concentrations
SO2 is highly reactive and toxic gas with a pungent, irritating and rotten
smell. Emission that leads to high concentrations of SO2 generally also leads to
formation of other oxides of Sulphur (SOX). Therefore, SO2 is used as an indicator
for a large group of gaseous sulphur oxides. NO2 is one of the highly reactive gasses
known as oxides of Nitrogen (NOX). In the present study, SO2 and NO2
concentration are measured for four months (February 2018 to May 2018). The
monthly variations in SO2 and NO2 concentrations are shown in Figure 5.13.
Figure 5.13 Monthly variations in SO2 and NO2 concentrations in Jaipur
SO2 and NO2concentration found to be higher in building CEEB as compare
to OAB because of CEEB is nearer to roadway and vehicles emissions are the major
source SO2 and NO2. For a residential apartment, both SO2 and NO2 concentration
are found to be lower as compared to building OAB and CEEB because this is way
from heavy traffic roads as compared to building OAB and CEEB. The highest

75
values of SO2 and NO2 concentration in residential apartment are measured in
kitchen while cooking which is 410 µg/m3and 156 µg/m3 respectively.
(a)
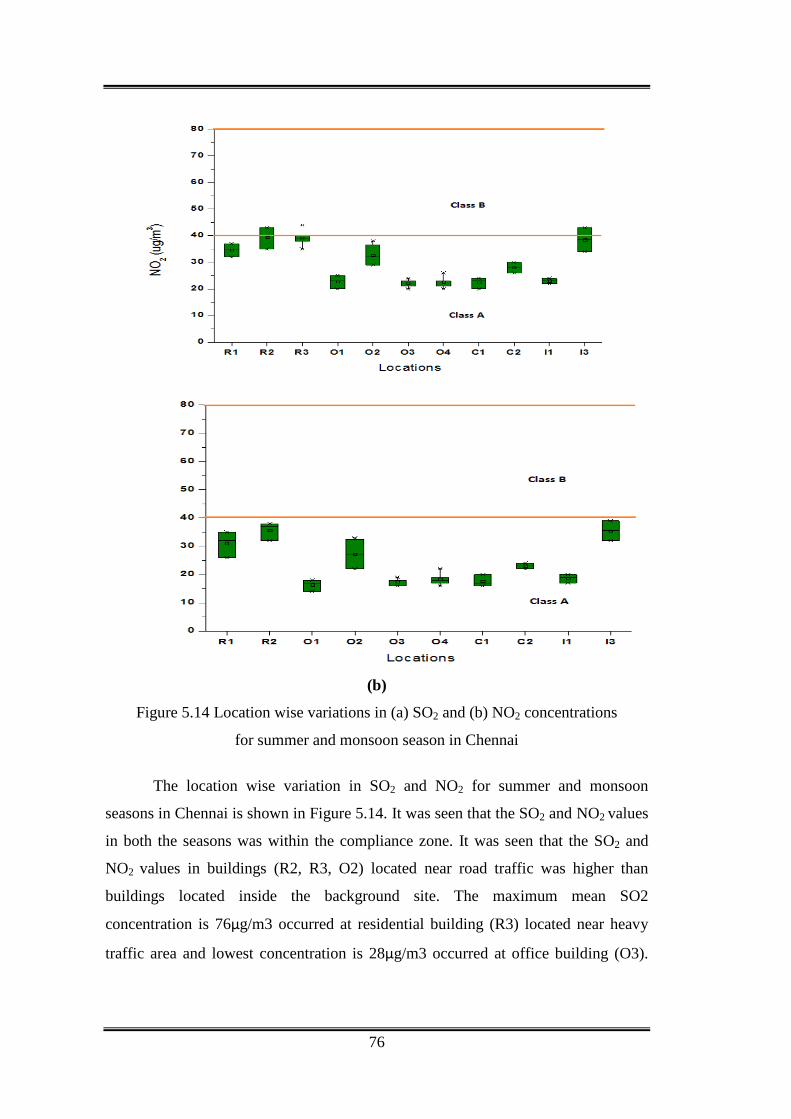
76
(b)
Figure 5.14 Location wise variations in (a) SO2 and (b) NO2 concentrations
for summer and monsoon season in Chennai
The location wise variation in SO2 and NO2 for summer and monsoon
seasons in Chennai is shown in Figure 5.14. It was seen that the SO2 and NO2 values
in both the seasons was within the compliance zone. It was seen that the SO2 and
NO2 values in buildings (R2, R3, O2) located near road traffic was higher than
buildings located inside the background site. The maximum mean SO2
concentration is 76µg/m3 occurred at residential building (R3) located near heavy
traffic area and lowest concentration is 28µg/m3 occurred at office building (O3).
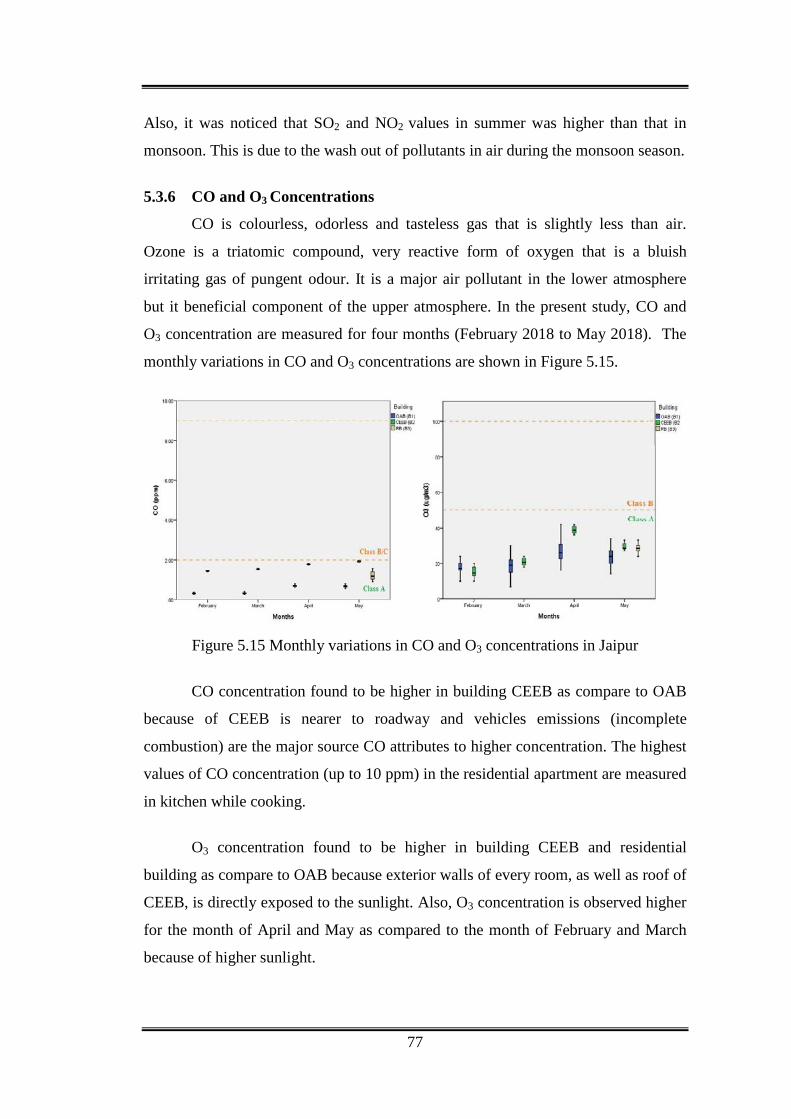
77
Also, it was noticed that SO2 and NO2 values in summer was higher than that in
monsoon. This is due to the wash out of pollutants in air during the monsoon season.
5.3.6 CO and O3 Concentrations
CO is colourless, odorless and tasteless gas that is slightly less than air.
Ozone is a triatomic compound, very reactive form of oxygen that is a bluish
irritating gas of pungent odour. It is a major air pollutant in the lower atmosphere
but it beneficial component of the upper atmosphere. In the present study, CO and
O3 concentration are measured for four months (February 2018 to May 2018). The
monthly variations in CO and O3 concentrations are shown in Figure 5.15.
Figure 5.15 Monthly variations in CO and O3 concentrations in Jaipur
CO concentration found to be higher in building CEEB as compare to OAB
because of CEEB is nearer to roadway and vehicles emissions (incomplete
combustion) are the major source CO attributes to higher concentration. The highest
values of CO concentration (up to 10 ppm) in the residential apartment are measured
in kitchen while cooking.
O3 concentration found to be higher in building CEEB and residential
building as compare to OAB because exterior walls of every room, as well as roof of
CEEB, is directly exposed to the sunlight. Also, O3 concentration is observed higher
for the month of April and May as compared to the month of February and March
because of higher sunlight.
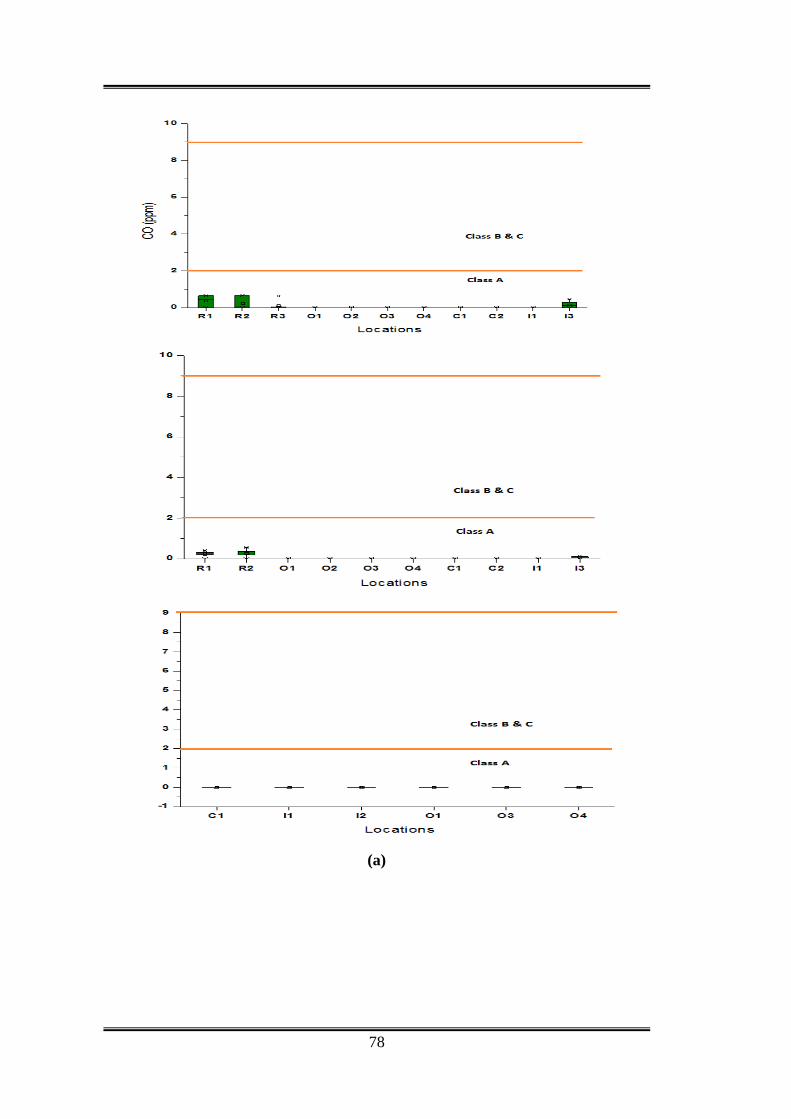
78
(a)
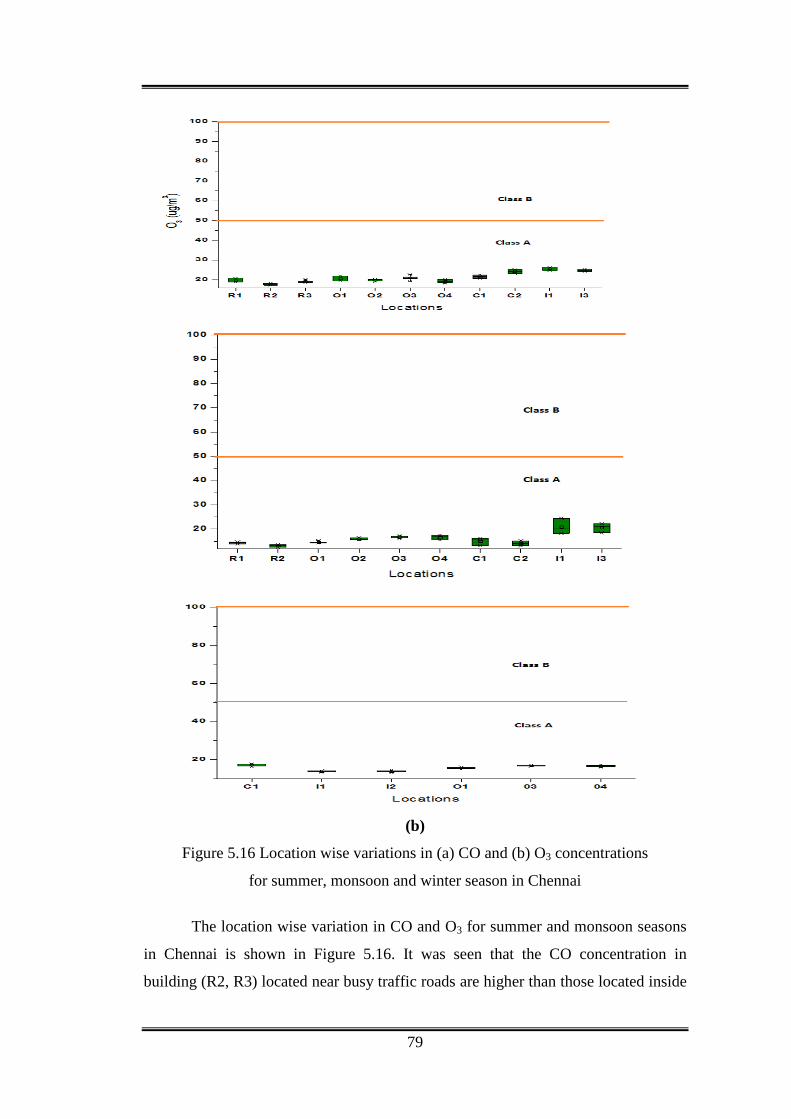
79
(b)
Figure 5.16 Location wise variations in (a) CO and (b) O3 concentrations
for summer, monsoon and winter season in Chennai
The location wise variation in CO and O3 for summer and monsoon seasons
in Chennai is shown in Figure 5.16. It was seen that the CO concentration in
building (R2, R3) located near busy traffic roads are higher than those located inside
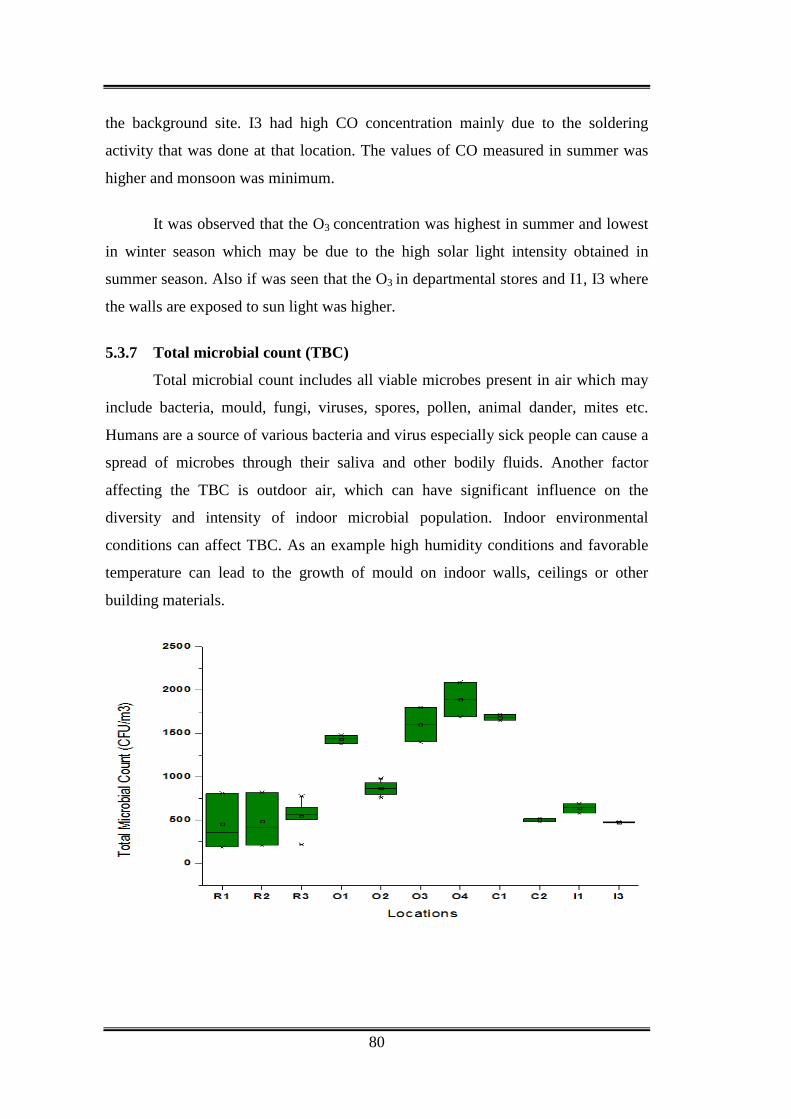
80
the background site. I3 had high CO concentration mainly due to the soldering
activity that was done at that location. The values of CO measured in summer was
higher and monsoon was minimum.
It was observed that the O3 concentration was highest in summer and lowest
in winter season which may be due to the high solar light intensity obtained in
summer season. Also if was seen that the O3 in departmental stores and I1, I3 where
the walls are exposed to sun light was higher.
5.3.7 Total microbial count (TBC)
Total microbial count includes all viable microbes present in air which may
include bacteria, mould, fungi, viruses, spores, pollen, animal dander, mites etc.
Humans are a source of various bacteria and virus especially sick people can cause a
spread of microbes through their saliva and other bodily fluids. Another factor
affecting the TBC is outdoor air, which can have significant influence on the
diversity and intensity of indoor microbial population. Indoor environmental
conditions can affect TBC. As an example high humidity conditions and favorable
temperature can lead to the growth of mould on indoor walls, ceilings or other
building materials.
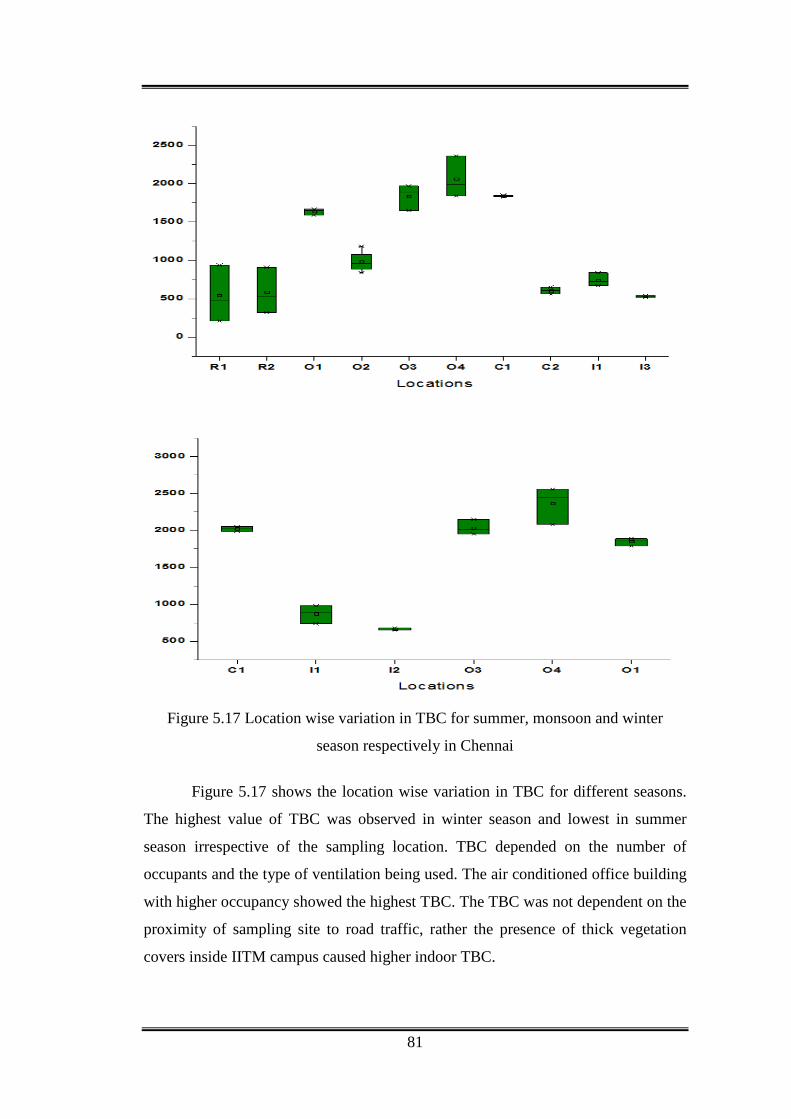
81
Figure 5.17 Location wise variation in TBC for summer, monsoon and winter
season respectively in Chennai
Figure 5.17 shows the location wise variation in TBC for different seasons.
The highest value of TBC was observed in winter season and lowest in summer
season irrespective of the sampling location. TBC depended on the number of
occupants and the type of ventilation being used. The air conditioned office building
with higher occupancy showed the highest TBC. The TBC was not dependent on the
proximity of sampling site to road traffic, rather the presence of thick vegetation
covers inside IITM campus caused higher indoor TBC.
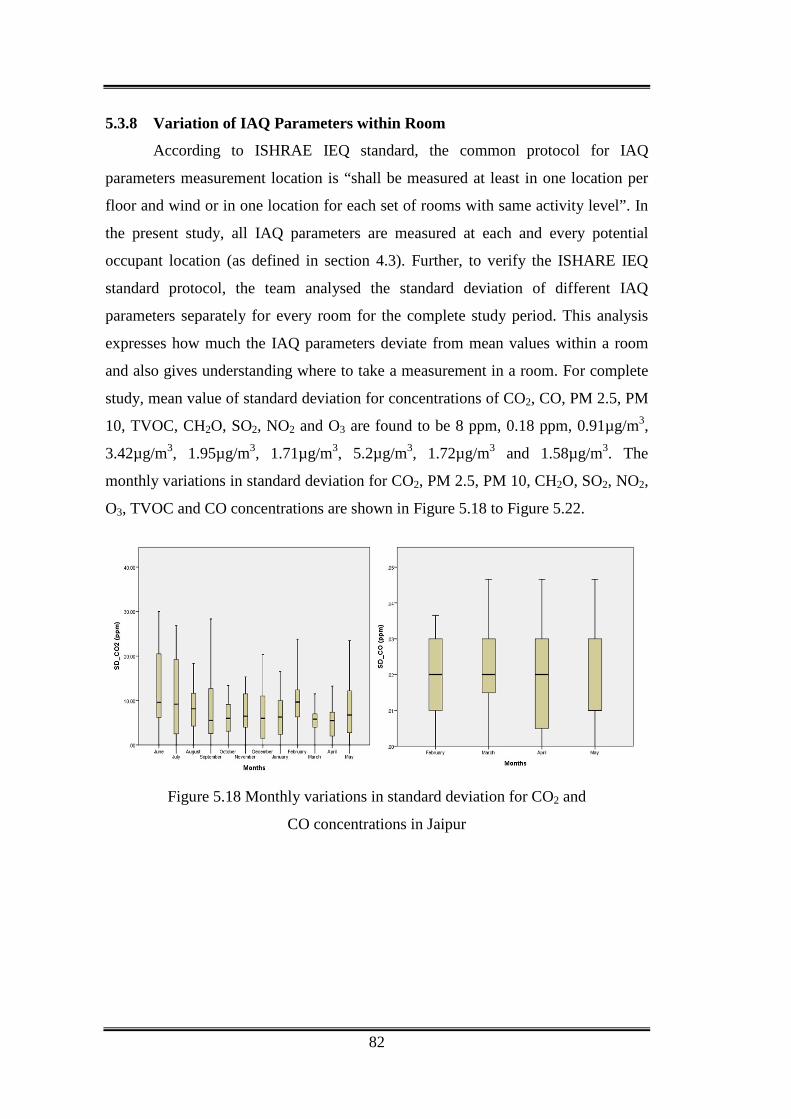
82
5.3.8 Variation of IAQ Parameters within Room
According to ISHRAE IEQ standard, the common protocol for IAQ
parameters measurement location is “shall be measured at least in one location per
floor and wind or in one location for each set of rooms with same activity level”. In
the present study, all IAQ parameters are measured at each and every potential
occupant location (as defined in section 4.3). Further, to verify the ISHARE IEQ
standard protocol, the team analysed the standard deviation of different IAQ
parameters separately for every room for the complete study period. This analysis
expresses how much the IAQ parameters deviate from mean values within a room
and also gives understanding where to take a measurement in a room. For complete
study, mean value of standard deviation for concentrations of CO2, CO, PM 2.5, PM
10, TVOC, CH2O, SO2, NO2 and O3 are found to be 8 ppm, 0.18 ppm, 0.91µg/m3,
3.42µg/m3, 1.95µg/m3, 1.71µg/m3, 5.2µg/m3, 1.72µg/m3 and 1.58µg/m3. The
monthly variations in standard deviation for CO2, PM 2.5, PM 10, CH2O, SO2, NO2,
O3, TVOC and CO concentrations are shown in Figure 5.18 to Figure 5.22.
Figure 5.18 Monthly variations in standard deviation for CO2 and
CO concentrations in Jaipur
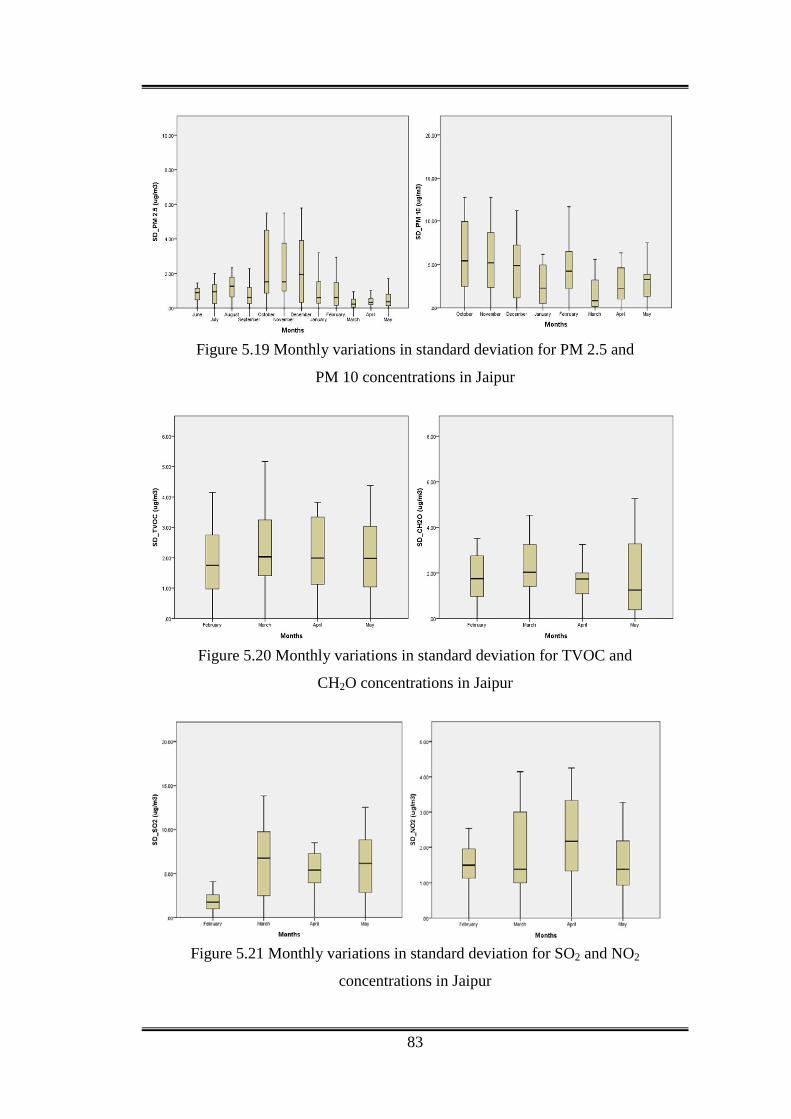
83
Figure 5.19 Monthly variations in standard deviation for PM 2.5 and
PM 10 concentrations in Jaipur
Figure 5.20 Monthly variations in standard deviation for TVOC and
CH2O concentrations in Jaipur
Figure 5.21 Monthly variations in standard deviation for SO2 and NO2
concentrations in Jaipur
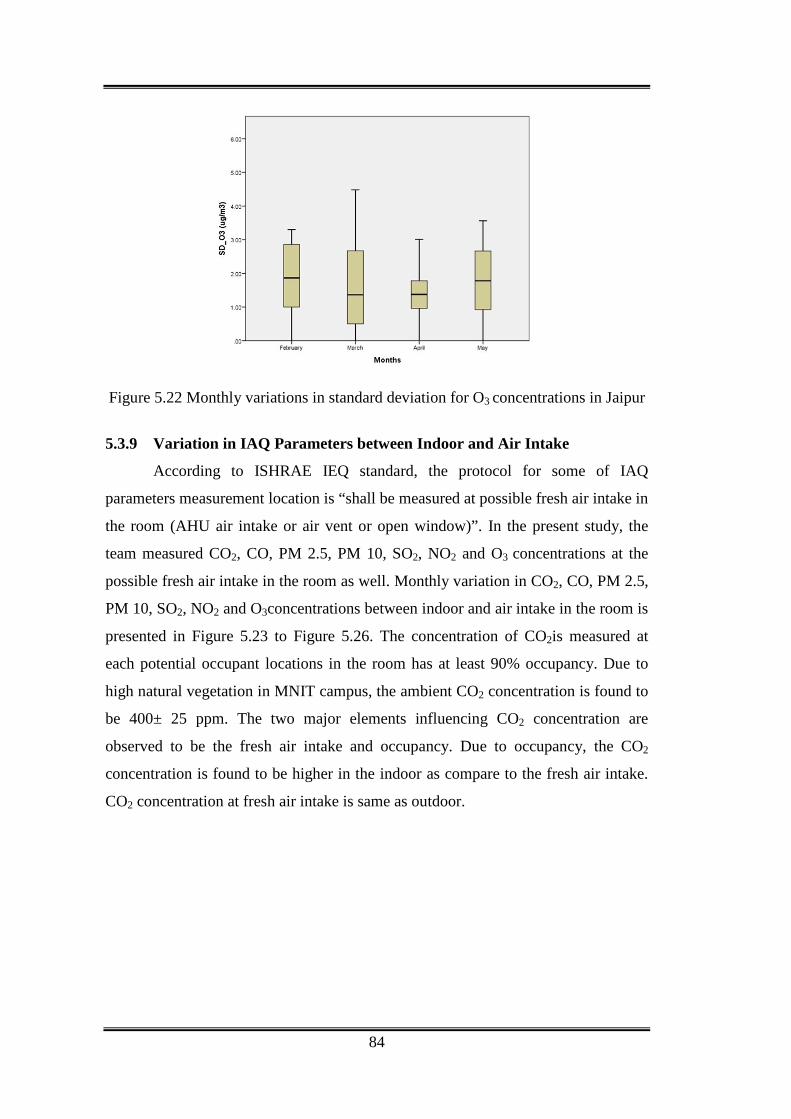
84
Figure 5.22 Monthly variations in standard deviation for O3 concentrations in Jaipur
5.3.9 Variation in IAQ Parameters between Indoor and Air Intake
According to ISHRAE IEQ standard, the protocol for some of IAQ
parameters measurement location is “shall be measured at possible fresh air intake in
the room (AHU air intake or air vent or open window)”. In the present study, the
team measured CO2, CO, PM 2.5, PM 10, SO2, NO2 and O3 concentrations at the
possible fresh air intake in the room as well. Monthly variation in CO2, CO, PM 2.5,
PM 10, SO2, NO2 and O3concentrations between indoor and air intake in the room is
presented in Figure 5.23 to Figure 5.26. The concentration of CO2is measured at
each potential occupant locations in the room has at least 90% occupancy. Due to
high natural vegetation in MNIT campus, the ambient CO2 concentration is found to
be 400± 25 ppm. The two major elements influencing CO2 concentration are
observed to be the fresh air intake and occupancy. Due to occupancy, the CO2
concentration is found to be higher in the indoor as compare to the fresh air intake.
CO2 concentration at fresh air intake is same as outdoor.

85
Figure 5.23 Monthly variations in CO2 concentrations between indoor and
air intake in Jaipur
Both PM 2.5 and PM 10 concentrations are found to lower in the indoor for
all seasons except the monsoon season. In monsoon season, the lower concentrations
of particulate matters are observed due to the fact of washout of the particles from
the atmosphere. Further, for the month of October and May both PM 2.5 and PM 10
concentrations are observed higher in air intake as compare to other months which is
due the effect of Diwali festival (Celebrated in India) in which a huge amount of
busting of firecrackers happens in the month of October and in the month of May the
dust storm hit north-west India.
(a)

86
(b)
Figure 5.24 Monthly variations in (a) PM 2.5 (b) PM 10 concentrations
between indoor and air intake in Jaipur
SO2 and NO2 concentration found to be higher at air intake as compare
indoor because of vehicles emissions are the major source SO2 and NO2. Similarly,
CO concentration found to be air intake as comparing indoor vehicles emissions
(incomplete combustion) are the major source CO. O3concentration is observed
higher at air intake as compare indoor because of higher sunlight. Further, ambient
ground-level O3 is not emitted directly into the air, but is created by chemical
reactions between NOX and VOCs in the presence of sunlight, causes higher values
of ozone concentrations at air intake as compared to indoor.
Figure 5.25 Monthly variations in SO2 and NO2 concentrations between
indoor and air intake in Jaipur

87
Figure 5.26 Monthly variations in CO and O3 concentrations between
indoor and air intake in Jaipur
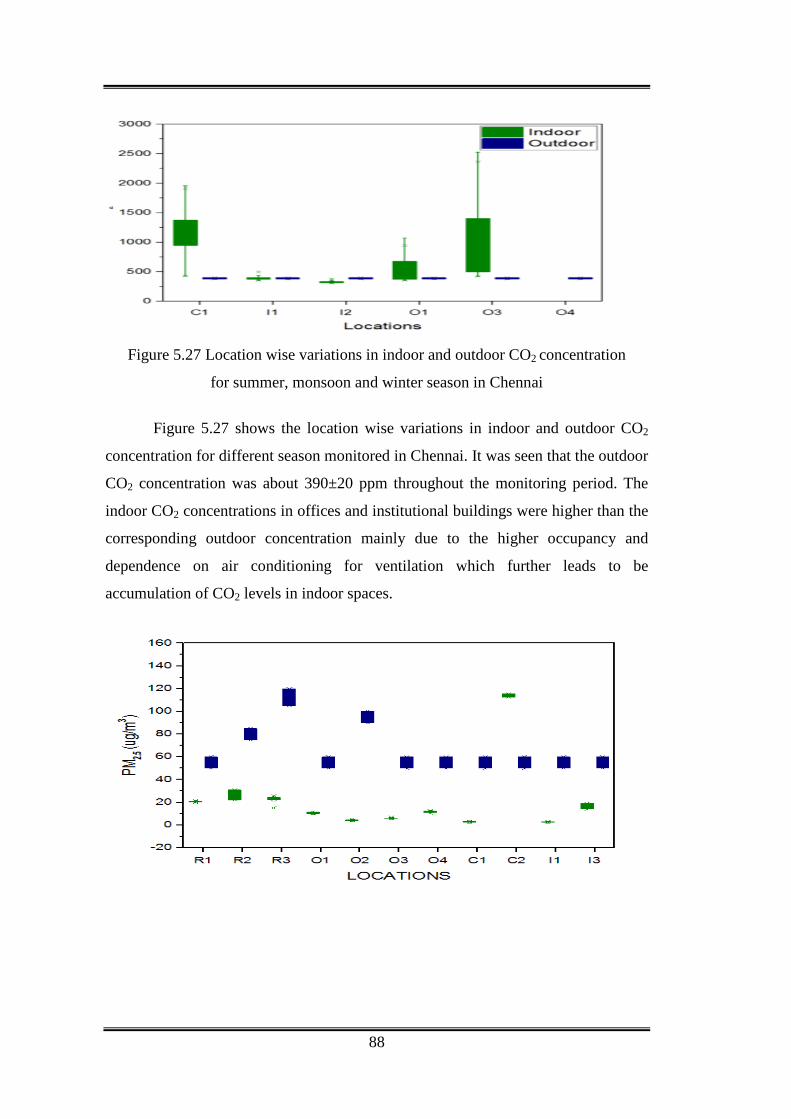
88
Figure 5.27 Location wise variations in indoor and outdoor CO2 concentration
for summer, monsoon and winter season in Chennai
Figure 5.27 shows the location wise variations in indoor and outdoor CO2
concentration for different season monitored in Chennai. It was seen that the outdoor
CO2 concentration was about 390±20 ppm throughout the monitoring period. The
indoor CO2 concentrations in offices and institutional buildings were higher than the
corresponding outdoor concentration mainly due to the higher occupancy and
dependence on air conditioning for ventilation which further leads to be
accumulation of CO2 levels in indoor spaces.
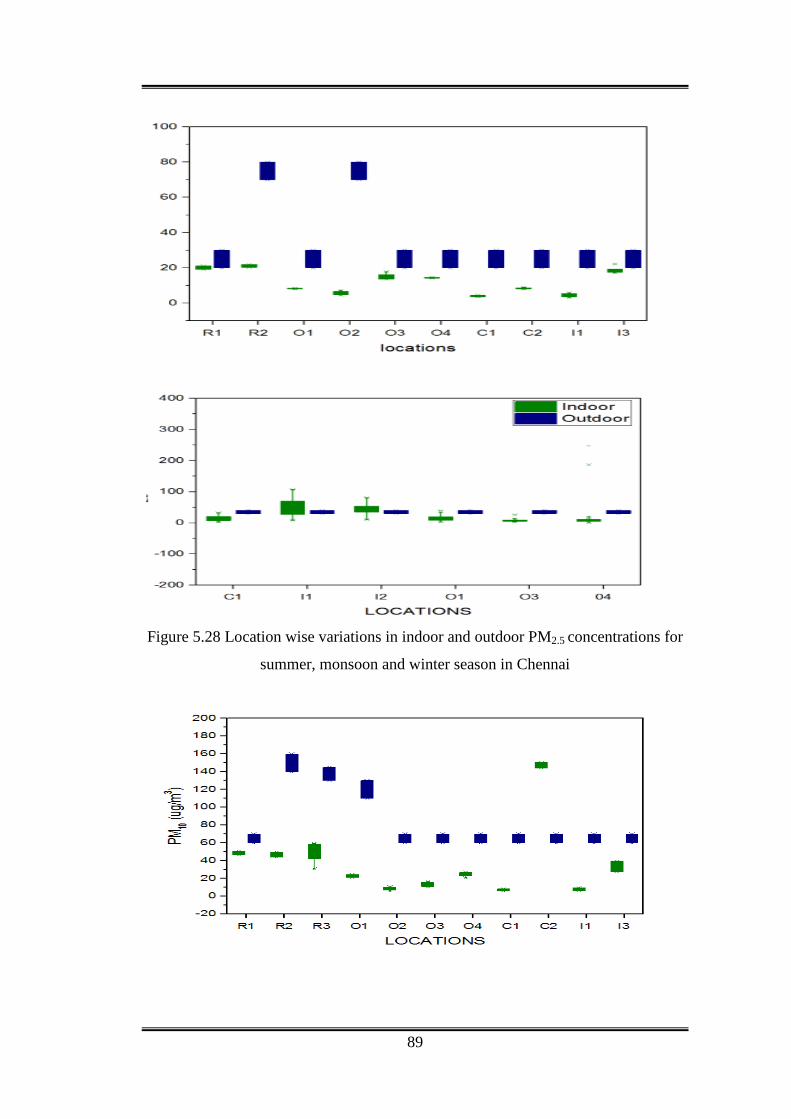
89
Figure 5.28 Location wise variations in indoor and outdoor PM2.5 concentrations for
summer, monsoon and winter season in Chennai
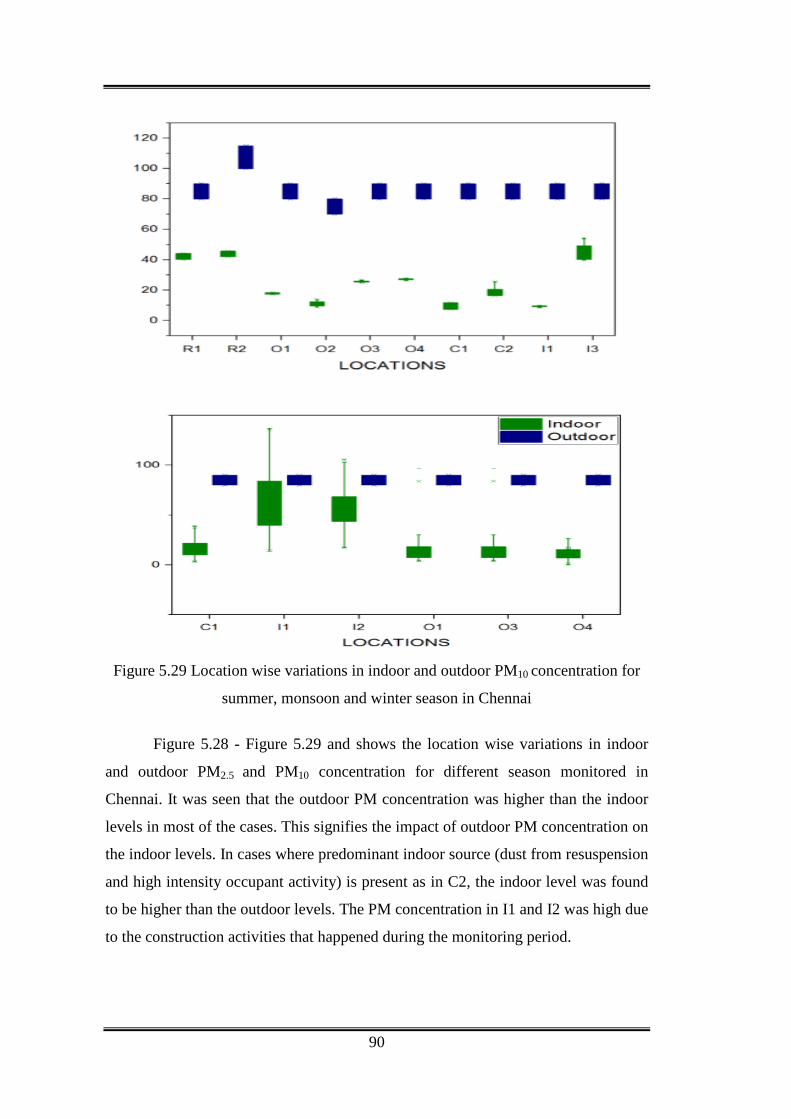
90
Figure 5.29 Location wise variations in indoor and outdoor PM10 concentration for
summer, monsoon and winter season in Chennai
Figure 5.28 - Figure 5.29 and shows the location wise variations in indoor
and outdoor PM2.5 and PM10 concentration for different season monitored in
Chennai. It was seen that the outdoor PM concentration was higher than the indoor
levels in most of the cases. This signifies the impact of outdoor PM concentration on
the indoor levels. In cases where predominant indoor source (dust from resuspension
and high intensity occupant activity) is present as in C2, the indoor level was found
to be higher than the outdoor levels. The PM concentration in I1 and I2 was high due
to the construction activities that happened during the monitoring period.
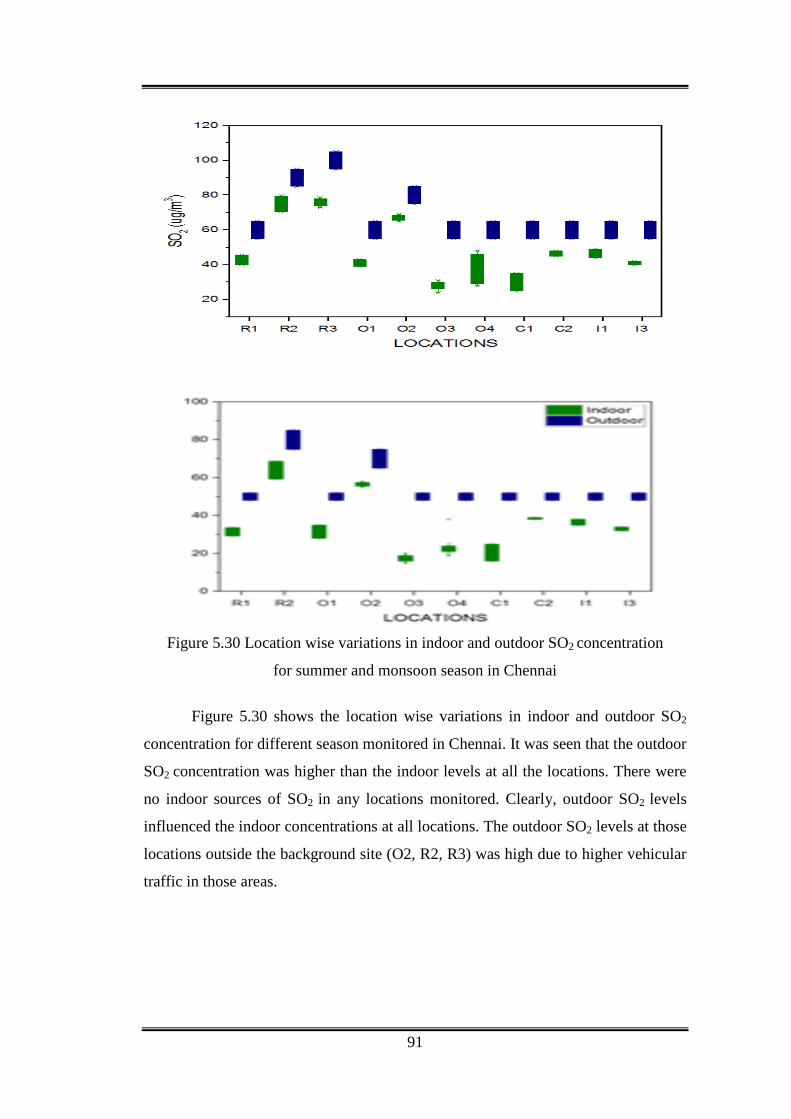
91
Figure 5.30 Location wise variations in indoor and outdoor SO2 concentration
for summer and monsoon season in Chennai
Figure 5.30 shows the location wise variations in indoor and outdoor SO2
concentration for different season monitored in Chennai. It was seen that the outdoor
SO2 concentration was higher than the indoor levels at all the locations. There were
no indoor sources of SO2 in any locations monitored. Clearly, outdoor SO2 levels
influenced the indoor concentrations at all locations. The outdoor SO2 levels at those
locations outside the background site (O2, R2, R3) was high due to higher vehicular
traffic in those areas.
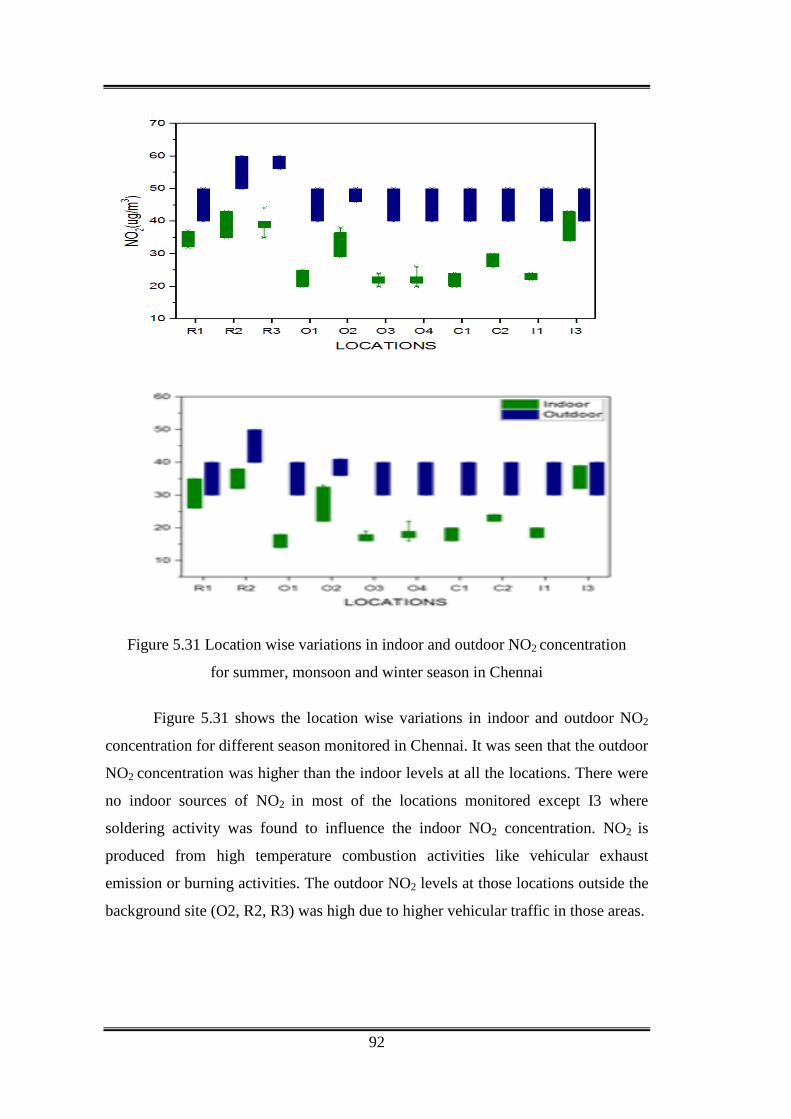
92
Figure 5.31 Location wise variations in indoor and outdoor NO2 concentration
for summer, monsoon and winter season in Chennai
Figure 5.31 shows the location wise variations in indoor and outdoor NO2
concentration for different season monitored in Chennai. It was seen that the outdoor
NO2 concentration was higher than the indoor levels at all the locations. There were
no indoor sources of NO2 in most of the locations monitored except I3 where
soldering activity was found to influence the indoor NO2 concentration. NO2 is
produced from high temperature combustion activities like vehicular exhaust
emission or burning activities. The outdoor NO2 levels at those locations outside the
background site (O2, R2, R3) was high due to higher vehicular traffic in those areas.

93
Figure 5.32 Location wise variations in indoor and outdoor CO concentration for
summer, monsoon and winter season in Chennai
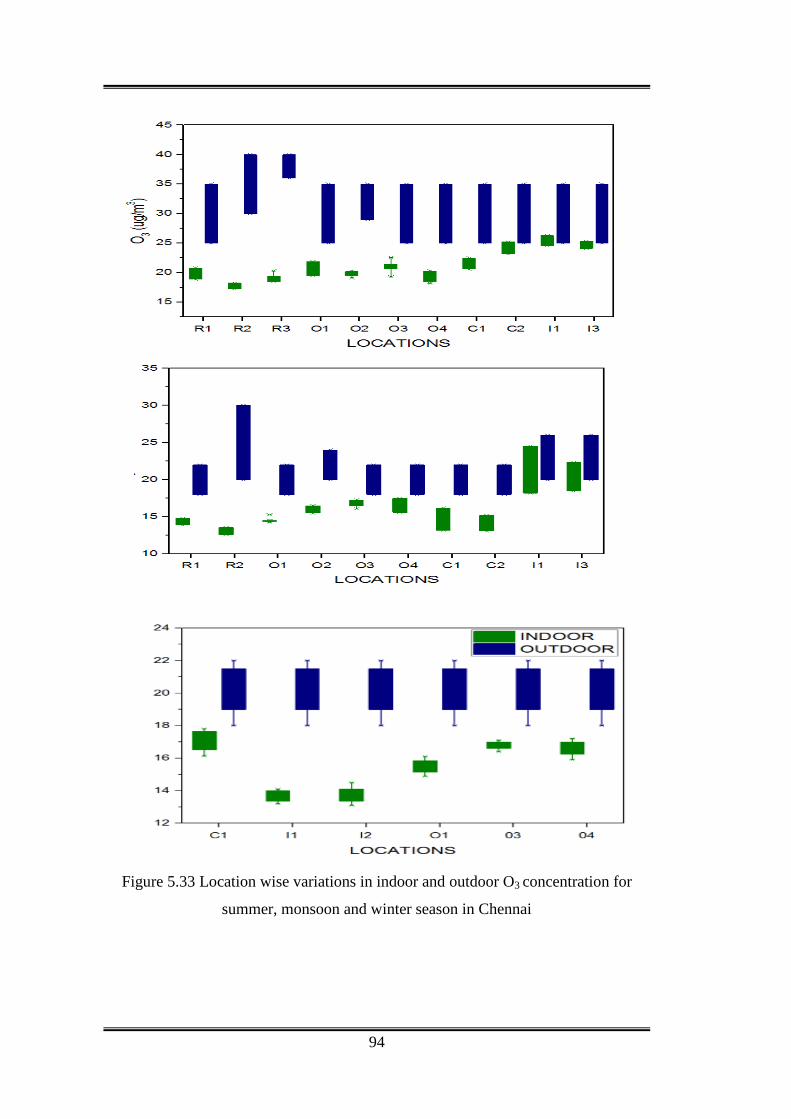
94
Figure 5.33 Location wise variations in indoor and outdoor O3 concentration for
summer, monsoon and winter season in Chennai

95
Figure 5.33 and shows the location wise variations in indoor and outdoor CO
and O3 concentration respectively for different season monitored in Chennai. It was
seen that the outdoor CO and O3 concentration was higher than the indoor levels at
all the locations. CO is mainly produced from incomplete combustion activities
mainly cooking in residences and soldering activity in I3. O3 levels in locations
outside the highly vegetated background site was higher due to higher sun light
received by these areas.
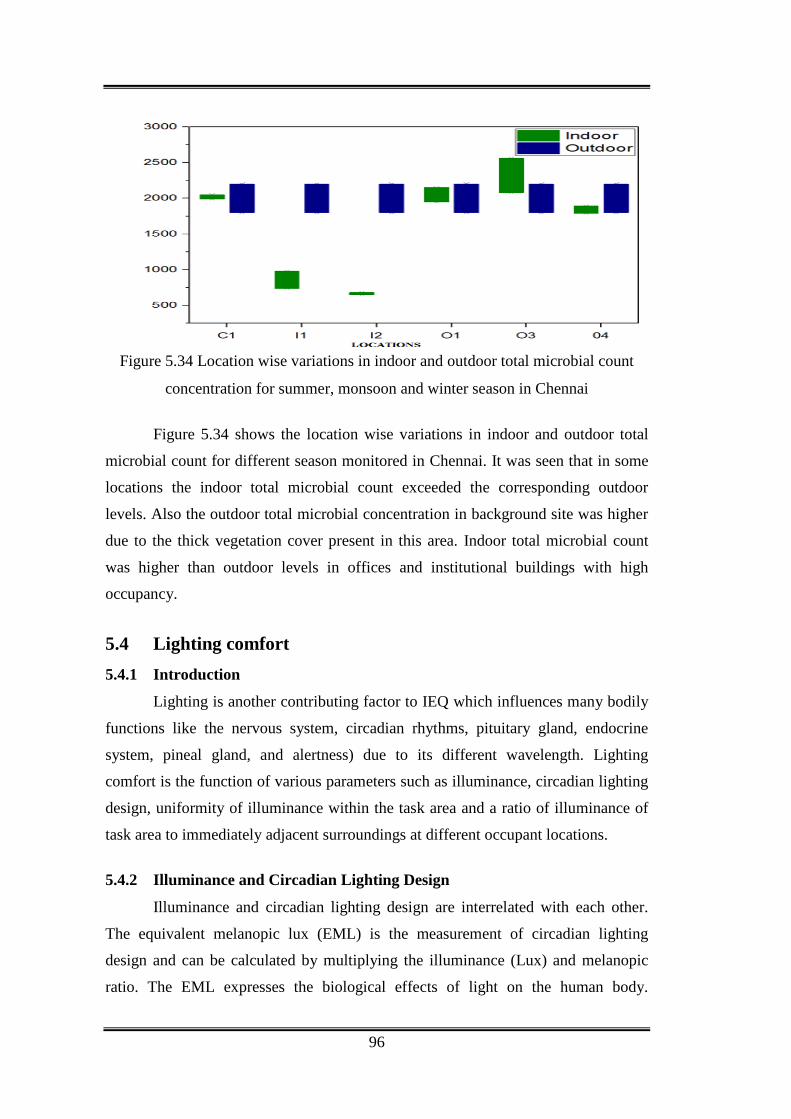
96
Figure 5.34 Location wise variations in indoor and outdoor total microbial count
concentration for summer, monsoon and winter season in Chennai
Figure 5.34 shows the location wise variations in indoor and outdoor total
microbial count for different season monitored in Chennai. It was seen that in some
locations the indoor total microbial count exceeded the corresponding outdoor
levels. Also the outdoor total microbial concentration in background site was higher
due to the thick vegetation cover present in this area. Indoor total microbial count
was higher than outdoor levels in offices and institutional buildings with high
occupancy. 5.4 Lighting comfort 5.4.1 Introduction
Lighting is another contributing factor to IEQ which influences many bodily
functions like the nervous system, circadian rhythms, pituitary gland, endocrine
system, pineal gland, and alertness) due to its different wavelength. Lighting
comfort is the function of various parameters such as illuminance, circadian lighting
design, uniformity of illuminance within the task area and a ratio of illuminance of
task area to immediately adjacent surroundings at different occupant locations.
5.4.2 Illuminance and Circadian Lighting Design
Illuminance and circadian lighting design are interrelated with each other.
The equivalent melanopic lux (EML) is the measurement of circadian lighting
design and can be calculated by multiplying the illuminance (Lux) and melanopic
ratio. The EML expresses the biological effects of light on the human body.

97
Whereas, the melanopic ratio is the function of CCT and light source type. In the
present study, most of the rooms in both buildings are having a fluorescent lamp
(with CCT 6500K) except two rooms (having LED) located in OAB. In the present
study, the mean value of illuminance for summer, monsoon, post-monsoon, winter,
and moderate seasons are found to be 286 Lux, 310 Lux, 335 Lux, 346 Lux and 316
Lux respectively. Further, the mean value of circadian lighting design for summer,
monsoon, post-monsoon, winter, and moderate seasons are found to be 304 EML,
328 EML, 354 EML, 365 EML and 334EML respectively. Also, the monthly
variations of illuminance and circadian lighting design are depicted in Figure 5.35.
(a)
(b)
Figure 5.35 Monthly variations in (a) illuminance and
(b) circadian light design in Jaipur
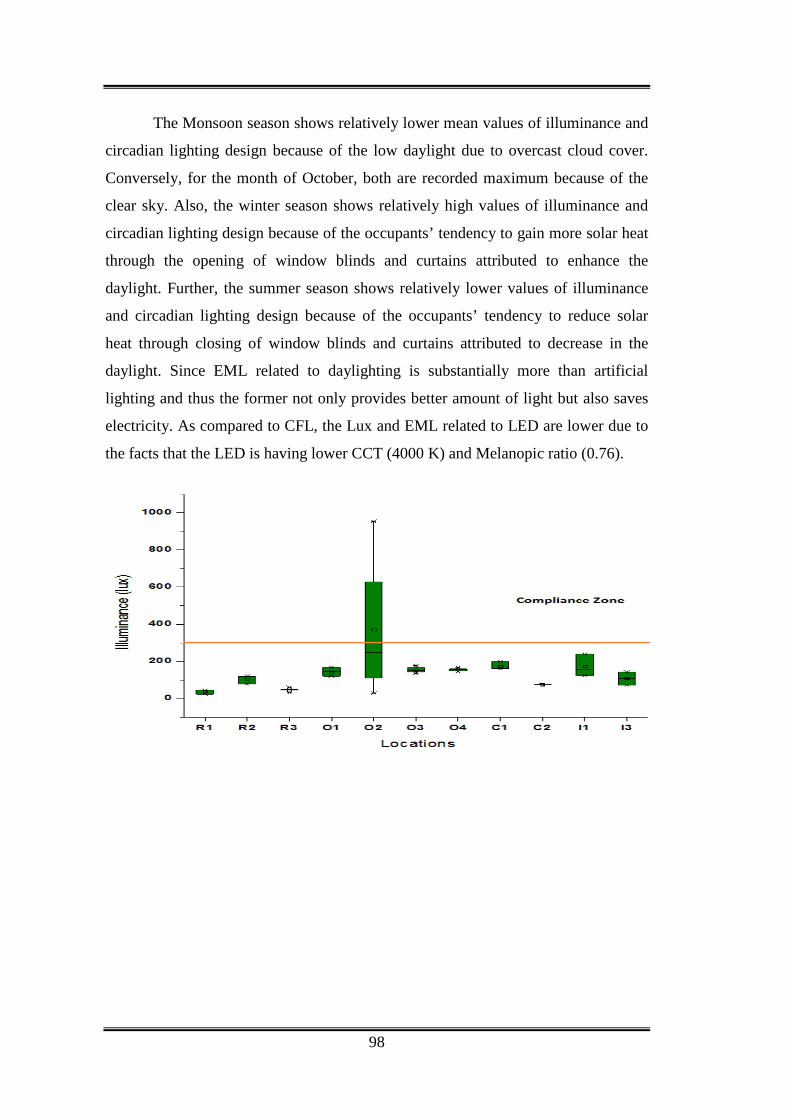
98
The Monsoon season shows relatively lower mean values of illuminance and
circadian lighting design because of the low daylight due to overcast cloud cover.
Conversely, for the month of October, both are recorded maximum because of the
clear sky. Also, the winter season shows relatively high values of illuminance and
circadian lighting design because of the occupants’ tendency to gain more solar heat
through the opening of window blinds and curtains attributed to enhance the
daylight. Further, the summer season shows relatively lower values of illuminance
and circadian lighting design because of the occupants’ tendency to reduce solar
heat through closing of window blinds and curtains attributed to decrease in the
daylight. Since EML related to daylighting is substantially more than artificial
lighting and thus the former not only provides better amount of light but also saves
electricity. As compared to CFL, the Lux and EML related to LED are lower due to
the facts that the LED is having lower CCT (4000 K) and Melanopic ratio (0.76).
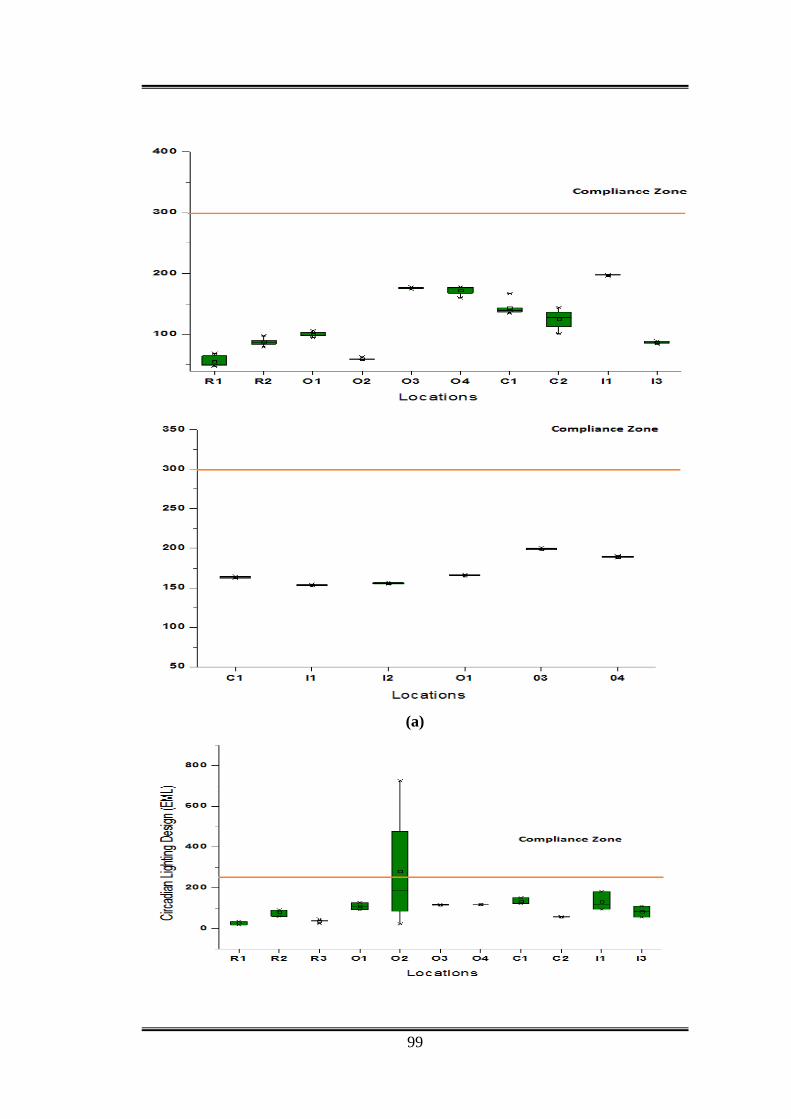
99
(a)
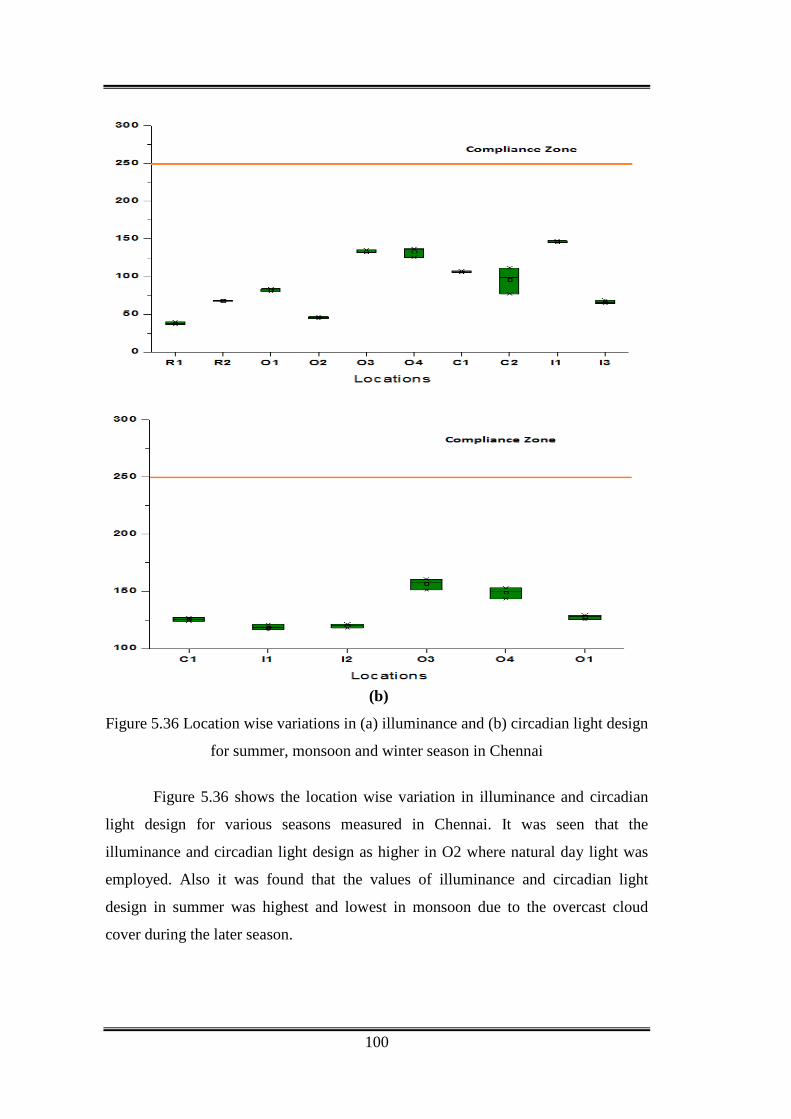
100
(b)
Figure 5.36 Location wise variations in (a) illuminance and (b) circadian light design
for summer, monsoon and winter season in Chennai
Figure 5.36 shows the location wise variation in illuminance and circadian
light design for various seasons measured in Chennai. It was seen that the
illuminance and circadian light design as higher in O2 where natural day light was
employed. Also it was found that the values of illuminance and circadian light
design in summer was highest and lowest in monsoon due to the overcast cloud
cover during the later season.

101
5.4.3 Uniformity and Ratio of Task Area to Adjacent Surroundings
The distribution of light across the task area should be uninformed to attain
the lighting comfort. The ratio of illuminance available in task area to the
illuminance available in immediate adjacent surrounding (an area with a bandwidth
of 0.5 m over the task area) should be within the threshold limits, as specified by
ISHRAE IEQ standard. Also, the monthly variations of same are depicted in graphs
as shown in Figure 5.37.
(a)
(b)
Figure 5.37 Monthly variation in (a) uniformity and (b) ratio of illuminance in Jaipur
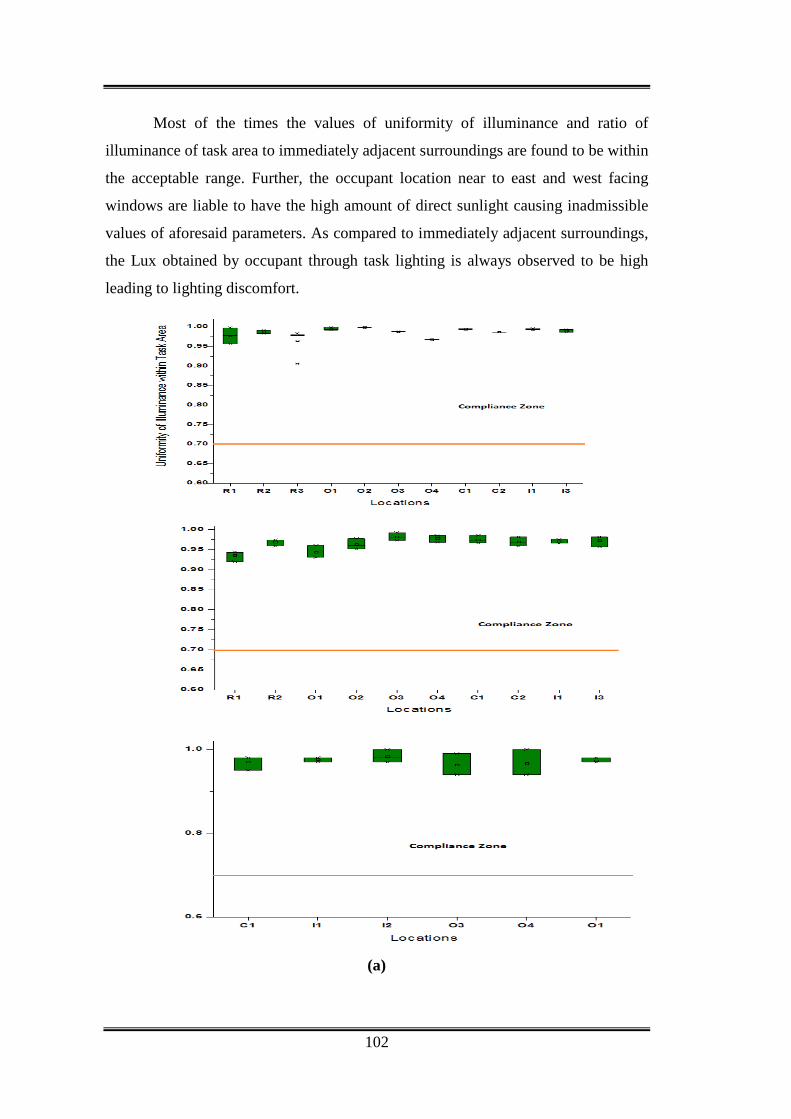
102
Most of the times the values of uniformity of illuminance and ratio of
illuminance of task area to immediately adjacent surroundings are found to be within
the acceptable range. Further, the occupant location near to east and west facing
windows are liable to have the high amount of direct sunlight causing inadmissible
values of aforesaid parameters. As compared to immediately adjacent surroundings,
the Lux obtained by occupant through task lighting is always observed to be high
leading to lighting discomfort.
(a)
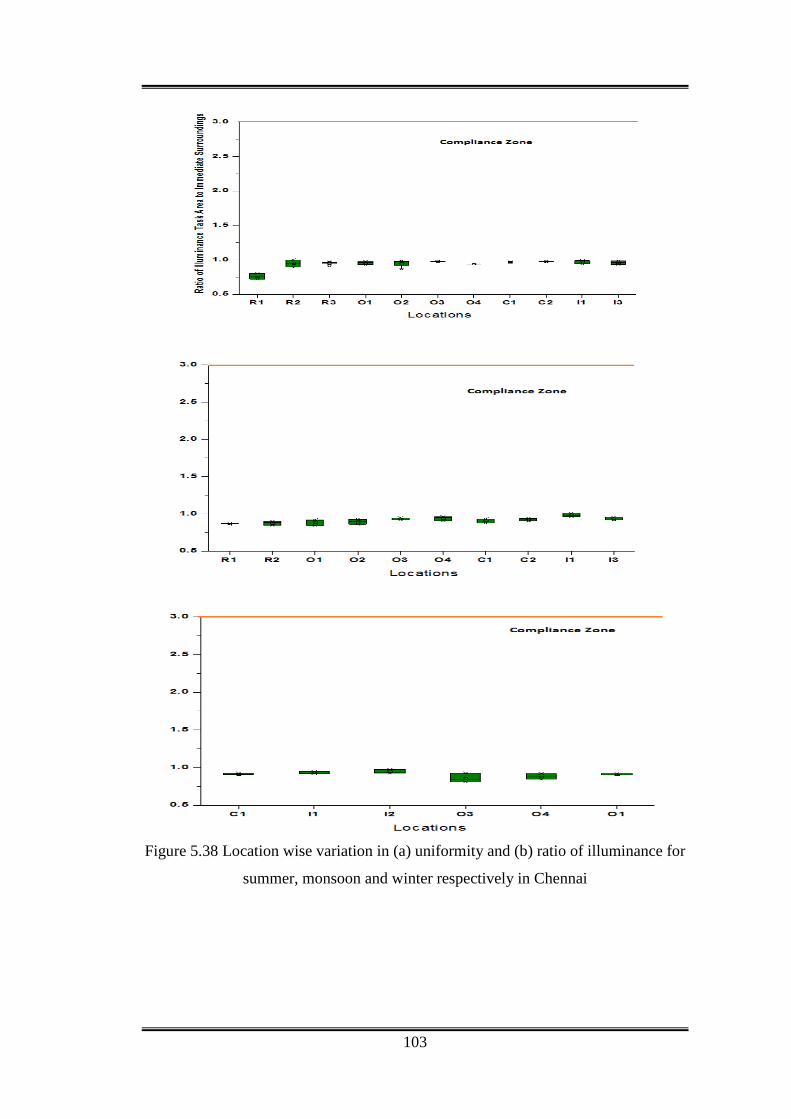
103
Figure 5.38 Location wise variation in (a) uniformity and (b) ratio of illuminance for
summer, monsoon and winter respectively in Chennai

104
Figure 5.38 shows the location wise variation in uniformity of illuminance
and ratio of illuminance for different seasons. It was seen that uniformity of
illuminance and ratio of illuminance of task area to immediately adjacent
surroundings were always within the acceptable range.
5.5 Acoustic Comfort 5.5.1 Overall Sound level
The acoustic discomfort occurs due to unwanted sound which causes stress,
hearing loss, mental discomfort, after sleep patterns and affects heart rate. According
to ISHRAE IEQ, the measurements related to acoustic comfort can be performed in
terms of noise isolation class, reverberation time and noise criteria. In the present
study, the overall sound level (dB) has been measured and analysed based on
ASHRAE 62.1-2013. The monthly variations of overall sound level are shown in
Figure 5.39.
Figure 5.39 Monthly variations in overall sound level in Jaipur
The monthly mean of the overall sound level is reported to be within the limit as specified in ASHRAE 62.1-2013. Thus, the seasonal variations in the value of overall sound level are found insignificant. However, the major factors causing acoustic discomfort are observed due to chanting by the students in the classrooms and air flow sounds in the ducts and evaporative cooling systems. Sound levels in the month of January and May are observed minimum due to closing of classes on account of completion of the odd semester and even semester.
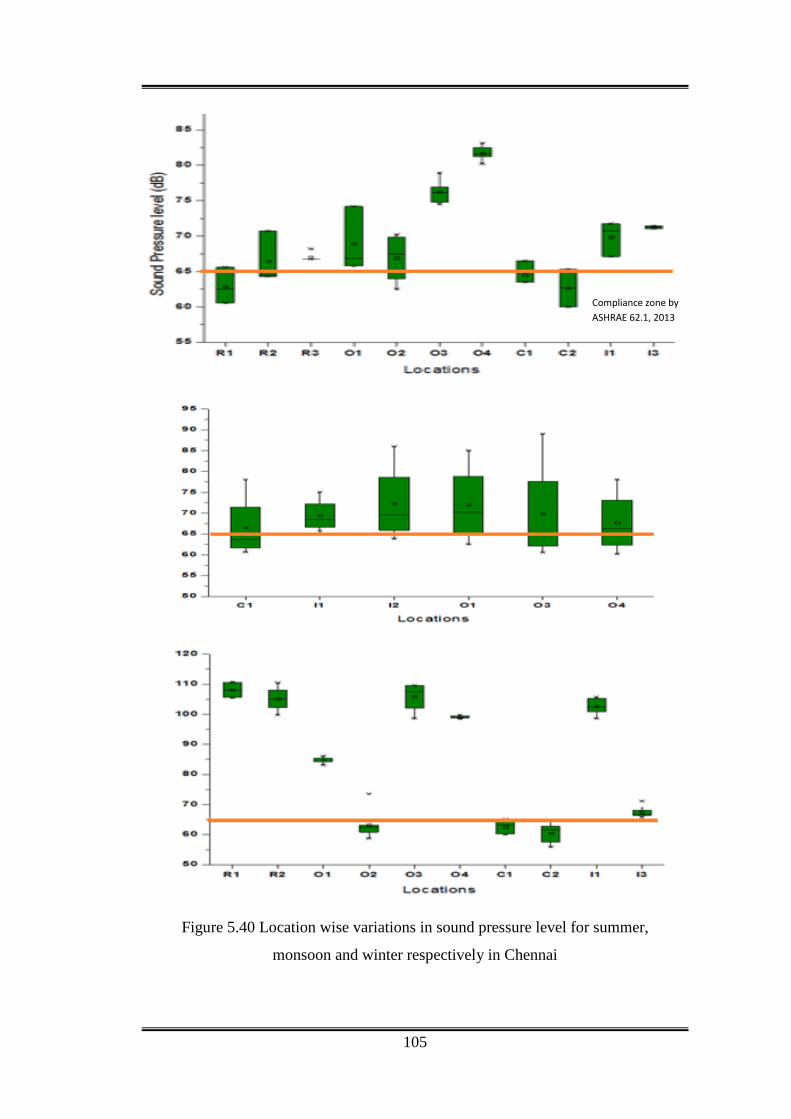
105
Figure 5.40 Location wise variations in sound pressure level for summer,
monsoon and winter respectively in Chennai
Compliance zone by ASHRAE 62.1, 2013
106
Figure 5.40 shows the location wise variations in sound pressure level for
different seasons measured in Chennai. The major factors causing acoustic
discomfort are observed due to chanting by the students in Student office room air
flow sounds in the ducts in office buildings and television sounds in residential
buildings.
5.6 Occupant Satisfaction Survey Subjective method is used to record the responses from occupants using a 7-
point subjective scale for the given environment as specified in the ISHARE IEQ
standard. Questionnaire is designed to record the various effects (sensation, comfort,
preference, annoyance, stiffness and smell) to perform a subjective assessment of
occupant comfort. Qualitative impact of parameters such as room temperature, RH,
air flow, stale air, overall lighting, an external view and daylight availability are
recorded in the questionnaire. The questionnaire is developed in such a way that all
the responses can be recorded with easiness using a 7-point scale. Where it
represents 1 as the worst unsatisfactory response and 7 as the best satisfactory
response. Each parameter is represented in term of % satisfaction, where the
response 1, 2 and 3 as unsatisfactory responses and 4, 5, 6 and 7 as a satisfactory
response. Further, many other parameters such as gender, weight, age, height and
native place representing occupant anonymity are also recorded in the same
questionnaire, as suggested by (Dhaka et al., 2013). Overall IEQ occupant
satisfaction for Buildings OAB, CEEB and the Residential building is found to be 83
%, 80 % and 81 % respectively. Monthly occupant satisfaction in Building OAB and
CEEB are shown in Figure 5.41 and Figure 5.42 respectively.
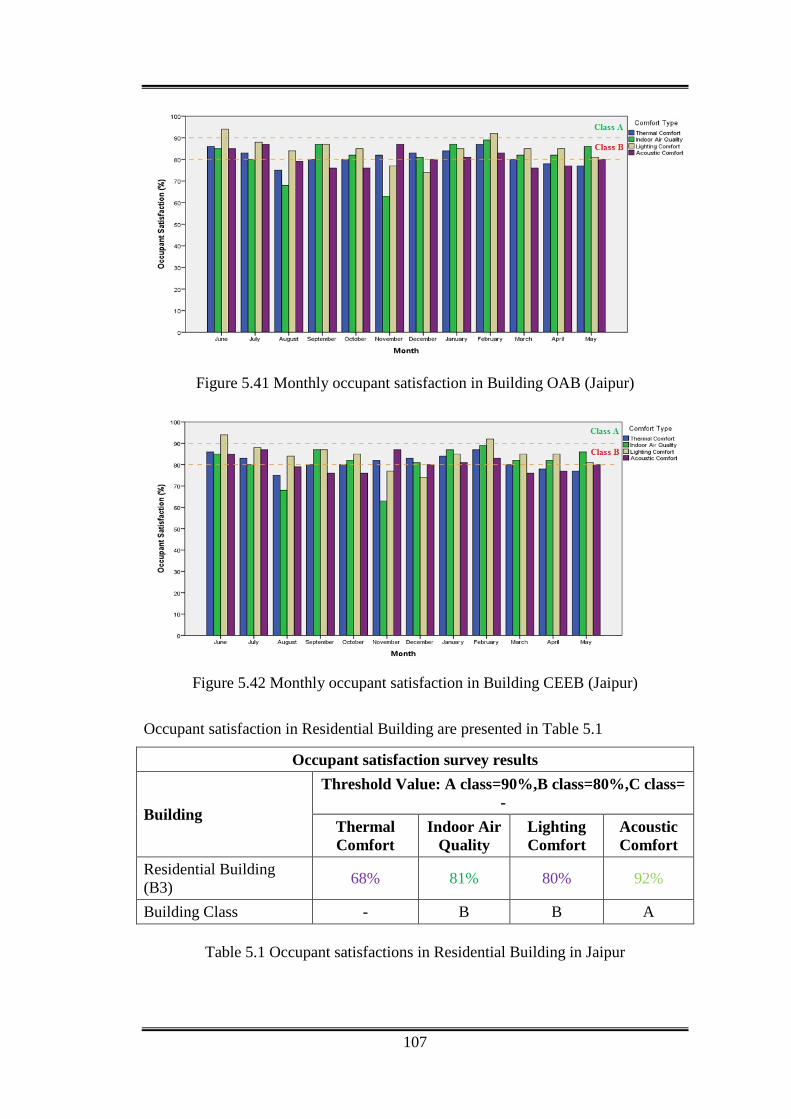
107
Figure 5.41 Monthly occupant satisfaction in Building OAB (Jaipur)
Figure 5.42 Monthly occupant satisfaction in Building CEEB (Jaipur)
Occupant satisfaction in Residential Building are presented in Table 5.1
Occupant satisfaction survey results
Building
Threshold Value: A class=90%,B class=80%,C class= -
Thermal Comfort
Indoor Air Quality
Lighting Comfort
Acoustic Comfort
Residential Building (B3) 68% 81% 80% 92%
Building Class - B B A
Table 5.1 Occupant satisfactions in Residential Building in Jaipur
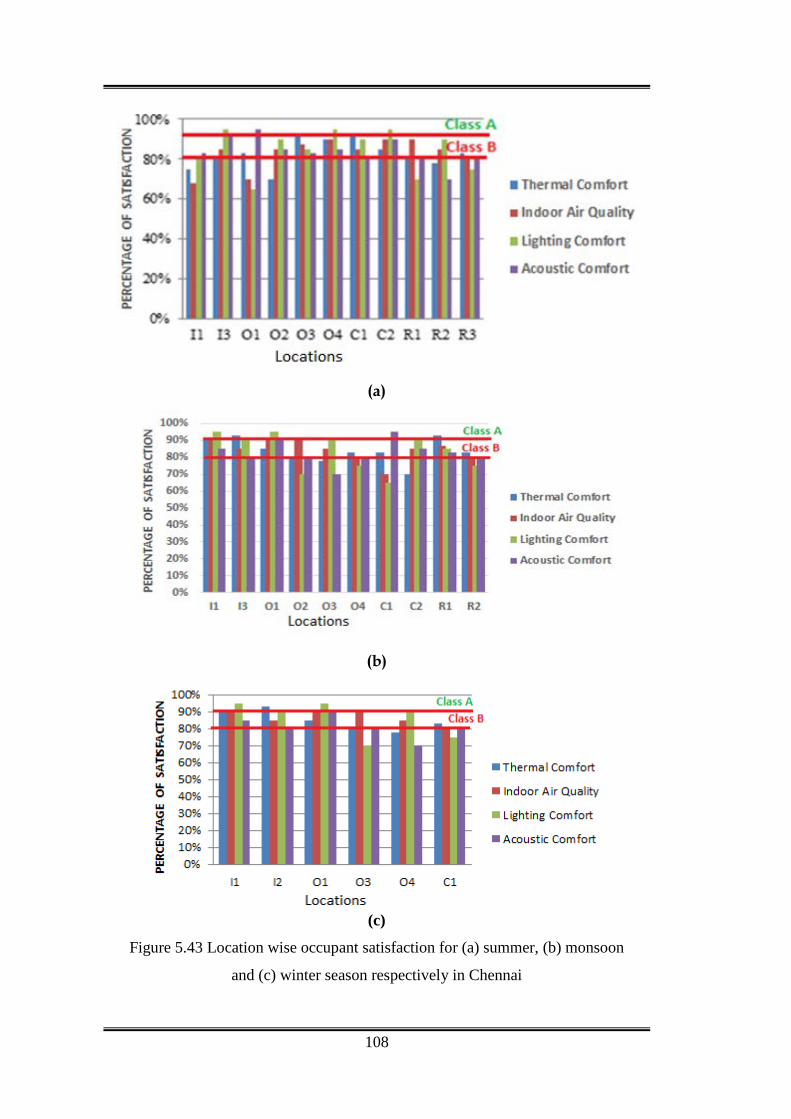
108
(a)
(b)
(c)
Figure 5.43 Location wise occupant satisfaction for (a) summer, (b) monsoon
and (c) winter season respectively in Chennai
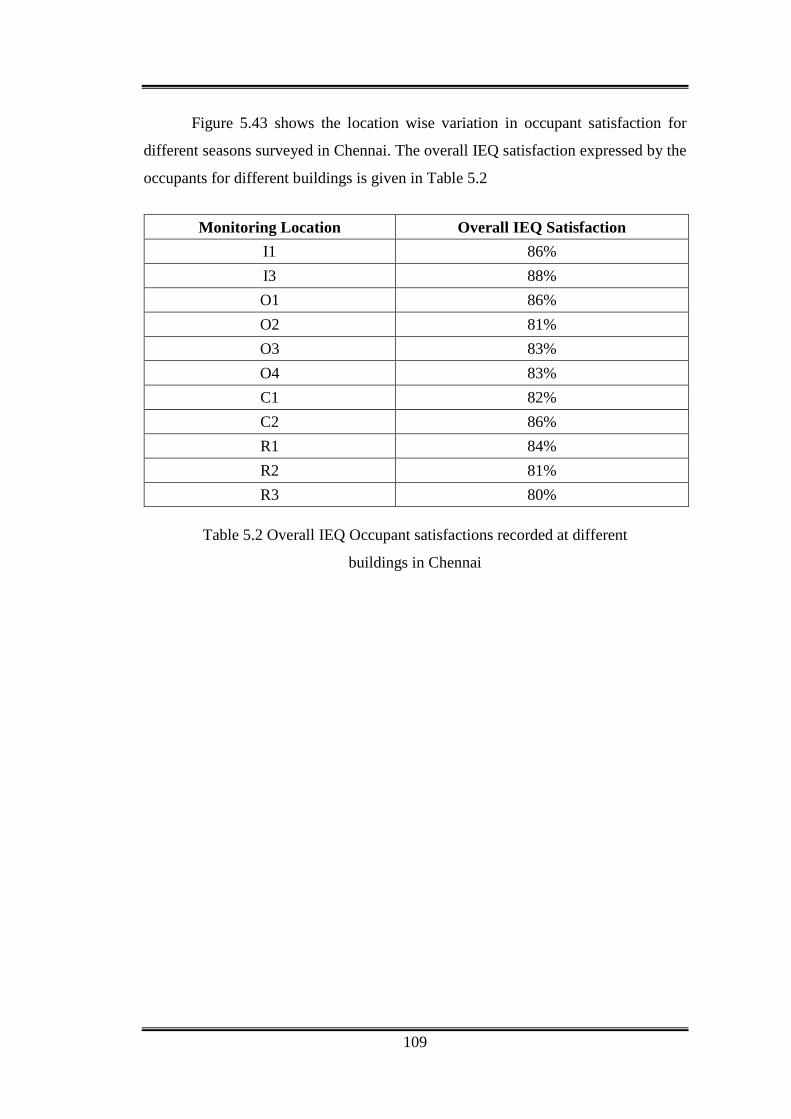
109
Figure 5.43 shows the location wise variation in occupant satisfaction for
different seasons surveyed in Chennai. The overall IEQ satisfaction expressed by the
occupants for different buildings is given in Table 5.2
Monitoring Location Overall IEQ Satisfaction
I1 86% I3 88% O1 86% O2 81% O3 83% O4 83% C1 82% C2 86% R1 84% R2 81% R3 80%
Table 5.2 Overall IEQ Occupant satisfactions recorded at different
buildings in Chennai

110
CHAPTER 6 CONCLUSIONS AND FUTURE SCOPE
6.1 Conclusions 6.1.1 Instrumentation
• Considering the equipment availability and difficulty in finding equipment
matching requirements specified in ISHRAE IEQ.
• As interim finding and recommendation, it is required to revisit the
specifications mentioned in the standard, especially for IAQ parameter.
Where the threshold value of any parameter is much higher as compared to
the least count, the stringency of measurement may be considered especially
for TVOC and CH2O. • Preferred measurement principle for IAQ instruments such as Gravimetric,
Beta Attenuation, Gas Chromatography (GC) and FTIR sensor are not found
in handheld instruments. However, the instruments for IAQ parameters
should be portable and handheld instruments because the measurement
methodology defined in ISHRAE IEQ standard is instantaneous or spot
measurement.
6.1.2 Measurement Protocol
In this study, an investigation of IEQ parameters for two cities having a
variety of building has been carried out under composite and warm-humid climate
conditions and thus the concluding measurement methodology remarks drew are as
follows:
• The study presents the importance of methods required for identification of a
potential occupied location for the assessment of IEQ parameters and
building performance.
• The overall approach for IEQ assessment (i.e. three times a day and once a
month or twice a season at every potential occupant location) throughout a
year is necessary to investigate the building characteristics.
• The methodology specified in the ISHARE IEQ standard, accepted for
thermal comfort assessment in this study is appropriate.
111
• The measurement location specified in the ISHARE IEQ standard for IAQ
parameters is suitable. In this study, the IAQ parameters are measured at
each and every occupant location which is inappropriate because the
standard deviation of IAQ parameters’ values found within every room is
observed to be low. Thus, the protocol for IAQ parameters measurement
locations “All parameters should be measured at least one location in a room
preferably as specified in Annexure B.1 in ISHARE IEQ standard” is correct.
• The measurement locations for SO2, NO2, and O3 defined by ISHARE IEQ
standard and same have been used in the present study is convenient.
Further, SO2, NO2 and O3 concentrations found at air intake are higher than
indoor. Thus, the SO2, NO2 and O3 concentrations measurement locations
should be measured at least one location in a room preferably as specified in
Annexure B.1 in ISHARE IEQ standard.
• Indoor and air intake comparison are necessary to find the source of
contaminate.
• CO2 concentrations should also be measured at ambient because of threshold
values specified in ISHRAE IEQ standard as ‘ambient + 350”.
• The total microbial count should althe so be measured for both indoors and
outdoors because of threshold values specified in ISHRAE IEQ standard is
<ambient concentration.
• As lighting is the local phenomena and thus the parameters of lighting
comfort are measured at occupant locations only. The methodology specified
in the present study for lighting comfort assessment is appropriate.
• The occupant satisfaction survey along with physical parameter
measurement is the most effective way for IEQ assessment
• The questionnaire specified in ISHRAE IEQ standard has required some
revision such as thermal comfort questions should be for present instant
instead of a specific season, questions for local discomfort, present activity
and clothing should be added.
112
6.1.3 IEQ Assessment
• Most of the IEQ parameters are found to be meeting the minimum threshold
limits for buildings in both climate zone.
• The acceptable range of comfort operative temperature can be increased at
elevated air velocity. This method is relatively lower energy consumption to
achieve the thermal comfort.
• The concentration of CO2 obtained is falling in class A category, because of
the high natural vegetation around the buildings which reduces the
concentration of fresh air CO.
• In Jaipur, the concentration of respirable suspended particulate matter is
found to be higher for the months from October to January. The
concentrations of PM 2.5 for monsoon and summer season is within the
acceptable range.
• Whereas in Chennai the indoor PM concentration was within the limits
except when a strong indoor source is present. Also, the PM concentration
was high in winter and lowest in monsoon.
• SO2, NO2, O3, and CO concentrations are observed in a within the threshold
range for both climatic regions. SO2, NO2 and CO concentrations found to be
higher at air intake/ outdoor as compared to indoor levels because vehicles
emissions are the major source. O3 concentration is observed higher at air
intake as compare indoor because of higher sunlight.
• The total microbial count in some locations were higher than the
corresponding outdoor levels due to higher occupancy at these locations.
Higher occupancy, inadequate ventilation and lack of maintenance activities
in buildings can cause high total microbial concentration.
• The majority of lighting comfort parameters is found to be within the
minimum threshold range.
• The LED light source consumes less energy as compare to other artificial
light source but, the Lux and EML are found to be lower which causes the
lighting discomfort and disturb the productivity as well as wellbeing of
occupant.
113
• The occupant satisfaction survey along with physical parameter
measurement is the most effective way for IEQ assessment. The occupant
satisfaction level of more than 80% is calculated for all IEQ elements and for
all buildings in both climatic zones.
6.2 Future Scope The study investigation of IEQ parameters for two cities having a variety of
building has been carried out under composite and warm-humid climate conditions.
Further, the same investigation also is carried out at another climatic zone.
Moreover, buildings other than university campus also be investigated throughout a
year.
Parameters such as radiant temperature asymmetry and total microbial count
are required to be investigated. Acoustic comfort parameters such as noise criteria,
sound isolation class and reverberation time also are investigate to ensure the
measurement methodology.
Erratum and addendum purposed in this study to be discussed and essential
to add in the next version of ISHRAE IEQ standard. Further, based on the learning,
improvements have to be made to increase the efficacy of the standard.
The reporting format and overall building evolution and rating using this
standard need clarification and future work.

114
REFERENCES Ahn, H., Rim, D. and Lo L. J. (2017), ‘Ventilation and energy performance of
partitioned indoor spaces under mixing and displacement ventilation’,
Building Simulation, Vol. 11, pp. 561–574.
Al-Hemoud, A., Al-Awadi, L., Al-Rashidi, M., Abdul Rahman, K., Al-Khayat, A.
and Behbehani, W. (2017), ‘Comparison of indoor air quality in schools:
Urban vs. Industrial 'oil & gas' zones in Kuwait’, Building and Environment,
Vol. 122, pp. 50-60.
Aries, M. B. C., Aarts, M. P. J., and van Hoof J. (2015), ‘Daylight and health: A
review of the evidence and consequences for the built environment’, Lighting
Res. Technol, Vol. 47, pp. 6–27
ASHRAE (2013). ASHRAE Standard 55-2013. Thermal environment conditions for
human occupancy.
ASHRAE (2013). ASHRAE Standard 62.1-2013. Ventilation for acceptable indoor
air quality.
ASHRAE (2013). ASHRAE Standard 62.2-2013. Ventilation and acceptable indoor
air quality in low rise residential building.
Begemann, S. H. A., van den Beld, G.J. and Tenner, A.D. (1997), ‘Daylight,
artificial light and people in an office environment, overview of visual and
biological responses’, International Journal of Industrial Ergonomics, Vol.
20, pp. 231-239.
British Standard (2014), BS 8233:2014, Sound Insulation and Noise Reduction for
Buildings
CIBSE (2012), The SLL Code for Lighting
Cheng, L., Li, B., Cheng, O., Baldwin, A.N., Shang Y. (2017), ‘Investigations of
indoor air quality of large department store buildings in China based on field
measurements’, Building and Environment, Vol. 118, pp. 128-143.
Chithra, V. S. and Shiva Nagendra S. M. (2012), ‘Indoor air quality investigations in
a naturally ventilated school building located close to an urban roadway in
Chennai, India’. Building and Environment, Vol. 54, pp. 159-167.
115
Dhaka, S., Mathur, J., Wagner, A., Brager, G. and Honnekeri A. (2013),
‘Assessment of thermal environmental conditions and quantification of
thermal adaptation in naturally ventilated buildings in composite climate of
India’, Building and Environment, Vol. 86, pp. 17-28.
Dhaka, S., Mathur, J., Wagner, A., Agarwal, G. D. and Garg V. (2013), ‘Evaluation
of thermal environmental conditions and thermal perception at naturally
ventilated hostels of undergraduate students in composite climate’, Building
and Environment, Vol. 66, pp. 42-53.
Djongyang, N., Tchinda, R. and Njomo, D. (2010), ‘Thermal comfort: a review
paper’, Renewable and Sustainable Energy Reviews, Vol. 14, pp. 2626–
2640.
European Standard (2011), EN 12464-1, Light and lighting - Lighting of work
places - Part 1: Indoor work places.
European Standard (2007), CEN EN-15251, Indoor Environemntal Input Parameters
for Design and Assessment of Energy Performance of Buildings Adressing
Indoor Air Quality, Thermal Environment, Lighting and Acoustics
Fabbri, K. and Tronchin L. (2015), ‘Indoor environmental quality in low energy
buildings’, Energy Procedia, Vol. 78, pp. 2778 – 2783.
Frontczak, M. and Wargocki, P. (2011), ‘Literature survey on how different factors
influence human comfort in indoor environments’, Building and
Environment, Vol. 49, pp. 922-937.
Huang, L., Zhu, Y., Ouyang, Q. and Cao B. (2012), ‘A study on the effects of
thermal, luminous, and acoustic environments on indoor environmental
comfort in offices’, Building and Environment, Vol. 49, pp. 304 - 309.
INDALUX (2002), Lighting hand book for Lighting Engineering
International Standard (2014), ISO 16283-1:2014(E), Acoustics — Field
measurement of sound insulation in buildings and of building elements —
Part 1: Airborne sound insulation
International Standard (2009), ISO 3382-1:2009(E), Acoustics — Measurement of
room acoustic parameters — Part 1: Performance spaces
Irshad, K., Habib, K., Kareem, M.W., Basrawi, F. and Saha, B. B. (2017),
‘Evaluation of thermal comfort in a test room equipped with a photovoltaic

116
assisted thermoelectric air duct cooling system’, International Journal of
Hydrogen Energy, pp. 1-17.
ISHRAE. (2015). ISHRAE position paper on indoor environmental quality.
ISHRAE. (2016). ISHRAE Standard 100001-2016.Indoor environmental quality
standard.
Jensen, K. L., Arens, E. and Zagreus, L. (2005) ‘Acoustical quality in office
workstations, as assessed by occupant surveys’, Indoor Air: 10th
International Conference on Indoor Air Quality and Climate, Beijing, pp.
2401–2405.
Kontes, G. D., Giannakis, G. I., Horn, P., Steiger S. and Rovas D. V. (2017), ‘Using
Thermostats for Indoor Climate Control in Office Buildings: The Effect on
Thermal Comfort’, Energies, Vol. 10, pp. 1368-1390.
Kulshreshtha P. and Khare, M. (2010),’ A comparative study of indoor air pollution
and its respiratory impacts in Delhi, India’, WIT Transactions on Ecology
and the Environment, Vol. 136, pp. 287 – 296.
Kumar, S., Singh, M. K., Loftness, V., Mathur, J. and Mathur, S. (2016), ‘Thermal
comfort assessment and characteristics of occupant's behavior in naturally
ventilated buildings in composite climate of India’, Energy for Sustainable
Development, Vol. 33, pp. 108–121.
Kumar, S., Mathur, J., Mathur, S., Singh, M. K. and Loftness, V. (2016), ‘An
adaptive approach to define thermal comfort zones on psychrometric chart
for naturally ventilated buildings in composite climate of India’, Building
and Environment, Vol. 109, pp. 135-153.
Lai, A.C.K., Mui, K.W., Wongb, L.T. and Law L.Y. (2009), ‘An evaluation model
for indoor environmental quality (IEQ) acceptance in residential buildings’,
Energy and Building, Vol. 49, pp. 930 - 936.
Lee, Y. S. and Guerin D. A. (2010), ‘Indoor environmental quality differences
between office types in LEED-certified buildings in the US’, Building and
Environment, Vol. 45, pp. 1104 - 1112.
Mishra, A.K., Derks, M.T.H., Kooi, L., Loomans, M.G.L.C. and Kort H.S.M.
(2017), ‘Analysing thermal comfort perception of students through the class
117
hour, during heating season, in a university classroom’, Building and
Environment, Vol. 125, 464-474.
Nasrollahi, N., Knight, I. and Jones, P. (2007), ‘Occupant Indoor Environmental
Quality (IEQ): Results of a survey in office buildings in Iran’, 2nd PALENC
Conference and 28th AIVC Conference on Building Low Energy Cooling
and Advanced Ventilation Technologies in the 21st Century, Crete island,
Greece, pp.668-691.
NBC (2016) Part 8 Building Service – Section 4 Acoustics, Sound Insulation and
Noise Control
NBC (2016) Part 8 Building Service – Section 1 Lighting and Natural Ventilation
Sakhare, V.V. and Ralegaonkar, R.V. (2014), ‘Indoor environmental quality: review
of parameters and assessment models’, Architectural Science Review, Vol.
57 (Pt. 2), pp. 147–154.
Serghides, D.K., Chatzinikola, C.K. and Katafygiotou, M.C. (2015), ‘Comparative
studies of the occupants' behaviour in a university building during winter and
summer time’, International Journal of Sustainable Energy, Vol. 34, pp. 528–
551.
Sheng, Y., Fang, L. and Nie, J. (2017), ‘Experimental analysis of indoor air quality
improvement achieved by using a Clean-Air Heat Pump (CAHP) air-cleaner
in a ventilation system’, Building and Environment, Vol. 122, pp.343-353.
Vilčeková, S., Kapalo, P., Mečiarová, L., Burdová, E.K. and Imreczeová, V. (2017),
’Investigation of Indoor Environment Quality in Classroom – Case Study’,
Energy Procedia, Vol. 190, pp. 496 - 503.
Wong, L.T., Mui, K.W. and Hui P.S. (2008), ‘A multivariate-logistic model for
acceptance of indoor environmental quality (IEQ) in offices’, Building and
Environment, Vol. 43, pp. 1–6.
Zuhaib, S., Manton, R., Griffin, C., Hajdukiewicz, M., Keane, M. M. and Goggins,
J. (2018), ‘An Indoor Environmental Quality (IEQ) assessment of a partially-
retrofitted university building’, Building and Environment, Vol. 139, pp. 69-
85.
Zumtobel lighting GmbH (2017), The lighting handbook
118
A.C. K Lai, K.W.Mui, L.T.Wong, L.Y.Law (2009), ‘A evaluation model for indoor
Environmental quality (IEQ) acceptance in residential building’.
A. R. M. Nasir, A. R. Musa, A. I. Che-Ani, N. Utaberta, N. A. G. Abdullah, N. M.
Tawil (2011), ‘Identification of Indoor Environmental Quality (IEQ)
Parameter in Creating Conducive Learning Environment for Architecture
Studio’.
Tiberiu Catalina, Vlad lordache (2011), ‘IEQ assessments on schools in design
stage’.
Li Haung, Yingxin Zhu, Qin Quyang (2011), ‘Bin Cao, A study on the effects of
thermal, luminous, and acoustic environments in indoor environmental
comforts in offices’.
David Heinzerling, Stefano Schavion, Tom Webster, Ed Arens (2013), ‘Indoor
Environment assessment models: A literature review and a proposed
weighting and classification scheme’.
Yousef Al Horr, Mohammed Arif, Marta katafygiotou, Ahmed Mazroei, Amit
Kaushik, Esam Elsarrag (2016), ‘Impact of indoor environmental quality on
occupant wellbeing and comfort: A review of literature’.
Yang Geng, Wenjie ji, Borong Lin, YingXin Zhu (2017), ‘The impact of thermal
environment on occupant IEQ Perception and productivity’.
Danny H.W. Li, Joseph C. Lam (1999), ‘Measurements of solar radiation and
illuminance on vertical surfaces and day lighting implications’.
Sui-kei wong, Lawrence Wai-Chung lai, Daniel Chi-wing Ho, Kwong-Wing Chu,
Cindy Lo-Kuen lam, Cris Hung-fai Ng (2009), ‘Sick Building Syndrome and
perceived indoor environmental quality: A survey of apartment buildings in
Hong Kong’.
Monika Frontczak, Pawel wargocki (2011), ‘Literature survey on how different
factors influence human comfort in indoor environments’.
Richard J. de Deara, Gail S. Bragerb (2002), ‘Thermal comfort in naturally
ventilated buildings: revisions to ASHRAE Standard 55’.

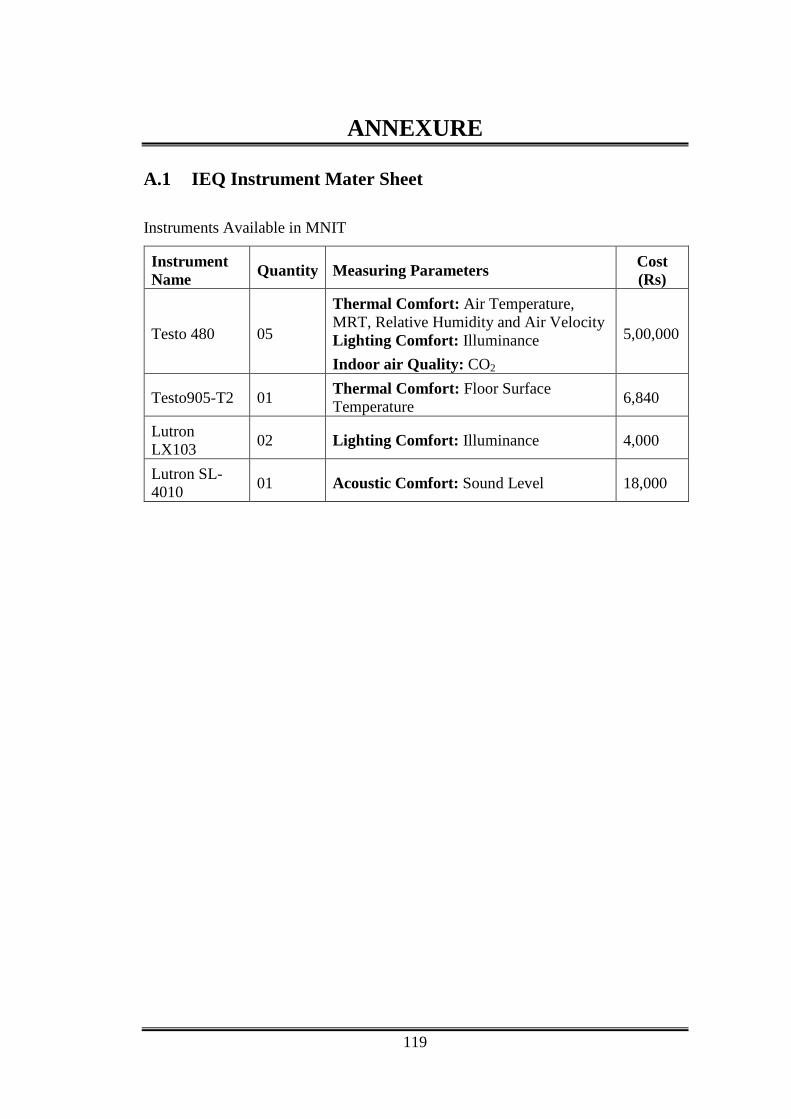
119
ANNEXURE A.1 IEQ Instrument Mater Sheet Instruments Available in MNIT
Instrument Name Quantity Measuring Parameters Cost
(Rs)
Testo 480 05
Thermal Comfort: Air Temperature, MRT, Relative Humidity and Air Velocity Lighting Comfort: Illuminance Indoor air Quality: CO2
5,00,000
Testo905-T2 01 Thermal Comfort: Floor Surface Temperature 6,840
Lutron LX103 02 Lighting Comfort: Illuminance 4,000
Lutron SL-4010 01 Acoustic Comfort: Sound Level 18,000
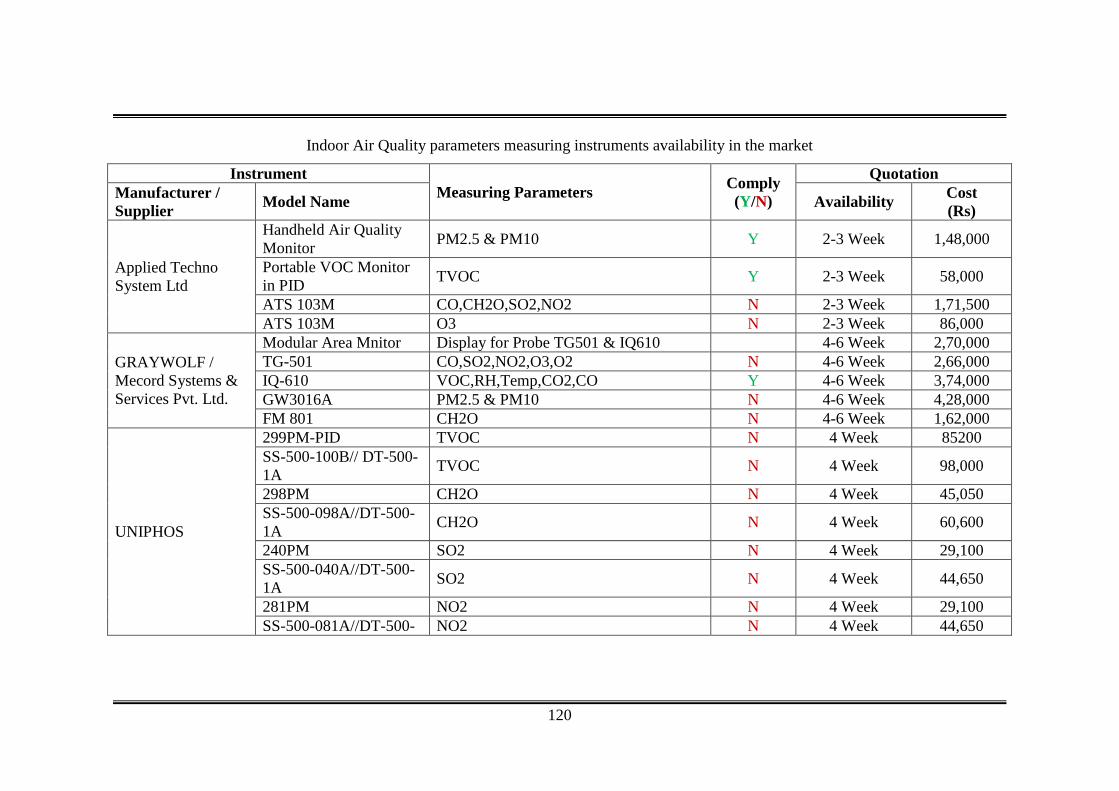
120
Indoor Air Quality parameters measuring instruments availability in the market
Instrument Measuring Parameters Comply
(Y/N)
Quotation Manufacturer / Supplier Model Name Availability Cost
(Rs)
Applied Techno System Ltd
Handheld Air Quality Monitor PM2.5 & PM10 Y 2-3 Week 1,48,000
Portable VOC Monitor in PID TVOC Y 2-3 Week 58,000
ATS 103M CO,CH2O,SO2,NO2 N 2-3 Week 1,71,500 ATS 103M O3 N 2-3 Week 86,000
GRAYWOLF / Mecord Systems & Services Pvt. Ltd.
Modular Area Mnitor Display for Probe TG501 & IQ610 4-6 Week 2,70,000 TG-501 CO,SO2,NO2,O3,O2 N 4-6 Week 2,66,000 IQ-610 VOC,RH,Temp,CO2,CO Y 4-6 Week 3,74,000 GW3016A PM2.5 & PM10 N 4-6 Week 4,28,000 FM 801 CH2O N 4-6 Week 1,62,000
UNIPHOS
299PM-PID TVOC N 4 Week 85200 SS-500-100B// DT-500-1A TVOC N 4 Week 98,000
298PM CH2O N 4 Week 45,050 SS-500-098A//DT-500-1A CH2O N 4 Week 60,600
240PM SO2 N 4 Week 29,100 SS-500-040A//DT-500-1A SO2 N 4 Week 44,650
281PM NO2 N 4 Week 29,100 SS-500-081A//DT-500- NO2 N 4 Week 44,650

121
Instrument Measuring Parameters Comply
(Y/N)
Quotation Manufacturer / Supplier Model Name Availability Cost
(Rs) 1A SS-500-015A//DT-500-1A O3 N 4 Week 57,500
BRMC
BR-HOL-1210 PM2.5,PM10,CHOH,RH,Temp N 6-8 Weeks 61,213 BR-AIR-329 PM2.5,TVOC,Temp N 6-8 Weeks 12,374 BR-AIR-300 (PM2.5,CHOH,Temp) N 6-8 Weeks 11,374 BR-SMART-126 PM2.5,PM10,CHOH,TVOC N 6-8 Weeks 64,757
Xi'an Yima Opto-electrical Technology Co., Ltd.
1080-A professional PM2.5,PM10,CHOH,SO2,NO2,O3 N 8 Weeks 37,28,675
ION Science / Swan Scientific LLP New Delhi
TIGER TVOC 6-8 Weeks 475000
PPM Technology Ltd. / SWAN Environmental Pvt. Ltd.
Formaldemeter™ htV-M CH2O N 4 weeks 2,52,000
Kilter Ozone Analyzer O3 Meter KT-2006 O3 N 5 weeks 78634
2B technology/ Entrol Systems Corporation
Personal Ozone Monitor™ (POM™) O3 Y 8 to 10 weeks 3,48,800
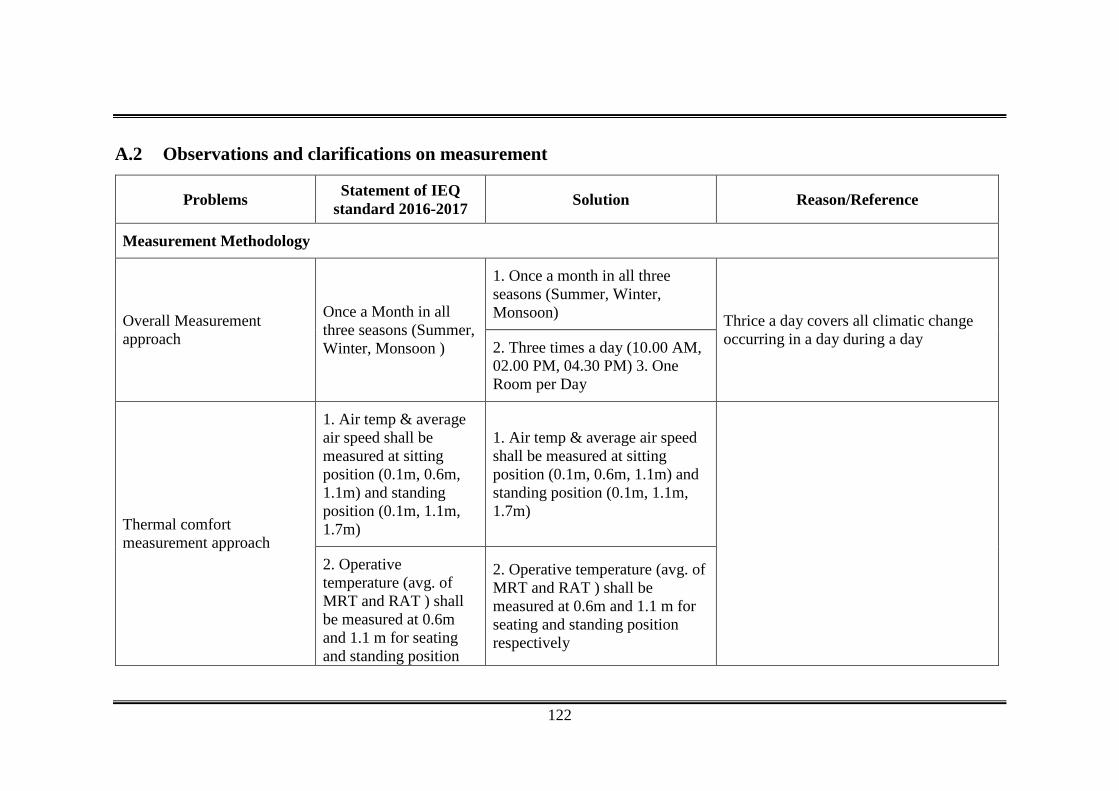
122
A.2 Observations and clarifications on measurement
Problems Statement of IEQ standard 2016-2017 Solution Reason/Reference
Measurement Methodology
Overall Measurement approach
Once a Month in all three seasons (Summer, Winter, Monsoon )
1. Once a month in all three seasons (Summer, Winter, Monsoon) Thrice a day covers all climatic change
occurring in a day during a day 2. Three times a day (10.00 AM, 02.00 PM, 04.30 PM) 3. One Room per Day
Thermal comfort measurement approach
1. Air temp & average air speed shall be measured at sitting position (0.1m, 0.6m, 1.1m) and standing position (0.1m, 1.1m, 1.7m)
1. Air temp & average air speed shall be measured at sitting position (0.1m, 0.6m, 1.1m) and standing position (0.1m, 1.1m, 1.7m)
2. Operative temperature (avg. of MRT and RAT ) shall be measured at 0.6m and 1.1 m for seating and standing position
2. Operative temperature (avg. of MRT and RAT ) shall be measured at 0.6m and 1.1 m for seating and standing position respectively
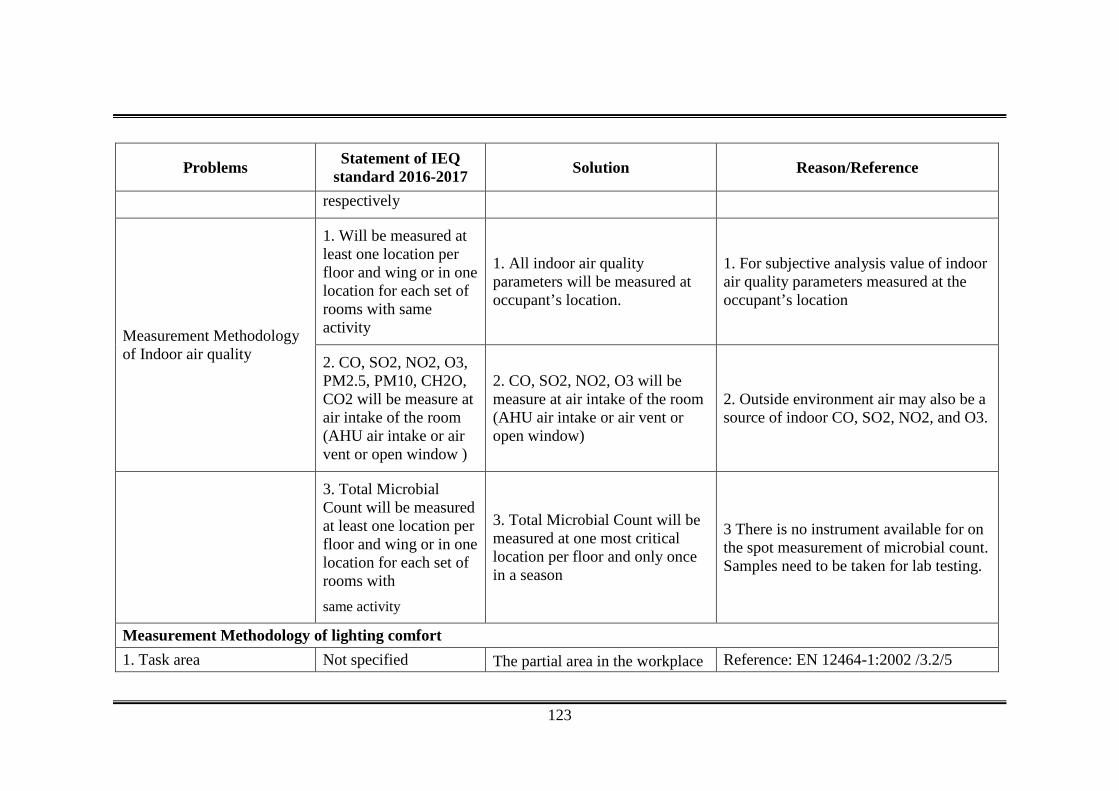
123
Problems Statement of IEQ standard 2016-2017 Solution Reason/Reference
respectively
Measurement Methodology of Indoor air quality
1. Will be measured at least one location per floor and wing or in one location for each set of rooms with same activity
1. All indoor air quality parameters will be measured at occupant’s location.
1. For subjective analysis value of indoor air quality parameters measured at the occupant’s location
2. CO, SO2, NO2, O3, PM2.5, PM10, CH2O, CO2 will be measure at air intake of the room (AHU air intake or air vent or open window )
2. CO, SO2, NO2, O3 will be measure at air intake of the room (AHU air intake or air vent or open window)
2. Outside environment air may also be a source of indoor CO, SO2, NO2, and O3.
3. Total Microbial Count will be measured at least one location per floor and wing or in one location for each set of rooms with same activity
3. Total Microbial Count will be measured at one most critical location per floor and only once in a season
3 There is no instrument available for on the spot measurement of microbial count. Samples need to be taken for lab testing.
Measurement Methodology of lighting comfort 1. Task area Not specified The partial area in the workplace Reference: EN 12464-1:2002 /3.2/5
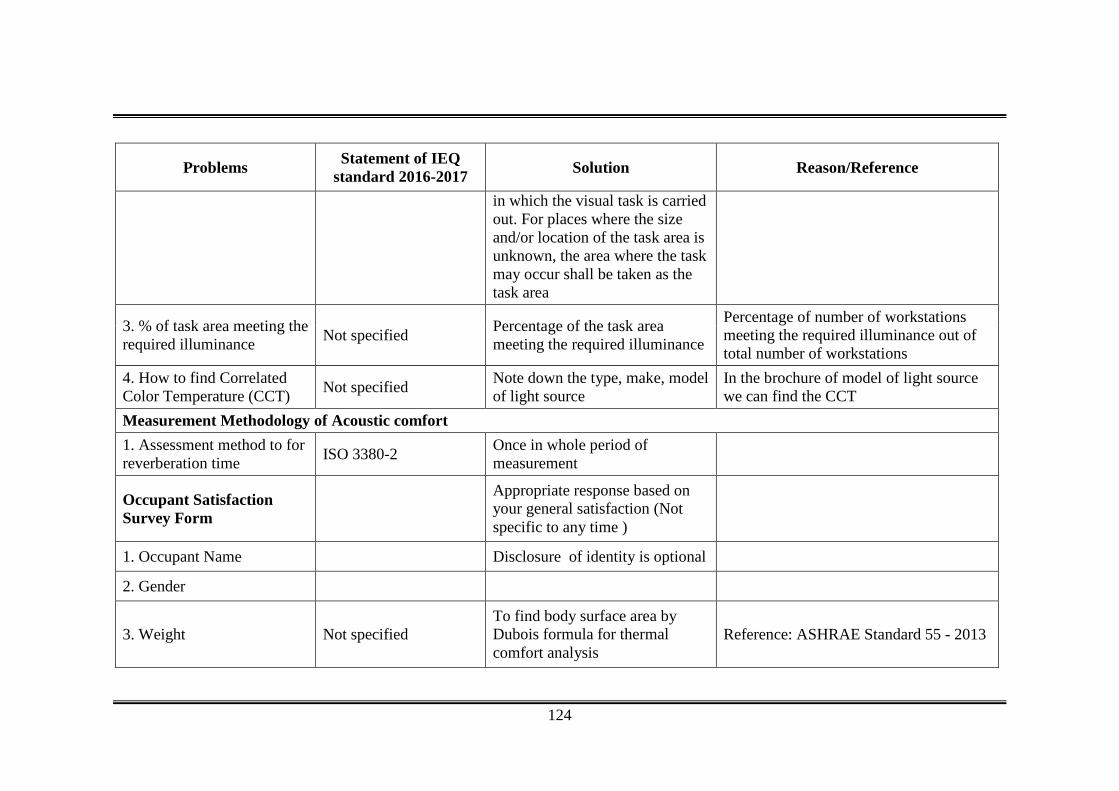
124
Problems Statement of IEQ standard 2016-2017 Solution Reason/Reference
in which the visual task is carried out. For places where the size and/or location of the task area is unknown, the area where the task may occur shall be taken as the task area
3. % of task area meeting the required illuminance Not specified Percentage of the task area
meeting the required illuminance
Percentage of number of workstations meeting the required illuminance out of total number of workstations
4. How to find Correlated Color Temperature (CCT) Not specified Note down the type, make, model
of light source In the brochure of model of light source we can find the CCT
Measurement Methodology of Acoustic comfort 1. Assessment method to for reverberation time ISO 3380-2 Once in whole period of
measurement
Occupant Satisfaction Survey Form
Appropriate response based on your general satisfaction (Not specific to any time )
1. Occupant Name Disclosure of identity is optional
2. Gender
3. Weight Not specified To find body surface area by Dubois formula for thermal comfort analysis
Reference: ASHRAE Standard 55 - 2013
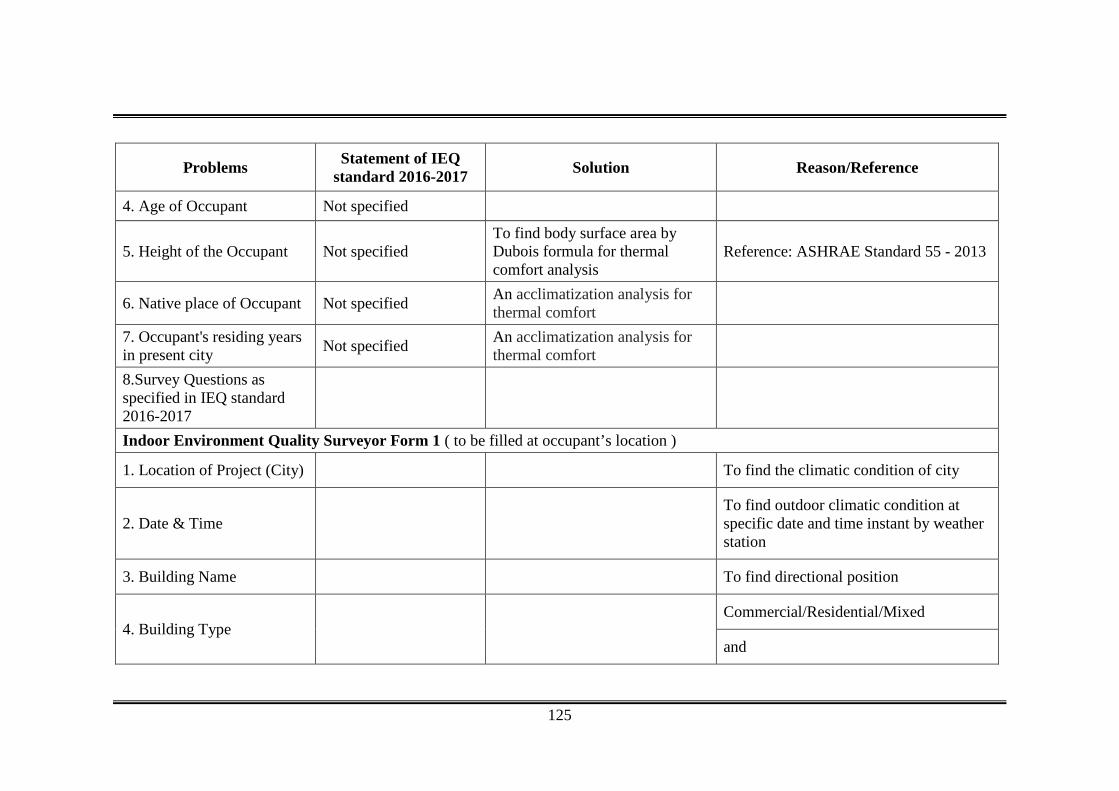
125
Problems Statement of IEQ standard 2016-2017 Solution Reason/Reference
4. Age of Occupant Not specified
5. Height of the Occupant Not specified To find body surface area by Dubois formula for thermal comfort analysis
Reference: ASHRAE Standard 55 - 2013
6. Native place of Occupant Not specified An acclimatization analysis for thermal comfort
7. Occupant's residing years in present city Not specified An acclimatization analysis for
thermal comfort
8.Survey Questions as specified in IEQ standard 2016-2017
Indoor Environment Quality Surveyor Form 1 ( to be filled at occupant’s location )
1. Location of Project (City) To find the climatic condition of city
2. Date & Time To find outdoor climatic condition at specific date and time instant by weather station
3. Building Name To find directional position
4. Building Type Commercial/Residential/Mixed
and
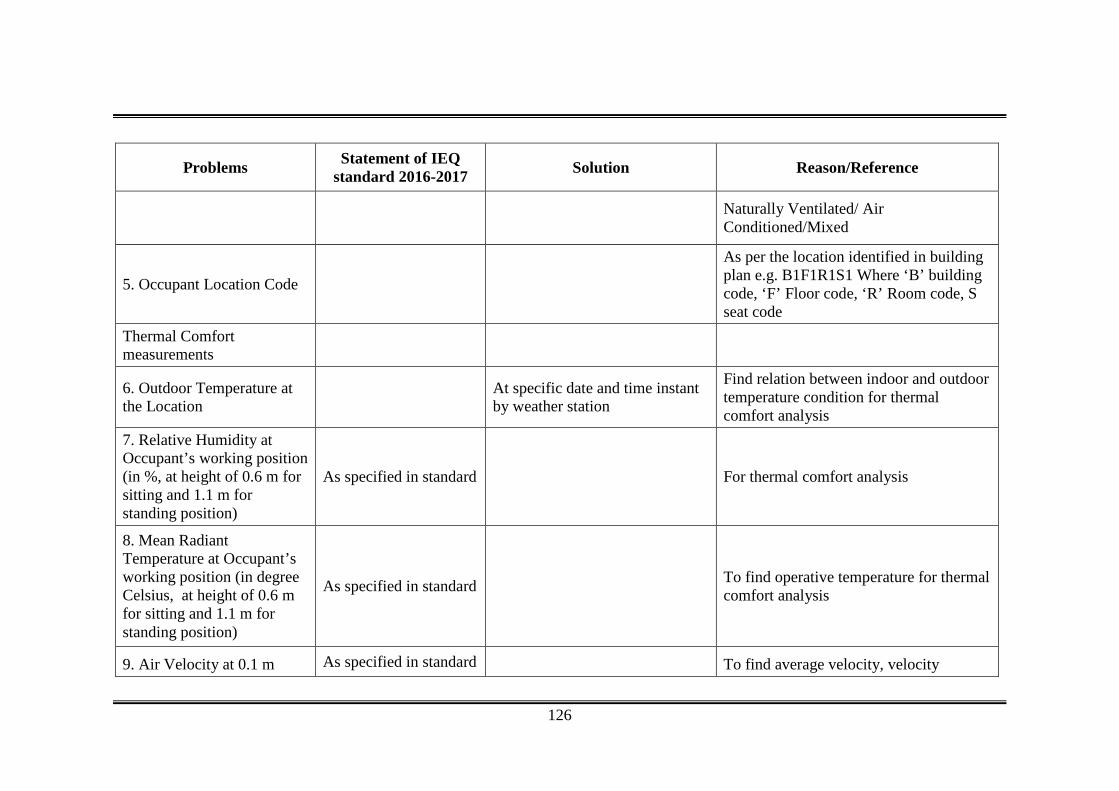
126
Problems Statement of IEQ standard 2016-2017 Solution Reason/Reference
Naturally Ventilated/ Air Conditioned/Mixed
5. Occupant Location Code
As per the location identified in building plan e.g. B1F1R1S1 Where ‘B’ building code, ‘F’ Floor code, ‘R’ Room code, S seat code
Thermal Comfort measurements
6. Outdoor Temperature at the Location At specific date and time instant
by weather station
Find relation between indoor and outdoor temperature condition for thermal comfort analysis
7. Relative Humidity at Occupant’s working position (in %, at height of 0.6 m for sitting and 1.1 m for standing position)
As specified in standard For thermal comfort analysis
8. Mean Radiant Temperature at Occupant’s working position (in degree Celsius, at height of 0.6 m for sitting and 1.1 m for standing position)
As specified in standard To find operative temperature for thermal comfort analysis
9. Air Velocity at 0.1 m As specified in standard To find average velocity, velocity
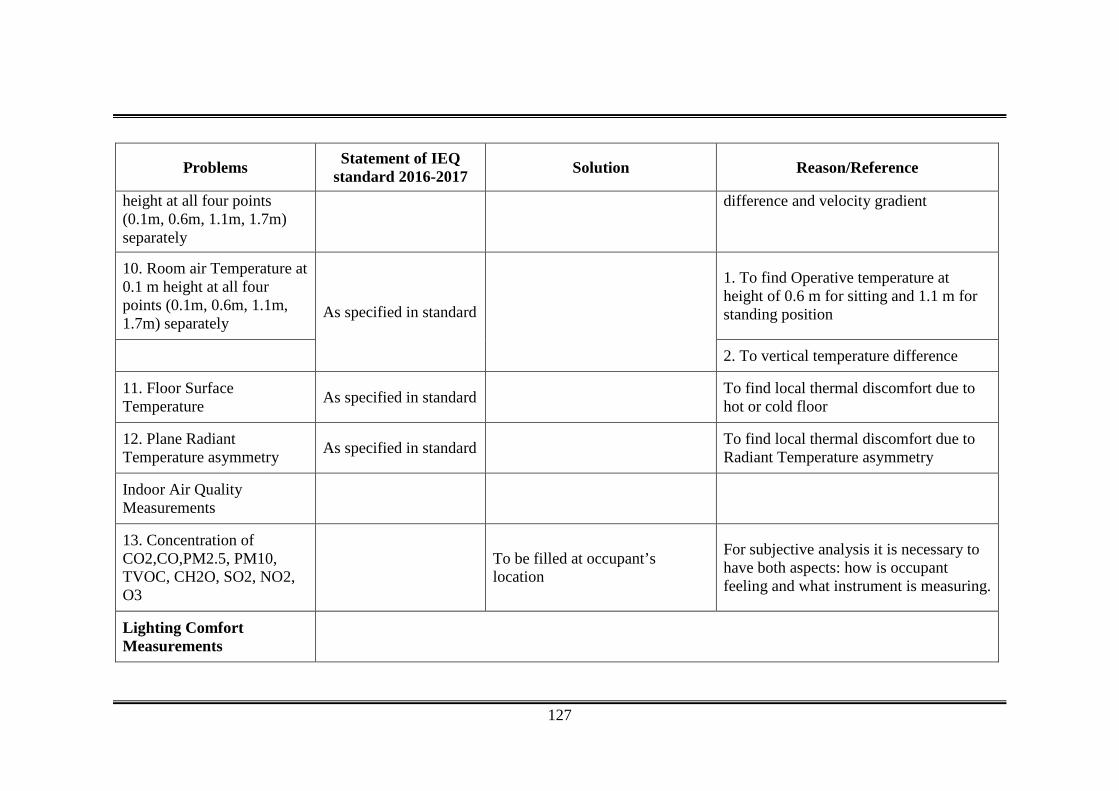
127
Problems Statement of IEQ standard 2016-2017 Solution Reason/Reference
height at all four points (0.1m, 0.6m, 1.1m, 1.7m) separately
difference and velocity gradient
10. Room air Temperature at 0.1 m height at all four points (0.1m, 0.6m, 1.1m, 1.7m) separately
As specified in standard
1. To find Operative temperature at height of 0.6 m for sitting and 1.1 m for standing position
2. To vertical temperature difference
11. Floor Surface Temperature As specified in standard To find local thermal discomfort due to
hot or cold floor
12. Plane Radiant Temperature asymmetry As specified in standard To find local thermal discomfort due to
Radiant Temperature asymmetry
Indoor Air Quality Measurements
13. Concentration of CO2,CO,PM2.5, PM10, TVOC, CH2O, SO2, NO2, O3
To be filled at occupant’s location
For subjective analysis it is necessary to have both aspects: how is occupant feeling and what instrument is measuring.
Lighting Comfort Measurements
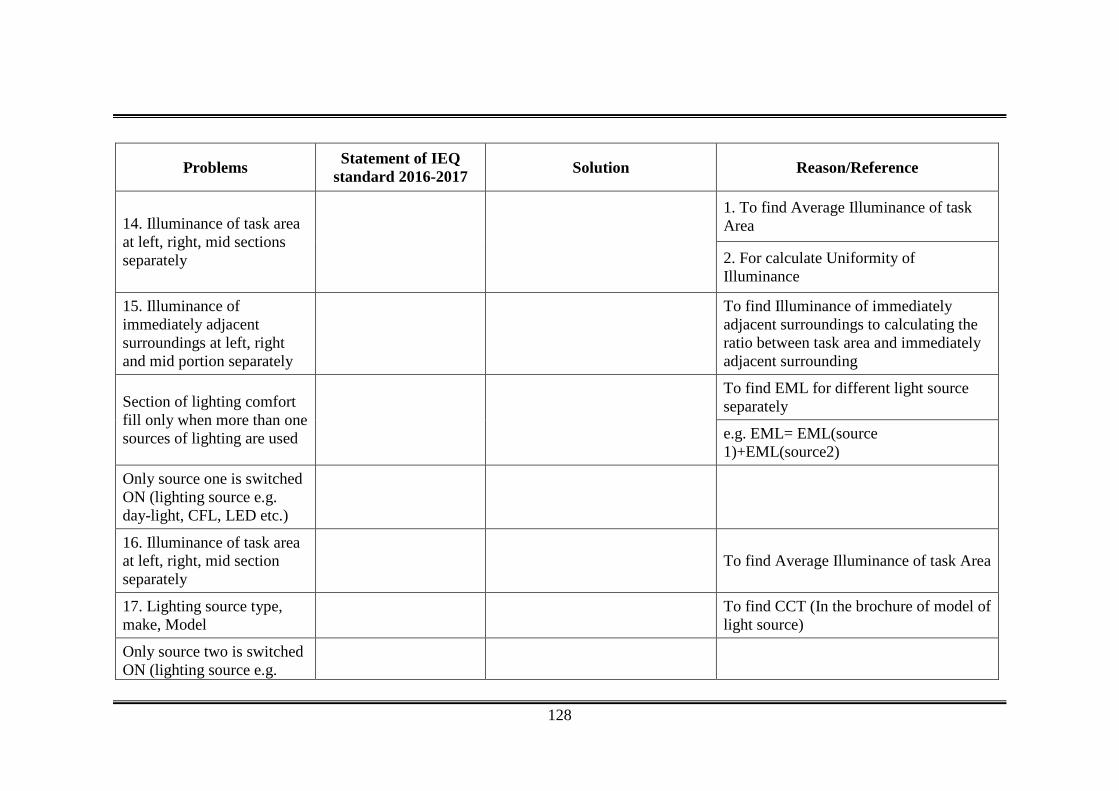
128
Problems Statement of IEQ standard 2016-2017 Solution Reason/Reference
14. Illuminance of task area at left, right, mid sections separately
1. To find Average Illuminance of task Area
2. For calculate Uniformity of Illuminance
15. Illuminance of immediately adjacent surroundings at left, right and mid portion separately
To find Illuminance of immediately adjacent surroundings to calculating the ratio between task area and immediately adjacent surrounding
Section of lighting comfort fill only when more than one sources of lighting are used
To find EML for different light source separately
e.g. EML= EML(source 1)+EML(source2)
Only source one is switched ON (lighting source e.g. day-light, CFL, LED etc.)
16. Illuminance of task area at left, right, mid section separately
To find Average Illuminance of task Area
17. Lighting source type, make, Model To find CCT (In the brochure of model of
light source)
Only source two is switched ON (lighting source e.g.
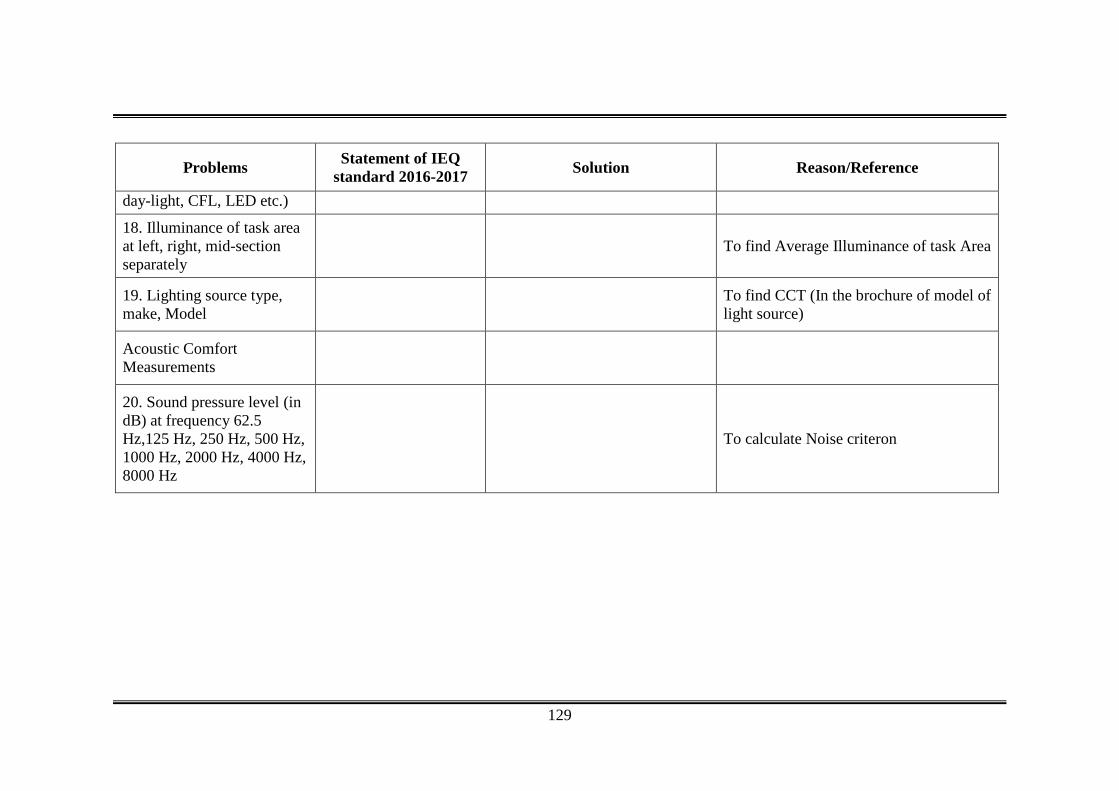
129
Problems Statement of IEQ standard 2016-2017 Solution Reason/Reference
day-light, CFL, LED etc.)
18. Illuminance of task area at left, right, mid-section separately
To find Average Illuminance of task Area
19. Lighting source type, make, Model To find CCT (In the brochure of model of
light source)
Acoustic Comfort Measurements
20. Sound pressure level (in dB) at frequency 62.5 Hz,125 Hz, 250 Hz, 500 Hz, 1000 Hz, 2000 Hz, 4000 Hz, 8000 Hz
To calculate Noise criteron
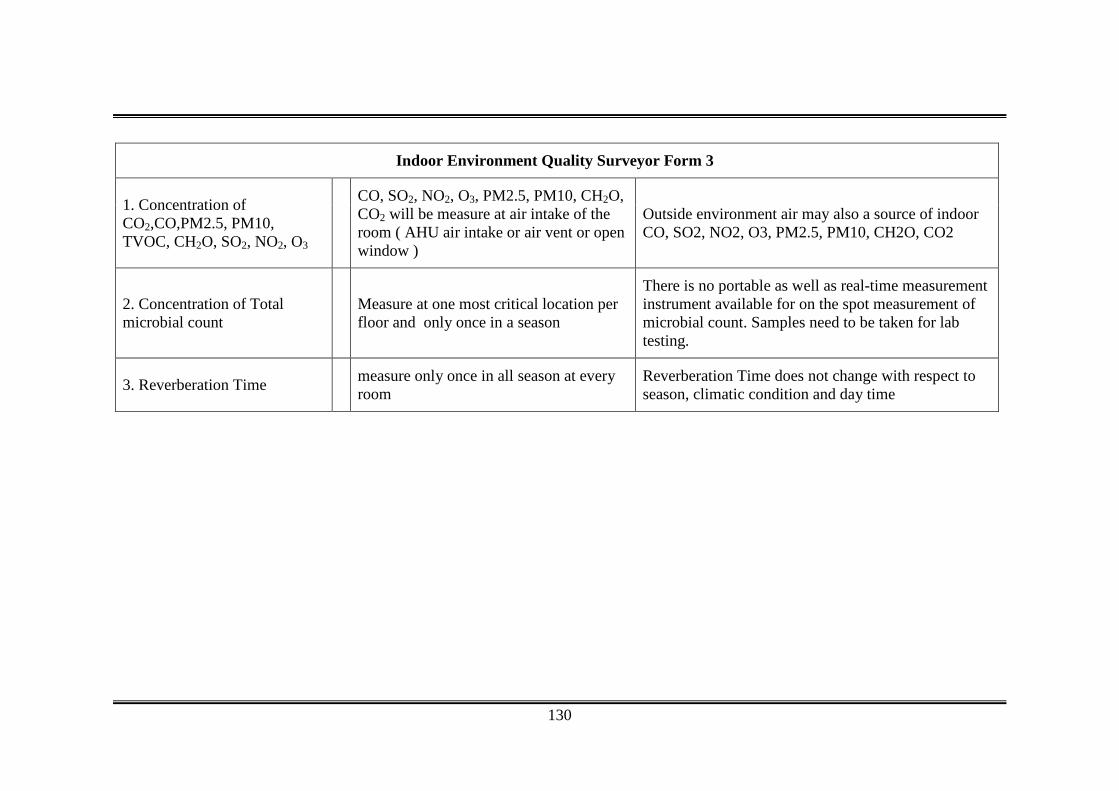
130
Indoor Environment Quality Surveyor Form 3
1. Concentration of CO2,CO,PM2.5, PM10, TVOC, CH2O, SO2, NO2, O3
CO, SO2, NO2, O3, PM2.5, PM10, CH2O, CO2 will be measure at air intake of the room ( AHU air intake or air vent or open window )
Outside environment air may also a source of indoor CO, SO2, NO2, O3, PM2.5, PM10, CH2O, CO2
2. Concentration of Total microbial count Measure at one most critical location per
floor and only once in a season
There is no portable as well as real-time measurement instrument available for on the spot measurement of microbial count. Samples need to be taken for lab testing.
3. Reverberation Time measure only once in all season at every room
Reverberation Time does not change with respect to season, climatic condition and day time
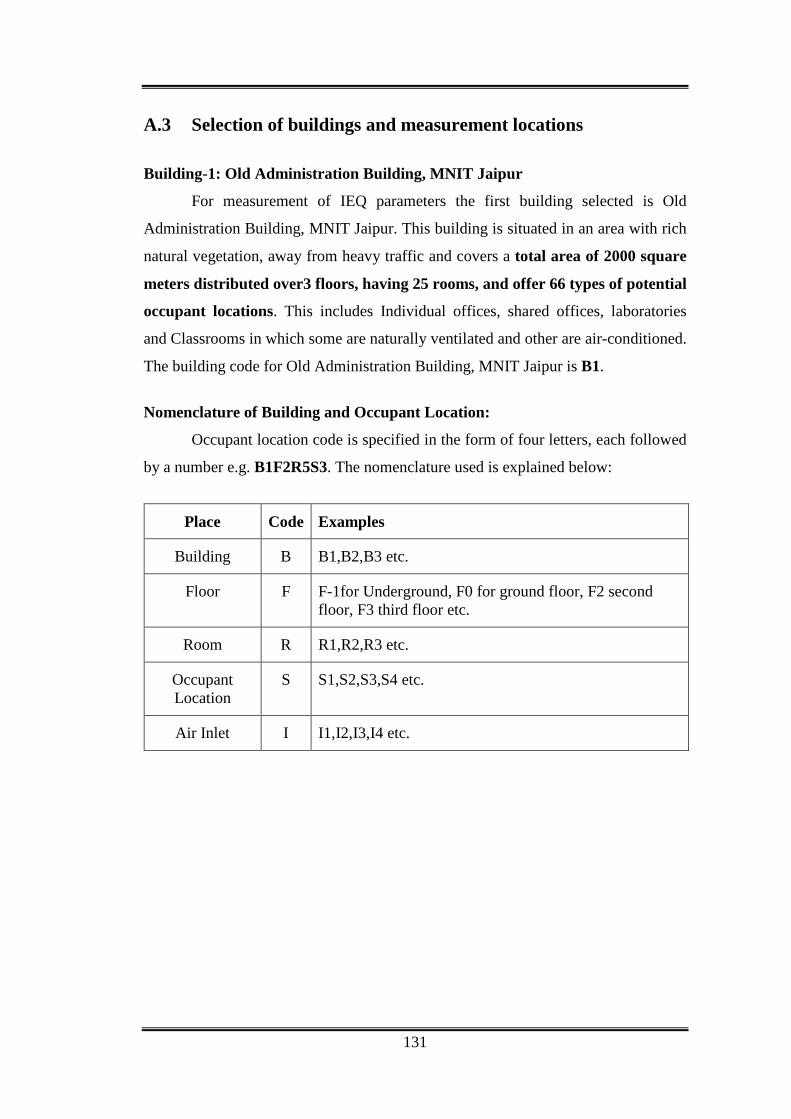
131
A.3 Selection of buildings and measurement locations Building-1: Old Administration Building, MNIT Jaipur
For measurement of IEQ parameters the first building selected is Old
Administration Building, MNIT Jaipur. This building is situated in an area with rich
natural vegetation, away from heavy traffic and covers a total area of 2000 square
meters distributed over3 floors, having 25 rooms, and offer 66 types of potential
occupant locations. This includes Individual offices, shared offices, laboratories
and Classrooms in which some are naturally ventilated and other are air-conditioned.
The building code for Old Administration Building, MNIT Jaipur is B1.
Nomenclature of Building and Occupant Location:
Occupant location code is specified in the form of four letters, each followed
by a number e.g. B1F2R5S3. The nomenclature used is explained below:
Place Code Examples
Building B B1,B2,B3 etc.
Floor F F-1for Underground, F0 for ground floor, F2 second floor, F3 third floor etc.
Room R R1,R2,R3 etc.
Occupant Location
S S1,S2,S3,S4 etc.
Air Inlet I I1,I2,I3,I4 etc.
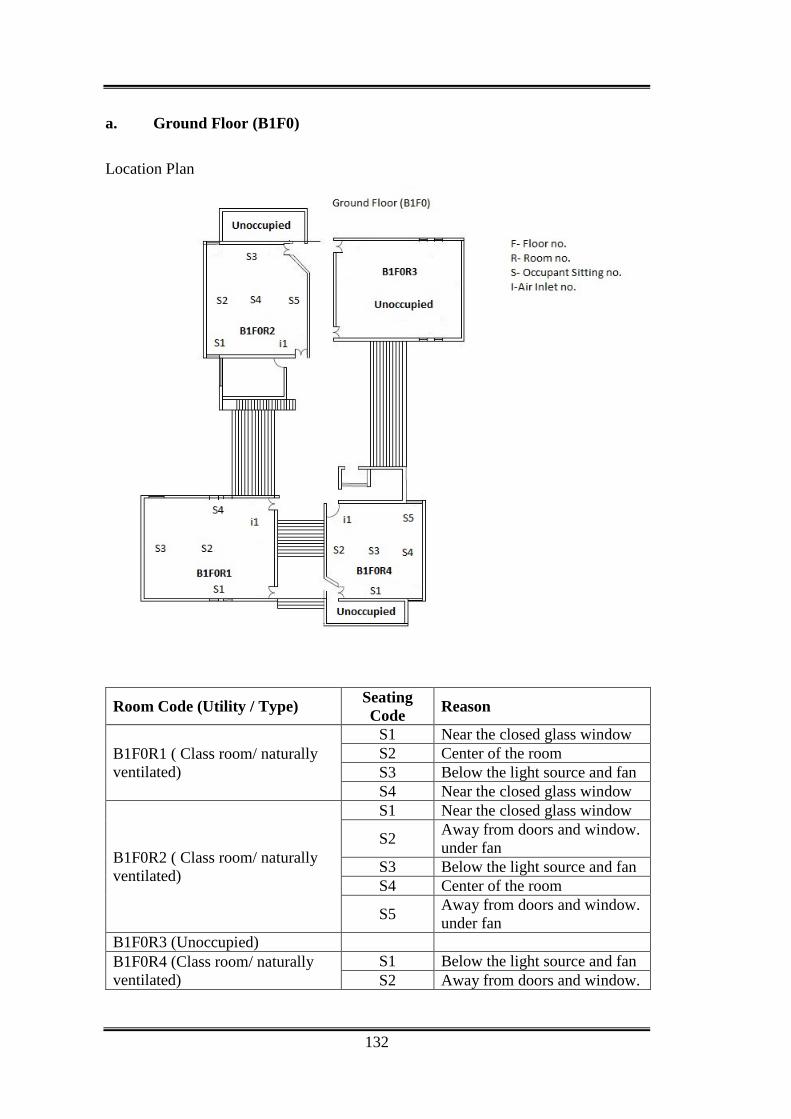
132
a. Ground Floor (B1F0)
Location Plan
Room Code (Utility / Type) Seating Code Reason
B1F0R1 ( Class room/ naturally ventilated)
S1 Near the closed glass window S2 Center of the room S3 Below the light source and fan S4 Near the closed glass window
B1F0R2 ( Class room/ naturally ventilated)
S1 Near the closed glass window
S2 Away from doors and window. under fan
S3 Below the light source and fan S4 Center of the room
S5 Away from doors and window. under fan
B1F0R3 (Unoccupied) B1F0R4 (Class room/ naturally ventilated)
S1 Below the light source and fan S2 Away from doors and window.
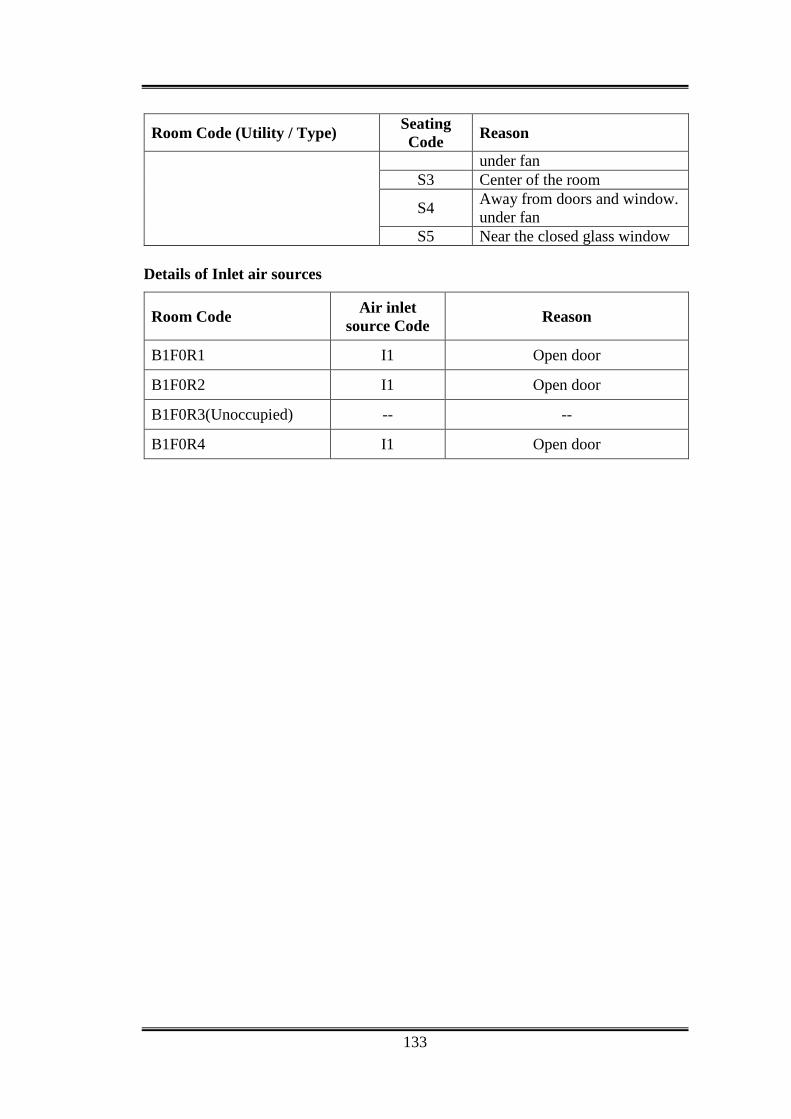
133
Room Code (Utility / Type) Seating Code Reason
under fan S3 Center of the room
S4 Away from doors and window. under fan
S5 Near the closed glass window Details of Inlet air sources
Room Code Air inlet source Code Reason
B1F0R1 I1 Open door
B1F0R2 I1 Open door
B1F0R3(Unoccupied) -- --
B1F0R4 I1 Open door
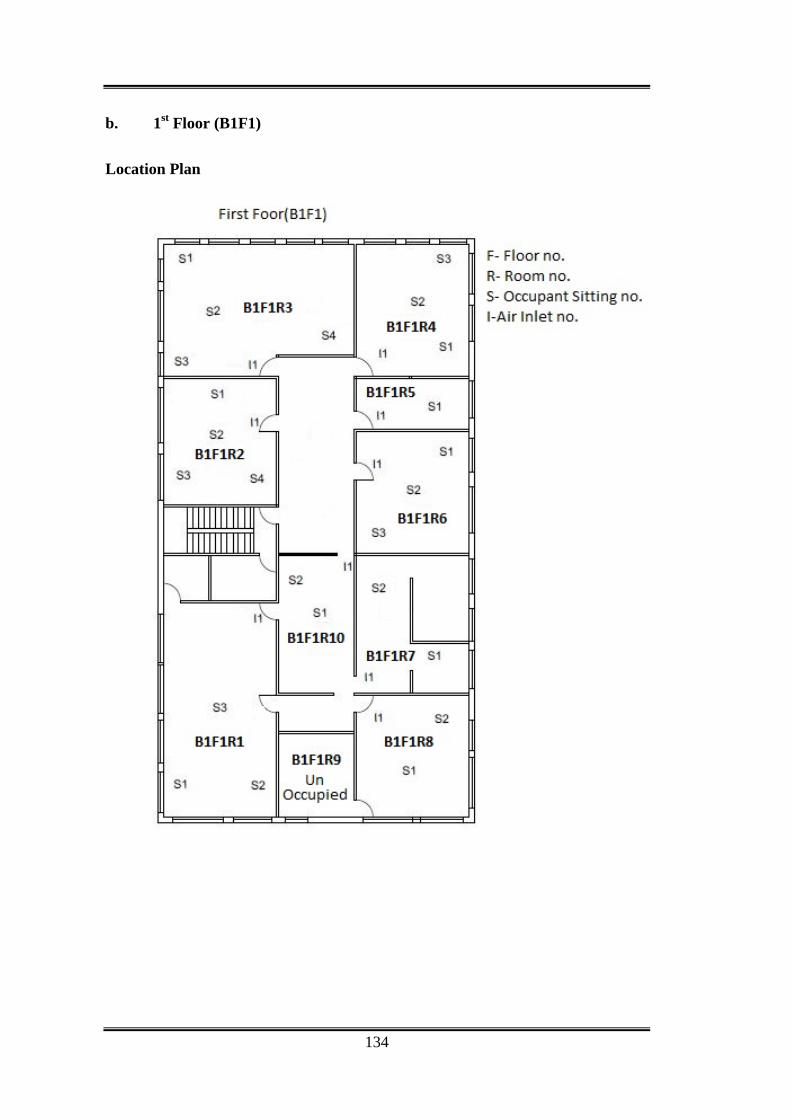
134
b. 1st Floor (B1F1)
Location Plan
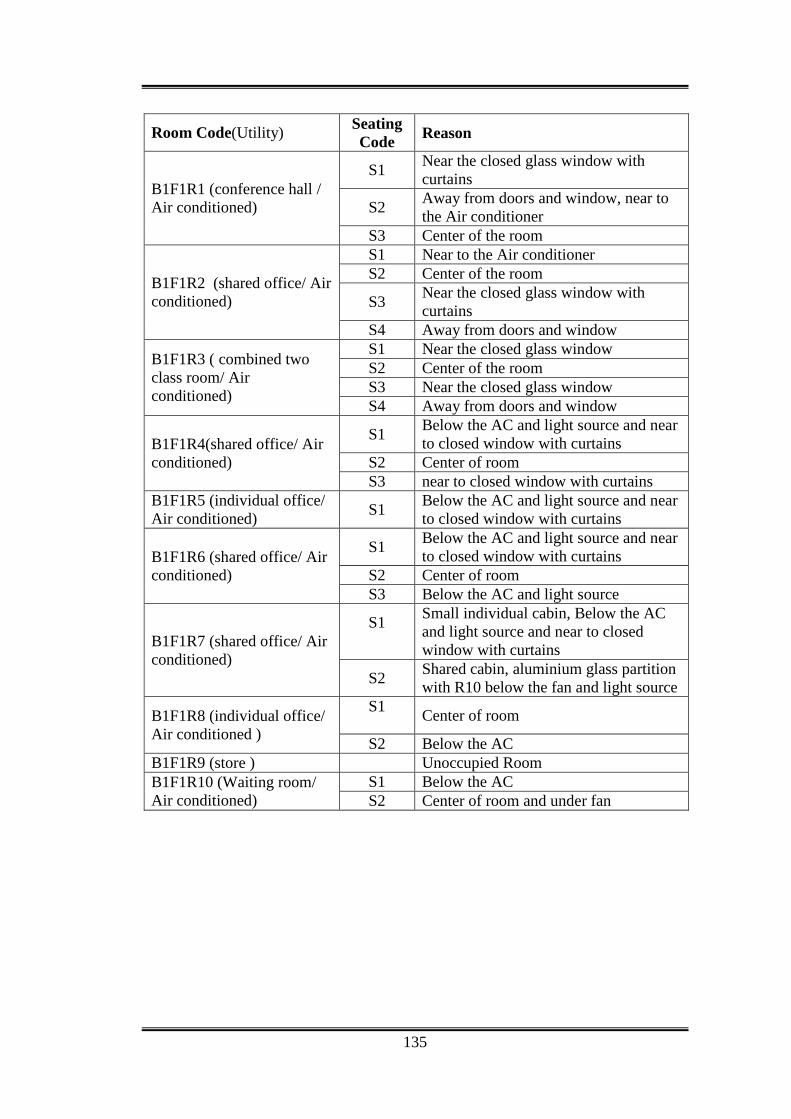
135
Room Code(Utility) Seating Code Reason
B1F1R1 (conference hall / Air conditioned)
S1 Near the closed glass window with curtains
S2 Away from doors and window, near to the Air conditioner
S3 Center of the room
B1F1R2 (shared office/ Air conditioned)
S1 Near to the Air conditioner S2 Center of the room
S3 Near the closed glass window with curtains
S4 Away from doors and window
B1F1R3 ( combined two class room/ Air conditioned)
S1 Near the closed glass window S2 Center of the room S3 Near the closed glass window S4 Away from doors and window
B1F1R4(shared office/ Air conditioned)
S1 Below the AC and light source and near to closed window with curtains
S2 Center of room S3 near to closed window with curtains
B1F1R5 (individual office/ Air conditioned) S1 Below the AC and light source and near
to closed window with curtains
B1F1R6 (shared office/ Air conditioned)
S1 Below the AC and light source and near to closed window with curtains
S2 Center of room S3 Below the AC and light source
B1F1R7 (shared office/ Air conditioned)
S1
Small individual cabin, Below the AC and light source and near to closed window with curtains
S2 Shared cabin, aluminium glass partition with R10 below the fan and light source
B1F1R8 (individual office/ Air conditioned )
S1 Center of room
S2 Below the AC B1F1R9 (store ) Unoccupied Room B1F1R10 (Waiting room/ Air conditioned)
S1 Below the AC S2 Center of room and under fan
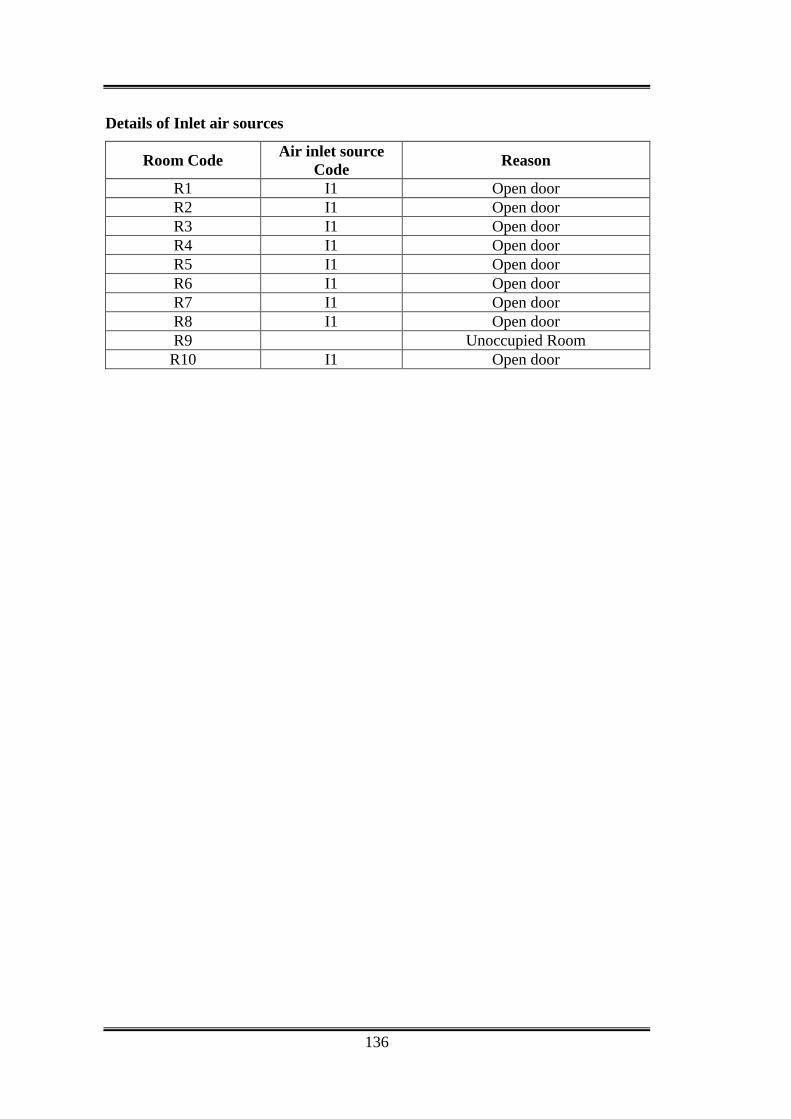
136
Details of Inlet air sources
Room Code Air inlet source Code Reason
R1 I1 Open door R2 I1 Open door R3 I1 Open door R4 I1 Open door R5 I1 Open door R6 I1 Open door R7 I1 Open door R8 I1 Open door R9 Unoccupied Room R10 I1 Open door

137
c. 2nd Floor (B1F2)
Location Plan
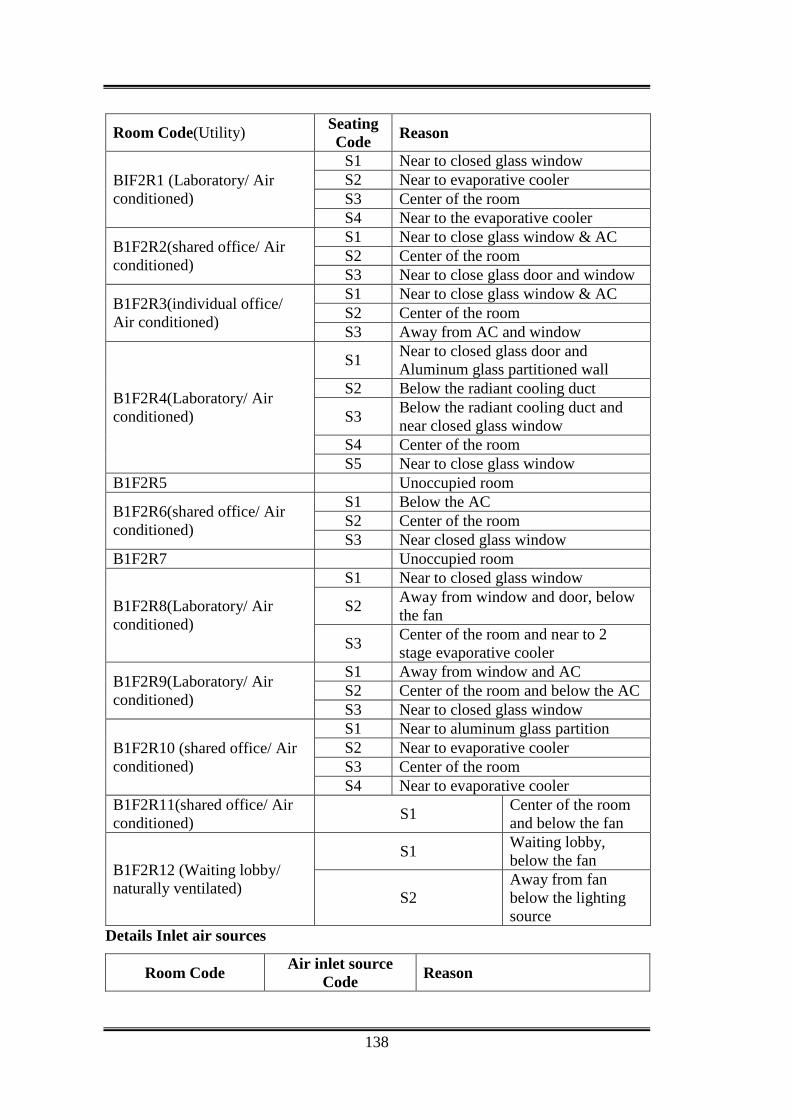
138
Room Code(Utility) Seating Code Reason
BIF2R1 (Laboratory/ Air conditioned)
S1 Near to closed glass window S2 Near to evaporative cooler S3 Center of the room S4 Near to the evaporative cooler
B1F2R2(shared office/ Air conditioned)
S1 Near to close glass window & AC S2 Center of the room S3 Near to close glass door and window
B1F2R3(individual office/ Air conditioned)
S1 Near to close glass window & AC S2 Center of the room S3 Away from AC and window
B1F2R4(Laboratory/ Air conditioned)
S1 Near to closed glass door and Aluminum glass partitioned wall
S2 Below the radiant cooling duct
S3 Below the radiant cooling duct and near closed glass window
S4 Center of the room S5 Near to close glass window
B1F2R5 Unoccupied room
B1F2R6(shared office/ Air conditioned)
S1 Below the AC S2 Center of the room S3 Near closed glass window
B1F2R7 Unoccupied room
B1F2R8(Laboratory/ Air conditioned)
S1 Near to closed glass window
S2 Away from window and door, below the fan
S3 Center of the room and near to 2 stage evaporative cooler
B1F2R9(Laboratory/ Air conditioned)
S1 Away from window and AC S2 Center of the room and below the AC S3 Near to closed glass window
B1F2R10 (shared office/ Air conditioned)
S1 Near to aluminum glass partition S2 Near to evaporative cooler S3 Center of the room S4 Near to evaporative cooler
B1F2R11(shared office/ Air conditioned) S1 Center of the room
and below the fan
B1F2R12 (Waiting lobby/ naturally ventilated)
S1 Waiting lobby, below the fan
S2 Away from fan below the lighting source
Details Inlet air sources
Room Code Air inlet source Code Reason

139
B1F2R1 I1 In front of Evaporative Cooler I2 In front of Evaporative Cooler
B1F2R2 I1 Open door B1F2R3 I1 Open door
B1F2R4 I1 In front of radiant cooling inlet air duct
B1F2R5 Unoccupied room B1F2R6 I1 Open door B1F2R7 Unoccupied room
B1F2R8 I1 In front of two stage Evaporative Cooler
B1F2R9 I1 Open door
B1F2R10 I1 In front of Evaporative Cooler I2 In front of Evaporative Cooler
B1F2R11 I1 Open door B1F2R12 I1 Open door
2. Building-2: Centre for Energy and Environment Building, MNIT Jaipur
For measurement of IEQ parameters the second building selected is Centre
for Energy and Environment Building, MNIT Jaipur. This building is situated in an
area nearer (around 65 meters) to the roadway covers a total area of 162
square meters having 1 floor, 3 rooms, and 10 types of potential occupant
locations. This includes shared offices, laboratories in which some are naturally
ventilated and others are air conditioned. The building code for Centre for Energy
and Environment Building, MNIT Jaipur is B2.

140
a. Ground Floor (B2F0)
Location Plan
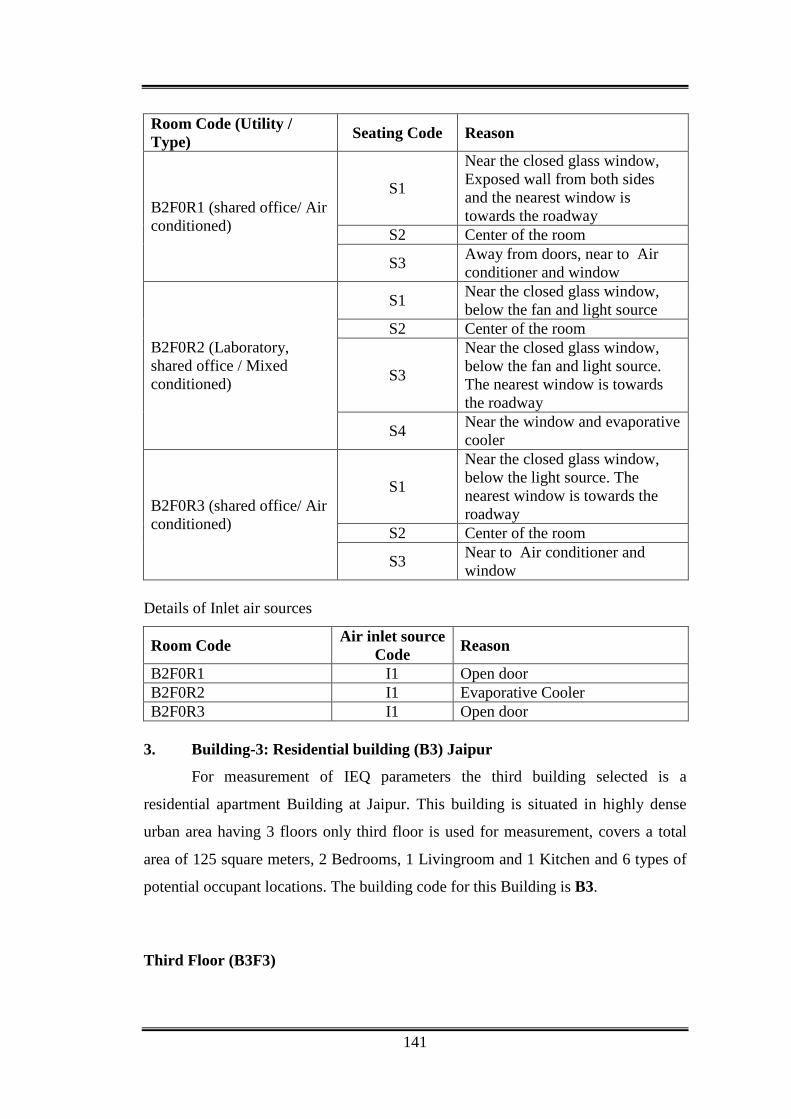
141
Room Code (Utility / Type) Seating Code Reason
B2F0R1 (shared office/ Air conditioned)
S1
Near the closed glass window, Exposed wall from both sides and the nearest window is towards the roadway
S2 Center of the room
S3 Away from doors, near to Air conditioner and window
B2F0R2 (Laboratory, shared office / Mixed conditioned)
S1 Near the closed glass window, below the fan and light source
S2 Center of the room
S3
Near the closed glass window, below the fan and light source. The nearest window is towards the roadway
S4 Near the window and evaporative cooler
B2F0R3 (shared office/ Air conditioned)
S1
Near the closed glass window, below the light source. The nearest window is towards the roadway
S2 Center of the room
S3 Near to Air conditioner and window
Details of Inlet air sources
Room Code Air inlet source Code Reason
B2F0R1 I1 Open door B2F0R2 I1 Evaporative Cooler B2F0R3 I1 Open door
3. Building-3: Residential building (B3) Jaipur
For measurement of IEQ parameters the third building selected is a
residential apartment Building at Jaipur. This building is situated in highly dense
urban area having 3 floors only third floor is used for measurement, covers a total
area of 125 square meters, 2 Bedrooms, 1 Livingroom and 1 Kitchen and 6 types of
potential occupant locations. The building code for this Building is B3.
Third Floor (B3F3)
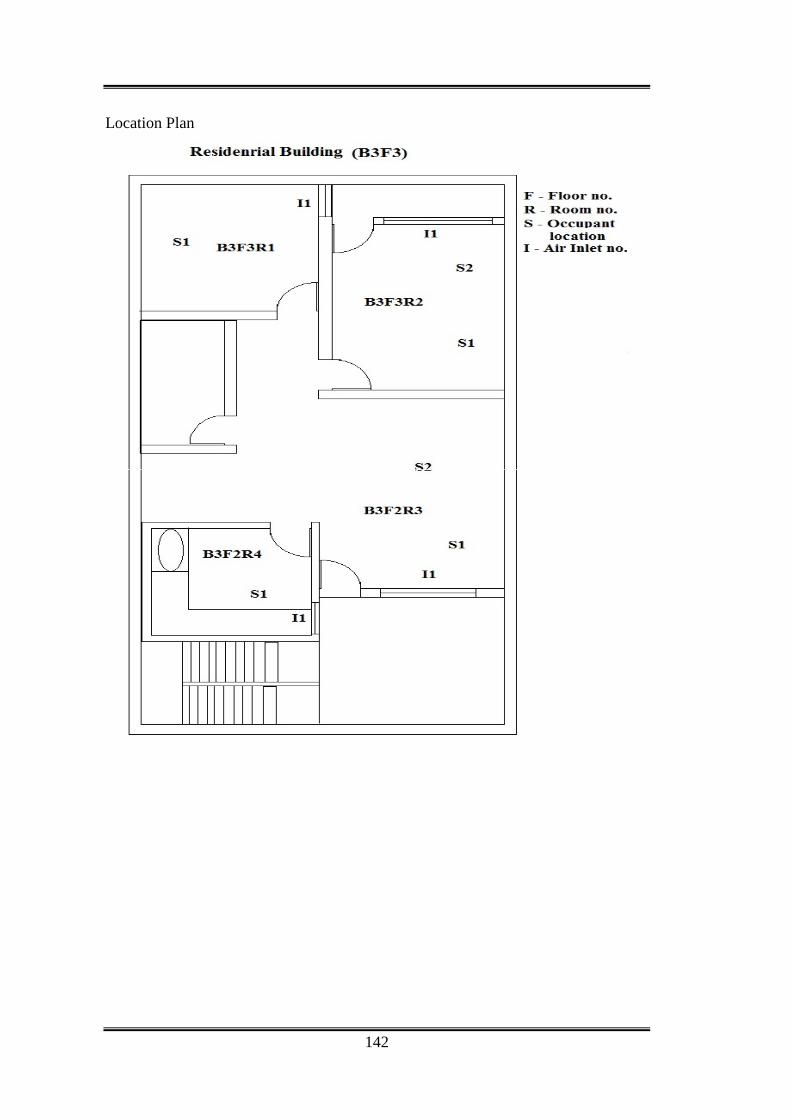
142
Location Plan

143
Room Code (Utility / Type) Seating Code Reason
B3F3R1 (Bedroom 1/ Naturally ventilated)
S1
Center of the room
B3F3R2 (Bedroom 2 / Naturally ventilated)
S1
One side of bed, away the closed window, below the fan and light source
S2
One side of bed Near the closed window, below the fan and light source
B3F3R3(Livingroom/ Air-conditioned)
S1 Near to Evaporative Cooler and window
S2
Center of the room, below the fan and light source
B3F3R4 (Kitchen Naturally ventilated) S1 Center of the room
Details of Inlet air sources
Room Code Air inlet source Code Reason
B3F3R1 I1 Open Window
B3F3R2 I1 Open Window
B3F3R3 I1 Evaporative Cooler
B3F3R4 I1 Open Window
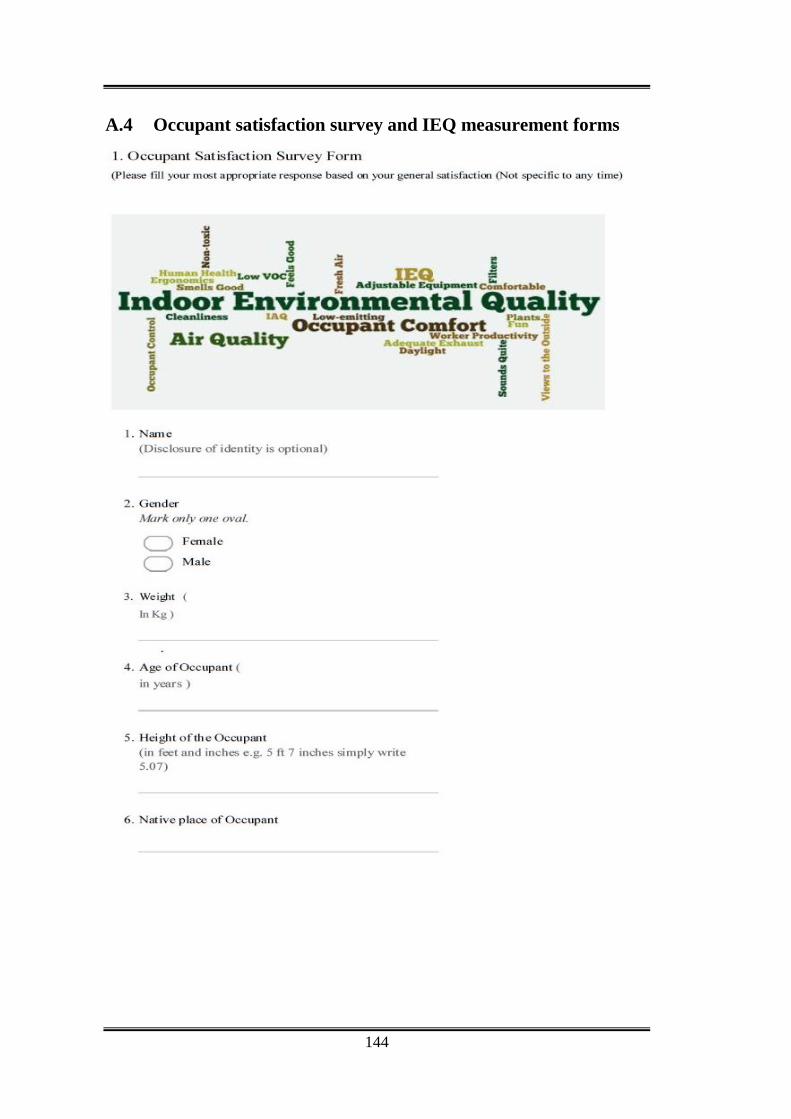
144
A.4 Occupant satisfaction survey and IEQ measurement forms
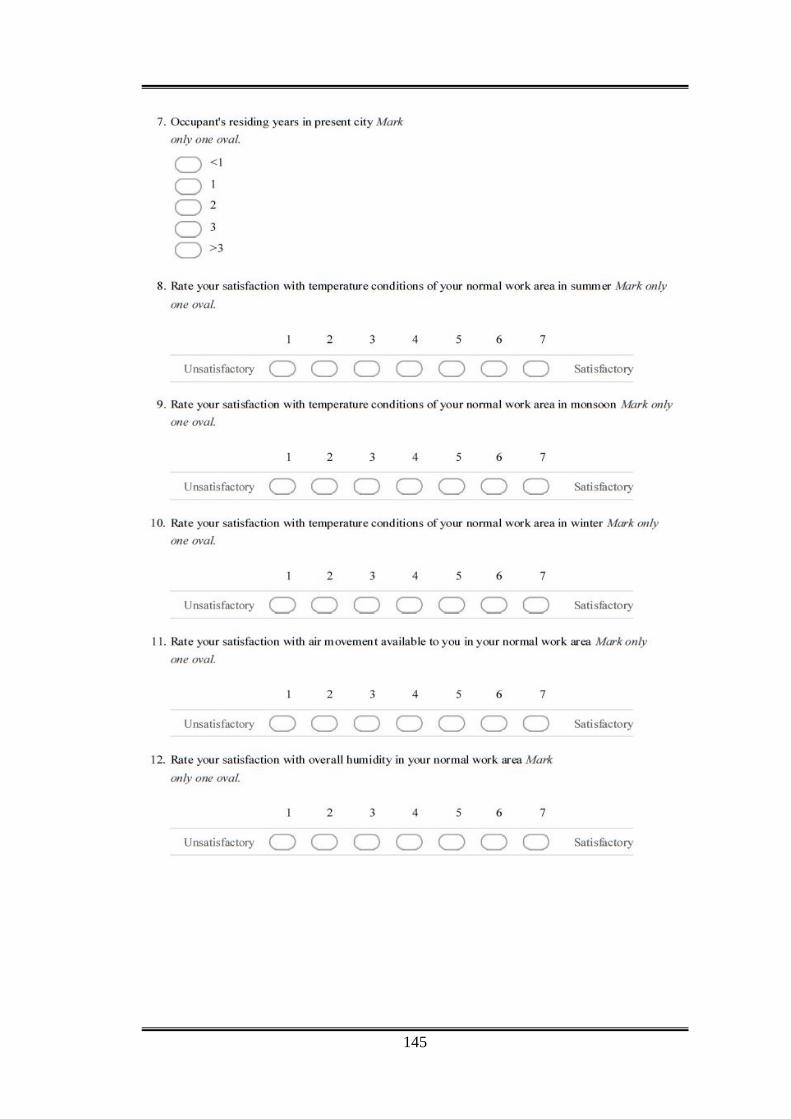
145

146
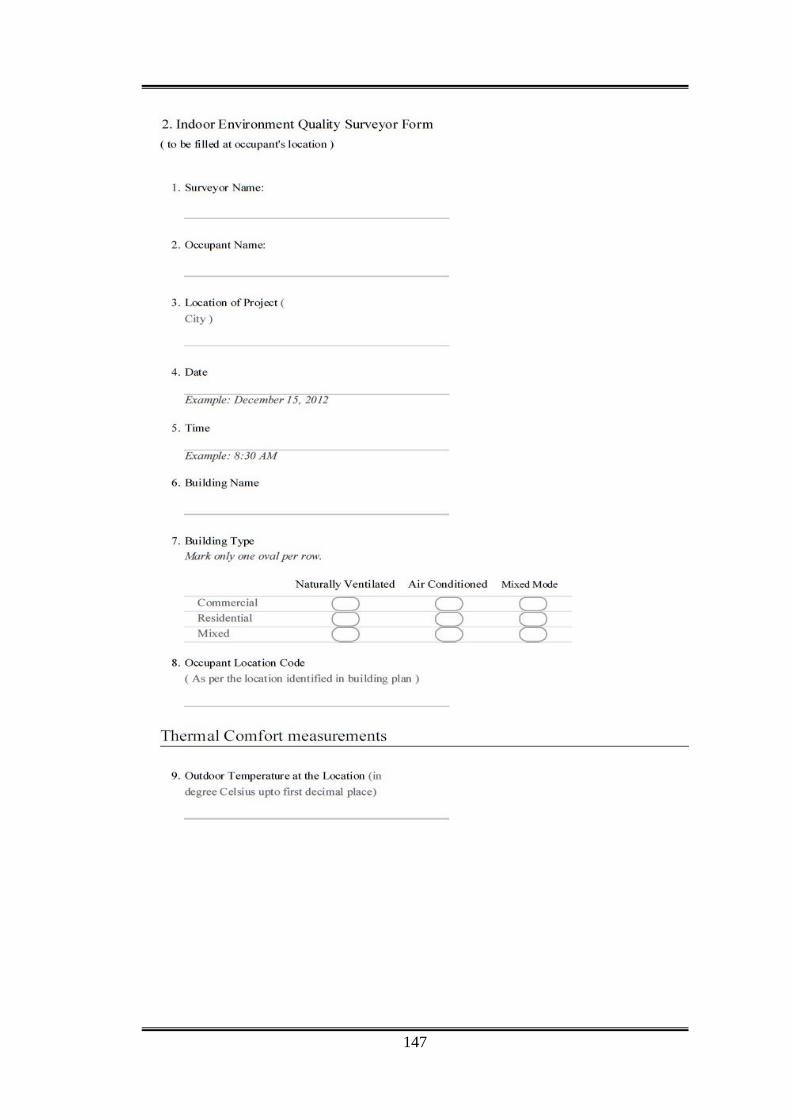
147
148
149
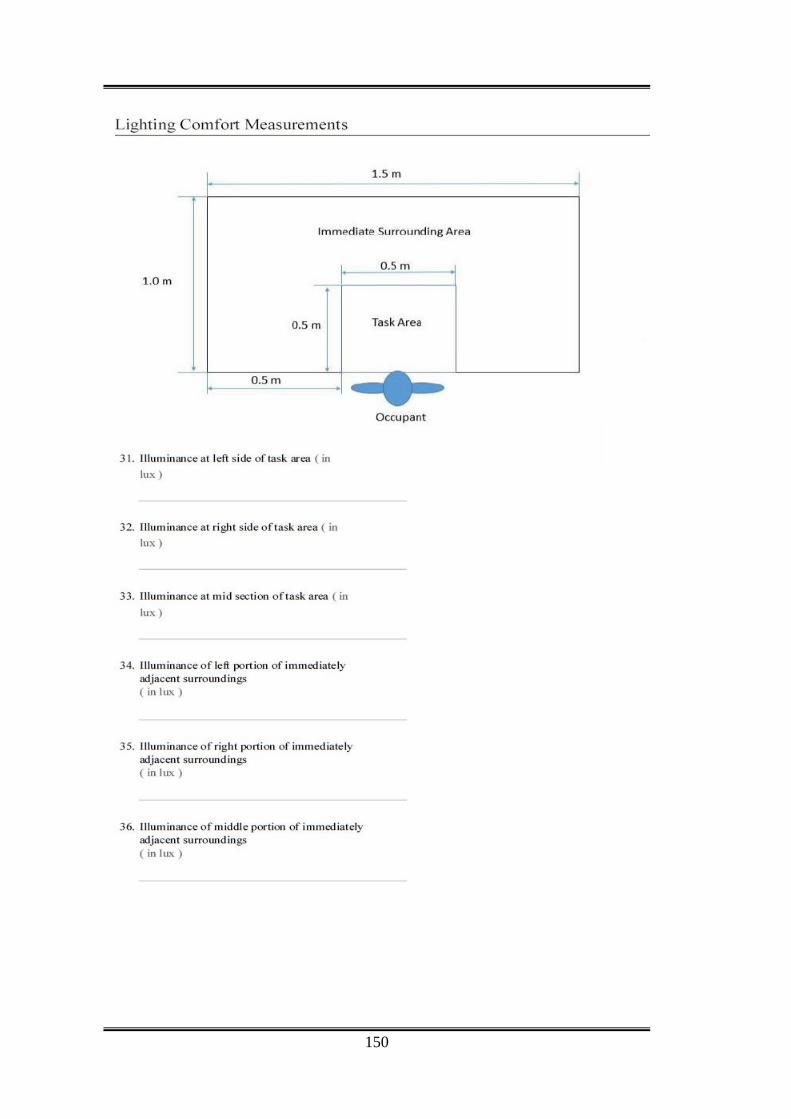
150
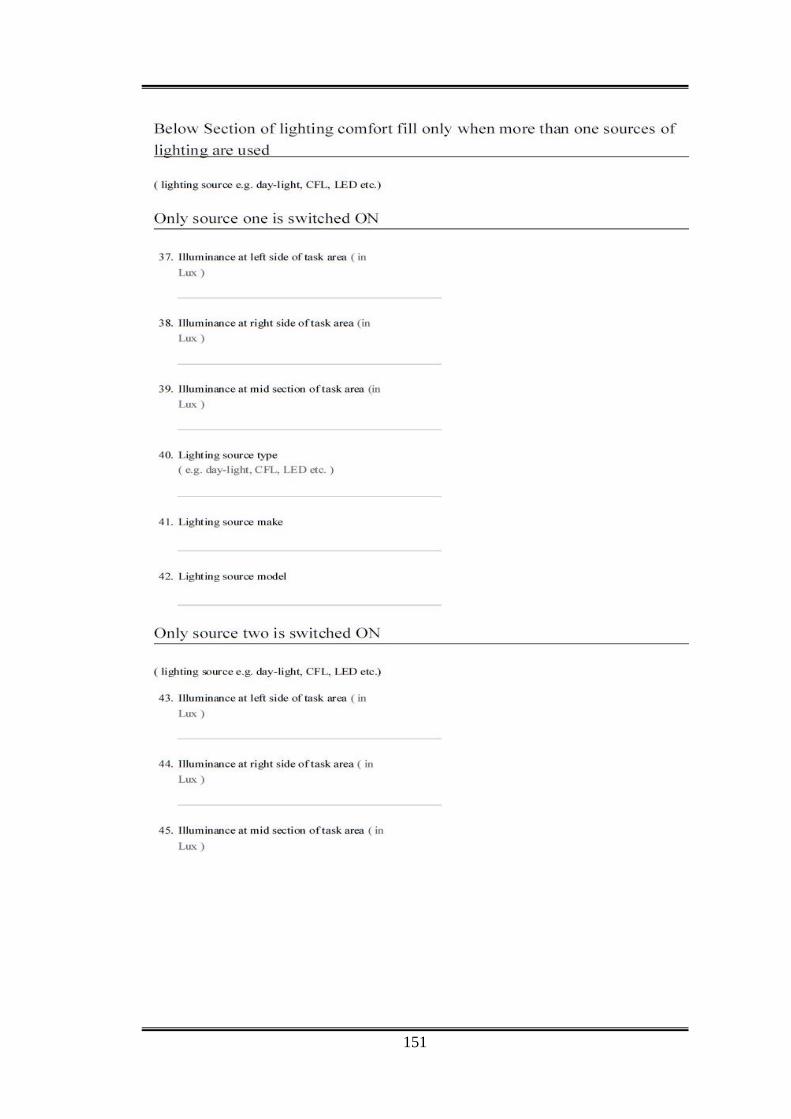
151
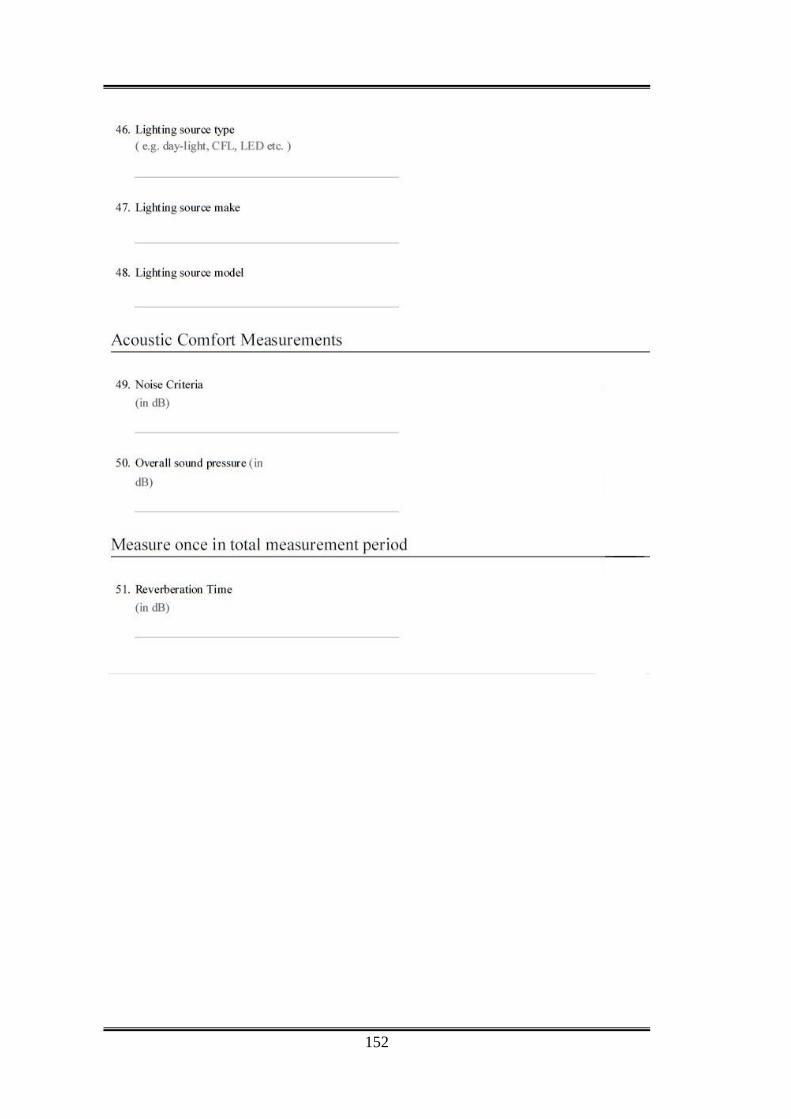
152
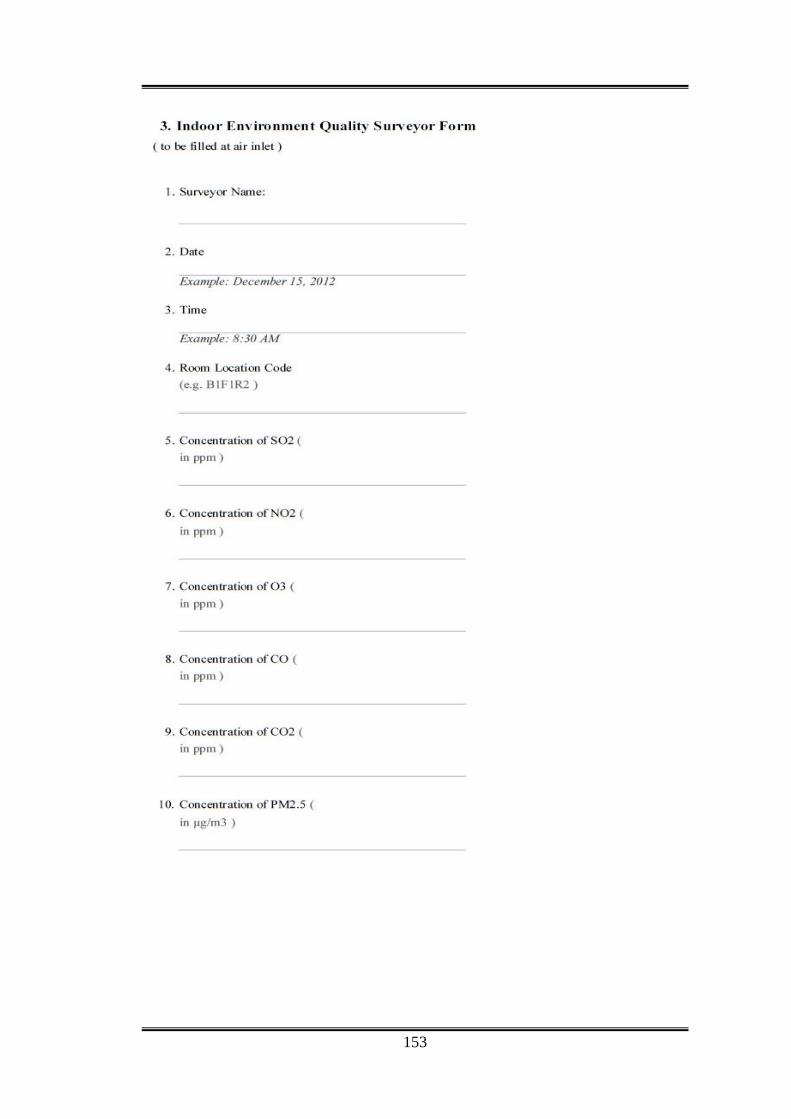
153
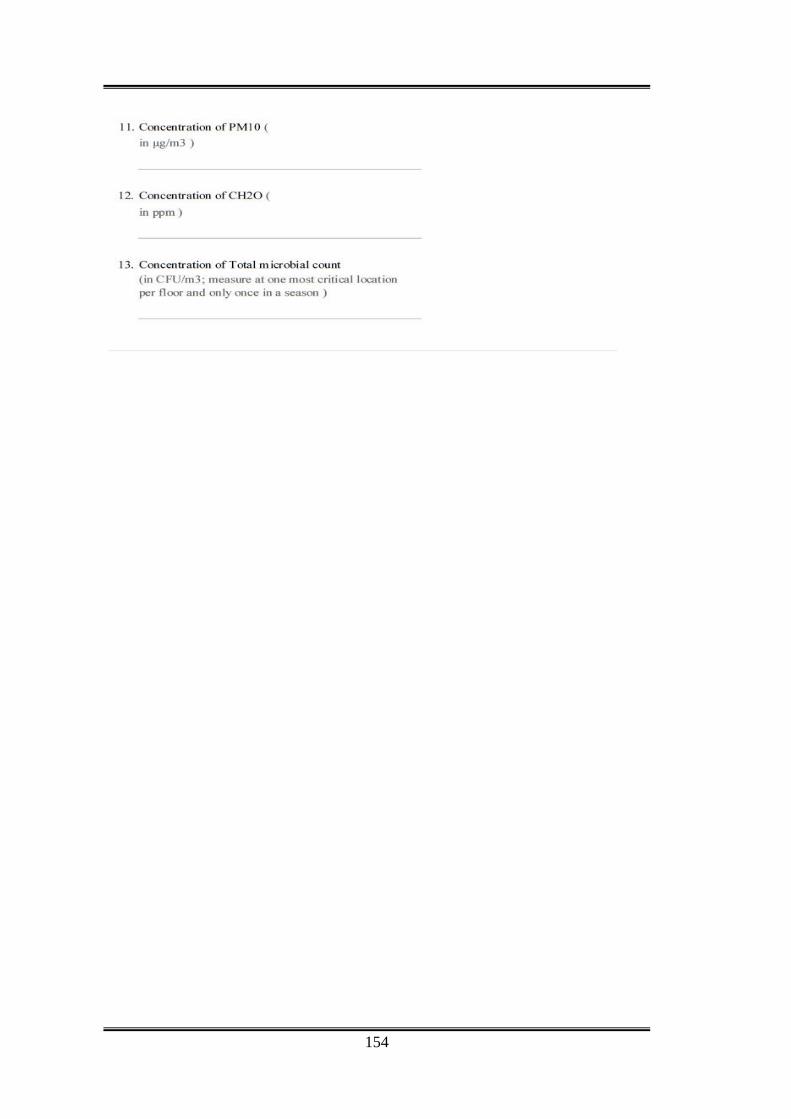
154
155
A.5 Summary of measurements and results 1. Results of June, 2017 (Summer)
a. Old Administration Building, MNIT Jaipur
Measurement taken from 12th June, 2017 to 22nd June, 2017
Time slot for measurement are morning session (10.00am to 11.00am), afternoon session (2.00pm to 3.00pm) and evening session
(4.00pm to 5.00pm)
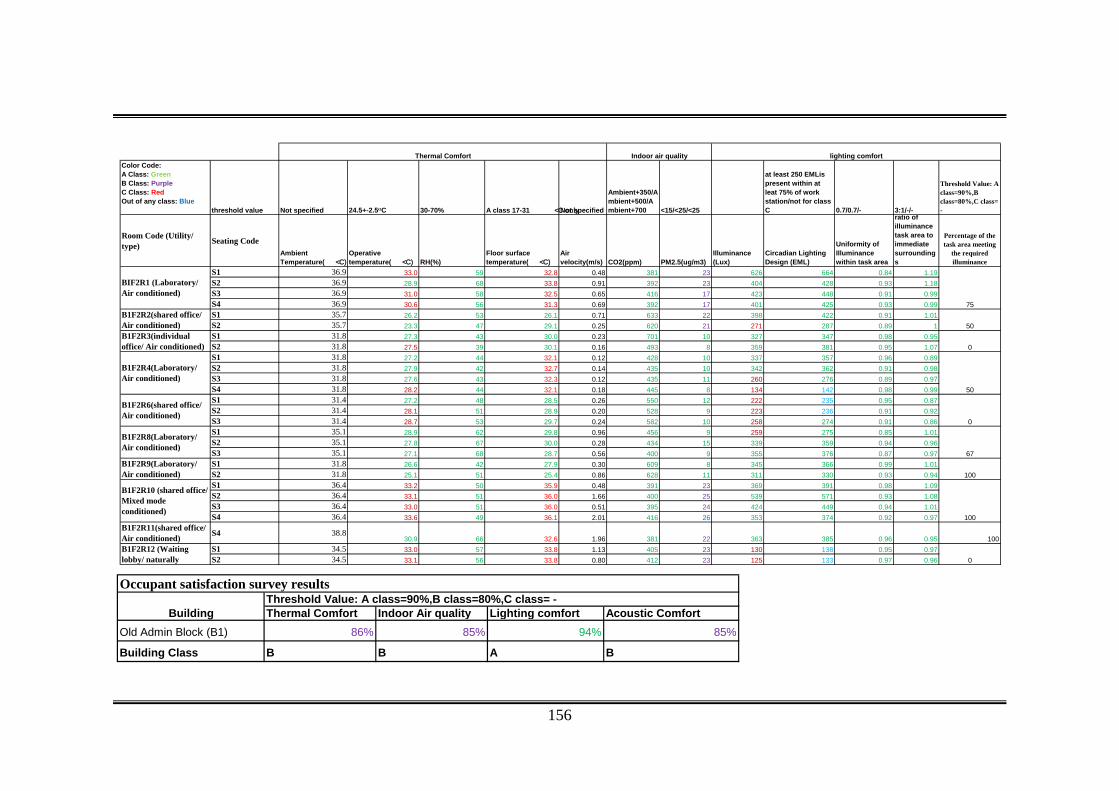
156
Color Code:A Class: GreenB Class: Purple C Class: RedOut of any class: Blue
threshold value Not specified 24.5+-2.5ᴼC 30-70% A class 17-31 <C onlyNot specified
Ambient+350/Ambient+500/Ambient+700 <15/<25/<25
at least 250 EMLis present within at leat 75% of work station/not for class C 0.7/0.7/- 3:1/-/-
Threshold Value: A class=90%,B class=80%,C class= -
Room Code (Utility/ type) Seating Code
Ambient Temperature( <C)
Operative temperature( <C) RH(%)
Floor surface temperature( <C)
Air velocity(m/s) CO2(ppm) PM2.5(ug/m3)
Illuminance (Lux)
Circadian Lighting Design (EML)
Uniformity of Illuminance within task area
ratio of illuminance task area to immediate surroundings
Percentage of the task area meeting
the required illuminance
S1 36.9 33.0 59 32.8 0.48 381 23 626 664 0.84 1.19
S2 36.9 28.9 68 33.8 0.91 392 23 404 428 0.93 1.18
S3 36.9 31.0 58 32.5 0.65 416 17 423 448 0.91 0.99
S4 36.9 30.6 56 31.3 0.69 392 17 401 425 0.93 0.99
S1 35.7 26.2 53 26.1 0.71 633 22 398 422 0.91 1.01
S2 35.7 23.3 47 29.1 0.25 620 21 271 287 0.89 1
S1 31.8 27.3 43 30.0 0.23 701 10 327 347 0.98 0.95
S2 31.8 27.5 39 30.1 0.16 493 8 359 381 0.95 1.07
S1 31.8 27.2 44 32.1 0.12 428 10 337 357 0.96 0.89
S2 31.8 27.9 42 32.7 0.14 435 10 342 362 0.91 0.98
S3 31.8 27.6 43 32.3 0.12 435 11 260 276 0.89 0.97
S4 31.8 28.2 44 32.1 0.18 445 8 134 142 0.98 0.99
S1 31.4 27.2 48 28.5 0.26 550 12 222 235 0.95 0.87
S2 31.4 28.1 51 28.9 0.20 528 9 223 236 0.91 0.92
S3 31.4 28.7 53 29.7 0.24 582 10 258 274 0.91 0.86
S1 35.1 28.9 62 29.8 0.96 456 9 259 275 0.85 1.01
S2 35.1 27.8 67 30.0 0.28 434 15 339 359 0.94 0.96
S3 35.1 27.1 68 28.7 0.56 400 9 355 376 0.87 0.97
S1 31.8 26.6 42 27.9 0.30 609 8 345 366 0.99 1.01
S2 31.8 25.1 51 25.4 0.86 628 11 311 330 0.93 0.94
S1 36.4 33.2 50 35.9 0.48 391 23 369 391 0.98 1.09
S2 36.4 33.1 51 36.0 1.66 400 25 539 571 0.93 1.08
S3 36.4 33.0 51 36.0 0.51 395 24 424 449 0.94 1.01
S4 36.4 33.6 49 36.1 2.01 416 26 353 374 0.92 0.97
B1F2R11(shared office/ Air conditioned) S4 38.8
30.9 66 32.6 1.96 381 22 363 385 0.96 0.95 100
S1 34.5 33.0 57 33.8 1.13 405 23 130 138 0.95 0.97
S2 34.5 33.1 56 33.8 0.80 412 23 125 133 0.97 0.96
B1F2R10 (shared office/ Mixed mode conditioned)
Indoor air quality
B1F2R12 (Waiting lobby/ naturally
B1F2R4(Laboratory/ Air conditioned)
B1F2R6(shared office/ Air conditioned)
B1F2R8(Laboratory/ Air conditioned)
B1F2R9(Laboratory/ Air conditioned)
Thermal Comfort
BIF2R1 (Laboratory/ Air conditioned)
B1F2R2(shared office/ Air conditioned)B1F2R3(individual office/ Air conditioned)
lighting comfort
67
100
100
0
75
50
0
50
0
Thermal Comfort Indoor Air quality Lighting comfort Acoustic Comfort
Old Admin Block (B1) 86% 85% 94% 85%
Building Class B B A B
Threshold Value: A class=90%,B class=80%,C class= -Occupant satisfaction survey results
Building

157
b. Centre for Energy and Environment Building, MNIT Jaipur
Measurement taken on 23rd June, 2017
Time slot for measurement are morning session (10.00am to 11.00am), afternoon session (2.00pm to 3.00pm) and evening session
(4.00pm to 5.00pm)
Color Code:A Class: GreenB Class: Purple C Class: RedOut of any class: Blue
threshold value Not specified 24.5+-2.5ᴼC 30-70% A class 17-31 <C onlyNot specified
Ambient+350/Ambient+500/Ambient+700 <15/<25/<25
at least 250 EMLis present within at leat 75% of work station/not for class C 0.7/0.7/- 3:1/-/-
A class=90%,B class=80%,C class= 80%
Room Code (Utility / Type)
Seating Code
Ambient Temperature( <C)
Operative temperature( <C) RH(%)
Floor surface temperature( <C)
Air velocity(m/s) CO2(ppm) PM2.5(ug/m3)
Illuminance (Lux)
Circadian Lighting Design (EML)
Uniformity of Illuminance within task area
ratio of illuminance task area to immediate surroundings
Percentage of the task area meeting
the required illuminance
S1 33.8 29.4 46 29.9 1.08 582 18 210 223 0.9 0.74
S2 33.8 23.2 44 30.1 0.54 535 17 312 331 0.98 1.08
S3 33.8 28.6 48 29.4 0.57 612 18 374 396 0.84 0.93
S1 33.8 33.1 58 33 0.62 469 21 245 260 0.95 0.94
S2 33.8 32.2 58 32.5 0.77 459 23 229 243 0.94 0.98
S3 33.8 31.9 54 32.2 0.98 513 20 292 309 0.97 1.14
S4 33.8 31.3 66 31.6 1.44 466 21 371 393 0.94 1.13
S1 33.8 30.9 48 31.7 1.37 503 19 268 284 0.92 1.01
S2 33.8 30.9 50 30.7 0.47 588 18 279 296 0.97 1.09
S3 33.8 29.5 50 30.3 1.43 620 18 290 307 0.91 0.94
B2F0R3 (shared office/ Air conditioned)
B2F0R2 (Laboratory, shared office / Mixed mode
B2F0R1 (shared office/ Air conditioned)
Indoor air qualityThermal Comfort
25
0
lighting comfort
67
Thermal Comfort Indoor Air quality Lighting comfort Acoustic ComfortCEE (B2) 84% 78% 74% 71%Building Class B - - -
Occupant satisfaction survey results Threshold Value: A class=90%,B class=80%,C class= -
Building

158
2. Results of July, 2017 (Monsoon) a. Old Administration Building, MNIT Jaipur Measurement taken from 24th July, 2017 to 31st July, 2017 Time slot for measurement are morning session (10.00am to 11.00am), afternoon session (2.00pm to 3.00pm) and evening session (4.00pm to 5.00pm)
Color Code:A Class: GreenB Class: Purple C Class: RedOut of any class: Red threshold
value Not specified 24.5+-2.5ᴼC 30-70%A class 17-31ᴼC only Not specifie
Ambient+350/Ambient+500/Ambient+700
A class=15, B class=25, C class=25
at least 250 EMLis present within at leat 75% of work station/not for class C
A class=0.7, B class= 0.7, C class= -
A class=3:1, B class= -, C class= -
Threshold Value: A class=90%,B class=80%,C class= -
Room Code (Utility/ type) Seating Code
Ambient Temperature(ᴼC)
Operative temperature(ᴼC) RH(%)
Floor surface temperature(ᴼC)
Air velocity(m/s) CO2(ppm)
PM2.5(ug/m3)
Illuminance (Lux)
Circadian Lighting Design (EML)
Uniformity of Illuminance within task area
ratio of illuminance task area to immediate surroundings
Percentage of the task area meeting
the required illuminance
S1 30.5 29.5 82 27.6 0.29 356 31 441 452 0.87 1.19S2 30.5 29.5 82 29.0 0.90 355 34 617 642 0.83 0.74S3 30.5 29.8 80 29.3 0.65 378 32 291 301 0.96 1.04S4 30.5 29.4 84 29.6 0.73 366 35 427 443 0.97 1.01S1 27.2 25.5 69 26.5 0.52 618 14 380 406 0.81 0.93S2 27.2 27 72 28.2 0.29 576 11 172 180 0.95 1.1S1 27.2 26.5 66 27.5 0.33 664 12 282 292 0.93 1.01S2 27.2 25.6 72 27.6 0.18 665 12 283 291 0.86 1S1 30 28.7 65 28.7 0.12 393 24 298 366 0.99 0.94S2 30 28.9 61 29.0 0.15 394 29 500 518 0.93 1.06S3 30 28.1 56 29.1 0.18 378 26 396 325 0.95 0.88S4 30 28.5 60 28.5 0.40 390 27 330 436 0.97 0.97S1 31.5 29.1 61 27.5 0.23 498 16 295 304 0.91 1.01S2 31.5 27.8 66 27.5 0.21 508 18 250 270 0.95 0.88S3 31.5 27.8 69 28.0 0.20 530 18 384 387 0.91 1.01S1 27.2 27.4 94 27.4 0.33 441 20 388 424 0.98 1.09S2 27.2 27.3 93 27.4 1.31 456 19 445 464 0.97 0.91S3 27.2 27.1 94 27.3 0.32 420 22 272 286 0.84 0.87S1 30.5 20.3 61 23.7 0.91 669 17 314 322 0.91 0.9S2 30.5 24.6 49 26.6 0.61 513 15 350 363 0.9 1.16S1 31.5 31.8 72 31.7 0.36 427 20 413 427 0.97 1.22S2 31.5 31.8 73 31.4 2.05 406 21 445 446 0.81 0.83S3 31.5 31.5 72 31.3 0.32 416 18 567 598 0.94 1.19S4 31.5 31.6 73 31.3 1.89 410 20 389 414 0.99 1.03
B1F2R11(shared office/ Air conditioned)
S4 30.5 30.2 79 30.6 1.16 417 31 378 392 0.97 0.95 100S1 30 31.5 71 31.5 0.94 387 37 136 138 0.97 1.03S2 30 31.6 70 31.4 0.51 385 38 138 166 0.96 1.02
75
0
67
100
100
0
0
Thermal Comfort
B1F2R6(shared office/ Air conditioned)
Indoor air quality
BIF2R1 (Laboratory/ Air conditioned)
B1F2R2(shared office/ Air conditioned)B1F2R3(individual office/ Air conditioned)
B1F2R4(Laboratory/ Air conditioned)
B1F2R8(Laboratory/ Air conditioned)
lighting comfort
75
50
B1F2R9(Laboratory/ Air conditioned)
B1F2R10 (shared office/ Mixed mode conditioned)
B1F2R12 (Waiting lobby/ naturally ventilated)
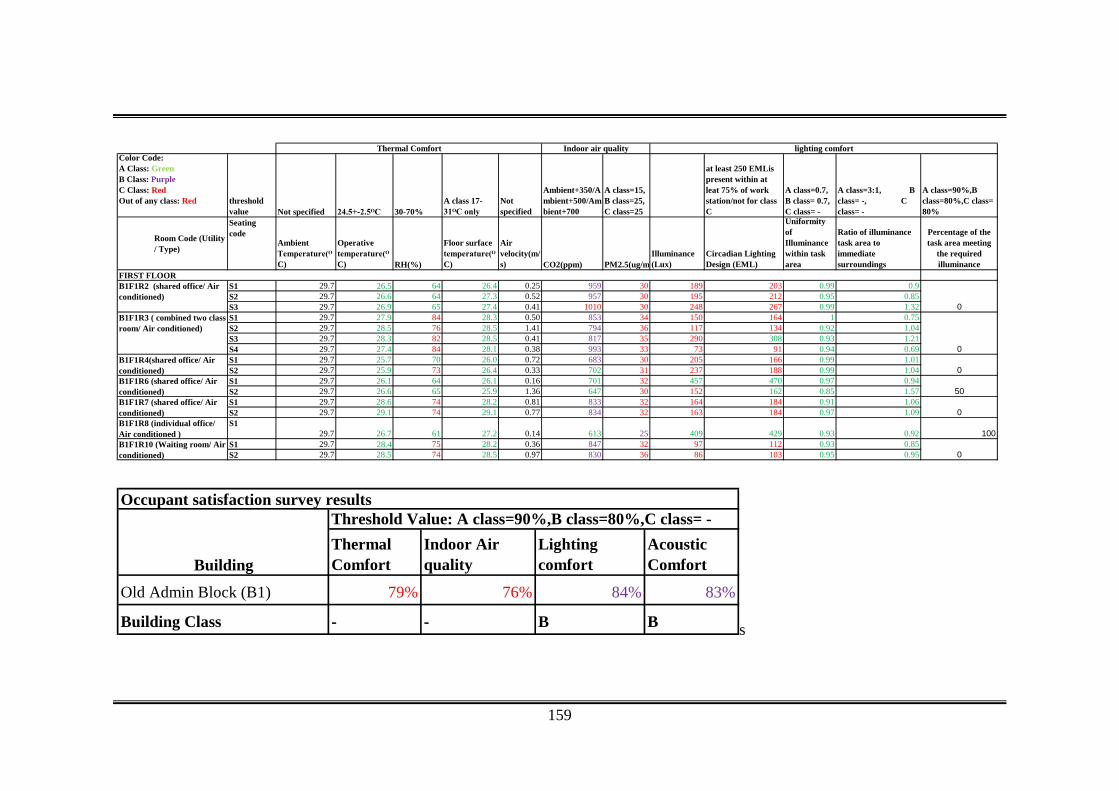
159
s
Color Code:A Class: GreenB Class: Purple C Class: RedOut of any class: Red threshold
value Not specified 24.5+-2.5ᴼC 30-70%A class 17-31ᴼC only
Not specified
Ambient+350/Ambient+500/Ambient+700
A class=15, B class=25, C class=25
at least 250 EMLis present within at leat 75% of work station/not for class C
A class=0.7, B class= 0.7, C class= -
A class=3:1, B class= -, C class= -
A class=90%,B class=80%,C class= 80%
Room Code (Utility / Type)
Seating code
Ambient Temperature(ᴼC)
Operative temperature(ᴼC) RH(%)
Floor surface temperature(ᴼC)
Air velocity(m/s) CO2(ppm) PM2.5(ug/m
Illuminance (Lux)
Circadian Lighting Design (EML)
Uniformity of Illuminance within task area
Ratio of illuminance task area to immediate surroundings
Percentage of the task area meeting
the required illuminance
S1 29.7 26.5 64 26.4 0.25 959 30 189 203 0.99 0.9S2 29.7 26.6 64 27.3 0.52 957 30 195 212 0.95 0.85S3 29.7 26.9 65 27.4 0.41 1010 30 248 267 0.99 1.32S1 29.7 27.9 84 28.3 0.50 853 34 150 164 1 0.75S2 29.7 28.5 76 28.5 1.41 794 36 117 134 0.92 1.04S3 29.7 28.3 82 28.5 0.41 817 35 290 308 0.93 1.21S4 29.7 27.4 84 28.1 0.38 993 33 73 91 0.94 0.69S1 29.7 25.7 70 26.0 0.72 683 30 205 166 0.99 1.01S2 29.7 25.9 73 26.4 0.33 702 31 237 188 0.99 1.04S1 29.7 26.1 64 26.1 0.16 701 32 457 470 0.97 0.94S2 29.7 26.6 65 25.9 1.36 647 30 152 162 0.85 1.57S1 29.7 28.6 74 28.2 0.81 833 32 164 184 0.91 1.06S2 29.7 29.1 74 29.1 0.77 834 32 163 184 0.97 1.09
B1F1R8 (individual office/ Air conditioned )
S129.7 26.7 61 27.2 0.14 613 25 409 429 0.93 0.92 100
S1 29.7 28.4 75 28.2 0.36 847 32 97 112 0.93 0.85S2 29.7 28.5 74 28.5 0.97 830 36 86 103 0.95 0.95
B1F1R7 (shared office/ Air conditioned) 0
B1F1R10 (Waiting room/ Air conditioned) 0
B1F1R3 ( combined two class room/ Air conditioned)
0B1F1R4(shared office/ Air conditioned) 0B1F1R6 (shared office/ Air conditioned) 50
Thermal Comfort Indoor air quality lighting comfort
FIRST FLOORB1F1R2 (shared office/ Air conditioned)
0
Thermal Comfort
Indoor Air quality
Lighting comfort
Acoustic Comfort
Old Admin Block (B1) 79% 76% 84% 83%
Building Class - - B B
Building
Occupant satisfaction survey results Threshold Value: A class=90%,B class=80%,C class= -
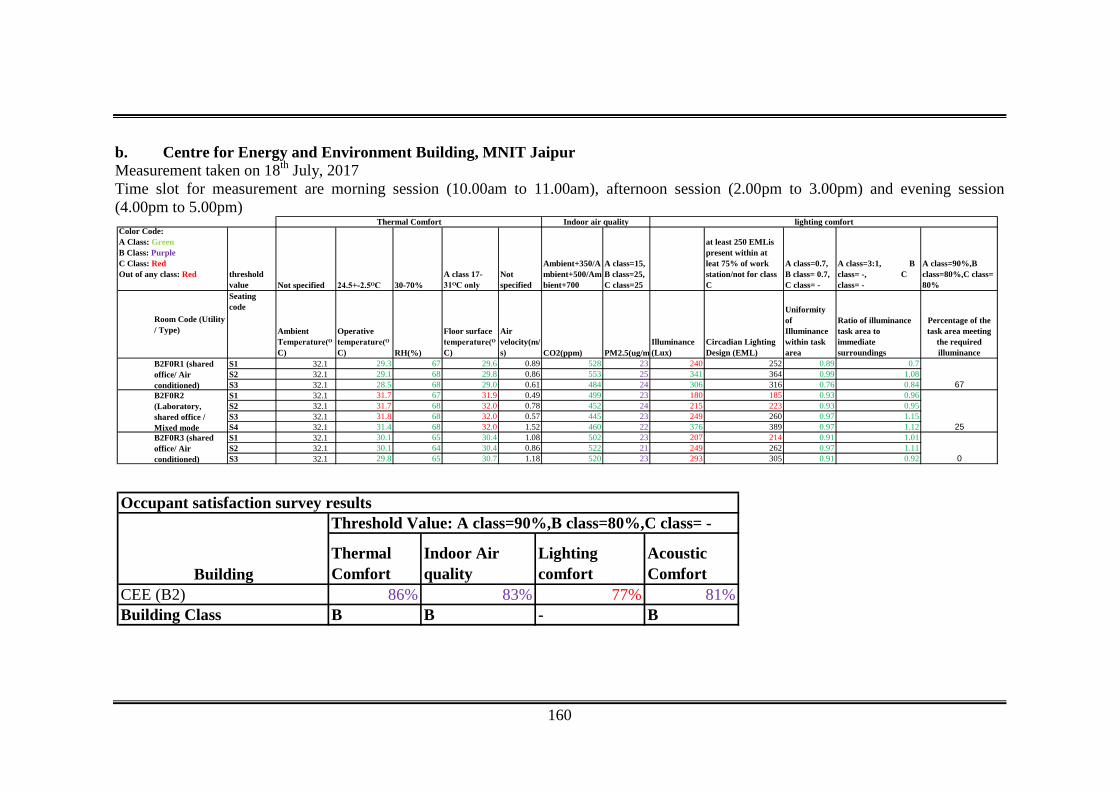
160
b. Centre for Energy and Environment Building, MNIT Jaipur Measurement taken on 18th July, 2017 Time slot for measurement are morning session (10.00am to 11.00am), afternoon session (2.00pm to 3.00pm) and evening session (4.00pm to 5.00pm)
Color Code:A Class: GreenB Class: Purple C Class: RedOut of any class: Red threshold
value Not specified 24.5+-2.5ᴼC 30-70%A class 17-31ᴼC only
Not specified
Ambient+350/Ambient+500/Ambient+700
A class=15, B class=25, C class=25
at least 250 EMLis present within at leat 75% of work station/not for class C
A class=0.7, B class= 0.7, C class= -
A class=3:1, B class= -, C class= -
A class=90%,B class=80%,C class= 80%
Room Code (Utility / Type)
Seating code
Ambient Temperature(ᴼC)
Operative temperature(ᴼC) RH(%)
Floor surface temperature(ᴼC)
Air velocity(m/s) CO2(ppm) PM2.5(ug/m
Illuminance (Lux)
Circadian Lighting Design (EML)
Uniformity of Illuminance within task area
Ratio of illuminance task area to immediate surroundings
Percentage of the task area meeting
the required illuminance
S1 32.1 29.3 67 29.6 0.89 528 23 240 252 0.89 0.7S2 32.1 29.1 68 29.8 0.86 553 25 341 364 0.99 1.08S3 32.1 28.5 68 29.0 0.61 484 24 306 316 0.76 0.84S1 32.1 31.7 67 31.9 0.49 499 23 180 185 0.93 0.96S2 32.1 31.7 68 32.0 0.78 452 24 215 223 0.93 0.95S3 32.1 31.8 68 32.0 0.57 445 23 249 260 0.97 1.15S4 32.1 31.4 68 32.0 1.52 460 22 376 389 0.97 1.12S1 32.1 30.1 65 30.4 1.08 502 23 207 214 0.91 1.01S2 32.1 30.1 64 30.4 0.86 522 21 249 262 0.97 1.11S3 32.1 29.8 65 30.7 1.18 520 23 293 305 0.91 0.92
67
25
B2F0R1 (shared office/ Air conditioned)B2F0R2 (Laboratory, shared office / Mixed mode B2F0R3 (shared office/ Air conditioned)
lighting comfort
0
Indoor air qualityThermal Comfort
Thermal Comfort
Indoor Air quality
Lighting comfort
Acoustic Comfort
CEE (B2) 86% 83% 77% 81%Building Class B B - B
Occupant satisfaction survey results
Building
Threshold Value: A class=90%,B class=80%,C class= -
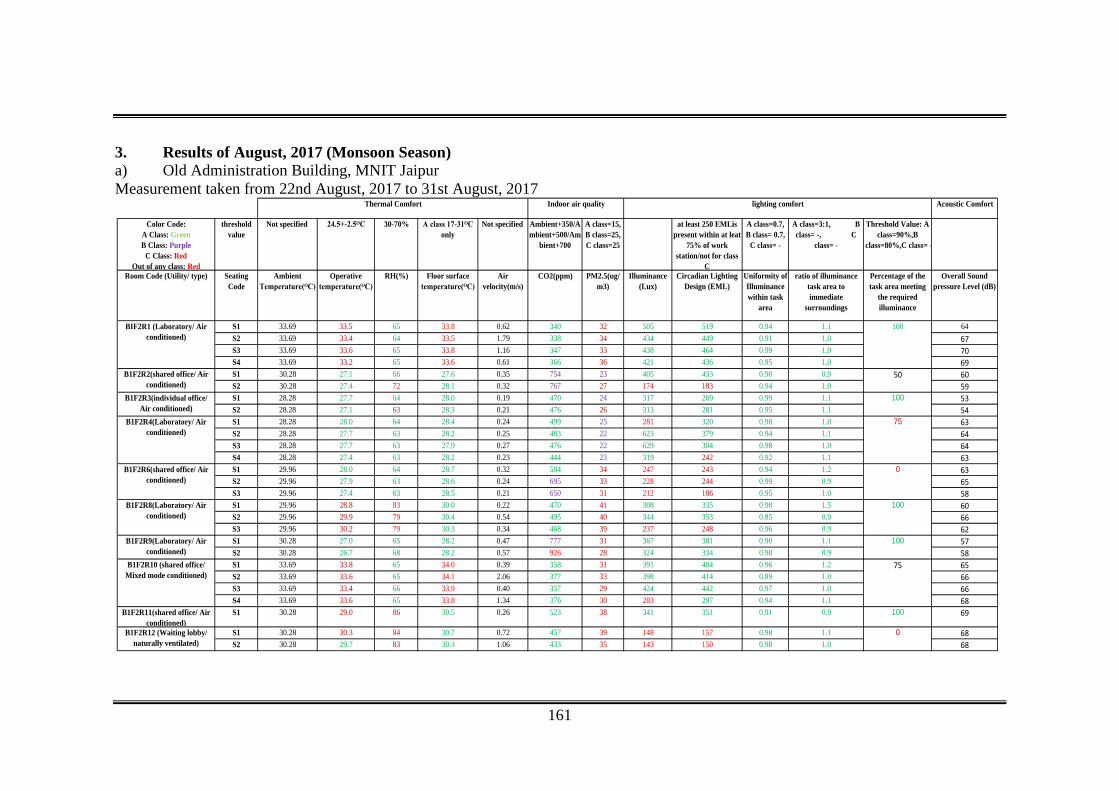
161
3. Results of August, 2017 (Monsoon Season) a) Old Administration Building, MNIT Jaipur Measurement taken from 22nd August, 2017 to 31st August, 2017
Acoustic Comfort
Color Code:A Class: GreenB Class: Purple
C Class: RedOut of any class: Red
threshold value
Not specified 24.5+-2.5ᴼC 30-70% A class 17-31ᴼC only
Not specified Ambient+350/Ambient+500/Am
bient+700
A class=15, B class=25, C class=25
at least 250 EMLis present within at leat
75% of work station/not for class
C
A class=0.7, B class= 0.7,
C class= -
A class=3:1, B class= -, C
class= -
Threshold Value: A class=90%,B
class=80%,C class= -
Room Code (Utility/ type) Seating Code
Ambient Temperature(ᴼC)
Operative temperature(ᴼC)
RH(%) Floor surface temperature(ᴼC)
Air velocity(m/s)
CO2(ppm) PM2.5(ug/m3)
Illuminance (Lux)
Circadian Lighting Design (EML)
Uniformity of Illuminance within task
area
ratio of illuminance task area to immediate
surroundings
Percentage of the task area meeting
the required illuminance
Overall Sound pressure Level (dB)
S1 33.69 33.5 65 33.8 0.62 340 32 505 519 0.94 1.1 64S2 33.69 33.4 64 33.5 1.79 338 34 434 449 0.91 1.0 67S3 33.69 33.6 65 33.8 1.16 347 33 438 464 0.99 1.0 70S4 33.69 33.2 65 33.6 0.61 366 36 421 436 0.95 1.0 69S1 30.28 27.1 66 27.6 0.35 754 23 405 433 0.90 0.9 60S2 30.28 27.4 72 28.1 0.32 767 27 174 183 0.94 1.0 59S1 28.28 27.7 64 28.0 0.19 470 24 317 269 0.99 1.1 53S2 28.28 27.1 63 28.3 0.21 476 26 313 281 0.95 1.1 54S1 28.28 28.0 64 28.4 0.24 499 25 281 320 0.98 1.0 63S2 28.28 27.7 63 28.2 0.25 483 22 623 379 0.94 1.1 64S3 28.28 27.7 63 27.9 0.27 476 22 629 304 0.98 1.0 64S4 28.28 27.4 63 28.2 0.23 444 23 319 242 0.92 1.1 63S1 29.96 28.0 64 28.7 0.32 584 34 247 243 0.94 1.2 63S2 29.96 27.9 63 28.6 0.24 695 33 228 244 0.99 0.9 65S3 29.96 27.4 63 28.5 0.21 650 31 212 186 0.95 1.0 58S1 29.96 28.8 83 30.0 0.22 470 41 308 335 0.98 1.5 60S2 29.96 29.9 79 30.4 0.54 495 40 344 353 0.85 0.9 66S3 29.96 30.2 79 30.3 0.34 468 39 237 248 0.96 0.9 62S1 30.28 27.0 65 28.2 0.47 777 31 367 381 0.90 1.1 57S2 30.28 26.7 68 28.2 0.57 926 28 324 334 0.98 0.9 58S1 33.69 33.8 65 34.0 0.39 358 31 391 404 0.96 1.2 65S2 33.69 33.6 65 34.1 2.06 377 33 398 414 0.89 1.0 66S3 33.69 33.4 66 33.9 0.40 357 29 424 442 0.97 1.0 66S4 33.69 33.6 65 33.8 1.34 376 30 283 297 0.94 1.1 68
B1F2R11(shared office/ Air conditioned)
S1 30.28 29.0 86 30.5 0.26 523 38 341 351 0.91 0.9 100 69
S1 30.28 30.3 84 30.7 0.72 457 39 148 157 0.98 1.1 68S2 30.28 29.7 83 30.3 1.06 433 35 143 150 0.98 1.0 68
B1F2R9(Laboratory/ Air conditioned)
100
B1F2R10 (shared office/ Mixed mode conditioned)
75
B1F2R12 (Waiting lobby/ naturally ventilated)
0
B1F2R4(Laboratory/ Air conditioned)
75
B1F2R6(shared office/ Air conditioned)
0
B1F2R8(Laboratory/ Air conditioned)
100
100
Thermal Comfort Indoor air quality lighting comfort
BIF2R1 (Laboratory/ Air conditioned)
100
B1F2R2(shared office/ Air conditioned)
50
B1F2R3(individual office/ Air conditioned)
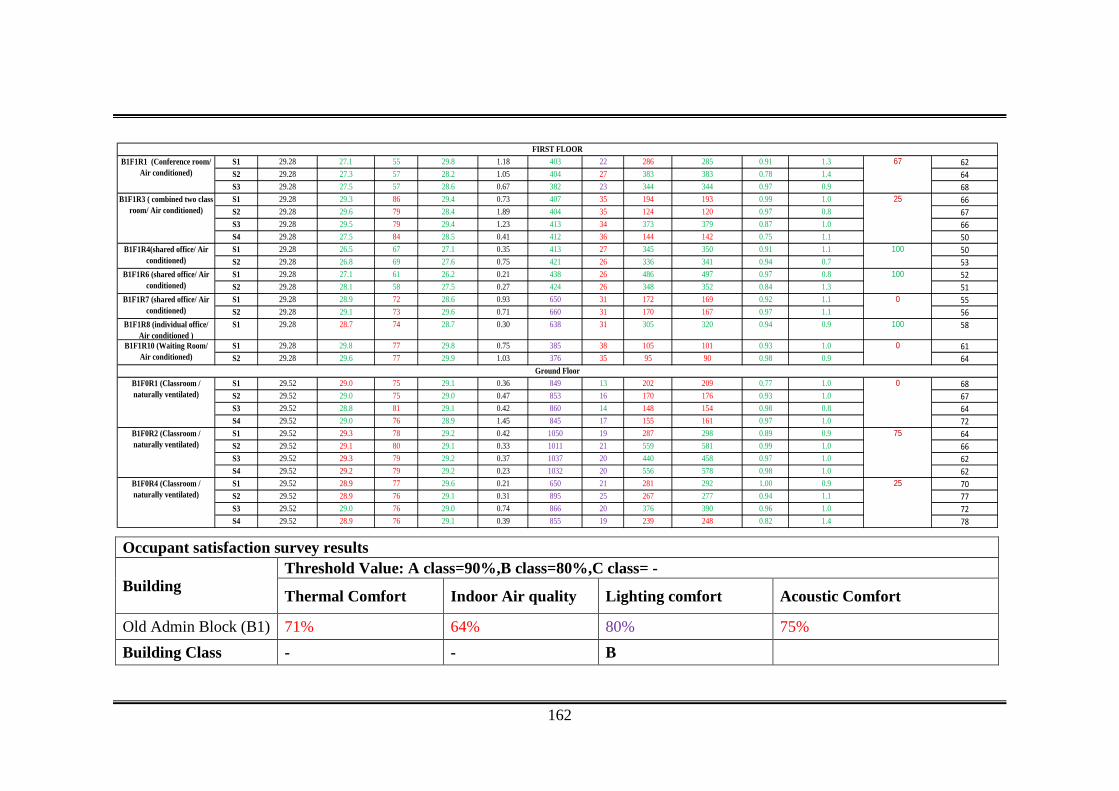
162
Occupant satisfaction survey results
Building Threshold Value: A class=90%,B class=80%,C class= -
Thermal Comfort Indoor Air quality Lighting comfort Acoustic Comfort
Old Admin Block (B1) 71% 64% 80% 75% Building Class - - B
S1 29.28 27.1 55 29.8 1.18 403 22 286 285 0.91 1.3 62S2 29.28 27.3 57 28.2 1.05 404 27 383 383 0.78 1.4 64S3 29.28 27.5 57 28.6 0.67 382 23 344 344 0.97 0.9 68S1 29.28 29.3 86 29.4 0.73 407 35 194 193 0.99 1.0 66S2 29.28 29.6 79 28.4 1.89 404 35 124 120 0.97 0.8 67S3 29.28 29.5 79 29.4 1.23 413 34 373 379 0.87 1.0 66S4 29.28 27.5 84 28.5 0.41 412 36 144 142 0.75 1.1 50S1 29.28 26.5 67 27.1 0.35 413 27 345 350 0.91 1.1 50S2 29.28 26.8 69 27.6 0.75 421 26 336 341 0.94 0.7 53S1 29.28 27.1 61 26.2 0.21 438 26 486 497 0.97 0.8 52S2 29.28 28.1 58 27.5 0.27 424 26 348 352 0.84 1.3 51S1 29.28 28.9 72 28.6 0.93 650 31 172 169 0.92 1.1 55S2 29.28 29.1 73 29.6 0.71 660 31 170 167 0.97 1.1 56
B1F1R8 (individual office/ Air conditioned )
S1 29.28 28.7 74 28.7 0.30 638 31 305 320 0.94 0.9 100 58
S1 29.28 29.8 77 29.8 0.75 385 38 105 101 0.93 1.0 61S2 29.28 29.6 77 29.9 1.03 376 35 95 90 0.98 0.9 64
S1 29.52 29.0 75 29.1 0.36 849 13 202 209 0.77 1.0 68S2 29.52 29.0 75 29.0 0.47 853 16 170 176 0.93 1.0 67S3 29.52 28.8 81 29.1 0.42 860 14 148 154 0.98 0.8 64S4 29.52 29.0 76 28.9 1.45 845 17 155 161 0.97 1.0 72S1 29.52 29.3 78 29.2 0.42 1050 19 287 298 0.89 0.9 64S2 29.52 29.1 80 29.1 0.33 1011 21 559 581 0.99 1.0 66S3 29.52 29.3 79 29.2 0.37 1037 20 440 458 0.97 1.0 62S4 29.52 29.2 79 29.2 0.23 1032 20 556 578 0.98 1.0 62S1 29.52 28.9 77 29.6 0.21 650 21 281 292 1.00 0.9 70S2 29.52 28.9 76 29.1 0.31 895 25 267 277 0.94 1.1 77S3 29.52 29.0 76 29.0 0.74 866 20 376 390 0.96 1.0 72S4 29.52 28.9 76 29.1 0.39 855 19 239 248 0.82 1.4 78
Ground FloorB1F0R1 (Classroom / naturally ventilated)
0
B1F0R2 (Classroom / naturally ventilated)
75
B1F0R4 (Classroom / naturally ventilated)
25
B1F1R6 (shared office/ Air conditioned)
100
B1F1R7 (shared office/ Air conditioned)
0
B1F1R10 (Waiting Room/ Air conditioned)
0
B1F1R4(shared office/ Air conditioned)
100
FIRST FLOORB1F1R1 (Conference room/
Air conditioned) 67
B1F1R3 ( combined two class room/ Air conditioned)
25

163
b) Centre for Energy and Environment Building, MNIT Jaipur • Measurement taken on 18th August, 2017 Time slot for measurement are morning session (10.00am to 11.00am), afternoon session (2.00pm to 3.00pm) and evening session (4.00pm to 5.00pm)
Acoustic ComfortColor Code:
A Class: GreenB Class: Purple
C Class: RedOut of any class: Red
threshold value
Not specified 24.5+-2.5ᴼC 30-70% A class 17-31ᴼC only
Not specified Ambient+350/Ambient+500/Am
bient+700
A class=15, B class=25, C class=25
at least 250 EMLis present within at leat
75% of work station/not for class
C
A class=0.7, B class= 0.7,
C class= -
A class=3:1, B class= -, C
class= -
A class=90%,B class=80%,C class=
80%
Room Code (Utility / Type) Seating code Ambient Temperature(ᴼC)
Operative temperature(ᴼC)
RH(%) Floor surface temperature(ᴼC)
Air velocity(m/s)
CO2(ppm) PM2.5(ug/m3 Illuminance (Lux)
Circadian Lighting Design (EML)
Uniformity of Illuminance within task
area
Ratio of illuminance task area to immediate
surroundings
Percentage of the task area meeting
the required illuminance
Overall Sound pressure Level (dB)
S1 34.19 28.3 45 29.4 0.75 560 27 240 254 0.82 0.9 65S2 34.19 28.1 44 28.7 0.54 577 26 292 310 0.87 1.1 63S3 34.19 27.5 44 28.8 0.30 586 22 321 333 0.83 0.9 62S1 34.19 34.0 50 32.5 0.47 507 26 190 195 0.94 1.0 68S2 34.19 33.5 50 34.1 0.47 476 29 254 263 0.89 0.9 69S3 34.19 33.7 50 34.0 0.72 484 30 238 247 0.94 1.0 68S4 34.19 32.1 51 33.6 1.18 470 30 272 279 0.92 1.0 66S1 34.19 29.5 53 31.3 0.30 512 27 311 328 0.81 0.9 63S2 34.19 30.6 50 31.5 1.52 490 31 394 422 0.95 1.1 64S3 34.19 30.7 49 32.5 1.52 488 32 289 297 0.91 0.8 65
Occupant satisfaction survey results Building Threshold Value: A class=90%,B class=80%,C class= -
Thermal Comfort
Indoor Air quality
Lighting comfort Acoustic Comfort
CEE (B2) 80% 83% 61% 82%Building Class B B - B
B2F0R2 (Laboratory, shared office / Mixed mode
conditioned)
0
B2F0R3 (shared office/ Air conditioned)
67
Thermal Comfort Indoor air quality lighting comfort
B2F0R1 (shared office/ Air conditioned)
33
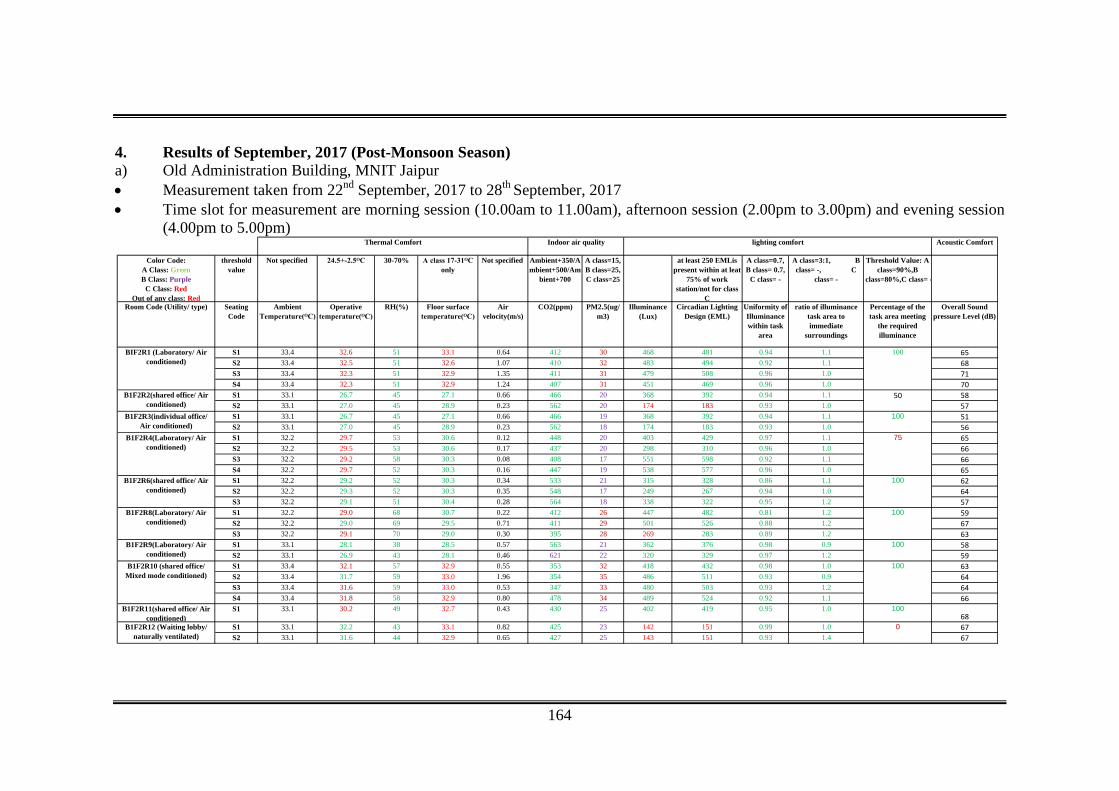
164
4. Results of September, 2017 (Post-Monsoon Season) a) Old Administration Building, MNIT Jaipur • Measurement taken from 22nd September, 2017 to 28th September, 2017 • Time slot for measurement are morning session (10.00am to 11.00am), afternoon session (2.00pm to 3.00pm) and evening session
(4.00pm to 5.00pm)
Acoustic Comfort
Color Code:A Class: GreenB Class: Purple
C Class: RedOut of any class: Red
threshold value
Not specified 24.5+-2.5ᴼC 30-70% A class 17-31ᴼC only
Not specified Ambient+350/Ambient+500/Am
bient+700
A class=15, B class=25, C class=25
at least 250 EMLis present within at leat
75% of work station/not for class
C
A class=0.7, B class= 0.7,
C class= -
A class=3:1, B class= -, C
class= -
Threshold Value: A class=90%,B
class=80%,C class= -
Room Code (Utility/ type) Seating Code
Ambient Temperature(ᴼC)
Operative temperature(ᴼC)
RH(%) Floor surface temperature(ᴼC)
Air velocity(m/s)
CO2(ppm) PM2.5(ug/m3)
Illuminance (Lux)
Circadian Lighting Design (EML)
Uniformity of Illuminance within task
area
ratio of illuminance task area to immediate
surroundings
Percentage of the task area meeting
the required illuminance
Overall Sound pressure Level (dB)
S1 33.4 32.6 51 33.1 0.64 412 30 468 481 0.94 1.1 65S2 33.4 32.5 51 32.6 1.07 410 32 483 494 0.92 1.1 68S3 33.4 32.3 51 32.9 1.35 411 31 479 508 0.96 1.0 71S4 33.4 32.3 51 32.9 1.24 407 31 451 469 0.96 1.0 70S1 33.1 26.7 45 27.1 0.66 466 20 368 392 0.94 1.1 58S2 33.1 27.0 45 28.9 0.23 562 20 174 183 0.93 1.0 57S1 33.1 26.7 45 27.1 0.66 466 19 368 392 0.94 1.1 51S2 33.1 27.0 45 28.9 0.23 562 18 174 183 0.93 1.0 56S1 32.2 29.7 53 30.6 0.12 448 20 403 429 0.97 1.1 65S2 32.2 29.5 53 30.6 0.17 437 20 298 310 0.96 1.0 66S3 32.2 29.2 58 30.3 0.08 408 17 551 598 0.92 1.1 66S4 32.2 29.7 52 30.3 0.16 447 19 538 577 0.96 1.0 65S1 32.2 29.2 52 30.3 0.34 533 21 315 328 0.86 1.1 62S2 32.2 29.3 52 30.3 0.35 548 17 249 267 0.94 1.0 64S3 32.2 29.1 51 30.4 0.28 564 18 338 322 0.95 1.2 57S1 32.2 29.0 68 30.7 0.22 412 26 447 482 0.81 1.2 59S2 32.2 29.0 69 29.5 0.71 411 29 501 526 0.88 1.2 67S3 32.2 29.1 70 29.0 0.30 395 28 269 283 0.89 1.2 63S1 33.1 28.1 38 28.5 0.57 563 21 362 376 0.98 0.9 58S2 33.1 26.9 43 28.1 0.46 621 22 320 329 0.97 1.2 59S1 33.4 32.1 57 32.9 0.55 353 32 418 432 0.98 1.0 63S2 33.4 31.7 59 33.0 1.96 354 35 486 511 0.93 0.9 64S3 33.4 31.6 59 33.0 0.53 347 33 480 503 0.93 1.2 64S4 33.4 31.8 58 32.9 0.80 478 34 489 524 0.92 1.1 66
B1F2R11(shared office/ Air conditioned)
S1 33.1 30.2 49 32.7 0.43 430 25 402 419 0.95 1.0 10068
S1 33.1 32.2 43 33.1 0.82 425 23 142 151 0.99 1.0 67S2 33.1 31.6 44 32.9 0.65 427 25 143 151 0.93 1.4 67
B1F2R6(shared office/ Air conditioned)
100
B1F2R8(Laboratory/ Air conditioned)
100
B1F2R9(Laboratory/ Air conditioned)
100
B1F2R10 (shared office/ Mixed mode conditioned)
100
B1F2R12 (Waiting lobby/ naturally ventilated)
0
B1F2R2(shared office/ Air conditioned)
50
B1F2R3(individual office/ Air conditioned)
100
B1F2R4(Laboratory/ Air conditioned)
75
BIF2R1 (Laboratory/ Air conditioned)
100
Thermal Comfort Indoor air quality lighting comfort
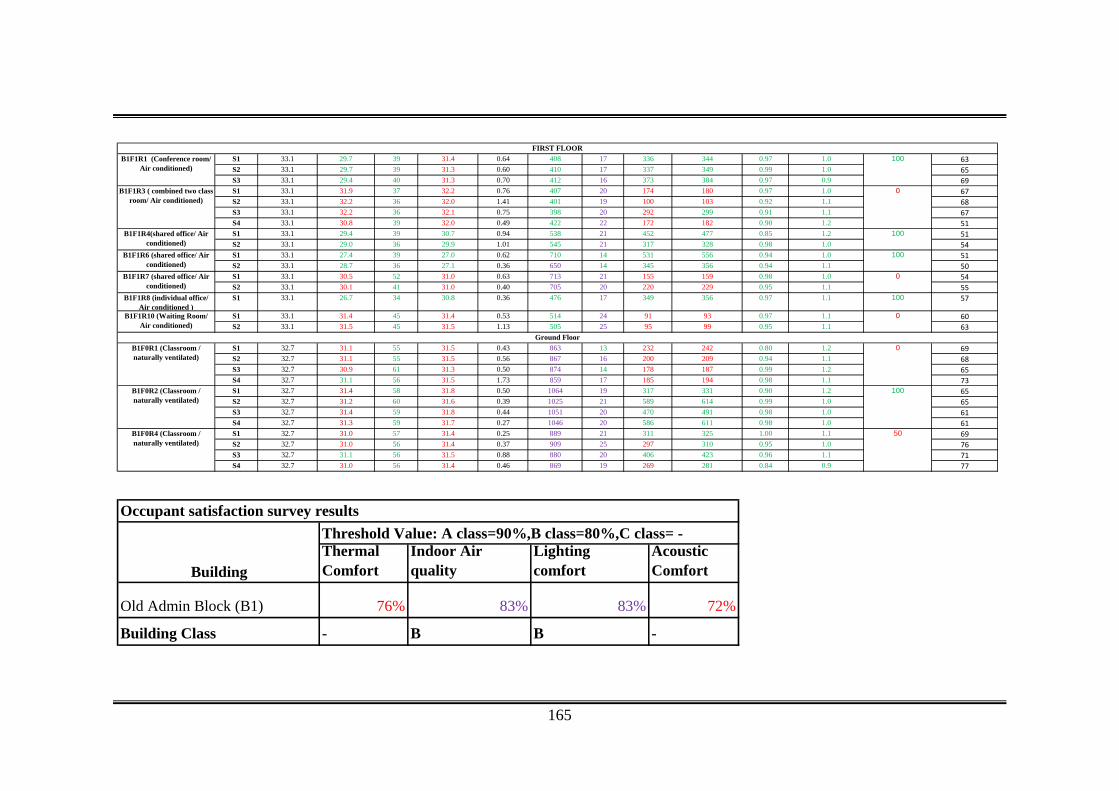
165
S1 33.1 29.7 39 31.4 0.64 408 17 336 344 0.97 1.0 63S2 33.1 29.7 39 31.3 0.60 410 17 337 349 0.99 1.0 65S3 33.1 29.4 40 31.3 0.70 412 16 373 384 0.97 0.9 69S1 33.1 31.9 37 32.2 0.76 407 20 174 180 0.97 1.0 67S2 33.1 32.2 36 32.0 1.41 401 19 100 103 0.92 1.1 68S3 33.1 32.2 36 32.1 0.75 398 20 292 299 0.91 1.1 67S4 33.1 30.8 39 32.0 0.49 422 22 172 182 0.90 1.2 51S1 33.1 29.4 39 30.7 0.94 538 21 452 477 0.85 1.2 51S2 33.1 29.0 36 29.9 1.01 545 21 317 328 0.98 1.0 54S1 33.1 27.4 39 27.0 0.62 710 14 531 556 0.94 1.0 51S2 33.1 28.7 36 27.1 0.36 650 14 345 356 0.94 1.1 50S1 33.1 30.5 52 31.0 0.63 713 21 155 159 0.98 1.0 54S2 33.1 30.1 41 31.0 0.40 705 20 220 229 0.95 1.1 55
B1F1R8 (individual office/ Air conditioned )
S1 33.1 26.7 34 30.8 0.36 476 17 349 356 0.97 1.1 100 57
S1 33.1 31.4 45 31.4 0.53 514 24 91 93 0.97 1.1 60S2 33.1 31.5 45 31.5 1.13 505 25 95 99 0.95 1.1 63
S1 32.7 31.1 55 31.5 0.43 863 13 232 242 0.80 1.2 69S2 32.7 31.1 55 31.5 0.56 867 16 200 209 0.94 1.1 68S3 32.7 30.9 61 31.3 0.50 874 14 178 187 0.99 1.2 65S4 32.7 31.1 56 31.5 1.73 859 17 185 194 0.98 1.1 73S1 32.7 31.4 58 31.8 0.50 1064 19 317 331 0.90 1.2 65S2 32.7 31.2 60 31.6 0.39 1025 21 589 614 0.99 1.0 65S3 32.7 31.4 59 31.8 0.44 1051 20 470 491 0.98 1.0 61S4 32.7 31.3 59 31.7 0.27 1046 20 586 611 0.98 1.0 61S1 32.7 31.0 57 31.4 0.25 889 21 311 325 1.00 1.1 69S2 32.7 31.0 56 31.4 0.37 909 25 297 310 0.95 1.0 76S3 32.7 31.1 56 31.5 0.88 880 20 406 423 0.96 1.1 71S4 32.7 31.0 56 31.4 0.46 869 19 269 281 0.84 0.9 77
B1F1R7 (shared office/ Air conditioned)
0
B1F1R10 (Waiting Room/ Air conditioned)
0
Ground FloorB1F0R1 (Classroom / naturally ventilated)
0
B1F0R2 (Classroom / naturally ventilated)
100
B1F0R4 (Classroom / naturally ventilated)
50
B1F1R3 ( combined two class room/ Air conditioned)
0
B1F1R4(shared office/ Air conditioned)
100
B1F1R6 (shared office/ Air conditioned)
100
B1F1R1 (Conference room/ Air conditioned)
100FIRST FLOOR
Thermal Comfort
Indoor Air quality
Lighting comfort
Acoustic Comfort
Old Admin Block (B1) 76% 83% 83% 72%
Building Class - B B -
Building
Threshold Value: A class=90%,B class=80%,C class= -Occupant satisfaction survey results
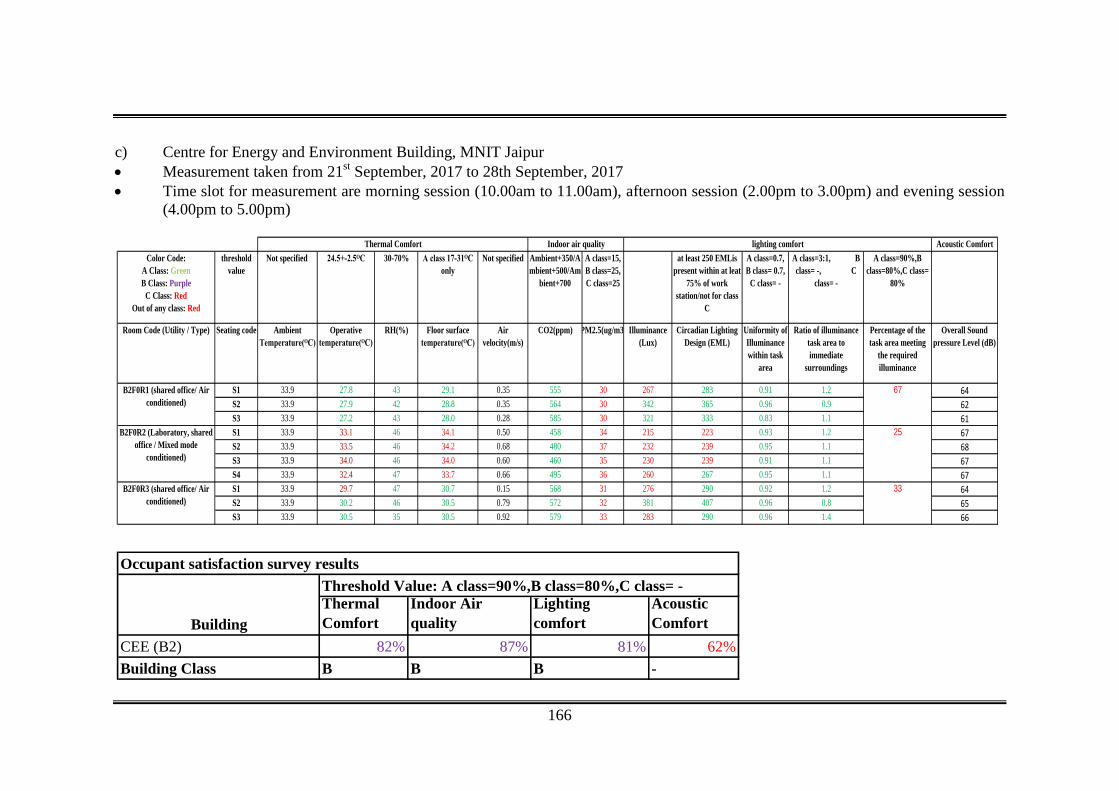
166
c) Centre for Energy and Environment Building, MNIT Jaipur • Measurement taken from 21st September, 2017 to 28th September, 2017 • Time slot for measurement are morning session (10.00am to 11.00am), afternoon session (2.00pm to 3.00pm) and evening session
(4.00pm to 5.00pm)
Acoustic ComfortColor Code:
A Class: GreenB Class: Purple
C Class: RedOut of any class: Red
threshold value
Not specified 24.5+-2.5ᴼC 30-70% A class 17-31ᴼC only
Not specified Ambient+350/Ambient+500/Am
bient+700
A class=15, B class=25, C class=25
at least 250 EMLis present within at leat
75% of work station/not for class
C
A class=0.7, B class= 0.7,
C class= -
A class=3:1, B class= -, C
class= -
A class=90%,B class=80%,C class=
80%
Room Code (Utility / Type) Seating code Ambient Temperature(ᴼC)
Operative temperature(ᴼC)
RH(%) Floor surface temperature(ᴼC)
Air velocity(m/s)
CO2(ppm) PM2.5(ug/m3 Illuminance (Lux)
Circadian Lighting Design (EML)
Uniformity of Illuminance within task
area
Ratio of illuminance task area to immediate
surroundings
Percentage of the task area meeting
the required illuminance
Overall Sound pressure Level (dB)
S1 33.9 27.8 43 29.1 0.35 555 30 267 283 0.91 1.2 64S2 33.9 27.9 42 28.8 0.35 564 30 342 365 0.96 0.9 62S3 33.9 27.2 43 28.0 0.28 585 30 321 333 0.83 1.1 61S1 33.9 33.1 46 34.1 0.50 458 34 215 223 0.93 1.2 67S2 33.9 33.5 46 34.2 0.68 480 37 232 239 0.95 1.1 68S3 33.9 34.0 46 34.0 0.60 460 35 230 239 0.91 1.1 67S4 33.9 32.4 47 33.7 0.66 495 36 260 267 0.95 1.1 67S1 33.9 29.7 47 30.7 0.15 568 31 276 290 0.92 1.2 64S2 33.9 30.2 46 30.5 0.79 572 32 381 407 0.96 0.8 65S3 33.9 30.5 35 30.5 0.92 579 33 283 290 0.96 1.4 66
Indoor air quality lighting comfort
B2F0R1 (shared office/ Air conditioned)
67
B2F0R2 (Laboratory, shared office / Mixed mode
conditioned)
25
Thermal Comfort
B2F0R3 (shared office/ Air conditioned)
33
Thermal Comfort
Indoor Air quality
Lighting comfort
Acoustic Comfort
CEE (B2) 82% 87% 81% 62%Building Class B B B -
Occupant satisfaction survey results
Building
Threshold Value: A class=90%,B class=80%,C class= -

167
5. Results of October, 2017 (Moderate Season) a) Old Administration Building, MNIT Jaipur • Measurement taken from 25th October, 2017 to 31st October, 2017
Acoustic Comfort
Color Code:A Class: GreenB Class: Purple
C Class: RedOut of any class: Red
threshold value
Not specified 24.5+-2.5ᴼC 30-70% A class 17-31ᴼC only
Not specified Ambient+350/Ambient+500/Am
bient+700
A class<15, B class<25, C class<25
A class<50, B class<100, C class<100
at least 250 EMLis present within at leat
75% of work station/not for class C
A class>0.7, B class> 0.7,
C class= -
A class<3:1, B class= -, C class= -
A class>90%,B class>80%,C class> 80%
Room Code (Utility/ type) Seating Code
Ambient Temperature(ᴼC)
Operative temperature(ᴼC)
RH(%) Floor surface temperature(ᴼC)
Air velocity(m/s)
CO2(ppm) PM2.5(ug/m3) PM10(ug/m3) Illuminance (Lux)
Circadian Lighting Design (EML)
Uniformity of Illuminance
within task area
Ratio of illuminance task area to immediate
surroundings
Percentage of the task area meeting
the required illuminance
Overall Sound (dB)
S1 31.3 30.6 34 30.5 0.67 400 64 140 340 357 0.91 0.9 60S2 31.3 30.0 33 30.0 0.92 403 60 128 419 432 0.93 0.9 67S3 31.3 30.0 34 29.9 1.14 409 62 132 403 425 0.96 1.0 66S4 31.3 29.8 33 30.0 0.94 428 63 134 395 407 0.95 1.0 66S1 30.4 28.5 35 28.8 0.37 443 64 131 172 180 1.00 1.0 59S2 30.4 28.5 36 28.4 0.73 454 53 111 363 387 0.96 0.9 59S1 30.4 27.4 43 29.0 0.62 459 52 99 342 354 0.94 1.0 62S2 30.4 27.4 43 28.9 0.46 446 47 110 345 358 0.91 1.0 62S1 30.6 29.1 38 28.5 0.07 471 68 135 277 291 0.97 1.0 58S2 30.6 29.0 37 28.4 0.09 503 70 122 593 646 0.92 1.0 52S3 30.6 29.1 39 28.4 0.12 523 68 123 682 736 0.96 0.9 53S4 30.6 29.0 38 28.4 0.15 502 74 145 312 326 0.96 1.0 51S1 30.6 27.4 35 25.6 0.29 531 63 125 494 544 0.95 1.0 58S2 30.6 20.9 36 27.1 0.22 529 65 138 322 354 0.97 1.0 60S3 30.6 27.6 36 27.3 0.21 536 62 118 553 608 0.98 1.0 60S1 30.6 29.7 35 30.0 0.31 477 63 121 411 439 0.97 0.9 62S2 30.6 28.9 36 30.0 1.19 508 65 129 557 610 0.94 1.0 62S3 30.6 29.4 36 28.5 0.26 508 65 125 395 409 0.98 1.0 63S1 25.9 39 29.0 0.71 460 57 110 362 386 0.94 1.0 63S2 25.9 39 28.9 0.55 474 59 112 365 384 0.92 1.0 63S1 31.3 30.6 41 31.1 0.52 384 66 143 353 370 0.93 1.0 65S2 31.3 30.4 43 31.1 1.93 393 64 134 430 452 0.93 1.0 59S3 31.3 30.2 44 31.0 0.50 408 65 136 398 421 0.95 1.0 59S4 31.3 30.5 42 31.1 0.77 389 63 130 466 499 0.91 0.9 60
B1F2R11(shared office/ Air conditioned)
S1 30.4 28.4 34 28.7 0.56 469 51 104 343 354 0.96 0.9 100 59
S1 30.4 28.3 34 28.9 0.84 459 61 120 129 135 0.92 1.0 60S2 30.4 28.4 35 28.8 0.53 446 56 109 118 124 0.97 1.0 62
BIF2R1 (Laboratory/ Air conditioned)
100
Thermal Comfort Indoor air quality lighting comfort
B1F2R2(shared office/ Air conditioned)
50
B1F2R3(individual office/ Air conditioned)
100
B1F2R4(Laboratory/ Air conditioned)
100
B1F2R6(shared office/ Air conditioned)
100
B1F2R8(Laboratory/ Air conditioned)
100
B1F2R9(Laboratory/ Air conditioned)
100
B1F2R10 (shared office/ Mixed mode conditioned)
100
B1F2R12 (Waiting lobby/ naturally ventilated)
0
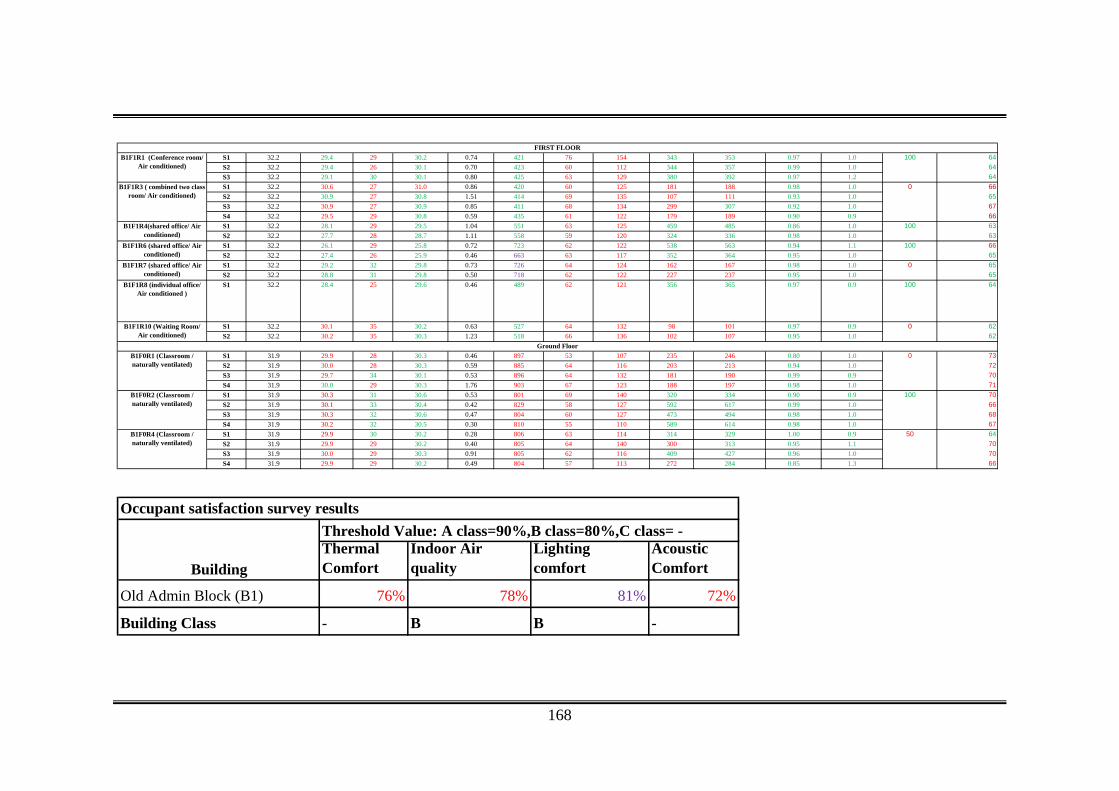
168
S1 32.2 29.4 29 30.2 0.74 421 76 154 343 353 0.97 1.0 64S2 32.2 29.4 26 30.1 0.70 423 60 112 344 357 0.99 1.0 64S3 32.2 29.1 30 30.1 0.80 425 63 129 380 392 0.97 1.2 64S1 32.2 30.6 27 31.0 0.86 420 60 125 181 188 0.98 1.0 66S2 32.2 30.9 27 30.8 1.51 414 69 135 107 111 0.93 1.0 65S3 32.2 30.9 27 30.9 0.85 411 68 134 299 307 0.92 1.0 67S4 32.2 29.5 29 30.8 0.59 435 61 122 179 189 0.90 0.9 66S1 32.2 28.1 29 29.5 1.04 551 63 125 459 485 0.86 1.0 63S2 32.2 27.7 28 28.7 1.11 558 59 120 324 336 0.98 1.0 63S1 32.2 26.1 29 25.8 0.72 723 62 122 538 563 0.94 1.1 66S2 32.2 27.4 26 25.9 0.46 663 63 117 352 364 0.95 1.0 65S1 32.2 29.2 32 29.8 0.73 726 64 124 162 167 0.98 1.0 65S2 32.2 28.8 31 29.8 0.50 718 62 122 227 237 0.95 1.0 65
B1F1R8 (individual office/ Air conditioned )
S1 32.2 28.4 25 29.6 0.46 489 62 121 356 365 0.97 0.9 100 64
S1 32.2 30.1 35 30.2 0.63 527 64 132 98 101 0.97 0.9 62S2 32.2 30.2 35 30.3 1.23 518 66 136 102 107 0.95 1.0 62
S1 31.9 29.9 28 30.3 0.46 897 53 107 235 246 0.80 1.0 73S2 31.9 30.0 28 30.3 0.59 885 64 116 203 213 0.94 1.0 72S3 31.9 29.7 34 30.1 0.53 896 64 132 181 190 0.99 0.9 70S4 31.9 30.0 29 30.3 1.76 903 67 123 188 197 0.98 1.0 71S1 31.9 30.3 31 30.6 0.53 801 69 140 320 334 0.90 0.9 70S2 31.9 30.1 33 30.4 0.42 829 58 127 592 617 0.99 1.0 66S3 31.9 30.3 32 30.6 0.47 804 60 127 473 494 0.98 1.0 68S4 31.9 30.2 32 30.5 0.30 810 55 110 589 614 0.98 1.0 67S1 31.9 29.9 30 30.2 0.28 806 63 114 314 329 1.00 0.9 64S2 31.9 29.9 29 30.2 0.40 805 64 140 300 313 0.95 1.1 70S3 31.9 30.0 29 30.3 0.91 805 62 116 409 427 0.96 1.0 70S4 31.9 29.9 29 30.2 0.49 804 57 113 272 284 0.85 1.3 66
B1F1R1 (Conference room/ Air conditioned)
100FIRST FLOOR
B1F1R3 ( combined two class room/ Air conditioned)
0
B1F1R4(shared office/ Air conditioned)
100
B1F1R6 (shared office/ Air conditioned)
100
B1F1R7 (shared office/ Air conditioned)
0
B1F1R10 (Waiting Room/ Air conditioned)
0
Ground FloorB1F0R1 (Classroom / naturally ventilated)
0
B1F0R2 (Classroom / naturally ventilated)
100
B1F0R4 (Classroom / naturally ventilated)
50
Thermal Comfort
Indoor Air quality
Lighting comfort
Acoustic Comfort
Old Admin Block (B1) 76% 78% 81% 72%
Building Class - B B -
Building
Threshold Value: A class=90%,B class=80%,C class= -Occupant satisfaction survey results
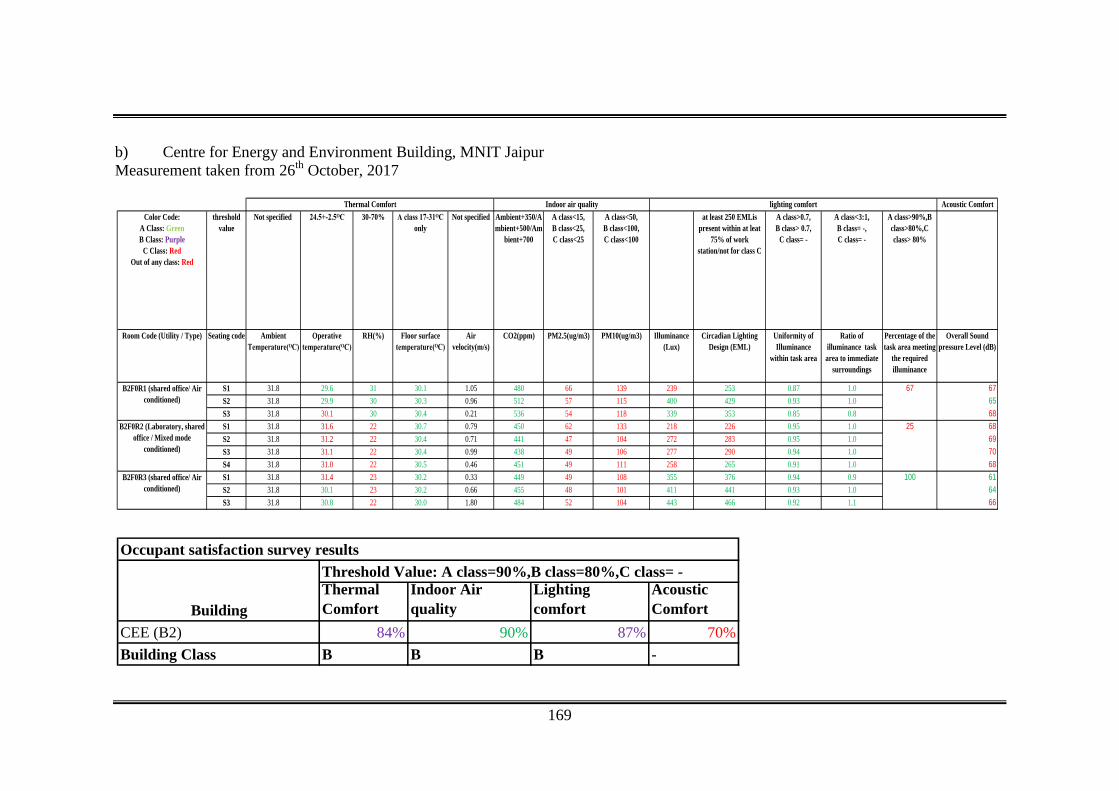
169
b) Centre for Energy and Environment Building, MNIT Jaipur Measurement taken from 26th October, 2017
Acoustic ComfortColor Code:
A Class: GreenB Class: Purple
C Class: RedOut of any class: Red
threshold value
Not specified 24.5+-2.5ᴼC 30-70% A class 17-31ᴼC only
Not specified Ambient+350/Ambient+500/Am
bient+700
A class<15, B class<25, C class<25
A class<50, B class<100, C class<100
at least 250 EMLis present within at leat
75% of work station/not for class C
A class>0.7, B class> 0.7,
C class= -
A class<3:1, B class= -, C class= -
A class>90%,B class>80%,C class> 80%
Room Code (Utility / Type) Seating code Ambient Temperature(ᴼC)
Operative temperature(ᴼC)
RH(%) Floor surface temperature(ᴼC)
Air velocity(m/s)
CO2(ppm) PM2.5(ug/m3) PM10(ug/m3) Illuminance (Lux)
Circadian Lighting Design (EML)
Uniformity of Illuminance
within task area
Ratio of illuminance task area to immediate
surroundings
Percentage of the task area meeting
the required illuminance
Overall Sound pressure Level (dB)
S1 31.8 29.6 31 30.1 1.05 480 66 139 239 253 0.87 1.0 67S2 31.8 29.9 30 30.3 0.96 512 57 115 400 429 0.93 1.0 65S3 31.8 30.1 30 30.4 0.21 536 54 118 339 353 0.85 0.8 68S1 31.8 31.6 22 30.7 0.79 450 62 133 218 226 0.95 1.0 68S2 31.8 31.2 22 30.4 0.71 441 47 104 272 283 0.95 1.0 69S3 31.8 31.1 22 30.4 0.99 438 49 106 277 290 0.94 1.0 70S4 31.8 31.0 22 30.5 0.46 451 49 111 258 265 0.91 1.0 68S1 31.8 31.4 23 30.2 0.33 449 49 108 355 376 0.94 0.9 61S2 31.8 30.1 23 30.2 0.66 455 48 101 411 441 0.93 1.0 64S3 31.8 30.8 22 30.0 1.80 484 52 104 443 466 0.92 1.1 66
Indoor air quality lighting comfort
B2F0R1 (shared office/ Air conditioned)
67
B2F0R2 (Laboratory, shared office / Mixed mode
conditioned)
25
Thermal Comfort
B2F0R3 (shared office/ Air conditioned)
100
Thermal Comfort
Indoor Air quality
Lighting comfort
Acoustic Comfort
CEE (B2) 84% 90% 87% 70%Building Class B B B -
Occupant satisfaction survey results
Building
Threshold Value: A class=90%,B class=80%,C class= -
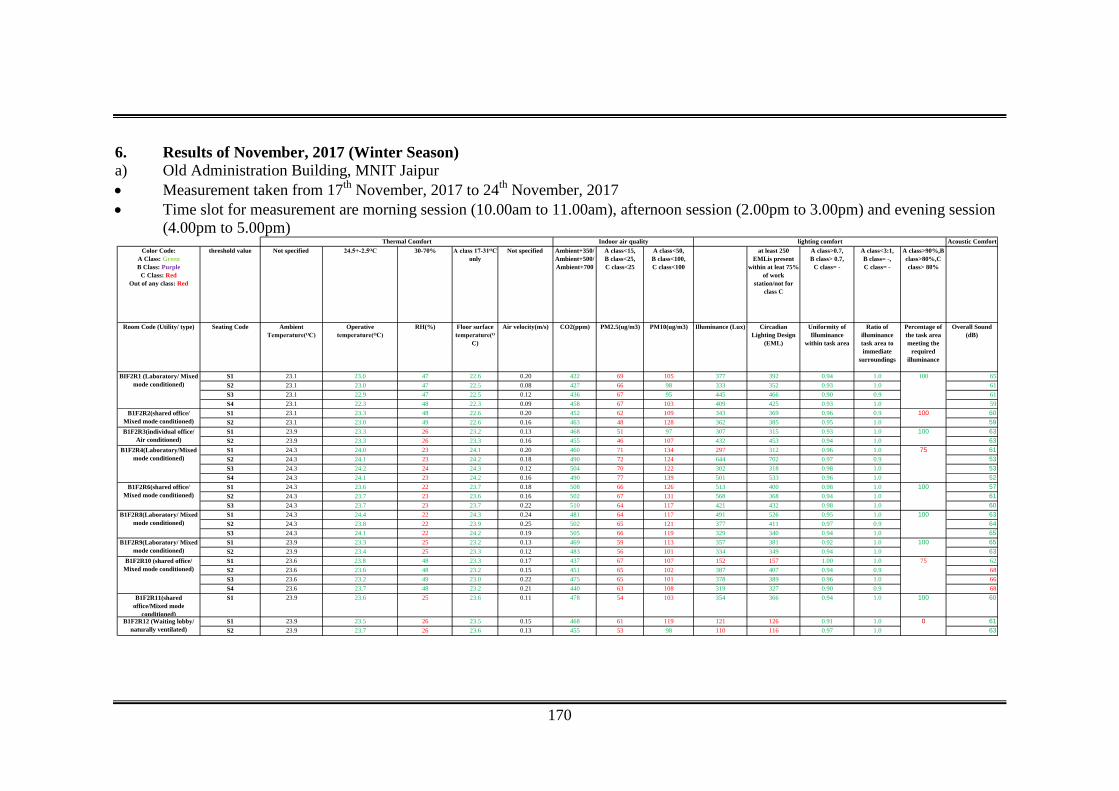
170
6. Results of November, 2017 (Winter Season) a) Old Administration Building, MNIT Jaipur • Measurement taken from 17th November, 2017 to 24th November, 2017 • Time slot for measurement are morning session (10.00am to 11.00am), afternoon session (2.00pm to 3.00pm) and evening session (4.00pm to 5.00pm)
Acoustic ComfortColor Code:
A Class: GreenB Class: Purple
C Class: RedOut of any class: Red
threshold value Not specified 24.5+-2.5ᴼC 30-70% A class 17-31ᴼC only
Not specified Ambient+350/Ambient+500/Ambient+700
A class<15, B class<25, C class<25
A class<50, B class<100, C class<100
at least 250 EMLis present
within at leat 75% of work
station/not for class C
A class>0.7, B class> 0.7,
C class= -
A class<3:1, B class= -, C class= -
A class>90%,B class>80%,C class> 80%
Room Code (Utility/ type) Seating Code Ambient Temperature(ᴼC)
Operative temperature(ᴼC)
RH(%) Floor surface temperature(ᴼ
C)
Air velocity(m/s) CO2(ppm) PM2.5(ug/m3) PM10(ug/m3) Illuminance (Lux) Circadian Lighting Design
(EML)
Uniformity of Illuminance
within task area
Ratio of illuminance task area to immediate
surroundings
Percentage of the task area meeting the
required illuminance
Overall Sound (dB)
S1 23.1 23.0 47 22.6 0.20 422 69 105 377 392 0.94 1.0 65S2 23.1 23.0 47 22.5 0.08 427 66 98 333 352 0.93 1.0 61S3 23.1 22.9 47 22.5 0.12 436 67 95 445 466 0.90 0.9 61S4 23.1 22.3 48 22.3 0.09 458 67 103 409 425 0.93 1.0 59S1 23.1 23.3 48 22.6 0.20 452 62 109 343 369 0.96 0.9 60S2 23.1 23.0 49 22.6 0.16 463 48 128 362 385 0.95 1.0 59S1 23.9 23.3 26 23.2 0.13 468 51 97 307 315 0.93 1.0 63S2 23.9 23.3 26 23.3 0.16 455 46 107 432 453 0.94 1.0 63S1 24.3 24.0 23 24.1 0.20 460 71 134 297 312 0.96 1.0 61S2 24.3 24.1 23 24.2 0.18 490 72 124 644 702 0.97 0.9 53S3 24.3 24.2 24 24.3 0.12 504 70 122 302 318 0.98 1.0 53S4 24.3 24.1 23 24.2 0.16 490 77 139 501 533 0.96 1.0 52S1 24.3 23.6 22 23.7 0.18 508 66 126 513 400 0.98 1.0 57S2 24.3 23.7 23 23.6 0.16 502 67 131 568 368 0.94 1.0 61S3 24.3 23.7 23 23.7 0.22 510 64 117 421 432 0.98 1.0 60S1 24.3 24.4 22 24.3 0.24 481 64 117 491 526 0.95 1.0 63S2 24.3 23.8 22 23.9 0.25 502 65 121 377 411 0.97 0.9 64S3 24.3 24.1 22 24.2 0.19 505 66 119 329 340 0.94 1.0 65S1 23.9 23.3 25 23.2 0.13 469 59 113 357 381 0.92 1.0 65S2 23.9 23.4 25 23.3 0.12 483 56 101 334 349 0.94 1.0 63S1 23.6 23.8 48 23.3 0.17 437 67 107 152 157 1.00 1.0 62S2 23.6 23.6 48 23.2 0.15 451 65 102 387 407 0.94 0.9 68S3 23.6 23.2 49 23.0 0.22 475 65 101 378 389 0.96 1.0 66S4 23.6 23.7 48 23.2 0.21 440 63 108 319 327 0.90 0.9 68
B1F2R11(shared office/Mixed mode
conditioned)
S1 23.9 23.6 25 23.6 0.11 478 54 103 354 366 0.94 1.0 100 60
S1 23.9 23.5 26 23.5 0.15 468 61 119 121 126 0.91 1.0 61S2 23.9 23.7 26 23.6 0.13 455 53 98 110 116 0.97 1.0 63
B1F2R6(shared office/ Mixed mode conditioned)
100
B1F2R8(Laboratory/ Mixed mode conditioned)
100
B1F2R9(Laboratory/ Mixed mode conditioned)
100
B1F2R10 (shared office/ Mixed mode conditioned)
75
B1F2R12 (Waiting lobby/ naturally ventilated)
0
B1F2R2(shared office/ Mixed mode conditioned)
100
B1F2R3(individual office/ Air conditioned)
100
B1F2R4(Laboratory/Mixed mode conditioned)
75
BIF2R1 (Laboratory/ Mixed mode conditioned)
100
Thermal Comfort Indoor air quality lighting comfort
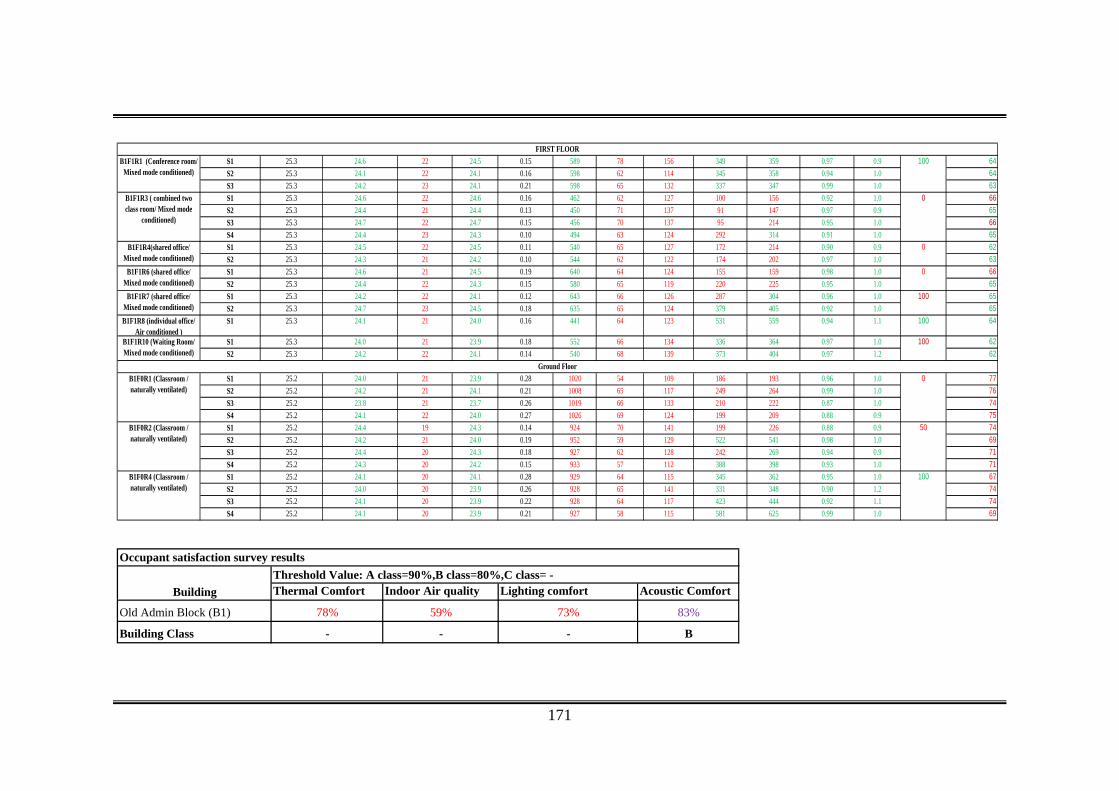
171
S1 25.3 24.6 22 24.5 0.15 589 78 156 349 359 0.97 0.9 64S2 25.3 24.1 22 24.1 0.16 598 62 114 345 358 0.94 1.0 64S3 25.3 24.2 23 24.1 0.21 598 65 132 337 347 0.99 1.0 63S1 25.3 24.6 22 24.6 0.16 462 62 127 100 156 0.92 1.0 66S2 25.3 24.4 21 24.4 0.13 450 71 137 91 147 0.97 0.9 65S3 25.3 24.7 22 24.7 0.15 456 70 137 95 214 0.95 1.0 66S4 25.3 24.4 23 24.3 0.10 494 63 124 292 314 0.91 1.0 65S1 25.3 24.5 22 24.5 0.11 540 65 127 172 214 0.90 0.9 62S2 25.3 24.3 21 24.2 0.10 544 62 122 174 202 0.97 1.0 63S1 25.3 24.6 21 24.5 0.19 640 64 124 155 159 0.98 1.0 66S2 25.3 24.4 22 24.3 0.15 580 65 119 220 225 0.95 1.0 65S1 25.3 24.2 22 24.1 0.12 643 66 126 287 304 0.96 1.0 65S2 25.3 24.7 23 24.5 0.18 635 65 124 379 405 0.92 1.0 65
B1F1R8 (individual office/ Air conditioned )
S1 25.3 24.1 21 24.0 0.16 441 64 123 531 559 0.94 1.1 100 64
S1 25.3 24.0 21 23.9 0.18 552 66 134 336 364 0.97 1.0 62S2 25.3 24.2 22 24.1 0.14 540 68 139 373 404 0.97 1.2 62
S1 25.2 24.0 21 23.9 0.28 1020 54 109 186 193 0.96 1.0 77S2 25.2 24.2 21 24.1 0.21 1008 65 117 249 264 0.99 1.0 76S3 25.2 23.8 21 23.7 0.26 1019 66 133 210 222 0.87 1.0 74S4 25.2 24.1 22 24.0 0.27 1026 69 124 199 209 0.88 0.9 75S1 25.2 24.4 19 24.3 0.14 924 70 141 199 226 0.88 0.9 74S2 25.2 24.2 21 24.0 0.19 952 59 129 522 541 0.98 1.0 69S3 25.2 24.4 20 24.3 0.18 927 62 128 242 269 0.94 0.9 71S4 25.2 24.3 20 24.2 0.15 933 57 112 388 398 0.93 1.0 71S1 25.2 24.1 20 24.1 0.28 929 64 115 345 362 0.95 1.0 67S2 25.2 24.0 20 23.9 0.26 928 65 141 331 348 0.90 1.2 74S3 25.2 24.1 20 23.9 0.22 928 64 117 423 444 0.92 1.1 74S4 25.2 24.1 20 23.9 0.21 927 58 115 581 625 0.99 1.0 69
B1F1R7 (shared office/ Mixed mode conditioned)
100
B1F1R10 (Waiting Room/ Mixed mode conditioned)
100
Ground FloorB1F0R1 (Classroom / naturally ventilated)
0
B1F0R2 (Classroom / naturally ventilated)
50
B1F0R4 (Classroom / naturally ventilated)
100
B1F1R3 ( combined two class room/ Mixed mode
conditioned)
0
B1F1R4(shared office/ Mixed mode conditioned)
0
B1F1R6 (shared office/ Mixed mode conditioned)
0
B1F1R1 (Conference room/ Mixed mode conditioned)
100FIRST FLOOR
Thermal Comfort Indoor Air quality Lighting comfort Acoustic Comfort
Old Admin Block (B1) 78% 59% 73% 83%
Building Class - - - B
BuildingThreshold Value: A class=90%,B class=80%,C class= -
Occupant satisfaction survey results

172
b) Centre for Energy and Environment Building, MNIT Jaipur • Measurement taken from 16th November, 2017 • Time slot for measurement are morning session (10.00am to 11.00am), afternoon session (2.00pm to 3.00pm) and evening session (4.00pm to 5.00pm)
Acoustic ComfortColor Code:
A Class: GreenB Class: Purple
C Class: RedOut of any class: Red
threshold value Not specified 24.5+-2.5ᴼC 30-70% A class 17-31ᴼC only
Not specified Ambient+350/Ambient+500/Ambient+700
A class<15, B class<25, C class<25
A class<50, B class<100, C class<100
at least 250 EMLis present
within at leat 75% of work
station/not for class C
A class>0.7, B class> 0.7,
C class= -
A class<3:1, B class= -, C class= -
A class>90%,B class>80%,C class> 80%
Room Code (Utility / Type) Seating code Ambient Temperature(ᴼC)
Operative temperature(ᴼC)
RH(%) Floor surface temperature(ᴼ
C)
Air velocity(m/s) CO2(ppm) PM2.5(ug/m3) PM10(ug/m3) Illuminance (Lux) Circadian Lighting Design
(EML)
Uniformity of Illuminance
within task area
Ratio of illuminance task area to immediate
surroundings
Percentage of the task area meeting the
required illuminance
Overall Sound pressure Level
(dB)
S1 25.7 24.9 43 25.1 0.12 473 56 103 266 282 0.94 1.0 65S2 25.7 24.8 43 25.1 0.15 484 53 95 383 410 0.96 1.0 65S3 25.7 24.9 43 25.3 0.11 501 50 98 335 348 0.86 0.9 65S1 25.7 24.6 40 25.4 0.19 448 60 127 276 290 0.95 1.0 67S2 25.7 25.1 40 25.0 0.20 445 49 107 275 286 0.95 1.0 64S3 25.7 24.9 40 25.0 0.23 439 53 109 279 292 0.94 1.0 66S4 25.7 24.9 40 25.1 0.24 453 50 107 262 269 0.92 1.0 64S1 25.7 24.6 41 24.7 0.23 451 49 105 328 347 0.93 0.9 66S2 25.7 24.6 41 24.8 0.25 457 49 101 412 441 0.92 1.0 66S3 25.7 24.4 41 24.5 0.18 479 52 102 454 477 0.90 1.1 66
B2F0R3 (shared office/ Mixed mode conditioned)
100
Indoor air quality lighting comfort
B2F0R1 (shared office/ Mixed mode conditioned)
67
B2F0R2 (Laboratory, shared office / Mixed mode
conditioned)
0
Thermal Comfort
Thermal Comfort Indoor Air quality Lighting comfort Acoustic ComfortCEE (B2) 83% 89% 68% 85%Building Class B B - B
Occupant satisfaction survey results
BuildingThreshold Value: A class=90%,B class=80%,C class= -
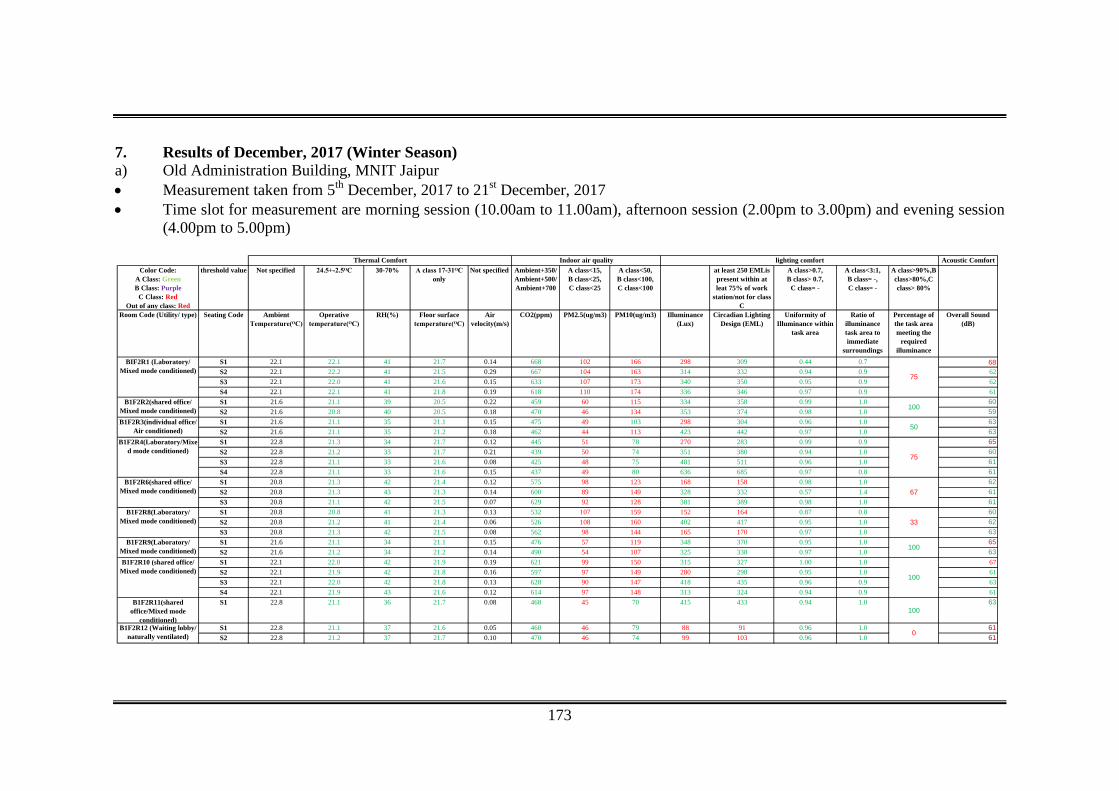
173
7. Results of December, 2017 (Winter Season) a) Old Administration Building, MNIT Jaipur • Measurement taken from 5th December, 2017 to 21st December, 2017 • Time slot for measurement are morning session (10.00am to 11.00am), afternoon session (2.00pm to 3.00pm) and evening session
(4.00pm to 5.00pm)
Acoustic ComfortColor Code:
A Class: GreenB Class: Purple
C Class: RedOut of any class: Red
threshold value Not specified 24.5+-2.5ᴼC 30-70% A class 17-31ᴼC only
Not specified Ambient+350/Ambient+500/Ambient+700
A class<15, B class<25, C class<25
A class<50, B class<100, C class<100
at least 250 EMLis present within at leat 75% of work
station/not for class C
A class>0.7, B class> 0.7,
C class= -
A class<3:1, B class= -, C class= -
A class>90%,B class>80%,C class> 80%
Room Code (Utility/ type) Seating Code Ambient Temperature(ᴼC)
Operative temperature(ᴼC)
RH(%) Floor surface temperature(ᴼC)
Air velocity(m/s)
CO2(ppm) PM2.5(ug/m3) PM10(ug/m3) Illuminance (Lux)
Circadian Lighting Design (EML)
Uniformity of Illuminance within
task area
Ratio of illuminance task area to immediate
surroundings
Percentage of the task area meeting the
required illuminance
Overall Sound (dB)
S1 22.1 22.1 41 21.7 0.14 668 102 166 298 309 0.44 0.7 68S2 22.1 22.2 41 21.5 0.29 667 104 163 314 332 0.94 0.9 62S3 22.1 22.0 41 21.6 0.15 633 107 173 340 350 0.95 0.9 62S4 22.1 22.1 41 21.8 0.19 618 110 174 336 346 0.97 0.9 61S1 21.6 21.1 39 20.5 0.22 459 60 115 334 358 0.99 1.0 60S2 21.6 20.8 40 20.5 0.18 470 46 134 353 374 0.98 1.0 59S1 21.6 21.1 35 21.1 0.15 475 49 103 298 304 0.96 1.0 63S2 21.6 21.1 35 21.2 0.18 462 44 113 423 442 0.97 1.0 63S1 22.8 21.3 34 21.7 0.12 445 51 78 270 283 0.99 0.9 65S2 22.8 21.2 33 21.7 0.21 439 50 74 351 380 0.94 1.0 60S3 22.8 21.1 33 21.6 0.08 425 48 75 481 511 0.96 1.0 61S4 22.8 21.1 33 21.6 0.15 437 49 80 636 685 0.97 0.8 61S1 20.8 21.3 42 21.4 0.12 575 98 123 168 158 0.98 1.0 62S2 20.8 21.3 43 21.3 0.14 600 89 149 328 332 0.57 1.4 61S3 20.8 21.1 42 21.5 0.07 629 92 128 381 389 0.98 1.0 61S1 20.8 20.8 41 21.3 0.13 532 107 159 152 164 0.87 0.8 60S2 20.8 21.2 41 21.4 0.06 526 108 160 402 417 0.95 1.0 62S3 20.8 21.3 42 21.5 0.08 562 98 144 165 170 0.97 1.0 63S1 21.6 21.1 34 21.1 0.15 476 57 119 348 370 0.95 1.0 65S2 21.6 21.2 34 21.2 0.14 490 54 107 325 338 0.97 1.0 63S1 22.1 22.0 42 21.9 0.19 621 99 150 315 327 1.00 1.0 67S2 22.1 21.9 42 21.8 0.16 597 97 149 280 298 0.95 1.0 61S3 22.1 22.0 42 21.8 0.13 628 90 147 418 435 0.96 0.9 63S4 22.1 21.9 43 21.6 0.12 614 97 148 313 324 0.94 0.9 61
B1F2R11(shared office/Mixed mode
conditioned)
S1 22.8 21.1 36 21.7 0.08 468 45 70 415 433 0.94 1.0100
63
S1 22.8 21.1 37 21.6 0.05 460 46 79 88 91 0.96 1.0 61S2 22.8 21.2 37 21.7 0.10 470 46 74 99 103 0.96 1.0 61
B1F2R6(shared office/ Mixed mode conditioned) 67
B1F2R8(Laboratory/ Mixed mode conditioned) 33
B1F2R9(Laboratory/ Mixed mode conditioned) 100
B1F2R10 (shared office/ Mixed mode conditioned)
100
B1F2R12 (Waiting lobby/ naturally ventilated) 0
B1F2R2(shared office/ Mixed mode conditioned) 100
B1F2R3(individual office/ Air conditioned) 50
B1F2R4(Laboratory/Mixed mode conditioned)
75
BIF2R1 (Laboratory/ Mixed mode conditioned)
75
Thermal Comfort Indoor air quality lighting comfort
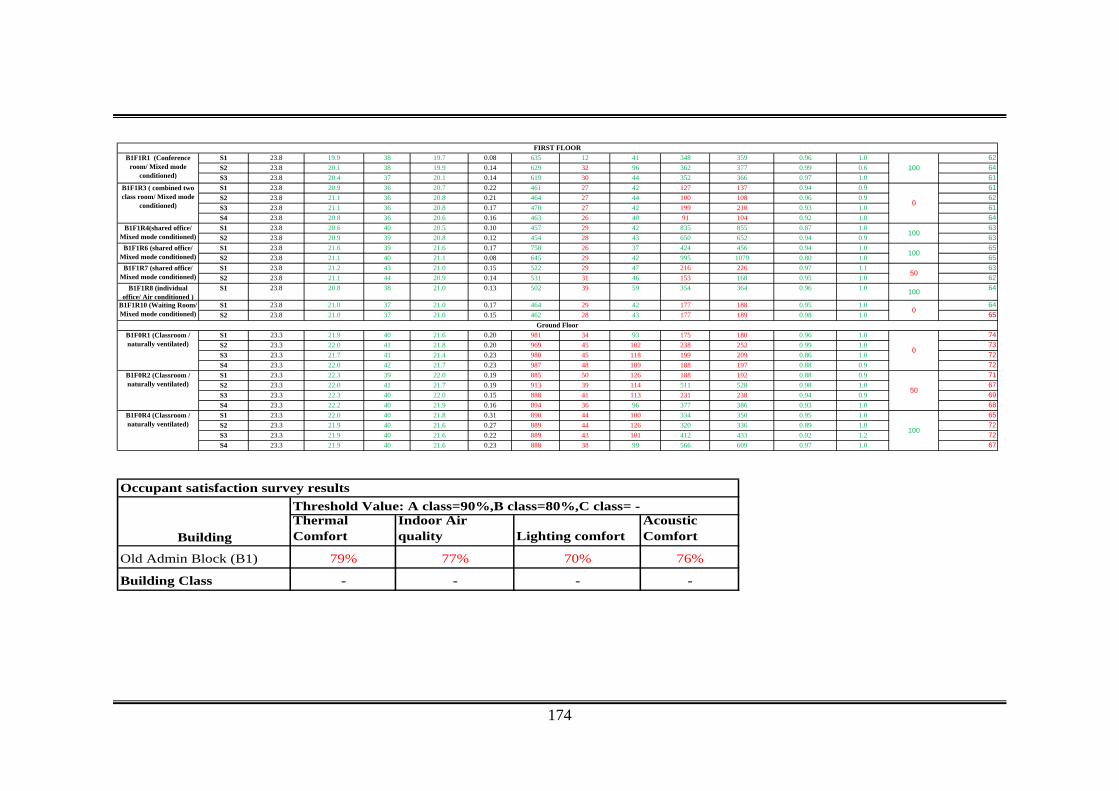
174
S1 23.8 19.9 38 19.7 0.08 635 12 41 348 359 0.96 1.0 62S2 23.8 20.1 38 19.9 0.14 629 32 96 362 377 0.99 0.6 64S3 23.8 20.4 37 20.1 0.14 619 30 44 352 366 0.97 1.0 61S1 23.8 20.9 36 20.7 0.22 461 27 42 127 137 0.94 0.9 61S2 23.8 21.1 36 20.8 0.21 464 27 44 100 108 0.96 0.9 62S3 23.8 21.1 36 20.8 0.17 470 27 42 199 210 0.93 1.0 61S4 23.8 20.8 36 20.6 0.16 463 26 40 91 104 0.92 1.0 64S1 23.8 20.6 40 20.5 0.10 457 29 42 835 855 0.87 1.0 63S2 23.8 20.9 39 20.8 0.12 454 28 43 650 652 0.94 0.9 63S1 23.8 21.6 39 21.6 0.17 758 26 37 424 456 0.94 1.0 65S2 23.8 21.1 40 21.1 0.08 645 29 42 995 1079 0.80 1.0 65S1 23.8 21.2 43 21.0 0.15 522 29 47 216 226 0.97 1.1 63S2 23.8 21.1 44 20.9 0.14 531 31 46 153 168 0.95 1.0 62
B1F1R8 (individual office/ Air conditioned )
S1 23.8 20.8 38 21.0 0.13 502 39 59 354 364 0.96 1.0 10064
S1 23.8 21.0 37 21.0 0.17 464 29 42 177 188 0.95 1.0 64S2 23.8 21.0 37 21.0 0.15 462 28 43 177 189 0.98 1.0 65
S1 23.3 21.9 40 21.6 0.20 981 34 93 175 180 0.96 1.0 74S2 23.3 22.0 41 21.8 0.20 969 45 102 238 252 0.99 1.0 73S3 23.3 21.7 41 21.4 0.23 980 45 118 199 209 0.86 1.0 72S4 23.3 22.0 42 21.7 0.23 987 48 109 188 197 0.88 0.9 72S1 23.3 22.3 39 22.0 0.19 885 50 126 188 192 0.88 0.9 71S2 23.3 22.0 41 21.7 0.19 913 39 114 511 528 0.98 1.0 67S3 23.3 22.3 40 22.0 0.15 888 41 113 231 238 0.94 0.9 69S4 23.3 22.2 40 21.9 0.16 894 36 96 377 386 0.93 1.0 68S1 23.3 22.0 40 21.8 0.31 890 44 100 334 350 0.95 1.0 65S2 23.3 21.9 40 21.6 0.27 889 44 126 320 336 0.89 1.0 72S3 23.3 21.9 40 21.6 0.22 889 43 101 412 433 0.92 1.2 72S4 23.3 21.9 40 21.6 0.23 888 38 99 566 609 0.97 1.0 67
B1F1R7 (shared office/ Mixed mode conditioned) 50
B1F1R10 (Waiting Room/ Mixed mode conditioned) 0
Ground FloorB1F0R1 (Classroom / naturally ventilated)
0
B1F0R2 (Classroom / naturally ventilated)
50
B1F0R4 (Classroom / naturally ventilated)
100
B1F1R3 ( combined two class room/ Mixed mode
conditioned) 0
B1F1R4(shared office/ Mixed mode conditioned) 100
B1F1R6 (shared office/ Mixed mode conditioned) 100
B1F1R1 (Conference room/ Mixed mode
conditioned) 100
FIRST FLOOR
Thermal Comfort
Indoor Air quality Lighting comfort
Acoustic Comfort
Old Admin Block (B1) 79% 77% 70% 76%
Building Class - - - -
Building
Threshold Value: A class=90%,B class=80%,C class= -Occupant satisfaction survey results
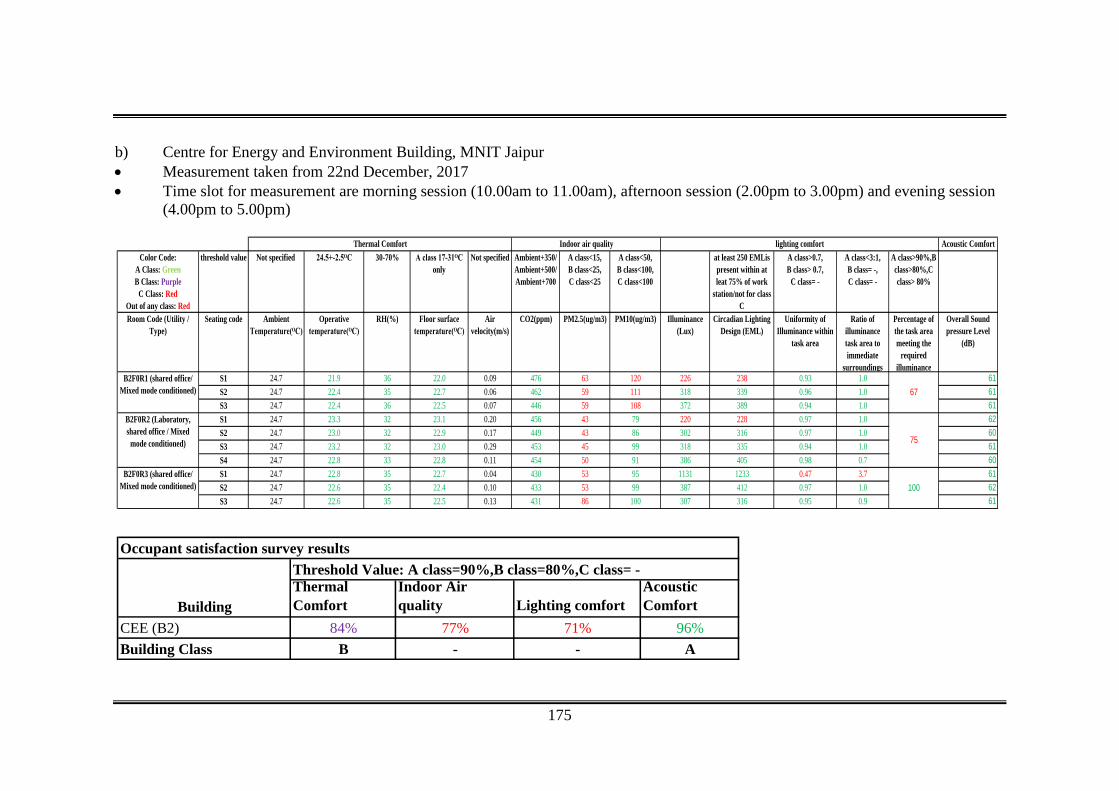
175
b) Centre for Energy and Environment Building, MNIT Jaipur • Measurement taken from 22nd December, 2017 • Time slot for measurement are morning session (10.00am to 11.00am), afternoon session (2.00pm to 3.00pm) and evening session (4.00pm to 5.00pm)
Acoustic ComfortColor Code:
A Class: GreenB Class: Purple
C Class: RedOut of any class: Red
threshold value Not specified 24.5+-2.5ᴼC 30-70% A class 17-31ᴼC only
Not specified Ambient+350/Ambient+500/Ambient+700
A class<15, B class<25, C class<25
A class<50, B class<100, C class<100
at least 250 EMLis present within at leat 75% of work
station/not for class C
A class>0.7, B class> 0.7,
C class= -
A class<3:1, B class= -, C class= -
A class>90%,B class>80%,C class> 80%
Room Code (Utility / Type)
Seating code Ambient Temperature(ᴼC)
Operative temperature(ᴼC)
RH(%) Floor surface temperature(ᴼC)
Air velocity(m/s)
CO2(ppm) PM2.5(ug/m3) PM10(ug/m3) Illuminance (Lux)
Circadian Lighting Design (EML)
Uniformity of Illuminance within
task area
Ratio of illuminance task area to immediate
surroundings
Percentage of the task area meeting the
required illuminance
Overall Sound pressure Level
(dB)
S1 24.7 21.9 36 22.0 0.09 476 63 120 226 238 0.93 1.0 61S2 24.7 22.4 35 22.7 0.06 462 59 111 318 339 0.96 1.0 61S3 24.7 22.4 36 22.5 0.07 446 59 108 372 389 0.94 1.0 61S1 24.7 23.3 32 23.1 0.20 456 43 79 220 228 0.97 1.0 62S2 24.7 23.0 32 22.9 0.17 449 43 86 302 316 0.97 1.0 60S3 24.7 23.2 32 23.0 0.29 453 45 99 318 335 0.94 1.0 61S4 24.7 22.8 33 22.8 0.11 454 50 91 386 405 0.98 0.7 60S1 24.7 22.8 35 22.7 0.04 430 53 95 1131 1233 0.47 3.7 61S2 24.7 22.6 35 22.4 0.10 433 53 99 387 412 0.97 1.0 62S3 24.7 22.6 35 22.5 0.13 431 86 100 307 316 0.95 0.9 61
B2F0R3 (shared office/ Mixed mode conditioned) 100
Indoor air quality lighting comfort
B2F0R1 (shared office/ Mixed mode conditioned) 67
B2F0R2 (Laboratory, shared office / Mixed
mode conditioned) 75
Thermal Comfort
Thermal Comfort
Indoor Air quality Lighting comfort
Acoustic Comfort
CEE (B2) 84% 77% 71% 96%Building Class B - - A
Occupant satisfaction survey results
Building
Threshold Value: A class=90%,B class=80%,C class= -

176
8. Results of January, 2018 (Winter Season) a) Old Administration Building, MNIT Jaipur • Measurement taken from Measurement taken from 16th January, 2018 to 31st January, 2018
Acoustic ComfortColor Code:
A Class: GreenB Class: Purple
C Class: RedOut of any class: Red
threshold value Not specified 24.5+-2.5ᴼC 30-70% A class 17-31ᴼC only
Not specified Ambient+350/Ambient+500/Ambie
nt+700
A class<15, B class<25, C class<25
A class<50, B class<100, C class<100
at least 250 EMLis present within at leat 75% of work
station/not for class C
A class>0.7, B class> 0.7,
C class= -
A class<3:1, B class= -, C class= -
A class>90%,B class>80%,C class> 80%
Room Code (Utility/ type) Seating Code Ambient Temperature(ᴼC)
Operative temperature(ᴼC)
RH(%) Floor surface temperature(ᴼC)
Air velocity(m/s) CO2(ppm) PM2.5(ug/m3) PM10(ug/m3) Illuminance (Lux)
Circadian Lighting Design
(EML)
Uniformity of Illuminance
within task area
Ratio of illuminance task
area to immediate
surroundings
Percentage of the task area meeting
the required illuminance
Overall Sound (dB)
S1 22.2 20.9 25 19.3 0.09 556 55 95 421 443 0.96 1.0 69S2 22.2 22.3 26 19.1 0.12 547 54 99 417 446 0.95 0.9 63S3 22.2 22.1 27 19.3 0.07 494 56 102 367 380 0.98 1.0 63S4 22.2 20.2 31 19.0 0.09 535 59 107 377 390 0.98 1.0 62S1 23.1 22.1 43 20.8 0.08 736 42 82 290 307 0.92 0.9 61S2 23.1 21.7 43 21.2 0.08 579 45 86 152 161 0.94 0.9 60S1 23.1 21.5 44 20.4 0.05 598 42 78 274 284 0.97 1.0 64S2 23.1 21.7 43 20.3 0.05 596 42 74 222 236 0.94 0.9 64S1 23.1 21.1 46 20.8 0.11 399 54 83 302 319 0.97 0.9 66S2 23.1 21.3 44 20.0 0.14 454 51 81 448 487 0.91 0.9 61S3 23.1 21.5 44 20.2 0.11 493 48 81 606 649 0.89 0.9 62S4 23.1 21.1 45 20.3 0.10 429 51 80 390 414 0.95 0.9 62S1 23.8 22.3 40 22.2 0.21 400 88 130 387 417 0.90 0.9 63S2 23.8 22.9 39 22.2 0.18 410 84 94 309 330 0.97 1.0 62S3 23.8 23.3 37 21.9 0.14 415 80 108 796 865 0.82 0.9 62S1 23.8 23.4 37 22.3 0.13 388 81 133 604 661 0.76 0.9 61S2 23.8 23.5 37 22.1 0.11 391 80 126 613 654 0.91 0.9 63S3 23.8 23.6 37 22.1 0.14 403 79 121 328 349 0.95 0.9 64S1 23.8 23.5 38 22.6 0.13 591 43 106 381 399 0.92 1.0 66S2 23.8 23.6 38 22.5 0.14 603 46 105 352 379 0.99 1.0 64S1 21.9 21.2 46 20.4 0.12 452 109 138 458 486 0.98 0.9 68S2 21.9 21.0 44 20.4 0.13 443 102 324 432 466 0.70 0.9 62S3 21.9 21.0 44 20.3 0.12 443 104 138 521 549 0.97 0.9 64S4 21.9 21.2 44 20.2 0.12 452 101 131 830 890 0.68 0.9 62
B1F2R11(shared office/Mixed mode
conditioned)
S1 21.9 20.7 44 19.7 0.13 457 92 118 402 422 0.95 1.0100
64
S1 21.9 20.5 44 20.0 0.09 459 93 124 90 93 0.97 1.0 62S2 21.9 20.5 44 19.9 0.09 440 95 129 105 110 0.97 1.0 62
BIF2R1 (Laboratory/ Mixed mode conditioned)
100
Thermal Comfort Indoor air quality lighting comfort
B1F2R2(shared office/ Mixed mode conditioned) 0
B1F2R3(individual office/ Air conditioned) 0
B1F2R4(Laboratory/Mixed mode conditioned)
100
B1F2R6(shared office/ Mixed mode conditioned) 100
B1F2R8(Laboratory/ Mixed mode conditioned) 100
B1F2R9(Laboratory/ Mixed mode conditioned) 100
B1F2R10 (shared office/ Mixed mode conditioned)
100
B1F2R12 (Waiting lobby/ naturally ventilated) 0
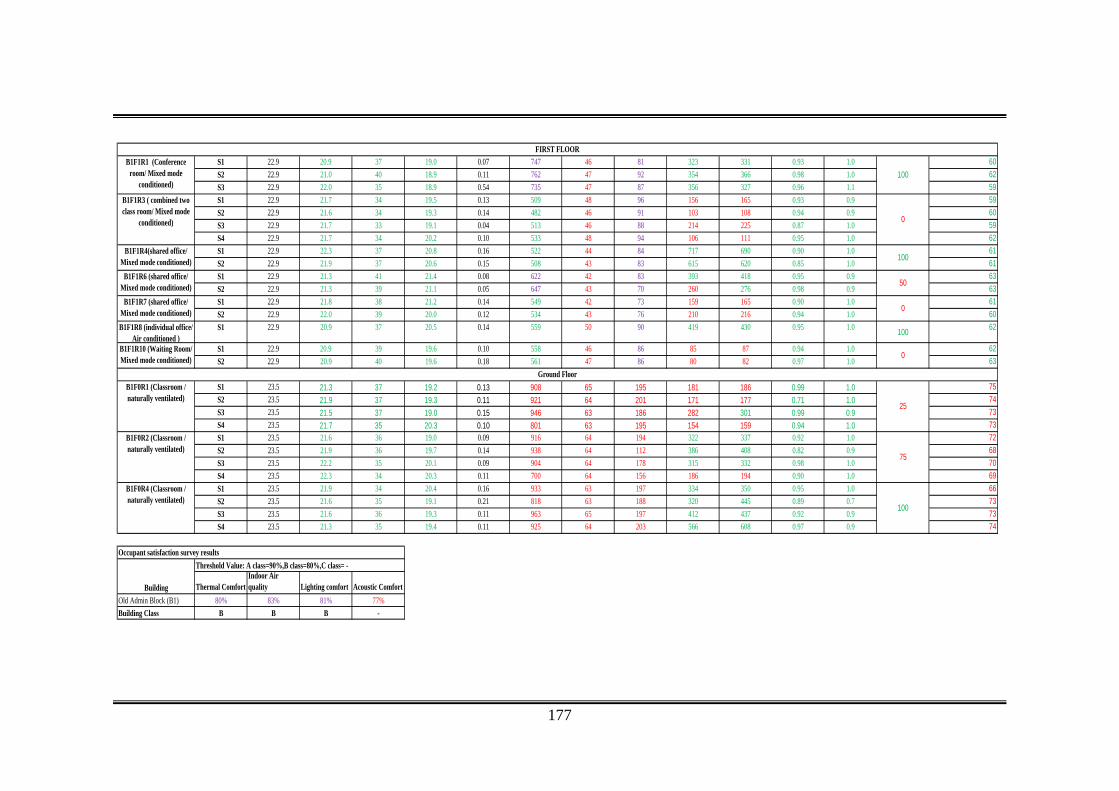
177
S1 22.9 20.9 37 19.0 0.07 747 46 81 323 331 0.93 1.0 60S2 22.9 21.0 40 18.9 0.11 762 47 92 354 366 0.98 1.0 62S3 22.9 22.0 35 18.9 0.54 735 47 87 356 327 0.96 1.1 59S1 22.9 21.7 34 19.5 0.13 509 48 96 156 165 0.93 0.9 59S2 22.9 21.6 34 19.3 0.14 482 46 91 103 108 0.94 0.9 60S3 22.9 21.7 33 19.1 0.04 513 46 88 214 225 0.87 1.0 59S4 22.9 21.7 34 20.2 0.10 533 48 94 106 111 0.95 1.0 62S1 22.9 22.3 37 20.8 0.16 522 44 84 717 690 0.90 1.0 61S2 22.9 21.9 37 20.6 0.15 508 43 83 615 620 0.85 1.0 61S1 22.9 21.3 41 21.4 0.08 622 42 83 393 418 0.95 0.9 63S2 22.9 21.3 39 21.1 0.05 647 43 70 260 276 0.98 0.9 63S1 22.9 21.8 38 21.2 0.14 549 42 73 159 165 0.90 1.0 61S2 22.9 22.0 39 20.0 0.12 534 43 76 210 216 0.94 1.0 60
B1F1R8 (individual office/ Air conditioned )
S1 22.9 20.9 37 20.5 0.14 559 50 90 419 430 0.95 1.0 10062
S1 22.9 20.9 39 19.6 0.10 558 46 86 85 87 0.94 1.0 62S2 22.9 20.9 40 19.6 0.18 561 47 86 80 82 0.97 1.0 63
S1 23.5 21.3 37 19.2 0.13 908 65 195 181 186 0.99 1.0 75S2 23.5 21.9 37 19.3 0.11 921 64 201 171 177 0.71 1.0 74S3 23.5 21.5 37 19.0 0.15 946 63 186 282 301 0.99 0.9 73S4 23.5 21.7 35 20.3 0.10 801 63 195 154 159 0.94 1.0 73S1 23.5 21.6 36 19.0 0.09 916 64 194 322 337 0.92 1.0 72S2 23.5 21.9 36 19.7 0.14 938 64 112 386 408 0.82 0.9 68S3 23.5 22.2 35 20.1 0.09 904 64 178 315 332 0.98 1.0 70S4 23.5 22.3 34 20.3 0.11 700 64 156 186 194 0.90 1.0 69S1 23.5 21.9 34 20.4 0.16 933 63 197 334 350 0.95 1.0 66S2 23.5 21.6 35 19.1 0.21 818 63 188 320 445 0.89 0.7 73S3 23.5 21.6 36 19.3 0.11 963 65 197 412 437 0.92 0.9 73S4 23.5 21.3 35 19.4 0.11 925 64 203 566 608 0.97 0.9 74
Thermal ComfortIndoor Air quality Lighting comfort Acoustic Comfort
Old Admin Block (B1) 80% 83% 81% 77% Building Class B B B -
B1F1R1 (Conference room/ Mixed mode
conditioned) 100
FIRST FLOOR
B1F1R3 ( combined two class room/ Mixed mode
conditioned) 0
B1F1R4(shared office/ Mixed mode conditioned) 100
B1F1R6 (shared office/ Mixed mode conditioned) 50
Building
Threshold Value: A class=90%,B class=80%,C class= -
B1F1R7 (shared office/ Mixed mode conditioned) 0
B1F1R10 (Waiting Room/ Mixed mode conditioned) 0
Ground FloorB1F0R1 (Classroom / naturally ventilated)
25
B1F0R2 (Classroom / naturally ventilated)
75
B1F0R4 (Classroom / naturally ventilated)
100
Occupant satisfaction survey results
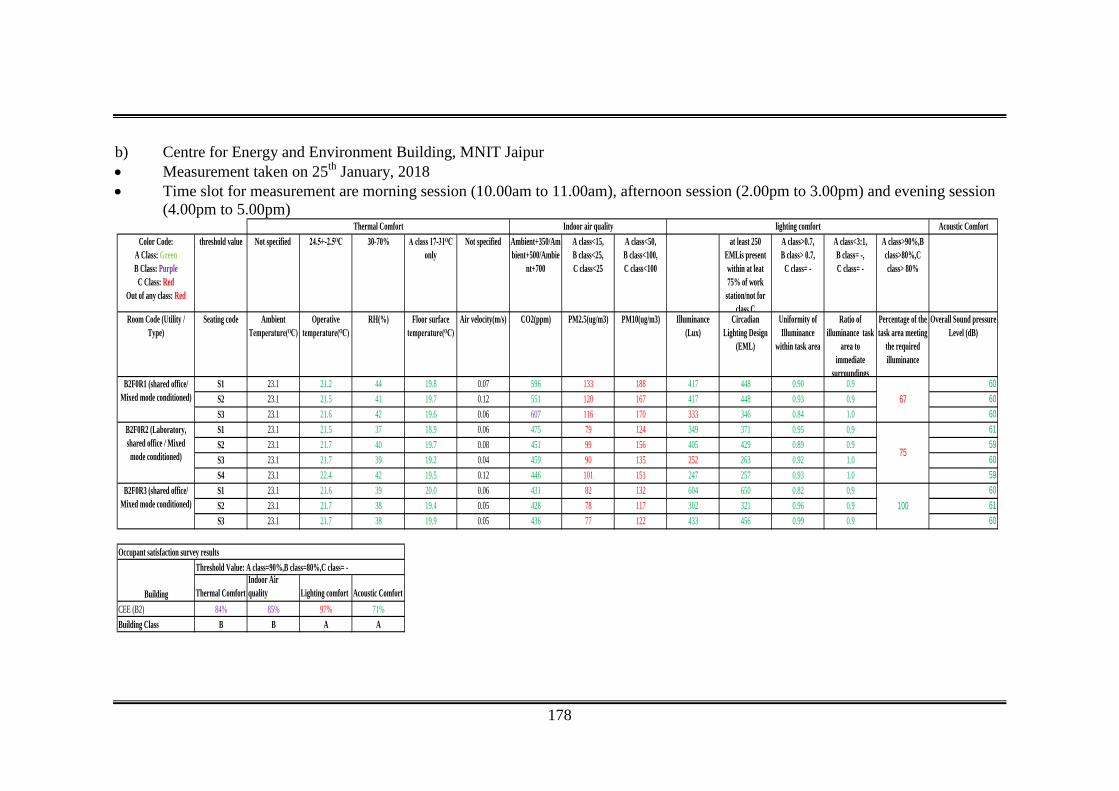
178
b) Centre for Energy and Environment Building, MNIT Jaipur • Measurement taken on 25th January, 2018 • Time slot for measurement are morning session (10.00am to 11.00am), afternoon session (2.00pm to 3.00pm) and evening session (4.00pm to 5.00pm)
Acoustic ComfortColor Code:
A Class: GreenB Class: Purple
C Class: RedOut of any class: Red
threshold value Not specified 24.5+-2.5ᴼC 30-70% A class 17-31ᴼC only
Not specified Ambient+350/Ambient+500/Ambie
nt+700
A class<15, B class<25, C class<25
A class<50, B class<100, C class<100
at least 250 EMLis present within at leat 75% of work
station/not for class C
A class>0.7, B class> 0.7,
C class= -
A class<3:1, B class= -, C class= -
A class>90%,B class>80%,C class> 80%
Room Code (Utility / Type)
Seating code Ambient Temperature(ᴼC)
Operative temperature(ᴼC)
RH(%) Floor surface temperature(ᴼC)
Air velocity(m/s) CO2(ppm) PM2.5(ug/m3) PM10(ug/m3) Illuminance (Lux)
Circadian Lighting Design
(EML)
Uniformity of Illuminance
within task area
Ratio of illuminance task
area to immediate
surroundings
Percentage of the task area meeting
the required illuminance
Overall Sound pressure Level (dB)
S1 23.1 21.2 44 19.8 0.07 596 133 188 417 448 0.90 0.9 60S2 23.1 21.5 41 19.7 0.12 551 120 167 417 448 0.93 0.9 60S3 23.1 21.6 42 19.6 0.06 607 116 170 333 346 0.84 1.0 60S1 23.1 21.5 37 18.9 0.06 475 79 124 349 371 0.95 0.9 61S2 23.1 21.7 40 19.7 0.08 451 99 156 405 429 0.89 0.9 59S3 23.1 21.7 39 19.2 0.04 459 90 135 252 263 0.92 1.0 60S4 23.1 22.4 42 19.5 0.12 446 101 151 247 257 0.93 1.0 59S1 23.1 21.6 39 20.0 0.06 431 82 132 604 650 0.82 0.9 60S2 23.1 21.7 38 19.4 0.05 428 78 117 302 321 0.96 0.9 61S3 23.1 21.7 38 19.9 0.05 436 77 122 433 456 0.99 0.9 60
Thermal ComfortIndoor Air quality Lighting comfort Acoustic Comfort
CEE (B2) 84% 85% 97% 71%Building Class B B A A
Indoor air quality lighting comfort
B2F0R1 (shared office/ Mixed mode conditioned) 67
B2F0R2 (Laboratory, shared office / Mixed
mode conditioned) 75
Thermal Comfort
B2F0R3 (shared office/ Mixed mode conditioned) 100
Occupant satisfaction survey results
Building
Threshold Value: A class=90%,B class=80%,C class= -
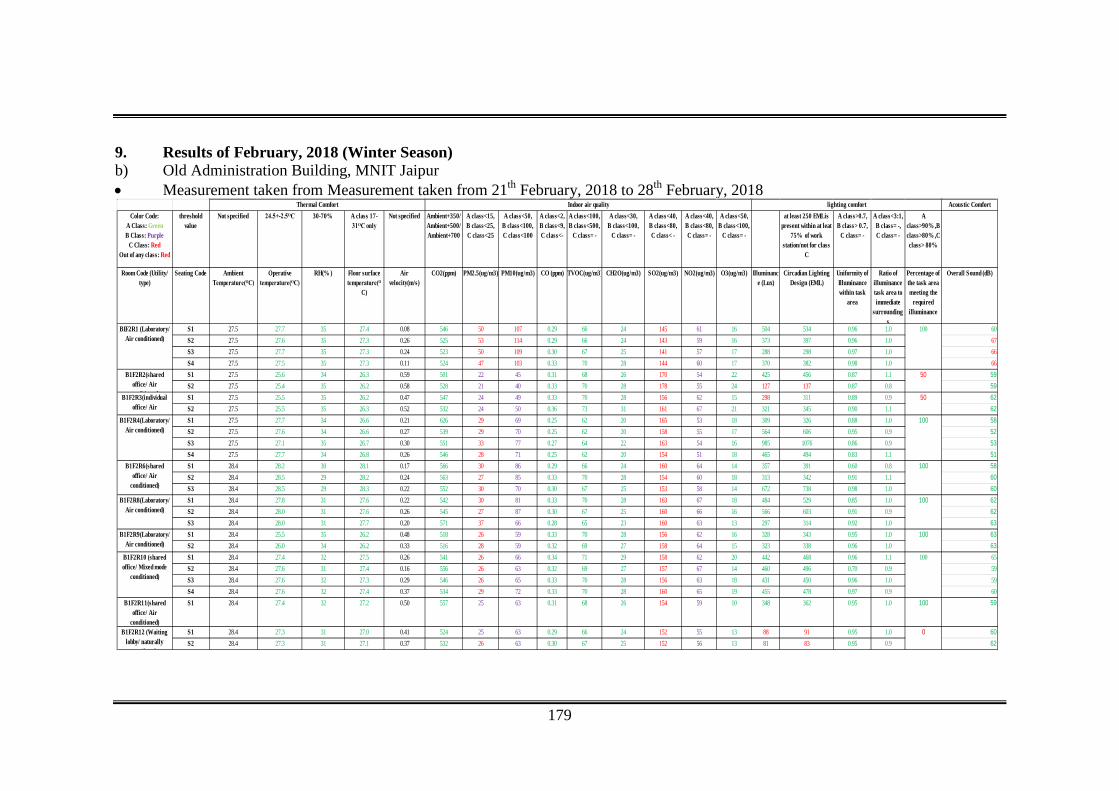
179
9. Results of February, 2018 (Winter Season) b) Old Administration Building, MNIT Jaipur • Measurement taken from Measurement taken from 21th February, 2018 to 28th February, 2018
Acoustic ComfortColor Code:
A Class: GreenB Class: Purple
C Class: RedOut of any class: Red
threshold value
Not specified 24.5+-2.5ᴼC 30-70% A class 17-31ᴼC only
Not specified Ambient+350/Ambient+500/Ambient+700
A class<15, B class<25, C class<25
A class<50, B class<100, C class<100
A class<2, B class<9, C class<-
A class<100, B class<500,
C class= -
A class<30, B class<100,
C class= -
A class<40, B class<80, C class< -
A class<40, B class<80, C class= -
A class<50, B class<100,
C class= -
at least 250 EMLis present within at leat
75% of work station/not for class
C
A class>0.7, B class> 0.7,
C class= -
A class<3:1, B class= -, C class= -
A class>90% ,B class>80% ,C class> 80%
Room Code (Utility/ type)
Seating Code Ambient Temperature(ᴼC)
Operative temperature(ᴼC)
RH(% ) Floor surface temperature(ᴼ
C)
Air velocity(m/s)
CO2(ppm) PM2.5(ug/m3) PM10(ug/m3) CO (ppm) TVOC(ug/m3) CH2O(ug/m3) SO2(ug/m3) NO2(ug/m3) O3(ug/m3) Illuminance (Lux)
Circadian Lighting Design (EML)
Uniformity of Illuminance within task
area
Ratio of illuminance task area to immediate
surroundings
Percentage of the task area meeting the
required illuminance
Overall Sound (dB)
S1 27.5 27.7 35 27.4 0.08 546 50 107 0.29 66 24 145 61 16 504 534 0.96 1.0 60S2 27.5 27.6 35 27.3 0.26 525 53 114 0.29 66 24 143 59 16 373 397 0.96 1.0 67S3 27.5 27.7 35 27.3 0.24 523 50 109 0.30 67 25 141 57 17 288 298 0.97 1.0 66S4 27.5 27.5 35 27.3 0.11 524 47 103 0.33 70 28 144 60 17 370 382 0.98 1.0 66S1 27.5 25.6 34 26.3 0.59 501 22 45 0.31 68 26 170 54 22 425 456 0.87 1.1 59
S2 27.5 25.4 35 26.2 0.58 528 21 40 0.33 70 28 178 55 24 127 137 0.87 0.8 59
S1 27.5 25.5 35 26.2 0.47 547 24 49 0.33 70 28 156 62 15 298 311 0.89 0.9 62
S2 27.5 25.5 35 26.3 0.52 532 24 50 0.36 73 31 161 67 21 321 345 0.90 1.1 62
S1 27.5 27.7 34 26.6 0.21 626 29 69 0.25 62 20 165 53 18 309 326 0.88 1.0 58
S2 27.5 27.6 34 26.6 0.27 539 29 70 0.25 62 20 158 55 17 564 606 0.95 0.9 52
S3 27.5 27.1 35 26.7 0.30 551 33 77 0.27 64 22 163 54 16 985 1076 0.86 0.9 53
S4 27.5 27.7 34 26.8 0.26 546 28 71 0.25 62 20 154 51 18 465 494 0.83 1.1 51
S1 28.4 28.2 30 28.1 0.17 566 30 86 0.29 66 24 160 64 14 357 391 0.60 0.8 58
S2 28.4 28.5 29 28.2 0.24 563 27 85 0.33 70 28 154 60 18 313 342 0.91 1.1 60
S3 28.4 28.5 29 28.3 0.22 552 30 70 0.30 67 25 153 58 14 672 738 0.98 1.0 60
S1 28.4 27.8 31 27.6 0.22 542 30 81 0.33 70 28 163 67 18 484 529 0.85 1.0 62
S2 28.4 28.0 31 27.6 0.26 545 27 87 0.30 67 25 160 66 16 566 603 0.91 0.9 62
S3 28.4 28.0 31 27.7 0.20 571 37 66 0.28 65 23 160 63 13 297 314 0.92 1.0 63
S1 28.4 25.5 35 26.2 0.48 518 26 59 0.33 70 28 156 62 16 328 343 0.95 1.0 63
S2 28.4 26.0 34 26.2 0.33 516 28 59 0.32 69 27 158 64 15 323 338 0.96 1.0 63
S1 28.4 27.4 32 27.5 0.26 541 26 66 0.34 71 29 158 62 20 442 468 0.96 1.1 65S2 28.4 27.6 31 27.4 0.16 556 26 63 0.32 69 27 157 67 14 460 496 0.70 0.9 59S3 28.4 27.6 32 27.3 0.29 546 26 65 0.33 70 28 156 63 18 431 450 0.96 1.0 59S4 28.4 27.6 32 27.4 0.37 534 29 72 0.33 70 28 160 65 19 455 478 0.97 0.9 60
B1F2R11(shared office/ Air
conditioned)
S1 28.4 27.4 32 27.2 0.50 557 25 63 0.31 68 26 154 59 10 348 362 0.95 1.0 100 59
S1 28.4 27.3 31 27.0 0.41 524 25 63 0.29 66 24 152 55 13 88 91 0.95 1.0 60
S2 28.4 27.3 31 27.1 0.37 532 26 63 0.30 67 25 152 56 13 81 83 0.95 0.9 62
B1F2R6(shared office/ Air
conditioned)
100
B1F2R8(Laboratory/ Air conditioned)
100
B1F2R9(Laboratory/ Air conditioned)
100
B1F2R10 (shared office/ Mixed mode
conditioned)
100
B1F2R12 (Waiting lobby/ naturally
til t d)
0
B1F2R2(shared office/ Air
diti d)
50
B1F2R3(individual office/ Air
diti d)
50
B1F2R4(Laboratory/ Air conditioned)
100
BIF2R1 (Laboratory/ Air conditioned)
100
Thermal Comfort Indoor air quality lighting comfort
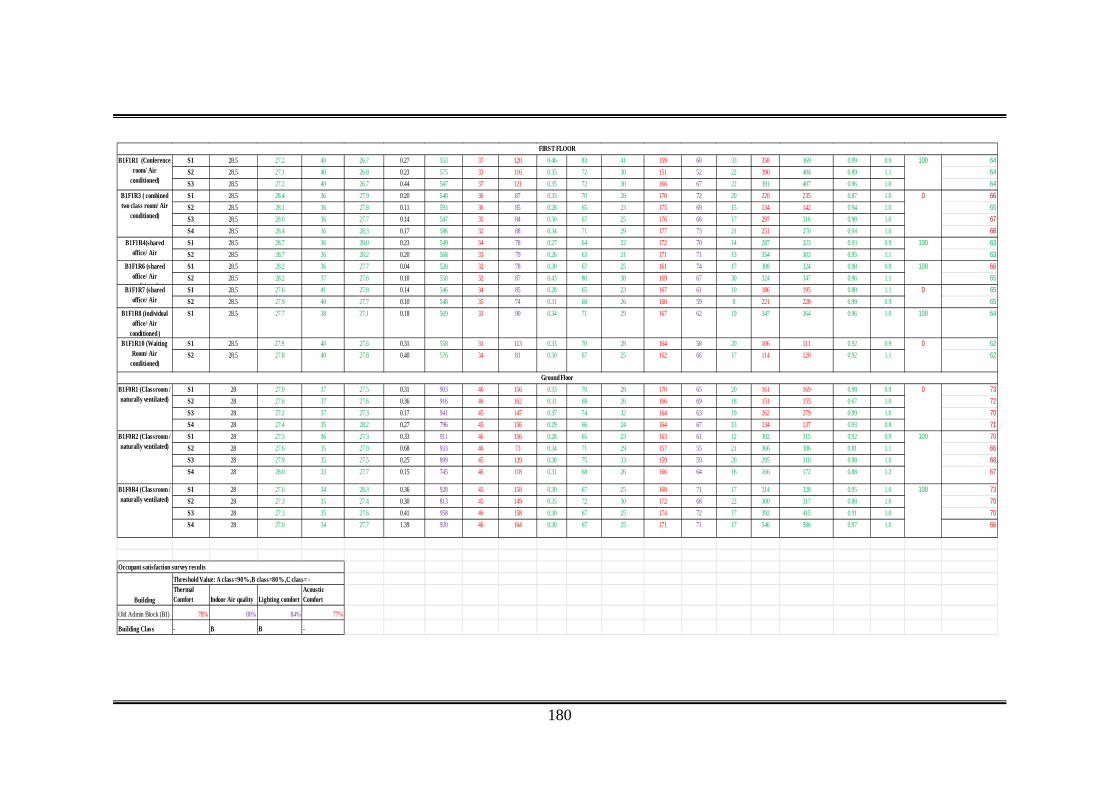
180
S1 28.5 27.2 40 26.7 0.27 553 37 120 0.46 83 41 159 60 33 358 369 0.99 0.9 64
S2 28.5 27.1 40 26.8 0.23 575 33 116 0.35 72 30 151 52 22 390 404 0.89 1.1 64
S3 28.5 27.2 40 26.7 0.44 547 37 121 0.35 72 30 166 67 22 391 407 0.96 1.0 64
S1 28.5 28.4 36 27.9 0.20 548 36 87 0.33 70 28 170 72 20 220 235 0.87 1.0 66
S2 28.5 28.1 36 27.8 0.11 593 36 85 0.28 65 23 175 69 15 134 142 0.94 1.0 65
S3 28.5 28.0 36 27.7 0.14 547 35 84 0.30 67 25 176 68 17 297 316 0.90 1.0 67
S4 28.5 28.4 36 28.3 0.17 586 32 88 0.34 71 29 177 73 21 251 270 0.94 1.0 66
S1 28.5 28.7 36 28.0 0.23 549 34 78 0.27 64 22 172 70 14 287 323 0.93 0.9 63
S2 28.5 28.7 36 28.2 0.20 568 33 79 0.26 63 21 171 71 13 354 303 0.95 1.1 63
S1 28.5 28.2 36 27.7 0.04 528 32 78 0.30 67 25 161 74 17 308 324 0.98 0.9 66
S2 28.5 28.2 37 27.6 0.10 550 32 87 0.43 80 38 169 67 30 324 347 0.96 1.1 65
S1 28.5 27.6 41 27.8 0.14 546 34 85 0.28 65 23 167 61 10 186 195 0.80 1.1 65
S2 28.5 27.9 40 27.7 0.10 548 35 74 0.31 68 26 160 59 8 221 228 0.99 0.9 65
B1F1R8 (individual office/ Air
conditioned )
S1 28.5 27.7 38 27.1 0.18 569 33 90 0.34 71 29 167 62 19 347 364 0.96 1.0 100 64
S1 28.5 27.9 40 27.6 0.31 558 31 113 0.33 70 28 164 58 20 106 111 0.92 0.9 62
S2 28.5 27.8 40 27.8 0.40 576 34 81 0.30 67 25 162 66 17 114 120 0.92 1.1 62
S1 28 27.0 37 27.5 0.31 903 46 156 0.33 70 28 170 65 20 161 169 0.98 0.9 73
S2 28 27.6 37 27.6 0.36 916 46 162 0.31 68 26 166 69 18 151 155 0.67 1.0 72
S3 28 27.2 37 27.3 0.17 941 45 147 0.37 74 32 164 63 19 262 279 0.99 1.0 70
S4 28 27.4 35 28.2 0.27 796 45 156 0.29 66 24 164 67 13 134 137 0.93 0.8 71
S1 28 27.3 36 27.3 0.33 911 46 156 0.28 65 23 163 61 12 302 315 0.92 0.9 70
S2 28 27.6 35 27.8 0.68 933 46 73 0.34 71 29 157 55 21 366 386 0.81 1.1 66
S3 28 27.9 35 27.5 0.25 899 45 139 0.38 75 33 159 59 20 295 310 0.98 1.0 68
S4 28 28.0 33 27.7 0.15 745 46 118 0.31 68 26 166 64 16 166 172 0.88 1.2 67
S1 28 27.6 34 28.3 0.36 928 45 158 0.30 67 25 168 71 17 314 328 0.95 1.0 73
S2 28 27.3 35 27.4 0.30 813 45 149 0.35 72 30 172 68 22 300 317 0.88 1.0 70
S3 28 27.3 35 27.6 0.41 958 46 158 0.30 67 25 174 72 17 392 415 0.91 1.0 70
S4 28 27.0 34 27.7 1.39 920 46 164 0.30 67 25 171 71 17 546 586 0.97 1.0 66
Thermal Comfort Indoor Air quality Lighting comfort
Acoustic Comfort
Old Admin Block (B1) 78% 80% 84% 77%
Building Class - B B -
Building
Threshold Value: A class=90% ,B class=80% ,C class= -
B1F1R7 (shared office/ Air
diti d)
0
B1F1R10 (Waiting Room/ Air
conditioned)
0
Ground FloorB1F0R1 (Classroom / naturally ventilated)
0
B1F0R2 (Classroom / naturally ventilated)
100
B1F0R4 (Classroom / naturally ventilated)
100
Occupant satisfaction survey results
B1F1R3 ( combined two class room/ Air
conditioned)
0
B1F1R4(shared office/ Air
diti d)
100
B1F1R6 (shared office/ Air
diti d)
100
B1F1R1 (Conference room/ Air
conditioned)
100
FIRST FLOOR

181
b) Centre for Energy and Environment Building, MNIT Jaipur • Measurement taken on 20th February, 2018 • Time slot for measurement are morning session (10.00am to 11.00am), afternoon session (2.00pm to 3.00pm) and evening session (4.00pm to 5.00pm)
Acoustic ComfortColor Code:
A Class: GreenB Class: Purple
C Class: RedOut of any class: Red
threshold value
Not specified 24.5+-2.5ᴼC 30-70% A class 17-31ᴼC only
Not specified Ambient+350/Ambient+500/Ambient+700
A class<15, B class<25, C class<25
A class<50, B class<100, C class<100
A class<2, B class<9, C class<-
A class<100, B class<500,
C class= -
A class<30, B class<100,
C class= -
A class<40, B class<80, C class< -
A class<40, B class<80, C class= -
A class<50, B class<100,
C class= -
at least 250 EMLis present within at leat
75% of work station/not for class
C
A class>0.7, B class> 0.7,
C class= -
A class<3:1, B class= -, C class= -
A class>90% ,B class>80% ,C class> 80%
Room Code (Utility / Type)
Seating code Ambient Temperature(ᴼC)
Operative temperature(ᴼC)
RH(% ) Floor surface temperature(ᴼ
C)
Air velocity(m/s)
CO2(ppm) PM2.5(ug/m3) PM10(ug/m3) CO (ppm) TVOC(ug/m3) CH2O(ug/m3) SO2(ug/m3) NO2(ug/m3) O3(ug/m3) Illuminance (Lux)
Circadian Lighting Design (EML)
Uniformity of Illuminance within task
area
Ratio of illuminance task area to immediate
surrounding
Percentage of the task area meeting the
required illuminance
Overall Sound pressure Level (dB)
S1 28.5 28.8 36 27.4 0.60 491 28 82 0.28 65 23 160 65 12 218 229 0.82 1.0 68
S2 28.5 28.8 36 28.1 0.55 499 28 84 0.32 69 27 166 63 19 355 379 0.96 1.0 64
S3 28.5 28.9 35 28.1 0.32 487 29 94 0.34 71 29 163 64 21 352 367 0.89 1.0 70
S1 28.5 29.2 34 28.0 0.37 489 28 85 0.26 63 21 159 67 11 234 245 0.93 1.0 69
S2 28.5 28.9 34 27.4 0.20 482 28 96 0.31 68 26 157 57 18 303 317 0.93 1.0 71
S3 28.5 29.2 34 28.1 0.48 493 28 73 0.26 63 21 160 62 11 342 361 0.94 1.0 69
S4 28.5 28.9 34 27.6 0.31 483 29 104 0.35 72 30 156 62 18 330 348 0.96 1.0 66
S1 28.5 29.1 35 27.8 0.10 496 37 166 0.29 66 24 158 65 16 407 433 0.89 1.2 60
S2 28.5 29.2 36 27.8 0.52 499 39 169 0.31 68 26 166 64 16 391 419 0.97 1.3 62
S3 28.5 29.3 36 27.9 0.70 510 39 172 0.32 69 27 172 67 18 293 303 0.83 0.7 67
Occupant satisfaction survey results Building Threshold Value: A class=90% ,B class=80% ,C class= -
Thermal Comfort Indoor Air quality Lighting comfort
Acoustic Comfort
CEE (B2) 85% 92% 84% 76%Building Class B B B -
Indoor air quality lighting comfort
B2F0R1 (shared office/ Air
conditioned)
67
B2F0R2 (Laboratory, shared office / Mixed
mode conditioned)
25
Thermal Comfort
B2F0R3 (shared office/ Air
conditioned)
100
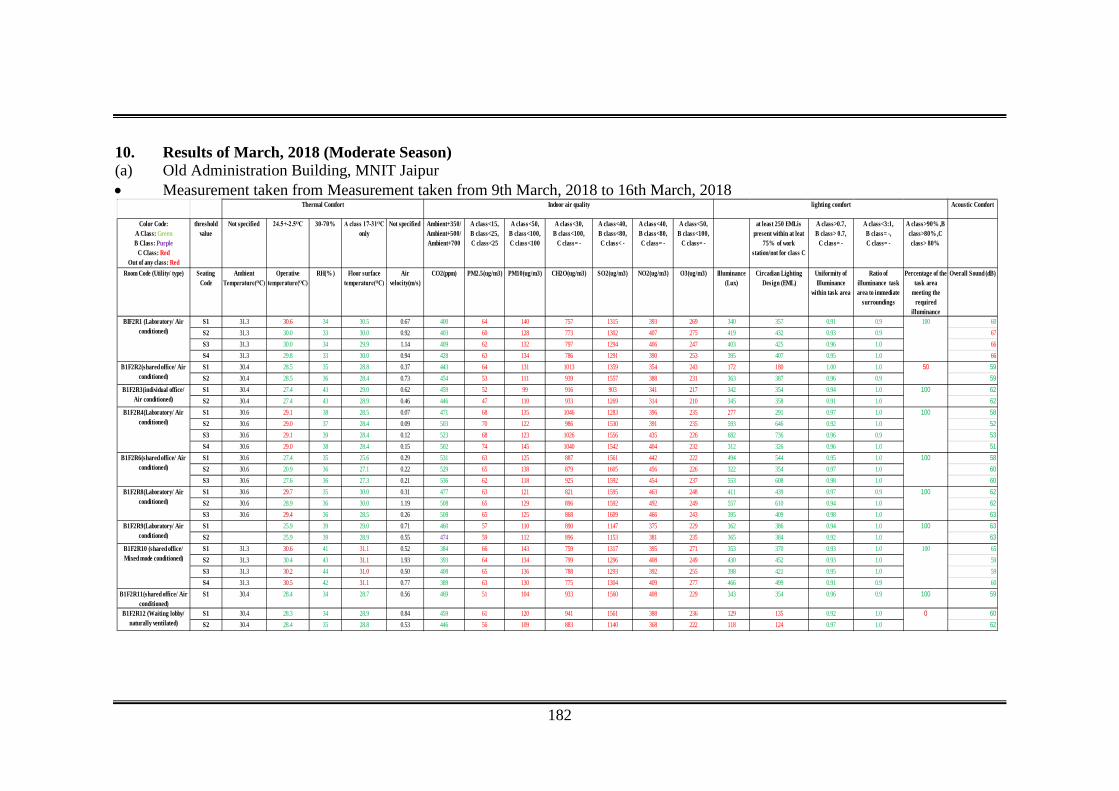
182
10. Results of March, 2018 (Moderate Season) (a) Old Administration Building, MNIT Jaipur • Measurement taken from Measurement taken from 9th March, 2018 to 16th March, 2018
Acoustic Comfort
Color Code:A Class: GreenB Class: Purple
C Class: RedOut of any class: Red
threshold value
Not specified 24.5+-2.5ᴼC 30-70% A class 17-31ᴼC only
Not specified Ambient+350/Ambient+500/Ambient+700
A class<15, B class<25, C class<25
A class<50, B class<100, C class<100
A class<30, B class<100,
C class= -
A class<40, B class<80, C class< -
A class<40, B class<80, C class= -
A class<50, B class<100,
C class= -
at least 250 EMLis present within at leat
75% of work station/not for class C
A class>0.7, B class> 0.7,
C class= -
A class<3:1, B class= -, C class= -
A class>90% ,B class>80% ,C class> 80%
Room Code (Utility/ type) Seating Code
Ambient Temperature(ᴼC)
Operative temperature(ᴼC)
RH(% ) Floor surface temperature(ᴼC)
Air velocity(m/s)
CO2(ppm) PM2.5(ug/m3) PM10(ug/m3) CH2O(ug/m3) SO2(ug/m3) NO2(ug/m3) O3(ug/m3) Illuminance (Lux)
Circadian Lighting Design (EML)
Uniformity of Illuminance
within task area
Ratio of illuminance task area to immediate
surroundings
Percentage of the task area
meeting the required
illuminance
Overall Sound (dB)
S1 31.3 30.6 34 30.5 0.67 400 64 140 757 1315 393 269 340 357 0.91 0.9 60S2 31.3 30.0 33 30.0 0.92 403 60 128 773 1302 407 275 419 432 0.93 0.9 67S3 31.3 30.0 34 29.9 1.14 409 62 132 797 1294 406 247 403 425 0.96 1.0 66S4 31.3 29.8 33 30.0 0.94 428 63 134 786 1291 390 253 395 407 0.95 1.0 66S1 30.4 28.5 35 28.8 0.37 443 64 131 1013 1359 354 243 172 180 1.00 1.0 59
S2 30.4 28.5 36 28.4 0.73 454 53 111 939 1557 388 231 363 387 0.96 0.9 59
S1 30.4 27.4 43 29.0 0.62 459 52 99 916 903 341 217 342 354 0.94 1.0 62
S2 30.4 27.4 43 28.9 0.46 446 47 110 933 1269 314 210 345 358 0.91 1.0 62
S1 30.6 29.1 38 28.5 0.07 471 68 135 1046 1283 396 235 277 291 0.97 1.0 58
S2 30.6 29.0 37 28.4 0.09 503 70 122 986 1530 391 235 593 646 0.92 1.0 52
S3 30.6 29.1 39 28.4 0.12 523 68 123 1026 1556 435 226 682 736 0.96 0.9 53
S4 30.6 29.0 38 28.4 0.15 502 74 145 1040 1542 404 232 312 326 0.96 1.0 51
S1 30.6 27.4 35 25.6 0.29 531 63 125 887 1561 442 222 494 544 0.95 1.0 58
S2 30.6 20.9 36 27.1 0.22 529 65 138 879 1605 456 226 322 354 0.97 1.0 60
S3 30.6 27.6 36 27.3 0.21 536 62 118 925 1592 454 237 553 608 0.98 1.0 60
S1 30.6 29.7 35 30.0 0.31 477 63 121 821 1595 463 248 411 439 0.97 0.9 62
S2 30.6 28.9 36 30.0 1.19 508 65 129 896 1592 492 249 557 610 0.94 1.0 62
S3 30.6 29.4 36 28.5 0.26 508 65 125 868 1609 466 243 395 409 0.98 1.0 63
S1 25.9 39 29.0 0.71 460 57 110 890 1147 375 229 362 386 0.94 1.0 63
S2 25.9 39 28.9 0.55 474 59 112 896 1153 381 235 365 384 0.92 1.0 63
S1 31.3 30.6 41 31.1 0.52 384 66 143 759 1317 395 271 353 370 0.93 1.0 65S2 31.3 30.4 43 31.1 1.93 393 64 134 799 1296 408 249 430 452 0.93 1.0 59S3 31.3 30.2 44 31.0 0.50 408 65 136 788 1293 392 255 398 421 0.95 1.0 59S4 31.3 30.5 42 31.1 0.77 389 63 130 775 1304 409 277 466 499 0.91 0.9 60
B1F2R11(shared office/ Air conditioned)
S1 30.4 28.4 34 28.7 0.56 469 51 104 933 1560 408 229 343 354 0.96 0.9 100 59
S1 30.4 28.3 34 28.9 0.84 459 61 120 941 1561 388 236 129 135 0.92 1.0 60
S2 30.4 28.4 35 28.8 0.53 446 56 109 883 1140 368 222 118 124 0.97 1.0 62
BIF2R1 (Laboratory/ Air conditioned)
100
Thermal Comfort Indoor air quality lighting comfort
B1F2R2(shared office/ Air conditioned)
50
B1F2R3(individual office/ Air conditioned)
100
B1F2R4(Laboratory/ Air conditioned)
100
B1F2R6(shared office/ Air conditioned)
100
B1F2R8(Laboratory/ Air conditioned)
100
B1F2R9(Laboratory/ Air conditioned)
100
B1F2R10 (shared office/ Mixed mode conditioned)
100
B1F2R12 (Waiting lobby/ naturally ventilated)
0

183
S1 32.2 29.4 29 30.2 0.74 421 76 154 685 1262 442 263 343 353 0.97 1.0 64
S2 32.2 29.4 26 30.1 0.70 423 60 112 693 1252 439 267 344 357 0.99 1.0 64
S3 32.2 29.1 30 30.1 0.80 425 63 129 666 1267 408 269 380 392 0.97 1.2 64
S1 32.2 30.6 27 31.0 0.86 420 60 125 564 1268 433 264 181 188 0.98 1.0 66
S2 32.2 30.9 27 30.8 1.51 414 69 135 777 1236 424 262 107 111 0.93 1.0 65
S3 32.2 30.9 27 30.9 0.85 411 68 134 766 1237 408 266 299 307 0.92 1.0 67
S4 32.2 29.5 29 30.8 0.59 435 61 122 494 1161 436 249 179 189 0.90 0.9 66
S1 32.2 28.1 29 29.5 1.04 551 63 125 559 1167 409 244 459 485 0.86 1.0 63
S2 32.2 27.7 28 28.7 1.11 558 59 120 610 1192 434 258 324 336 0.98 1.0 63
S1 32.2 26.1 29 25.8 0.72 723 62 122 653 1239 458 251 538 563 0.94 1.1 66
S2 32.2 27.4 26 25.9 0.46 663 63 117 729 1236 431 245 352 364 0.95 1.0 65
S1 32.2 29.2 32 29.8 0.73 726 64 124 597 1270 432 263 162 167 0.98 1.0 65
S2 32.2 28.8 31 29.8 0.50 718 62 122 592 1302 436 260 227 237 0.95 1.0 65
B1F1R8 (individual office/ Air conditioned )
S1 32.2 28.4 25 29.6 0.46 489 62 121 692 1242 432 254 356 365 0.97 0.9 100 64
S1 32.2 30.1 35 30.2 0.63 527 64 132 709 1268 422 265 98 101 0.97 0.9 62
S2 32.2 30.2 35 30.3 1.23 518 66 136 670 1260 442 277 102 107 0.95 1.0 62
S1 31.9 29.9 28 30.3 0.46 897 53 107 958 1567 401 218 235 246 0.80 1.0 73
S2 31.9 30.0 28 30.3 0.59 885 64 116 954 1582 405 232 203 213 0.94 1.0 72
S3 31.9 29.7 34 30.1 0.53 896 64 132 942 1571 417 250 181 190 0.99 0.9 70
S4 31.9 30.0 29 30.3 1.76 903 67 123 968 1569 385 221 188 197 0.98 1.0 71
S1 31.9 30.3 31 30.6 0.53 801 69 140 1024 1372 371 248 320 334 0.90 0.9 70
S2 31.9 30.1 33 30.4 0.42 829 58 127 893 1590 463 220 592 617 0.99 1.0 66
S3 31.9 30.3 32 30.6 0.47 804 60 127 856 1578 457 236 473 494 0.98 1.0 68
S4 31.9 30.2 32 30.5 0.30 810 55 110 898 1579 462 215 589 614 0.98 1.0 67
S1 31.9 29.9 30 30.2 0.28 806 63 114 976 1520 422 220 314 329 1.00 0.9 64
S2 31.9 29.9 29 30.2 0.40 805 64 140 929 1533 406 223 300 313 0.95 1.1 70
S3 31.9 30.0 29 30.3 0.91 805 62 116 897 1547 407 219 409 427 0.96 1.0 70
S4 31.9 29.9 29 30.2 0.49 804 57 113 882 1563 435 226 272 284 0.85 1.3 66
Thermal Comfort
Indoor Air quality
Lighting comfort
Acoustic Comfort
Old Admin Block (B1) 76% 78% 81% 72%
Building Class - B B -
B1F1R1 (Conference room/ Air conditioned)
100
FIRST FLOOR
B1F1R3 ( combined two class room/ Air conditioned)
0
B1F1R4(shared office/ Air conditioned)
100
B1F1R6 (shared office/ Air conditioned)
100
Building
Threshold Value: A class=90% ,B class=80% ,C class= -
B1F1R7 (shared office/ Air conditioned)
0
B1F1R10 (Waiting Room/ Air conditioned)
0
Ground FloorB1F0R1 (Classroom / naturally ventilated)
0
B1F0R2 (Classroom / naturally ventilated)
100
B1F0R4 (Classroom / naturally ventilated)
50
Occupant satisfaction survey results
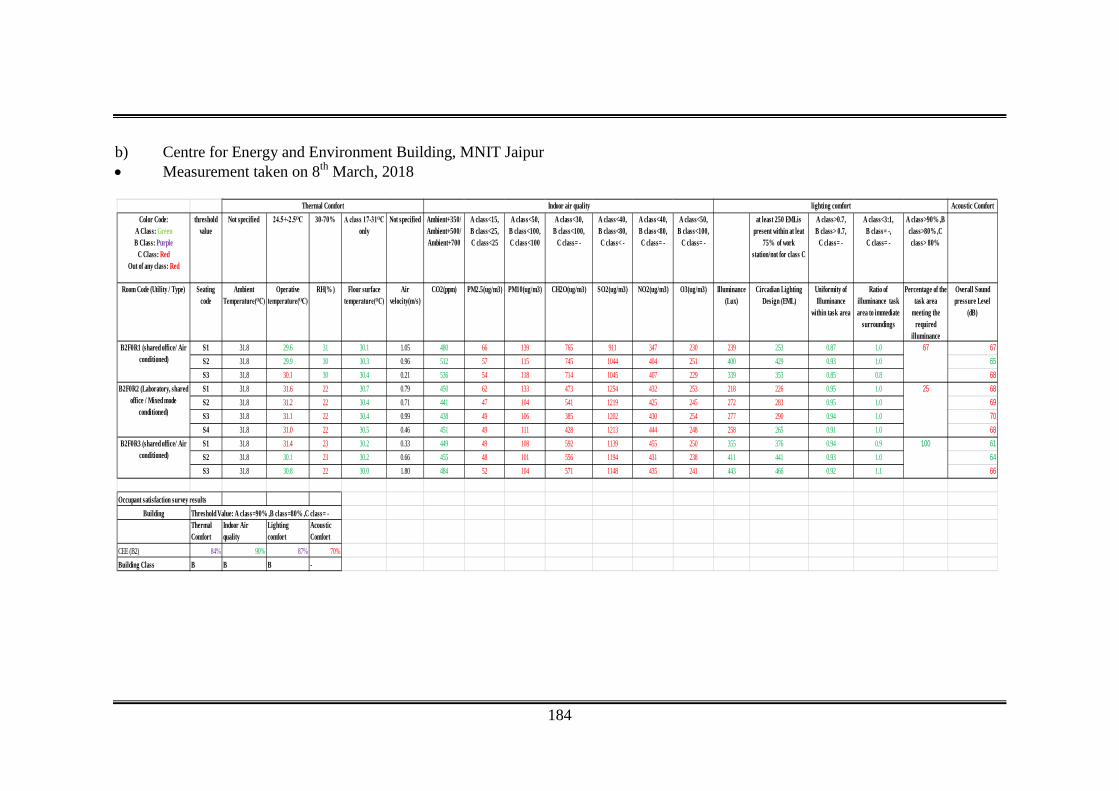
184
b) Centre for Energy and Environment Building, MNIT Jaipur • Measurement taken on 8th March, 2018
Acoustic ComfortColor Code:
A Class: GreenB Class: Purple
C Class: RedOut of any class: Red
threshold value
Not specified 24.5+-2.5ᴼC 30-70% A class 17-31ᴼC only
Not specified Ambient+350/Ambient+500/Ambient+700
A class<15, B class<25, C class<25
A class<50, B class<100, C class<100
A class<30, B class<100,
C class= -
A class<40, B class<80, C class< -
A class<40, B class<80, C class= -
A class<50, B class<100,
C class= -
at least 250 EMLis present within at leat
75% of work station/not for class C
A class>0.7, B class> 0.7,
C class= -
A class<3:1, B class= -, C class= -
A class>90% ,B class>80% ,C class> 80%
Room Code (Utility / Type) Seating code
Ambient Temperature(ᴼC)
Operative temperature(ᴼC)
RH(% ) Floor surface temperature(ᴼC)
Air velocity(m/s)
CO2(ppm) PM2.5(ug/m3) PM10(ug/m3) CH2O(ug/m3) SO2(ug/m3) NO2(ug/m3) O3(ug/m3) Illuminance (Lux)
Circadian Lighting Design (EML)
Uniformity of Illuminance
within task area
Ratio of illuminance task area to immediate
surroundings
Percentage of the task area
meeting the required
illuminance
Overall Sound pressure Level
(dB)
S1 31.8 29.6 31 30.1 1.05 480 66 139 765 911 347 230 239 253 0.87 1.0 67
S2 31.8 29.9 30 30.3 0.96 512 57 115 745 1044 404 251 400 429 0.93 1.0 65
S3 31.8 30.1 30 30.4 0.21 536 54 118 714 1045 407 229 339 353 0.85 0.8 68
S1 31.8 31.6 22 30.7 0.79 450 62 133 473 1254 432 253 218 226 0.95 1.0 68
S2 31.8 31.2 22 30.4 0.71 441 47 104 541 1219 425 245 272 283 0.95 1.0 69
S3 31.8 31.1 22 30.4 0.99 438 49 106 385 1202 430 254 277 290 0.94 1.0 70
S4 31.8 31.0 22 30.5 0.46 451 49 111 428 1213 444 248 258 265 0.91 1.0 68
S1 31.8 31.4 23 30.2 0.33 449 49 108 592 1139 455 250 355 376 0.94 0.9 61
S2 31.8 30.1 23 30.2 0.66 455 48 101 556 1194 431 238 411 441 0.93 1.0 64
S3 31.8 30.8 22 30.0 1.80 484 52 104 571 1148 435 241 443 466 0.92 1.1 66
Occupant satisfaction survey results Building Threshold Value: A class=90% ,B class=80% ,C class= -
Thermal Comfort
Indoor Air quality
Lighting comfort
Acoustic Comfort
CEE (B2) 84% 90% 87% 70%Building Class B B B -
Indoor air quality lighting comfort
B2F0R1 (shared office/ Air conditioned)
67
B2F0R2 (Laboratory, shared office / Mixed mode
conditioned)
25
Thermal Comfort
B2F0R3 (shared office/ Air conditioned)
100
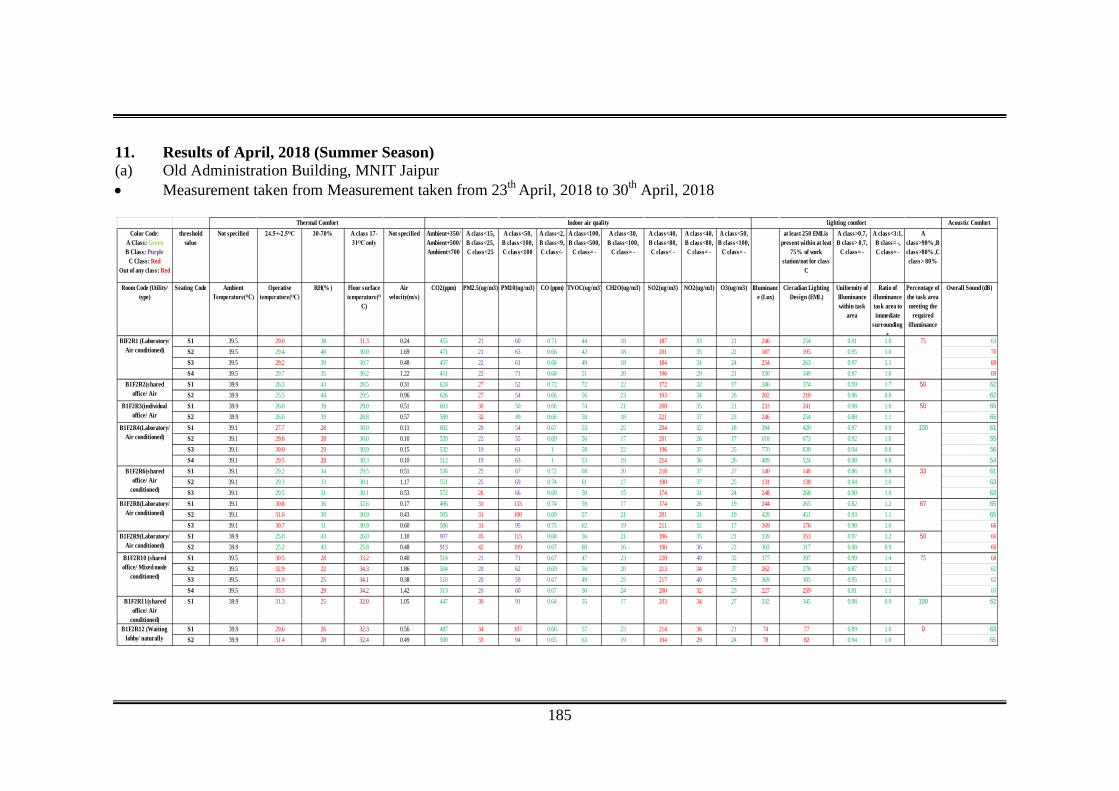
185
11. Results of April, 2018 (Summer Season) (a) Old Administration Building, MNIT Jaipur • Measurement taken from Measurement taken from 23th April, 2018 to 30th April, 2018
Acoustic ComfortColor Code:
A Class: GreenB Class: Purple
C Class: RedOut of any class: Red
threshold value
Not specified 24.5+-2.5ᴼC 30-70% A class 17-31ᴼC only
Not specified Ambient+350/Ambient+500/Ambient+700
A class<15, B class<25, C class<25
A class<50, B class<100, C class<100
A class<2, B class<9, C class<-
A class<100, B class<500,
C class= -
A class<30, B class<100,
C class= -
A class<40, B class<80, C class< -
A class<40, B class<80, C class= -
A class<50, B class<100,
C class= -
at least 250 EMLis present within at leat
75% of work station/not for class
C
A class>0.7, B class> 0.7,
C class= -
A class<3:1, B class= -, C class= -
A class>90% ,B class>80% ,C class> 80%
Room Code (Utility/ type)
Seating Code Ambient Temperature(ᴼC)
Operative temperature(ᴼC)
RH(% ) Floor surface temperature(ᴼ
C)
Air velocity(m/s)
CO2(ppm) PM2.5(ug/m3) PM10(ug/m3) CO (ppm) TVOC(ug/m3) CH2O(ug/m3) SO2(ug/m3) NO2(ug/m3) O3(ug/m3) Illuminance (Lux)
Circadian Lighting Design (EML)
Uniformity of Illuminance within task
area
Ratio of illuminance task area to immediate
surroundings
Percentage of the task area meeting the
required illuminance
Overall Sound (dB)
S1 39.5 29.0 38 31.3 0.24 455 21 60 0.71 44 18 187 33 21 246 254 0.91 1.0 63S2 39.5 29.4 40 30.0 1.69 471 21 63 0.66 42 18 201 35 22 187 195 0.95 1.0 70S3 39.5 29.2 39 30.7 0.48 457 22 61 0.66 49 18 184 31 24 254 263 0.97 1.1 69S4 39.5 29.7 35 30.2 1.22 451 22 71 0.68 51 20 196 29 21 330 349 0.97 1.0 69S1 39.9 26.3 43 28.5 0.31 624 27 52 0.72 72 22 172 32 17 346 374 0.59 1.7 62
S2 39.9 25.5 44 29.5 0.96 626 27 54 0.66 56 23 193 34 26 202 210 0.96 0.8 62
S1 39.9 26.0 39 29.0 0.51 603 30 50 0.66 74 21 208 35 21 233 241 0.98 1.0 65
S2 39.9 26.0 39 28.8 0.57 589 32 49 0.66 58 18 221 37 23 246 254 0.88 1.1 65
S1 39.1 27.7 28 30.0 0.11 602 20 54 0.67 53 25 204 32 18 394 420 0.97 0.9 61
S2 39.1 29.8 28 30.0 0.10 520 22 55 0.69 56 17 201 26 17 618 673 0.92 1.0 55
S3 39.1 30.0 29 30.9 0.15 532 19 61 1 58 22 196 37 25 770 830 0.94 0.8 56
S4 39.1 29.5 28 30.3 0.10 512 19 63 1 53 19 214 36 26 489 524 0.98 0.8 54
S1 39.1 29.2 34 29.5 0.51 536 25 67 0.72 68 20 218 37 27 140 148 0.86 0.8 61
S2 39.1 29.3 33 30.1 1.17 551 25 69 0.74 61 17 190 37 25 131 138 0.94 1.0 63
S3 39.1 29.5 31 30.1 0.53 572 26 66 0.69 50 15 174 31 24 248 268 0.90 1.0 63
S1 39.1 30.8 36 32.6 0.17 406 31 133 0.74 59 17 174 26 19 244 265 0.82 1.2 65
S2 39.1 31.6 30 30.9 0.43 505 31 100 0.69 57 21 201 31 19 428 451 0.93 1.1 65
S3 39.1 30.7 31 30.9 0.60 506 31 95 0.75 62 19 211 32 17 169 176 0.90 1.0 66S1 39.9 25.0 43 26.0 1.10 907 45 115 0.68 56 21 196 35 21 339 353 0.97 1.2 66S2 39.9 25.2 43 25.8 0.48 913 42 109 0.67 60 16 190 36 22 303 317 0.98 0.9 66S1 39.5 30.5 28 33.2 0.40 514 21 71 0.67 47 23 228 40 32 377 397 0.99 1.4 68S2 39.5 32.9 22 34.3 1.86 504 20 62 0.69 56 20 213 34 37 262 278 0.87 1.1 62S3 39.5 31.9 25 34.1 0.38 518 20 59 0.67 49 25 217 40 29 369 385 0.95 1.1 62S4 39.5 33.5 29 34.2 1.42 513 20 60 0.67 50 24 200 32 23 227 239 0.91 1.1 63
B1F2R11(shared office/ Air
conditioned)
S1 39.9 31.3 25 32.0 1.05 447 30 91 0.64 55 17 203 34 27 332 345 0.98 0.9 100 62
S1 39.9 29.6 26 32.3 0.56 487 34 107 0.66 57 23 214 36 21 74 77 0.89 1.0 63
S2 39.9 31.4 28 32.4 0.49 500 33 94 0.65 63 19 194 29 24 78 82 0.94 1.0 65
B1F2R6(shared office/ Air
conditioned)
33
B1F2R8(Laboratory/ Air conditioned)
67
B1F2R9(Laboratory/ Air conditioned)
50
B1F2R10 (shared office/ Mixed mode
conditioned)
75
B1F2R12 (Waiting lobby/ naturally
til t d)
0
B1F2R2(shared office/ Air
diti d)
50
B1F2R3(individual office/ Air
diti d)
50
B1F2R4(Laboratory/ Air conditioned)
100
BIF2R1 (Laboratory/ Air conditioned)
75
Thermal Comfort Indoor air quality lighting comfort

186
S1 35.2 30.4 21 31.5 0.55 536 20 44 0.68 71 37 243 53 30 308 325 0.58 0.9 62S2 35.2 29.4 22 30.6 0.66 554 20 46 0.71 72 35 235 54 29 275 286 0.95 0.9 62
S3 35.2 32.9 24 32.7 0.71 580 21 49 0.70 75 41 262 62 46 220 230 0.96 1.0 62
S1 35.2 32.5 18 33.9 0.61 518 28 81 0.74 72 27 165 38 22 255 274 0.96 1.0 64S2 35.2 32.4 18 33.7 0.49 499 27 74 0.72 63 29 183 41 20 207 223 0.92 1.1 63
S3 35.2 32.6 18 33.9 0.57 506 26 72 0.78 67 29 190 44 22 441 475 0.88 1.2 65
S4 35.2 32.1 17 33.5 0.69 501 27 79 0.70 69 30 188 38 25 210 225 0.86 1.1 64
S1 35.2 29.1 32 30.3 0.53 663 23 48 0.69 71 34 227 54 39 477 504 0.93 1.0 61
S2 35.2 28.9 32 30.1 0.47 652 24 50 0.70 71 38 223 51 36 467 492 0.95 1.0 61
S1 35.2 29.5 29 30.6 0.32 683 16 36 0.73 74 45 243 58 36 391 414 0.96 1.1 64
S2 35.2 29.0 31 30.1 0.39 693 18 40 0.72 75 35 222 45 29 286 305 0.93 0.9 63
S1 35.2 30.3 28 31.3 0.37 572 20 42 0.79 85 38 207 49 31 170 177 0.82 1.0 63
S2 35.2 30.0 28 30.9 0.18 585 20 46 0.74 85 35 223 51 29 257 273 0.94 1.1 63
B1F1R8 (individual office/ Air
conditioned )
S1 35.2 28.1 36 29.3 1.02 559 25 52 0.69 71 37 209 39 26 489 505 0.93 1.0 100 62
S1 35.2 30.3 24 31.8 0.15 564 23 56 0.71 73 40 229 50 28 81 84 0.96 0.9 60
S2 35.2 31.1 24 32.4 0.14 563 23 56 0.77 77 37 216 51 26 86 89 0.95 1.0 60
S1 41.1 36.6 26 36.3 0.59 867 60 189 0.61 63 35 255 45 21 181 186 0.99 0.9 78
S2 41.1 36.5 25 36.2 0.64 880 59 195 0.55 57 29 253 44 19 171 177 0.71 1.0 77
S3 41.1 37.0 26 36.7 0.45 905 59 180 0.57 67 26 235 42 14 282 301 0.99 1.0 75
S4 41.1 35.1 24 34.8 0.55 760 59 189 0.53 61 31 245 42 14 154 159 0.94 0.8 76
S1 41.1 35.9 25 35.6 0.61 875 59 189 0.56 77 23 223 40 14 322 337 0.92 0.9 75
S2 41.1 35.4 24 35.1 0.96 897 59 176 0.61 75 22 196 34 13 386 408 0.82 1.1 71
S3 41.1 35.4 24 35.1 0.96 897 59 176 0.61 75 22 196 34 13 386 408 0.82 1.1 73
S4 41.1 34.6 24 34.3 0.53 863 59 172 0.56 71 22 203 37 15 315 332 0.98 1.0 72
S1 41.1 35.7 24 35.4 0.62 879 59 190 0.51 66 33 242 45 20 284 298 0.97 0.9 69
S2 41.1 34.7 24 34.4 0.58 777 59 182 0.57 69 25 246 46 30 320 335 0.89 1.0 75
S3 41.1 35.2 24 34.9 0.69 922 60 191 0.64 62 32 229 33 21 412 437 0.92 1.0 75
S4 41.1 34.4 23 34.1 1.67 884 59 198 0.60 60 22 211 28 19 566 608 0.97 1.0 71
Thermal Comfort Indoor Air quality Lighting comfort
Acoustic Comfort
Old Admin Block (B1) 78% 82% 85% 77%
Building Class - B B -
Building
Threshold Value: A class=90% ,B class=80% ,C class= -
B1F1R7 (shared office/ Air
diti d)
0
B1F1R10 (Waiting Room/ Air
conditioned)
0
Ground FloorB1F0R1 (Classroom / naturally ventilated)
25
B1F0R2 (Classroom / naturally ventilated)
100
B1F0R4 (Classroom / naturally ventilated)
75
Occupant satisfaction survey results
B1F1R3 ( combined two class room/ Air
conditioned)
50
B1F1R4(shared office/ Air
diti d)
100
B1F1R6 (shared office/ Air
diti d)
50
B1F1R1 (Conference room/ Air
conditioned)
67
FIRST FLOOR
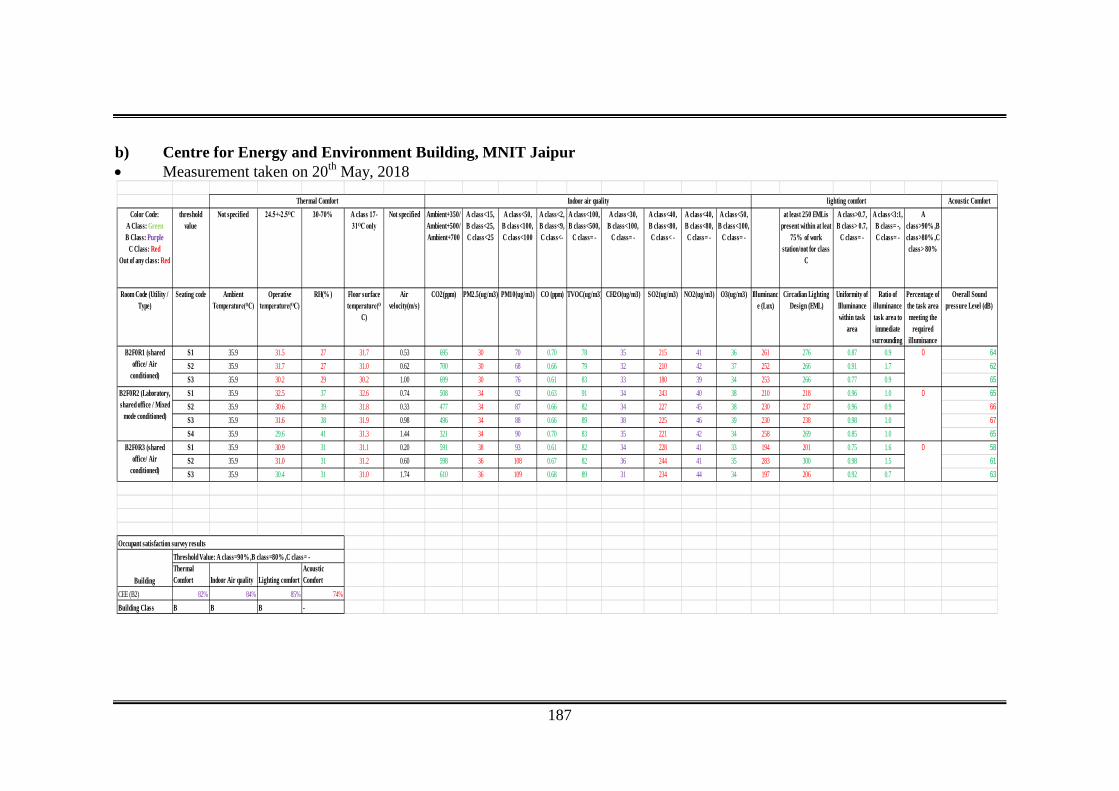
187
b) Centre for Energy and Environment Building, MNIT Jaipur • Measurement taken on 20th May, 2018
Acoustic ComfortColor Code:
A Class: GreenB Class: Purple
C Class: RedOut of any class: Red
threshold value
Not specified 24.5+-2.5ᴼC 30-70% A class 17-31ᴼC only
Not specified Ambient+350/Ambient+500/Ambient+700
A class<15, B class<25, C class<25
A class<50, B class<100, C class<100
A class<2, B class<9, C class<-
A class<100, B class<500,
C class= -
A class<30, B class<100,
C class= -
A class<40, B class<80, C class< -
A class<40, B class<80, C class= -
A class<50, B class<100,
C class= -
at least 250 EMLis present within at leat
75% of work station/not for class
C
A class>0.7, B class> 0.7,
C class= -
A class<3:1, B class= -, C class= -
A class>90% ,B class>80% ,C class> 80%
Room Code (Utility / Type)
Seating code Ambient Temperature(ᴼC)
Operative temperature(ᴼC)
RH(% ) Floor surface temperature(ᴼ
C)
Air velocity(m/s)
CO2(ppm) PM2.5(ug/m3) PM10(ug/m3) CO (ppm) TVOC(ug/m3) CH2O(ug/m3) SO2(ug/m3) NO2(ug/m3) O3(ug/m3) Illuminance (Lux)
Circadian Lighting Design (EML)
Uniformity of Illuminance within task
area
Ratio of illuminance task area to immediate
surrounding
Percentage of the task area meeting the
required illuminance
Overall Sound pressure Level (dB)
S1 35.9 31.5 27 31.7 0.53 695 30 70 0.70 78 35 215 41 36 261 276 0.87 0.9 64
S2 35.9 31.7 27 31.0 0.62 700 30 68 0.66 79 32 210 42 37 252 266 0.91 1.7 62
S3 35.9 30.2 29 30.2 1.00 699 30 76 0.61 83 33 180 39 34 253 266 0.77 0.9 65
S1 35.9 32.5 37 32.6 0.74 508 34 92 0.63 91 34 243 40 38 210 218 0.96 1.0 65
S2 35.9 30.6 39 31.8 0.33 477 34 87 0.66 82 34 227 45 38 230 237 0.96 0.9 66
S3 35.9 31.6 38 31.9 0.98 496 34 88 0.66 89 38 225 46 39 230 238 0.98 1.0 67
S4 35.9 29.6 41 31.3 1.44 321 34 90 0.70 83 35 221 42 34 258 269 0.85 1.0 65
S1 35.9 30.9 31 31.1 0.20 591 38 93 0.61 82 34 228 41 33 194 201 0.75 1.6 58
S2 35.9 31.0 31 31.2 0.60 598 36 108 0.67 82 36 244 41 35 283 300 0.98 1.5 61
S3 35.9 30.4 31 31.0 1.74 610 36 109 0.68 89 31 234 44 34 197 206 0.92 0.7 63
Thermal Comfort Indoor Air quality Lighting comfort
Acoustic Comfort
CEE (B2) 82% 84% 85% 74% Building Class B B B -
Indoor air quality lighting comfort
B2F0R1 (shared office/ Air
conditioned)
0
B2F0R2 (Laboratory, shared office / Mixed
mode conditioned)
0
Thermal Comfort
B2F0R3 (shared office/ Air
conditioned)
0
Occupant satisfaction survey results
Building
Threshold Value: A class=90% ,B class=80% ,C class= -

188
12. Results of May, 2018 (Summer Season) (b) Old Administration Building, MNIT Jaipur • Measurement taken from Measurement taken from 16th May, 2018 to 24th May, 2018
Acoustic ComfortColor Code:
A Class: GreenB Class: Purple
C Class: RedOut of any class: Red
threshold value
Not specified 24.5+-2.5ᴼC 30-70% A class 17-31ᴼC only
Not specified Ambient+350/Ambient+500/Ambient+700
A class<15, B class<25, C class<25
A class<50, B class<100, C class<100
A class<2, B class<9, C class<-
A class<100, B class<500,
C class= -
A class<30, B class<100,
C class= -
A class<40, B class<80, C class< -
A class<40, B class<80, C class= -
A class<50, B class<100,
C class= -
at least 250 EMLis present within at leat
75% of work station/not for class
C
A class>0.7, B class> 0.7,
C class= -
A class<3:1, B class= -, C class= -
A class>90% ,B class>80% ,C class> 80%
Room Code (Utility/ type)
Seating Code Ambient Temperature(ᴼC)
Operative temperature(ᴼC)
RH(% ) Floor surface temperature(ᴼ
C)
Air velocity(m/s)
CO2(ppm) PM2.5(ug/m3) PM10(ug/m3) CO (ppm) TVOC(ug/m3) CH2O(ug/m3) SO2(ug/m3) NO2(ug/m3) O3(ug/m3) Illuminance (Lux)
Circadian Lighting Design (EML)
Uniformity of Illuminance within task
area
Ratio of illuminance task area to immediate
surroundings
Percentage of the task area meeting the
required illuminance
Overall Sound (dB)
S1 38.3 31.8 48 34.7 0.22 463 50 127 0.67 63 47 268 50 25 342 357 0.91 1.0 64S2 38.3 31.7 48 33.6 2.10 456 42 129 0.70 70 33 250 51 28 230 242 0.97 0.9 71S3 38.3 31.2 49 32.9 0.73 460 55 137 0.66 68 30 227 47 24 260 270 0.99 1.0 70S4 38.3 30.8 51 32.6 0.69 465 51 131 0.67 64 31 256 49 27 322 340 0.95 1.0 70S1 40.1 28.1 42 30.4 0.93 609 23 51 0.67 51 19 222 32 20 198 206 0.94 0.9 63
S2 40.1 28.4 42 30.6 0.57 605 24 48 0.70 51 20 204 26 15 143 152 0.94 1.3 63
S1 40.1 29.6 36 30.9 0.47 730 31 67 0.62 51 22 236 39 25 245 252 0.98 1.0 66
S2 40.1 28.7 36 29.8 0.29 753 29 54 0.64 48 24 226 38 17 257 274 0.89 1.1 66
S1 40.1 30.6 28 32.1 0.25 585 28 65 0.67 59 15 193 32 16 298 314 0.92 0.9 62
S2 40.1 30.1 30 31.8 0.16 603 26 57 0.64 49 21 199 31 12 514 559 0.92 1.0 56
S3 40.1 29.1 29 33.2 0.12 548 28 59 0.60 48 24 233 36 19 519 553 0.90 0.8 57
S4 40.1 29.3 29 31.3 0.33 543 27 54 0.62 49 19 216 33 13 473 506 0.98 0.8 55
S1 38.9 29.9 41 31.0 0.92 709 35 67 0.57 55 23 247 32 23 151 160 0.89 0.9 62
S2 38.9 30.0 41 31.4 0.88 716 34 64 0.57 59 18 246 36 20 169 179 0.96 0.5 64
S3 38.9 30.7 40 31.5 0.31 735 32 64 0.56 57 28 259 40 24 268 289 0.76 1.0 64
S1 38.9 30.5 44 31.6 0.19 525 61 132 0.55 55 22 248 34 23 261 284 0.86 1.1 66
S2 38.9 30.7 45 31.4 1.14 510 60 135 0.57 56 16 228 36 18 429 452 0.87 1.0 66
S3 38.9 31.0 40 32.2 0.34 501 60 127 0.56 56 30 243 38 18 169 175 0.94 1.0 67
S1 40.1 26.5 42 28.9 0.41 648 25 48 0.70 51 14 185 24 17 322 333 0.95 1.0 67
S2 40.1 27.4 43 30.4 0.44 674 25 48 0.69 56 13 182 27 17 323 338 0.94 1.0 67
S1 38.3 33.1 41 35.1 0.36 460 55 124 0.72 68 36 255 43 23 355 372 0.99 1.5 69S2 38.3 34.0 39 35.2 1.40 454 49 133 0.71 62 30 233 50 24 258 274 0.95 1.0 63S3 38.3 34.3 39 35.4 0.63 461 51 130 0.79 62 30 245 47 26 331 344 0.98 1.1 63S4 38.3 34.7 37 35.4 1.62 471 49 124 0.71 63 31 233 46 21 195 204 0.91 1.0 64
B1F2R11(shared office/ Air
conditioned)
S1 38.9 33.7 25 34.8 0.73 470 47 125 0.56 52 31 266 39 22 318 330 0.89 1.0 100 63
S1 38.9 34.3 25 34.7 0.57 473 48 126 0.57 57 23 239 39 21 91 95 0.90 1.1 64
S2 38.9 34.2 25 35.2 0.30 502 48 136 0.59 54 23 233 38 29 79 83 0.86 1.1 66
BIF2R1 (Laboratory/ Air conditioned)
75
Thermal Comfort Indoor air quality lighting comfort
B1F2R2(shared office/ Air
diti d)
0
B1F2R3(individual office/ Air
diti d)
0
B1F2R4(Laboratory/ Air conditioned)
100
B1F2R6(shared office/ Air
conditioned)
0
B1F2R8(Laboratory/ Air conditioned)
33
B1F2R9(Laboratory/ Air conditioned)
100
B1F2R10 (shared office/ Mixed mode
conditioned)
50
B1F2R12 (Waiting lobby/ naturally
til t d)
0
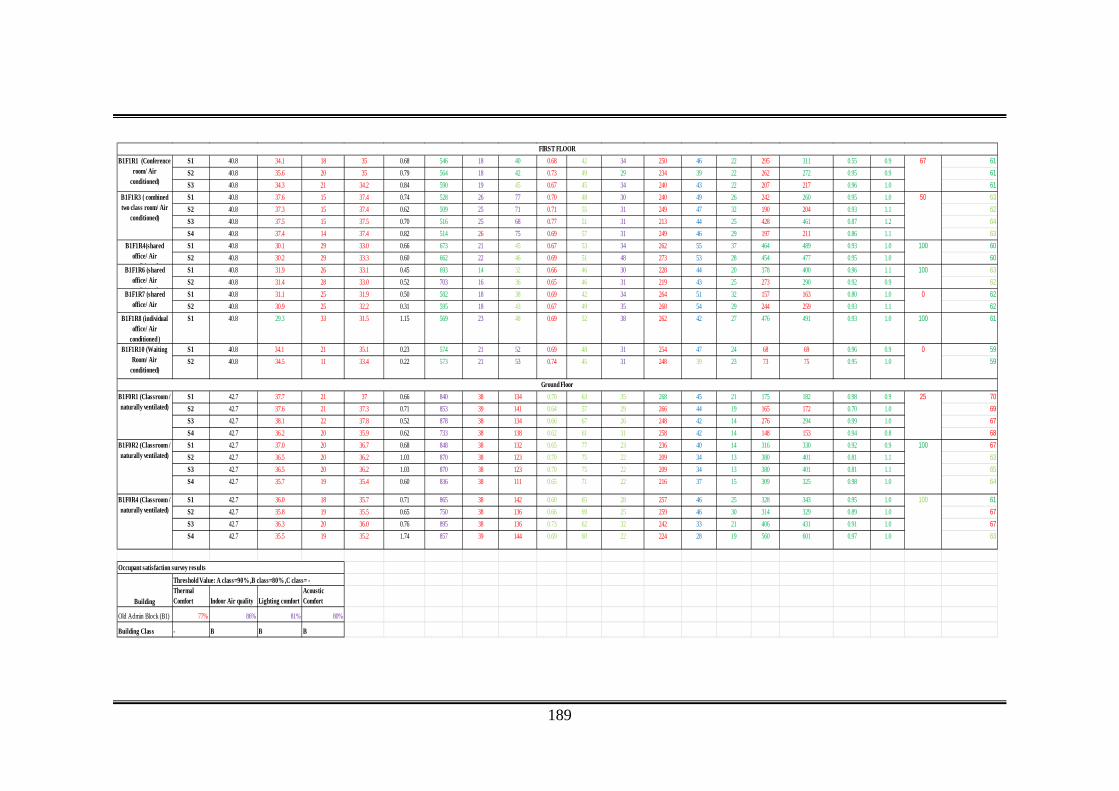
189
S1 40.8 34.1 18 35 0.68 546 18 40 0.68 42 34 250 46 22 295 311 0.55 0.9 61
S2 40.8 35.6 20 35 0.79 564 18 42 0.73 49 29 234 39 22 262 272 0.95 0.9 61
S3 40.8 34.3 21 34.2 0.84 590 19 45 0.67 45 34 240 43 22 207 217 0.96 1.0 61
S1 40.8 37.6 15 37.4 0.74 528 26 77 0.70 48 30 240 49 26 242 260 0.95 1.0 63
S2 40.8 37.3 15 37.4 0.62 509 25 71 0.71 55 31 249 47 32 190 204 0.93 1.1 62
S3 40.8 37.5 15 37.5 0.70 516 25 68 0.77 51 31 213 44 25 428 461 0.87 1.2 64
S4 40.8 37.4 14 37.4 0.82 514 26 75 0.69 57 31 249 46 29 197 211 0.86 1.1 63
S1 40.8 30.1 29 33.0 0.66 673 21 45 0.67 53 34 262 55 37 464 489 0.93 1.0 60
S2 40.8 30.2 29 33.3 0.60 662 22 46 0.69 51 48 273 53 28 454 477 0.95 1.0 60
S1 40.8 31.9 26 33.1 0.45 693 14 32 0.66 46 30 228 44 20 378 400 0.96 1.1 63
S2 40.8 31.4 28 33.0 0.52 703 16 36 0.65 46 31 219 43 25 273 290 0.92 0.9 62
S1 40.8 31.1 25 31.9 0.50 582 18 38 0.69 42 34 264 51 32 157 163 0.80 1.0 62
S2 40.8 30.9 25 32.2 0.31 595 18 43 0.67 49 35 268 54 29 244 259 0.93 1.1 62
B1F1R8 (individual office/ Air
conditioned )
S1 40.8 29.3 33 31.5 1.15 569 23 48 0.69 52 38 262 42 27 476 491 0.93 1.0 100 61
S1 40.8 34.1 21 35.1 0.23 574 21 52 0.69 48 31 254 47 24 68 69 0.96 0.9 59
S2 40.8 34.5 11 33.4 0.22 573 21 53 0.74 45 31 248 39 23 73 75 0.95 1.0 59
S1 42.7 37.7 21 37 0.66 840 38 134 0.70 63 35 268 45 21 175 182 0.98 0.9 70
S2 42.7 37.6 21 37.3 0.71 853 39 141 0.64 57 29 266 44 19 165 172 0.70 1.0 69
S3 42.7 38.1 22 37.8 0.52 878 38 134 0.66 67 26 248 42 14 276 294 0.99 1.0 67
S4 42.7 36.2 20 35.9 0.62 733 38 138 0.62 61 31 258 42 14 148 153 0.94 0.8 68
S1 42.7 37.0 20 36.7 0.68 848 38 132 0.65 77 23 236 40 14 316 330 0.92 0.9 67
S2 42.7 36.5 20 36.2 1.03 870 38 123 0.70 75 22 209 34 13 380 401 0.81 1.1 63
S3 42.7 36.5 20 36.2 1.03 870 38 123 0.70 75 22 209 34 13 380 401 0.81 1.1 65
S4 42.7 35.7 19 35.4 0.60 836 38 111 0.65 71 22 216 37 15 309 325 0.98 1.0 64
S1 42.7 36.0 18 35.7 0.71 865 38 142 0.60 65 28 257 46 25 328 343 0.95 1.0 61
S2 42.7 35.8 19 35.5 0.65 750 38 136 0.66 69 25 259 46 30 314 329 0.89 1.0 67
S3 42.7 36.3 20 36.0 0.76 895 38 136 0.73 62 32 242 33 21 406 431 0.91 1.0 67
S4 42.7 35.5 19 35.2 1.74 857 39 144 0.69 60 22 224 28 19 560 601 0.97 1.0 63
Thermal Comfort Indoor Air quality Lighting comfort
Acoustic Comfort
Old Admin Block (B1) 77% 86% 81% 80%
Building Class - B B B
B1F1R1 (Conference room/ Air
conditioned)
67
FIRST FLOOR
B1F1R3 ( combined two class room/ Air
conditioned)
50
B1F1R4(shared office/ Air
diti d)
100
B1F1R6 (shared office/ Air
diti d)
100
Building
Threshold Value: A class=90% ,B class=80% ,C class= -
B1F1R7 (shared office/ Air
diti d)
0
B1F1R10 (Waiting Room/ Air
conditioned)
0
Ground FloorB1F0R1 (Classroom / naturally ventilated)
25
B1F0R2 (Classroom / naturally ventilated)
100
B1F0R4 (Classroom / naturally ventilated)
100
Occupant satisfaction survey results

190
b) Centre for Energy and Environment Building, MNIT Jaipur • Measurement taken on 25th May, 2018 • Time slot for measurement are morning session (10.00am to 11.00am), afternoon session (2.00pm to 3.00pm) and evening session (4.00pm to 5.00pm)
Acoustic ComfortColor Code:
A Class: GreenB Class: Purple
C Class: RedOut of any class: Red
threshold value
Not specified 24.5+-2.5ᴼC 30-70% A class 17-31ᴼC only
Not specified Ambient+350/Ambient+500/Ambient+700
A class<15, B class<25, C class<25
A class<50, B class<100, C class<100
A class<2, B class<9, C class<-
A class<100, B class<500,
C class= -
A class<30, B class<100,
C class= -
A class<40, B class<80, C class< -
A class<40, B class<80, C class= -
A class<50, B class<100,
C class= -
at least 250 EMLis present within at leat
75% of work station/not for class
C
A class>0.7, B class> 0.7,
C class= -
A class<3:1, B class= -, C class= -
A class>90% ,B class>80% ,C class> 80%
Room Code (Utility / Type)
Seating code Ambient Temperature(ᴼC)
Operative temperature(ᴼC)
RH(% ) Floor surface temperature(ᴼ
C)
Air velocity(m/s)
CO2(ppm) PM2.5(ug/m3) PM10(ug/m3) CO (ppm) TVOC(ug/m3) CH2O(ug/m3) SO2(ug/m3) NO2(ug/m3) O3(ug/m3) Illuminance (Lux)
Circadian Lighting Design (EML)
Uniformity of Illuminance within task
area
Ratio of illuminance task area to immediate
surrounding
Percentage of the task area meeting the
required illuminance
Overall Sound pressure Level (dB)
S1 40.9 34.1 25 34.3 0.62 712 29 67 0.75 71 31 218 37 28 268 284 0.87 0.9 65
S2 40.9 33.9 25 33.6 0.71 717 28 65 0.71 72 28 213 38 29 254 268 0.92 1.7 63
S3 40.9 32.8 27 32.8 1.09 716 28 73 0.66 76 29 183 35 26 260 274 0.78 0.9 66
S1 40.9 35.1 27 32.8 1.09 716 28 73 0.66 76 29 183 35 26 260 274 0.78 0.9 66
S2 40.9 33.2 37 34.4 0.42 494 33 85 0.71 75 30 230 41 30 237 245 0.96 0.9 67
S3 40.9 34.2 36 34.5 1.07 513 32 85 0.71 82 34 228 42 31 237 246 0.98 1.0 68
S4 40.9 32.2 39 33.9 1.53 338 32 87 0.75 76 31 224 38 26 265 277 0.85 1.0 66
S1 40.9 33.5 29 33.7 0.29 608 37 91 0.66 75 30 231 37 25 201 209 0.76 1.6 59
S2 40.9 33.6 29 33.8 0.69 615 34 106 0.72 75 32 247 37 27 290 308 0.98 1.5 62
S3 40.9 33.0 29 33.6 1.83 627 34 106 0.73 82 27 237 40 26 204 213 0.92 0.7 64
Occupant satisfaction survey results Building Threshold Value: A class=90% ,B class=80% ,C class= -
Thermal Comfort Indoor Air quality Lighting comfort
Acoustic Comfort
CEE (B2) 78% 90% 87% 70%Building Class B B B -
Indoor air quality lighting comfort
B2F0R1 (shared office/ Air
conditioned)
0
B2F0R2 (Laboratory, shared office / Mixed
mode conditioned)
0
Thermal Comfort
B2F0R3 (shared office/ Air
conditioned)
0
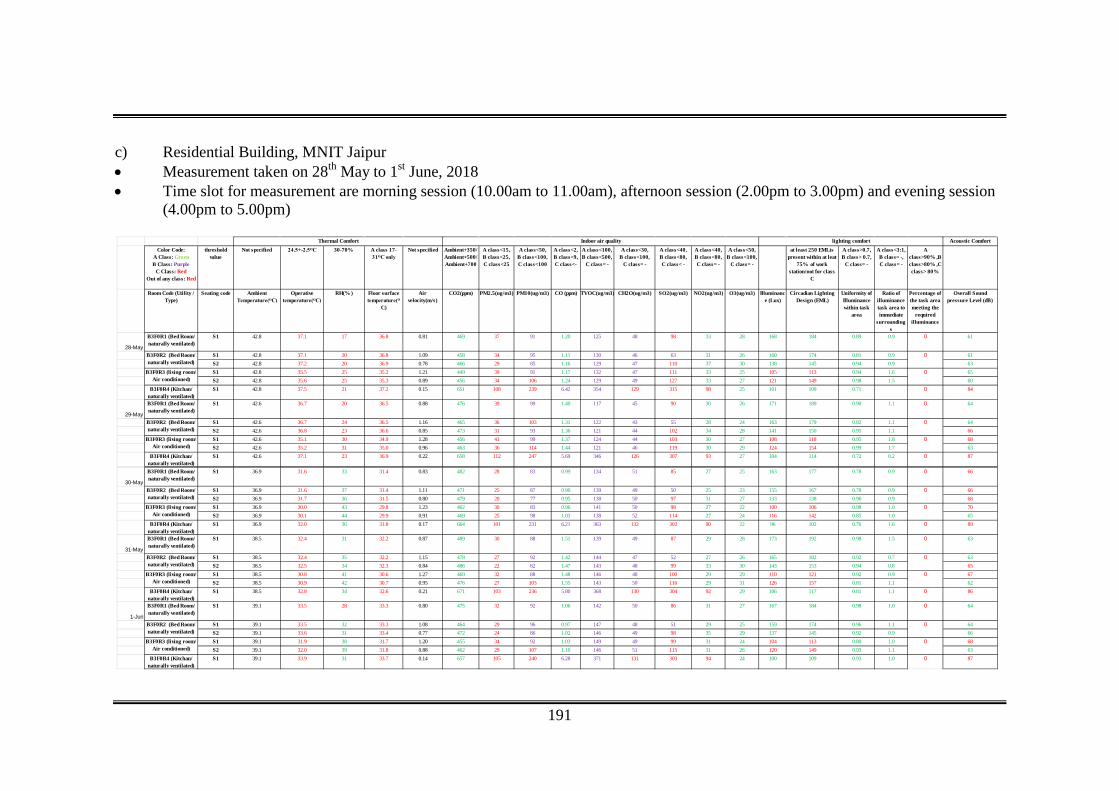
191
c) Residential Building, MNIT Jaipur • Measurement taken on 28th May to 1st June, 2018 • Time slot for measurement are morning session (10.00am to 11.00am), afternoon session (2.00pm to 3.00pm) and evening session (4.00pm to 5.00pm)
Acoustic ComfortColor Code:
A Class: GreenB Class: Purple
C Class: RedOut of any class: Red
threshold value
Not specified 24.5+-2.5ᴼC 30-70% A class 17-31ᴼC only
Not specified Ambient+350/Ambient+500/Ambient+700
A class<15, B class<25, C class<25
A class<50, B class<100, C class<100
A class<2, B class<9, C class<-
A class<100, B class<500,
C class= -
A class<30, B class<100,
C class= -
A class<40, B class<80, C class< -
A class<40, B class<80, C class= -
A class<50, B class<100,
C class= -
at least 250 EMLis present within at leat
75% of work station/not for class
C
A class>0.7, B class> 0.7,
C class= -
A class<3:1, B class= -, C class= -
A class>90% ,B class>80% ,C class> 80%
Room Code (Utility / Type)
Seating code Ambient Temperature(ᴼC)
Operative temperature(ᴼC)
RH(% ) Floor surface temperature(ᴼ
C)
Air velocity(m/s)
CO2(ppm) PM2.5(ug/m3) PM10(ug/m3) CO (ppm) TVOC(ug/m3) CH2O(ug/m3) SO2(ug/m3) NO2(ug/m3) O3(ug/m3) Illuminance (Lux)
Circadian Lighting Design (EML)
Uniformity of Illuminance within task
area
Ratio of illuminance task area to immediate
surroundings
Percentage of the task area meeting the
required illuminance
Overall Sound pressure Level (dB)
28-May
B3F0R1 (Bed Room/ naturally ventilated)
S1 42.8 37.1 17 36.8 0.81 469 37 91 1.20 125 48 98 33 28 168 184 0.89 0.9 0 61
S1 42.8 37.1 20 36.8 1.09 458 34 95 1.11 130 46 63 31 26 160 174 0.81 0.9 61S2 42.8 37.2 20 36.9 0.78 466 29 85 1.16 129 47 110 37 30 138 145 0.94 0.9 63S1 42.8 35.5 25 35.2 1.21 449 39 91 1.17 132 47 111 33 25 105 113 0.94 1.6 65S2 42.8 35.6 25 35.3 0.89 456 34 106 1.24 129 49 127 33 27 121 149 0.98 1.5 60
B3F0R4 (Kitchan/ naturally ventilated)
S1 42.8 37.5 21 37.2 0.15 651 108 239 6.42 354 129 315 98 25 101 109 0.71 0 84
29-May
B3F0R1 (Bed Room/ naturally ventilated)
S1 42.6 36.7 20 36.5 0.88 476 39 99 1.40 117 45 90 30 26 171 189 0.90 1.1 0 64
S1 42.6 36.7 24 36.5 1.16 465 36 103 1.31 122 43 55 28 24 163 179 0.82 1.1 64S2 42.6 36.8 23 36.6 0.85 473 31 93 1.36 121 44 102 34 28 141 150 0.95 1.1 66S1 42.6 35.1 30 34.9 1.28 456 41 99 1.37 124 44 103 30 27 108 118 0.95 1.8 68S2 42.6 35.2 31 35.0 0.96 463 36 114 1.44 121 46 119 30 29 124 154 0.99 1.7 63
B3F0R4 (Kitchan/ naturally ventilated)
S1 42.6 37.1 23 36.9 0.22 658 112 247 5.69 346 126 307 93 27 104 114 0.72 0.2 0 87
B3F0R3 (living room/ Air conditioned)
0
Thermal Comfort Indoor air quality lighting comfort
B3F0R2 (Bed Room/ naturally ventilated)
0
B3F0R2 (Bed Room/ naturally ventilated)
0
B3F0R3 (living room/ Air conditioned)
0
30-May
B3F0R1 (Bed Room/ naturally ventilated)
S1 36.9 31.6 33 31.4 0.83 482 28 83 0.99 134 51 85 27 25 163 177 0.78 0.9 0 66
S1 36.9 31.6 37 31.4 1.11 471 25 87 0.90 139 49 50 25 23 155 167 0.78 0.9 66S2 36.9 31.7 36 31.5 0.80 479 20 77 0.95 138 50 97 31 27 133 138 0.96 0.9 68S1 36.9 30.0 43 29.8 1.23 462 30 83 0.96 141 50 98 27 22 100 106 0.98 1.0 70S2 36.9 30.1 44 29.9 0.91 469 25 98 1.03 138 52 114 27 24 116 142 0.85 1.0 65
B3F0R4 (Kitchan/ naturally ventilated)
S1 36.9 32.0 36 31.8 0.17 664 101 231 6.21 363 132 302 90 22 96 102 0.76 1.6 0 89
31-May
B3F0R1 (Bed Room/ naturally ventilated)
S1 38.5 32.4 31 32.2 0.87 489 30 88 1.51 139 49 87 29 28 173 192 0.98 1.5 0 63
S1 38.5 32.4 35 32.2 1.15 478 27 92 1.42 144 47 52 27 26 165 182 0.92 0.7 63S2 38.5 32.5 34 32.3 0.84 486 22 82 1.47 143 48 99 33 30 143 153 0.94 0.8 65S1 38.5 30.8 41 30.6 1.27 469 32 88 1.48 146 48 100 29 29 110 121 0.92 0.9 67S2 38.5 30.9 42 30.7 0.95 476 27 103 1.55 143 50 116 29 31 126 157 0.81 1.1 62
B3F0R4 (Kitchan/ naturally ventilated)
S1 38.5 32.8 34 32.6 0.21 671 103 236 5.80 368 130 304 92 29 106 117 0.81 1.1 0 86
1-Jun
B3F0R1 (Bed Room/ naturally ventilated)
S1 39.1 33.5 28 33.3 0.80 475 32 92 1.06 142 50 86 31 27 167 184 0.98 1.0 0 64
S1 39.1 33.5 32 33.3 1.08 464 29 96 0.97 147 48 51 29 25 159 174 0.96 1.1 64S2 39.1 33.6 31 33.4 0.77 472 24 86 1.02 146 49 98 35 29 137 145 0.92 0.9 66S1 39.1 31.9 38 31.7 1.20 455 34 92 1.03 149 49 99 31 24 104 113 0.80 1.0 68S2 39.1 32.0 39 31.8 0.88 462 29 107 1.10 146 51 115 31 26 120 149 0.93 1.1 63
B3F0R4 (Kitchan/ naturally ventilated)
S1 39.1 33.9 31 33.7 0.14 657 105 240 6.28 371 131 303 94 24 100 109 0.93 1.0 0 87
B3F0R2 (Bed Room/ naturally ventilated)
0
B3F0R2 (Bed Room/ naturally ventilated)
0
B3F0R3 (living room/ Air conditioned)
0
B3F0R3 (living room/ Air conditioned)
0
B3F0R2 (Bed Room/ naturally ventilated)
0
B3F0R3 (living room/ Air conditioned)
0
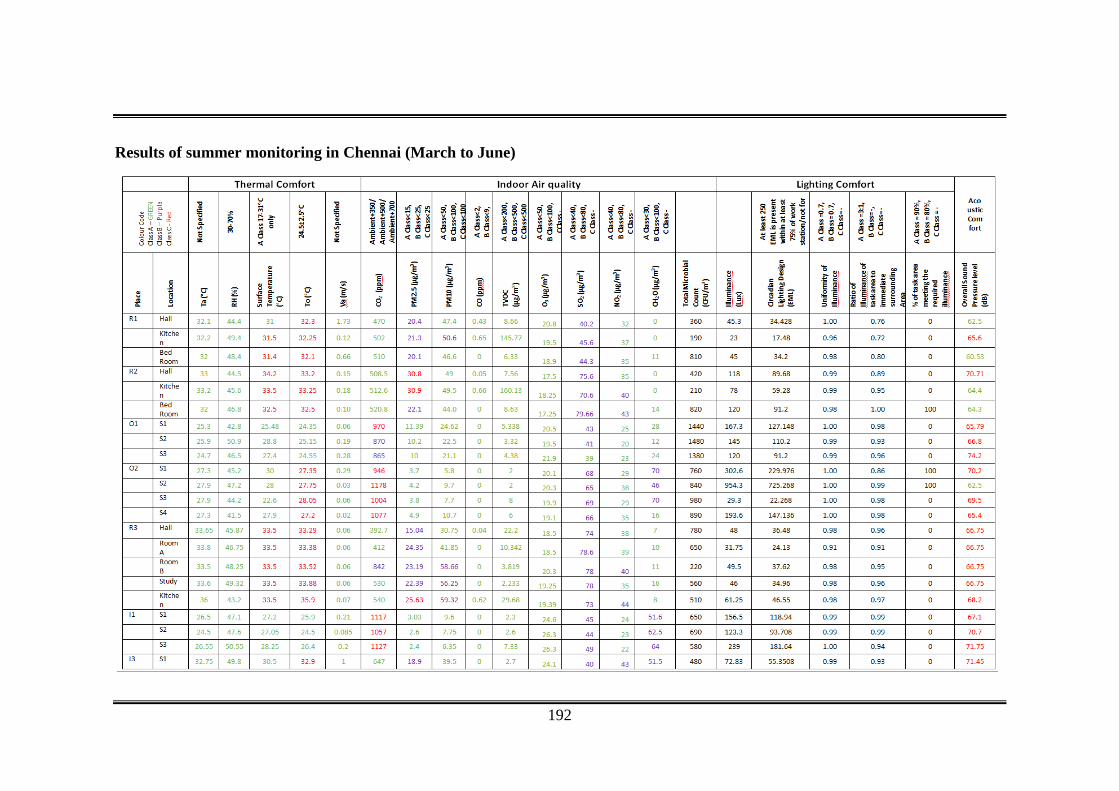
192
Results of summer monitoring in Chennai (March to June)
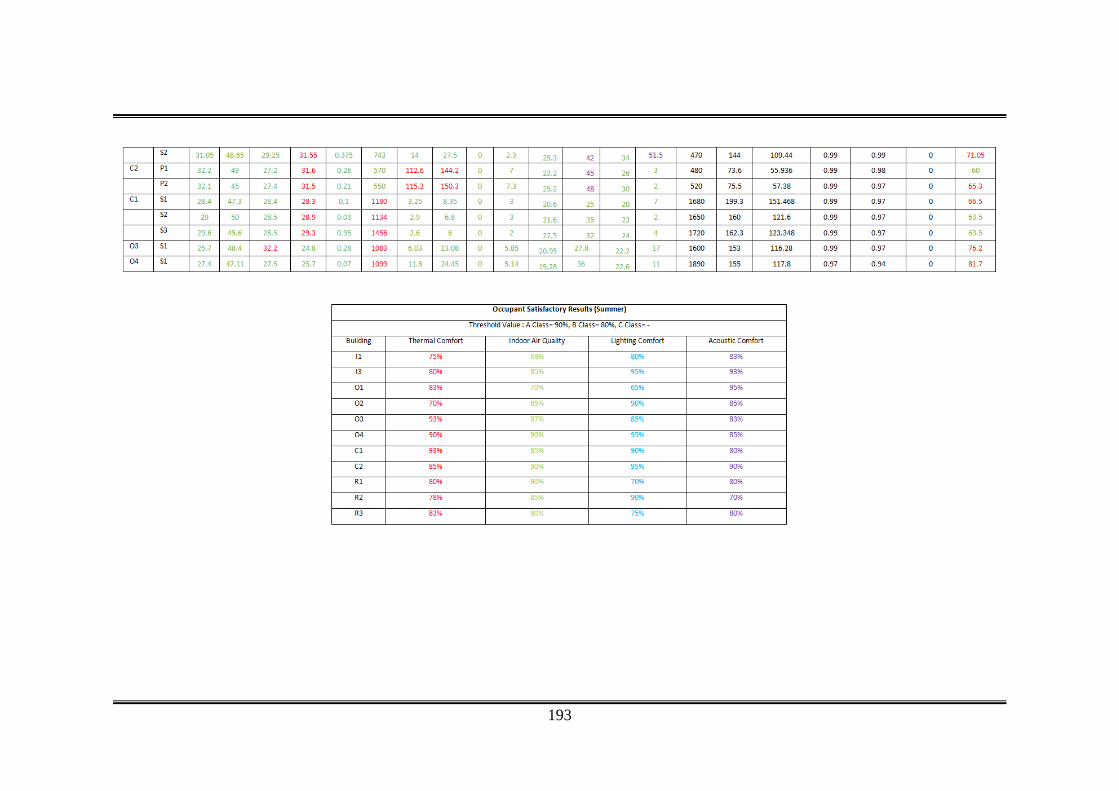
193
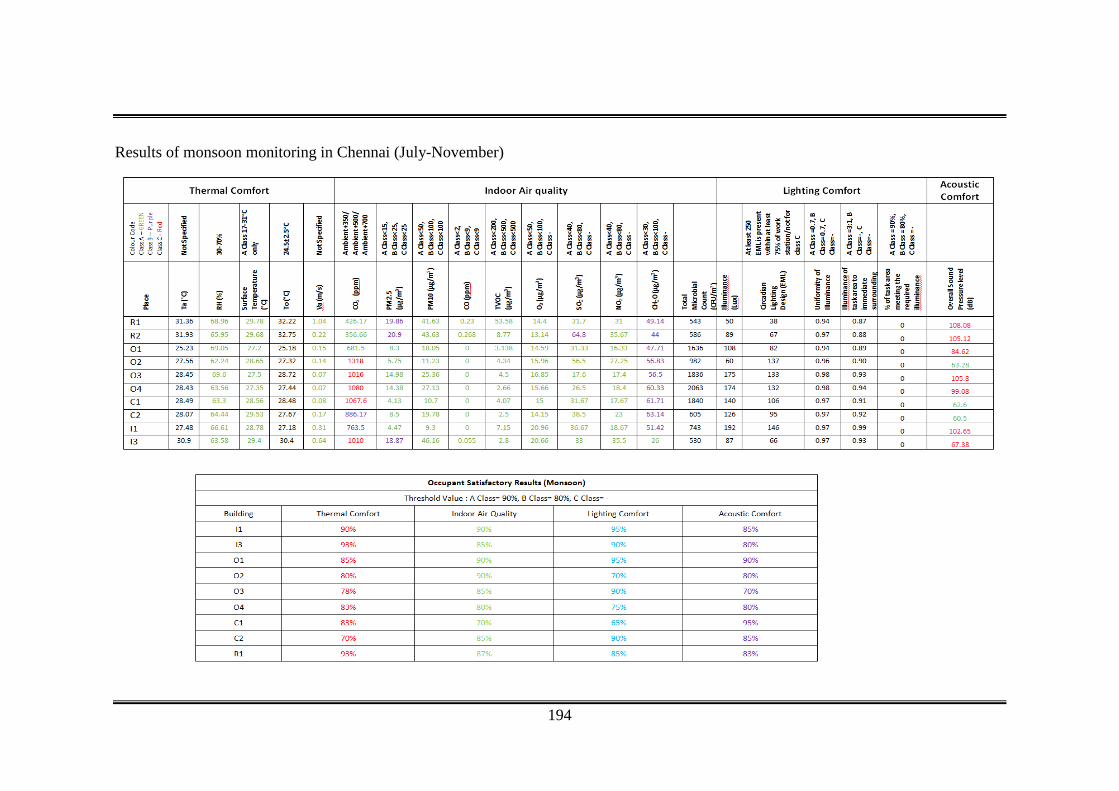
194
Results of monsoon monitoring in Chennai (July-November)
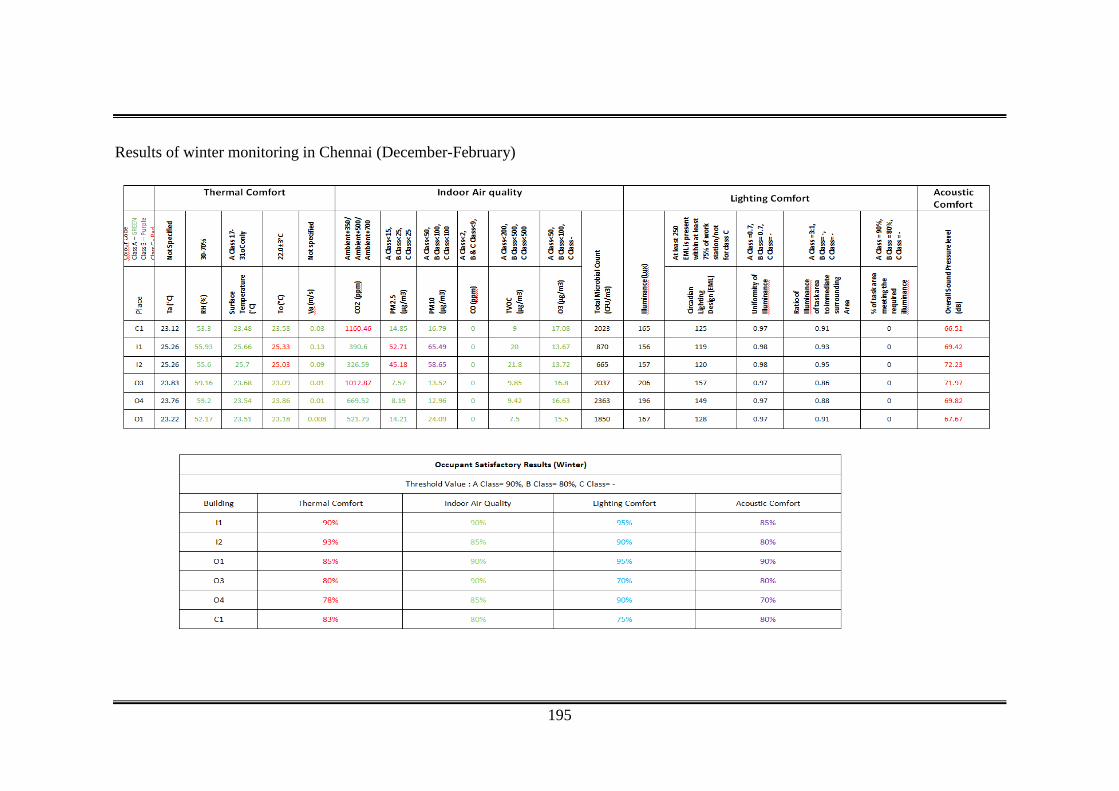
195
Results of winter monitoring in Chennai (December-February)