Contents lists available at SciVerse ScienceDirect Journal...
26
How resilient and countercyclical were emerging economies during the global financial crisis? Tatiana Didier, Constantino Hevia, Sergio L. Schmukler * , 1 World Bank,1818 H Street NW, Washington, DC 20433, USA JEL classification: E50 F30 F40 G01 G15 Keywords: Crisis transmission Contagion Countercyclical/procyclical policy Fiscal policy Monetary policy abstract By studying the cross-country incidence of the 2008–2009 global financial crisis, we document a structural break in the way emerging economies responded to the global shock. Contrary to popular perceptions, emerging economies suffered growth collapses (relative to the pre-crisis levels) comparable to those experienced by developed economies, even when they continued growing. Afterwards, most economies returned to their pre-crisis growth rates. Although emerging economies were not able to avoid the collapse originated in the U.S. and then transmitted across countries, they were more resilient during the global crisis than during past crises. Namely, they resumed their higher growth rates earlier and converged more quickly to their pre-crisis growth trend. Moreover, breaking with the past, emerging economies did not fall more than developed economies during the global crisis and were able to conduct countercyclical policies, thus becoming more similar to developed economies. Ó 2012 Elsevier Ltd. All rights reserved. * Corresponding author. E-mail addresses: [email protected] (T. Didier), [email protected] (C. Hevia), [email protected] (S.L. Schmukler). 1 For very useful comments, we thank Joshua Aizenman, Robert Dekle (the Editor), Shahrokh Fardoust, Brian Pinto, Luis Servén, Mark Spiegel, and participants at presentations held at the 4th Annual JIMF-SCIIE Conference (Santa Cruz, CA, U.S.), the Bank of Korea (Seoul, South Korea), the LACEA-LAMES Annual Meeting (Santiago, Chile), the Ministry of Economy (Johan- nesburg, South Africa), the workshop Macroeconomic Instability and Welfare Impact (Hanoi, Vietnam), and the World Bank (Washington, DC, U.S.). We also benefited from discussions with International Monetary Fund and World Bank staff, the World Bank Board, and the IMF-World Bank Development Committee. For excellent research assistance, we especially thank Francisco Ceballos. We are also grateful to Leandro Brufman, Luciano Cohan, Ana Gazmuri, Lucas Núñez, Paula Pedro, and Virginia Poggio, who helped at different stages of the paper. For financial support, we thank the World Bank Knowledge for Change Program (KCP), the Development Economics Vice-presidency, and the Office of the Chief Economists of the Latin American and the Caribbean Region. The views expressed in this paper are those of the authors and do not necessarily represent those of the World Bank. Contents lists available at SciVerse ScienceDirect Journal of International Money and Finance journal homepage: www.elsevier.com/locate/jimf 0261-5606/$ – see front matter Ó 2012 Elsevier Ltd. All rights reserved. doi:10.1016/j.jimonfin.2012.05.007 Journal of International Money and Finance xxx (2012) 1–26 Please cite this article in press as: Didier, T., et al., How resilient and countercyclical were emerging economies during the global financial crisis?, Journal of International Money and Finance (2012), doi:10.1016/j.jimonfin.2012.05.007
Transcript of Contents lists available at SciVerse ScienceDirect Journal...
Journal of International Money and Finance xxx (2012) 1–26
Contents lists available at SciVerse ScienceDirect
Journal of International Moneyand Finance
journal homepage: www.elsevier .com/locate/ j imf
How resilient and countercyclical were emerging economiesduring the global financial crisis?
Tatiana Didier, Constantino Hevia, Sergio L. Schmukler*,1
World Bank, 1818 H Street NW, Washington, DC 20433, USA
JEL classification:E50F30F40G01G15
Keywords:Crisis transmissionContagionCountercyclical/procyclical policyFiscal policyMonetary policy
* Corresponding author.E-mail addresses: [email protected] (T.
(S.L. Schmukler).1 For very useful comments, we thank Joshua A
Servén, Mark Spiegel, and participants at presentatBank of Korea (Seoul, South Korea), the LACEA-LAnesburg, South Africa), the workshop Macroecono(Washington, DC, U.S.). We also benefited from discBank Board, and the IMF-World Bank DevelopmentCeballos. We are also grateful to Leandro Brufman,who helped at different stages of the paper. For fi(KCP), the Development Economics Vice-presidenCaribbean Region. The views expressed in this paWorld Bank.
0261-5606/$ – see front matter � 2012 Elsevier Ltdoi:10.1016/j.jimonfin.2012.05.007
Please cite this article in press as: Didieeconomies during the global financialdoi:10.1016/j.jimonfin.2012.05.007
a b s t r a c t
By studying the cross-country incidence of the 2008–2009 globalfinancial crisis, we document a structural break in the wayemerging economies responded to the global shock. Contrary topopular perceptions, emerging economies suffered growthcollapses (relative to the pre-crisis levels) comparable to thoseexperienced by developed economies, even when they continuedgrowing. Afterwards, most economies returned to their pre-crisisgrowth rates. Although emerging economies were not able toavoid the collapse originated in the U.S. and then transmittedacross countries, they were more resilient during the global crisisthan during past crises. Namely, they resumed their higher growthrates earlier and converged more quickly to their pre-crisis growthtrend. Moreover, breaking with the past, emerging economies didnot fall more than developed economies during the global crisisand were able to conduct countercyclical policies, thus becomingmore similar to developed economies.
� 2012 Elsevier Ltd. All rights reserved.
Didier), [email protected] (C. Hevia), [email protected]
izenman, Robert Dekle (the Editor), Shahrokh Fardoust, Brian Pinto, Luisions held at the 4th Annual JIMF-SCIIE Conference (Santa Cruz, CA, U.S.), theMES Annual Meeting (Santiago, Chile), the Ministry of Economy (Johan-mic Instability and Welfare Impact (Hanoi, Vietnam), and the World Bankussions with International Monetary Fund and World Bank staff, the WorldCommittee. For excellent research assistance, we especially thank FranciscoLuciano Cohan, Ana Gazmuri, Lucas Núñez, Paula Pedro, and Virginia Poggio,nancial support, we thank the World Bank Knowledge for Change Programcy, and the Office of the Chief Economists of the Latin American and theper are those of the authors and do not necessarily represent those of the
d. All rights reserved.
r, T., et al., How resilient and countercyclical were emergingcrisis?, Journal of International Money and Finance (2012),

T. Didier et al. / Journal of International Money and Finance xxx (2012) 1–262
1. Introduction
In this paper, we document the extent to which emerging market economies were resilient to the2008–2009 global financial crisis. We interpret resilience from both an ex ante and ex post perspective.From an ex ante point of view, resilience means that economies have a lower likelihood of beingaffected by an external shock. From an ex post perspective, it means a better recovery when there arecontagion or spillover effects from external crises. We relate the behavior of emerging economiesduring the global crisis to the crisis transmission mechanisms (trade and finance) and a structuralbreak in the way they conducted their policies. We describe some of the factors that might havefacilitated (or hindered) the global transmission of the crisis and analyze the policies emergingeconomies adopted to become more resilient to crises.
We question the usual claim that, on impact, emerging market economies suffered less thanadvanced economies in terms of economic activity.2 Even though emerging economies had a betterperformance when focusing on plain growth rates, the conclusions change when considering changesin growth rates relative to the pre-crisis growth rates. Emerging economies endured declines in realgross domestic product (GDP) growth comparable to those in advanced economies. Nonetheless,emerging economies were able to avoid the amplification of external shocks that were typical of pastepisodes that tended to end up in banking, currency, and/or debt crises. During the recovery phase,emerging economies were more resilient. At first sight, GDP data suggest that emerging economiesrecovered similarly to developed economies, with most economies rebounding during the crisisaftermath according to howmuch they collapsed. Yet, higher-frequency industrial production (IP) datasuggest that emerging economies did recover more strongly than advanced economies. Still, there wassignificant heterogeneity among emerging economies, with Eastern Europe and Central Asia faring theworst. Overall, low-income economies were more isolated from the global shock.
Our findings put in perspective the concept of resilience to crises and how the arguments in theliterature square with the evidence. The popular perception is that emerging economies fared, onaverage, substantially better than advanced economies during the 2008–2009 global crisis(Eichengreen, 2010). Researchers justify this claim by presenting evidence of a negative associationbetween some indicators of economic performance around the crisis and the level of GDP per capita(Claessens et al., 2010; Frankel and Saravelos, 2010; Lane and Milesi-Ferretti, 2010; Rose and Spiegel,2010, 2011, in press; Rose, 2011).
Our results differ from those in the literature for at least two reasons. First, when using GDP growthas an indicator of economic performance (as in Frankel and Saravelos, 2010; Rose and Spiegel, 2010,2011, in press; Rose, 2011), it is true that advanced economies attained lower rates of GDP growthduring the crisis. This measure, however, could be capturing that advanced economies grow slower onaverage than emerging economies independent of any crisis event. In contrast, the analysis of collapsesin GDP growth suggests that, on impact, the crisis was notmore severe in advanced economies. Second,although other studies measure crisis incidence in terms of changes in GDP growth (Blanchard et al.,2010; Claessens et al., 2010; Lane and Milesi-Ferretti, 2010), we identify a non-linearity between thecollapse in GDP growth and GDP per capita that was ignored in those studies. Collapses in GDP growtharound the global crisis did not increase monotonically with GDP per capita. Instead, the largestcollapses in GDP growth occurred at income levels corresponding to those of the wealthier emergingeconomies and poorer high-income economies.
The analysis of high-frequency IP data is also important because the timing of the collapse and therecovery does not coincide with the calendar year and because it suggests that the post-crisis is onearea where emerging economies displayed better performance. In particular, emerging economies
2 Our data are comprised of 183 economies, classified as “advanced” (or “developed”) if they fall under the World Bank’s July2010 classification of “high-income” economies. All others are “developing economies.” Within the latter, economies areclassified as “emerging” if they have access to loans from theWorld Bank (IBRD) and as “low-income” if they only have access tofunds from IDA (the World Bank’s branch that focuses on the poorest nations). Economies not falling under the “advancedeconomies” group are assigned to regions according to the World Bank’s July 2010 classification. The region “Middle East andAfrica” includes economies in the Middle East and North and Sub-Saharan Africa. The region “Asia” includes economies in EastAsia, South Asia, and the Pacific.
Please cite this article in press as: Didier, T., et al., How resilient and countercyclical were emergingeconomies during the global financial crisis?, Journal of International Money and Finance (2012),doi:10.1016/j.jimonfin.2012.05.007

T. Didier et al. / Journal of International Money and Finance xxx (2012) 1–26 3
were typically under recessionary pressures for a fewer number of months than advanced economies.For example, by December 2010, IP in emerging economies had returned to its geometric trend,whereas in advanced economies it was still more than 13 percentage points below trend. Thisanalysis of the post-crisis period complements the growing literature on the 2008–2009 global crisisthat has concentrated mainly on the collapse and has typically analyzed low frequency GDPmeasures.
We conjecture that at least four factors are important in understanding the differentiated post-crisis behavior of emerging economies relative to advanced economies. The first and most obviousone is that the root of the problem was in the financial markets of the advanced economies, andemerging economies had a low exposure to these markets relative to other developed economies.The second reason is linked to the fact that, to the extent that there is a convergence process,emerging economies typically grow at a higher pace than advanced economies. Therefore, a recoveryof their growth trajectory would make emerging economies’ output converge to the pre-crisis levelsooner.
The third reason is related to international trade. As the U.S. economy came to a standstill in late2008, firms anticipated an accumulation of inventories and stopped their international orders.3 Thisgenerated a collapse in production in several emerging economies focused on supplying manufacturesto the world. As inventories decreased, and it became more likely that global demand would stabilize,firms reignited their production and overall economic activity in emerging markets expanded. Thus,emerging economies were able to generate a faster recovery than developed economies, for whichmanufacturing accounts for a smaller share of GDP.
The fourth reason is a fundamental change in theway emerging economies conducted their policiesrelative to the past. Historical evidence suggests that emerging economies usually lack the policy toolsto deal with external shocks that are available to advanced economies. Previous worldwide turbulentepisodes found most emerging economies unable to perform countercyclical policies. In many cases,their own vulnerabilities and poor institutional frameworks amplified negative external shocks leadingto sharper recessions.4 In contrast, we document a structural break in the way emerging economiesconduct their policies, with more countercyclical policies pursued before and during the global crisis.The global crisis found many emerging economies with more fiscal space, better domestic balancesheets, and the required credibility to conduct expansionary fiscal and monetary policies. In sum, theresilience of emerging economies to the 2008–2009 crisis might be partly attributed to a combinationof sounder macroeconomic and financial policy frameworks with a shift towards safer domestic andinternational financial stances. Frankel et al. (2011), Gourinchas and Obstfeld (2012), and Kose andPrasad (2010) make similar points from other angles.
Regarding the financial stance, emerging economies have, on average, made an effort to reduce thecredit risk embedded in debt contracts as well as currency and maturity mismatches. On the externalfront, emerging economies became net creditors to the rest of the world as regards debt contractswhile increasing their net debtor position as regards equity contracts. On the domestic front, severalemerging economies extended the maturity profile of their debt and increased the relative size ofdomestic currency debt during the 2000s. The changes in the profile of their debt structures mighthave reduced the downside risks of financial integration. In the past, the exchange-rate depreciationstypically observed around financial crises tended to increase the burden of foreign-currency debt that,coupled with high levels of short-term debt, led to rollover crises. In contrast, the exchange-ratedevaluations observed during 2008 and 2009 implied an improvement in the external positions ofemerging economies (measured in domestic currency) due to their net creditor stance. Lower currencyand maturity mismatches also helped absorb the shock. Furthermore, as world equity prices
3 For example, Alessandria et al. (2010, 2012) document a large inventory adjustment in the U.S. automobile sector during thecrisis.
4 For instance, the absence of access to world capital markets during turbulent times has hampered the ability of govern-ments to raise funds and conduct countercyclical fiscal policies (Reinhart and Reinhart, 2008; Broner et al., in press). In addition,emerging economies usually follow procyclical policies during both good and bad times (Kaminsky et al., 2004a; Talvi and Vegh,2005; Hutchinson et al., 2010).
Please cite this article in press as: Didier, T., et al., How resilient and countercyclical were emergingeconomies during the global financial crisis?, Journal of International Money and Finance (2012),doi:10.1016/j.jimonfin.2012.05.007

T. Didier et al. / Journal of International Money and Finance xxx (2012) 1–264
plummeted, the external liability was reduced and the net debtor equity position shrank.5 These shiftsin the domestic and international fronts might have also helped financially globalized emergingeconomies avoid the domestic amplification of the external shock. As a result, most emerging econ-omies came out of the crisis with strong balance sheets. In contrast, advanced economies saw theirrecovery hampered by impaired balance sheets in financial intermediaries, households, and the publicsector.
The rest of this paper is organized as follows. Section 2 describes the cross-country incidence of thecrisis and the post-crisis recovery. Section 3 examines the transmission channels and provides aneconometric analysis of the correlates of growth collapses and recoveries. Section 4 discusses the policyresponses to the 2008–2009 crisis. Section 5 concludes.
2. Performance during the 2008–2009 crisis
2.1. Performance during the downturn
The 2008–2009 global crisis was one of the broadest, deepest, andmost complex crises afflicting theworld since the Great Depression (Almunia et al., 2009). The crisis originated in the relatively small U.S.subprime housing market, which represented about 15 percent of U.S. total residential mortgages in2006. The latter, in turn, accounted for 25 percent of U.S. total debt (Agarwal and Ho, 2007). But afterthe Lehman Brothers’ collapse in September 2008, the crisis quickly spread across institutions, markets,and borders. There were massive failures of financial institutions and a collapse in asset values. Forexample, stockmarkets around theworld fell over 30 percent between September and December 2008,and about 18 trillion U.S. dollars in G-7 stock market capitalization vanished. These developments inthe financial markets marked the end of the boom years of the mid-2000s. Moreover, while real worldGDP grew, on average, at 3 percent between 2000 and 2008, real world GDP contracted 1.9 percent in2009.
Although highly synchronized during this downturn, the behavior of real GDP growth washeterogeneous across economies. Research suggests that emerging economies performed substantiallybetter than advanced economies during this phase of the crisis. In general, the evidence shows thateconomies with higher GDP per capita experienced lower GDP growth (Claessens et al., 2010; Frankeland Saravelos, 2010; Lane and Milesi-Ferretti, 2010; Rose and Spiegel, 2010, 2011, in press). Forinstance, in 2009 emerging economies and low-income economies grew, on average, 0.9 and 4.8percent, respectively; whereas the growth rate observed across advanced economies was significantlylower at �3.6 percent (Table 1).6 Moreover, there was substantial heterogeneity across regions: whileAsian economies experienced a growth rate of 5.1 percentage points, average GDP growth in the LatinAmerica and the Caribbean region was �2 percentage points.
But these statistics on GDP growth do not take into account differences in pre-crisis growth rates,and thus do not capture the extent of growth deceleration during the crisis. In particular, there isa greater degree of cross-country similarities if we measure economic performance in terms of growthcollapses, defined as the percentage point difference in real GDP growth between 2007 and 2009. Incontrast to the standard view, growth collapses were in fact larger in emerging economies relative toadvanced economies, 7.2 versus 6.1 percentage points, respectively. On the bright side, low-incomeeconomies suffered a smaller decline in GDP growth of just 3.2 percentage points (Table 1).7
A geographical parsing of the data confirms this pattern: no financially integrated emerging regionwas immune to the global crisis, and declines in real GDP growth rates are observed across the globe.
5 This shift in the net foreign asset position of emerging economies is the reverse of the exorbitant privilege documented forthe U.S. (Gourinchas and Rey, 2007). Namely, the observation that the U.S. has increased its share of low yield short-termliabilities on its total gross foreign liabilities and simultaneously increased its share of high-yield assets on its total grossforeign assets. This change in the balance sheet allowed the U.S. to earn a significant excess return on assets over liabilities.
6 Throughout this section, each economy’s observation within each group is weighted by its level of GDP in 2007 measured inU.S. dollars relative to the group aggregate.
7 If simple averages are used instead, advanced economies actually have greater collapses. However, the difference in growthcollapses between advanced and emerging economies is not statistically different from zero.
Please cite this article in press as: Didier, T., et al., How resilient and countercyclical were emergingeconomies during the global financial crisis?, Journal of International Money and Finance (2012),doi:10.1016/j.jimonfin.2012.05.007

Table 1Growth, growth volatility, collapse, and recovery.
Advancedeconomies
Emergingeconomies
Low-incomeeconomies
Average GDP growth in 2000–2007 2.4 6.2 6.9GDP growth in 2008 0.0 5.3 6.2GDP growth in 2009 �3.6 0.9 4.8GDP growth in 2010 2.5 6.7 5.8GDP growth in 2011 2.1 5.8 5.9GDP growth collapseGDP growth in 2009 minus GDP growth in 2007 �6.1 �7.2 �3.2GDP growth in 2009 minus averageGDP growth in 2000-2007
�6.0 �5.4 �2.3
GDP growth recoveryGDP growth in 2010 minus GDP growth in 2009 6.1 5.9 1.0GDP growth in 2011 minus GDP growth in 2009 5.7 4.9 1.1
Change in real GDP growth – averageAll sample – 1980–2007 All observations 0.1 0.3 0.2
Positive 1.6 3.9 4.8Negative �1.5 �3.6 �4.8
Tranquil years All observations 0.1 0.1 0.3Positive 1.5 3.2 4.3Negative �1.5 �3.1 �3.9
Crisis years All observations 0.2 �0.8 0.5Negative �1.7 �5.8 �5.1
Post-crisis years All observations 0.0 2.0 �0.4Positive 2.2 6.0 4.7
2009 All observations �4.4 �5.2 �2.0Negative �4.4 �5.9 �4.1
2010 All observations 5.4 5.2 1.3Positive 5.8 5.8 3.1
Mean tests2009 (Negative) vs tranquil years (Negative) �2.9 *** �2.8 *** �0.22009 (Negative) vs crisis years (Negative) �2.8 *** �0.2 0.62010 (Positive) vs tranquil years (Positive) 4.4 *** 2.7 *** �1.22010 (Positive) vs post-crisis years (Positive) 3.7 *** �0.3 �1.7 **
Average pre-crisis IP growth (Jan. 02–Apr. 08) 1.7 7.9 5.7Extent of collapse (2008’s peak to trough)Collapse in IP level �21.0 �13.8 �11.9Collapse in IP growth �25.4 �24.0 �18.7
Length of recovery (since trough)No. of months to recover half of the collapse in IP level 12.6 5.7 3.7No. of months to recover half of the collapse in IP growth 6.4 6.7 2.6No. of months to recover to average pre-crisis IP growth 9.6 8.6 1.1
This table shows statistics on real GDP growth rates, changes in real GDP growth rates, and the extent and length of industrialproduction (IP) collapse and recovery around the 2008–2009 crisis. Except for the number of months, the figures shown are inpercent. For the changes in real GDP growth rates, the figures correspond to the unweighted cross-country mean of the within-country averages. The mean tests show the differences in the mean change in real GDP growth rate between the 2009 collapseand tranquil and crisis years, respectively, pooling all observations within each category. Similar estimates are reported for the2010 recovery. The tests condition for positive or negative values of the change in growth rates. See the main text for the sourcesand definitions of the other crises. Collapse in IP level (IP growth) is defined as the percentage change between the within-country’s IP level (IP growth rates) peak during 2008 and its trough between January 2009 and June 2010, averaged acrossincome levels. IP growth rates are year-on-year based on monthly data. Average pre-crisis IP growth rates are calculated acrossthe January 2002 to April 2008 period. GDP data come from the IMF’sWorld Economic Outlook (October 2010).When actual GDPdata are not available for 2010 or 2011, we use estimates from Consensus Forecasts (January 2010) or World Economic Outlook(October 2010). IP data come from theWorld Bank’s Global Economic Monitor. Real GDP growth rates income-level averages areweighted by 2007 nominal GDP in U.S. dollars from the World Economic Outlook (October 2010).
T. Didier et al. / Journal of International Money and Finance xxx (2012) 1–26 5
Please cite this article in press as: Didier, T., et al., How resilient and countercyclical were emergingeconomies during the global financial crisis?, Journal of International Money and Finance (2012),doi:10.1016/j.jimonfin.2012.05.007
T. Didier et al. / Journal of International Money and Finance xxx (2012) 1–266
Economies in Latin America and the Caribbean and in Eastern Europe and Central Asia experiencedgreater growth collapses than those observed in advanced economies (7.7 and 12.6 percentage points,respectively, in comparison to 6.1 percentage points). Growth collapses were somewhat smaller inAsian economies and Middle East and African ones (4.9 percentage points in both regions). Overall,these are significant declines in GDP growth rates that are obscured by the evidence based on plainGDP growth rates. That is, the deceleration in growth observed in 2009 was highly homogeneousaround the world.
Fig. 1 shows that most of the (relatively few) economies that grew faster in 2009 than in 2007were in fact low-income economies. The figure also shows a statistically significant U-shape patternof growth collapses against GDP per capita. That is, the largest growth collapses did not occur amongthe richest economies. We consider several robustness tests to support this claim. First, the U-shaperemains even after dropping economies with a GDP growth collapse greater than 19 percentagepoints (Angola, Armenia, Estonia, Latvia, Lithuania, and Ukraine). Second, the slope coefficient ofa linear regression of growth collapse on the logarithm of GDP per capita for those economies withGDP per capita above 8000 PPP-adjusted U.S. dollars is slightly positive but not statistically differentfrom zero; thus, if anything, the richest economies tended to have smaller, not greater growthcollapses.8 Third, Table 2 shows regressions of growth collapses on income dummies. Again, thedummies for advanced and emerging economies are not statistically different from each other. Ifanything, emerging economies suffered greater collapses. On the contrary, low-income economiesdid suffer smaller collapses.9
These findings stand in contrast with the performance of emerging and advanced economiesaround previous crisis episodes. The upper-right panel of Table 2 shows regressions of growthcollapses on income and regional dummies during the Russian and Asian crises of 1997–1998, whichwe use as benchmark. During those crises, emerging and low-income economies across all regionssuffered large growth collapses, while advanced economies suffered only modest growth decelera-tions. In addition, collapses do not seem to be associated to the level or the square of GDP per capita.The results in Table 2 for both the 1997–1998 and 2008–2009 crises are robust to weighting obser-vations by population and by pre-crisis GDP measured in U.S. dollars. Moreover, the results are robustto excluding some or all European economies, as they may disproportionately affect the coefficientsfor advanced economies.
The timing of the 2008–2009 crisis renders annual data on GDP inadequate for a thorough analysisof the economic cycle that includes, for instance, the duration of downturns: peaks and troughs ineconomic activity do not necessarily coincide with calendar years. Hence, we turn to data on IP ata monthly frequency. These data allow us to construct different measures of the severity and durationof the recession that cannot be built using data at the annual frequency. Fig. 2 displays the evolution ofIP indexes across income groups relative to geometric pre-crisis trends. We normalize these indexes to100 in April 2008, the pre-crisis peak of IP in advanced economies. The top panel shows the level of IPin advanced economies together with a geometric trend between January 1995 and April 2008. Themiddle and bottom panels report analogous series for emerging and low-income economies, respec-tively. For the case of emerging economies, however, there is a clear break in the trend around 2002.Therefore, we also add a geometric trend between January 2002 and April 2008. Clearly, the 2008–2009 crisis was more severe than typical business-cycle fluctuations in both developed and emergingeconomies. In contrast, IP in low-income economies during the crisis does not appear to be verydifferent from the usual fluctuations.
While a casual inspection of the data might suggest that the level of IP in advanced economiesdropped substantially more than in emerging economies, collapses in the growth rate of industrialproduction are similar in both groups of economies. In particular, the lower panel of Table 1 shows thatthe collapse in year-on-year growth rates during the crisis was similar across advanced and emerging
8 This result also holds if we drop the economies with growth collapses greater than 19 percentage points.9 As a consistency check, we report in Table 1 several measures of GDP growth, collapse, and recovery. For example, we arrive
at a similar conclusions if we define growth collapse as real GDP growth in 2009 minus the average real GDP growth rate during2000–2007.
Please cite this article in press as: Didier, T., et al., How resilient and countercyclical were emergingeconomies during the global financial crisis?, Journal of International Money and Finance (2012),doi:10.1016/j.jimonfin.2012.05.007

-30%
-25%
-20%
-15%
-10%
-5%
0%
5%
10%
15%
5 6 7 8 9 10 11 12
Rea
l GD
P G
row
th 2
009-
2007
Per
cent
age
Poi
nts
2007 GDP Per Capita (PPP) - In Logs
Fitted: y = 0.004x2 -0.097x+0.454, R2 = 0.26Fitted (Without Outliers): y = 0.002x2 -0.063x+0.306, R2 = 0.32
y = -0.614x + 0.947R2 = 0.5118
-15%
-10%
-5%
0%
5%
10%
15%
20%
25%
-30% -25% -20% -15% -10% -5% 0% 5% 10% 15%
Rea
l GD
P G
row
th 2
010-
2009
Per
cent
age
Poi
nts
Real GDP Growth 2009-2007Percentage Points
A
B
Fig. 1. Real GDP growth collapse and recovery. Panel A: Real GDP growth collapse and income level. Panel B: Real GDP growth collapseand recovery. This figure shows the cross-country relation between real GDP growth collapse around the 2008–2009 crisis andincome level (panel A); and the cross-country relation between real GDP growth collapse and recovery around the 2008–2009 crisis(panel B). In panel A, the Y-axis depicts the real GDP growth collapse defined as the real GDP growth rate in 2009 minus the real GDPgrowth rate in 2007, while the X-axis depicts the natural logarithm of the 2007 GDP per capita (PPP adjusted). In panel B, the Y-axisdepicts the real GDP growth recovery, defined as the real GDP growth rate in 2010 minus the real GDP growth rate in 2009; while theX-axis depicts the real GDP growth collapse. The numbers are shown as percentage points of GDP. The fitted lines in panel A estimatequadratic relations between the GDP growth rate and the natural logarithm of GDP per capita. “Fitted (without outliers)” excludeseconomies with extreme collapses (i.e., negative growth rate higher than 19%). All coefficients are significant at a 5% level.
T. Didier et al. / Journal of International Money and Finance xxx (2012) 1–26 7
economies at 25.4 and 24 percent, respectively. On the other hand, low-income economies sufferedrelatively small declines in IP.
These findings suggest that, within the group of financially and trade integrated economies, thesystemic and global dimensions of the crisis dominated country-specific strengths that led to a highly
Please cite this article in press as: Didier, T., et al., How resilient and countercyclical were emergingeconomies during the global financial crisis?, Journal of International Money and Finance (2012),doi:10.1016/j.jimonfin.2012.05.007

Table 2Income and regional differences in real GDP growth collapse and recovery.
Panel A: collapse
2008–2009 Crisis Asian–Russian crises
Real GDPgrowth 2009
Collapse Collapse Collapse Real GDPgrowth 1999
Collapse Collapse Collapse
Advanced economies �3.830(0.454)***
�7.157(0.580)***
3.733(0.443)***
�1.236(0.307)***
Emerging economies �1.099(0.568)*
�7.643(0.662)***
2.841(0.460)***
�5.553(0.505)***
Low-income economies 3.122(0.564)***
�2.879(0.686)***
3.235(0.477)***
�5.386(0.766)***
Advanced economies �7.157(0.583)***
�1.236(0.309)***
Middle East and Africa �2.666(0.626)***
�5.557(0.557)***
Asia �4.576(1.013)***
�6.410(1.090)***
Eastern Europeand Central Asia
�12.520(1.294)***
�5.518(0.883)***
Latin Americaand Caribbean
�6.772(0.655)***
�4.498(0.633)***
Log of GDP per capita �4.558(0.987)***
�0.101(0.929)
Squared log ofGDP per capita
0.688(0.269)**
0.181(0.228)
Constant �1.000(0.693)
�5.677(0.921)***
Number of observations 170 170 170 170 172 170 170 170R-squared 0.211 0.573 0.670 0.253 0.389 0.528 0.535 0.021Adjusted R-squared 0.197 0.565 0.660 0.244 0.378 0.520 0.521 0.009Wald test:
advanced ¼ emerging14.092*** 0.305 1.950 53.383***
Wald test:advanced ¼ low-income
92.112*** 22.681*** 0.586 25.276***
Wald test:emerging ¼ low-income
27.774*** 24.947*** 0.353 0.033
Panel B: recovery
2008–2009 Crisis Asian–Russian crises
Real GDPGrowth 2010
Recovery Recovery Recovery Real GDPGrowth 1999
Recovery Recovery Recovery
Advanced economies 1.605(0.465)***
5.435(0.639)***
4.277(0.286)***
1.191(0.292)***
Emerging economies 3.810(0.362)***
4.909(0.520)***
4.550(0.356)***
4.151(0.613)***
Low-income economies 4.653(0.375)***
1.531(0.550)***
2.842(0.638)***
1.916(0.864)**
Advanced economies 5.435(0.643)***
1.191(0.294)***
Middle East and Africa 1.524(0.391)***
2.049(0.800)**
Asia 3.330(0.986)***
4.942(1.214)***
Eastern Europeand Central Asia
7.421(1.147)***
5.911(1.321)***
Latin Americaand Caribbean
4.407(0.779)***
1.730(0.675)**
Log of GDP per capita 2.356(0.755)***
2.048(1.150)*
Squared log ofGDP per capita
�0.234(0.202)
�0.435(0.280)
T. Didier et al. / Journal of International Money and Finance xxx (2012) 1–268
Please cite this article in press as: Didier, T., et al., How resilient and countercyclical were emergingeconomies during the global financial crisis?, Journal of International Money and Finance (2012),doi:10.1016/j.jimonfin.2012.05.007

Table 2 (continued )
Panel B: recovery
2008–2009 Crisis Asian–Russian crises
Real GDPGrowth 2010
Recovery Recovery Recovery Real GDPGrowth 1999
Recovery Recovery Recovery
Constant 0.674(0.595)
1.382(1.122)
Number of observations 170 170 170 170 173 172 172 172R-squared 0.617 0.473 0.523 0.177 0.528 0.245 0.282 0.026Adjusted R-squared 0.610 0.464 0.508 0.167 0.520 0.232 0.260 0.015Wald test:
advanced ¼ emerging13.997*** 0.408 0.358 18.994***
Wald test:advanced ¼ low-income
26.003*** 21.462*** 4.216** 0.633
Wald test:emerging ¼ low-income
2.620 19.934*** 5.469** 4.451**
This table shows ordinary least square regressions of real GDP growth rates, collapse measures, and recovery measures arounddifferent crises against income-level and regional dummies and GDP per capita. Collapse during the 2008–2009 crisis is definedas the difference between the real GDP growth rate in 2009 vis-à-vis the real GDP growth rate in 2007. Collapse during theAsian and Russian crises is defined as the difference between the maximum and minimum growth rates between 1996 and1999, considering the monotonic declines in growth rate. Recovery during the 2008–2009 crisis is defined as the differencebetween the expected real GDP growth rate in 2010 vis-à-vis the real GDP growth rate in 2009. Recovery during the Asian andRussian crises is defined as the difference between the real GDP growth rate in 2000 vis-à-vis the minimum growth rate usedto calculate the collapse. The bottom lines show F statistics for Wald tests on whether the coefficient of the different income-level dummies are equal. Robust standard errors are in parentheses. *, **, and *** mean significance at the 10%, 5%, and 1% levelsrespectively.
T. Didier et al. / Journal of International Money and Finance xxx (2012) 1–26 9
synchronized and homogeneous deceleration of growth. In this context, low-income economies thatwere less integrated to the rest of the world were relatively more isolated from the global shock andthus suffered smaller growth collapses.
2.2. Performance during the recovery
Annual GDP data show a large bounce-back effect in economic activity: economies that sufferedgreater collapses were typically those that enjoyed larger growth recoveries defined as GDP growth in2010 minus that in 2009 (Fig. 1).10 Only a few economies suffered a decline in growth rates between2007 and 2009 and a consecutive decline between 2009 and 2010.11
Nevertheless, the degree of cross-country heterogeneity observed during the recovery has beengreater than that of the downturn. In particular, as the effects of the global systemic shock faded, therelative strengths of individual economies might have started to play a more fundamental role.Heterogeneity in the rebound is observed not just between advanced and emerging economies, butalso across emerging regions. Even though advanced economies and economies in the Eastern Europeand Central Asia region suffered large collapses, their recovery was not as strong as that observed inother emerging regions.
This last observation predicts that, by 2010 or 2011, not all economies would recover all the lossesderived from the crisis; and that is what we observe. One way of capturing this cost is assessing whereeconomies stand relative to some reference level of GDP. To do this, we consider two reference levelsfor GDP: (i) the GDP level that was reached in 2008 (i.e., the pre-crisis annual peak), and (ii) the levelthat would have been reached in 2010–2011 had economies maintained their average growth ratesregistered during 2000–2007. The latter reference level is an estimate of trend GDP.
10 We use Consensus Forecasts or World Economic Outlook estimates when actual 2010 GDP data are not available.11 These economies are Albania, Azerbaijan, Equatorial Guinea, Djibouti, Greece, Guyana, Haiti, Kyrgyz Republic, Pakistan, TheGambia, Uganda, and Vanuatu.
Please cite this article in press as: Didier, T., et al., How resilient and countercyclical were emergingeconomies during the global financial crisis?, Journal of International Money and Finance (2012),doi:10.1016/j.jimonfin.2012.05.007

50
60
70
80
90
100
110
120Ja
n. 9
5
Jan.
96
Jan.
97
Jan.
98
Jan.
99
Jan.
00
Jan.
01
Jan.
02
Jan.
03
Jan.
04
Jan.
05
Jan.
06
Jan.
07
Jan.
08
Jan.
09
Jan.
10
Indu
stri
al P
rodu
ctio
n In
dex
Apr
. 08
= 10
0
Pre-Recovery Trough
Advanced Economies
Pre-Crisis Peak
50
60
70
80
90
100
110
120
Jan.
95
Jan.
96
Jan.
97
Jan.
98
Jan.
99
Jan.
00
Jan.
01
Jan.
02
Jan.
03
Jan.
04
Jan.
05
Jan.
06
Jan.
07
Jan.
08
Jan.
09
Jan.
10
Indu
stri
al P
rodu
ctio
n In
dex
Apr
. 08
= 10
0
Pre-Recovery Trough
Advanced EconomiesPre-Crisis Peak
50
60
70
80
90
100
110
120
Jan.
95
Jan.
96
Jan.
97
Jan.
98
Jan.
99
Jan.
00
Jan.
01
Jan.
02
Jan.
03
Jan.
04
Jan.
05
Jan.
06
Jan.
07
Jan.
08
Jan.
09
Jan.
10
Indu
stri
al P
rodu
ctio
n In
dex
Apr
. 08
= 10
0
Pre-Recovery Trough
Advanced EconomiesPre-Crisis Peak
A
B
C
Fig. 2. Industrial production. Panel A: Industrial production level – advanced economies. Panel B: Industrial production level –emerging economies. Panel C: Industrial production level – low-income economies. This figure shows the industrial production (IP)level (indexed to 100 in April 2008) and the IP level pre-crisis’ geometric trend during the 2008–2009 crisis by income level. Thepre-crisis trend for each income level is constructed by calculating the pre-crisis compounded annual growth rate between January1995 and April 2008 and extrapolating it until the end of the sample. An additional IP-level pre-crisis geometric trend betweenJanuary 2002 and April 2008 is shown for emerging economies. The IP data come from the World Bank’s Global Economic Monitor.Income-level averages are weighted by 2007 nominal GDP in U.S. dollars from the World Economic Outlook (October 2010).
T. Didier et al. / Journal of International Money and Finance xxx (2012) 1–2610
Please cite this article in press as: Didier, T., et al., How resilient and countercyclical were emergingeconomies during the global financial crisis?, Journal of International Money and Finance (2012),doi:10.1016/j.jimonfin.2012.05.007

-5%
0%
5%
10%
15%
20%
25%
Advanced Economies Asia Eastern Europeand Central Asia
Latin Americaand Caribbean
Middle Eastand Africa
Per
cent
2010 vs 20082010 vs 2008 2011 vs 2008
-18%
-16%
-14%
-12%
-10%
-8%
-6%
-4%
-2%
0%
Advanced Economies Asia Eastern Europeand Central Asia
Latin Americaand Caribbean
Middle Eastand Africa
Per
cent
20102010 2011
A
B
Fig. 3. Real GDP growth rates and output losses relative to pre-crisis trend. Panel A: Post-crisis GDP levels relative to peak. Panel B:Real output losses relative to pre-crisis real GDP growth trends. This figure shows real GDP in 2010 and 2011 in comparison withprevious trends. Panel A shows the projected real GDP in 2010 and 2011 as a percentage of the 2008 real GDP. Panel B shows theprojected real output losses relative to the real GDP trend for 2010 and 2011 defined as the difference between projected real GDP for2010 (2011) and the counterfactual real GDP for 2010 (2011), expressed as a percentage of counterfactual real GDP for 2010 (2011).Projected real GDP is calculated based on the 2009 real GDP level and 2010–2011 growth projections (and actual figures for someeconomies for 2010). Counterfactual real GDP is constructed by extrapolating pre-crisis average growth rates through the 2008–2011period (i.e., as if there had been no crisis event). Data for the counterfactual real GDP are thus calculated based on the 2007 real GDPlevel and the 2000–2007 average growth rate extrapolated through 2008–2011.
T. Didier et al. / Journal of International Money and Finance xxx (2012) 1–26 11
Consider first the expected level of GDP in 2010–2011 relative to that of 2008 (Fig. 3). In 2010, theaverage levels of GDP in advanced economies and in Eastern Europe and Central Asia are estimated toremain below their 2008 levels by �1.2 and �1.6 percent, respectively. In contrast, the GDP of theremaining developing regions comfortably exceeded that of 2008 by 2010. All regions are expected toexceed their 2008 GDP levels by 2011, although with substantial heterogeneity: at one extreme, the2011 level of GDP in Asia is expected to be 24 percentage points above its 2008 value; at the otherextreme, GDP in advanced economies is expected to be just 0.87 percentage points above its 2008value. Similar patterns emerge if the comparison is made against the GDP levels that would have beenachieved had economies continued to grow at the average rates achieved during 2000–2007 (Fig. 3,
Please cite this article in press as: Didier, T., et al., How resilient and countercyclical were emergingeconomies during the global financial crisis?, Journal of International Money and Finance (2012),doi:10.1016/j.jimonfin.2012.05.007
T. Didier et al. / Journal of International Money and Finance xxx (2012) 1–2612
bottom panel). The difference between expected GDP, calculated based on forecast growth rates, andthe counterfactual GDP levels is a roughmeasure of the output cost of the crisis. By far, the regionmostaffected by the crisis is Eastern Europe and Central Asia, whose expected GDP level is about 14 and 16percent below the counterfactual trend in 2010 and 2011, respectively.
Annual GDP data suggest that emerging economies recovered similarly to developed economies, atleast during 2010. However, analysis of higher-frequency IP data suggests that emerging economies didrecover more strongly than advanced economies. While the collapse in IP was similar in advanced andemerging economies, the recovery began earlier in emerging economies. The peak in IP took placearound April 2008 for both advanced and emerging economies. But by January 2009, emergingeconomies had started a sustained recovery; while advanced economies started to rebound only inMay 2009 (Fig. 2 and Table 1). Thus, the downward phase of the cycle lasted, on average, nine monthsfor emerging economies and 13 months for advanced economies. As a consequence, emerging econ-omies achieved their pre-crisis levels of IP by November 2009, whereas advanced economies were stillwell below their pre-crisis levels by December 2010.12 Moreover, during the rebound, emergingeconomies witnessed growth rates in IP sometimes even larger than pre-crisis rates, a phenomenonnot observed in advanced economies. For example, using the data in Fig. 2, we observe that IP inadvanced economies was over sixteen percentage points below its geometric trend by December 2010,but in emerging economies it was about nine percentage points below trend by that date.13
2.3. Volatility or resilience?
One important difference between emerging anddeveloped economies is their degree of volatility ineconomic activity. To the extent that typical business-cycle fluctuations are more volatile in emergingeconomies,weexpect larger declines and recoveries in these economies. To address this issue,we reportin Table 1 (middle panel) statistics on yearly changes in GDP growth during crisis and non-crisis yearsover 1980–2010.14 We first observe that GDP growth in emerging economies is twice as volatile as thatof advanced economies during tranquil periods: the averagepositive (negative) change inGDP growth is3.2 (�3.1) percentage points in the former and 1.5 (�1.5) in the latter. This difference becomes moreacute during crisis years (excluding the 2008–2009 crisis) as the average decline in GDP growth is�5.9and�1.7 percentage points in emerging and advanced economies, respectively. In contrast, in 2009, theaverage change in GDP growthwas�5.9 and�4.4 percentage points, respectively. These numbers showthat the 2008–2009 crisis was not a typical business-cycle fluctuation: the average cross-countrydecline in GDP growth during 2009 was almost twice as large as that during tranquil times inemerging economies. More formally, t-test statistics of equality of means comfortably reject the nullhypothesis that these averages are the same.15 In addition, the table also discloses one way in whichemerging economies havebecomebetter, at least in relative terms. During previous crises, the decline inthe change in GDP growth was about 247% (5.9/1.7) larger in the typical emerging economy than in thetypical advanced economy. In contrast, during 2009, the collapse in GDP growth was only 34% (5.9/4.4)larger in the typical emerging economy relative to the typical advanced economy.
3. Transmission channels of the global shock
For the most part, the classic literature on the transmission of shocks across economies focuses onshocks that originate in emerging economies that spill over to other emerging economies. But this time
12 Alternative measures capturing the length of the recession, displayed in the bottom panel of Table 1, confirm that emergingeconomies started to recover earlier than advanced economies.13 In making this comparison, we use the emerging economies’ geometric trend over the period January 2002–April 2008.14 The crisis years are defined using a composite crisis indicator that takes into account banking, currency, and domestic andexternal debt crises on an annual basis. The beginning of a crisis event is considered as the first year with any of these crisisevents, provided that no other crisis has been observed in the preceding two years. For more details, see Broner et al. (2011).15 The statistics to test the equality of means are calculated by taking the difference between averages for each category. Thismight differ from the differences of the means reported as those were calculated by first averaging within economies and thenacross regions.
Please cite this article in press as: Didier, T., et al., How resilient and countercyclical were emergingeconomies during the global financial crisis?, Journal of International Money and Finance (2012),doi:10.1016/j.jimonfin.2012.05.007

T. Didier et al. / Journal of International Money and Finance xxx (2012) 1–26 13
the shock starts in the center of the world financial system, is of a larger scale, and is transmittedworldwide mostly through trade and financial factors.
3.1. The trade channel
Early signs of a downturn in advanced economies started to appear early in 2008 when IP showedweakening performance in the second quarter. The recession in these economies continued to deependuring the second half of 2008.16 Consumers in advanced economies suffered a large negative wealtheffect as stock markets plummeted, and they abruptly demanded fewer goods from the rest of theworld. As global demand collapsed, the price of these goods declined as well. In other words, the largedecline in export volumes was accompanied by a drop in commodity prices that hit all commodityexporters regardless of the final destination of their exports. These lower export prices might haveamplified the direct impact of lower global demand, which spread the global crisis even further.Moreover, the negative income shock suffered by commodity exporters might have lowered theirdemand for imports from other economies that then reinforced the decline in global demand. Natu-rally, economies more open to trade and more dependent on exports (such as those in East Asia) werehit more severely.
The worldwide collapse in trade flows occurred almost simultaneously with the generalized fall inIP levels. Global export volumes fell by around 25 percent between April 2008 and January 2009, andstarted to rebound thereafter, mirroring the observed trends in IP. For instance, emerging economiessuffered a collapse in trade volumes similar to that in advanced economies: between April 2008 andJanuary 2009, export volumes declined by around 22 percent in both groups of economies. In advancedeconomies, however, the decline in export volumes lasted longer than in other regions, consistent withthe slower recovery observed in their IP. Perhaps surprisingly, low-income economies suffereda collapse in trade similar to that of advanced and emerging economies but lower GDP collapses. Thiscould be at least in part explained by a lower degree of trade integration of these economies; that is, thedrop in export volumes might have had only a small impact on their level of economic activity.
3.2. The financial channel
The financial channel of shock transmission operates through the financial account that connectseconomies to the international financial system.When the large global shock, namely the post-LehmanBrothers panic, affected the world economy the negative wealth effect suffered in high-incomeeconomies led to a decrease in foreign investments and, therefore, to less available capital aroundthe world. This direct financial effect can be amplified by mechanisms that affect how financialintermediaries typically operate. For instance, international investors (banks, mutual funds, hedgefunds, and so forth) might have to reduce their exposures to emerging economies in response to shocksaffecting the size, liquidity, and quality of their assets. Leveraged investors, such as banks and hedgefunds, might face regulatory requirements, internal provisioning practices, or margin calls that promptthem to rebalance their portfolios by selling their foreign assets. In addition, international banks andother agents might generate capital outflows during crises; for example, if a parent bank in anothereconomy finds itself in need of a boost to its capital. Therefore, losses in a crisis-hit economymight leadinternational investors to sell off assets or curtail lending in other economies as well.
Several developments in the global financial system during the last two decades might haveamplified the transmission of the shock. Financial globalization and securitization (the process oftransforming illiquid assets into traded securities) led to a complex net of interconnections amongfinancial institutions across economies. The complex and multiple-layer structure of the securitizationprocess generated opaque and hard-to-value assets on their balance sheets. Simultaneously, financialinstitutions increased their leverage and financed their portfolios with less capital and more short-term debt, which might have reflected a moral hazard problem due to implicit government
16 Taylor (2009, 2010) argues that the U.S. government’s announcement that “there is systemic risk” and that “the GreatDepression is coming” led to worldwide panic and extreme uncertainty.
Please cite this article in press as: Didier, T., et al., How resilient and countercyclical were emergingeconomies during the global financial crisis?, Journal of International Money and Finance (2012),doi:10.1016/j.jimonfin.2012.05.007

T. Didier et al. / Journal of International Money and Finance xxx (2012) 1–2614
guarantees. With Lehman Brothers’ bankruptcy in September 2008, investors reassessed theirexpectations of whether large and complex financial institutions would be allowed to fail, which led tomore uncertainty about the consequences of possible failures of highly interconnected banks. Asa consequence, spreads in the interbank market skyrocketed and banks with large exposures tononperforming loans suffered large declines in their short-term funding. New information from Leh-man’s collapse, along with the uncertainty involved in the true value of the assets of financial insti-tutions, prompted a re-pricing of risk that induced a cycle of deleveraging as financial institutionsfound difficulties in rolling over their short-term liabilities. As large financial institutions deleveraged,credit to the nonfinancial sector declined as well. Simultaneously, as a response to higher risks,investors pulled out of risky assets, both in advanced and emerging economies, and purchased assetsperceived to be safer (mostly, U.S. T-bills).17
The increase in uncertainty, re-pricing of risk, and flight-to-quality effects were manifested in largedeclines in asset prices and capital flows around the world. There were large declines in capital inflowsby foreign investors across advanced and emerging economies. Advanced economies experienceda large drop in capital inflows between the first and last quarter of 2008 of 13 percentage points of GDP.The decline in emerging economies, of about 11 percentage points of GDP, was concentrated betweenthe third and fourth quarters of the same year. In contrast, low-income economies suffered a suddenbut short-lived drop in capital inflows in the first quarter of 2009; flows returned to their previouslevels over the next quarter. Moreover, while capital was flowing out of financially open economiesduring the peak of the turmoil, stock markets collapsed in a highly synchronized way across regions;and credit stagnated. This suggests a reinforcing pattern in which a decline in capital flows might havetriggered collapses in asset prices and a generalized deterioration in conditions in domestic financialsystems that in turn could have amplified the international flow of capital due to margin calls andcapital requirements, among other triggers.
3.3. Correlates of growth collapses and growth recoveries
To shed light on the impact of different variables related to the trade and financial mechanismsdiscussed above on growth collapses and recoveries, we present cross-country regressions for the2008–2009 global financial crisis and, for comparison purposes, regressions for the Asian and Russiancrises of the late 1990s. To mitigate some of the endogeneity concerns, we measure the explanatoryvariables at their pre-crisis values, namely 2007 values in the case of the 2008–2009 crisis and 1996values for the Asian and Russian crises.18
Table 3 reports regressions of growth collapses during the 2008–2009 crisis and the Asian andRussian crises on a number of variables capturing transmission channels. These regressions suggestthat economies more open to trade, with larger current account deficits, with higher growth rates ofdomestic credit relative to GDP over 2003–2007, and more financially open suffered greater growthcollapses during the 2008–2009 crisis. Although reserves in 2007 seem to be positively associated withgrowth collapses (top panel), the effect disappears after controlling for trade openness (bottom panel).Besides being statistically significant, these estimated coefficients are also economically significant. Forexample, the estimated coefficient of 0.06 for trade openness during the global crisis means that, onaverage, an increase in trade openness of 10 percentage points of GDP is associated with an additionaldrop of 0.6 percentage points in GDP growth during this turbulent episode. Results for the Asian and
17 Many observers have argued that the financial channel has been the main channel of transmission of shocks acrosseconomies during the 1990s (Baig and Goldfajn, 1999; Kaminsky and Reinhart, 2000; Van Rijckeghem and Weder, 2001;Caramazza et al., 2004). See also Kaminsky and Reinhart (2000) and Martinez Peria et al. (2005) on the role of banks;Borensztein and Gelos (2003), Kaminsky et al. (2004b), Broner et al. (2006), and Raddatz and Schmukler (in press) on the role ofmutual funds, among many others. Similar channels also operated during the global crisis.18 Our goal in this section is to consider a reduced set of, arguably, uncontroversial explanatory variables. There are severalpapers focused on uncovering the different possible variables affecting the incidence of the 2008–2009 crisis (Blanchard et al.,2010; Claessens et al., 2010; Frankel and Saravelos, 2010; Lane and Milesi-Ferretti, 2010; Rose and Spiegel, 2010, 2011, in press;Rose, 2011). Moreover, Aizenman and Spiegel (2010) argue that being a commodity exporter might also have an impact on theincidence of crises.
Please cite this article in press as: Didier, T., et al., How resilient and countercyclical were emergingeconomies during the global financial crisis?, Journal of International Money and Finance (2012),doi:10.1016/j.jimonfin.2012.05.007

Table 3Correlates of real GDP growth collapse.
2008–2009 Crisis Asian–Russian crises
(1) (2) (3) (4) (5) (1) (2) (3) (4) (5)
Panel A: without income-level dummies
De facto trade openness(exports þ imports,% of GDP)
�0.063(0.005)***
�0.050(0.004)***
Reserves (% of GDP) �0.194(0.028)***
�0.194(0.054)***
Current accountsurplus (% of GDP)
0.162(0.052)***
0.094(0.123)
Credit growth (% of GDP) �0.110(0.013)***
0.007(0.012)
Log of de facto financialopenness (% of GDP)
�1.189(0.085)***
�2.956(0.701)***
Number of observations 159 164 170 162 164 166 153 144 145 167R-squared 0.541 0.299 0.073 0.395 0.534 0.407 0.243 0.023 0.002 0.108Adjusted R-squared 0.539 0.295 0.068 0.391 0.531 0.403 0.238 0.016 �0.004 0.102
Panel B: with income-level dummies
Advanced economies �4.440(1.037)***
�4.634(1.048)***
�3.957(0.928)
�5.853(4.897)
�3.563(4.295)
�1.248(0.824)
�1.574(0.857)*
�1.415(0.799)*
�0.686(0.848)
�1.427(0.975)
Emerging economies �5.151(1.335)***
�4.786(1.282)***
�3.974(1.010)***
�5.700(3.960)
�4.087(3.417)
�5.689(1.161)***
�6.264(1.129)***
�5.543(1.059)***
�6.038(1.191)***
�6.508(1.365)***
Low-income economies �0.718(0.904)
0.030(0.892)
0.698(0.877)
�1.433(3.673)
0.904(3.266)
�5.744(1.293)***
�6.612(1.434)***
�5.258(1.262)***
�5.781(1.258)***
�6.356(1.447)***
De facto trade openness(exports þ imports,% of GDP)
�0.034(0.011)***
�0.029(0.011)***
�0.024(0.009)***
�0.035(0.014)**
�0.024(0.014)*
�0.003(0.012)
0.007(0.013)
0.003(0.011)
0.009(0.014)
0.018(0.017)
Reserves (% of GDP) 0.031(0.027)
0.018(0.035)
0.027(0.025)
0.011(0.031)
Current accountsurplus (% of GDP)
0.062(0.039)
0.011(0.039)
�0.060(0.062)
0.025(0.076)
Credit growth (% of GDP) �0.061(0.013)***
�0.062(0.016)***
0.001(0.008)
�0.003(0.008)
Log of de facto financialopenness (% of GDP)
0.271(0.910)
�0.079(0.788)
�1.118(0.899)
�1.047(1.097)
Number of observations 153 159 152 155 145 151 142 143 163 123R-squared 0.616 0.617 0.706 0.608 0.704 0.527 0.524 0.509 0.533 0.496Adjusted R-squared 0.603 0.604 0.696 0.595 0.687 0.511 0.507 0.491 0.519 0.461
(continued on next page)
T.Didier
etal./
Journalof
InternationalMoney
andFinance
xxx(2012)
1–26
15
Pleasecite
thisarticle
inpress
as:Didier,
T.,et
al.,How
resilientand
countercyclicalwere
emerging
economies
duringthe
globalfinancial
crisis?,Journal
ofInternational
Money
andFinance
(2012),doi:10.1016/j.jim
onfin.2012.05.007

Table 3 (continued )
2008–2009 Crisis Asian–Russian crises
(1) (2) (3) (4) (5) (1) (2) (3) (4) (5)
Wald test:advanced ¼ emerging
0.479 0.031 0.000 0.013 0.166 40.441** 43.185*** 37.664*** 22.324*** 17.528***
Wald test:advanced ¼ low-income
15.249*** 21.651*** 32.714*** 8.539*** 9.351*** 22.220** 21.976*** 19.213*** 16.481*** 14.386***
Wald test:emerging ¼ low-income
16.618*** 18.151*** 25.965*** 16.533*** 22.783*** 0.003 0.102 0.092 0.088 0.026
This table shows ordinary least square regressions of a real GDP growth collapse measure around the 2008–2009 crisis and he Asian and Russian crises against trade and financial variables.Panel B includes income-level dummies. Collapse during the 2008–2009 crisis is defined as the difference between the re l GDP growth rate in 2009 vis-à-vis the real GDP growth rate in2007. Collapse during the Asian and Russian crises is defined as the difference between the maximum and minimum g wth rates between 1996 and 1999, considering the monotonicdeclines in growth rate. Explanatory variables are measured at their 1996/2007 values to mitigate endogeneity concerns. redit Growth” is calculated across the five years previous to thestart of each crisis. “Log of de Facto Financial Openness” is defined as the sum of the stock of foreign assets and liabilities sc ed by GDP. The data come from Lane andMilesi-Ferretti (2007).The bottom lines show F statistics for Wald tests on whether the coefficient of the different income-level dummies are eq al. Robust standard errors are in parentheses. *, **, and *** meansignificance at the 10%, 5%, and 1% levels, respectively.
T.Didier
etal./
Journalof
InternationalMoney
andFinance
xxx(2012)
1–26
16Pleasecite
thisarticle
inpress
as:Didier,
T.,et
al.,How
resilientand
countercyclicalwere
emerging
economies
duringthe
globalfinancial
crisis?,Journal
ofInternational
Money
andFinance
(2012),doi:10.1016/j.jim
onfin.2012.05.007
*
*
taro“Calu
T. Didier et al. / Journal of International Money and Finance xxx (2012) 1–26 17
Russian crises are similar except that the current account and credit growth are statisticallyinsignificant.
Note that the coefficients on income dummies (bottom panel) suggest that, even after controllingfor some of the variables believed to be related to the growth collapse, there is no difference in the GDPgrowth collapse experienced by advanced and emerging economies during the 2008–2009 crisis. Low-income economies, however, indeed fell less. In contrast, during the Asian and Russian crises, growthdeclines in advanced economies were modest if compared to those in emerging and low-incomeeconomies, which suffered collapses of similar magnitude.
Table 4 reports cross-country regressions analyzing the recovery from both crises, with andwithoutthe extent of the growth collapse as an explanatory variable. Consistent with the graphical analysis inFig. 1, we find that economies that suffered larger collapses in real GDP growth experienced strongergrowth recoveries both during the 2008–2009 crisis and the Asian and Russian crises. In addition, thereis some evidence that economies more open to trade, with higher ratios of international reserves toGDP, and more financially open experienced stronger recoveries. Most of the estimated coefficients onexplanatory variables are not statistically different from zero after controlling for the extent of thecollapse during the 2008–2009 crisis, except perhaps for trade openness.When this bounce-back effectis not controlled for (top panel), the variables statistically significant in the collapse regressions (Table3) also tend to be statistically significant in explaining the growth recovery. Similar results are observedfor the growth recovery around the Asian and Russian crises. Once we control for the growth collapse,most of the variables are no longer statistically significant in explaining the growth recovery.
4. Resilience and policy responses to the crisis
Once an economy is hit by an external shock, the way it performs and how resilient it is depends toa large extent on its economic fundamentals. In previous crisis episodes, many emerging economieswere usually caught with substantial macroeconomic and financial vulnerabilities that sapped theirability to undertake countercyclical policies. They were instead compelled to respond procyclically: toraise interest rates, cut fiscal spending, and/or hike taxes to cope with capital outflows, currencypressures, and low international reserve levels. Furthermore, in many cases, even these measures wereunable to prevent financial meltdowns. As argued by Reinhart and Reinhart (2008), the lack of access toworld capital markets during turbulent times might have hampered the ability of governments toconduct countercyclical fiscal policies.19
In stark contrast with this past, and at least in part exactly because of it, many emerging economieswere better prepared to withstand external shocks and were consequently in relatively strongerpositions when the global financial crisis erupted. The crisis found many emerging economies with therequired credibility and space to conduct countercyclical monetary and fiscal policies and a moreconsolidated financial stance. Several factors proved to be useful during late 2008 and early 2009,creating buffers between the external conditions and the local economy. Broadly speaking, thesefactors comprise developments in (i) monetary and exchange-rate policies, (ii) fiscal policy, and (iii)external and domestic financial positions.20
4.1. Monetary and fiscal policy
Perhaps one of the most surprising features of the emerging economies’ responses to the globalcrisis was the drastic reduction in interest rates. During previous crises, emerging economies weretypically forced to increase interest rates to contain capital outflows and the drainage in internationalreserves as their currencies were attacked. During the global crisis, the acquired credibility andinstitutional capacity of their central banks seemed essential to conduct active countercyclical
19 Kaminsky et al. (2004a) provide additional evidence documenting that emerging economies have typically followed pro-cyclical policies in bad times.20 For more details on descriptive statistics and additional anecdotal evidence suggesting a structural break in emergingmarket policies, see the working paper version of this article (Didier et al., 2011).
Please cite this article in press as: Didier, T., et al., How resilient and countercyclical were emergingeconomies during the global financial crisis?, Journal of International Money and Finance (2012),doi:10.1016/j.jimonfin.2012.05.007

Table 4Correlates of real GDP growth recovery.
2008–2009 Crisis Asian–Russian crises
(1) (2) (3) (4) (5) (1) (2) (3) (4) (5)
Panel A: not controlling for real GDP growth collapse
De facto trade openness(exports þ imports,% of GDP)
0.040(0.004)***
0.031(0.005)***
Reserves (% of GDP) 0.129(0.019)***
0.112(0.042)***
Current account surplus(% of GDP)
�0.100(0.032)***
�0.107(0.068)
Credit growth (% of GDP) 0.060(0.010)***
0.003(0.009)
Log of de facto financialopenness (% of GDP)
0.783(0.066)***
1.930(0.622)***
Number of observations 159 164 170 162 164 167 153 144 145 167R-squared 0.421 0.257 0.053 0.233 0.446 0.189 0.107 0.040 0.001 0.054Adjusted R-squared 0.418 0.252 0.047 0.228 0.442 0.184 0.101 0.034 �0.006 0.048
Panel B: controlling for real GDP growth collapse
Real GDP growth collapse 0.512(0.069)***
0.531(0.072)***
0.570(0.073)***
0.502(0.072)***
0.558(0.076)***
0.682(0.102)***
0.708(0.088)***
0.699(0.107)***
0.644(0.106)***
0.717(0.101)***
De facto tradeopenness (exports þimports, % of GDP)
0.007(0.005)
0.007(0.004)*
0.007(0.004)*
0.000(0.007)
�0.002(0.008)
0.001(0.006)
0.010(0.006)*
�0.005(0.006)
0.000(0.009)
�0.007(0.009)
Reserves (% of GDP) 0.009(0.014)
0.009(0.017)
�0.034(0.017)**
�0.032(0.018)*
Current accountsurplus (% of GDP)
0.005(0.027)
�0.004(0.035)
�0.066(0.031)**
�0.048(0.040)
Credit growth (% of GDP) �0.013(0.008)
�0.012(0.010)
0.008(0.007)
0.006(0.007)
Log of de factofinancial openness(% of GDP)
0.184(0.141)
0.170(0.155)
�0.090(0.596)
0.144(0.572)
Number of observations 153 159 152 155 145 151 142 143 163 123R-squared 0.676 0.670 0.690 0.676 0.690 0.575 0.607 0.583 0.492 0.607Adjusted R-squared 0.669 0.664 0.684 0.670 0.676 0.567 0.598 0.574 0.482 0.587
This table shows ordinary least square regressions of a real GDP growth recovery measure around the 2008–2009 crisis and the Asian and Russian crises against trade and financial variables.Panel B includes the real GDP growth collapsemeasure as an additional control. Recovery during the 2008–2009 crisis is defined as the difference between the expected real GDP growth rate in2010 vis-à-vis the real GDP growth rate in 2009. Recovery during the Asian and Russian crises is defined as the difference between the real GDP growth rate in 2000 vis-à-vis the minimumgrowth rate used to calculate the collapse. See Table 3 for real GDP growth collapse definitions. Explanatory variables aremeasured at their 1996/2007 values tomitigate endogeneity concerns.“Credit Growth” is calculated across thefive years previous to the start of each crisis. “Log of de Facto Financial Openness” is defined as the sumof the stock of foreign assets and liabilities scaledby GDP. The data come from Lane and Milesi-Ferretti (2007). Robust standard errors are in parentheses. *, **, and *** mean significance at the 10%, 5%, and 1% levels, respectively.
T.Didier
etal./
Journalof
InternationalMoney
andFinance
xxx(2012)
1–26
18Pleasecite
thisarticle
inpress
as:Didier,
T.,et
al.,How
resilientand
countercyclicalwere
emerging
economies
duringthe
globalfinancial
crisis?,Journal
ofInternational
Money
andFinance
(2012),doi:10.1016/j.jim
onfin.2012.05.007

T. Didier et al. / Journal of International Money and Finance xxx (2012) 1–26 19
monetary policies when theworld economy came to a halt. For example, inflation-targeting economiesin Asia and Latin America implemented drastic reductions in their monetary policy rates. Instead,during previous crises these economies had to increase their interest rates. In contrast to Asian andLatin American economies, money market rates increased considerably during the 2008–2009 crisis ineconomies in Eastern Europe and Central Asia.
The exchange-rate regime was a key factor behind economies’ ability to lower interest rates. Withthe exception of Eastern Europe, most financially globalized emerging economies have moved towardsmore flexible exchange-rate regimes, especially after the emerging market crises of the 1990s. Thischange in exchange-rate policy was feasible for at least two reasons: first, central banks improved theirindependence, credibility, and institutional capacity; and second, these economies were able to reducecurrency mismatches in the government and private sectors’ balance sheets through the deepening oflocal currency debt markets. These developments implied that exchange-rate fluctuations had lessadverse balance-sheet effects. As a result of thesemore flexiblemonetary regimes, exchange rates wereallowed to depreciate significantly in 2008 thereby cushioning the global shock and, at the same time,helping mitigate the deterioration of the external balance. In previous crisis episodes, many emergingeconomies had to devalue their currencies not as a choice but as the result of a run on their currencies.
Regarding fiscal policy, many emerging economies improved their fiscal stances during the 2000sand acquired enough fiscal space to design and implement packages to counteract the sharpcontraction in the world economy. In fact, during the 2008–2009 crisis, many emerging and low-income economies had more fiscal space than developed economies, and a number announcedstrong countercyclical fiscal policies even larger than those in several advanced economies.21 Thestrong expansion in fiscal balances in emerging economies contrasts with the typical fiscal consoli-dations observed during previous crises episodes. In the past, emerging economies usually followedprocyclical fiscal policies (Kaminsky et al., 2004a) and particularly so during periods of turmoil.
4.2. Financial factors
Two key developments in the management of their financial accounts have helped emergingeconomies reduce their vulnerabilities to external shocks. First, many economies improved theircurrent account positions, thereby becoming less dependent on foreign financing. Second, and perhapsmore importantly, many emerging economies have steadily changed the structure of their externalassets and liabilities, which made balance-sheet effects work in their favor during the global crisis.There was a switch of foreign liabilities from debt to equity while debt assets in foreign currency wereaccumulated to levels that exceeded foreign-debt liabilities. As currencies depreciated, the localcurrency value of their external assets increased, while that of their debt liabilities shrank. In addition,with the collapse in economic activity and the decline in equity prices, the local currency value ofemerging economies’ equity liabilities also contracted. Of course, emerging economies were able andwilling to let their currencies depreciate precisely because of this change in the composition of theirforeign assets and because liabilities did not create concerns for negative balance-sheet effects. Incontrast, developed economies saw increased debt liabilities vis-à-vis emerging economies in part asa reflection of large debt flows used to finance the U.S. current account deficit. Simultaneously,advanced economies became net claimants on emerging economies on the equity side.
The other side of the coin of this safer form of international financial integration among emergingeconomies was the accumulation of foreign reserves, which picked up dramatically in the emergingworld after the Asian and Russian crises of the late 1990s. Reserve accumulation has served twopurposes in emerging economies: first, it slowed down the appreciation of the domestic currencyduring the pre-crisis expansionary period; and second, it served as a self-insurance mechanism duringthe crisis that deterred currency and banking panics. In fact, when the global crisis erupted, manyemerging economies held international reserves in excess of their stock of short-term foreign
21 Using the fiscal space measure of Aizenman and Jinjarak (2010), Didier et al. (2011) show that in 2007 the groups ofemerging and low-income economies had larger fiscal space than the group of advanced economies. Eastern Europeaneconomies, however, had very low fiscal space according to the proposed measure.
Please cite this article in press as: Didier, T., et al., How resilient and countercyclical were emergingeconomies during the global financial crisis?, Journal of International Money and Finance (2012),doi:10.1016/j.jimonfin.2012.05.007

T. Didier et al. / Journal of International Money and Finance xxx (2012) 1–2620
liabilities. In practice, this eliminated concerns about debt-rollover difficulties, which gave investorsless incentives to attack emergingmarket currencies. At the same time, international reserves also gavecentral banks significant room to contain the depreciation of their currencies during the period ofturmoil.
Another important factor behind the flexibility in exchange rates amongmany emerging economiesin the aftermath of Lehman Brothers’ demise was the shift in emerging economies’ borrowing fromforeign currency towards domestic currency. This change in the currency denomination of debtcontracts has minimized the negative balance-sheet effects commonly observed in previous crisisepisodes when devaluations led to debt-overhang problems. Moreover, some emerging economieswere able to increase the average maturity of their domestic and international private debt, alsoreducing concerns about debt-rollover difficulties. For example, relative to the 1990s, economies in theLatin America and Caribbean region have been able to increase the average maturity of internationaldebt from 5.4 years to 7.7 years. Note that this increase in thematurity of debt across emerging regions,while widespread in local markets, was not as homogeneous in international markets. For instance,while maturity of international debt has increased on average across economies in Latin America andthe Caribbean and in Eastern Europe and Central Asia, declines have been observed among economiesin Asia and in the Middle East and Africa.
The soundness of domestic financial sectors also improved significantly during the pre-crisis yearsin several emerging economies due to better regulation and supervision, more prudent practices byfinancial intermediaries, and abundant local liquidity. When the international wholesale interbankmarket dried up in the last quarter of 2008, banks that relied more on this short-term wholesalemarket were hit harder and suffered rollover problems (Raddatz, 2010). Thus, even as the externalenvironment deteriorated sharply, local financial systems remained on sound footing and depositorsdid not flee the domestic banking system (unlike during previous crises). Perhaps for the first time inrecent decades, the domestic financial systems of many emerging economies at least did not amplifythe shock emanating from the international financial system.
4.3. A systematic analysis of the structural breaks in policies
In this subsection, we study the structural break in policies across emerging economies bycomparing more systematically the responses of key variables during the 2008–2009 crisis vis-à-visthe Asian and Russian crises. To do so, we perform a graphical and statistical comparison ofnonparametric densities. We also estimate quantile regressions to document differences across thepercentiles of the distribution of policies between the two crisis episodes. We perform the analysis forthe sample of all economies and separately for the sample of emerging economies.
Fig. 4 displays nonparametric density estimates of nine monetary, fiscal, and financial indicators forthe sample of all economies. Each figure has two density estimates that correspond to the 2008–2009crisis (black line) and the Asian and Russian crises (grey line), and each has the p-value of thenonparametric Kolmogorov–Smirnov test of equality of the two density functions. On the monetaryside, more economies were able to perform countercyclical monetary policy through reductions intheir moneymarket rates during the 2008–2009 crisis than in the past. In addition, relative to the Asianand Russian crises, economies suffered lower depreciations but more volatile exchange-rate move-ments during the 2008–2009 crisis. Moreover, economies lost substantially less reserves during the2008–2009 crisis than during the Asian and Russian crises. On the fiscal side, while the ratio ofrevenues to GDPda measure of average tax ratesdwas almost identical in the three episodes, there isan increase in the mass of economies with higher deficits and higher changes in government expen-ditures as a fraction of GDP. Moreover, the figure shows that, during the Asian and Russian crises, manyeconomies had to contract their government expenditures relative to GDP, while during the 2008–2009 crisis relatively few economies had to contract fiscal expenditures.
We also report densities for two measures of wealth effects from debt and equity holdings of eacheconomy. These measures try to capture the change in the local currency value of debt and equityholdings due to changes in nominal exchange rates and in local and international (debt and equity)prices. For these calculations, we use U.S. prices as a proxy for international prices. In particular, wedefine the wealth effect from debt holdings as:
Please cite this article in press as: Didier, T., et al., How resilient and countercyclical were emergingeconomies during the global financial crisis?, Journal of International Money and Finance (2012),doi:10.1016/j.jimonfin.2012.05.007

Fig. 4. Density plots. This figure shows the density plots of different policy variables during the Asian and Russian crises and the2008–2009 crisis. All available economies are included in the density estimations. In the case of the 2008–2009 crisis, policyvariables are calculated for the 2007–2009 period. In the case of the Asian and Russian crises, policy variables are calculated duringthe period used for the collapse variable, defined as the difference between the maximum and minimum growth rates between 1996and 1999, considering the monotonic declines in growth rate. The wealth effect variables capture the change in the local currencyvalue of debt and equity holdings due to changes in nominal exchange rates and local and international (debt and equity) prices. Inparticular, the 1996–2007 stock of debt (equity) assets is multiplied by the combined change in the local nominal exchange rate andthe change in an international debt (stock) index denominated in U.S. dollars. Similarly, the 1996–2007 stock of debt (equity)liabilities is multiplied by the combined change in the local nominal exchange rate and the change in a local debt (stock) indexdenominated in U.S. dollars. Both terms are then combined to obtain the net wealth effect. Debt and equity holdings are scaled byGDP. Changes in exchange rates (FX) and debt and stock indexes are calculated across the duration of each crisis as described above.For these calculations, we use the U.S. for the international prices. See the main text for more details. For each variable and crisis, thetop and bottom 5 percent of observations are excluded as outliers. “K–S p-value” shows the p-value from a Kolmogorov–Smirnov testof equality of distributions between the two crises for each policy variable. Densities are estimated using the Epanechnikov kernelfunction. The number of observations included in each density estimation is shown in parentheses.
T. Didier et al. / Journal of International Money and Finance xxx (2012) 1–26 21
WDit ¼ DAi
t
h�1þ DBPUSt
��1þ DFXi
t
�� 1
i� DLit
h�1þ DBPit
��1þ DFXi
t
�� 1
i;
where i denotes an economy; t ¼ 1996, 2007 is a time index; DAti denotes debt assets, including foreign
reserves, and DLti is debt liabilities, both expressed as a percentage of GDP; DBPUSt and DBPit denotepercentage changes across the crisis period in a debt-price index from the U.S. and economy i,respectively; andDFXi
t is the percentage change across the crisis period in the nominal exchange rate ineconomy i. The wealth effect from equity holdings is defined as
WEit ¼ EAit
h�1þ DEPUSt
��1þ DFXi
t
�� 1
i� ELit
h�1þ DEPit
��1þ DFXi
t
�� 1
i;
where EAti and ELti denote equity assets and liabilities, respectively, as a percentage of GDP, DEPUSt is the
percentage change across the crisis period from a U.S. stock-price index, and DEPit is the percentagechange across the crisis period from a stock-price index in economy i, measured in U.S. dollars. Fig. 4shows that, during the 2008–2009 crisis, more economies enjoyed positive debt and equity wealtheffects relative to the Asian and Russian crises. Moreover, while in the latter crises several economiessuffered very large negative wealth effects on debt holdings, inducing negative balance-sheet effects,almost no economy suffered a negative wealth effect on debt holdings during the 2008–2009 crisisrelative to the U.S.
Please cite this article in press as: Didier, T., et al., How resilient and countercyclical were emergingeconomies during the global financial crisis?, Journal of International Money and Finance (2012),doi:10.1016/j.jimonfin.2012.05.007
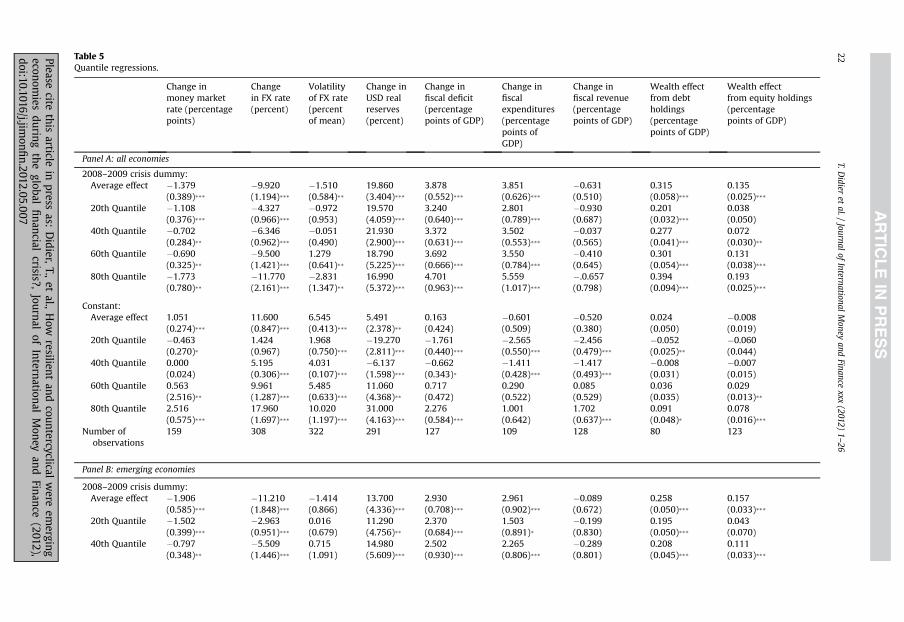
Table 5Quantile regressions.
Change inmoney marketrate (percentagepoints)
Changein FX rate(percent)
Volatilityof FX rate(percentof mean)
Change inUSD realreserves(percent)
Change infiscal deficit(percentagepoints of GDP)
Change infiscalexpenditures(percentagepoints ofGDP)
Change infiscal revenue(percentagepoints of GDP)
Wealth effectfrom debtholdings(percentagepoints of GDP)
Wealth effectfrom equity holdings(percentagepoints of GDP)
Panel A: all economies
2008–2009 crisis dummy:Average effect �1.379
(0.389)***�9.920(1.194)***
�1.510(0.584)**
19.860(3.404)***
3.878(0.552)***
3.851(0.626)***
�0.631(0.510)
0.315(0.058)***
0.135(0.025)***
20th Quantile �1.108(0.376)***
�4.327(0.966)***
�0.972(0.953)
19.570(4.059)***
3.240(0.640)***
2.801(0.789)***
�0.930(0.687)
0.201(0.032)***
0.038(0.050)
40th Quantile �0.702(0.284)**
�6.346(0.962)***
�0.051(0.490)
21.930(2.900)***
3.372(0.631)***
3.502(0.553)***
�0.037(0.565)
0.277(0.041)***
0.072(0.030)**
60th Quantile �0.690(0.325)**
�9.500(1.421)***
1.279(0.641)**
18.790(5.225)***
3.692(0.666)***
3.550(0.784)***
�0.410(0.645)
0.301(0.054)***
0.131(0.038)***
80th Quantile �1.773(0.780)**
�11.770(2.161)***
�2.831(1.347)**
16.990(5.372)***
4.701(0.963)***
5.559(1.017)***
�.0.657(0.798)
0.394(0.094)***
0.193(0.025)***
Constant:Average effect 1.051
(0.274)***11.600(0.847)***
6.545(0.413)***
5.491(2.378)**
0.163(0.424)
�0.601(0.509)
�0.520(0.380)
0.024(0.050)
�0.008(0.019)
20th Quantile �0.463(0.270)*
1.424(0.967)
1.968(0.750)***
�19.270(2.811)***
�1.761(0.440)***
�2.565(0.550)***
�2.456(0.479)***
�0.052(0.025)**
�0.060(0.044)
40th Quantile 0.000(0.024)
5.195(0.306)***
4.031(0.107)***
�6.137(1.598)***
�0.662(0.343)*
�1.411(0.428)***
�1.417(0.493)***
�0.008(0.031)
�0.007(0.015)
60th Quantile 0.563(2.516)**
9.961(1.287)***
5.485(0.633)***
11.060(4.368)**
0.717(0.472)
0.290(0.522)
0.085(0.529)
0.036(0.035)
0.029(0.013)**
80th Quantile 2.516(0.575)***
17.960(1.697)***
10.020(1.197)***
31.000(4.163)***
2.276(0.584)***
1.001(0.642)
1.702(0.637)***
0.091(0.048)*
0.078(0.016)***
Number ofobservations
159 308 322 291 127 109 128 80 123
Panel B: emerging economies
2008–2009 crisis dummy:Average effect �1.906
(0.585)***�11.210(1.848)***
�1.414(0.866)
13.700(4.336)***
2.930(0.708)***
2.961(0.902)***
�0.089(0.672)
0.258(0.050)***
0.157(0.033)***
20th Quantile �1.502(0.399)***
�2.963(0.951)***
0.016(0.679)
11.290(4.756)**
2.370(0.684)***
1.503(0.891)*
�0.199(0.830)
0.195(0.050)***
0.043(0.070)
40th Quantile �0.797(0.348)**
�5.509(1.446)***
0.715(1.091)
14.980(5.609)***
2.502(0.930)***
2.265(0.806)***
�0.289(0.801)
0.208(0.045)***
0.111(0.033)***
T.Didier
etal./
Journalof
InternationalMoney
andFinance
xxx(2012)
1–26
22Pleasecite
thisarticle
inpress
as:Didier,
T.,et
al.,How
resilientand
countercyclicalwere
emerging
economies
duringthe
globalfinancial
crisis?,Journal
ofInternational
Money
andFinance
(2012),doi:10.1016/j.jim
onfin.2012.05.007

60th Quantile �0.709(0.701)
�10.700(1.996)***
0.180(1.246)
4.328(5.840)
2.921(0.850)***
2.515(1.111)**
0.7320.945)
0.200(0.062)***
0.151(0.038)***
80th Quantile �1.897(1.212)
�14.540(5.233)***
�1.767(1.868)
15.960(9.685)
3.912(1.0172)***
5.909(1.874)***
0.3261.143)
0.281(0.077)***
0.198(0.032)***
Constant:Average effect 1.940
(0.429)***12.560(1.303)***
6.115(0.605)***
7.361(3.086)**
1.176(0.551)**
0.080(0.740)
1.3900.521)***
0.028(0.042)
�0.009(0.026)
20th Quantile 0.000(0.258)
0.000(0.869)
0.000(0.229)
�13.480(3.624)***
�0.891(0.496)*
�1.679(0.690)**
3.2520.383)***
�0.059(0.038)
�0.034(0.061)
40th Quantile 0.352(0.249)
5.195(1.154)***
3.064(0.806)***
�5.084(4.610)
0.675(0.710)
�0.577(0.635)
1.7520.627)***
�0.008(0.038)
�0.007(0.012)
60th Quantile 1.024(0.651)
10.700(1.976)***
6.042(1.069)***
16.180(4.375)***
1.499(0.607)**
0.448(0.642)
1.1960.769)
0.042(0.043)
0.019(0.018)
80th Quantile 3.587(1.110)***
20.000(4.751)***
9.729(1.681)***
29.170(5.168)***
3.044(0.859)***
1.432(1.108)
.0540.791)
0.126(0.054)**
0.076(0.021)***
Number ofobservations
95 157 164 156 71 61 0 57 73
This table shows OLS and 20th, 40th, 60th, and 80th quantile regressions of different policy variables against a 2008–2009 isis dummy. Panel A includes all available economies; panel Bincludes only emerging economies. “Average effect” corresponds to the OLS regressions. In the case of the 2008–2009 cris policy variables are calculated for the 2007–2009 period. FXmeans foreign exchange. See themain text and Fig. 4 for more details on the calculation of the wealth effects. For each variab , the top and bottom 5 percent of observations are excluded asoutliers. *, **, and *** mean significance at the 10%, 5%, and 1% levels, respectively.
T.Didier
etal./
Journalof
InternationalMoney
andFinance
xxx(2012)
1–26
23
Pleasecite
thisarticle
inpress
as:Didier,
T.,et
al.,How
resilientand
countercyclicalwere
emerging
economies
duringthe
globalfinancial
crisis?,Journal
ofInternational
Money
andFinance
(2012),doi:10.1016/j.jim
onfin.2012.05.007
(�(
�(�(�(�(1(7
cris,le
T. Didier et al. / Journal of International Money and Finance xxx (2012) 1–2624
We complement the above analysis by running quantile regressions to check whether there isa significant change in some key quantiles of the distributions (Table 5). We focus on the 20th, 40th,60th, and 80th quantiles, and also report the change in the average values of the distributions. Inparticular, we pool the information of the variable of interest across crises and run quantile regressionson a constant and a dummy variable taking the value of one during the 2008–2009 crisis. The constantis interpreted as the level of the jth quantile of the variable of interest during the Asian and Russiancrises, and the coefficient on the dummy variable represents the change in the location of that quantilebetween the 2008–2009 crisis and the Asian and Russian crises.22 We find that there are statisticallysignificant changes in most quantiles of the distributions. For example, all quantiles and the meanshow a significant improvement in the debt and equity wealth effects during the 2008–2009 crisisrelative to the Asian and Russian crises (except for the 20th quantile of the equity wealth effect).Likewise, there is a significant decline (although to varying degree of significance) in money marketrates in all quantiles.
Overall, the above findings show a significant change in the stance of policies during the 2008–2009crisis relative to the Asian and Russian crises. Although these are encouraging results, they are based onthe sample of all economies, some of whomwere not strongly affected by the Asian and Russian crisesbut were so during the 2008–2009 crisis. This observation could be biasing the results toward findinga significant change in policies for the simple reason that during the 1990s several economies did nothave the need to conduct countercyclical policies. For that reason, we restrict the sample to emergingeconomies. Arguably, this set of economies suffered output declines both during the Asian and Russiancrises and the 2008–2009 crisis.
Quantile regressions within the group of emerging economies (Table 5) show important changes inpolicies in these countries as well. For example, there is a significant decline in the average moneymarket rates and the 20th, 40th, and 80th quantiles (the latter at the 10 percent significance level).Emerging economies expanded their fiscal expenditures during the 2008–2009 crisis, resulting instatistically significant increases in the average effect (of about 3 percentage points of GDP) and in allquantiles. The size of the coefficients on the 2008–2009 crisis dummy increases for higher quantiles,implying both a shift to the right and a spread of the distribution. Consider, for example, the typicaleconomies located in the 20th and 80th quantiles of the distribution of changes in fiscal expendituresduring the Asian and Russian crises. During the 2008–2009 crisis, the economies in the 20th quantileincreased fiscal expenditures by about 1.5 percentage points of GDP relative to an increase of almost 6percentage points observed in the economies in the 80th quantile. We also find significant improve-ments in the average effect and in all quantiles of debt and wealth effects. Furthermore, densitiesanalogous to those in Fig. 4 but for the group of emerging economies yield similar conclusions.23
5. Conclusions
Contrary to common perceptions, emerging economies were hit by the global crisis as much asadvanced economies. As the world economy collapsed, both emerging and advanced economies wit-nessed declines in growth rates of similar magnitude when compared to their own pre-crisis rates,evenwhen emerging economies kept growing at a higher rate than advanced economies. Furthermore,because the size of the collapse in each economy explains a significant part of the post-crisis perfor-mance, the rebound from the crisis was similar in emerging and advanced economies. One sign ofresilience for emerging economies is that they started their recovery earlier than advanced economies,returning to their higher pre-crisis growth rates and, consequently, converging faster to their long-runoutput trend. Still, there is significant heterogeneity among emerging economies, with Eastern Europe
22 The level of the jth quantile of the variable of interest in the 2008–2009 crisis is recovered by adding the constant and thecoefficient on the dummy variable.23 These densities (not reported in the paper) show that emerging economies were more able to decrease their money marketrates and increase government expenditures as a fraction of GDP during the 2008–2009 crisis relative to the past. Moreover,while about 50 percent of the economies contracted government expenditures as a fraction of GDP, only 22 percent did soduring the 2008–2009 crisis. Furthermore, emerging economies enjoyed more positive wealth effects, both in equity and debt,relative to the Asian and Russian crises.
Please cite this article in press as: Didier, T., et al., How resilient and countercyclical were emergingeconomies during the global financial crisis?, Journal of International Money and Finance (2012),doi:10.1016/j.jimonfin.2012.05.007
T. Didier et al. / Journal of International Money and Finance xxx (2012) 1–26 25
and Central Asia faring much worse. The crisis seems to have been transmitted mostly through tradeand financial factors, which likely contributed to the better performance of the less-connected low-income economies.
The evidence suggests that it was difficult for emerging economies to decouple from the worldeconomy at the same time that they were part of the global production system, used foreign funds tofinance investments, and held assets abroad. Any significant collapse in global demand and financialcenters was likely to get transmitted to all economies linked to them. The faster recovery of IP inemerging economies could be partly explained by a recomposition of inventories that were initiallydepleted and needed restocking once it became obvious that theworld economywould eventually stopits freefall.
Notwithstanding the large collapse, emerging economies indeed made progress during the 2000snot so much relative to advanced economies but relative to their own past. Namely, emerging econ-omies were able to become more similar to advanced economies and therefore the 2008–2009external shock was not magnified. While during past crises emerging economies fell more thanadvanced economieswith the financial system and the public sector amplifying the shock, this time thetwo groups of economies fell similarly. Furthermore, emerging economies were able to use a widerange of countercyclical policies. While these tools have been available to advanced economies fora long time, emerging economies had to overcome their past history of procyclicality. The good stanceof emerging economies before the global crisis and the policies implemented during it were likelyreflected in their improved performance.
To conclude, the continuing integration in global trade and global financial markets poses a trade-offto emerging economies.While integration tends to be associatedwith higher growth and other positivespillover effects, it also makes economies susceptible to foreign shocks and contagion effects. Thisvulnerability makes the lessons from the global crisis more telling. Emerging economies will probablytry to keep improving their external positions, expanding theirfiscal space, reducing creditmismatches,building buffers in the financial system, and gaining credibility in their monetary policy among otherthings. These policies seemed to have helped during the global downturn and the incentives to continuethem only becamemore obvious. Unfortunately, some of these countercyclical policies entail pecuniaryand opportunity costs, like those related to hoarding reserves, developing local currency and long-termdebt markets, and slowing down the growth rate of credit and consumption. Moreover, the actions bysome economies may have negative spillover effects. For example, by limiting foreign capital someeconomies might push capital to flow to neighboring economies, exerting additional upward pressureon their domestic currencies during good times. Having a broad framework to understand the generalequilibrium effects (within and across economies) of the policies adopted to deal with globalization andcrises is an avenue for fruitful new research.
References
Agarwal, S., Ho, C., 2007. Comparing the prime and subprime mortgage markets. Chicago Fed Letter 241 (August).Aizenman, J., Jinjarak, Y., 2010. Globalization and developing economies – a shrinking tax base? Journal of Development Studies
45 (5), 653–671.Aizenman, J., Spiegel, M., 2010. Takeoffs. Review of Development Economics 14 (2), 177–196.Alessandria, G., Kaboski, J.P., Midrigan, V., 2010. The great trade collapse of 2008–09: an inventory adjustment? IMF Economic
Review 58 (2), 254–294.Alessandria, G., Kaboski, J.P., Midrigan, V., 2012. U.S. trade and inventory dynamics. American Economic Review 101 (3),
303–307.Almunia, M., Bénétrix, A., Eichengreen, B., O’Rourke, K.H., Rua, G., 2009. From great depression to great credit crisis: similarities,
differences and lessons. NBER Working Paper 15524, November.Baig, T., Goldfajn, I., 1999. Financial market contagion in the Asian crisis. IMF Staff Papers 46 (2), 167–195.Blanchard, O., Faruqee, H., Das, M., 2010. The initial impact of the crisis on emerging market countries. Brookings Papers on
Economic Activity, Spring: pp. 263–307.Borensztein, E.R., Gelos, R.G., 2003. A panic-prone pack? The behavior of emerging market mutual funds. IMF Staff Papers 50 (1),
43–63.Broner, F., Didier, T., Erce, A., Schmukler, S., 2011. Capital flows: dynamics and crises. CEPR Discussion Papers 8591.Broner, F., Gelos, R.G., Reinhart, C.M., 2006. When in peril, retrench: testing the portfolio channel of contagion. Journal of
International Economics 69 (1), 203–230.Broner, F.A., Lorenzoni, G., Schmukler, S.L., Why do emerging economies borrow short term? Journal of the European Economic
Association, in press.
Please cite this article in press as: Didier, T., et al., How resilient and countercyclical were emergingeconomies during the global financial crisis?, Journal of International Money and Finance (2012),doi:10.1016/j.jimonfin.2012.05.007

T. Didier et al. / Journal of International Money and Finance xxx (2012) 1–2626
Caramazza, F., Ricci, L., Salgado, R., 2004. International financial contagion in currency crises. Journal of International Money andFinance 23 (1), 51–70.
Claessens, S., Dell’Ariccia, G., Igan, D., Laeven, L., 2010. Cross-country experiences and policy implications from the globalfinancial crisis. Economic Policy 62, 267–293.
Didier, T., Hevia, C., Schmukler, S., 2011. How resilient were emerging economies to the global crisis? Policy Research WorkingPaper Series 5224, The World Bank.
Eichengreen, B., 2010. Lessons of the crisis for emerging markets. International Economics and Economic Policy 7 (1), 49–62.Frankel, J., Saravelos, G., 2010. Are leading indicators of financial crises useful for assessing country vulnerability? Evidence from
the 2008–09 global crisis. NBER Working Paper 16047, June.Frankel, J., Vegh, C., Vuletin, G., 2011. On Graduation from fiscal procyclicality. NBER Working Papers 17691, November.Gourinchas, P.O., Rey, H., 2007. From world banker to world venture capitalist: U.S. external adjustment and the exorbitant
privilege. In: Clarida, R. (Ed.), G-7 Current Account Imbalances: Sustainability and Adjustment. University of Chicago Press,Chicago, pp. 11–55.
Gourinchas, P.O., Obstfeld, M., 2012. Stories of the Twentieth Century for the Twenty-first. American Economic Journal:Macroeconomics 4 (1), 226–265.
Hutchinson, M., Noy, I., Wang, L., 2010. Fiscal and monetary policies and the cost of sudden Stops. Journal of InternationalMoney and Finance 29 (6), 973–987.
Kaminsky, G.L., Reinhart, C.M., 2000. On crises, contagion, and confusion. Journal of International Economics 51 (1), 145–168.Kaminsky, G.L., Reinhart, C.M., Végh, C.A., 2004a. When it rains, it pours: procyclical capital flows and macroeconomic policies.
NBER Macroeconomics Annual 19, 11–82.Kaminsky, G.L., Lyons, R.K., Schmukler, S.L., 2004b. Managers, investors, and crises: mutual fund strategies in emerging markets.
Journal of International Economics 64 (1), 113–134.Kose, A.M., Prasad, E.S., 2010. Emerging Markets: Resilience and Growth amid Global Turmoil. Brookings, Washington, DC.Lane, P.R., Milesi-Ferretti, G.M., 2007. The external wealth of nations mark II: revised and extended estimates of foreign assets
and liabilities, 1970–2004. Journal of International Economics 73 (2), 223–250.Lane, P.R., Milesi-Ferretti, G.M., 2010. The cross-country incidence of the global crisis. IMF Working Paper 10/171, July.Martinez Peria, M.S., Powell, A.A., Vladkova-Hollar, I., 2005. Banking on foreigners: the behavior of International bank claims on
Latin America, 1985–2000. IMF Staff Papers 53 (3), 430–461.Raddatz, C., 2010. When the rivers run dry: liquidity and the use of wholesale funds in the transmission of the U.S. subprime
crisis. World Bank Policy Research Working Paper 5203, February.Raddatz, C., Schmukler, S.L., On the international transmission of shocks: micro-evidence from mutual fund portfolios. Journal
of International Economics, in press.Reinhart, C.M., Reinhart, V.R., 2008. Capital flow bonanzas: an encompassing view of the past and present. In: Frankel, J.,
Giavazzi, F. (Eds.), NBER International Seminar in Macroeconomics 2008. University of Chicago Press, Chicago.Rose, A.K., 2011. International financial integration and crisis intensity. ADBI Working Papers 341.Rose, A.K., Spiegel, M., 2010. Cross-country causes and consequences of the 2008 crisis: international linkages and American
exposure. Pacific Economic Review 15 (3), 340–363.Rose, A.K., Spiegel, M., 2011. Cross-country causes and consequences of the 2008 crisis: an update. European Economic Review
55 (3), 309–324.Rose, A.K., Spiegel, M., Cross-country causes and consequences of the 2008 crisis: early warning. Global Journal of Economics,
in press.Talvi, E., Vegh, C., 2005. Tax Base Variability and procyclical fiscal policy in developing countries. Journal of Development
Economics 78 (1), 156–190.Taylor, J.B., 2009. Getting Off Track: How Government Actions and Interventions Caused, Prolonged, and Worsened the Financial
Crisis. Hoover Institution Press, Stanford, CA.Taylor, J.B., 2010. Getting back on track: macroeconomic policy lessons from the financial crisis. Federal Reserve Bank of St. Louis
Review 92 (3), 165–176.Van Rijckeghem, C., Weder, B., 2001. Sources of contagion: is it finance or trade? Journal of International Economics 54 (2),
293–330.
Please cite this article in press as: Didier, T., et al., How resilient and countercyclical were emergingeconomies during the global financial crisis?, Journal of International Money and Finance (2012),doi:10.1016/j.jimonfin.2012.05.007