Looking for the Cradle of Life Sergio Branciamore DBAG- University of Florence - Italy.

DRIV ING EXPANSION.ENSURING
CONTINUIT Y.M A K I N G S T R O N G
C O M P A N I E S S T R O N G E R .
A N N U A L R E P O R T
2 0 1 3 / 1 4
www.deutsche-beteiligung.de
ISSN
161
9-12
26
De
uts
che
Be
teil
igu
ng
s A
GA
nn
ua
l R
ep
ort
20
13
/14
C O N T E N T SA N N U A L R E P O R T 2 0 13 / 1 4
LONG-TERM PERFORMANCE I
2013/14 HIGHLIGHTS I I
T O O U R S H A R E H O L D E R S 2
LETTER FROM THE BOARD OF MANAGEMENT 2
BOARD OF MANAGEMENT 3
REPORT OF THE SUPERVISORY BOARD 4
CORPORATE GOVERNANCE 10
SHARES 14
O U R P O R T F O L I O 22
5 0 Y E A R S O F D B AG 40
C O M B I N E D M A N AG E M E N T R E P O R T 52
BUSINESS OVERVIEW 54
THE GROUP AND UNDERLYING CONDITIONS 55
BUSINESS REVIEW OF THE GROUP 69
FINANCIAL REVIEW OF
DEUTSCHE BETEIL IGUNGS AG (COMMENTARY BASED
ON THE GERMAN COMMERCIAL CODE – HGB) 94
SIGNIFICANT EVENTS AFTER THE END
OF THE REPORTING PERIOD 100
ADDITIONAL STATUTORY INFORMATION
AND COMMENTARY 101
OPPORTUNITIES AND RISKS 108
REPORT ON EXPECTED DEVELOPMENTS 124
C O N S O L I DAT E D F I N A N C I A L S TAT E M E N T S 130
CONSOLIDATED STATEMENT OF
COMPREHENSIVE INCOME 132
CONSOLIDATED STATEMENT OF CASH FLOWS 133
CONSOLIDATED STATEMENT OF FINANCIAL POSIT ION 134
CONSOLIDATED STATEMENT OF CHANGES IN EQUITY 135
NOTES TO THE CONSOLIDATED FINANCIAL STATEMENTS 136
M I S C E L L A N E O U S I N F O R M AT I O N 196
STATEMENT OF RESPONSIBIL ITY 196
AUDITOR’S REPORT 197
CONTACT 198
IMPRINT 198
TEN-YEAR FINANCIAL SUMMARY I I I
F INANCIAL CALENDAR IV
F I N A N CI A L C A L EN DA R
2 2 J A N UA RY 2 015
Annual press conference 2013/14, Frankfurt / Main
2 2 J A N UA RY 2 015
Analysts’ conference, Frankfurt / Main
11 F E B R UA RY 2 015
Listed Private Equity Day, Zurich
18 /19 F E B R UA RY 2 015 Road Show Great Britain, London/Edinburgh
16 M A R C H 2 015
Report on the first quarter 2014/15, Analysts’ conference call
21 M A R C H 2 015 Börsentag Munich (SdK Stock Forum), Munich
2 4 M A R C H 2 015
Annual Meeting, Frankfurt /Main
2 5 M A R C H 2 015
Dividend payment 2015
14 A P R I L 2 015 Solventis Stock Forum, Frankfurt/Main
15 J U N E 2 015
Report on the second quarter 2014/15, Analysts’ conference call
14 S E P T E M B E R 2 015
Report on the third quarter 2014/15, Analysts’ conference call
I V

D R I V I N G E X PA N S I O N . E N S U R I N G C O N T I N U I T Y. I D R I V I N G E X PA N S I O N . E N S U R I N G C O N T I N U I T Y. I I
LO N G -T ER M P ER F O R M A N CE 2013 /14 H I G H L I G H T S
Net asset value rose after paying a dividend of 1.20 euros in March 2014 to 22.18 euros per share at 31 October 2014. This equates to a gain of 1.82 euros, or a return of 15.8 percent in financial year 2013/14. Thus, we exceeded both the cost of equity and the long-term average: over the past ten-year period, we generated an average return on net asset value per share of 15.3 percent.
More information on the historical return trend on page 88.
R E T U R N O N N E T A S S E T VA L U E P E R S H A R E (%)
60
50
40
30
20
10
0
(10)
(20)
04/05 05/06 06/07 07/08 08/09 09/10 10/11 11/12 12/13 13/14
20.0
36.4
56.2
7.3 12.7
(6.2)
16.811.5
15.8
(17.5)
In financial year 2013/14, the price of DBAG shares rose to 21.83 euros, up from 19.36 euros. Including the dividend of 1.20 euros that we paid per share in March 2014, we delivered a total return to our shareholders of 19.5 percent.Thus, DBAG shares outperformed the S-Dax – the benchmark index for German companies of a comparable size – and the LPX Direct – the benchmark index for directly investing private equity firms. Over a ten-year period, DBAG shares generated an average total return for our shareholders of 16.2 percent annually. That is roughly twice the return delivered by the benchmark indices.
More information on DBAG shares on page 14.
P E R F O R M A N C E O F D B A G S H A R E S A N D B E N C H M A R K I N D I C E S
(1 November 2004 to 31 October 2014, indexed to 1 November 2004 = 100)
450
400
350
300
250
200
150
100
50
DBAG
Dax
S-Dax
LPX Direct
1 Nov. 04 1 Nov. 06 1 Nov. 08 1 Nov. 10 1 Nov.12 1 Nov. 14
The consolidated net income of 47.8 million euros (previous year: 32.3 million euros) reflects profits from attractive divestments to strategic investors, very satisfactory progress on the part of most portfolio companies and higher fee income from investment services to funds.The net result of investment activity reached 54.5 million euros (previous year: 41.0 million euros); fee income from fund management and advisory services totalled 21.7 million euros (previous year: 18.9 million euros).
More information on the consolidated net income on page 75.
C O N S O L I D AT E D N E T I N C O M E (€mn)
120
100
80
60
40
20
0
(20)
(40)
04/05 05/06 06/07 07/08 08/09 09/10 10/11 11/12 12/13 13/14
136.5
(51.1)
82.7
19.6
(16.6)
34.144.5
32.3
47.841.3
D R I V I N G E X PA N S I O N . E N S U R I N G C O N T I N U I T Y. I I I
T EN -Y E A R F I N A N CI A L SU M M A RY
€mn 2004/05 2005/06 2006/07 2007/08 2008/09 2009/10 2010/11 2011/12 2012/13 2013/14
Development of portfolio and value
New investment 24 22 40 14 4 8 9 22 42 20
“Portfolio value” (31 Oct.) 1 197 121 189 127 123 118 84 143 173 153
Number of investments (31 Oct.) 35 32 30 21 19 17 16 18 20 19
Earnings position
EBIT 41.6 89.1 150.8 (60.5) 20.4 36.8 (23.0) 46.2 33.6 48.2
EBT 42.3 90.9 155.6 (55.3) 22.4 37.6 (19.9) 47.0 33.8 48.5
Consolidated net income/(loss) for the year 41.3 82.7 136.5 (51.1) 19.6 34.1 (16.6) 44.5 32.3 47.8
Consolidated retained profit 35.5 57.2 118.2 29.2 52.6 73.1 37.3 70.8 86.7 118.1
Financial position
Cash flows from operating activities (35.6) (4.1) (2.6) 3.0 (3.5) (12.8) 0.9 (9.6) (12.0) (1.4)
Cash flows from investing activities 132.2 169.3 65.4 11.2 28.8 36.3 34.1 (17.8) 18.7 70.8
thereof proceeds from disposals of financial assets 156.5 191.0 106.1 25.7 33.0 44.5 43.6 3.8 60.4 90.8
thereof purchase of financial assets (24.1) (21.7) (40.7) (14.5) (4.3) (8.2) (9.4) (21.6) (41.7) (20.0)
Cash flows from financing activities (57.1) (40.7) (71.4) (57.3) (5.5) (13.7) (19.1) (10.9) (16.4) (16.4)
Change in cash funds 2 39.5 124.0 (9.0) (50.5) 10.6 (70.9) 14.9 (38.7) (9.7) 52.4
Asset position
Non-current assets 201.1 124.6 211.3 147.2 161.2 244.3 228.6 238.7 233.6 243.9
thereof long-term securities 0 0 0 0 14.5 102.9 123.1 83.0 50.5 81.0
Current assets 65.2 195.5 183.0 125.1 127.1 71.8 51.3 59.5 77.1 103.2
thereof cash and short-term securities 40.7 164.7 155.8 105.2 109.5 37.8 32.5 27.8 47.8 69.7
Equity 246.6 289.0 353.6 244.8 256.8 273.9 238.9 266.2 278.4 303.4
Liabilities/provisions 19.7 31.1 40.8 27.4 31.5 42.2 41.0 32.8 32.2 43.7
Total assets 266.3 320.1 394.4 272.3 288.3 316.1 279.9 299.0 310.7 347.1
Key indicators
Return on NAV per share after taxes 3 (%) 18.1 36.4 56.2 (17.5) 7.3 12.7 (6.2) 16.7 11.5 15.8
Equity as a percentage of total assets 92.6 90.3 89.7 89.9 89.1 86.7 85.3 89.0 89.6 87.4
Information on shares 4
Earnings per share (€) 1.79 5.02 9.20 (3.73) 1.44 2.50 (1.22) 3.25 2.36 3.49
NAV per share (€) 14.64 19.07 25.09 17.90 18.77 20.03 17.47 19.46 20.36 22.18
Dividend per share (€; 2013/14: recommended) 0.33 0.50 1.00 0.40 0.40 0.40 0.40 0.40 0.40 0.40
Surplus dividend/bonus per share (€; 2013/14: recommended) 0.33 2.50 2.50 – 0.60 1.00 0.40 0.80 0.80 1.60
Total amount distributed 5 (2013/14: recommended) 11.1 45.5 47.9 5.5 13.7 19.1 10.9 16.4 16.4 27.4
Number of shares (end of FY) 16,837,329 15,153,864 14,403,864 13,676,359 13,676,359 13,676,359 13,676,359 13,676,359 13,676,359 13,676,359
thereof held by the Company 313.367
Share price (€; end of FY) 13.25 17.35 24.10 10.45 15.55 20.79 15.50 19.49 19.36 21.83
Market capitalisation (end of FY) 223.1 262.9 347.1 142.9 212.7 284.3 212.0 266.6 264.8 298.6
Number of employees 50 44 47 48 49 51 53 54 55 56
The table above contains data as originally reported in the respective annual consolidated financial statements. 1 Without interests in shelf companies and companies that are mainly attributable to third parties 2 Cash as well as short- and long-term securities3 Change in net asset value per share relative to opening net asset value per share at beginning of reporting period, less dividends per share4 Partly adjusted; earnings and cash flow per share relative to weighted average number of shares outstanding 5 Relates to respective financial year
C O N S O L I DAT E D N E T I N C O M E reaches
M I L L I O N E U R O S
R E T U R N O N N E T A S S E T VA L U E per share
P E R C E N T
T O TA L R E T U R N to shareholders
P E R C E N T
47.8
15.8
19.5

O U R M I S S I O N
S T A T E M E N T
Stock exchange-listed Deutsche Beteiligungs AG invests
in well-positioned mid-sized companies with potential
for growth.
For many years, we have focused on industrial business
models in selected sectors. With our experience, expertise
and equity, we support our portfolio companies in
implementing their sustainable, value-creating corporate
strategies.
Our entrepreneurial approach to investing has made us a
sought-after investment partner in the German-speaking
world. We have achieved superior performance over
many years – for our portfolio companies as well as for
our shareholders and investors.
A N N U A L R E P O R T 2 0 1 3 / 1 4 1
M E M B E R S O F T H E B OA R D O F M A N AG E M E N T
From left to right:
D R R O L F S C H E F F E L S , T O R S T E N G R E D E (Spokesman), S U S A N N E Z E I D L E R
2 L E T T E R F R O M T H E B O A R D O F M A N A G E M E N T

For Deutsche Beteiligungs AG, 2015 will be a very special year. This autumn, we will be looking back on 50 years of investing in Germany’s “Mittelstand”. Five decades during which we have financed growth through customised equity solutions and have driven change processes. Five decades during which we have backed farsighted entrepreneurs and courageous managers in developing their companies. In other words, five decades during which DBAG has played a leading role in private equity in Germany. We, too, have moved forward over time. With our successful investment activities as a point of departure, we have developed a growing fund business in recent years. The result is that we now create value in two ways: by providing investment services to private equity funds and, as always, by investing in portfolio companies.
DBAG today is one of Germany’s most successful private equity companies, and there are surely a number of reasons for that. One of them is that we have remained true to our investment principles: we invest in strong companies that have growth potential, an excellent market position and seasoned management.
Investing, developing and, finally, realising created value – that is the triad that defines our business. In 2013/14, we exited two long-standing investments, realising the value that had been built over many years. Our “young” portfolio is developing much to our satisfaction: most of our portfolio companies made good progress and very satisfactory value contributions. That is actually what we expect of the companies in which we recently invested. Please allow us to expound here on the three aspects of our business:
To begin with, the realisations. As has so often been the case in the past, we were able to draw the attention of buyers for whom our investments had a strategic value. And that was clearly reflected in the purchase prices. DBAG invested in Homag Group AG in 1997. In 2007, we led
Frankfurt/Main, 20 January 2015
— 1 —
A N N U A L R E P O R T 2 0 1 3 / 1 4 1

the company to an IPO; the proceeds from that alone considerably exceeded the invested capital. In finalising the disinvestment this past summer, we completed a transaction that – measured in absolute terms – was one of the most profitable in DBAG’s history. It provides the basis for the surplus dividend, which we are again recommending – for the ninth time in ten years. In October 2014, we divested another successful investment after 39 years in our portfolio: automotive dealership Dr. Vogler. Once again, the company was sold to a strategic buyer.
As for the development of the portfolio, it encompassed 15 active investments at the end of the period: ten management buyouts and five expansion capital investments. Two figures illustrate how well the companies have performed overall. They increased revenues by an average of nine percent compared with the preceding year. The improvement in their earnings power was even more impressive: an average of twelve percent. This was a key reason for the past financial year’s good valuation result. The recent additions to the portfolio in particular made good on their potential. Eight of the 15 active investments have been in the portfolio for less than two years – representing some 45 percent of the portfolio value. Momentum also came from the stock market: part of the value gain comes from higher valuation multiples.
Finally, the investments. These lay the foundation for positive value contributions in coming years. In 2013/14, we invested 20 million euros from DBAG’s balance sheet. We acquired a stake in a bakery chain and provided further funding to our portfolio companies for their expansion plans. “Unser Heimatbäcker” is one of the ten largest bakery chains in Germany. The company is growing rapidly and is proactively driving change in its market. After “Schülerhilfe” last year, this is the second company whose development is fuelled to a large degree by Germany’s domestic market and consumer demand. Both sectors – tutoring services and bakeries – are generally considered non-cyclical. This represents a positive change to the risk profile of our portfolio, which is also more balanced in terms of size now that we have exited what was our largest investment by far.
The investment team considered many interesting companies in 2013/14, and we would have liked to invest more. Yet one principle remains unchanged: we do not want to invest in as many companies as possible, but in the best companies possible. Additionally, competition has intensified. Strategic investors are expanding their companies through add-on acquisitions. Driven by low interest rates, players such as foundations and family offices are approaching attractive companies. Our response is to continuously improve our processes. Moreover, we have expanded our investment team once again.
— 2 —
2 L E T T E R F R O M T H E B O A R D O F M A N A G E M E N T

We are very pleased with financial year 2013/14. The consolidated net income of 47.8 mil lion euros exceeds our expectations. It represents a return on net asset value of 15.8 percent, nearly doubling our forecast of at least eight percent. 2013/14 is another in a series of successful financial years: over a ten-year period, we increased the net asset value per share by an average of 15.3 percent per year.
In addition to realisation profits and the portfolio companies’ value growth, a significant contributor to consolidated net income was fee income from fund management and advisory services – which increased yet again and is now almost double the amount it was five years ago. Within a decade, it has more than tripled. These developments show the value institutional investors attach to the “Deutsche Beteiligungs AG” brand, its investment team and its wealth of experience. The assets we manage and advise amount to nearly one billion euros – not counting the capital that you, the shareholders, have entrusted to us. This, too, represents a significant increase compared to 2004.
You have profited time and again from our investment activity in the form of sizeable distributions. Our policy is to be able to pay a base dividend even in years when we do not generate special realisation profits. Successful realisations of the kind seen in 2013/14 then make surplus dividends possible. The Supervisory Board and the Board of Management therefore recommend distributing 2.00 euros per share, which includes a surplus dividend of 1.60 euros per share.
We will be celebrating another anniversary this year: December 2015 will mark the 30th anniversary of the initial stock market listing of DBAG shares. Anyone who has held DBAG shares since 1985 and who reinvested the dividends in DBAG will be very pleased about the annual return of some 9.6 percent which DBAG shares delivered. Those who became DBAG shareholders later on were also well rewarded. Over the past ten-year period, DBAG shares returned an average of 16 percent annually, or nearly double the amount of investments in the Dax or S-Dax. This past financial year, DBAG shares delivered a total return of nearly 20 percent.
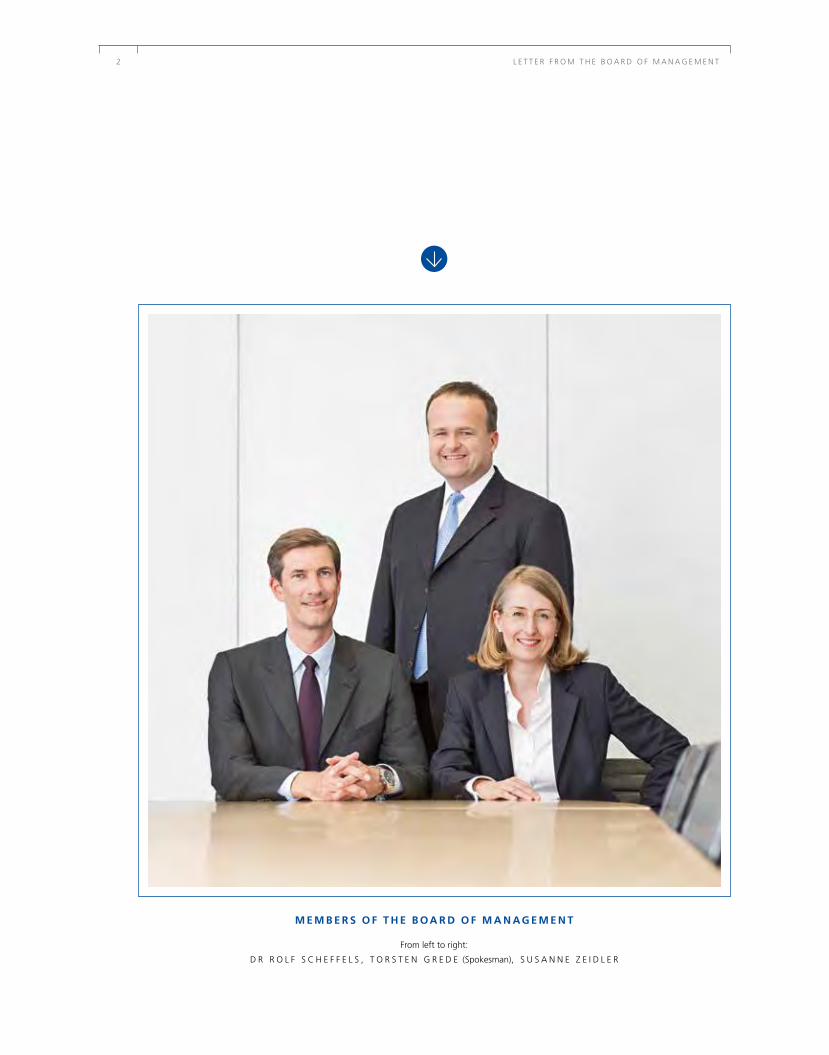
To continue this development, the companies in our portfolio will keep to the course mutually agreed at the outset of our investment. One of the key objectives was often growth. For that reason, the motto of this year’s Annual Report is “Driving expansion, ensuring continuity”. What this means is illustrated by looking at Broetje-Automation, a mechanical
— 3 —
A N N U A L R E P O R T 2 0 1 3 / 1 4 3

M I T G L I E D E R D E S VO R S TA N D S
Von links nach rechts:
D R . R O L F S C H E F F E L S , S U S A N N E Z E I D L E R , T O R S T E N G R E D E (Sprecher)
engineering and plant construction company (page 26). In a magazine, you can retrace 50 years of Deutsche Beteiligungs AG (page 40). Looking back, one thing becomes evident: DBAG has always been committed to Germany’s “Mittelstand”.
That commitment endures. We frequently find our investments in sectors for which the “Mittelstand” is known throughout the world. The investments we agreed at the beginning of the new financial year are prime examples. The three companies have a more than 100-year history: a manufacturer of specialised films and a mechanical engineering com pany can now take advantage of growth opportunities, unfettered by corporate constraints; and a foundry will develop its potential with support from DBAG. All in all, a solid start on the investment side.
What can you expect of DBAG in its anniversary year 2014/15? As always, great dedication on the part of the investment team to augmenting the value of the existing portfolio companies and to investing in new ones. Also as in the past, a steady flow of transparent information – with the stock market as a watchful motivator. And consolidated net income which, on a comparable basis, should slightly exceed that of the previous year – that is, without the effects of the Homag realisation. Disinvestments can rarely be planned in our business, neither the timing, nor the price. For that reason, we have based our one-year forecast on our costing, the expected fee income from investment services to funds, and the valuation contribution of our portfolio. The latter component is the least certain of the three since portfolio companies are not immune to cyclical influences. Distortions or a shift in sentiment in the stock markets can change company valuations quickly and significantly, thereby greatly impacting our annual net income. Both risks have, in our estimation, increased.
We measure the performance of each investment at the end of the holding period, which is not one year, but usually from four to seven years. During that time, we aim to make our portfolio companies more valuable – thereby continuing to create value for you. Our 50 years of success are no reason for us to sit back and relax. Instead, they are a reason – a mandate – to press on, ensuring that the next 50 are equally rewarding.
Torsten Grede Dr Rolf Scheffels Susanne Zeidler
— 4 —
2 L E T T E R F R O M T H E B O A R D O F M A N A G E M E N T

BOA R D O F M A N AG EM EN T
T O R S T E N G R E D E
Spokesman
Strategy and Business Development, Corporate Communication, Com pliance, Investment Business, Investor Relations (fund investors)
D R R O L F S C H E F F E L S
Investment Business, Investment Team Development
S U S A N N E Z E I D L E R
Chief Financial Officer
Finance and Accounting, Legal and Fiscal, Investor Relations (stock market), Investment Controlling, Internal Audit, Personnel, IT and Organisation
Torsten Grede studied business administration in Cologne and St Gallen, following a traineeship in banking. After earning his degree, he started his career in 1990 at Deutsche Beteiligungs AG; he now has more than 20 years of experience in private equity. Torsten Grede was named Senior Vice President in 1995 and was initially appointed to the Board of Management in 2001.
After completing a traineeship as an industrial administrator at Braun AG, Dr Rolf Scheffels studied business administration at the Goethe University in Frankfurt/Main, where he received his degree. His career began in 1992 with the audit firm C&L Deutsche Revision AG, Frankfurt/Main. In 1996, Dr Rolf Scheffels earned his doctorate (Dr. rer. pol.) at the Goethe University. He joined Deutsche Beteiligungs AG in 1997. Dr Rolf Scheffels was named Senior Vice President in 2000 and was initially appointed to the Board of Management in 2004.
Susanne Zeidler studied business administration at the University of Münster. She began her professional career in 1987 with an audit partnership that specialised in midsized companies. She moved into the area of corporate finance at an audit firm in 1990, where she was responsible, until 1999, for valuations of midsized and listed companies operating in various sectors. After becoming a partner in 2000, Susanne Zeidler headed the internal audit review and other back office activities at the audit firm’s largest German office. Beginning in 2005, she built the firm’s activities with foundations and other nonprofit organisations. In 2011, she joined a worldwide fundraising organisation, where she served as director at its international headquarters.
Born 1964. Spokesman of the Board of Management since March 2013; member of the Board of Management since January 2001; appointed until December 2018.
Born 1966. Member of the Board of Management since January 2004; appointed until March 2016.
Born 1961. Member of the Board of Management since November 2012; appointed until October 2020.
A N N U A L R E P O R T 2 0 1 3 / 1 4 3

Posting an excellent consolidated net
income, Deutsche Beteiligungs AG
recorded yet another year of success
in its long history. In 2013/14, our
working relationship with the Board
of Management was again both
effective and trustful.
A N D R E W R I C H A R D S
Chairman of the Supervisory Board
4 R E P O R T O F T H E S U P E R V I S O R Y B O A R D

R EP O RT O F T H E SU P ERV I SO RY BOA R D
In the reporting year, we again consistently and conscientiously discharged the duty of overseeing the managerial activities of the Board of Management required of us by law, the Articles of Association and the rules of procedure. The Board of Management regularly provided the Supervisory Board with comprehensive and prompt information, both in writing and verbally, about the Company’s course of business, its asset, financial and earnings position, the competitive environment and the prospects, as well as the risk management and compliance systems installed at Deutsche Beteiligungs AG. We discussed these issues in depth. Any divergences from the planned course of business were elucidated and substantiated by the Board of Management. The Board of Management also reported on strategic and major operational decisions as well as on the business policies it intends to pursue.
In financial year 2013/14, the Supervisory Board held eight meetings, three of which were telephone conferences. In several instances, the Supervisory Board met without the attendance of the Board of Management.
An integral part of all our Board meetings were detailed reports on current developments in individual portfolio companies. We received comprehensive quarterly reports in writing on those issues from the Board of Management. We were informed promptly and in depth about investments that were not performing as expected. We were also regularly informed about new investments in, and planned realisations from the portfolio.
At our first regular meeting on 28 NOVEMBER 2013, we dealt with the investment progress of the DBAG Expansion Capital Fund. The Board of Management informed us about the preliminary results for the preceding 2012/13 financial year and the potential for a dividend payment. The 2013/14 budget was also presented, which was drawn up based on a new methodology. In the November meeting, we were involved in and contributed to the Corporate Governance Statement (§ 289a of the German Commercial Code – HGB), and submitted the Declaration of Conformity as well as the joint report by the Board of Management and the Supervisory Board on the corporate governance practised at Deutsche Beteiligungs AG.
At our regular meeting on 24 JANUARY 2014, the auditors reported on the results of their audit of the separate financial statements and the consolidated financial statements at 31 October 2013. We adopted the separate financial statements of Deutsche Beteiligungs AG and approved the consolidated financial statements. We passed a joint dividend recommendation and the agenda for the 2014 Annual Meeting. We also discussed issues concerning potential conflicts of interest of Supervisory Board members.
A N N U A L R E P O R T 2 0 1 3 / 1 4 5

At our meeting following the Annual Meeting on 27 MARCH 2014, the Board of Management reported in depth on the market and competitive situation of Deutsche Beteiligungs AG; both fundraising issues and investment opportunities were comprehensively elucidated. We also dealt with the registration of DBAG as an AIF management company in accordance with the German Investment Code (Kapitalanlagegesetzbuch).
In addition to the reports on the portfolio companies and investment projects that are regularly dealt with at every meeting, the topics discussed at our meeting on 12 JUNE 2014 also pertained to the two disposals that were completed in the latter part of the financial year.
In the two telephone conferences on 30 JUNE 2014 and 9 JULY 2014, we were informed in detail about the progress of the negotiations concerning the disinvestment of Homag Group AG, before granting our consent to the sale of this investment.
At our meeting on 11 SEPTEMBER 2014, the Board of Management reported on the status of the compliance system at Deutsche Beteiligungs AG. According to that, there were no breaches in compliance. The Board of Management also reported on the status of the compliance systems at the portfolio companies of DBAG. At this meeting, the Board of Management’s presentations on the Company’s strategic development played a prominent role. We agreed that we again want to review the efficacy of our work practices in financial year 2014/15.
Between meetings, the Board of Management’s spokesman promptly informed the Chairman of the Supervisory Board about significant business issues, after which the complete Supervisory Board was briefed accordingly. In view of its magnitude, the disinvestment of Homag Group AG required our approval. There were no other transactions requiring our consent in financial year 2013/14.
All members of the Supervisory Board attended all of the Board’s meetings this past financial year, except when – as in one instance – there was a conflict of interest regarding an item dealt with on the agenda. The meeting of the Executive Committee was attended by all of its members. The Audit Committee also met in the presence of all members, with one exception.
CO R P O R AT E G OV ER N A N C E
We regularly evaluate the efficacy of our work on the Supervisory Board; we did so most recently in October 2013. We also continually follow the changes in corporate governance practices taking place in Germany. Management’s report on the Company’s corporate governance is also presented on behalf of the Supervisory Board; we adhere to the practice of publishing this report in the Annual Report (pages 10 to 13), and it is also accessible at the Company’s website together with the Corporate Governance Statement. The Board of Management and the Supervisory Board jointly submitted an updated Declaration of Conformity in November 2014 based on the German Corporate Governance Code as amended on 13 May 2013 (§ 161
6 R E P O R T O F T H E S U P E R V I S O R Y B O A R D

German Stock Corporation Act – AktG), which is permanently accessible to any interested party at the Company’s website.
To disseminate its responsibilities and increase efficiency, the Supervisory Board formed an Executive Committee, which also performs the functions of a Nominations Committee, as well as an Audit Committee.
In accordance with the recommendations of the Code, every Supervisory Board member is required to disclose to the Supervisory Board any conflict of interest that may possibly arise. There was one notice of a conflictofinterest issue this past financial year.
W O R K O F T H E E X EC U T I V E CO M M I T T EE
The Executive Committee convened once this past financial year: at its meeting on 21 November 2013, it determined the shortterm performancerelated and the longterm remuneration component for the members of the Board of Management for financial year 2012/13. The Supervisory Board approved the recommendation following an indepth discussion in a telephone conference on 25 November 2013. Since Mr von Hodenberg, in his capacity as a former member of the Board of Management and thereby as a recipient of that performancelinked component, had a personal interest in this decision, he declared that he had a conflict of interest on his own behalf and also pointed to a possible conflict of interest over a decision on the performancelinked component for the other members of Board of Management at that time. He therefore took part neither in the discussion, nor in the vote concerning the performancelinked component for the members of the Board of Management for financial year 2012/13.
The bonus payments for 2013/14 were discussed in a telephone conference at the beginning of the new financial year on 14 November 2014 and recommended to the Supervisory Board. The Supervisory Board approved the recommendation following an indepth discussion in a telephone conference on 18 November 2014. A further meeting in the new financial year (13 January 2015) dealt with Ms Zeidler’s reappointment and her service contract.
W O R K O F T H E AU D I T CO M M I T T EE
In six meetings held during the reporting year, the Audit Committee addressed issues concerning the separate and consolidated financial statements, the halfyearly financial report and the quarterly financial reports, all of which were discussed with the Board of Management prior to their publication. Additionally, the Committee discussed miscellaneous accounting issues, such as the effects of the new accounting standard IFRS 10 on the group of consolidated companies and
A N N U A L R E P O R T 2 0 1 3 / 1 4 7

on the asset, financial and earnings position of the DBAG Group. We monitored the accounting process as well as the effectiveness of the internal control system. From our point of view, there were no grounds for objections to the Company’s current practice.
We reviewed the required independence and objectivity of the Company’s auditors and the additional services the auditors provided. We also discussed the assignment of the audit to the auditors, the determination of the audit’s focal points and audit fees.
We continue to comply in multiple ways with the requirements under §§ 100 (5), 107 (4) German Stock Corporation Act (AktG), which stipulate that at least one independent member of the Supervisory Board or Audit Committee must have expert knowledge of accounting or auditing. In particular the Chairman of the Audit Committee has profound knowledge of and experience in the application of accounting principles and internal control processes.
The Chairmen regularly reported to the Supervisory Board on the work of their committees.
S EPA R AT E A N D CO N S O L I DAT ED F I N A N C I A L S TAT EM EN T S EN D O R S ED
Prior to recommending KPMG AG Wirtschaftsprüfungsgesellschaft (KPMG), Frankfurt/Main, for election as auditors to shareholders at the Annual Meeting, the Supervisory Board requested and received an independency statement from KPMG. Subsequent to the 2014 Annual Meeting, at which our recommendation was adopted, and in my capacity as the Chairman of the Supervisory Board, I commissioned KPMG with the audit. The auditors were required to immediately report all major findings and occurrences to us that may come to light during the audit.
KPMG audited the separate financial statements of Deutsche Beteiligungs AG for financial year 2013/14 and management’s combined report on Deutsche Beteiligungs AG and the Group, including the underlying accounting, and endorsed them with an unqualified certificate. The same applies to the consolidated financial statements for financial year 2013/14. The consolidated financial statements were drawn up in conformity with the International Financial Reporting Standards (IFRS). The auditors confirmed that the consolidated financial statements comply with the IFRS, as adopted by the European Union, and the additional requirements of German commercial law pursuant to § 315a (1) of the German Commercial Code (Handelsgesetzbuch – HGB) and that the consolidated financial statements in their entirety present a true and fair view of the position of the Group as well as the opportunities and risks involved in its future development.
8 R E P O R T O F T H E S U P E R V I S O R Y B O A R D

The Supervisory Board received the audited and certified financial statements of Deutsche Beteiligungs AG for the year ended 31 October 2014 and the combined management report on the state of Deutsche Beteiligungs AG and the Group in due time, reviewed them in conjunction with the report of the Audit Committee Chairman and the auditors, and discussed these documents in detail with the Board of Management in the presence of the auditors. The same applies to the consolidated financial statements as well as to the recommendation for the appropriation of profits.
The auditors explained the findings gathered within the scope of the preaudit at our meeting on 27 November 2014. At our meeting of 20 January 2015 as well as the meeting of the Audit Committee on the same day, the auditors reported on the results of their audit. There were no grounds for objections. The auditors also reported on the services they rendered in addition to performing the audit. The auditors provided detailed answers to our inquiries. After its own indepth review of all documents, the Supervisory Board found no grounds for objection. We approved the results of the audit. On 20 January 2015, we followed the Audit Committee’s recommendation and approved the consolidated financial statements and adopted the separate financial statements of Deutsche Beteiligungs AG.
The Supervisory Board reviewed the Board of Management’s recommendation on the appropriation of the retained profit. After its review, the Supervisory Board agreed to the Board of Management’s recommendation to distribute the sum of 27.4 million euros to shareholders and carry forward the residual retained profit of 64.9 million euros to new account.
Posting an excellent result this past financial year again, Deutsche Beteiligungs AG completed another chapter in its long story of success. We wish to express our greatest appreciation to everyone concerned. Our thanks to the Board of Management and the staff of Deutsche Beteiligungs AG for their outstanding performance and commitment this past financial year.
Frankfurt/Main, 20 January 2015
Andrew Richards Chairman of the Supervisory Board
A N N U A L R E P O R T 2 0 1 3 / 1 4 9

CO R P O R AT E GOV ER N A N CE
Corporate governance refers to the way a company is responsibly managed and controlled. The Supervisory Board and the Board of Management acknowledge and endorse the principles of good corporate governance. We have therefore set out the central values and guiding principles for Deutsche Beteiligungs AG in a Code of Conduct. Our intention is to give every member of our staff a set of fundamental rules and to communicate to our business partners and investors that our dealings are firmly rooted in ethical principles and that we will always interact fairly in good partnership. Our guiding principles also encompass the avoidance of conflicts of interest and acknowledgement of our social responsibility. We act politically neutrally, but support social projects and commit to fair competition.
Our Corporate Governance Statement sets out the basic principles behind the conduct of our business; it is published on the Internet and is accessible there together with this report.
Consistent with the recommendation of the German Corporate Governance Code, the following is a combined report by the Supervisory Board and the Board of Management on the corporate governance practised at Deutsche Beteiligungs AG. Further information can be found in the Corporate Governance Statement and the Report of the Supervisory Board (page 4ff.); that information is an integral part of our combined Corporate Governance Report. We will refer to other sections of this Annual Report on particular issues, if appropriate.
CO M P L I A N C E: EM P LOY EES , T R A N S AC T I O N P RO C ES S , P O R T F O L I O CO M PA N I ES
Compliance by the management and staff with all legal requirements applicable to Deutsche Beteiligungs AG and its subsidiaries and with all internal rules has long been a Company objective and an integral part of our corporate culture. However, as a private equity firm, that objective extends not just to our own Company. DBAG also endorses the installation and ongoing development of compliance schemes at current and future portfolio companies. The compliance system of DBAG therefore consists of three components:
> compliance for DBAG staff
> compliance in transactions
> compliance at portfolio companies
Code of Conduct, Corporate Governance Statement and Corporate Governance Report www.deutsche-beteiligung.de/corporate-governance
1 0 C O R P O R AT E G O V E R N A N C E

A compliance manager oversees adherence by DBAG STAFF to the Code of Conduct and the rules set out in the compliance guideline. He is independent in his role and reports directly to the Spokesman of the Board of Management. Practical effects and changes over past practice have occurred, for example, in the acceptance of invitations and gifts.
DBAG acts as a responsible investor. Compliance aspects have therefore also been integrated into the TRANSACTION PROCESS, specifically in the due diligence process and in purchase agreements. An examination of compliance issues is required as an integral part of every due diligence process to ensure that potential portfolio companies also fulfil DBAG’s values. The basis for this is a questionnaire which, depending on the situation, can be integrated into the due diligence process in collaboration with the legal consultant for the transaction or with the assistance of a specialised compliance adviser, who may be commissioned additionally, if required. To minimise the liability risk for DBAG in connection with compliance issues, warranty clauses to that effect will be included in every purchase agreement for a portfolio company.
DBAG employees who hold offices on a supervisory board or in an advisory council at a PORTFOLIO COMPANY or act on behalf of a shareowner of a portfolio company are required to firmly endorse the introduction or ongoing development of a compliance system within the portfolio company. The “DBAG Compliance Standard for Portfolio Companies” serves as guidance.
CO M P O S I T I O N O F T H E SU P E RV I S O RY BOA R D: O P ER A B I L I T Y I S K E Y O B J EC T I V E
The German Corporate Governance Code recommends that the Supervisory Board specify concrete objectives regarding its composition and report on these and on their implementation.
The key objective is the Supervisory Board’s operability; this objective is best addressed when the majority of its members are independent and not exposed to conflicts of interest and when its members are experienced in the multifaceted operations of DBAG and have expert knowledge of applicable accounting principles. The Supervisory Board is also of the opinion that the majority – or four – of its members should be independent, and the Chairman of the Supervisory Board should be one of them.
The current composition of the Supervisory Board reflects this objective. A further objective of more appropriately considering women in the Supervisory Board’s composition has not yet been reached. Achieving that objective will be the duty of the Nominations Committee when preparing for the next elections to the Supervisory Board. The Supervisory Board will stand for reelection at the 2016 Annual Meeting.
A N N U A L R E P O R T 2 0 1 3 / 1 4 1 1

The members of the Supervisory Board do not have business or personal relationships to the Company or its boards, or to a controlling shareholder or a company with which that shareholder is affiliated, which could constitute a significant and not merely temporary conflict of interest. Should, contrary to expectations, conflicts of interest arise in individual instances, these are disclosed and dealt with appropriately by the Supervisory Board. The members of the Supervisory Board bring with them a wide spectrum of professional and personal experience, including management responsibility abroad or in international companies in Germany. The age limit of 70 means that the Company can benefit as much as possible from these skills on the one hand; on the other hand, it is conducive to introducing changes in the Board’s composition.
I N D EP EN D EN C E O F CO R P O R AT E BO D I ES : N O CO N FL I C T S O F I N T ER ES T
Conflicts of interest on the part of members of the Board of Management and the Supervisory Board requiring immediate disclosure to the Supervisory Board did not come to our attention.
P R I N C I P L E O F EQ UA L T R E AT M EN T: T I M ELY I N F O R M AT I O N TO A L L I N T ER ES T ED PA R T I ES
The principle of simultaneously directing information to all interested parties ranks high in our communication policy. All major reports, announcements and presentations are accessible on the Internet synchronously with the respective event. The key presentations we prepare for meetings with investors are also available on our website. Any interested individual can take note of the dates and locations of roadshows and investors’ conferences that we attend.
Our complete Annual Meeting is webcast live on the Internet. Shareholders may elect to exercise their voting rights personally or through a proxy of their choice or through a proxy appointed by the Company who is bound by their directives. Postal voting is also possible. All documents and information on the Annual Meeting are accessible in German and in English on our website.
R EM U N E R AT I O N O F T H E BOA R D O F M A N AG EM EN T: L I N K E D TO CO R P O R AT E P ER F O R M A N C E
The remuneration paid to the Board of Management is composed of fixed and performancerelated components, most of which have a longterm incentive. We issue an individualised statement of emoluments paid to the members of the Board of Management. Shareholders at the 2011 Annual Meeting approved the remuneration scheme with a vote of approximately 92 percent.
Since the beginning of financial year 2013/14, the remuneration paid to Supervisory Board members is solely composed of a fixed fee.
Details on the remuneration for the members of the Board of Management and the Supervisory Board page 101
1 2 C O R P O R AT E G O V E R N A N C E

S T R I C T RU L ES O N S H A R E OW N ER S H I P
Apart from participating in the employee stock ownership plan once a year (see page 91), members of the staff and the corporate bodies may only purchase shares in Deutsche Beteiligungs AG within a limited frame. Shares may only be purchased and sold during specified periods of time. These periods largely begin subsequent to publication of the Annual Report and interim reports and to the Annual Meeting. They are announced on the website of Deutsche Beteiligungs AG.
Based on the nature of the business operations of Deutsche Beteiligungs AG, there are further rules that apply to trading in securities for DBAG staff. Irrespective of the trading restrictions for shares in Deutsche Beteiligungs AG, it is not permitted for members of the staff – or for members of the corporate bodies – to deal in shares of portfolio companies of Deutsche Beteiligungs AG, or of companies undergoing the due diligence process or whose portfolio contains companies in which Deutsche Beteiligungs AG is considering an investment.
R E P O R TA B L E S EC U R I T I ES T R A N S AC T I O N S (“D I R EC TO R S’ D E A L I N G S”)
The members of the Board of Management and the Supervisory Board of DBAG as well as related parties are required to report transactions in DBAG shares (§ 15a WpHG (German Securities Trading Act)).
Reporting individualCorporate body
Date of transaction Transaction
Number of shares
Price €
Susanne Zeidler Board of Management 29 Sept. 2014 Purchase 1,000 21.50
The members of the Board of Management held a total of 32,613 nopar value shares as at 31 October 2014, or less than one percent of the subscribed capital of Deutsche Beteiligungs AG.
The members of the Supervisory Board held a total of 33,000 nopar value shares as at 31 October 2014, or less than one percent of the subscribed capital of Deutsche Beteiligungs AG.
D EC L A R AT I O N O F CO N F O R M I T Y P U R SUA N T TO S EC T I O N 161 O F T H E G E R M A N S TO C K CO R P O R AT I O N AC T ( A K T I EN G ES E T Z – A K TG)
The Board of Management and the Supervisory Board declare that, since issuance of the last Declaration of Conformity, Deutsche Beteiligungs AG has complied with the recommendations of the “German Corporate Governance Code” as amended on 13 May 2013 in their entirety and will continue to do so. We have also followed all of the suggestions in the Code and will also follow them in the future.
Frankfurt/Main, November 2014
Deutsche Beteiligungs AG The Board of Management Supervisory Board
A N N U A L R E P O R T 2 0 1 3 / 1 4 1 3

SH A R ES
C A P I TA L M A R K E T CO M M U N I C AT I O N
We foster an open ongoing dialogue with private and institutional investors and with financial analysts. In the past financial year, we met with numerous institutional investors in Germany and other major European financial centres. We also presented DBAG to private investors at two events. In addition, we make use of the customary electronic communication channels.
A key objective of our investor relations communication is to achieve a fair valuation of our shares. Our efforts to promote trading in DBAG shares also serve that purpose, since the pricesetting process is more efficient for liquid stocks. Frequently, the difference between the share price and net asset value per share is used when assessing private equity companies. A gain in net asset value per share is considered an indicator of the value growth that companies create for their shareholders with their own portfolio. Dividends are also considered, since distribution policies can vary greatly from company to company. One of the particular strengths of our business model, moreover, is that we additionally earn substantial fee income from management and advisory services to funds. Our efforts are focused on having this unique aspect of our business model adequately taken into account when DBAG shares are assessed.
SH A R E P ER F O R M A N CE A N D A N A LYS T S’ R ECO M M EN DAT I O N S
N E T A S S E T VA LU E P ER S H A R E: G A I N O F 15 . 8 P E RC EN T I N F I N A N C I A L Y E A R
In financial year 2013/14, we again successfully created value for our shareholders: net asset value per share increased from 19.16 euros (after a dividend payment of 1.20 euros per share) at the beginning of the financial year to 22.18 euros, a gain of 3.02 euros or 15.8 percent.
Maintaining close relations with our shareholders and investors remains a priority. For information on our current investor relations activities, www.deutsche-beteiligung.de/investor-relations/
1 4 S H A R E S

1 Net asset value per share at a (quarterly) reporting date relative to the value at the preceding (quarterly) reporting date. In the event that a dividend was paid in a quarter, that amount is added to the net asset value per share at the reporting date.
Very satisfactory returns have also been delivered to shareholders over more extended periods of time: on 1 November 2004, net asset value per share was 12.54 euros. The base and surplus dividends that have been paid since then total 13.49 euros per share. Adding these dividend payments to the net asset value of 22.18 euros per share at the current reporting date results in an increase of 23.13 euros or about 235 percent on the initial amount ten years ago.1 This corresponds to an average annual return of 12.9 percent.
DBAG shares, including reinvested dividends
DBAG net asset value per share, including dividends (“total return”)
Dax, indexed
LPX Direct TR, indexed
SDax, indexed
SHARE PERFORMANCE AND NET ASSET VALUE PER SHARE
(1 November 2004 – 31 October 2014, total return, indexed to 1 November 2004 = 100)
500
450
400
350
300
250
200
150
100
50
01 Nov. 2004 1 Nov. 2006 1 Nov. 2008 1 Nov. 2010 1 Nov. 2012 1 Nov. 2014
The significant rise in net asset value per share this past financial year contributed towards the positive price movement of DBAG shares. In financial year 2013/14, they largely traded within a narrow band around the net asset value per share. Initially trading at a discount to NAV of up to five percent at the beginning of the financial year, they were quoted at a premium of, at times, up to twelve percent following the announcement of the preliminary results for 2012/13 and the dividend recommendation. As in previous years, after the dividend payment the share price fell to below net asset value per share. Towards the end of the financial year, prices again closely reflected net asset value. This distinguishes DBAG from other private equity firms: the stocks of 16 of the 23 listed private equity companies in Europe that also hold direct investments trade at discounts of more than ten percent, another three at discounts of between five and ten percent.
A N N U A L R E P O R T 2 0 1 3 / 1 4 1 5

DIFFERENCE BETWEEN SHARE PRICE AND NET ASSET VALUE PER SHARE
(1 November 2013 to 31 October 2014; %)
15
10
5
0
(5)
(10)1 Nov. 2013 1 Feb. 2014 1 March 2014 1 Aug. 2014 1 Nov. 2014
R ES E A RC H : H O L D R ECO M M EN DAT I O N S C U R R EN T LY P R ED O M I N AT E
Analysts frequently also consider the difference between the current share price and the net asset value per share in their opinions. In view of the market’s continued very favourable – from analysts’ perspective – assessment of our shares on a sector comparison, hold recommendations currently predominate. As previously mentioned, we want to call more attention to the role that fee income for investment services to funds plays for the performance generated by DBAG.
Analysts’ recommendations are regularly documented on our website in the section “Investor Relations/Research” as soon as they come to our attention. The table below presents analysts’ ratings at the beginning of financial year 2014/15. DBAG shares are also tracked by other analysts who exclusively assess listed private equity firms and comparable companies.
ANALYSTS’ RATINGS FOR DEUTSCHE BETEIL IGUNGS AG
ODDO SEYDLER BANK November 2014 “Hold”
Edison Investment Research September 2014 –
HSBC Trinkaus July 2014 “Neutral”
J.P. Morgan Cazenove September 2014 “Underweight”
Landesbank BadenWürttemberg December 2014 “Hold”
Solventis Wertpapierhandelsbank March 2014 “Buy”
Warburg Research (M.M.Warburg) November 2014 “Hold”
1 6 S H A R E S

On 31 October 2014, LPX Direct consisted of 30 constituents with a market capitalisation of 46.9 billion euros. DBAG shares are the only German component in the index, with a weighting of 0.64 percent.
SH A R E P R I CE M OV EM EN T A N D L I Q U I D I T Y
S H A R E P R I C E C L E A R LY O U T P E R F O R M ED BEN C H M A R K I N D I C ES
In financial year 2013/14, DBAG shares clearly outpaced key benchmark indices. Driven by a strong trend at the beginning of the financial year, they reached their peak price of 22.82 euros in Xetra trading in January 2014 and then largely moved sideways. Following the Annual Meeting, the share price declined, as has often been the case with our shares. The year’s low of 18.50 euros was reached in midApril, from which the shares quickly rebounded. After that, DBAG shares benefitted from the announced Homag realisation and fluctuated only within a narrow range of between 21 euros and 22 euros in a highly volatile market. At the end of the financial year, DBAG shares closed at 21.83 euros in Xetra trading.
DBAG
Dax
SDax
LPX Direct
PERFORMANCE OF DBAG PORTFOLIO OVER
ONE, F IVE AND TEN YEARS
(Initial investment of 10,000 euros on 1 November of the years 2013, 2009 and 2004; €)
1 year
5 years
10 years
44,984
17,484
22,597
23,244
11,952
18,964
21,246
19,606
17,174
10,852
9,998
10,324
A N N U A L R E P O R T 2 0 1 3 / 1 4 1 7

In March 2014, a dividend of 0.40 euros per share and a surplus dividend of 0.80 euros per share were paid for financial year 2012/13, a total of 16.4 million euros. This corresponds to a dividend yield of 6.6 percent based on the net asset value per share at the outset of the financial year (less the dividend paid for the previous year), or 6.2 percent measured by the opening share price at the beginning of the year. The share price movement and dividend payment result in a total return of 19.5 percent for DBAG shareholders this financial year. DBAG shares thus outperformed major benchmark indices. Over this period, the Dax merely gained 3.2 percent, the SDax, in net terms, remained unchanged and the LPX Direct, an index of other private equity stocks, grew by 8.5 percent. Over longer periods of time, an investment in DBAG shares has also – in part significantly – outperformed investments in the LPX Direct, or the Dax and SDax.
S H A R E L I Q U I D I T Y: T R A D I N G VO LU M E AT H I G H ES T L E V EL I N F I V E Y E A R S
One particularly gratifying aspect is that the price movement of DBAG shares was accompanied by significantly improved share liquidity. At 7.2 million shares, compared with 6.1 million shares in the previous year, trading volume on German stock exchanges reached its highest level since the financial market crisis in 2008. This is all the more noteworthy since overthecounter trading clearly gained in importance during the same period. The Bloomberg Information System identified another 2.4 million DBAG shares traded directly between buyers and sellers in financial year 2013/14. That means that almost one quarter of trading in DBAG shares took place over the counter. Five years ago, this platform was hardly ever used, whereas in 2012/13, OTC transactions accounted for almost 29 percent.
Apart from the turnover peak that is frequently observed in March, the month in which the Annual Meeting is held, monthly turnovers in DBAG shares were balanced more equally in 2013/14 than in the preceding year. Consistent marketability is an important feature for many institutional investors in assessing the quality of stocks. An average of 28,741 shares (previous year: 24,155) were traded daily on German stock exchanges. Some 72 percent of the turnover (previous year: 76 percent) was Xetratraded. Relative to the freefloat market capitalisation, shares in float ownership had a turnover rate of 1.00 (2012/13: 0.90).2
2 Stock exchange turnover and OTC turnover, calculated with a freefloat proportion of 70.0 percent
1 8 S H A R E S

Overview of dividend policy – management report: objectives and strategy, page 61
R ECO M M EN D E D A P P RO P R I AT I O N O F P RO F I T D I V I D EN D P O L I C Y U N C H A N G ED: SU R P LU S D I V I D EN D F O L LOW I N G SU CC ES S FU L H O M AG R E A L I S AT I O N
One of our major financial objectives is to have the shareholders of Deutsche Beteiligungs AG participate in the Company’s performance through regular dividends. In pursuit of that objective, our dividend policy has remained unchanged for many years. It consists of two components: a base dividend and a surplus distribution which is disbursed in instances of particularly high realisation proceeds and sufficient liquidity. That policy will again be maintained for financial year 2013/14.
In accordance with the legal framework in Germany, the separate financial statements of Deutsche Beteiligungs AG drawn up in conformity with the German Commercial Code (Handelsgesetzbuch – HGB) are decisive in determining DBAG’s ability to pay dividends. The HGBformatted annual profit is largely based on realised disposals. Apart from permanent value impairment, unrealised valuation movements are not considered in HGB accounting.
Following the profitable realisation of the investment in Homag, the base dividend is to remain unchanged at 0.40 euros per share. In addition, a surplus dividend of 1.60 euros is to be distributed to shareholders. In total, the Board of Management and the Supervisory Board will therefore recommend paying a dividend of 2.00 euros per share, or 27.4 million euros, to shareholders at the Annual Meeting. This equates to a dividend yield relative to net asset value per share at the outset of the financial year (less dividends paid for the previous year) of 10.4 percent. The average dividend yield for the past ten financial years – the period for which the present dividend policy has been in effect – is 9.3 percent.
A N N U A L R E P O R T 2 0 1 3 / 1 4 1 9

SH A R EH O L D ER P RO F I L E
Since the conversion to registered shares on 1 July 2013, we have more precise information available on the structure of our shareholder base. That puts us in a position to communicate with our shareholders specifically and directly. We want to expand on this in the future, in particular by using electronic means. At 20 October 2014, more than 11,400 private shareholders were invested in Deutsche Beteiligungs AG, holding approximately 42.9 percent of the shares at that date. Approximately one quarter of DBAG shares were held by institutional investors. Since most institutional investors – both German and international – are not listed directly in share registers, but through nominee shareholders (banks, brokerages), we obtain further information on our shareholder profile through disclosures several times each year. According to the voting rights notifications we have received, 69.96 percent of DBAG shares are in freefloat ownership, as defined by Deutsche Börse.
Private shareholders Germany
Private shareholders international
Rossmann Beteiligungs GmbH
Anpora Patrimonio
Institutional investors Germany
Institutional investors Europe
Institutional investors USA
Other
SHAREHOLDER PROFILE AS AT 31 OCTOBER 2014
%
2.5
4.3
41.0
12.0
8.3
5.0
25.0 1.9
2 0 S H A R E S

SHARE PROFILE
WKN/ISIN A1TNUT/DE000A1TNUT7
Symbol DBAGn (Reuters)/DBAN (Bloomberg)
Listings Frankfurt (Xetra and trading floor), BerlinBremen, Dusseldorf, Hamburg, Hanover, Munich, Stuttgart
Market segment Prime Standard
Index affiliation (selection)
SDax (rank 40 1); Classic All Share; CDax; Prime All Share; Deutsche Börse sector indices: DAXsector All Financial Services, DAXsubsector Private Equity & Venture Capital, LPX Direct, LPX Europe, LPX50; Stoxx Private Equity 20
Designated sponsors ODDO SEYDLER BANK AG, M.M.Warburg & CO (AG & Co.) KGaA
Share capital 48,533,334.20 euros
Number of shares issued 13,676,359
thereof outstanding 13,676,359
First traded 19 December 1985
1 At 31 October 2014, measured by market capitalisation (liquidity measure ranking: 38)
SHARE DATA
2013/14 2012/13 2011/12
Closing rate 1 € 21.83 19.36 19.49
Financial year high 1 € 22.82 21.93 20.21
Financial year low 1 € 18.50 17.27 14.01
Financial year average rate 1 € 21.05 19.25 16.57
Annual performance 2 % 19.5 7.6 33.3
Market capitalisation 1,3 €mn 298.6 264.8 266.5
thereof in free float 4 €mn 208.9 180.6 186.3
Average daily trading value 5 €mn 0.608 0.476 0.242
Dividend per share 6 € 0.40 0.40 0.40
Surplus dividend per share 6 € 1.60 0.80 0.80
Distribution sum 6 €mn 27.4 16.4 16.4
Dividend yield 7 % 10.4 6.6 7.2
Earnings per share € 3.49 2.36 3.25
NAV per share 3 € 22.18 20.36 19.46
Price/NAV per share 3 0.98 0.95 1.00
1 Xetra closing rate2 Adjusted for dividends 3 At end of period4 As defined by Deutsche Börse AG5 According to Deutsche Börse AG data 6 2013/14 recommended7 Relative to NAV per share at start of financial year (less dividend paid for previous year)
www.dirk.org
www.lpeq.com
DBAG is a member of:
www.dai.de
A N N U A L R E P O R T 2 0 1 3 / 1 4 2 1

2 2 O U R P O R T F O L I O
O U RP O R T F O L I O

A N N U A L R E P O R T 2 0 1 3 / 1 4 2 3
VA L UAT I O N
7.3T I M E S E B I T D A
Our portfolio companies’ valuation is based on 7.3 times their earnings on average, or to be more precise, 7.3 times their expected EBITDA for 2014 (or their financial year ending in 2014). Two companies were not valuated with the multiples method due to their strong growth. The remaining 13 companies were included in the calculation for the average figure weighted by their share of the portfolio value.
D E B T
2.4T I M E S E B I T D A
Our portfolio companies have debts amounting to less than 2.4 times their EBITDA on average. Two companies with no net liabilities were not considered in the calculation. The remaining 13 companies were included in the calculation for the average figure weighted by their share of the portfolio value. The calculation is based on the companies’ expected EBITDA and their net debt for 2014 (or their financial year ending in 2014).
R E V E N U E S
9.3P E R C E N T G R O W T H
The 14 companies that were part of our portfolio throughout the financial year increased their revenues by 9.3 percent. This was calculated by comparing the companies’ expected revenues for 2014 (or their financial year ending in 2014) with revenues generated in 2013. The respective growth rate was weighted by the company’s share in the value of our portfolio. This increase is predominantly due to organic growth.
E A R N I N G S
12.1P E R C E N T G R O W T H
The companies in the portfolio improved their earnings by 12.1 percent on average within one year. The indicator used is EBITDA (earnings before interest, tax, depreciation and amortisation) on tangible and intangible fixed assets. This was calculated by comparing the companies’ expected EBITDA for 2014 (or their financial year ending in 2014) with their EBITDA in 2013. The 14 companies that were in our portfolio throughout the financial year were included in the (weighted) calculation.
OU
R P
OR
TF
OL
IO

2 4 O U R P O R T F O L I O
DBAG offers the capital market shares that grant interest in a portfolio with currently 15 investments. We provide tailored equity solutions for the managers and partners of our portfolio companies. They can count on us in two ways: on the one hand, we give them scope to implement their business ideas and concepts that create value in the long term; on the other, thanks to our industry expertise and experience, we are sought after as a partner for supporting growth strategies and change processes. Just as the motto of this Annual Report says: Driving expansion. Ensuring continuity.
But what exactly does that mean? Why not take a look at our portfolio. For example, Broetje-Automation: the manufacturer of machinery and plants for aircraft assembly has boosted its expansion by acquiring two companies (see page 26). Stephan Machinery is using additional equity to expand its range of machines for the food industry and establishing an international service and distribution network (see page 38). Finally “Unser Heimatbäcker“: the company that we added to our portfolio in the 2013/14 financial year is continuing its course with DBAG as a partner to consolidate its market and expand its position (see page 39).
»
O U R P O R T F O L I O
CO M PA N I E S A R E G R O W I N G
A N D B ECO M I N G
M O R E P R O F I TA B L E .
«
In the past financial year, our portfolio companies have developed well overall, as their average increase in revenues and earnings in 2014 shows. Our portfolio investments are growing and becoming more profitable. They are improving their strategic position in the market to secure existing jobs and create new ones. Their average growth in revenues and earnings far exceeds general economic trends. That shows what great potential the companies that our investment team has identified and reviewed. The 23 members of this team together combine more than 200 years of experience from investments in mid-sized German companies. We will use this experience to continue supporting our portfolio companies.
O U R P O R T F O L I O
Stephan Machinery is one of the companies in the portfolio that make
classical industrial goods and sell them worldwide.
The bakery chain operates regionally: "Unser Heimatbäcker" is the market leader
in northeast Germany with more than 500 outlets.
15active
investments

A N N U A L R E P O R T 2 0 1 3 / 1 4 2 5
Company Revenues 2014 ¤mn Employees Core business
Broetje-Automation GmbH, Wiefelstede (Germany)
89(FY 2013/141) 550
Developer and manufacturer of machines and plants used to automate the assembly of aircraft for customers worldwide
Clyde Bergemann Group, Wesel (Germany) / Glasgow (UK) / Delaware (USA)
545(US$, FY 2013/14) 1,800
Developer and manufacturer of components for power plants on three continents as well as global service business
DNS:NET Internet Service GmbH, Berlin (Germany) 101 30
Telecommunications and IT services based on high-quality fibre-optic infrastructure in Berlin and Brandenburg
FDG S.A.,Orly (France) 1111 760
Services for supermarkets in France and other neighbouring countries
Formel D GmbH, Troisdorf (Germany) 1571 4,500 Services for car manufacturers and their suppliers worldwide
Grohmann GmbH, Prüm (Germany) 951 790
Developer and manufacturer of plants for industrial automation worldwide
Heytex Bramsche GmbH, Bramsche (Germany) 751 305
Manufacturer of textile print media and technical textiles for customers worldwide
Inexio KGaA, Saarlouis (Germany)
34(FY 2013/141) 170
Telecommunications and IT services based on high-quality optic-fibre infrastructure in Southwest Germany
JCK KG, Quakenbrück (Germany) 5751 1,050 Textile retail business, mainly for discounters in Germany
Plant Systems & Services PSS GmbH, Bochum (Germany) 281 190
Industrial services for the energy and process industries in Germany and neighbouring countries
Romaco GmbH, Karlsruhe (Germany)
113(FY 2013/141) 450
Developer and manufacturer of machines and plants for packaging technology serving customers worldwide
Schülerhilfe (ZGS Bildungs-GmbH), Gelsenkirchen (Germany) 521 350 Provider of education and tutoring services in Germany
Spheros GmbH, Gilching (Germany) 1971 770
Developer and manufacturer of air conditioning units, heating systems, water pumps and roof hatches for buses with production facilities on three continents
Stephan Machinery GmbH (ProXES), Hameln (Germany) 811 180
Developer and manufacturer of machines and processing lines for manufacturing liquid and semi-liquid food products
Unser Heimatbäcker GmbH, Pasewalk (Germany) 1071 2,300 Bakery chain in northeast Germany
1 Preliminary / expected
The 15 companies in the table make up the active portfolio of Deutsche Beteiligungs AG as at the balance sheet date of 31 October 2014. In addition, the portfolio comprises investments in older international buyout funds with an investment period that expired more than five years ago, as well as a minor investment from an earlier disposal. More
information on the current portfolio can be found online at www.deutsche-beteiligung.de/portfolio.
The eleven largest investments, accounting for around 81 percent of the portfolio value, are presented on the following pages.
OU
R P
OR
TF
OL
IO
2 6 O U R P O R T F O L I O
BROETJE-AUTOMATION GMBH
» M O R E T H A N
€ 200mnI N P R O F I TA B L E R E V E N U E S«
I S O U R S T R AT E G I C G O A L – D O U B L I N G T H E
S TAT U S Q U O
BROETJE-AUTOMATION IS EXPANDING. ITS PLANS FOR GROWTH ARE BECOMING A REALITY.
HOW A MID-SIZED COMPANY IS GETTING STRONGER.

A N N U A L R E P O R T 2 0 1 3 / 1 4 2 7
IN F IGURES
BROETJE-AUTOMATION
“That’s precision craftsmanship.” Really? Looking up at the vast machines, almost 15 metres high, in the production hall in Wiefelstede in Lower Saxony, the description doesn’t seem to fit. And yet it captures the essence of Broetje-Automation’s business. After all, the robots that rivet the individual parts of an aircraft fuselage work with a tolerance of just 0.3 millimetres, a little more than the diameter of a human hair. Precision mechanics in its highest form. They perform minute operations on large components – on fuselage shells, tailplanes and wings. Again and again, always in the same high quality. An aircraft expands by around half a metre when it flies at high altitudes with low air pressure. Despite this, it is held together by several hundred thousand rivets – thanks in part to the precise work of machinery and plants made by Broetje-Automation.
The company has set itself the goal of developing and building the most effective production plants in the world for the aerospace industry. In this way, it helps its customers to optimise their production processes and give them a competitive edge. Today, 35 years after its foundation, Broetje-Automation (BA) is the uncontested world market leader in the development and production of fully automated riveting plants for the assembly of aircraft, in other words airplanes and helicopters.
However, riveting machines are just one part of the process chain in aircraft manufacturing. Other connection technologies are used, too, because modern technical fibres such as carbon fibre composites (CFK) have different processing and riveting requirements compared to classical metal structures. BA has developed automation solutions for all these technologies. The mid-sized company learns something new with every machine it installs, because every customer has its own production process. Based on this, BA has developed the capability to plan and construct complete turnkey production lines with both its own machines and third-party products. The company claims to be an expert for efficient production processes in its target industries, and with good reason.
MORE INTERNATIONAL, BIGGER, MORE
TECHNOLOGIES
The company now plans to build on these strengths and grow. It wants to enter new markets and offer new technologies – to hone its portfolio to perfection. Over the next three years, it intends to more than double its revenues. “200 million euros” is the target for 2017. This would make Broetje-Automation the leading provider in the global market for production solutions in the aircraft industry.
“We have to develop a systemic dimension, because our customers’ wishes are growing more diverse,” Bernd Schröder, one of the company’s two Managing Directors, defines the sales target. “Only if we grow can we broaden our scope both internationally and technologically to better capture the opportunities in the aerospace industry.” (see “Products for a growing market”, page 28.) Aircraft manufacturers are stepping up their monthly construction rates, and production processes are transforming. These changes trigger investments, from which BA aims to benefit.
It helps that the company is part of its new owners’ core business. Before 2012, BA was just a three-percent entity in the three-and-a-half billion revenue pool of a family-owned corporation. “Investment decisions can take a little
BA operates worldwide with subsidiaries
in the US and China as well as several
sales and service centres in America, Asia
and Europe. In the 2013/14 financial year
(30 September), the company generated
more than 90 million euros in revenues
with 550 employees, including 384 at its
two German plants in Wiefelstede and
Jaderberg. Its latest acquisition has added
revenues of around 40 million euros and
120 employees.
OU
R P
OR
TF
OL
IO

2 8 O U R P O R T F O L I O
PRODUCTS FOR A
GROWING MARKET
Anyone who reads the daily reports about ailing airlines and cost pressure in the aerospace industry may find the forecasts hard to believe: the aircraft industry is growing and has major plans. The number of passenger airplanes will double in the next 20 years from around 17,000 in 2014 to more than 34,000 in 2033. Because most machines currently in operation will have to be renewed by then, 30,000 jets will have to be produced. The world is bigger than Europe: the aspiring middle classes in emerging countries have money and want to travel.
In future, they won’t only be sitting in air-planes made by Airbus or Boeing in Euro-pean or American factories. Established manufacturers have long been making at least parts of aircrafts outside their domestic markets, in the case of Airbus in China even complete machines. What’s more, China and Russia as well as India have their own growing aircraft industries. Building air-craft is also a question of prestige. Broetje-Automation aims to equip these plants and has already fulfilled its first orders.
N E W A I R C R A F T I N 2 0 Y E A R S
30,000
longer, and sometimes less attention is paid to smaller units given the priorities of larger ones,” recalls Ingo Körner, Co-Managing Director alongside Bernd Schröder. The two colleagues at the helm of BA have been planning to expand for years, in this case through organic growth and acquisitions.
“WE HAVE BECOME ENTREPRENEURS.“
“Investments that boost the company’s value are particularly encouraged by financial investors – that’s something else we like about DBAG,” emphasises Schröder, and mentions in particular support for M&A processes.
So far, BA has made four acquisitions with the partici-pation of DBAG. Immediately after changing partners, it purchased a company in Toulouse, right on the doorstep of the headquarters of a key account. This enabled BA to expand its position in the strategically important French market. The acquisition of a small company specialised in optical sensors formed the basis for a new product range, which served to accelerate the riveting process.
The portfolio of a machine construction company in spring 2014 provided BA with know-how and patents to expand its own technology base. To this end, the company established a subsidiary, BA Composites, to develop and produce machines for processing fibre composite parts – in other words, machines to process the same material that is used increasingly often in new aircraft types. BA also sees great potential in the automotive industry. It has already developed a first machine, the result of proprietary research and development, to which it has now allocated a growing budget.
The company’s most recent acquisition was considerably larger: at the end of 2014, Broetje-Automation took over the aircraft assembly technology section of Dürr machine and plant engineering group. This is a decisive step for BA on its way to becoming a full-range supplier. The company is also considerably closer to achieving its 200-million-euro sales target. Previously, the market for aircraft assembly technology was characterised by suppliers that only covered individual steps along the aircraft production process. Through this acquisition, BA has improved its capability to offer complete assembly lines from a single source.

A N N U A L R E P O R T 2 0 1 3 / 1 4 2 9
While BA holds a leading position in drilling and riveting systems for aircraft construction, its new acquisition offers materials handling equipment and systems for positioning and measuring components. “That opens up growth opportunities that the two companies would not have been able to capture on their own,” according to Schröder, BA’s Managing Director.
The service business is also set to bring growth. Its risk profile differs to the production of machines and plants and fluctuates less, thus flattening the sales curve. The service business is considered less risky overall, but earns higher margins; as a result, it increases the value of the investment. As with other companies in its portfolio, before entering into the investment, DBAG urged the management of BA to capture this potential. A few months after changing partners, BA Services was founded. From five million euros initially in service revenues, the subsidiary now generates more than 20 million euros, and this figure is set to increase in future. The company has also doubled the number of employees in this business to around 100.
According to Bernd Schröder, one of the key benefits of the new shareholder structure is a “greater degree of freedom” for himself and his management colleague. As he says, “We have become entrepreneurs.” So have some dozen managers in the company who like Schröder and Körner also participate in “their” company and benefit from its success directly. This also means that everyone pulls together, something that is particularly important
during a period of major change in the company. “We are turning BA inside out and becoming an international company with global branches. Growth will mainly take place at foreign plants. To get everyone on board as we progress along this path, we need to communicate,” Schröder explains. He and Körner inform employees openly and regularly about the company’s targets. Everyone should know where the company is heading. “We want to become a multinational competence team.” The idea of partnering with a private equity company originally gave rise to requests by employees at the time. In addition, the work’s council talked to colleagues at other companies in DBAG’s portfolio: “But the business logic convinced the sceptics,” says Schröder.
Some 15 kilometres from the company’s current head-quarters, a major construction site can be seen. The company is investing here and pooling its two existing sites to offer more attractive working conditions for employees, create more efficient production processes and improve communication. A clear sign of expansion and change. And of strength: “We also want to show how modern and innovative we are.”
» I N V E S T M E N T S T H AT B O O S T T H E
C O M PA N Y ’ S VA LU E A R E PA RT I C U L A R LY
E N C O U R A G E D – T H AT ’ S S O M E T H I N G
E L S E W E L I K E A B O U T D B A G . «
Bernd Schröder, Managing Director
F U R T H E R P O R T F O L I O C O M PA N I E S
Wiefelstede (Germany) / www.broetje-automation.de
2011/12 2012/13 2013/14 (PREL.)
77.9% SHARE OF DBAG FUND V
MBO TYPE OF INVESTMENT
MARCH 2012 INIT IAL INVESTMENT
548 EMPLOYEES
€ 5.6mnINVESTMENT
OF DBAG
18.8%SHARE OF DBAG
REVENUES €mn
83 87 89
OU
R P
OR
TF
OL
IO

3 0 O U R P O R T F O L I O
C O M P O N E N T S F O R P OW E R P L A N T S
The companies in the Clyde Bergemann Group develop
and produce components for energy-related production
processes. These products guarantee the efficient and safe
operation of power plants, industrial and waste incinerating
plants as well as petrochemical plants. They are also used in
pulp and paper plants, in the cement/mineral industry and
in marine boilers. In addition, the company maintains and
services these products.
The Clyde Bergemann Group has developed groundbreaking
technologies that have made it a market leader in its key
business segments. Products for efficiently cleaning power
plant boilers and for conveying bulk account for more than
two thirds of revenues; Clyde Bergemann is the indisputable
market leader in both of these markets. The group’s products
contribute to lower-emission and more efficient energy
generation, serving a growing demand.
P OT E N T I A L F O R D E V E LO P M E N T
Clyde Bergemann has been part of DBAG’s portfolio since
2005. At the time, the group had established a technolo-
gical lead and built up an international presence: in 2005,
Clyde Bergemann already had seven production sites in six
countries on three continents. Our goal was to expand the
product portfolio to include environmental protection and
to further grow the company’s international reach through
organic growth as well as acquisitions.
Since entering into this investment, the company’s revenues
have increased by 13 percent annually on average. It achieved
this partly through acquisitions: between 2005 and 2009,
Clyde Bergemann purchased seven companies with their own
products and services in the US, Australia and Europe. DBAG
and DBAG Fund IV contributed towards these acquisitions
by providing additional equity. The three American and the
Australian companies have particularly helped to boost the
value of the investment. They also allowed Clyde Bergemann
to offer its existing customers a larger range of products and
services as well as giving it access to new regional markets,
such as Australia. Clyde Bergemann has founded companies
in India, China, Indonesia and Turkey to further consolidate
its global sales and service network.
2013 /14 F I N A N C I A L Y E A R
In 2013/14, the company grew its revenues considerably year-
on-year thanks to a solid order backlog. Its earnings were at
the previous year’s level; however, they were impacted by
restructuring costs at a German site and start-up costs at an
American plant.
O U T LO O K A N D O B J EC T IV E S
In the current 2014/15 financial year (28 February), the group
intends to capture the opportunities offered by environmental
legislation in America and the growing awareness of air
pollution control in China. For this reason, it expects to
grow strongly in Asia, among others. Accordingly, Clyde
Bergemann’s revenues and earnings are expected to exceed
the previous year’s values.
45.1% SHARE OF DBAG FUND IV
MBO TYPE OF INVESTMENT
MAY 2005 INIT IAL INVESTMENT
€ 9.2mnINVESTMENT
OF DBAG
17.8%SHARE OF DBAG
CLYDE BERGEMANN GROUP
Wesel (Germany) / Glasgow (UK) / Delaware (USA) / www.cbpg.com
REVENUES in US$mn EMPLOYEES
2011/12 2012/13 2013/14
1,800445 447 545

A N N U A L R E P O R T 2 0 1 3 / 1 4 3 1
FORMEL D GMBH
S E RV I C E S F O R T H E
AU TO M OT I V E I N D U ST RY
Formel D provides the automotive industry and its suppliers
with services that cover the entire product creation process,
from vehicle development and production to customer
service. The company advises its customers and provides
them with specialised employees as well as technical
solutions. The focus is on services that address quality issues.
The value chain in the automotive industry has become
more permeable. Formel D makes use of the opportunities
that arise from the greater integration of the individual
levels of the value chain. In doing so, it serves the specific
needs of the automotive industry, which is under pressure
to improve quality and productivity despite the growing
complexity of vehicles (e.g. due to more electronics), an
increasing number of models and shorter product life
cycles. This enables Formel D to detach itself to a certain
extent from the volatility of the economy. In the context
of ongoing globalisation, every new factory a carmaker
opens presents Formel D with an opportunity to enter new
markets and capture additional growth potential. Here, the
company benefits from being one of the few global service
providers in its segment.
P OT E N T I A L F O R D E V E LO P M E N T
Formel D already has an international presence with
88 production sites in 25 countries. Nevertheless, it intends
to continue expanding to other countries, such as the US
and China. It aims to base its revenue and earnings growth
particularly on new services. As a precondition for further
growth, the formerly family-run company intends to trans-
form its leadership culture towards corporate governance
that is geared to the capital markets.
By strengthening its sales organisations in the US and
China, Formel D is pushing its international expansion. It
has made its sales division more customer and solution-
oriented overall. A new reporting system is in place that
provides detailed information regularly throughout the year
as a basis for the company’s value-based management.
2014 F I N A N C I A L Y E A R
Formel D owes its strong revenue growth in 2014 to a wider
choice of services, some with greater complexity, for existing
customers as well as a rise in the number of new models
going into production. Especially in Germany and the US, the
company performed better than expected. The number of
employees rose by around 20 percent. In Russia, the Ukraine
crisis affected business. Overall, Formel D improved its profit
margin once more compared to the previous year.
O U T LO O K A N D O B J EC T IV E S
The company will continue to implement the measures
agreed on at the start of the investment. These include, for
example, optimising its network of sites by closing plants
that are not sufficiently profitable. The budget entails
higher revenues in 2015, especially in the core markets of
Germany, the US and China. The company also aims to
boost its profitability.
62.4% SHARE OF DBAG FUND V
MBO TYPE OF INVESTMENT
MAY 2013 INIT IAL INVESTMENT
€10.4mnINVESTMENT
OF DBAG
15.1%SHARE OF DBAG
Troisdorf (Germany) / www.formeld.com
REVENUES in €mn EMPLOYEES
4,5002012 2014
(PREL.)
124
2013
135 157
OU
R P
OR
TF
OL
IO

3 2 O U R P O R T F O L I O
PL A N T S F O R I N D U ST R I A L AU TO M AT I O N
Grohmann Engineering develops and produces automated
plants for manufacturing sophisticated products for the
semiconductor, electronics and automotive industries as
well as for biotechnology and medical technology, among
others, and markets them worldwide. The company
works hand in hand with its customers and suppliers to
pioneer key technologies, such as required in the industrial
production and assembly of lithium ion batteries or the
industrial production of fuel cells.
The company benefits from the current trend towards process
optimisation for the highly efficient mass production of
technically sophisticated products or individual components
of such products. The aim is to improve quality and safety
standards, reduce material and manufacturing costs,
enhance product variability and shorten throughput times.
Grohmann supplies the necessary machines and plants to
achieve this. Standard machines are rarely used, and the
effort required to develop new machines is often high.
P OT E N T I A L F O R D E V E LO P M E N T
Our investment in Grohmann stems from an expansion
capital investment made in the 1990s. Since Deutsche
Beteiligungs AG entered into the investment (none of
DBAG’s funds have a stake in the company), the company’s
revenues have grown by around six percent a year on
average. Its customers’ industries have changed. Lower
order volumes from the telecommunications industry, for
example, have been offset by business with customers in
the biotechnology and medical technology industries. In
the past years, Grohmann has benefitted from a focus on
production processes in the information, communications
and automotive industries.
Currently, the family-owned company has set its sights on
the growth opportunities offered by the electromobility
sector: Grohmann Engineering is considered the technology
leader in plants for the industrial production of battery cells.
2014 F I N A N C I A L Y E A R
The company’s revenues and earnings developed better
than planned and were up on the previous year. After
making concessions in previous years for development
requests, repeat orders helped to boost the company’s
profitability.
O U T LO O K A N D O B J EC T IV E S
Based on the positive incoming orders in 2014, the company
expects higher revenues in 2015. Earnings are supposed
to increase disproportionately.
GROHMANN ENGINEERING GMBH
Prüm (Germany) / www.grohmann.com
REVENUES in €mn EMPLOYEES
7902012 2014
(PREL.)
111
2013
94 95
EXPANSION CAPITAL INVESTMENT TYPE OF INVESTMENT
DECEMBER 1996 INIT IAL INVESTMENT
€ 2.1mnINVESTMENT
OF DBAG
25.1%SHARE OF DBAG

A N N U A L R E P O R T 2 0 1 3 / 1 4 3 3
P RO D U C E R O F T EC H N I C A L T E X T I L E S
Heytex Bramsche GmbH produces laminated and coated
technical textiles as well as textile print media. The latter
are used in the advertising industry and for exhibition
booth designs, for example, as banners on facades or as
translucent advertising media. In this core business, Heytex
is the technological and European market leader with a
broad product range and is widely known as a brand.
Technical textiles stand out due to their unique functions:
they can be flame retardant, water-resistant or scratch-
proof. They are used as truck tarpaulins, tents or sports
arena roofs, but also as oil barriers, for example, in open
stretches of water, as well as conveyor belts.
Thanks to Heytex’ broad product portfolio, the company is
less dependent on the economic climate in certain end-user
industries and even on individual customers. This also sets
the company apart from the competition. A further aspect
that convinced us to invest in Heytex is its ability to make
technologically sophisticated products that are sought after
in the industry profitably, even in small batches.
P OT E N T I A L F O R D E V E LO P M E N T
When we entered into the investment, the aim was to
expand the company’s sales activities significantly. The
focus was on increasing its international reach. Heytex
intends to grow its market share in technical textiles by
taking advantage of the highly fragmented market to boost
its growth disproportionally with high-quality products. By
introducing measures to improve its operations, it intends
to be more profitable.
Since entering into the investment, Heytex has realigned its
sales organisation; in doing so, it emerged that its backlog
demand was greater than expected. In Italy, France and
Spain, the company now has its own sales organisation
and has restructured its plant in China. At the company’s
two sites in Germany, measures to improve operations are
already well underway. The company has also managed to
reduce its debt considerably.
2014 F I N A N C I A L Y E A R
In almost all product groups, revenues were up on the
previous year – proving that the changes in the sales
division have taken effect. Due to general market restraint
in Europe, delivery bottlenecks for certain raw materials
and initial problems in the production of a new product
range, the company was not able to meet all of its budget
targets.
O U T LO O K A N D O B J EC T IV E S
Heytex plans to continue implementing its defined
corporate strategy consistently in 2015. This includes further
expanding the sales force, developing innovative product
solutions and optimising production worldwide. To this
end, Heytex intends to strengthen the organisation in
selected areas. In addition, to reduce its general dependence
on the European market, it will focus above all on growth
in the US market. The acquisition of an American company
with a similar product portfolio completed at the end of
2014 provides a sound basis for this.
HEYTEX BRAMSCHE GMBH
68.0% SHARE OF DBAG FUND V
MBO TYPE OF INVESTMENT
DECEMBER 2012 INIT IAL INVESTMENT
€ 6.4mnINVESTMENT
OF DBAG
16.4%SHARE OF DBAG
Bramsche (Germany) / www.heytex.com
REVENUES in €mn EMPLOYEES
3052014
(PREL.)2012 2013
79 68 75
OU
R P
OR
TF
OL
IO

3 4 O U R P O R T F O L I O
B ROA D BA N D C O N N EC T I O N S
A N D I T S E RV I C E S
inexio Informationstechnologie und Telekommunikation
KGaA invests in the development and expansion of a
powerful telecommunications infrastructure in the greater
region of Rhineland-Palatinate/Saarland, as well as in
Bavaria and Baden-Württemberg. inexio has a proprietary
and steadily growing fibre-optic and municipal network
covering more than 5,000 kilometres as well as four
company-owned data centres. The company offers the
entire spectrum of telecommunications and IT – from
carrier services to assuming all telecommunications,
IT and data centre services. After originally focusing
exclusively on business customers, inexio now also offers
telecommunications services to private customers.
P OT E N T I A L F O R D E V E LO P M E N T
inexio is continuously growing its customer base by
investing in fast fibre-optic networks, i.e. in an increasingly
popular infrastructure with long-term availability, to
secure attractive sources of future revenue that are also
predictable. The entry barriers to the market in which
inexio operates are traditionally high. inexio has a highly
motivated and experienced management team. Thanks
to the company’s structure and capacities, it can take
advantage of current market opportunities.
A further key success factor is inexio’s ability to rapidly
expand its own network. Especially in rural areas, the rule
is that the first to invest gets access to the customers. The
capital invested by DBAG and the fund allows inexio to
considerably step up the pace at which it invests and quickly
tap into rural regions that border onto the existing network.
In the past two years, inexio has acquired a smaller company
with a network and customers in Bavaria. This enables it to
continue the regional expansion of its own network. inexio
is growing organically by linking ten to twelve localities to
the broadband network every month.
2013 /14 F I N A N C I A L Y E A R
In the 2013/14 financial year (30 September), inexio grew
its sustainable and profitable customer business largely as
forecast. The number of customer agreements increased
in the one-year period by over 60 percent. Revenues with
business customers also grew, although to a lesser degree.
Revenues and profit exceeded the forecast values.
O U T LO O K A N D O B J EC T IV E S
inexio plans to continue expanding its infrastructure and
customer numbers as well as increasing its revenues and
operating profits in 2014/15.
INEXIO INFORMATIONSTECHNOLOGIE UND TELEKOMMUNIKATION KGAA
8.14% SHARE OF DBAG EXPANSION CAPITAL FUND
EXPANSION CAPITAL INVESTMENT TYPE OF INVESTMENT
MAY 2013 INIT IAL INVESTMENT
€ 5.1mnINVESTMENT
OF DBAG
5.84%SHARE OF DBAG
Saarlouis (Germany) / www.inexio.net
2011/12 2012/13 2013/14 (PREL.)
REVENUES in €mn EMPLOYEES
17019 25 34

A N N U A L R E P O R T 2 0 1 3 / 1 4 3 5
M AC H I N E S A N D P L A N T S F O R
PAC K AG I N G T EC H N O LO GY
Romaco is a leading global supplier of processing and
packaging technology. Divided into two business areas,
“Tableting” and “Packaging”, the company develops
system solutions for the pharmaceutical, cosmetics, food
and chemical industries. Romaco focuses on serving the
technically sophisticated segment of flexible machinery,
which benefits from the strong global growth of generic
drug manufacturers. The company’s product range includes
primary and secondary packaging, sterile liquid and powder
filling solutions, as well as tablet compression technology.
By investing in Romaco, DBAG is participating in one of the
most attractive and strongly growing segments of Germany’s
mechanical engineering sector. Romaco benefits from the
growth drivers in the pharmaceutical market – a growing global
population, an ageing population in industrialised nations and
rising prosperity in emerging countries. The countless machines
that the company has delivered worldwide in the past provide
an excellent basis for establishing a stable service business.
P OT E N T I A L F O R D E V E LO P M E N T
The strategic goal is to develop Romaco into a so-called
full liner in the group’s key area of tablet production
and packaging. This will enable the company to offer its
customers integrated system solutions for the entire tablet
production process. By investing in its sales organisation,
Romaco aims to improve its regional market coverage. In
addition, it plans to expand its service business.
In 2013/14, DBAG and DBAG Fund V provided funding
to help Romaco take the first key steps towards fulfilling
its development potential and implementing its strategic
goals. With the acquisition of IMA Kilian in November
2013, the company gained another important process
step in tablet production. On the other hand, in October
2014 Romaco sold its group company FrymaKoruma, a
manufacturer of machines for food production, to Stephan
Machinery (“ProXES”), another company in our portfolio.
The revenues generated by this disposal will go towards
further implementing the full-liner strategy, among others.
2013 /14 F I N A N C I A L Y E A R
In the first half of the 2013/14 financial year (31 October),
Romaco suffered from its customers’ reluctance to invest,
especially in emerging countries that are key to the
company’s business. In these countries, political uncertainty
and the resulting devaluation of the currency resulted in an
unfavourable climate for investment and in orders being
postponed in the business for new machinery. Revenues
and earnings in the second half of 2013/14 were therefore
below expectations and down on the previous year’s values
on a comparable basis, despite a clear turnaround. Sales
and the services business were enhanced.
O U T LO O K A N D O B J EC T IV E S
Romaco is continuing to focus on acquiring companies
to complete its range of machines. Given a considerable
improvement in the order situation more recently, the
company started the 2014/15 financial year with a larger
order backlog, which is expected to yield higher revenues
and earnings.
ROMACO GMBH
77.3% SHARE OF DBAG FUND V
MBO TYPE OF INVESTMENT
APRIL 2011 INIT IAL INVESTMENT
€ 11.2mnINVESTMENT
OF DBAG
18.7%SHARE OF DBAG
Karlsruhe (Germany) / www.romaco.com
1 Including the acquisition of IMA Kilian in 2013 but excluding the disposal of FrymaKoruma in 2014
REVENUES in €mn EMPLOYEES
4502011/12 2013/14
(PREL.)1
2012/13
109 103 113
OU
R P
OR
TF
OL
IO

3 6 O U R P O R T F O L I O
E D U C AT I O N A N D T U TO R I N G S E RV I C E S
Schülerhilfe GmbH is the largest provider of supplementary
educational and tutoring services in Germany and Austria.
The company teaches more than 80,000 customers, mainly
students aged between six and 18, at 1,066 learning
centres. Schülerhilfe GmbH operates one third of the
centres itself, while the remaining ones are run by
independent franchisees; these are expected to generate
a further 77 million euros in revenues in 2014 under the
“Schülerhilfe” brand. Based on the number of locations,
Schülerhilfe is Germany’s third-largest franchise system.
As the market leader, the company is widely known. It is
led by an entrepreneurial and experienced management
team. It has good prospects: Schülerhilfe benefits from
the increasing institutionalisation of the tutoring market
and the resulting consolidation of the industry. At the
same time, (school) education is growing in importance.
The company’s business model is neither capital-intensive
nor cyclical: it generates a stable payment flow, and every
new pupil at an existing location improves the company’s
average profit contribution.
P OT E N T I A L F O R D E V E LO P M E N T
Schülerhilfe aims to grow faster than the market; to this
end, it intends to optimise the marketing instruments it
uses, for example. It plans to generate growth above all
from existing business by increasing the number of pupils
per location on the one hand and revenues per pupil on the
other. The company wants to expand its product range, for
example, by offering services to adults or a form of learning
that combines the advantages of classroom teaching and
e-learning.
In the first year of our investment, Schülerhilfe optimised
and expanded its sales platform. It further increased its
brand awareness by changing the marketing mix. Initial
tests with its new products have been successful.
2014 F I N A N C I A L Y E A R
The company’s revenues and earnings at its own
learning centres were up on the previous year’s values.
The franchising business also developed positively due
to effective marketing and sales measures. Schülerhilfe
reduced its debt according to plan.
O U T LO O K A N D O B J EC T IV E S
In 2015, Schülerhilfe will push ahead with the measures
agreed on when we entered into the investment. These
include the company’s proprietary e-learning platform,
which will now be rolled out nationwide to franchisees
after being successfully launched at its own centres. In
addition, the company intends to expand its services to
adults to ten centres. The budget for 2015 provides for
both higher revenues and greater profitability.
SCHÜLERHILFE GMBH
75.9% FURTHER SHARE OF
DBAG FUND VI
MBO TYPE OF INVESTMENT
OCTOBER 2013 INIT IAL INVESTMENT
€ 9.8mnINVESTMENT
OF DBAG
17.8%SHARE OF DBAG
Gelsenkirchen (Germany) / www.schuelerhilfe.de
20132012 2014 (PREL.)
REVENUES in €mn EMPLOYEES
35043 48 52

A N N U A L R E P O R T 2 0 1 3 / 1 4 3 7
A I R CO N D IT I O N I N G F O R B U S E S
Spheros develops and produces air conditioning systems,
engine-independent heating systems, water pumps and
roof hatches for buses. The company’s core competence is
air management in buses: it has supplemented this in recent
years by developing, industrialising (purchasing components
and configuring them) and integrating entire electronics
systems into bus bodies. The company’s differentiated
portfolio with premium, standard and basic products
enables it to cover demand in both mature western markets
and fast-growing emerging countries.
Spheros is an international company with six production
sites on three continents. It is the global market leader in its
largest business segment, the development and assembly
of customised bus air control systems. The world market
for buses is growing in structural terms, driven by several
trends, such as urbanisation, the mobility needs of a growing
middle class and the general growth of the population.
P OT E N T I A L F O R D E V E LO P M E N T
Spheros aims to grow even faster than the market. To this
end, it intends to further drive its international expansion
through local partnerships, boosting its export business and
founding further subsidiaries abroad. The company plans to
extend its existing competences to other areas. It aims to
further strengthen its electronics expertise and capture the
market for refrigerated trucks in the Middle East. In addition,
it intends to develop new products for use in buses.
Spheros has already taken first steps towards reaching this
goal: it has established a spare parts business in South
America by founding a subsidiary in Brazil. In addition, a joint
venture in Brazil under Spheros’ industrial management has
been developing and producing electrical and electronic
components for buses since 2013. After opening a sales
office in Australia, the company has now completed the
expansion of its international presence. Revenues with
new customers will consolidate its market share in the air
conditioning business.
2014 F I N A N C I A L Y E A R
Spheros’ revenues and earnings developed as expected in
2014 in local currency and were significantly up on the
previous year’s values. Especially its European business
was above expectations. In Germany, for example, the
liberalisation of long-distance bus services triggered a
sharp rise in demand for buses and therefore for Spheros’
products. The company’s new bus electronics products
have been well received on the market. In Turkey, Brazil
and India, the devaluation of the respective local currency
had a negative effect on earnings. The company’s debt
reduction was as expected.
O U T LO O K A N D O B J EC T IV E S
In 2015, the company aims to expand its air control
management business in the US and launch a new
generation of heating systems in Asia. In addition,
it expects a continued rise in demand following the
liberalisation of the long-distance bus market in Germany.
Based on this outlook, the company expects to boost
revenues and generate more profit accordingly.
SPHEROS GMBH
65.3% SHARE OF DBAG FUND V
MBO TYPE OF INVESTMENT
MARCH 2012 INIT IAL INVESTMENT
€ 12.9mnINVESTMENT
OF DBAG
15.7%SHARE OF DBAG
Gilching (Germany) / www.spheros.com
2012 2014 (PREL.)
REVENUES in €mn EMPLOYEES
770168
2013
190 197
OU
R P
OR
TF
OL
IO
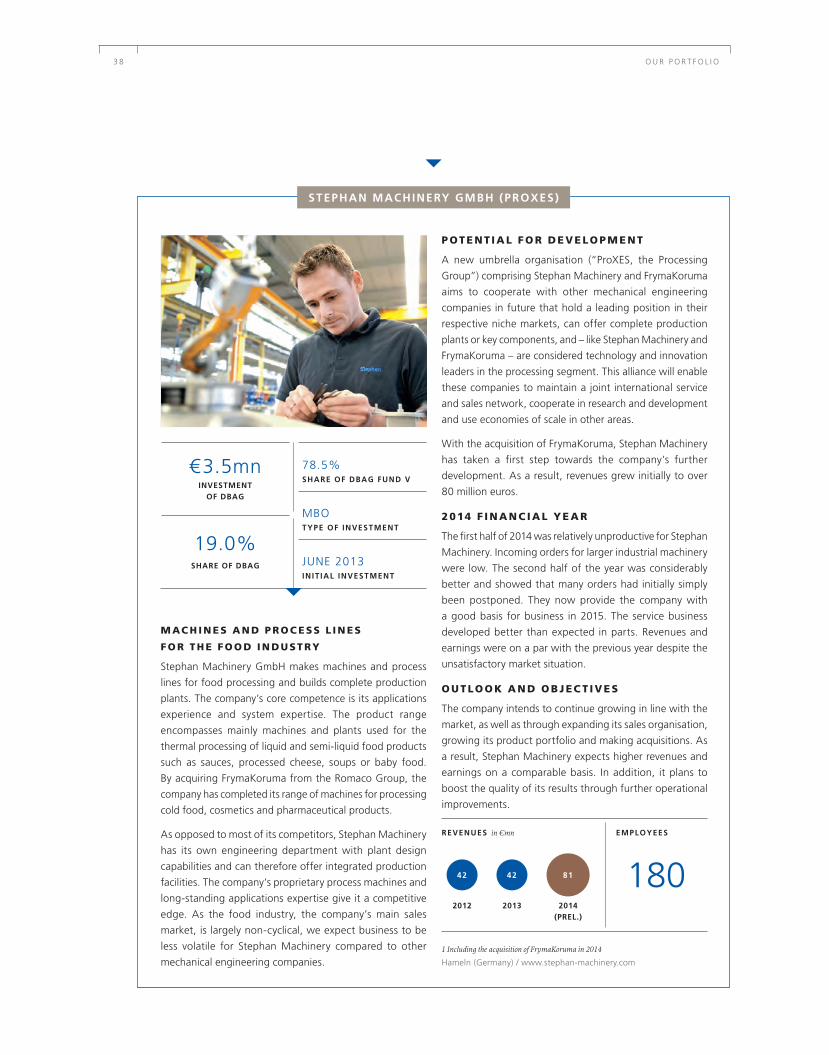
3 8 O U R P O R T F O L I O
M AC H I N E S A N D P RO C E SS L I N E S
F O R T H E F O O D I N D U ST RY
Stephan Machinery GmbH makes machines and process
lines for food processing and builds complete production
plants. The company’s core competence is its applications
experience and system expertise. The product range
encompasses mainly machines and plants used for the
thermal processing of liquid and semi-liquid food products
such as sauces, processed cheese, soups or baby food.
By acquiring FrymaKoruma from the Romaco Group, the
company has completed its range of machines for processing
cold food, cosmetics and pharmaceutical products.
As opposed to most of its competitors, Stephan Machinery
has its own engineering department with plant design
capabilities and can therefore offer integrated production
facilities. The company’s proprietary process machines and
long-standing applications expertise give it a competitive
edge. As the food industry, the company’s main sales
market, is largely non-cyclical, we expect business to be
less volatile for Stephan Machinery compared to other
mechanical engineering companies.
P OT E N T I A L F O R D E V E LO P M E N T
A new umbrella organisation (“ProXES, the Processing
Group”) comprising Stephan Machinery and FrymaKoruma
aims to cooperate with other mechanical engineering
companies in future that hold a leading position in their
respective niche markets, can offer complete production
plants or key components, and – like Stephan Machinery and
FrymaKoruma – are considered technology and innovation
leaders in the processing segment. This alliance will enable
these companies to maintain a joint international service
and sales network, cooperate in research and development
and use economies of scale in other areas.
With the acquisition of FrymaKoruma, Stephan Machinery
has taken a first step towards the company’s further
development. As a result, revenues grew initially to over
80 million euros.
2014 F I N A N C I A L Y E A R
The first half of 2014 was relatively unproductive for Stephan
Machinery. Incoming orders for larger industrial machinery
were low. The second half of the year was considerably
better and showed that many orders had initially simply
been postponed. They now provide the company with
a good basis for business in 2015. The service business
developed better than expected in parts. Revenues and
earnings were on a par with the previous year despite the
unsatisfactory market situation.
O U T LO O K A N D O B J EC T IV E S
The company intends to continue growing in line with the
market, as well as through expanding its sales organisation,
growing its product portfolio and making acquisitions. As
a result, Stephan Machinery expects higher revenues and
earnings on a comparable basis. In addition, it plans to
boost the quality of its results through further operational
improvements.
STEPHAN MACHINERY GMBH (PROXES)
78.5% SHARE OF DBAG FUND V
MBO TYPE OF INVESTMENT
JUNE 2013 INIT IAL INVESTMENT
€ 3.5mnINVESTMENT
OF DBAG
19.0%SHARE OF DBAG
Hameln (Germany) / www.stephan-machinery.com
1 Including the acquisition of FrymaKoruma in 2014
2012
REVENUES in €mn EMPLOYEES
18042
2013
42
2014 (PREL.)
81

A N N U A L R E P O R T 2 0 1 3 / 1 4 3 9
BA K E RY C H A I N
Unser Heimatbäcker is Germany’s fifth largest bakery chain
in terms of revenues. The company is the result of a merger
of a number of bakery chains in Northeast Germany. It
operates various types of outlets under the brands “Unser
Heimatbäcker” and “Lila Bäcker”, mainly in the entrance
areas of supermarkets and in shopping centres, as well as
its own bakery shops and cafés. It also delivers a range of
bakery products to 1,500 customers (supermarkets, hotels,
restaurants and filling stations) via a wholesaler.
P OT E N T I A L F O R D E V E LO P M E N T
The fragmented bakery market in Germany is characterised
by a few major competitors, a consolidation process, and
structural changes brought on, among other things, by
discount bakeries and, increasingly, in-store bakeries in
retail grocery stores. As a high-quality bakery chain with
innovative production processes and a holistic marketing
concept, the company is well placed to play an active role
in consolidating this market.
This strong competitive position was an important reason
for our decision to invest in Unser Heimatbäcker. To capture
further economies of scale, the company should use its
position for further expansion by opening new stores,
making acquisitions and continuing the implementation of
its “Lila Bäcker” concept. As well as a uniform design at all
points of sale, this concept incorporates a special pricing
strategy and a customer loyalty programme, among others.
Just a few weeks after entering the investment, the
company’s shareholders financed the acquisition of the
De Mäkelbörger bakery group from insolvency protection
proceedings. The aim is to gradually integrate the group into
Unser Heimatbäcker, adding some 1,200 employees as well
as more than 100 outlets in Mecklenburg-West Pomerania
and Brandenburg. De Mäkelbörger also operates its own
large-scale production of frozen bakery goods, which can
be used to expand the retail business.
2014 F I N A N C I A L Y E A R
Unser Heimatbäcker’s performance exceeded expectations
in 2014. By introducing the legal minimum wage ahead
of schedule in July 2014, the company set itself apart as
an attractive employer in its business segment. In addition
to acquiring De Mäkelbörger as mentioned above, Unser
Heimatbäcker took over another smaller bakery chain
in 2014.
O U T LO O K A N D O B J EC T IV E S
The company will continue to integrate the acquired outlets
and convert more units to the “Lila Bäcker” concept. It has
also identified further acquisition targets. In addition, it is
expected to expand its retail business. As a result, revenues
and earnings should be higher in the current business year
compared to the previous year.
UNSER HEIMATBÄCKER GMBH
66.3% SHARE OF DBAG FUND VI
MBO TYPE OF INVESTMENT
JUNE 2014 INIT IAL INVESTMENT
€ 9.9mnINVESTMENT
OF DBAG
15.6%SHARE OF DBAG
Pasewalk (Germany) / www.unser-heimatbaecker.de
2012
REVENUES in €mn EMPLOYEES
2,30095
2013
99
2014 (PREL.)
107
OU
R P
OR
TF
OL
IO

4 0 5 0 Y E A R S O F D B A G
50 YEARS OF DBAG
1965–2015

A N N U A L R E P O R T 2 0 1 3 / 1 4 4 1
For over 50 years, we have supported successful small and mid-sized companies, the backbone of
the German economy, with private equity. Deutsche Beteiligungsgesellschaft mbH was founded
in 1965 and renamed Deutsche Beteiligungs AG in 1985. Ever since then, we have contributed
to countless success stories. We have helped far-sighted entrepreneurs and committed managers
to take the next step forward in a globalised world. At the same time, this has enabled us to
develop and shape the investment business in Germany. To the benefit of all: our shareholders,
our partners at the companies we invest in, and not least the future viability of Germany as a
place to do business.
The company's initial public offering in 1985 was a historic step, giving private investors access to the private equity investment class for the first time.
The new service soon met with demand: the investment in Eberle-Werke, a family-owned company in Nuremberg, in 1966 was the third investment following DBG's foundation the previous year.
50
YE
AR
S O
F D
BA
G
DBAG's investment
team
2015
1966
1985
2015

4 2 5 0 Y E A R S O F D B A G
1 9 6 5 1 9 6 6 1 9 6 7 1 9 6 8 1 9 6 9
Seen from today’s perspective, Deutsche Bank’s decision to found “Deutsche Kapitalbeteiligungsgesellschaft mbH” (DBG, renamed Deutsche Beteiligungsgesellschaft mbH shortly afterwards) on 23 September 1965 was a pioneering step. Because even though the Company’s first real investments in small and mid-sized companies at the time ranged from around 0.5 to 2.5 million deutschmarks, they were something completely new and innovative in the German financial and capital market of the 1960s. The Federal Republic of Germany was already well established both politically and economically. Following the economic miracle, there was full employment. The country owed its increasing prosperity not least to the "Mittelstand", the large number of small and mid-sized companies, many of them family-owned, that put German products on the global map under the seal “Made in Germany”. However, some of these companies were only able to finance their growth from classical capital sources to a limited extent. And so the idea was born of setting up a company to provide these companies with equity.
Pioneering work without real role models
In the early years of private equity financing, there were very few examples on which an investment company like DBG could model itself. Two investment companies that started up at around the same time as DBG had already funded established mid-sized companies as silent part-ners. In this respect, the service they offered was therefore still similar to the traditional lending business of banks. Shortly afterwards, the two companies withdrew from this still young market. DBG had to find its own way. Its objectives were clear: to improve the equity structure of mainly mid-sized companies and generate growth, on the one hand by strengthening these companies’ innovativeness and competitive edge, and on the other by achieving an adequate return on the invested capital.
Ludwig Erhard, Minister for Economic Affairs and subsequently the second Chancellor of the
Federal Republic of Germany, is considered the father of the economic miracle.
was the average amount invested in small and mid-sized companies by DBAG at the time.
500,000 to
2,500,000 DEUTSCHMARKS
I N 1965,
P R I VAT E E QU I T Y WA S S OM E T H I NG
C OM P L E T E LY N E W I N GE R M A N Y.

A N N U A L R E P O R T 2 0 1 3 / 1 4 4 3
1 9 7 0 1 9 7 1 1 9 7 2 1 9 7 3 1 9 7 4
A great idea catches on
Today, half a century later, investment companies based in Germany have invested around 37 billion euros of capital in just under 6,000 mainly German companies. The revenues of companies financed with private equity correspond to 8.2 percent of Germany’s gross national product. This underlines just how important private equity is for the country’s economy. Fifty years after being introduced to the market, it has become established in the German economy and is now indispensable. DBAG and its competitors are sought-after whenever the financial resources of owners or internal financing with corporate profits are insufficient to allow companies to take the next step in their development in a globalised market.
This benefits the entire economy, as the figures show: more than 90 percent of companies financed with private equity in 2013 in Germany were in the category “less than 500 million euros in annual revenues and fewer than 1,000 employees”. Private equity, especially when it comes from Germany, finances German SMEs.
Companies in Germany funded with private equity (2013, by annual revenues)Source: PEREP Analytics. Only includes companies with known revenues (377 companies)
is the average amount invested in MBOs nowadays by DBAG alongside DBAG Fund VI.
Around
10,000,000 EUROS
TODAY, I T S VA L U E T O T H E
E C ONOM Y H A S L ONG BE E N
R E C O GN I S E D.5
0 Y
EA
RS
OF
DB
AG

4 4 5 0 Y E A R S O F D B A G
1 9 7 5 1 9 7 6 1 9 7 7 1 9 7 8 1 9 7 9
In the 1970s, the environment was somewhat unfavourable for the equity business: the shock following the two oil crises in 1974 and 1979 weighed heavily on the economy. Rising oil prices made production more expensive and even hit small and mid-sized companies that had previously been robust. Despite this, their good reputation remained untarnished, even internationally. Anglo-American private equity companies decided to take advantage of the situation and attempted to enter the German market. However, they were hindered in this by the economic and social climate with its critical attitude to entrepreneurship and pursuit of profit as well as competition from the state with its venture capital scheme to promote investments (ERP-Beteiligungsprogramm), which was subject to strict conditions. None of the foreign companies managed to gain a foothold in the German equity business. At the end of 1975, the German equity market had a volume of just 420 million deutschmarks. DBG led the market among German private equity companies with a market share of around 18 percent.
In the early 1980s, German companies’ equity base had been declining for years despite the economic upswing. This prompted a political reaction: a law on special investment companies (Gesetz über Unter-nehmens beteiligungsgesellschaften – UBGG) was initiated to simplify the process for companies to borrow equity. It governed the activities of private equity companies for the first time with the aim of making it easier for unlisted SMEs to receive external financing.
The oil crisis largely took Germany by surprise and laid the foundation for greater energy efficiency.
Growth of assets managed/advised by DBAG from 1965 to 2013/14
2013/14:
€1.3BILLION
1965:
DM
20MILLION
I N 1975,
T H E PRIVATE EQUITY B U S I N E S S P L AY E D A
M ARGINAL ROLE
I N G E R M A N Y.

A N N U A L R E P O R T 2 0 1 3 / 1 4 4 5
1 9 8 0 1 9 8 1 1 9 8 2 1 9 8 3 1 9 8 4
TODAY, DBAG ALONE HAS INVESTED
MORE CAPITAL THAN THE WHOLE MARKET
BACK THEN.
Advising and managing assets worth 1.3 billion euros
Today, German SMEs are highly sought-after by international private equity companies. Measured by the volume invested, the German market has grown strongly – and with it Deutsche Beteiligungs AG: at the balance sheet date for the 2013/14 financial year, DBAG advised and managed assets worth 1.3 billion euros with a portfolio of 19 invest-ments. Its partners are open and discerning managers as well as owners of family businesses who not only expect equity from their financial investor, but also business expertise, a first-rate network and in-depth understanding of their products and markets.
It is clear that over the years, there has been a fundamental change of mindset. Today, the function of private equity companies, namely of creating a kind of exchange, is widely understood. This is available as a capital market for families who want to dispose of their company, corporations that have lost interest in their non-core business or to finance further growth. After all, not all business models can be floated on the stock exchange. If there were no financial investors, then basically the only potential buyers left for these companies would be their competitors. And they would only be interested in creating “synergies” – one sales team instead of two, making one of two research divisions superfluous, and taking advantage of this to invest abroad on a large scale. Because not all companies want to accept this prospect, this results in investment opportunities for companies like DBAG. With experience gained from investments in more than 300 German SMEs, it is today one of Germany’s leading private equity companies.
Private equity secures earnings and creates jobs. Synergies captured through takeovers, on the other hand, often result in job losses.
50
YE
AR
S O
F D
BA
G

4 6 5 0 Y E A R S O F D B A G
1 9 8 5 1 9 8 6 1 9 8 7 1 9 8 8 1 9 8 9
In the middle of the 1980s boom, DBG’s Supervisory Board and Board of Management decided to act. The management had already given some thought to financing the investment business on the capital market in future. Now was the right time: Deutsche Beteiligungs AG (DBAG) was founded on 10 December 1984. With an equity base of 60 million deutschmarks and the most attractive investments from DBG’s portfolio in terms of profitability and growth opportunities, DBAG was the first German private equity firm in accordance with the UBGG. The initial price for its share was set on 19 December 1985. The timing was good: in 1985, the business volume of the German investment industry passed the one billion deutschmarks threshold for the first time. The growth of the entire industry gathered momentum, promoted on the one hand by strong economic growth in the 1980s and on the other by the effects of reunification towards the end of the decade.
Still successful and in demand after 30 years on the stock exchange
From being an oddity on the exchange list, DBAG grew steadily over the following years to become a gem in the depots of many private and institutional investors. Even today, purchasing a DBAG share is the only way for investors to supplement their depot with a German prime standard value that invests in the most promising unlisted German SMEs based on the value-enhancing approach of a private equity investor. It does this by means of proven criteria and transparent objectives. Private equity for the price of one share.
This also makes it accessible for private investors, who normally do not have access to this investment class: private equity funds, which institutional investors use for capital allocation, require minimum investments that only few private investors can afford.
A historic moment: DBAG's initial public offering in 1985 made private equity accessible for private investors.
The fall of the Berlin Wall in 1989 set things in motion in economic terms, too.
I N 1985,
V E N T U R E C A P I TA L
WA S C ON S I DE R E D
A R I S K .

A N N U A L R E P O R T 2 0 1 3 / 1 4 4 7
1 9 9 0 1 9 9 1 1 9 9 2 1 9 9 3 1 9 9 4
An important building block for a diversified private equity portfolio
Worldwide, there are some 250 listed private equity companies, mostly in Europe. Their investment strategies vary: they invest either directly in companies or in private equity funds, prefer specific industries, countries, company sizes or investment phases. Investors can therefore combine a selection of these shares to create a diversified private equity portfolio – diversified in terms of geographic distribution, private equity investment style (buyout, venture capital or growth financing) and financing form (equity or mezzanine), among others. Unlike in the case of closed-end funds, investors who buy a private equity share invest in an existing portfolio. They can end the investment at any time or remain invested indefinitely. Just as in other segments of the equity market, listed private equity includes open-end investment funds and exchange-traded funds (ETFs), and there are even listed private equity indices calculated on the stock exchange. Thirty years after going public, Deutsche Beteiligungs AG’s share is included in a number of such funds, ETFs and indices.
LPEQ, an amalgamation of 18 private equity companies listed on various European exchanges, and LPX Group as a financial
services provider in the area of alternative asset classes support the private equity business with analyses, indices and
exchange-traded funds.
The development of DBAG's share since going public on 19 December 1985 (= 100); until 31 October 2014, its value increased by around 9.6 percent p.a.
TODAY, N U M E ROU S
I N V E S T OR S H AV E A DDE D
DB AG ’ S S H A R E S T O
T H E I R DE P O T. 5
0 Y
EA
RS
OF
DB
AG

4 8 5 0 Y E A R S O F D B A G
1 9 9 5 1 9 9 6 1 9 9 7 1 9 9 8 1 9 9 9
After the fall of the Berlin Wall and the Iron Curtain, the 1990s were characterised by the huge economic effort to reconstruct the eastern German states. For DBAG, too, this heralded the dawn of a new era and the most exciting decade in its history so far. The impact of the fall of the Berlin Wall on the German economy was also felt by small and mid-sized companies. In addition, Europeanisation and the start of globalisation were making their mark. Corporate structures were transformed, producing more split-offs and spin-offs, and demand for management buyouts (MBOs) increased as the next generation in family-owned companies took over. In addition, it emerged that the credit requirements would become stricter for small and medium-sized companies in particular – leading years later, in 2004, to the regulations known as “Basel II”. This also generated new opportunities in the private equity business.
Strategic consequences from a turbulent decade
These fundamental changes offered salaried managers the chance to become entrepreneurs themselves – with the help of financial investors to fund the MBO. From around the mid-1990s, interest in MBOs grew significantly. After the German capital market opened, private equity became more popular here and demand grew considerably. DBAG was one of the first German financial investors to recognise this and make acquisitions structured as buyouts part of their strategy. By concentrating on German SMEs in traditional sectors with exceptional potential for development, DBAG established the framework for its activities, which basically still applies today. This paid off: until the turn of the millennium, the DBAG Group multiplied its portfolio volume fivefold to around 500 million euros in the course of this decade of rapid growth.
At the beginning of the new millennium, changes in regulations resulted in banks hiving
off their private equity business.
Management buyouts secure the future of small and mid-sized companies.
I N 1995, ON LY V E RY F E W M A NAGE R S
C OU L D BU Y T H E I R
C OM PA N Y ’ S S H A R E S .

A N N U A L R E P O R T 2 0 1 3 / 1 4 4 9
Management buyouts – majority interest in a company together with its management board – now dominate DBAG's portfolio.
34MANAGEMENT BUYOUTS
SINCE 1997
2 0 0 0 2 0 0 1 2 0 0 2 2 0 0 3 2 0 0 4
MBOs as an attractive form of investment
Not least thanks to this important strategic decision in the 1990s, DBAG is well established today as a preferred partner for SMEs and has made its mark as one of the leading German buyout investors.
Since 1995, DBAG has structured 31 management buyouts in Germany. Twenty-one of these investments have since ended, most with considerable success, not only for the companies themselves, but also for investors and DBAG’s shareholders. The MBOs that have already ended yielded more than double the capital invested. With an average holding period of less than five years, a (gross) capital multiplier of 2.9 presents an attractive return. Its in-depth knowledge of successful MBOs acquired over many years will continue to contribute to the attractiveness and performance of DBAG and its shares in future.
TODAY, DB AG F I NA NC E S
M B O S A S GE R M A N Y ’ S
L E A DI NG BU YOU T
I N V E S T OR .
50
YE
AR
S O
F D
BA
G

5 0 5 0 Y E A R S O F D B A G
2 0 0 5 2 0 0 6 2 0 0 7 2 0 0 8 2 0 0 9
Thanks to its strong position, DBAG emerged from the economic crash at the beginning of the new millennium relatively unscathed. The group net income was not always positive during these years. However, thanks to its disciplined investment and financing management, it was able to lead its portfolio companies safely through the crisis. Even in its worst year it generated substantial capital gains; a comparably sound equity base took care of the rest.
Banks, once the founders of investment companies, no longer wanted to include private equity in their balance sheets to the same extent as at the turn of the millennium due to its sector-specific volatility in periods of excessively high prices on the stock exchange. In addition, regulatory changes made investments in private equity companies seem less attractive for banks. Deutsche Beteiligungs AG was prepared for this challenge. It has always entered into investments either exclusively via funds or – after DBAG was founded – as a co-investment with funds. In 2002, DBAG established a fund whose members not only comprised shareholders of DBAG or partners of DBG for the first time. Deutsche Bank only contributed 13 percent of investment commitments to this DBAG Fund IV. That was the last time it took a stake: when DBAG Fund V was established in 2006, it did not participate at all. In 2007, Deutsche Bank sold its remaining 15 percent share of DBAG.
At the time, DBAG had long grown out of the need for a strong parent company. It had matured and become independent, and no longer relied exclusively on direct investment as its mainstay. With its strategy of managing and offering advice on closed-end private equity funds for institutional investors, it not only opened up a second source of financing, but also established a second earnings pillar. DBAG’s success could be seen not only in the growing volume of funds, but also in the expansion of its products to include a fund for growth financing, which was established in 2011. DBAG Fund VI was the largest buyout fund of a German private equity company in 2012 with a volume of 700 million euros.
1975
DBG Fonds II
DM139 million
1965
DBG Fonds I
DM473 million
2006
DBAG Fund V
€ 434 million
1998
DBG Fonds III
DM 283 million
2013
DBAG Fund VI
€700 million
2011
DBAG Expansion Capital Fund
€142 million
2002
DBAG Fund IV
€ 228 million
Overview of DBAG's funds
F ROM 2005, E S TA BL I S H I NG F U N D S
BE C A M E MOR E P R E VA L E N T.

A N N U A L R E P O R T 2 0 1 3 / 1 4 5 1
2 0 1 0 2 0 1 1 2 0 1 2 2 0 1 3 2 0 1 4
Annual rate of return of different asset classes over a ten-year period from 2004 to 2013, based on comparable cash flows and taking into account the initial and the end value of each
private equity fundSource: “2013 Pan-European Private Equity Performance Benchmarks Study”, European
Private Equity & Venture Capital Association (EVCA), Brussels, June 2014 (page 21)
Only the best is good enough
The investment universe in which DBAG finds new candidates for its portfolio comprises around 4,000 unquoted German SMEs. The Company has sufficient funds for this – a total of 800 million euros from its own balance sheet and from investment commitments from its fund investors (31 October 2014). In addition, it has one of the largest and most experienced investment teams on the market.
DBAG’s network is unique, and the success of its business with a 15.3 percent return on equity on average over the past ten years speaks for itself. The “locust” debate in Germany that raised its head in April 2005 gave DBAG the opportunity to set itself apart from the compe-tition: measured by the private equity sector, its listing on the stock market provides it with an exceptionally high degree of transparency for entrepreneurs and managers in SMEs, for shareholders and business partners as well as for all those who are interested in the business of DBAG. This also benefits the companies in DBAG’s portfolio, putting them in a position to take the next step in their development. Compari-sons with listed companies or family-owned businesses have repeatedly shown that companies financed with private equity grow faster, pursue a clearer strategy, have a better financial structure, and ultimately secure existing jobs and create new ones. This offers good prospects for further successful decades in the life of Deutsche Beteiligungs AG. And proof of the farsightedness of those who laid the foundation for institutionalised private equity capital 50 years ago.
All investment decisions by Deutsche Beteiligungs AG are made at its headquarters in Frankfurt/Main, not far
from the Frankfurt Stock Exchange.
TODAY, T H E Y
H E L P T O M A K E U S T H E L A RGE S T GE R M A N F U N D
A DV I S OR . 5
0 Y
EA
RS
OF
DB
AG

on Deutsche Beteiligungs AG andthe Deutsche Beteiligungs AG Group
for f inancial year 2013/14
C O M B I N E D
M A N A G E M E N T R E P O R T
5 2 C O M B I N E D M A N A G E M E N T R E P O R T

54B U S I N E S S O V E R V I E W
55T H E G R O U P A N D U N D E R LY I N G CO N D I T I O N S
55 . STRUCTURE AND BUSINESS ACTIVITY
60 . OBJECTIVES AND STRATEGY
64 . STEERING AND CONTROL
67 . SUSTAINABIL ITY
69B U S I N E S S R E V I E W O F T H E G R O U P
69 . MACROECONOMIC AND SECTOR-RELATED
UNDERLYING CONDITIONS
72 . BUSINESS AND PORTFOLIO REVIEW
75 . EARNINGS POSIT ION
80 . F INANCIAL POSIT ION
82 . ASSET POSIT ION
87 . COMPARISON OF ACTUAL AND PROJECTED
BUSINESS PERFORMANCE
88 . F INANCIAL AND NON-FINANCIAL
PERFORMANCE INDICATORS
93 . OVERALL ASSESSMENT OF THE ECONOMIC
POSIT ION OF THE GROUP
94F I N A N C I A L R E V I E W O F D E U T S CH E B E T E I L I G U N G S AG (CO M M E N TA R Y B A S E D O N T H E G E R M A N CO M M E R C I A L CO D E – H G B )
94 . EARNINGS POSIT ION
98 . ASSET POSIT ION
99 . F INANCIAL POSIT ION
100 . COMPARISON OF ACTUAL AND PROJECTED
BUSINESS PERFORMANCE
100 S I G N I F I C A N T E V E N T S A F T E R T H E E N D O F T H E R E P O R T I N G P E R I O D
101A D D I T I O N A L S TAT U T O R Y I N F O R M AT I O N A N D CO M M E N TA R Y
101 . REMUNERATION REPORT
105 . TAKEOVER-RELATED DISCLOSURES § 289 (4)
AND § 315 (4) GERMAN COMMERCIAL CODE – HGB
107 . CORPORATE GOVERNANCE STATEMENT (§ 289A
GERMAN COMMERCIAL CODE – HGB)
108O P P O R T U N I T I E S A N D R I S K S
108 . OPPORTUNITY AND RISK MANAGEMENT SYSTEM
109 . INVESTMENT STRATEGY ALIGNED TO OBJECTIVES
111 . DESCRIPTION OF RISK FACTORS
112 . EXTERNAL AND SECTOR RISKS
114 . STRATEGIC AND OPERATIONAL RISKS
118 . F INANCIAL RISKS
120 . DESCRIPTION OF OPPORTUNITIES
121 . GENERAL STATEMENT ON OPPORTUNITIES AND RISKS
122 . KEY FEATURES OF THE ACCOUNTING-RELATED
INTERNAL CONTROL AND RISK MANAGEMENT SYSTEM
(§ 289 (5) AND § 315 (2) NO. 5 GERMAN COMMERCIAL
CODE – HGB
124R E P O R T O N E X P E C T E D D E V E L O P M E N T S
125 . EXPECTED DEVELOPMENT OF
UNDERLYING CONDITIONS
126 . EXPECTED BUSINESS DEVELOPMENT
129 . GENERAL FORECAST
A N N U A L R E P O R T 2 0 1 3 / 1 4 5 3
CO
MB
INE
D M
AN
AG
EM
EN
T R
EP
OR
T

CO M B I N ED M A N AG EM EN T R EP O RT
B US I N E SS OV ERV I E W
Deutsche Beteiligungs AG (DBAG) ended the 2013/14 financial year posting consolidated net income of 47.8 million euros. The profitable realisation of the largest investment and the good progress the portfolio companies have made led to a very satisfactory net result of valuation and disposal. A significant contribution also came from fee income for management and advisory services to funds. Comprehensive income, after accounting for actuarial losses arising from pension obligations, reached 41.4 million euros.
The portfolio of DBAG is a young one. Two older investments were realised in 2013/14, and new investment of 20.0 million euros was channelled into new or existing investee businesses. Nearly three quarters of the portfolio value are now attributable to investments that were entered into in the past five financial years. They have excellent prospects for value growth and profitable realisations in the coming years.
In addition, DBAG’s net expense ratio recorded a considerable reduction on the prior year, resulting from higher fee income for management and advisory services to funds.
Sizable capital gains from realisations led to a profit for the year of 65.4 million euros for the Group’s parent company. Adjusted for the profit carried forward from the previous year and the dividend paid in March 2014, the retained profit totalled 92.3 million euros. From that amount, 2.00 euros per share have been recommended for distribution to shareholders, or a total of 27.4 million euros.
5 4 C O M B I N E D M A N A G E M E N T R E P O R T

T H E G RO U P A N D U N D ER LY I N G CO N D I T I O N S
S T RU C T U R E A N D BU S I N ES S AC T I V I T Y
Positioning: Listed private equity company
Deutsche Beteiligungs AG (DBAG) is a publicly listed private equity company domiciled in Frankfurt/Main. It raises closed-end private equity funds (“DBAG funds”) for investments in equity or equity-like financial instruments predominantly in non-quoted companies. Employing its own assets, it enters into investments as a co-investor alongside these private equity funds. Its investment focus as a co-investor and fund manager (“fund investment services”) is on German “Mittelstand” companies.
DBAG shares have been listed on the Frankfurt stock exchange since 1985. They are traded in the Prime Standard, the market segment with the highest transparency level, and are, among other things, a constituent of the S-Dax (national) as well as the LPX Direct and LPX Europe (international) indices. A stock market listing is exceptional for a private equity company: through the purchase of shares, it provides a unique opportunity for shareholders to profit both from fee income for investment services to funds as well as from earnings generated by a portfolio of unquoted companies.
Deutsche Beteiligungs AG is recognised as a special investment company as defined by German statutory legislation on special investment companies (Gesetz über Unternehmens-beteiligungsgesellschaften – UBGG) and is therefore exempt from municipal trade tax. Since 14 July 2014, it is also registered as an AIF management company in accordance with the German Investment Code (KAGB). The corporate structure is presented in the notes to the consolidated financial statements on pages 144 and 146.
Business model: Raising closed-end private equity funds and co-investing alongside these funds
Deutsche Beteiligungs AG invests alongside the DBAG funds in German “Mittelstand” companies. Its roots reach back to 1965, when Deutsche Beteiligungs GmbH (DBG), its predecessor firm, was founded. Since then, initially DBG and, since its founding in 1984, DBAG have entered into equity investments in more than 300 companies. From the very beginning, investments were (also) made through funds. At first, these funds exclusively bundled assets from its partnership or shareholder base; raised in 2002, the DBAG Fund IV was the first fund to which investors outside the group of shareholders committed capital.
DBAG funds are structured as closed-end private equity funds and invest on their own account. They bundle the assets of German and international institutions. These institutional investors – pension funds, funds of funds, banks, foundations, insurance companies or family offices – generally do not themselves hold direct investments in our target market.
List of subsidiaries and associates: Notes to the consolidated f inancial statements page 194
www.deutsche-beteiligung.de/corporate-governance/
Fund details: Notes to the consolidated f inancial statements page 182
A N N U A L R E P O R T 2 0 1 3 / 1 4 5 5
CO
MB
INE
D M
AN
AG
EM
EN
T R
EP
OR
T

DBAG and DBAG funds invest on the same terms in the same investee businesses and in the same instruments. To that end, DBAG has concluded co-investment agreements with the DBAG funds. The co-investment agreements provide for a fixed investment ratio over the entire life of a fund. The monitoring of investments and their disinvestment also take place in parallel.
Fund TargetStart of investment period ("vintage")
End of investment period Size Thereof DBAG
Investment ratio Fund : DBAG
DBAG Fund IV Buyouts September 2002 February 2007 €322mn €94mn 1:3.43 (29.2%)
DBAG Fund V Buyouts February 2007 February 2013 €539mn €105mn 1:5.14 (19.4%)
DBAG Expansion Capital Fund
Expansion financings May 2011 May 2017 €242mn €100mn 1:2.39 (41.8%)
DBAG Fund VI Buyouts February 2013 February 2018 €700mn1 €133mn 1:5.33 (18.8%)
1 Without the shares of the entity through which the members of the investment team invest (“carry entity”)
In the current and the coming three financial years, the co-investment agreements could trigger outflows of 199 million euros for DBAG, insofar as DBAG does not make use of its right of refraining from a co-investment.
At the end of the reporting period, DBAG had financial resources of 150.7 million euros available for investment. To fulfil the investment commitments, DBAG will also be able resort to proceeds from future disinvestments or raise loans, if appropriate.
Business activity: Fund management services (“investment services”) to DBAG funds and co-investments in industrial and services companies
Realisation of value creation from investments a major source of income
Within the scope of its activity for DBAG funds, Deutsche Beteiligungs AG seeks investments in healthy companies with good prospects for development and (co-)invests in these companies. It backs these companies for a period of usually four to seven years as a financial investor in a focused-partnership role. It pursues the objective of appreciating the value of the portfolio companies. Deutsche Beteiligungs AG realises that value upon a portfolio company’s ultimate disinvestment. The portfolio companies continue their development under a different constellation, for example, alongside an industrial partner, a new financial investor or as a quoted company.
The modes and specific structuring of investments are geared to individual financing situations. These could be
> a generational transition in a family-owned business,
> a capital requirement to fund a company’s growth
> split-offs of peripheral activities from large corporations, or
> a sale from the portfolio of another financial investor.
Investment criteria page 62
Risk arising from co-investment agreements page 116
5 6 C O M B I N E D M A N A G E M E N T R E P O R T

Depending on the individual situation, an investment can involve equity or equity-like instruments and taking either majority or minority positions. A generational transition, for example, will usually be structured as a management buyout (MBO). In an MBO, financial investors acquire a control interest; the respective management team will also take an equity stake. Split-offs of peripheral activities from large corporations or a sale from the portfolio of another financial investor (“secondary buyout”) are also usually structured as majority takeovers. Growth financings are made by way of a minority interest or by providing equity-like funding for businesses in the hands of families wishing to retain control over their companies.
Our investment performance is, first and foremost, based on proven private equity business processes. These include
> access to and assessment of transaction opportunities,
> an in-depth due-diligence process prior to making an investment,
> supporting the portfolio companies’ managements in implementing their corporate concepts by taking offices on advisory councils and supervisory boards,
> a disinvestment process that is well-timed and well-structured.
Investment services to DBAG funds as a source of income
Raising capital for DBAG funds is advantageous both for the Company and, consequently, for its shareholders, as well as for the investors in the fund. As a private equity company, DBAG is not permitted to take majority positions by itself; structuring management buyouts together with the DBAG funds is, however, possible. The fund investors can, in turn, be assured of a strong identity of interest that ensues from their fund adviser’s investment activity alongside the fund. The funds’ assets also create a substantially larger capital base, which enables diversifying the portfolio more broadly. In addition, DBAG earns fee income for management or advisory services to the funds, which serves to cover a large part of its operating costs.
Deutsche Beteiligungs AG provides management or advisory services to DBAG funds through two Group companies, both of which do not employ a staff of their own. Their business is discharged by DBAG or its staff.
DBG New Fund Management manages DBAG Fund IV (fully invested), whereas DBAG Fund V (also fully invested) and the DBAG Expansion Capital Fund are managed by DBG Managing Partner. This means that they take decisions on the acquisition and disposal of investments. DBAG Fund VI has its own management company with its place of business in Guernsey, Channel Islands; it is therefore exclusively advised by DBG Managing Partner.
Fee income from investment services to funds page 77
Consolidated DBAG group of companies: Notes to the consolidated financial statements page 144
A N N U A L R E P O R T 2 0 1 3 / 1 4 5 7
CO
MB
INE
D M
AN
AG
EM
EN
T R
EP
OR
T

The range of services provided by the management or advisory firms is broad: they seek, assess and structure investment opportunities, negotiate investment agreements, compile investment memoranda for all funds (and, for DBAG Fund IV, DBAG Fund V and the DBAG Expansion Capital Fund, take investment decisions), support the portfolio companies during the holding period and realise the funds’ portfolios. This range of services is referred to as “investment services to funds”, or “investment services” for short.
The fees for these investment services to funds are in line with the industry standard: the amount is volume-related. During the investment phase, fees are based on the capital committed by the fund investors. After that, they are measured by the historical cost of the recoverable investments remaining in the respective fund’s portfolio (DBAG Fund V, DBAG Fund IV, DBG Fonds III and DBG Fonds I).1 In that respect, fee income for investment services is at least partially linked to the portfolio companies’ value appreciation.
Portfolio profile: MBOs and expansion financings predominate
From 2000 to 2012, Deutsche Beteiligungs AG invested exclusively in MBOs. This evolved from a market environment in which expansion capital investments by private equity companies were less in demand. Today, the largest part of the portfolio 2, or 79 percent, is attributable to co-investments in eleven management buyouts. There were five expansion capital investments in the portfolio (15 percent of portfolio value) at the end of the period. Investments in three international buyout funds now account for a little less than six percent of the portfolio value; they consist of older investments that are gradually liquidated through the sale of the underlying portfolio companies.
Our track record confirms the success of our investment activity: since 1997, DBAG has sponsored 31 MBOs together with DBG Fonds III, DBAG Fund IV, DBAG Fund V and DBAG Fund VI. Of these investments, 21 have been realised completely or for the most part up to the end of this reporting year. Based on the realisations and the value of the current investments in the portfolio, these MBOs have generated 2.2 x the invested capital.3
Expansion capital investments are also attractive. These investments differ from MBOs in that, among other things, the companies’ debt level is mostly lower. The holding period for a minority expansion capital investment is usually longer. The rate of return is therefore generally lower than those for MBOs, whereas earnings in absolute terms are comparable.
Details on the portfolio page 83 ff.
1 DBAG Fund V is still invested in seven companies. DBAG Fund IV still holds one investment. DBG Fonds III and DBG Fonds I are of subordinate importance for the fund advisory business of DBAG.
2 All disclosures concerning the composition of the “portfolio” (also referred to as “portfolio value”) relate to the portfolio recognised in financial assets totalling 127.1 million euros and to loans receivable from portfolio companies of 25.9 million euros recognised in item “Loans and receivables” (note 19 and note 20); the value of this portfolio totals 153.1 million euros.
3 Considers 31 buyouts structured up to 30 September 2014.
5 8 C O M B I N E D M A N A G E M E N T R E P O R T

Organisational position: Large investment team
Deutsche Beteiligungs AG is relatively small in size, and hierarchic structures are lean. The Board of Management consists of three members, and the number of staff in the DBAG Group totalled 56. The largest entity is a team of 21 investment professionals.4 This team has a broad skill set combined with multifaceted experience in the investment business. A project team of two to four individuals is generally responsible for each transaction and is always supported by a member of the Board of Management.
Two of the three Board of Management members are intensively involved in transaction activities, meaning identifying transaction opportunities and supporting the portfolio companies during the holding period. These two Board of Management members are also members of the investment team. The support functions for the investment process, the administrative activities at DBAG, and the responsibility for investor relations are bundled under a Chief Financial Officer.
All staff are employed by Deutsche Beteiligungs AG and are located at the Company’s headquarters. This is conducive to communication and creates short decision-taking lines. DBAG is able to completely cover the entire investment process with its own resources. Efficient, well-attuned processes make it possible to quickly implement investment decisions as well as to regularly valuate the portfolio on a timely basis.
Balance sheet management: Financing via the stock market
DBAG finances itself exclusively through the stock market. Its balance sheet structure attests to the special nature of the private equity business with investments and realisations that are not schedulable. The Company maintains sufficient liquidity in order to take advantage of investment opportunities and meet co-investment commitments alongside the funds at any time. Loans are only taken up in exceptional cases and only to serve short-term liquidity requirements. For longer planning horizons, we manage the amount of equity capital via distributions, share repurchases (as in 2005, 2006 and 2007), or, if appropriate, capital increases (2004).
Co-investment commitments page 56
4 Without the members of the Board of Management
A N N U A L R E P O R T 2 0 1 3 / 1 4 5 9
CO
MB
INE
D M
AN
AG
EM
EN
T R
EP
OR
T

O B J EC T I V ES A N D S T R AT EG Y
Objective: To sustainably increase the value of DBAG by building the value of portfolio companies
The core BUSINESS OBJECTIVE is to sustainably increase the value of Deutsche Beteiligungs AG. DBAG reaches this objective in its role as an investor by rigidly implementing a strategy of “investing, developing and realising value growth”, as well as by providing fund management and advisory services.
Maschinen- und
Anlagenbau
Build the value of portfolio
companies
Automobil-zulieferung
Have shareholders participate in
performance through regular dividend,
if possible
Industrie-dienstleistung /
Logistik
Generate fee income
from investment services
Maschinen- und
Anlagenbau
Support promising mid-market
business models
Automobil-zulieferung
Garner esteem as an advisor of private equity
funds
Industrie-dienstleistung /
Logistik
Maintain and build on
our reputation in the private equity market
OBJECTIVES OF DEUTSCHE BETEIL IGUNGS AG
Financial objectives
Non-financial objectives
C O R E B U S I N E S S O B J E C T I V ESustainably increase the value of DBAG
6 0 C O M B I N E D M A N A G E M E N T R E P O R T

The value of DBAG is, first and foremost, determined by the value of the portfolio companies. To grow that value, DBAG supports the portfolio companies during a phase of strategic development in its role as a financial investor in a focused partnership. DBAG is invested in its portfolio companies for a mid- to long-term period, largely meaning a term of four to seven years. Value is built over that period and is mostly realised when the investment is exited. For expansion financings, the value growth is often partially realised during the holding period by way of current distributions. Investment decisions are based on assumptions concerning the holding period and realisable value gains upon an investment’s ultimate disposal. The targeted average annual internal rate of return (IRR) based on these assumptions is approximately 20 percent for expansion financings and 25 percent for MBOs.
A sustainable positive value contribution, which is appropriately acknowledged by the capital market, is also to come from the business of investment services to funds. Its performance is measured by sustainable growth in fee income for these services and the return achieved from the surplus in fee income over the relevant expenses.
As is common in the private equity sector, the measure for our performance is a period of ten years. Support for portfolio companies in their development is limited in time. This, and the influence of external factors on value growth could entail strong fluctuations in the performance of individual years. Only when viewed over a sufficiently long time span is it possible to assess whether we have reached the core financial objective of our business activities. We measure the performance contribution of an individual year by comparison with the median performance over a ten-year horizon. On the average of this ten-year period, we aim to increase the net asset value per share by an amount that significantly exceeds the cost of equity.
We intend to have our shareholders participate in that value appreciation by paying a regular dividend (base dividend) and – in instances of particularly profitable realisations – a surplus dividend. This dividend model is consistent with the irregular cash inflows of our private equity business. The total return to shareholders therefore derives from the gain in the Company’s value in terms of net asset value per share, plus dividends paid.
Besides its financial targets, Deutsche Beteiligungs AG also pursues a set of NON-FINANCIAL
OBJECTIVES. We aim to support the development of promising mid-market business models and therefore give our portfolio companies the leeway they need to successfully pursue their strategic development – with our equity as well as with our experience, knowledge and network. Our portfolio companies should remain well poised beyond DBAG’s investment period. We believe that the value of our investments at the time of their disposal will be particularly high, if the prospects for their further progress are favourable after we exit them.
Details on the return on net asset value per share page 88
A N N U A L R E P O R T 2 0 1 3 / 1 4 6 1
CO
MB
INE
D M
AN
AG
EM
EN
T R
EP
OR
T

A key aspect linked to an investment is to appropriately consider the interests of all stakeholders involved. By successfully supporting our portfolio companies, we want to substantiate the confidence we have gained in the market and among investors over nearly five decades and thereby maintain and underpin our good reputation. We are convinced that this also involves adhering to ESG (Environmental, Social and Governance) principles, which includes compliance with our business policies.
The assets of the DBAG funds constitute a substantial part of DBAG’s investment base. The funds are organised as closed-end funds; regularly raising successor funds is therefore a requirement. These efforts will only succeed if investors in these funds achieve commensurate returns and we are perceived to be reliable and trustworthy. We therefore attach great importance to open, responsible interaction with the partners (“limited partners”) in DBAG funds.
Strategy: Investments in German “Mittelstand” companies with exceptional potential for development
Broad spectrum of investment criteria
Deutsche Beteiligungs AG and its advised funds invest in companies with promising potential for development. That potential should enable the companies to augment their value, for example, by enhancing their strategic positioning, improving operational processes or by earnings growth. Such companies are, for instance, characterised by leadership positions in their (possibly small) markets, seasoned managements, strong innovative capacity and future-viable products.
Many such companies can be found in Germany’s “Mittelstand”, for example in mechanical engineering and plant construction, among automotive suppliers and industrial support services providers. DBAG’s investment team is particularly experienced in these sectors: about half of all transactions in the past 15 years stem from these particularly strong sectors of Germany’s “Mittelstand”. It follows that the investment team has in-depth expertise in these sectors. Based on this expertise, even complex transactions are conceivable in these core sectors, such as spin-offs from large corporations or conglomerates or mergers. In recent decades, other new sectors, such as telecommunication or services, have increasingly gained in significance. There are companies operating in such sectors that also meet DBAG’s investment criteria. Geographically, we concentrate our investments on companies domiciled in German-speaking countries.
Our stance on sustainability issues is also discussed as an aspect of corporate governance page 67
Financial and non-financial performance indicators page 88
6 2 C O M B I N E D M A N A G E M E N T R E P O R T

We consider a broad range of criteria when taking our investment decisions. We principally examine whether the products and services of potential investee businesses address the needs arising from changing economic and societal conditions. Our particular focus is on the following trends:
> efficient generation and utilisation of energy,
> stewardship of natural resources,
> the challenges of climate change,
> growing mobility,
> efforts to increase productivity and
> progressive industrialisation in emerging countries.
We concentrate on mid-market companies. This means that our portfolio companies typically generate annual revenues of between 50 million and 500 million euros. Depending on the sector, size and earnings performance, the debt-free enterprise value of such companies will generally range from 50 million to 250 million euros. This magnitude basically applies irrespective of the type of investment. Investments in smaller companies may also be considered, if there is potential for significant growth. Neither do we exclude larger transactions. If appropriate, we structure such investments together with other investors who pursue a similar investment strategy.
We endeavour to achieve a diversified portfolio. That way, we avoid cluster risks and increase the probability of sharing in numerous growth opportunities. We may invest in companies operating in the same industry, but we take care that the companies serve different niche markets or operate in different geographical regions. Most of our portfolio companies operate internationally. That applies to the markets they serve and, increasingly, to their production sites.
Many of our portfolio companies produce capital goods. The demand for these products is generally subject to stronger cyclical swings than the demand for consumer goods. When we enter into such investments, we see to it that, among other things, finance structures are resilient. Co-investments in companies whose performance is more strongly linked to consumer demand mitigate the effects of cyclical business models on the value of the portfolio.
Deutsche Beteiligungs AG invests in established companies with a proven business model. This approach excludes investments in early-stage companies. Moreover, we attach importance to the companies being led by seasoned and dedicated managements who are able to successfully realise the objectives that were mutually agreed.
A N N U A L R E P O R T 2 0 1 3 / 1 4 6 3
CO
MB
INE
D M
AN
AG
EM
EN
T R
EP
OR
T

Investment performance is prerequisite for growth in fund advisory business
Investors’ assets are only available for a limited period of time. Beyond that, once invested, the capital committed by investors – unlike assets from the balance sheet of DBAG – cannot be invested another time: following a realisation, the capital is returned to investors. To ensure continuity in the fund advisory business, new funds must therefore be raised at regular intervals.
Our aim is to have a successor fund exceed the size of its predecessor. That way, total managed and advised assets will grow on a several-year average and with that the basis for fee income from investment services to funds.
Capital commitments to a (successor) fund are significantly influenced by the performance of a current fund. Thus, a prerequisite for an increase in managed and advised assets is, among other things, an excellent track record. Investors also value the investment team’s experience,
size and network.
S T EER I N G A N D CO N T RO L
Key performance mark: Return on net asset value
Our business policy is geared to appreciating the value of DBAG over the long term by successful investments in portfolio companies and a successful fund advisory business. It follows from the nature of the business and the financial accounting methodology that the Company’s value may decrease in individual years. The Company’s value is largely determined by the fair value of the portfolio companies at the end of a reporting period; that value is subject to influences beyond DBAG’s control, such as those from the stock market. The Company’s value is understood to have increased over the long term when, on an average of, for example, ten years, the return on net asset value per share exceeds the cost of equity. The key performance mark is the return on net asset value.
We determine the return on net asset value by comparing the NAV per share at the close of the financial year with the opening NAV per share, less dividends, at the onset of the financial year. To that end, we use the net asset value as stated in the consolidated financial statements, which are drawn up in compliance with the International Financial Reporting Standards (IFRS).
We derive the cost of equity (rEK) based on the capital asset pricing model (CAPM) from a risk-free base rate (rf) and a risk premium for the entrepreneurial risk (ß). We determine the risk premium by also considering a risk premium for the stock market (rM) as well as DBAG’s individual risk. The cost of equity is then derived as follows: rEK = rf + ß * rM.
6 4 C O M B I N E D M A N A G E M E N T R E P O R T
We derive the risk-free base rate from a zero bond interest rate with a residual term of 30 years, based on the yield curve at the reporting date. At 31 October 2014, this value was 2.0 percent (previous year: 2.5 percent).
The market risk premium used was an unchanged 7.0 percent.
For the individual risk measure we use an adjusted ß (beta) of 0.5. This value is based on the most recently utilisable observable levered beta factor for Deutsche Beteiligungs AG of 0.60 (at 31 October 2012; all subsequent values are not applicable due to the low liquidity of the shares). Since the ratio of (safe) financial resources to (risk-exposed) portfolio has since shifted in favour of financial resources, a discount of 0.10 is applied to the value of 0.60.
Inserting the three input factors in the formula, we arrive at a cost of equity for DBAG of 5.5 percent as at the most recent reporting date (previous year: 8.1 percent). This calculatory result is strongly influenced by the historically low interest rate level and the low risk position of DBAG on the reporting date following its recent profitable realisations. This is set against what we believe are shareholders’ expectations of sustainably stable returns. In measuring our business performance, we will therefore use, unchanged, an alternative return of eight percent for the time being as a basis, instead of the arithmetically calculated cost of equity. We will, however, continue to monitor the developments in capital market data and adjust the cost of equity, if appropriate.
Controlling: Regular assessment of portfolio companies and of investment performance of DBAG funds
Mid-term performance of portfolio is key measure
The intrinsic value of our shares is determined to a significant degree by the value of the investment portfolio and its development. Valuations may be subject to considerable fluctuations at short notice. The reasons are the portfolio companies’ susceptibility to industry-related cycles and valuation ratios in the stock markets. Short-term changes therefore ordinarily do not convey a true picture of the success of an investment. We will frequently only know whether a private equity investment can actually be termed successful after a number of years, upon its disposal. We therefore measure our performance by the average return on net asset value per share over a longer horizon, and not by the results of a single financial year.
Because of the particularities of our business activity, we do not steer the business of DBAG by traditional annual indicators such as EBIT or profitability. The key influential parameter at Group level is the medium-term performance of the portfolio or of an individual investment.
Details on the return on net asset value page 88
A N N U A L R E P O R T 2 0 1 3 / 1 4 6 5
CO
MB
INE
D M
AN
AG
EM
EN
T R
EP
OR
T

At the portfolio company level, traditional indicators, however, play a direct role: when taking our decision to invest, we clearly define performance targets based on the business plans developed by the portfolio companies’ managements – such as for revenues, profitability and debt. During the time of our investment, we valuate our portfolio companies at quarterly intervals using their current financial metrics (EBITDA, EBITA and net debt). Based on these monthly or quarterly reports, we closely follow the business trend in each portfolio company in a year-over-year and current budget comparison. We also consider other indicators, such as order intake and orders on hand.
The members of the Board of Management and investment professionals of Deutsche Beteiligungs AG regularly inform themselves about operational, financial and strategic developments at our portfolio companies through their work on advisory councils and supervisory bodies. They do so in keeping with the principles of good corporate governance.
Assessment of DBAG funds by commonly used indicators in the private equity industry
The success of DBAG funds is based on the investment performance. We measure it by indicators that are commonly used in the private equity industry. These include the relationship between the portfolio value or the relationship between distributions to investors and the capital called as well as the return on the capital called, determined by the internal rate of return method.
Ensuring performance: Board of Management members directly involved in all relevant operating processes
The members of the Board of Management are personally involved in the core processes of business operations at Deutsche Beteiligungs AG (i.e. investment management and fund advisory services). In their fund investment services, they specifically take decisions in conjunction with generating investment opportunities (deal flow) and with analysing (due diligence) or negotiating acquisitions and disinvestments. Additionally, they discuss key issues at weekly meetings with those members of the investment team who are involved in transactions or in supporting the portfolio companies. The members of the Board of Management take joint decisions on co-investments that DBAG enters into with the DBAG funds.
A key instrument in ensuring performance is the risk management system. It addresses exposure to both operational risk and to risk inherent in the portfolio companies’ development. The insight gained from the risk management system is discussed on a continual basis in the meetings on the state of the portfolio companies.
Opportunity and risk management page 108
6 6 C O M B I N E D M A N A G E M E N T R E P O R T

SU S TA I N A B I L I T Y
Deutsche Beteiligungs AG has committed to sustainable corporate governance and meets high ESG standards. We take our guidance from our firm belief that development can only be termed sustainable when it meets the needs of the present without compromising the ability of future generations to meet their own needs.5 As a private equity company, this commitment encompasses both the integration of the principles of responsible investment in our investment process as well as corporate governance issues. Through our engagement on advisory councils and supervisory boards, our efforts are also directed towards helping our portfolio companies pursue sustainable corporate governance goals. We have set out our sustainability principles in an ESG guideline.
At DBAG, our focus regarding sustainability is on the following issues:
> Environmental: minimisation of greenhouse gas emissions and high levels of resource efficiency;
> Employment and social affairs: we acknowledge that our employees are our most important resource;
> Corporate governance: we commit to the highest standards in corporate governance.
In practice, this means that we consciously reduce business travel to a necessary minimum and, instead, use alternative forms of communication to the extent possible. Our offices comply with the most modern environmental standards in respect of ventilation and air conditioning, heating and illumination. We report in detail on greenhouse gas emissions on an annual basis within the scope of the Carbon Disclosure Project.
The protection of our employees’ health and maintenance of a discrimination-free workplace are key priority issues for us. In relation to the size of our Company, our engagement in training and education is very much above average.
The Board of Management and the Supervisory Board have always committed to responsible, transparent and sustainable value creation. Since its introduction, we have consistently followed nearly all of the recommendations and suggestions of the “German Corporate Governance Code” and have therefore subjected ourselves to the rules of good fiduciary corporate governance and surveillance. In respect of the currently valid Code, DBAG declared that there are no discrepancies.
In our ESG guidelines, we have set out that all potential investments must also be analysed by ESG criteria. Investments in certain sectors and companies, in particular the armament industry, are excluded from the outset. Moreover, we do not engage in unfriendly takeovers. In the due-diligence process, we examine opportunities and risks linked to compliance or non-compliance with ESG criteria. There are special compliance rules in effect for the investment process itself, that is, for our conduct in transaction situations.
Non-financial performance indicators – Sustainability page 92
Further regulatory information and commentary page 101
5 As defined in the United Nations report dated 1987 “Report of the World Commission on Environment and Development” (“Brundtland Report”)
A N N U A L R E P O R T 2 0 1 3 / 1 4 6 7
CO
MB
INE
D M
AN
AG
EM
EN
T R
EP
OR
T

Increasing DBAG’s value depends on the extent to which we succeed in augmenting the value of our portfolio companies. Ways to achieve this could extend to a company investing in research and development and strengthening its competitiveness through innovation. That, however, also implies a motivated staff and a high degree of acceptance among customers and suppliers. In short, the company must act in conformity with its social environment. We therefore attach great significance to our portfolio companies respecting social and ethical principles and minimising negative effects on nature. We are convinced that companies that uphold high ESG standards are managed better, are exposed to lower business risks and, ultimately, create more value.
Since every portfolio company is governed by very individual internal and external factors, the following ESG criteria may vary as to their relevance. Due to the allocation of roles between our portfolio companies and DBAG, we exert a direct influence only in respect of selecting an investment. During the holding period, we have an indirect influence by taking offices on advisory councils and supervisory boards. We focus on the following ESG criteria:
> Environment: minimisation and professional management of negative effects on nature;
> Employment and social affairs: furtherance of good work conditions, high social standards and provision of a positive contribution to society;
> Corporate governance and business ethics: maintenance of best-possible standards and furtherance of good business practices.
6 8 C O M B I N E D M A N A G E M E N T R E P O R T

B US I N E SS R E V I E W O F T H E G RO U P
M AC RO ECO N O M I C A N D S EC TO R - R EL AT ED U N D ER LY I N G CO N D I T I O N S
Real economy: Business dynamism has eased
The underlying macroeconomic conditions have softened in the past financial year. This is evidenced, for example, by the 2014 growth forecast for the German economy. It was corrected downward in the course of the year: the German Council of Economic Experts adjusted its forecast on the growth of the gross domestic product for 2014 from 1.9 percent in March to 1.2 percent (November 2014); the German government and the International Monetary Fund corrected their forecasts to a similar extent.6 According to the economic experts, the damper for the German economy was, it seems, primarily triggered by higher geopolitical risk and the unfavourable economic trend in major member states of the eurozone. The expected uptrend in investment in machinery and equipment failed to take place, despite very favourable financing terms, whereas the consumer climate in Germany largely remained stable.
Of greater importance than the factors mentioned above for our portfolio companies’ business performance, however, is the economic trend in the eurozone and in key emerging markets such as China, India or Brazil, as well as in the United States. Apart from the United States and Great Britain, expectations for the year in these economic regions were not fulfilled either. In the emerging countries, the business slowdown of 2013 continued in the first half of the year 2014. In some economies – such as Brazil – production even receded in the first half of the year. Expenditures on machinery and equipment remained below those of recent periods. In other emerging economies, the slowdown in growth was stronger than anticipated, due to country-specific factors, not least the crisis in Eastern Europe.
Financial markets: No major change
There was no fundamental change in the financial markets in 2014. The European Central Bank, however, continued to drive its low-interest-rate policy in 2014. The average interest rate for new loans to the corporate sector in the eurozone has dropped since the key rate was lowered from 0.5 percent in early November 2013 to 0.05 percent, or more than half a percentage point. In spite of this, the weakness of the banking system in key European economies leads banks to show restraint in granting loans, which has consequences for the real economy. In the US, an interest rate rise is on the agenda, but has not yet been implemented. In a number of emerging countries (Brazil, India, Russia) higher interest rates in 2014 have softened demand. A restrictive lending policy impedes industry in making capital expenditures and impacts those portfolio companies that manufacture capital goods.
6 “More confidence in market processes – Annual Economic Report 2014/15”, German Council of Economic Experts, Wiesbaden, November 2014; 2014 Spring and Autumn Projections by the German Government, Federal Ministry for Economic Affairs and Energy, Berlin, April / October 2014; World Economic Outlook, International Monetary Fund, New York, January / October 2014
A N N U A L R E P O R T 2 0 1 3 / 1 4 6 9
CO
MB
INE
D M
AN
AG
EM
EN
T R
EP
OR
T

The financing that private equity companies require to structure MBOs is, on the other hand, amply available at attractive terms.
Currency rates: Negative impact on performance
Exchange rate swings affect our business both directly and indirectly: a part of the investments we entered into are denominated in US dollars (IFRS value at 31 October 2014: 19.4 million euros; previous year: 24.0 million euros), meaning that changes in exchange rates are directly reflected in the net result of valuation. The value of the US dollar against the euro increased by 8.4 percent between the two reporting dates. The investments denominated in US dollars therefore gained 1.5 million euros in value. In 2012/13, the currency rate had a negative effect of 1.2 million euros.
However, in 2013/14 we also recorded negative effects which arose from the currency weakness in major emerging markets. Portfolio companies operate production facilities in Brazil and Turkey. Income generated there led to lower profit contributions on a euro basis, due to devaluation of the local currencies. Beyond that, weaker local currencies dampen the demand for capital goods that are manufactured at the portfolio companies’ German sites. The negative impact of currency parities on the portfolio value exceeded those on the positive side this past financial year.
Private equity market in 2014: Competition more intense
Deutsche Beteiligungs AG pursues a highly focused investment strategy in respect of business models, company size and sectors. We focus on the mid-market segment in German-speaking regions, that is, on transactions with a value of 50 to 250 million euros. Measured by the number of transactions and investment volume, this encompasses a rather small section of the private equity market. It is therefore difficult to relate general statements on the private equity market in Germany 7 to the activities in our segment of the market, or deduce consequences from it for specific business opportunities. When a company is up for sale it has frequently not been decided whether the new owner is to be a strategic buyer or a financial investor. For that reason, we not only consider the market for private equity transactions, but also the M&A market as a whole.
7 Private equity transactions are not recorded separately in the official statistics. Information on market trends is therefore largely derived from reports by industry associations or by market participants, which revert to data provided by members or generally accessible information. Source: BVK data – “Der deutsche Beteiligungsmarkt im 1. Halbjahr 2014”, Tab. 1, page 6; Bundesverband deutscher Kapitalbeteiligungsgesellschaften / German Private Equity and Venture Capital Association (BVK), Berlin, August 2014
7 0 C O M B I N E D M A N A G E M E N T R E P O R T

Private equity transactions
Strategic transactions
M&A MARKET GERMANY – TRANSACTION VALUE
€bn
2009 H1 2009 H2 2010 H1 2010 H2 2011 H1 2011 H2 2012 H1 2012 H2 2013 H1 2013 H2 2014 H1
2.86.2 5.0
15.2
0.9
11.7
2.5
14.8
4.3
21.4
1.2
5.98.3
13.7
5.4
17.6
9.4
23.9
3.75.6
16.9
35.2
The M&A market grew in both of the past two years. Financial investors, however, have not profited in that growth.8 Trade buyers have robust balance sheets and are increasingly employing their assets for acquisitions. Furthermore, in view of current low interest rate levels additional players in the M&A market have intensified the competition for attractive companies. Among these are foundations and family offices that manage the assets of a single or several families. The volume of the M&A market in which financial investors contend has been stable since 2012.
In our opinion, a key driver of the transaction activity in the private equity business is still the available liquidity: firstly, private equity funds have received huge streams of capital commit-ments and must now invest these assets. And secondly, there is a sufficient supply of acquisition finance available. These huge assets seeking investment stand in contrast to a limited supply of investment opportunities. As a consequence, valuations particularly for well-positioned compa-nies have increased consistently. Accepting these high valuations on a historical comparison is easier for strategic buyers, who can include gains from synergies in their return considerations.
The number of investment opportunities which we can attend to has remained stable on a high level. The proportion of investment opportunities in our core sectors – that is, in mechanical engineering and plant construction, automotive suppliers and industrial support services – has remained constant at nearly 50 percent.
8 Source: “Der Transaktionsmarkt in Deutschland, 1. Halbjahr 2014”, Ernst & Young, July 2014
Trend in transaction opportunities page 92
A N N U A L R E P O R T 2 0 1 3 / 1 4 7 1
CO
MB
INE
D M
AN
AG
EM
EN
T R
EP
OR
T

BU S I N ES S A N D P O R T F O L I O R E V I E W
Portfolio movement: One new management buyout and add-on acquisitions by portfolio companies
DBAG entered into a new investment this past financial year: we structured the management buyout of the bakery chain “UNSER HEIMATBÄCKER”, the second investment by DBAG Fund VI. We also increased our stake in an existing investment (INEXIO), supported portfolio companies in making add-on acquisitions of smaller companies (ROMACO, UNSER HEIMATBÄCKER) and met obligations arising from expansion capital agreements (INEXIO, DNS:NET).
We very successfully exited two investments (HOMAG GROUP AG, DR. VOGLER), following exceptionally long holding periods.
The investment in HOMAG GROUP AG was, measured by the historical cost and the portfolio value, the largest investment by far in our portfolio. It was also one of the oldest engagements: the initial investment, a minority stake, dates back to 1997. DBAG supported this mechanical engineering company’s rapid expansion and backed profitability improvement programmes. The objective was to lead Homag to an initial public offering, with the effect of settling the succession issue in the family-owned business. In autumn of 2006, we agreed to increase our investment: DBAG, DBAG Fund IV and DBAG Fund V acquired the majority. The IPO of Homag Group AG in July 2007 enabled a partial realisation of the investment, the proceeds of which significantly exceeded the invested capital.
With the divestment of the remaining Homag shares in July 2014, we reached all of our objectives: in agreement with the second-largest shareholder, we identified a globally operating industrial company with strong regional roots as the buyer who we believe can provide an ideal platform for Homag to continue the excellent progress it has made following its successful realignment in recent years and achieve its growth objectives. Moreover, as was the case with all recent major divestments, we again found a strategic buyer who was willing to pay a premium on the market value. We therefore ended our long-standing investment, earning an attractive return: adding the present proceeds to those achieved from Homag’s initial public offering in July 2007 and the dividends received since 1997, the investment will have returned a money multiple of 3.5 x. That means total proceeds are 2.5 times greater than the historical cost.
The year 1975 marked the beginning of the investment in DR. VOGLER GMBH & CO. KG , a regional automotive dealership operating eight locations in the greater Rhine-Main area. Effective 1 October 2014, we divested 94 percent of the silent holding in this company and 94 percent of the limited partner’s share which we manage for DBG Fonds I, an older DBAG fund. DBAG regularly received distributions over the past decades. Most recently, DBAG had a 51-percent share in the company’s economic performance and the fund a share of just over 18 percent. Added to that are the proceeds we have now received from the realisation of this investment, which was one of the smaller ones in the portfolio.
The economic outcome of the transaction is described in Earnings position – Net result of valuation and disposal page 75
7 2 C O M B I N E D M A N A G E M E N T R E P O R T

DBAG has been invested in Unser Heimatbäcker GmbH (“UNSER HEIMATBÄCKER”) since June 2014. Measured by the number of outlets, the company is among the ten largest bakery chains in Germany. With some 360 outlets, 2,300 employees and annual revenues of 99 million euros (2013), it was initially formed through the merger of several bakery chains. Backed by DBAG, the company intends to play a proactive role in the bakery sector’s consolidation. A first move was the acquisition of a smaller bakery group shortly after the onset of our investment, which the company’s shareholders financed.
INVESTMENT IN THE PORTFOLIO
€mn
50
40
30
20
10
02004/05 2005/06 2006/07 2007/08 2008/09 2009/10 2010/11 2011/12 2012 / 13 2013 / 14
24.1 21.7
40.7
14.5
4.38.2 9.4
21.6
41.7
20.0
In 2013/14, DBAG initiated investment decisions on more than 92 million euros – 20.0 million from its own balance sheet and approximately another 72 million euros from investors’ commitments to funds.
As a result of the investment restraint in the financial crisis years (2008 to 2011), DBAG’s portfolio is currently a young one. At the end of the reporting period, 72 percent of the portfolio value was attributable to investments that had been in the portfolio for less than five years at that time (previous year: 42 percent).
VINTAGE PROFILE OF PORTFOLIO
Number of investments
Cost (¤mn)
IFRS value (¤mn)
IFRS value (%)
< 2 years 8 53.9 67.4 44.1
2 to 5 years 4 33.0 42.6 27.8
> 5 years 7 18.7 35.9 23.5
Other 1 14.3 7.1 4.7
Total 19 119.9 153.1
1 Value of remaining parts of exited investments (retentions for representations and warranties, etc.)
A N N U A L R E P O R T 2 0 1 3 / 1 4 7 3
CO
MB
INE
D M
AN
AG
EM
EN
T R
EP
OR
T

Fundraising: Funds in first half of investment phase
In 2011, we raised a fund for minority investments in family-owned businesses in the form of growth capital (DBAG Expansion Capital Fund) and in 2012 a fund for buyouts (DBAG Fund VI). The funds still have more than two and three years, respectively, in their investment periods ahead of them; thus, there was no need for fundraising activity this past financial year. Total advised assets 9 amounted to 1.3 billion euros at the reporting date, of which 153.1 million euros were attributable to the consolidated balance sheet of the DBAG Group and 199.1 million euros to undrawn capital commitments by DBAG.
Shares: Considerable advance in market price
DBAG shares outpaced their benchmark indices in 2013/14. Driven by a strong uptrend at the start of the financial year, they reached their highest price point in January 2014, closing at 22.82 euros in Xetra trading. The Xetra year-end closing rate on 31 October 2014 of 21.83 euros represents a gain of 12.8 percent compared with the year before (31 October 2013).
In March 2014, a dividend of 0.40 euros per share and a surplus dividend of 0.80 euros per share, or a total of 16.4 million euros, were paid for financial year 2012/13. This corresponds to a dividend yield of 6.6 percent based on the opening net asset value per share at the beginning of financial year 2012/13, or of 6.2 percent measured by the annual closing rate of that financial year. The share price movement and dividend payment add up to a total return for DBAG shareholders of 19.5 percent over the financial year. In comparison with benchmark indices and over different periods, share performance is as follows:
SHARE PERFORMANCE ( p . a . , % ) OVER …
DBAG shares Dax S-Dax LPX Direct 1
1 year (financial year 2013/14) 19.5 3.2 0.0 8.5
3 years (financial years 2011/12 to 2013/14) 18.9 16.9 14.4 20.2
5 years (financial years 2009/10 to 2013/14) 13.7 11.4 14.4 16.3
10 years (financial years 2004/05 to 2013/14) 16.2 8.8 8.5 5.7
1 LPX Direct: index of 30 international listed private equity companies that, like DBAG, enter into direct investments
9 Sum of invested capital of DBAG funds and of DBAG as well as outstanding capital commitments
7 4 C O M B I N E D M A N A G E M E N T R E P O R T

E A R N I N G S P O S I T I O N
Overall assessment: Consolidated net income clearly up after profitable exits
The consolidated net income of 47.8 million euros in financial year 2013/14, following net income of 32.3 million euros in the previous year, primarily stems from a very satisfactory net result of valuation and disposal of financial assets and loans and receivables (net result of valuation and disposal), which reached 50.3 million euros, compared with the prior year’s 34.5 million euros (before minority interest). Almost 60 percent of the net result of valuation and disposal comes from disposals of financial assets; value movements on financial assets and loans and receivables over the course of the year account for some 40 percent. In 2012/13, the net result of valuation and disposal was strongly driven by the rise in the market value of the investment in Homag Group AG.
The gain in the net result of fund services and investment activity (76.2 million euros; previous year: 59.9 million euros) also reflects higher fee income from fund management and advisory services. The net expense ratio, that is, the net amount of income from fund management and advisory services and total other income/expenses adjusted for special effects 10, was 0.7 percent, which is clearly down on the previous year’s 2.5 percent. Other income/expenses is largely composed of the expenses for the management of our portfolio and for management and advisory services to DBAG funds.
Net result of valuation and disposal: Greatest contribution from profitable realisations
The NET RESULT OF VALUATION AND DISPOSAL , which was 50.3 million euros (previous year: 34.5 million euros), is the largest constituent in the net result of fund services and investment activity. It is composed of valuation movements totalling 21.3 million euros (previous year: 29.1 million euros) and net disposals of 28.9 million euros (previous year: 5.4 million euros).
Homag Group AG delivered 24.6 million euros, the largest single contribution towards the net result of the valuation and disposal. That is the amount by which the net sales proceeds exceeded the valuation of this investment at the start of the financial year. The divestment of automotive dealership Dr. Vogler and reversals of warranty retentions from former divestments contributed 4.4 million euros towards the net result of disposal.
The value of the carried portfolio (net result of valuation) exceeds the previous year’s amount by 21.6 million euros. The gain stems from those investments that were in the portfolio during the entire financial year. Investments that have been held for less than one year are carried at transaction cost, which is deemed to be the best estimate of their fair value, preventing them from contributing towards a value gain over that period of time.11 On the back of a favourable business trend, most portfolio companies delivered a positive value contribution in 2013/14: at the valuation date, nearly all portfolio companies had forecast higher earnings and lower debt
10 Remuneration components linked to performance11 Applies at the reporting date to investment in Unser Heimatbäcker; also, three other older investments,
all of which are small, are carried at amortised cost.
A N N U A L R E P O R T 2 0 1 3 / 1 4 7 5
CO
MB
INE
D M
AN
AG
EM
EN
T R
EP
OR
T

for 2014 as compared with the preceding year; frequently, budgets were surpassed. When in singular cases 2014 revenues and earnings fell short of the previous year’s or budgeted levels, market influences were responsible, which we do not consider as being permanent or which would endanger the strategic positioning of the portfolio company in question.
< 6.0 x
6.0 to 8.0 x
≥ 8.0 x
PORTFOLIO VALUE BY UNDERLYING EBITDA MULTIPLES
%
24.6 15.7
59.7
1 Contributions to income of €1.7mn from receipt of purchase price components initially retained relating to disinvestments of past financial years are recognised in “Other”. See notes to the financial statements, “Other current assets”, page 161.
NET RESULT OF VALUATION AND DISPOSAL (BY SOURCES)
¤mn 2013/14 2012/13
Valuation of unquoted invest-ments (multiples method)
Change in earnings 8.0 1.0
Change in multiples 8.2 2.9
Change in debt 2.4 0.4
Change in exchange rates 1.1 (1.2)
Positive value movement due to Homag share price 0.0 23.6
Net result of disposal 1 27.2 5.4
Other 3.4 2.4
50.3 34.5
NET RESULT OF VALUATION AND DISPOSAL (BY COMPONENTS)
¤mn 2013/14 2012/13
Positive valuation movement
Share price movement Homag 0.0 23.6
Other positive valuation movements 27.7 9.4
Negative valuation movements (6.0) (1.7)
Net result of disposal 1 27.2 5.4
Other 1.4 (2.2)
50.3 34.5
Movements in stock market multiples had a positive value effect in net terms: whereas the EBITDA multiple for a peer group of mechanical engineering companies declined from 7.7 x in the previous year to 7.3 x, the multiples for peer groups of other sectors were higher than at the preceding valuation date, or than those used in the transaction price.
7 6 C O M B I N E D M A N A G E M E N T R E P O R T

Current income from financial assets: Higher interest entitlements on shareholder loans
In 2013/14, we achieved CURRENT INCOME FROM FINANCIAL ASSETS AND LOANS AND
RECEIVABLES totalling 4.2 million euros, down 2.3 million euros on the previous year (6.5 million euros). In the preceding year, this item was distorted by a special effect of 4.3 million euros. A company through which profit entitlements from investments by a fund company of DBAG Fund IV are settled paid a distribution in 2012/13. This distribution (positive effect on income) led to current income of 4.3 million euros, but concurrently to a distribution-related write-down on this company (negative effect on income) of 2.2 million euros. Profit distributions from the portfolio (dividends, among other things) in 2013/14 reached 2.2 million euros (previous year: 2.1 million euros). Interest entitlements arising from shareholder loans granted within the scope of acquisition financing in the previous and reporting year totalled nearly 1.6 million euros in 2013/14 (previous year: 0.2 million euros).
Fee income from fund management and advisory services: Increased through new buyout fund
FEE INCOME FROM FUND MANAGEMENT AND ADVISORY SERVICES amounted to 21.7 million euros (previous year: 18.9 million euros). The increase in 2013/14 is due to the fact that we received fees for advisory services to DBAG Fund VI for a full year for the first time; the previous year only saw fee income from this fund starting with the onset of its investment period in February 2013. We also received a performance-related payment (1.2 million euros) from an older DBAG fund; this is a non-regularly recurrent special effect. Conversely, management fee income from DBAG Fund V declined further, as scheduled. Management fees from the DBAG Expansion Capital Fund also decreased: in view of the delayed investment progress, we reached an agreement with the investors to prolong the investment period and to lower management fees.
Management fee income
Advisory fee income
FEE INCOME FROM FUND MANAGEMENT AND ADVISORY SERVICES
€mn
25
20
15
10
5
02004/05 2005/06 2006/07 2007/08 2008/09 2009/10 2010/11 2011/12 2012 / 13 2013 / 14
6.6 5.6 7.2 12.6 11.1 11.0 11.0 11.7
9.6
9.3
13.5
8.2
A N N U A L R E P O R T 2 0 1 3 / 1 4 7 7
CO
MB
INE
D M
AN
AG
EM
EN
T R
EP
OR
T
Fee income from management and advisory services to funds generally depends on the size of the DBAG fund; performance-related components are only paid by DBG Fonds I. Fee income declines along with every exit from the portfolio, insofar as the fund’s investment period has ended. An increase in fee income can only be expected when a new DBAG fund is raised, if the size of that follow-on fund is greater than the current investing fund.
Movement in Other income/expenses
PERSONNEL EXPENSES in 2013/14 increased to 16.5 million euros, up 2.7 million euros on the previous year’s 13.8 million euros. Two constituents of this item changed significantly compared with the preceding year. The reduction in the number of Board of Management members led to a decline in fixed emoluments. However, following profitable realisations, expenses for emoluments linked to investment performance were considerably higher. Provisions of 4.2 million euros were made for this in 2013/14, compared with 0.1 million euros the year before.
Additionally, in view of this year’s improved result compared with that of the previous year, provisions for variable income components linked to the Company’s general performance were also higher (4.6 million euros, following 3.5 million euros in the prior year).
OTHER OPERATING INCOME , totalling 9.8 million euros, was up on the previous year’s 5.7 million euros. The largest part of this item, or 7.6 million euros, relates to reimbursed costs for screening investment opportunities; DBAG, in its management and advisory capacity, can charge these costs to DBAG funds. Proportionate to their investment ratio, DBAG funds carry a part of the expenses for screening those investments that do not terminate in a transaction. Reimbursed costs increased by 3.5 million euros on the prior year. 1.1 million euros are attributable to value-added tax refunds for previous years. In 2012/13, there were no such refunds.
The costs for screening investment opportunities are, in turn, the largest item in OTHER
OPERATING EXPENSES (21.2 million euros, previous year: 18.2 million euros). Transaction-related consultancy and screening costs – which are partially reimbursable by DBAG funds – were 10.9 million euros, an increase of 3.8 million euros on the previous year (7.1 million euros); the difference largely explains the rise in Other operating expenses. The second-largest position under this heading is the management fee that DBAG pays for its co-investment share in DBAG Fund VI. This fee was charged for a full year for the first time and therefore exceeded the previous year’s 1.9 million euros; that amount is contained in fee income from fund management and advisory services. The other major components remained constant for the most part: general consultancy costs again amounted to 1.4 million euros, and office rental to 1.1 million euros, compared with 1.0 million euros last year. Other operating expenses also include numerous smaller positions pertaining to costs incurred in the ordinary course of business.
Determination of performance-linked remuneration pages 91 and 101
Fee income from fund manage -ment and advisory services page 57
7 8 C O M B I N E D M A N A G E M E N T R E P O R T

NET INTEREST mirrors another deterioration in interest rates for low-risk investment vehicles. At 0.3 million euros, it remained low (previous year: 0.1 million euros). INTEREST INCOME reached 0.4 million euros (previous year: 0.9 million euros). Contributing towards the decline was lower interest on investment in securities (down by 0.1 million euros compared with 2012/13). The difference, however, is chiefly attributable to a one-off effect: in the previous year, 0.4 million euros related to an erroneous tax refund that was corrected in the same financial year. Correspondingly, this largely explains the change in INTEREST EXPENSES of 0.6 million euros (0.2 million euros in financial year 2013/14; previous year: 0.8 million euros). Interest expenses were relieved by another 0.3 million euros due to higher expected interest income on plan assets. Conversely, however, this is set against a loss in a comparable amount charged to Other comprehensive income. The reason is a change in the accounting method.
TEN-YEAR SUMMARY OF EARNINGS
¤mn 2004/05 2005/06 2006/07 2007/08 2008/09 2009/10 2010/11 2011/12 2012/13 2013/14
Net result of investment activity 1 51.8 114.4 165.0 (53.4) 31.8 53.2 (4.5) 51.3 41.0 54.5
Other income / expenses 2 (6.4) (23.5) (9.3) (1.9) (9.4) (15.5) (15.4) (4.0) (7.3) (6.0)
EBIT 41.6 89.1 150.8 (60.5) 20.4 36.8 (23.0) 46.2 33.6 48.2
EBT 42.3 90.9 155.6 (55.3) 22.4 37.6 (19.9) 47.0 33.8 48.5
Consolidated net income 41.3 82.7 136.5 (51.1) 19.6 34.1 (16.6) 44.5 32.3 47.8
Other comprehensive income 3 (2.3) (3.3) 0.7 (6.2) (3.7) (6.4)
Total comprehensive income 17.3 30.8 (15.9) 38.3 28.6 41.4
Consolidated retained profit 35.5 57.2 118.2 29.2 52.6 73.1 37.3 70.8 86.7 118.1
Return on NAV per share % 20.0 36.4 56.2 (17.5) 7.3 12.7 (6.2) 16.7 11.5 15.8
1 Net result of valuation and disposal as well as current income from financial assets
2 Net amount of other income and expense items; up to and including FY 2007/08 “Other comprehensive income”, starting FY 2012/13 incl. income from fund management and advisory services
3 Since FY 2009/10, actuarial gains / losses on pension obligations / plan assets are taken directly to equity through “Other comprehensive income“.
A N N U A L R E P O R T 2 0 1 3 / 1 4 7 9
CO
MB
INE
D M
AN
AG
EM
EN
T R
EP
OR
T

F I N A N C I A L P O S I T I O N
Overall assessment: Sound financial position enhances scope
The Group, in our view, continues to boast a sound financial position. Its financial resources (cash and interest-bearing securities) are sufficient to finance the investment projects planned for the current financial year and beyond. Liquid funds have been invested in safe vehicles that additionally allow us to access the funds at short notice, should they be needed to finance investment projects. In the current financial market environment, however, these generate low returns.
Particularities in assessing financial position: Irregular payment flows
Major payment flows in our operations commonly stem from a small number of investments and disinvestments. This gives rise to irregular and difficult-to-predict payment flows. We respond to these conditions through our finance management: for the short to mid-term, we draw on avail-able liquidity. Alternatively, we can raise borrowings, if appropriate. For longer planning horizons, we steer the amount of equity capital through distributions, share repurchases (as in 2005, 2006 and 2007) or, if appropriate, capital increases (2004).
The financial resources reported at the end of the financial year totalling 150.7 million euros (thereof 112.4 million euros in German government securities and, to a small degree, fixed-rate securities of banks with a credit rating based on Standard & Poor’s of A or better) are available for future investment. Investment commitments alongside DBAG Fund VI and the DBAG Expansion Capital Fund amount to approximately 199 million euros (31 October 2014). Broken down over a period of four years, that means about 50 million euros annually. We plan to cover that liquidity requirement from our proprietary capital and inflows from realisations of investments.
Cash flows: Higher cash flows from investment activities
INVESTMENT AND DISINVESTMENT ACTIVITIES in 2013/14 led to cash inflows of 70.8 million euros (previous year: 18.7 million euros). These derive from payments for investments in the portfolio netted against proceeds from disposals of investments.
In financial year 2013/14, proceeds from disposals of financial assets amounting to 90.8 million euros (previous year: 60.4 million euros) largely stemmed from inflows following successful disin-vestments: Homag Group AG, Dr. Vogler and (indirectly) DBG Eastern Europe and Harvest Partners IV, in total 84.1 million euros. The greatest portion is attributable to the disinvestment of Homag Group AG; subsequent to exits from the portfolios of DBG Eastern Europe and Harvest Partners IV, two older international buyout funds, DBAG received 2.3 million euros. Additional inflows
8 0 C O M B I N E D M A N A G E M E N T R E P O R T

came from the repayment of a shareholder loan, which we had granted to finance the invest-ment in FDG S.A. Due to its good economic development, the company was able to refinance itself and repay the loan as well as the interest accrued, a total of 3.2 million euros. Furthermore, warranty retentions from former disinvestments were reversed (2.1 million euros).
Payments for investment in financial assets reached 20.0 million euros (previous year: 41.7 million euros). These pertain to the acquisition of an interest in one new portfolio company (Unser Heimatbäcker, 9.9 million euros) and to follow-on investment in existing investee businesses: DNS:net and inexio received further tranches to finance growth; in addition, we increased our interest in inexio (in total, 3.9 million euros). We invested a total of 5.9 million euros in Romaco and Stephan Machinery (to be named ProXES in future) to finance add-on acquisitions. Additions to the securities portfolio led to (net) outflows of 33.9 million euros (previous year: (net) inflows of 6.7 million euros). Total cash flows from investing activities this past financial year amounted to 36.3 million euros (previous year: 25.4 million euros).
Expenditures on property, plant and equipment and intangible assets at DBAG totalled 0.7 mil-lion euros in financial year 2013/14 (previous year: 0.3 million euros). Overall, property, plant and equipment and intangible assets are insignificant and remained nearly unchanged at 1.5 million euros at the reporting date.
As in the previous year, CASH FLOWS FROM FINANCING ACTIVITIES amounted to 16.4 million euros. These pertain exclusively to the dividend payment.
The negative CASH FLOWS FROM OPERATING ACTIVITIES improved by 10.6 million euros to -1.4 million euros. A major accounting transaction was the repayment of a loan granted to a newco for bridge-over financing of a new investment in the fourth quarter of the preceding financial year (Schülerhilfe, 8.9 million euros).
TEN-YEAR SUMMARY OF F INANCIAL DATA
¤mn 2004/05 2005/06 2006/07 2007/08 2008/09 2009/10 2010/11 2011/12 2012/13 2013/14
Cash flows from operating activities (35.6) (4.1) (2.6) 3.0 (3.5) (12.8) 0.9 (9.6) (12.0) (1.4)
Cash flows from investing activities1 132.2 168.8 65.0 3.8 19.6 (44.4) 33.1 (18.2) 18.7 70.8
Cash flows from financing activities (57.1) (40.7) (71.4) (57.3) (5.5) (13.7) (19.1) (10.9) (16.4) (16.4)
Change in financial resources 2 39.5 124.0 (9.0) (50.5) 10.6 (70.9) 14.9 (38.8) (9.8) 52.4
1 Adjusted for cash flows from additions to and disposals of securities; as of FY 2012/13 also adjusted for cash flows from additions to and disposals of property, plant and equipment
2 Financial resources: cash and short- and long-term securities
A N N U A L R E P O R T 2 0 1 3 / 1 4 8 1
CO
MB
INE
D M
AN
AG
EM
EN
T R
EP
OR
T

A S S E T P O S I T I O N
Overall assessment: Increase in assets due to positive value movement of portfolio
The assets of the Group totalling 347.1 million euros (previous year: 310.7 million euros) largely consist of the investment portfolio as well as cash and securities. Assets increased this past financial year. The value appreciation of the investment portfolio – which was partially realised through disinvestments – led to a gain in assets that exceeded the dividend distribution of 16.4 million euros. With liquid or near-liquid assets of 150.7 million euros, the Company has more than 40 percent of its total assets available to meet its investment commitments to DBAG funds.
Asset structure: Changed, following realisations
NON-CURRENT ASSETS – which predominantly consist of financial assets, loans and receivables as well as long-term securities – totalled 243.9 million euros (previous year: 233.6 million euros) and comprised 70 percent of total assets (previous year: 75 percent). Subsequent to the exit of the largest investment in the portfolio (Homag Group AG), there was a shift in the composition of this balance sheet item at the expense of financial assets. LONG-TERM
SECURITIES, which largely consist of securities of German sovereign issuers with a term of up to six years, increased by 30.5 million euros to 81.0 million euros; cash from successful disposals that is not required in the short to mid-term was invested in securities. OTHER NON-CURRENT
ASSETS (0.4 million euros; previous year: 0.9 million euros) exclusively contained corporation tax credits at the reporting date.
STRUCTURE OF F INANCIAL POSIT ION
€mn
350
300
250
200
150
100
50
0ASSETS 2012/13
ASSETS 2013/14
LIABILITIES 2013/14
LIABILITIES 2012/13
Non-current assets
Receivables and other current assets
Cash and short-term securities
Equity
Non-current liabilities
Current liabilities
69.7
33.5
243.9
23.6
20.1
303.4
18.412.4
278.4
47.8
29.3
233.6
8 2 C O M B I N E D M A N A G E M E N T R E P O R T

CURRENT ASSETS amounted to 103.2 million euros at the end of the period, which exceeds those of the prior year (77.1 million euros). The increase is due to a rise in cash (38.3 million euros; previous year: 19.8 million euros) as well as in other current assets. These increased from 11.4 million euros in the prior year to 18.5 million euros, due to higher receivables from DBAG funds for reimbursable costs and for advisory services.
Portfolio value: Lower, following exit of largest investment
The value of the Group’s investments is reflected in the statement of financial position in financial assets as well as loans and receivables. The sum of both of these items amounted to 161.0 mil-lion euros at 31 October 2014 (previous year: 180.9 million euros). It consisted of investments in 19 companies and international private equity funds valued at 153.1 million euros (“portfolio value”; previous year: 172.7 million euros) as well as shares in companies the value of which is mainly attributable to minority interest. The latter is contained under this balance sheet heading in an amount of 8.0 million euros.
Compared with the opening value at the beginning of the financial year, the value of the invest-ment portfolio decreased by 58.3 million euros in 2013/14 through disposals, partial disposals and repayments from fund investments. A primary contributor was the disinvestment of Homag Group AG (56.0 million euros).
The investment in new and existing portfolio companies (20.0 million euros) as well as value gains of the carried portfolio (21.3 million euros) did not offset the decrease in the portfolio value caused by disposals, partial disposals and repayments from fund investments.
Portfolio profile: Ten investments account for 78 percent of portfolio value
We measure the fair value of our investments at quarterly intervals. Valuation changes are recognised in the consolidated statement of comprehensive income.
78 percent of the portfolio value (IFRS) at 31 October 2014 is attributable to the following ten investments 12:
Our valuation methodology is detailed in the notes to the consolidated financial statements page 146
12 See footnote 3, page 58; the investments are alphabetically ordered regardless of their valuation.
A N N U A L R E P O R T 2 0 1 3 / 1 4 8 3
CO
MB
INE
D M
AN
AG
EM
EN
T R
EP
OR
T

Company Cost ¤mn Equity share DBAG % Investment type Sector
Broetje-Automation GmbH 5.6 18.8 MBOMechanical engineering and plant construction
Clyde Bergemann Group 9.2 15.7 MBOMechanical engineering and plant construction
Formel D GmbH 10.4 15.1 MBO Industrial services
Grohmann GmbH 2.1 25.1 Expansion capitalMechanical engineering and plant construction
Heytex Bramsche GmbH 6.4 17.1 MBO Industrial services
Romaco GmbH 11.2 18.7 MBOMechanical engineering and plant construction
Schülerhilfe GmbH 9.8 17.8 MBO Education
Spheros GmbH 13.9 15.7 MBOMechanical engineering and plant construction
Stephan Machinery GmbH (“ProXES”) 5.9 18.8 MBO
Mechanical engineering and plant construction
Unser Heimatbäcker GmbH 9.9 15.6 MBO Consumer goods
Based on the valuations at the reporting date, the portfolio is structured as follows. The data is based on the previously mentioned “portfolio”. The breakdown of equity by the portfolio companies’ net debt is also based on that portfolio; however, investments in international buyout funds as well as investments in entities through which retentions for representations and warranties arising from exited investments are held were omitted (2014 net debt and 2014 EBITDA based on portfolio companies’ forecasts at 30 September 2014).
PORTFOLIO VALUE BY NET DEBT/EBITDA
OF PORTFOLIO COMPANIES
%
18.8 23.1
37.1 21.0
< 1.0
1.0 to < 2.0
2.0 to < 3.0
> 3.0
PORTFOLIO VALUE BY VALUATION METHOD
FOR INVESTMENTS
%
8.3
8.2
6.5
77.0
Multiples method
Transaction price
DCF
Other
8 4 C O M B I N E D M A N A G E M E N T R E P O R T
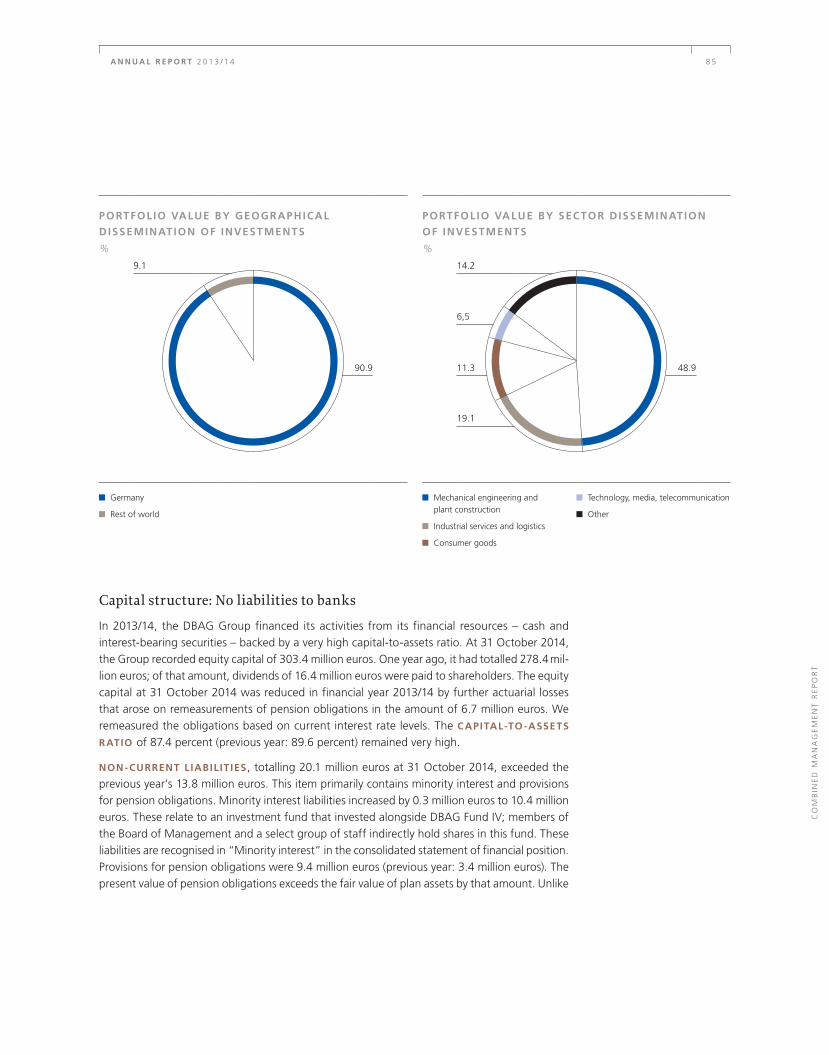
PORTFOLIO VALUE BY GEOGRAPHICAL
DISSEMINATION OF INVESTMENTS
%
9.1
90.9
Germany
Rest of world
PORTFOLIO VALUE BY SECTOR DISSEMINATION
OF INVESTMENTS
%
14.2
6,5
11.3 48.9
19.1
Mechanical engineering and plant construction
Industrial services and logistics
Consumer goods
Technology, media, telecommunication
Other
Capital structure: No liabilities to banks
In 2013/14, the DBAG Group financed its activities from its financial resources – cash and interest-bearing securities – backed by a very high capital-to-assets ratio. At 31 October 2014, the Group recorded equity capital of 303.4 million euros. One year ago, it had totalled 278.4 mil-lion euros; of that amount, dividends of 16.4 million euros were paid to shareholders. The equity capital at 31 October 2014 was reduced in financial year 2013/14 by further actuarial losses that arose on remeasurements of pension obligations in the amount of 6.7 million euros. We remeasured the obligations based on current interest rate levels. The CAPITAL-TO-ASSETS
RATIO of 87.4 percent (previous year: 89.6 percent) remained very high.
NON-CURRENT LIABILITIES, totalling 20.1 million euros at 31 October 2014, exceeded the previous year’s 13.8 million euros. This item primarily contains minority interest and provisions for pension obligations. Minority interest liabilities increased by 0.3 million euros to 10.4 million euros. These relate to an investment fund that invested alongside DBAG Fund IV; members of the Board of Management and a select group of staff indirectly hold shares in this fund. These liabilities are recognised in “Minority interest” in the consolidated statement of financial position. Provisions for pension obligations were 9.4 million euros (previous year: 3.4 million euros). The present value of pension obligations exceeds the fair value of plan assets by that amount. Unlike
A N N U A L R E P O R T 2 0 1 3 / 1 4 8 5
CO
MB
INE
D M
AN
AG
EM
EN
T R
EP
OR
T

in financial years up to 2011/12, we again chose not to balance the current underfunding by an allocation to plan assets. We want to maintain the availability of the required funds in the event of rising interest rates and possible overfunding.
CURRENT L IABIL IT IES amounted to 23.6 million euros at the reporting date (previous year: 18.4 million euros). Provisions for performance-linked remuneration not yet paid totalled 12.6 million euros (previous year: 8.5 million euros). As in the past, the Group had no liabilities to banks.
Financial resources: Significant increase following exits
The Group had financial resources of 150.7 million euros at 31 October 2014. They consisted of two components: cash in the amount of 38.3 million euros and another 112.4 million euros recognised in current assets in line item SHORT-TERM SECURITIES (31.4 million euros) and in non-current assets in line item LONG-TERM SECURITIES (81.0 million euros). These relate to securities of German sovereign issuers. To improve interest income without changing the risk position, we invested liquid funds in floating-rate bonds with maturities of between two and three years. These bonds typically provide a high degree of liquidity and low price risk; a part of these bonds had a term of less than one year at the end of the period.
Financial resources increased over the 2013/14 financial year by 52.3 million euros. Major cash flows relate to returns from disposals as well as new investment and the dividend payment.
TEN-YEAR SUMMARY OF F INANCIAL POSIT ION
¤mn31 Oct.
200531 Oct.
200631 Oct.
200731 Oct.
200831 Oct.
200931 Oct.
201031 Oct.
201131 Oct.
201231 Oct.
201331 Oct.
2014
Financial assets 198.9 121.5 209.6 138.3 137.2 129.9 93.5 150.7 166.8 135.0
Securities/cash 40.7 164.7 155.8 105.2 124.0 140.7 155.6 105.8 98.3 150.7
Other assets 26.6 33.8 29.1 28.7 27.0 45.5 30.8 42.5 45.6 61.4
Equity 246.6 289.0 353.6 244.8 256.8 273.9 238.9 266.2 278.4 303.4
Liabilities/provisions 19.7 31.1 40.8 27.4 31.5 42.2 41.0 32.8 32.3 43.7
Total assets 266.3 320.1 394.4 272.3 288.3 316.1 279.9 299.0 310.7 347.1
8 6 C O M B I N E D M A N A G E M E N T R E P O R T

CO M PA R I S O N O F AC T UA L A N D P ROJ EC T ED BU S I N ES S P ER F O R M A N C E
SUMMARY OF ASSESSMENT BY BOARD OF MANAGEMENT ON THE ECONOMIC TREND AND ACHIEVEMENT OF OBJECTIVES (PROJECTED/ACTUAL COMPARISON)
Actual 2012/13 Projected 2013/14 Actual 2013/14
Consolidated net income €32.3mnSince no contribution projected from Homag Group AG: clearly below prior year
€47.8mn, thereof contribution to income Homag Group AG €25.6mn (incl. dividend)
Return on net asset value per share11.5% with cost of equity of 8.1% To reach cost of equity 15.8% with assumed cost of equity of 8.0%
Net result of investment activity €41.0mnSince no contribution projected from Homag Group AG: clearly below prior year
€54.5mn, thereof contribution Homag Group AG €25.6mn (incl. dividend)
Contribution to income from unquoted portfolio €7.7mn Clearly in excess of prior year €25.7mn
Net expense ratio 2.5% Less than 3% and slightly below prior year 0.7%
Personnel costs €13.8mnWithout performance-related remuneration slightly less than prior year
Without performance-related remuneration€12.4mn
Fee income from investment services to funds €18.9mn Slightly in excess of prior year
€21.7mn, thereof €1.2mn for performance-linked remuneration Fonds I (not predictable)
Other operating income (without fee income from investment services) €5.7mn
Strongly dependent on transaction activity, in the order of prior year
€9.8mn due to higher reimbursable transaction-related consultancy costs
Other operating expenses (incl. write-downs) €18.2mn
Slightly less than prior year due to non-recurrence of two special effects
€21.2mn due to higher transaction-related consultancy costs
Net interest €0.1mn Net interest unchanged €0.3mn (impact of IAS 19)
Financial resources €98.3mnWithout realisations, lower at end of financial year €150.7mn, thereof realisations €90.8mn
New investment €44.5mn €50mn €20.0mn
Except for new investment, the forecast issued in January 2014 was achieved in all points, and in some instances clearly overachieved. That also applies to the key performance indicator – the return on net asset value per share. Reaching 15.8 percent, it significantly surpassed the fore-cast, even though – unpredictable – actuarial losses arising from remeasurements of pension obligations weighed on the return, accounting for about 2.6 percentage points.
A N N U A L R E P O R T 2 0 1 3 / 1 4 8 7
CO
MB
INE
D M
AN
AG
EM
EN
T R
EP
OR
T

F I N A N C I A L A N D N O N - F I N A N C I A L P ER F O R M A N C E I N D I C ATO R S
Return significantly exceeds cost of equity: Consolidated net asset value per share rose by 15.8 percent in 2013/14
The return on consolidated net asset value per share is our core performance indicator. It discloses by way of the movement in financial assets and the net result of fund services and investment activity to what extent the portfolio companies’ performance contributed to a change in consolidated net asset value. This past financial year, consolidated net asset value increased by 1.82 euros per share, even though the Company paid a dividend of 1.20 euros. The return on consolidated net asset value per share thus reached 15.8 percent. It is based on consolidated net income of 47.8 million euros. Comprehensive income, which is relevant in determining the return, was 41.4 million euros; 2013/14 comprehensive income contains an actuarial loss of 6.7 million euros. The return on consolidated net asset value of 15.8 percent thus exceeds the cost of equity which we have set at 8.0 percent (previous year: 11.5 percent and 8.1 percent, respectively).13
Consolidated net income (€mn) Return on NAV per share (%)
CONSOLIDATED NET INCOME (€mn) AND RETURN ON NAV PER SHARE (%)
2004/05 2005/06 2006/07 2007/08 2008/09 2009/10 2010/11 2011/12 2012/13 2013/14
82.7
136.5
19.634.1
44.5 47.832.3
(51.1)
(16.6)
20 .0
36.4
56.2
(17.5)
7.3
(6.2)
12.7
16.8 15.811.5
41.3
13 In determining the return, the dividend paid per share in the financial year (€1.20) is deducted from the
consolidated net asset value per share as at the preceding reporting date (31 October 2013: €20.36). We relate the consolidated net asset value per share at 31 October 2014 of €22.18 to that amount (€19.16).
8 8 C O M B I N E D M A N A G E M E N T R E P O R T

Our business is strongly influenced by irregular transactions (investments in portfolio companies and their disinvestment). It is also significantly determined by external factors beyond our control (e.g. cyclical trends or stock market conditions). Changes in valuation ratios may temporarily obliterate the value gains achieved by the portfolio companies through higher margins or an improved strategic positioning. For that reason, we assess our performance based on the average return on consolidated net asset value over a longer horizon. Over the past ten-year period (2004/05 to 2013/14), we achieved an average return on consolidated net asset value of 15.3 percent. This is more than seven percentage points in excess of the average cost of equity, which, according to our computation, was between seven and nine percent – with the exception of the reporting year.
Performance: Aggregate total return of 236 percent since 31 October 2004
Taking dividends and surplus dividends into account, DBAG recorded an aggregate total return of 236 percent based on net asset value per share in the ten-year period from 31 October 2004 to the end of the past financial year; this equates to an average annual total return of 12.8 percent over this ten-year period.14 Total return is a key indicator for the performance of listed private equity companies and allows a comparison with other equity investments over longer periods of time, for example, with the performance of stock indices or stock funds.
Valuation of DBAG shares: Market price frequently in excess of net asset value
Our investor relations activities are targeted, among other things, at attaining a fair valuation of DBAG shares. For listed private equity companies, this is mostly assessed by the difference between the share price and net asset value, without differentiating whether the respective company exclusively holds investments or – like DBAG – additionally achieves substantial fee income from fund management and advisory services. This past financial year, DBAG shares traded at a premium to net asset value of up to twelve percent on about half of the trading days, and they closed at a discount to net asset value per share of up to five percent on some 45 percent of trading days. Only on 18 trading days did they trade at a discount of five to a maximum of eight percent.
14 The calculation implies a reinvestment of dividends and surplus dividends in net asset value per share in each case at the
end of the second quarter of a financial year (30 April); the dividend is usually paid at the end of March.
A N N U A L R E P O R T 2 0 1 3 / 1 4 8 9
CO
MB
INE
D M
AN
AG
EM
EN
T R
EP
OR
T

People: Dedication and personal performance are key features of our corporate culture
Personal performance and a team-based work environment are key characteristics of our corporate culture. We attach great importance to treating each other and our business partners with respect. In our daily work, we emphasise a high level of PROFESSIONALISM and stable processes. In doing so, we utilise our lean structures and short decision-taking routes. This has the advantage that the members of the Board of Management are in regular contact with most employees and learn, for instance, about the extent of the staff’s satisfaction not by indicators, but in everyday interaction.
The private equity business involves managing heavy workloads. Assignments within our organisation call for a high level of IDENTIFICATION with the role. We endorse this by fostering a culture of direct communication, lean reporting lines and team-based project organisation. We also delegate responsibility and accountability early on.
We attach particular importance to nurturing a corporate culture in which LOYALTY to the Company can prosper. One measure for this is the staff’s years of service to the Company: investment managers and senior executives have been with DBAG for an average of more than eight years (previous year: nine years). Staff fluctuation at Deutsche Beteiligungs AG is low: it averaged less than five percent over the past ten years. In 2013/14, four employees left the Company, which corresponds to a rate of about seven percent.15
Number of staffNumber of departures
Fluctuation rate %
Financial year 2013/14 58 4 6.9
Average over financial years 2009/10 to 2013/14 52 3 5.8
Average over financial years 2004/05 to 2013/14 52 2 3.8
Our performance thrives on the professional and personal skills of our people at all levels and in all areas of the Company. The members of our investment team need to identify the right busi-nesses for an investment; they need to recognise the potential and motivate the managements of these businesses to tap that potential. Ultimately, they will need to steer the process of profitably realising the investment. In addition to excellent management skills and sector knowledge, this calls for keen leadership and motivation qualities, communication skill and social competency.
We regularly strive to develop both the professional and personal competencies of our staff. This past year again, more than three quarters of the staff participated in further education and training programmes. In selecting the right programmes, we endeavour to match the training with personal development needs.
15 The representation does not include apprentices, employees with a fixed-term work contract and retiring employees.
9 0 C O M B I N E D M A N A G E M E N T R E P O R T

Staff profile: High training rate
At 31 October 2014, Deutsche Beteiligungs AG employed a staff of 26 female und 25 male employees (without the members of the Board of Management), or a total of 51, which is two more than at the previous year’s reporting date. Additionally, five apprentices are currently qualifying for their future professions; this represents an apprenticeship quota of nine percent (previous year: six apprentices, apprenticeship quota of eleven percent). The average age is 38.0 years (previous year: 39.0 years). Not included in these figures are the three female and one male employee on parental leave at the reporting date.
2013/14 2012/13
Number of employees (without Board of Management) 56 55
thereof full-time 46 45
thereof part-time 5 4
thereof apprentices 5 6
Personnel costs and social contributions ¤mn 11.4 9.7
During the reporting year, we offered 14 students (previous year: also 14) an internship for a period of several months, allowing them to gain insight into the responsibilities of an investment manager or investor relations manager. We prefer to award the internship to students who are about to complete their studies. We use this instrument to present DBAG as an interesting employer. Through our consistent business model, our corporate culture of collaborative interaction and our attractive working conditions, we again succeeded in attracting highly qualified people.
Employee compensation: Incentivisation through variable components
The compensation system at Deutsche Beteiligungs AG is geared to endorsing performance and – in addition to a motivating work environment – offering a financial incentive to attract and retain key staff. The Company creates an opportunity for select staff to share in its annual performance. The extent of this scheme follows the practice common in the private equity industry.
Compensation is composed of fixed and performance-related components, as well as components with long-term incentive effects. A constituent of the performance-linked compensation scheme, which has largely remained unchanged for more than ten years, is a bonus that rewards the performance of DBAG and personal performance. The factors that are considered when measuring the Company’s performance include the value appreciation of individual portfolio companies as well as realisations from the portfolio or the number and quality of new investments. Profit-sharing schemes that allow the team members to participate in the performance of DBAG’s investments have a long-term incentive effect.
As a listed company, DBAG offers an employee share purchase plan to active and former employees. In the reporting year, 69 percent of the staff took advantage of the offer (previous year: 71 percent).
A N N U A L R E P O R T 2 0 1 3 / 1 4 9 1
CO
MB
INE
D M
AN
AG
EM
EN
T R
EP
OR
T

Transaction opportunities: High proportion of proprietary deal flow
In addition to participating in auctions, our network assists us in originating transaction opportunities through a proprietary deal flow. In 2013/14, nearly 30 percent of all transaction opportunities originated by way of direct contacts – either the owners of companies addressed us or we addressed companies directly. In the comparative financial year, that proportion was 35 percent, or slightly higher.
In 2013/14, we screened 299 investment opportunities; 182 related to potential MBOs and 117 concerned expansion financings. This represents a marginal decline compared with the previous year’s 316 opportunities. The proportion of transaction opportunities that were initially followed up declined from 93 to 84 percent.
Total
Of which followed up
TRANSACTION OPPORTUNIT IES
2013/14
2012/13
2011/12
2010/11
2009/10
0 50 100 150 200 250 300 350
293
316
250
299
264
284
260
237
203
236
Sustainability: Adherence at DBAG and portfolio companies
We adhere to sustainability aspects in the operational processes of DBAG as well as at the portfolio companies in as far as we are able to exert an influence as a co-owner. From the corporate governance perspective, we stated that ESG principles, as a manifestation of the sustainability concept, are a constituent of our analyses and decision-taking processes. Our understanding of responsible governance is reflected in, among other things, a tried-and-true opportunity and risk management system, a stable staff structure, as well as open communication with the Company’s shareholders.
DBAG also participates in the Carbon Disclosure Project (CDP). The aim of this non-profit organisation is to have companies disclose their environmental impact, such as climate-damaging greenhouse gas emissions. The latest report (data for 2013) revealed a significant improvement in the rating measured
Corporate governance/sustainability page 67
9 2 C O M B I N E D M A N A G E M E N T R E P O R T

by CDP performance scores. With a score of 81 (out of 100; previous year: 51) in the climate disclosure score, DBAG had a far better rate than the average among S-Dax listed companies (score of 52). In 2014, DBAG was named “Best Improver” among 160 German corporations assessed.
We also attach importance to ESG principles when selecting our investments. During the due diligence process we examine the degree to which target companies meet modern environmental, social and governance standards. That enhances the attractiveness of portfolio companies for potential buyers. Our aim is to have the value created within our portfolio companies realised at an attractive price in four to seven years. We have therefore chosen to exclusively invest in business models that meet these criteria and have sound long-term perspectives.
Before entering into an investment, ESG-related opportunities and risks are evaluated and documented. Based on these findings, we endeavour to achieve an improvement in ESG performance factors during the time of our investment, as far as our role as a co-owner of a portfolio company allows. We monitor the ESG progress at our portfolio companies over an investment’s entire holding period. This past financial year, we succeeded in having even those companies that have been in the portfolio for longer adopt ESG guidelines of their own.
Foundation: Social and cultural commitment by DBAG
The “Gemeinnützige Stiftung der Deutschen Beteiligungs AG”, a non-profit charitable foundation, was established and accredited in October 2010. It represents the cornerstone of DBAG’s lasting commitment to social and cultural projects. The foundation’s focal point is to support active and former employees of current and former DBAG portfolio companies and their dependants in emergency cases. The foundation also sponsors the arts and cultural projects in the greater Frankfurt area. We view DBAG’s social and cultural engagement as a contribution towards affirming and building the Company’s good reputation.
This past financial year, the foundation finalised one project and sponsored two new projects. We increased the foundation’s endowment by another T€20.
OV ER A L L A S S ES S M EN T O F T H E ECO N O M I C P O S I T I O N O F T H E G RO U P
In the opinion of the Board of Management, the Deutsche Beteiligungs AG Group was economically very sound at the time this combined management report was drawn up.
Posting a consolidated net income of 47.8 million euros and a return on net asset value per share of 15.8 percent, the Group achieved excellent results in financial year 2013/14. This performance largely derives from the projected progress the portfolio companies have made, from two profitable realisations, as well as from higher fee income for investment services to private equity funds. Fee income forms a solid basis serving to cover a major part of current operating costs.
The Group remains soundly capitalised: it has sizeable liquid resources and no bank debt.
www.dbag-stiftung.de
A N N U A L R E P O R T 2 0 1 3 / 1 4 9 3
CO
MB
INE
D M
AN
AG
EM
EN
T R
EP
OR
T

F I N A N CI A L R E V I E W O F D EU T SCH E B E T E I L I GU N GS AG (CO M M EN TA RY BA SED O N T H E G ER M A N CO M M ERCI A L CO D E – H G B)
The management report on Deutsche Beteiligungs AG and the Group management report for financial year 2013/14 are presented combined, in conformity with § 315 (3) HGB in connection with § 298 (3) HGB. The presentation of the economic position of Deutsche Beteiligungs AG is based on an abridged balance sheet and an abridged profit and loss account derived from the balance sheet and profit and loss account as prescribed by HGB. The complete annual financial statements of Deutsche Beteiligungs AG based on HGB are published in the “Bundesanzeiger” (Federal Gazette), together with the consolidated financial statements.
E A R N I N G S P O S I T I O N
Overall assessment: Exceptionally profitable financial year completed
In financial year 2013/14, Deutsche Beteiligungs AG achieved a profit for the year of 65.4 million euros, or 29.8 million euros over that of the preceding 2012/13 financial year (35.6 million euros), for which a total dividend of 1.20 euros per share – consisting of a base dividend of 0.40 euros per share and a surplus dividend of 0.80 euros per share – was paid in March 2014. The main contribution towards the result came from the profitable realisation of an investment (Homag Group AG).
Net result of valuation and disposal: Significant increase following profitable exits
The net result of valuation and disposal is determined by earnings or losses from the disposal of investments as well as write-downs netted against write-ups on investments contained in the portfolio at the reporting date. Write-downs and write-ups are performed at the lower of cost or market and the applicable procedure for reversals of impairment losses. The upper ceiling for write-ups is the historical cost. The net result of valuation and disposal of 58.6 million euros (previous year: 34.5 million euros) largely reflects the two profitable realisations in the course of this financial year (Homag Group AG, Dr. Vogler Group).
The annual f inancial statements are accessible at www.deutsche-beteiligung.de/ investor-relations; a printed version is also available on request.
9 4 C O M B I N E D M A N A G E M E N T R E P O R T

ABRIDGED PROFIT AND LOSS ACCOUNT OF DEUTSCHE BETEIL IGUNGS AG (BASED ON HGB)
T€ 2013/14 2012/13
Net result of valuation and disposal 1 58,590 34,485
Current income from financial assets 11,963 6,791
Fee income from fund management and advisory services 20,093 20,705
Total net result of investment activity 90,646 61,981
Personnel expenses (16,434) (16,499)
Other operating income (without write-ups) 4,002 5,527
Other operating expenses (10,812) (13,975)
Depreciation and amortisation on property, plant and equipment and intangible assets (416) (419)
Interest income 664 807
Interest expenses (1,810) (1,306)
Total other income/expenses (24,806) (25,865)
Result of ordinary activity 65,840 36,116
Income taxes (405) (491)
Other taxes (7) (6)
Profit for the year 65,428 35,619
1 The net result of valuation and disposal is composed of p/l items “Income from the disposal of investments” (€58.6mn) and write-ups in the financial year of €0.4mn that are recognised in item “Other operating income”. “Write-downs on financial assets” in the amount of €0.4mn were deducted.
Current income from financial assets: Higher, after distribution of free liquidity
In financial year 2013/14, we recorded CURRENT INCOME FROM FINANCIAL ASSETS in the amount of 12.0 million euros, which is 5.2 million euros in excess of the prior year’s 6.8 million euros. Income from financial assets contains distributions, typical of the business, of 9.5 million euros from associated companies. These distributions stem from retentions on disinvestments of previous periods, but primarily also from the maturity of securities in which free liquidity had previously been invested. Also recognised herein are profit distributions and interest earnings from portfolio companies.
A N N U A L R E P O R T 2 0 1 3 / 1 4 9 5
CO
MB
INE
D M
AN
AG
EM
EN
T R
EP
OR
T

Fee income from fund management and advisory services: Marginal decline
Fee income from management and advisory services to DBAG funds of 20.1 million euros contains for the first time fee income from DBAG Fund VI for a full year. The previous year’s amount of 20.7 million euros was positively distorted by a special effect of approximately four million euros.
In total, the NET RESULT OF FUND SERVICES AND INVESTMENT ACTIVITY of 90.6 million euros exceeded that of the also very successful previous year (62.0 million euros) by about 46 percent.
TOTAL OTHER INCOME/EXPENSES of -24.8 million euros was slightly below the previous year’s -25.9 million euros.
Other operating income: Decline due to structural change
Other operating income without write-ups declined from 5.4 million euros to 4.0 million euros. In the reporting year, DBG Managing Partner GmbH & Co. KG, a consolidated company, assumed the fund management and advisory activities. Due to this structural change, proceeds from investment management-related reimbursable expenses declined.
Personnel expenses: Stable overall, despite higher performance-linked emoluments
In financial year 2013/14, PERSONNEL EXPENSES remained nearly constant, decreasing by 0.1 million euros from 16.5 million euros to 16.4 million euros in 2013/14. Provisions for performance-related income components, which totalled 8.4 million euros, were significantly in excess of the previous year’s 3.6 million euros. The reasons for this are the profitable disinvestments of Homag Group AG and the Dr. Vogler Group (4.2 million; previous year: 0.1 million for investment performance Coveright) as well as variable components based on personal performance – these were also higher than in the previous year in view of the Company’s improved general performance. The costs for salaries and social contributions declined. Expenses recognised for pension obligations were significantly lower. They decreased from 3.2 million euros to 0.3 million euros; in the preceding year, 1.5 million euros were recognised to account for a modification of mortality tables.
9 6 C O M B I N E D M A N A G E M E N T R E P O R T

Other operating expenses: Decreased compared with the previous year
Other operating expenses amounted to 10.8 million euros in the financial year, or 3.2 million euros below those of the prior year (14.0 million euros). This item largely contains expenses for the management of investments, meaning the acquisition, monitoring and disinvestment of portfolio companies or fund investments. The largest position in other operating expenses is the external expenditures for screening investment opportunities (partly chargeable to the DBAG funds); these costs decreased from 5.3 million euros (2012/13) to 2.5 million euros (2013/14). Other operating expenses also include numerous smaller items pertaining to costs incurred in the ordinary course of business.
Net interest: Negative due to higher interest charges arising on pension obligations
Net interest was negative (-1.1 million euros; previous year: -0.5 million euros) and once again considerably lower than that of the preceding year. Slightly lower interest income of 0.7 mil-lion euros compared with the previous year (2012/13: 0.8 million euros) mirrors the current low interest rate level for short-term investments; balances on current accounts, for example, currently earn no interest at all. The decline in interest income is due to lower interest on tax refunds. Interest expenses (1.8 million euros, following 1.3 million euros) include interest on pension obligations.
Profit of 65.4 million euros for the year
Deutsche Beteiligungs AG posted an annual profit of 65.4 million euros for financial year 2013/14. The previous year’s profit had totalled 35.6 million euros. The Company’s return on equity was 23.2 percent. In the prior year, it amounted to 15.2 percent.
Retained profit of 92.3 million euros
Including the profit carried forward from the previous year and the dividend payment, the retained profit amounted to 92.3 million euros.
A N N U A L R E P O R T 2 0 1 3 / 1 4 9 7
CO
MB
INE
D M
AN
AG
EM
EN
T R
EP
OR
T

A S S E T P O S I T I O N
The major asset positions of Deutsche Beteiligungs AG are THE DIRECTLY HELD INVESTMENTS that are shown in “Investments”, in addition to EQUITY SHARES IN ASSOCIATES, which, for their part, hold further investments: until 2006, DBAG primarily held investments directly; since then, it holds its investments indirectly as a result of the structure of DBAG funds. Also, non-current assets include INVESTMENT SECURITIES; these securities constitute significant parts of the financial resources of Deutsche Beteiligungs AG. Together with cash and cash equivalents, these resources are available for future investment.
ABRIDGED BALANCE SHEET OF DEUTSCHE BETEIL IGUNGS AG (BASED ON HGB)
T€ 2013/14 2012/13
Equity shares in associates 128,013 121,134
Investments 19,900 43,279
Securities 97,073 57,570
Other non-current assets 1,455 1,307
Non-current assets 246,441 223,290
Receivables and other assets 27,309 18,010
Cash and cash equivalents 23,302 2,309
Current assets 50,611 20,319
Prepaid expenses 344 385
Miscellaneous assets 1,908 3,231
Assets 299,304 247,225
Subscribed capital 48,533 48,533
Capital reserve 141,394 141,394
Retained earnings 403 403
Retained profit 92,276 43,259
Equity 282,606 233,589
Provisions 16,481 13,235
Liabilities 217 327
Deferred income 0 74
Liabilities 299,304 247,225
In financial year 2013/14, shares in associated companies rose by 6.9 million euros, increasing from 121.1 million euros to 128.0 million euros. The gain is due to the investment in a new portfolio company (Unser Heimatbäcker), further capital calls for expansion capital investments (DNS:NET, inexio) and follow-on investments in existing investee businesses.
9 8 C O M B I N E D M A N A G E M E N T R E P O R T

Following the disinvestment of Homag Group AG, the value of directly held investments declined significantly to 19.9 million euros (previous year: 43.3 million euros). Investments are made indirectly, write-ups are capped at acquisition cost, and there were no impairment losses to be recognised.
Investment securities increased in net terms by 39.5 million euros to 97.1 million euros.
Current assets: Significant increase due to higher cash position
Current assets rose significantly in the financial year: at 31 October 2014, they amounted to 50.6 million euros, a gain of 30.3 million euros on the previous year. Cash and cash equivalents accounted for nearly half of current assets at the reporting date; another constituent under this item was a receivable from a portfolio company arising from non-distributed profit entitlements.
Provisions: Higher than in the previous year
At the end of the period, provisions amounted to 16.5 million euros, or 3.3 million euros over those of the previous year (13.2 million euros). Provisions were chiefly made to cover per-formance-related income components; 4.2 million euros thereof are attributable to the reporting year, and 4.2 million euros were made over the last eight financial years, but are still subject to a payout stop.
F I N A N C I A L P O S I T I O N
Particularities in assessing financial position: Cash flow characterised by irregular outflows
The strong FINANCIAL RESOURCES reported at the end of the period of 120.4 million euros (investment securities of 97.1 million euros and cash and cash equivalents of 23.3 million euros) are available to meet investment commitments. Based on the investment progress planned for the coming three to four years, DBAG will have an average liquidity requirement of some 50 million euros annually; the actual requirement may fluctuate strongly.
Capital structure: No liabilities to banks
In financial year 2013/14, Deutsche Beteiligungs AG financed its activities from its available financial resources. At 31 October 2014, the Company reported equity of 282.6 million euros, which compares with 233.6 million euros at 31 October 2013; dividend payments to share-holders account for 16.4 million euros of that amount. The CAPITAL-TO-ASSETS RATIO of 94.4 percent (previous year: 94.5 percent) remained very high.
A N N U A L R E P O R T 2 0 1 3 / 1 4 9 9
CO
MB
INE
D M
AN
AG
EM
EN
T R
EP
OR
T

CO M PA R I S O N O F AC T UA L A N D P ROJ EC T ED BU S I N ES S P ER F O R M A N C E
Profit for the year: Profitable disinvestment leads to overachievement of forecast
The profit for the year of Deutsche Beteiligungs AG primarily depends on the extent to which larger capital gains on disposals have been achieved and whether material write-downs are to be recognised due to permanent impairment losses. The profit for the year of 35.6 million euros posted in 2012/13 stemmed primarily from a profitable disposal. We were unable to foresee at the beginning of the financial year whether such a disposal would be possible in 2013/14 as well. For that reason, we had forecast in 2012/13 that the profit for the year would clearly “fall short of that posted for the past financial year”. Totalling 65.4 million euros, it is actually nearly double the previous year’s profit, the reason being that the largest investment by far in the portfolio was sold highly profitably.
S I G N I F I C A N T E V EN T S A F T ER T H E EN D O F T H E R EP O R T I N G P ER I O D
After the end of the period, DBAG signed three agreements on investments alongside DBAG Fund VI.
Huhtamaki Films is a manufacturer and finisher of films. Huhtamaki Films has been a division of Finland-based Huhtamäki Oyi, which sold the division to the DBAG-advised DBAG Fund VI and the division’s management in an MBO. DBAG will hold approximately 17 percent in Huhtamaki Films and invest up to 12.5 million euros. The company is headquartered in Forchheim, Germany.
The Pfaudler Process Solutions Group (Pfaudler) manufactures glass-lined reactors and components for the chemical and pharmaceutical industries. Pfaudler, with its head office in Schwetzingen, Germany, has been part of National Oilwell Varco, Inc., a US-based supplier to the oil and gas industries. DBAG Fund VI will initially acquire the group completely; it is planned to have its management co-invest in a management buyout. DBAG will hold approximately 15 percent in Pfaudler and invest proprietary capital of up to eight million euros for its stake.
Gienanth GmbH (Gienanth) is an iron foundry that manufactures products by hand-moulded and machine-moulded casting processes for the global market at two sites in Germany. DBAG Fund VI will initially acquire the company completely; Gienanth’s management is expected to co-invest in a management buyout. DBAG will hold approximately 19 percent in the company and invest equity of up to 14 million euros in its stake.
1 0 0 C O M B I N E D M A N A G E M E N T R E P O R T

A D D I T I O N A L S TAT U TO RY I N F O R M AT I O N A N D CO M M EN TA RY
R EM U N ER AT I O N R E P O R T
Management remuneration: Geared to assignment, personal and company performance
The Supervisory Board decides on the remuneration framework and all remuneration components for the members of the Board of Management. Shareholders at the Annual Meeting approved the system in 2011. Total remuneration for the members of the Board of Management consists of the following components:
> a fixed annual salary,
> a variable annual bonus,
> variable remuneration components with long-term incentive effects,
> non-cash components, and
> where applicable, pension benefits.
Criteria for the appropriateness of remuneration levels are, in particular, the responsibilities of the respective Board of Management member, his/her personal performance, and the financial position, performance and prospects of Deutsche Beteiligungs AG. To that end, the structure and level of schemes common to the private equity industry, which are required to attract and retain qualified key personnel, are considered.
Insofar as the members of the Board of Management receive emoluments for offices held in other companies, these are transferred to DBAG. A severance pay cap is provided for in the service contracts of all Board of Management members. The D&O (Directors and Officers) liability insurance which the Company has taken out contains a deductible for the Board of Management members. No advances or loans have been granted to Board of Management members.
COMPONENTS NOT LINKED TO PERFORMANCE consist of a fixed base salary paid on a monthly basis and non-cash emoluments. Non-cash emoluments largely pertain to the value based on applicable tax rules for the use of a company car. In financial year 2013/14, they amounted to T€572 for Mr Grede, T€572 for Dr Scheffels, and T€316 for Ms Zeidler.
The annual bonus represents the PERFORMANCE-RELATED REMUNERATION COMPONENT for the members of the Board of Management. It is linked to the personal performance of the Board members over the past financial year and can generally reach half the fixed base salary. Personal performance is determined by the Supervisory Board at its equitable discretion.
A N N U A L R E P O R T 2 0 1 3 / 1 4 1 0 1
CO
MB
INE
D M
AN
AG
EM
EN
T R
EP
OR
T

As a VARIABLE COMPONENT WITH LONG-TERM INCENTIVE EFFECTS, the members of the Board of Management are also awarded a bonus that is based on the Company’s performance over the reference period (the reporting year and the two prior financial years). The Supervisory Board determines the Company’s performance based on the return on net asset value. Eligibility for a bonus starts when the return at least amounts to the cost of equity (currently 8 percent); the maximum amount is reached at 20 percent.
In its meeting on 18 November 2014, the Executive Committee of the Supervisory Board discussed the amount of both variable income components for financial year 2013/14 and recommended them to the Supervisory Board. The Supervisory Board approved the recommendation and fixed the variable remuneration for the three members of the Board of Management at a total of T€1,154. Of that amount, T€710 are attributable to the performance-related component and represent the maximum amount possible for each member of the Board of Management. The variable income component with long-term incentive effects was fixed uniformly at approximately 63 percent of the maximum amount possible and totals T€444.
Allowing the investment team to share in the long-term performance of investments is standard procedure in the private equity industry. To that end, the focus is commonly not on the performance of a single investment. Rather, the profit effects of a pool of investments made over a specific investment period are considered. This procedure therefore also reflects downside developments. For that reason, the remuneration for the Board of Management members who are concurrently members of the investment team consists of further variable components. These allow the Board of Management members to participate in the investment performance of DBAG and therefore have a long-term incentive effect. In the past years, the design of these variable components was adapted in conformity with the changed practice in the private equity sector. Currently, there are two models in place that are orientated around the relevant investment period:
> The profit-sharing scheme for investments entered into up to the year 2000 is geared to the return on net asset value of DBAG. Profit-sharing awards are only granted if the return on net asset value for the reporting year exceeds the mark of 15 percent before taxes and bonuses. The computation base of net asset value relates exclusively to investments included in this variable component, which chiefly consists of the investments in Homag Group AG (that part invested prior to 2007), in Grohmann GmbH and the Dr. Vogler Group. For current members of the Board of Management who concurrently are members on the investment team, the realisations of the investments in Homag and the Dr. Vogler Group have resulted in remuneration components of T€1,006 for financial year 2013/14. Only those current and former Board of Management members who joined DBAG prior to August 2000 receive this remuneration component. With the realisation of these older investments, this profit-sharing scheme has again declined in significance for the future.
1 0 2 C O M B I N E D M A N A G E M E N T R E P O R T

> The scheme installed for investments made from 2001 to 2006 is common practice in the private equity industry. Profit-sharing awards are granted beginning at a minimum return on the investments of eight percent annually after calculatory costs of two percent. They are exclusively paid from realised profits. The entitlement of current Board of Management members under this profit-sharing scheme totals T€372 for financial year 2013/14, following T€74 for the previous year. Two thirds of these entitlements are paid after the close of a financial year. Entitlement to the remaining one third is subject to a final review after the disinvestment phase of all investments involved has been completed, and is paid in the amount of the remaining final entitlement.
Performance-related components of this kind will no longer be awarded for co-investments entered into since 2007, i.e., the commencement of the investment period of DBAG Fund V, nor for those that will be made in the future. The members of the Board of Management, who are also members of the investment team, have since then been sharing in the performance of these investments through a private co-investment. This is detailed in note 38 to the consolidated financial statements “Information based on IAS 24, Carried interest investments by key management staff”.
The remuneration for current Board of Management members in financial year 2013/14 totalled T€3,992 (previous year: T€2,124) and is distributed over the individual components as follows:
Component not linked to performance
Performance-related components
Components with long-term incentive effects Total
T€ 2013/14 2012/13 2013/14 2012/13 2013/14 2012/13 2013/14 2012/13
Torsten Grede 572 535 280 241 910 59 1,762 835
Dr Rolf Scheffels 572 515 280 280 818 14 1,670 809
Susanne Zeidler 316 300 150 180 94 0 560 480
Total 1,460 1,350 710 701 1,822 73 3,992 2,124
Follow-on emoluments of former Board of Management members arising from per formance-linked profit-sharing schemes for older investments (investments entered into up to 31 December 2000 and from 2001 to 2006) amount to a total of T€1,479.
Pension arrangements: Two models
Pension commitments to members of the Board of Management are based on two models. Commitments to Board of Management members initially appointed to the Board up to 1 January 2001 provide for defined annual pension benefits. Members appointed later to the Board participate in a contribution plan. This plan is also applicable to other staff of Deutsche Beteiligungs AG; it has been closed to employees exempt from collective agreements and members of the corporate bodies since the beginning of financial year 2004/05. Board of the Management members appointed for the first time to the Board since then do not receive pension benefits.
A N N U A L R E P O R T 2 0 1 3 / 1 4 1 0 3
CO
MB
INE
D M
AN
AG
EM
EN
T R
EP
OR
T

More information in the notes to the consolidated financial statements, note 30 “Pension obligations and plan assets”
Pension arrangements for Torsten Grede provide for defined annual pension benefits; they amount to T€87. Dr Rolf Scheffels participates in a contribution plan: for each year of service, a one-time pension contribution is paid that is measured by a percentage of the total compensation paid for that year. The annual retirement benefit component amounts to 0.75 percent of total compensation, and six percent on those parts of the emoluments exceeding the income threshold set by the state pension plan, each multiplied by an age factor that decreases with increasing age. The annual contribution for Board of Management members is based solely on the fixed salary. The accrued pension capital for Dr Scheffels is capped at a contribution that corresponds to an annual pension entitlement of T€87. At 31 October 2014, the cap did not have an effect. The pension capital for Dr Scheffels at 31 October 2014 amounted to T€2,010 (previous year: T€1,419).
Service costPresent value of the
defined benefit obligation
T€ 2013/14 2012/13 31 Oct. 2014 31 Oct. 2013
Torsten Grede 62 41 1,522 1,024
Dr Rolf Scheffels 54 46 1,154 920
Total 116 87 2,676 1,944
This past financial year, the sum of T€842 (previous year: T€727) was paid to former Board of Management members or their surviving dependents. The present value of pension obligations to former Board of Management members or surviving dependents totalled T€23,266 at the end of the reporting period (previous year: T€20,020).
Supervisory Board compensation: New scheme applied for the first time
The remuneration for members of the Supervisory Board is determined by shareholders at the Annual Meeting. In financial year 2013/14, it was based for the first time on a resolution passed at the Annual Meeting on 26 March 2013 and consisted of two components: an annual fixed fee of T€50 and bonuses for the chairmanship, vice chairmanship and committee membership. In the preceding 2012/13 financial year, the annual fixed fee had amounted to T€30; the performance-related component contained in the former scheme did not fall due in 2012/13.
The Chairman of the Supervisory Board receives a maximum of twice the fixed fee, irrespective of his membership on various committees. The Vice Chairman of the Supervisory Board and the Chairman of the Audit committee receive a maximum of one and a half times the fixed fee. Membership on the Executive Committee is compensated by one quarter of the fixed fee.
1 0 4 C O M B I N E D M A N A G E M E N T R E P O R T

The arrangements for the remuneration of the Supervisory Board are presented on the Internet at www.deutsche-beteiligung.de/corporate-governance
Remuneration paid to members of the Supervisory Board totalled T€388 in financial year 2013/14 (previous year: T€233). It was distributed as follows:
T€ Fixed fee Bonus Total
Andrew Richards (Chairman) 50 50 100
Roland Frobel 50 0 50
Wilken von Hodenberg 50 0 50
Philipp Möller 50 13 63
Dr Hendrik Otto 50 0 50
Gerhard Roggemann (Vice Chairman) 50 25 75
Total 300 88 388
In financial year 2013/14, members of the Supervisory Board did not receive fees for con-sultancy services.
TA K EOV E R - R EL AT E D D I S C LO SU R ES ( § 2 8 9 (4 ) A N D § 315 (4 ) G E R M A N CO M M ERC I A L CO D E – H G B
The share capital of Deutsche Beteiligungs AG amounted to 48,533,334.20 euros at the end of the reporting period on 31 October 2014. It is denominated into 13,676,359 no-par value registered shares. Arithmetically, the capital attributable to each share is approximately 3.55 euros. Various classes of shares do not exist. All shares carry the same rights and obligations. Except for any possible own shares on which the Company is not entitled to exercise rights, each no-par value share carries one vote. The right to vote begins when the shares are paid in full. Rights and obligations attached to the shares ensue from the statutory provisions, in particular §§ 12, 53a ff., 118 ff., and 186 German Stock Corporation Act (AktG).
In August 2012, the Company was notified in accordance with § 21 German Securities Trading Act (WpHG) that 25.04 percent of the voting rights and the share capital were held directly by Rossmann Beteiligungs GmbH, Burgwedel, Germany, and indirectly by Mr Dirk Rossmann, Germany. The voting rights held by Rossmann Beteiligungs GmbH are attributable to Mr Dirk Rossmann in accordance with § 22 (1) sentence 1 No. 1 of the German Securities Trading Act (WpHG). A decontrol agreement has existed between Deutsche Beteiligungs AG and Rossmann Beteiligungs GmbH since March 2013. According to the agreement, Rossmann Beteiligungs GmbH undertakes to exercise, for resolutions concerning the election or dismissal of Supervisory Board members, the voting rights attached to shares in DBAG attributable to the Rossmann group as a whole, now and in the future, within a scope of no more than 45 percent of the voting capital present at an Annual Meeting. The agreement is valid for a term of five years. The Board of Management knows of no other restrictions relating to voting rights or the vesting of shares.
A N N U A L R E P O R T 2 0 1 3 / 1 4 1 0 5
CO
MB
INE
D M
AN
AG
EM
EN
T R
EP
OR
T

In accordance with the Articles of Association of DBAG, the Board of Management consists of at least two individuals. Its actual number of members is determined by the Supervisory Board, which, pursuant to § 84 (1) German Stock Corporation Act (Aktiengesetz – AktG), appoints the members of the Board of Management for a maximum period of five years. A reappointment or prolongation for a maximum period of five years is admissible. A simple majority of the votes cast is required for appointments of members to the Board of Management. In the event of an equality of votes, the Chairman of the Supervisory Board has the casting vote (§ 11 (4) of the Articles of Association). In accordance with the Articles of Association, the Supervisory Board may exempt all or individual members of the Board of Management, in general or in individual cases, from the restrictions in § 181 German Civil Code (Bürgerliches Gesetzbuch – BGB). To date, no use has been made of these provisions. Based on § 84 (3) German Stock Corporation Act, the revocation of an appointment is only admissible for reasonable cause.
Amendments to the Articles of Association may be adopted pursuant to the provisions of §§ 179, 133 of the German Stock Corporation Act (AktG) and to § 5 (3) and (4) and § 17 of the Articles of Association. The Articles of Association of DBAG make use of the option to deviate from the required majority as stipulated by law and provide for basically adopting resolutions at the Annual Meeting by a simple majority of votes and, insofar as a majority of the share capital is required, by a simple majority of the share capital, except where the law or the Articles of Association determine otherwise. The Supervisory Board may adopt amendments to the Articles of Association that relate merely to the wording.
At the Annual Meeting on 23 March 2011, the Board of Management was authorised, in accordance with § 71 (1) No. 8 German Stock Corporation Act (AktG), to purchase own shares of up to ten percent of the share capital up to and including 22 March 2016. The Board of Management may choose to acquire shares via the stock exchange or via a tender offer to all shareholders or an invitation to submit such a tender.
The Board of Management is authorised, subject to consent by the Supervisory Board, to resell own shares, for example, as consideration in conjunction with corporate acquisitions or mergers or acquisitions of investments in enterprises under suspension of shareholders’ pre-emptive rights in other ways than via the stock exchange or by a public offer to all shareholders.
Pursuant to the resolution adopted at the Annual Meeting on 24 March 2010, the Board of Management has been authorised, with the consent of the Supervisory Board, to raise the share capital until 23 March 2015 by up to a total of €24,266,665.33 (Authorised Capital 2010) through one or several issues of new registered no-par shares in exchange for cash and/or non-cash contributions. Shareholders shall principally be granted subscription rights. The Board of Management is, however, authorised to exclude shareholders’ pre-emptive rights in certain instances and within a certain capital range.
1 0 6 C O M B I N E D M A N A G E M E N T R E P O R T

For details on the authorisations: www.deutsche-beteiligung.de Agenda for the Annual Meetings on 24 March 2010 and 23 March 2011
In conjunction with the authorisation adopted at the Annual Meeting on 24 March 2010 concerning the issuance of warrant-linked bonds and/or convertible bonds with the option of excluding shareholders’ pre-emptive rights in certain instances and within a certain capital range, the share capital of the Company may be conditionally raised by up to €24,266,665.33 euros through the issuance of 6,838,179 new registered shares to holders or creditors of warrant-linked bonds and/or convertible bonds who exercise their option or conversion rights or fulfil their conversion obligations (Conditional Capital 2010/I).
These authorisations are detailed in the respective resolutions passed at the Annual Meetings mentioned above. In the reporting year, the Board of Management did not make use of the authorisations.
The members of the Board of Management do not have a special right to terminate their service contracts in the event of a change of control at Deutsche Beteiligungs AG. In this event, they are also not entitled to severance payments based on compensation agreements.
CO R P O R AT E G OV ER N A N C E S TAT EM EN T ( § 2 8 9A G E R M A N CO M M E RC I A L CO D E – H G B)
The Corporate Governance Statement pursuant to § 289a HGB is permanently accessible at our website in section Investor Relations under Corporate Governance (www.deutsche-beteiligung.de/management-declaration). It contains the Declaration of Conformity to the German Corporate Governance Code in accordance with § 161 German Stock Corporation Act (Aktiengesetz – AktG), information on corporate governance practices and the responsibilities and processes of the Board of Management and the Supervisory Board. The Corporate Governance Statement and, in that context, the other statutory information on corporate governance are an integral part of the audited combined management report.
A N N U A L R E P O R T 2 0 1 3 / 1 4 1 0 7
CO
MB
INE
D M
AN
AG
EM
EN
T R
EP
OR
T

O P P O R T U N I T I E S A N D R I SK S
O P P O R T U N I T Y A N D R I S K M A N AG EM EN T S Y S T EM
Objective: Optimise the reward/risk profile
The business policy of Deutsche Beteiligungs AG is targeted at increasing the value of DBAG by making profitable investments in portfolio companies. In other words: we take advantage of opportunities to invest in promising companies. To exploit these opportunities, it is crucial to have an effective opportunity management system in place, for instance, through ongoing market observation and structured analysis of identified and feasible potential investments.
Our risk management system has the objective of providing a comprehensive overview of the Group’s risk profile. Events involving material negative financial effects for the Group in particular must be recognised promptly so that we can define and take counteraction to avoid, mitigate or manage these risks.
The management of opportunities and risks is our daily routine: we understand it as an integrated continual entrepreneurial process. The objective is to optimise the reward-risk profile. Risk that endangers the continuity of the Company must be avoided.
Strategy: Appropriately monitor all phases of investment activity
The purpose of the risk management system is to identify, analyse, control and monitor risk exposure. In that context, the individuals responsible develop recommendations on the design of risk management processes, on an appropriate estimation of business-specific rewards and risk, and on utilising opportunities and risk.
Key risks and opportunities in our business relate to the four phases involved in our investment activities: the identification, acquisition, holding and disposal of investments. The management of opportunities and risks therefore considers detailed information from the operating business of the investment team in the analysis. Optimising the opportunity-risk profile begins when screening potential investments and extends to applying suitable instruments in monitoring and supporting our portfolio companies – the core of our operational business.
1 0 8 C O M B I N E D M A N A G E M E N T R E P O R T

Structure: Board of Management directly responsible
The basis of the risk management system is a risk management manual, which, we believe, depicts and analyses exposure to all major risks. We document the specified action to control and monitor these risks. This is firmly embedded in the Group‘s workflows and achieved through organisational directives and the definition of processes. Additionally, there are numerous instruments and measures that we employ to monitor and manage specific entrepreneurial opportunities and risks. Risk management is the direct responsibility of the Board of Management: a risk manager has been appointed who reports directly to the CFO.
Processes: Board of Management regularly assesses opportunities and risks
The monitoring, adaptation and optimisation of the risk management framework are the responsibility of a risk manager, who reports to the responsible Board of Management member. The results of ongoing risk surveillance are presented to the complete Board of Management in a quarterly risk management report. Significant risks that emerge unexpectedly – for instance, from certain portfolio companies – must be reported immediately.
The Board of Management is directly involved in an appropriate evaluation of risks and opportunities and how they are addressed. It regularly reviews whether assessments have changed and which action is to be taken in response. Basically, a member of the Board of Management, who is also a member of the investment team, is assigned to every portfolio company. This ensures that the entire Board of Management gains direct and prompt knowledge of any new developments in respect of opportunities and risks.
The Board of Management comprehensively informs the Supervisory Board at least on a quarterly basis about the Company’s risk exposure and that of its investee businesses. In the event of an unexpected and material change in the exposure to risk, the Board of Management informs the Supervisory Board immediately.
I N V ES T M EN T S T R AT EG Y A L I G N ED TO O B J EC T I V ES
Deutsche Beteiligungs AG basically invests only in established companies with proven business models. Our investee businesses should have a leadership position in their – possibly very small – market.
Co-investments in the form of expansion financings can generate a part of the earnings that are achievable from these investments as dividends or interest during the holding period. By contrast, the main part of the profit from MBOs is generally realised at the end of the investment phase. The majority shareowner in an MBO is able to exert greater control. Based on our estimation and experience, expansion capital investments tend to have a lower risk profile than MBOs, since these target companies generally have lower levels of debt. Correspondingly, we expect somewhat lower returns on these investments.
A N N U A L R E P O R T 2 0 1 3 / 1 4 1 0 9
CO
MB
INE
D M
AN
AG
EM
EN
T R
EP
OR
T

The development of individual investee businesses directly affects the performance of the Company. Should an individual portfolio company exhibit a negative business trend and its value be impaired, such developments must not put the Company itself at risk. We therefore principally limit the amount invested in any one investment. The acquisition cost should not exceed ten percent of the Company’s equity at the time of the investment. An asymmetrical development in the value of individual investments could, however, cause the value of an individual portfolio company to total more than ten percent of DBAG’s equity.
DBAG focuses on investments in larger companies. Experience has shown that such companies tend to have a seasoned management team, a solid market position and are generally more stable, for instance, because they operate globally. Co-investments in larger companies will therefore tend to mitigate risk. Acquiring larger companies, and at the same time diversifying the portfolio by sectors, customer markets and business models by investing in many such companies, requires a broad capital base. DBAG achieves this together with the DBAG funds.
A diversified portfolio – both in terms of the number of investments and of various business models – not only mitigates risk, it also creates opportunities. DBAG primarily invests in companies with promising development potential. Such companies can be found in various sectors of Germany’s “Mittelstand”. In addition to strongly cyclical business models, there are companies that serve relatively stable consumer demand and thereby mitigate the effects of cyclical swings. Nonetheless, the portfolio is focused on certain sectors. For instance, companies operating in the mechanical engineering and plant construction sector accounted for a significant proportion of 49 percent of the total portfolio. These mechanical engineering and plant construction companies, however, operate in very different niche markets and geographical regions so that, in our opinion, no particular sector risk exists.
Although the concentration in DBAG’s portfolio declined this past financial year, 53.2 percent of the portfolio value related to only five investee businesses at the reporting date. However, in view of the high proportion of liquid funds at the reporting date in relation to equity and the smaller share of financial assets, we consider the risk arising from this concentration as being acceptable.
We generally enter into our co-investments without there being an obligation to provide follow-on financing for portfolio companies in times of crisis. Nevertheless, this could become advisable in certain instances for a number of reasons, such as ensuring earnings opportunities or for reputational reasons. We cannot exclude that such follow-on financings may become necessary in the future. In assessing a portfolio company’s additional funding needs, we apply the same criteria as we do for new investments. However, additional aspects may be relevant for the decision. In certain circumstances, the risk profile for follow-on funding may be greater than for new investments.
1 1 0 C O M B I N E D M A N A G E M E N T R E P O R T

D ES C R I P T I O N O F R I S K FAC TO R S
Probability of occurrence
Possible financial effects
Risk exposure vs. previous year
External and sector risks
Economic cycles likely significant increased
Changes in legal and taxation framework possible moderate unchanged
Strategic and operational risks
Access to investment opportunities possible significant unchanged
Performance of portfolio investments possible significant unchanged
Fundraising possible significant unchanged
Personnel risks possible significant unchanged
Operational risks unlikely significant reduced
Financial risks
Equity for the financing of investments (liquidity) unlikely significant unchanged
Availability of acquisition finance possible significant unchanged
Currency and interest rate risks possible moderate increased
In the estimation of the Board of Management, the risk factors described in the following could have a significant negative impact on the asset, financial and earnings position of Deutsche Beteiligungs AG, the price of DBAG shares and the Company’s reputation. Other risks that may be unknown or currently regarded as insignificant could also affect DBAG’s performance. Also described is how these risks are addressed by the opportunity and risk management system.
A N N U A L R E P O R T 2 0 1 3 / 1 4 1 1 1
CO
MB
INE
D M
AN
AG
EM
EN
T R
EP
OR
T

E X T ER N A L A N D S EC TO R R I S K S
Economic cycles: Selective investment process to mitigate risk exposure
The development of our portfolio companies is influenced by a variety of market factors. These include geographical and sector-related economic cycles, political and financial scenarios as well as commodity prices and currency rate trends. The performance of our portfolio companies – specifically, their earnings and financial position – determines the development of the investments’ fair value which, in turn, has a direct impact on the Group’s earnings and financial position. Additionally, valuation ratios in the equity and financial markets are mirrored in the measurement of the fair value of our portfolio companies.
These market factors sometimes change at very short notice, and our ability to address them may, of course, be limited. Short-term results, however, are not decisive for success in private equity. Our investment decisions are based on strategic plans that target value creation over a span of several years. The holding periods for investments generally extend beyond the length of individual cyclical phases. We held the investments (MBOs and expansion financings) that were realised over the past ten financial years for an average of about five years.
We address the opportunities and risks involved in economic cycles through a careful selection of portfolio companies. The basis for this is our investment strategy. However, our investment decisions are also driven by other specific considerations – not least by the purchase price for new investments, which must hold out prospects of achieving returns on the investment commensurate with the risk involved.
Subsequent to Schülerhilfe in the prior financial year, Unser Heimatbäcker is the second company that has a stronger focus on the German domestic market and consumer demand than a number of our other portfolio companies. Moreover, both sectors – tutoring services and bakeries – are considered stable and non-cyclical. In contrast, the businesses of most of our portfolio companies are internationally diversified and have different geographical focuses. Specific country-related economic trends should, as a rule, normally not materially impact the performance of the total portfolio. However, in times of massive global downturns, negative impacts on the portfolio companies and their valuation may be unavoidable.
We do not expect such a massive downturn at the moment; however, we do see risks for the economy in the coming twelve months. Among them are an aggravated geopolitical environment, persistent weak growth in Europe and in many growth countries, as well as the interest rate policy of central banks. The political conflicts in Eastern Europe have already entailed economic sanctions, and in a number of regions in the world there are militant conflicts that threaten to escalate. In major member states of the European Union (France, Italy), business dynamism is weak. Growth has slowed down in Germany as well. If the low-interest-rate policy of key central banks were to be ended, this could – depending on the timing and design of the interest turnaround – harbour the risk of major macroeconomic distortions and greater volatility in the stock markets.
Information on the holding periods of current investments page 73
1 1 2 C O M B I N E D M A N A G E M E N T R E P O R T

Legal and taxation framework: Greater legal certainty following registration as an AIF management company
Our business is subject to many different regulatory and fiscal influences. These have an effect on the immediate investment business as well as on opportunities to raise, manage and advise funds. This gives rise to risks, but occasionally may also create opportunities for the Company.
We successfully completed the registration process pursuant to the German Investment Code (KAGB) in July 2014 and have since been registered as an AIF management company. However, there is still a certain degree of legal uncertainty about the interpretation of this very new law issued by the German Federal Financial Supervisory Authority (BaFin). The KAGB sets out new regulations on the marketing of shares in funds. The extent to which this will entail material hindrances when raising the next DBAG fund, is not completely foreseeable at the moment. Furthermore, the interplay between the KAGB and the German Special Investment Company Act (UBGG) has not been conclusively clarified and also requires an interpretation on the part of two different supervisory authorities – the Ministry of Economics of the State of Hesse for UBGG, and BaFin for KAGB.
The directive by the European Commission on a reform of insurance and reinsurance regulations in Europe defines, among other things, the solvency requirements and risk management for the insurance industry. This directive (Solvency II) has not yet been transposed into national law, but is to take place by the end of March 2015, with application of the new rules starting in 2016. It cannot be excluded that it may then become more difficult for insurance companies to invest in private equity funds. Insurance companies, however, only represent a (small) part of potential investors in private equity funds. Company pension schemes and pension funds are not affected by the directive. On the other hand, insurance companies could then transact their private equity investments through public companies; this could create opportunities for additional demand for DBAG shares.
Fundamental changes to tax legislation that would lead to taxes being imposed on foreign partners of German fund companies would have serious disadvantages for DBAG. International investors could, for instance, make private equity investments in Germany through competitors of Deutsche Beteiligungs AG who invest in Germany via foreign fund structures. This would impact the Company’s ability to raise capital for parallel investment funds. Adverse taxation conditions could therefore compel us to make radical structural changes. This might include relocating the Company’s domicile.
Risks may also ensue from foreign-based legislation that regulates financial investors, fund investors or funds. Particularly in the aftermath of the most recent financial crisis, rules have been changed, such as in the United States. At present, however, there is no indication that the Dodd-Frank Wall Street Reform and Consumer Protection Act (DFA) or the Foreign Account Tax Compliance Act (FATCA) would restrict our business activity.
We regularly review amendments to legal frameworks on the marketing of our shares. DBAG shares are not affected by the restrictions of the British Financial Conduct Authority for non-mainstream pooled investments.
A N N U A L R E P O R T 2 0 1 3 / 1 4 1 1 3
CO
MB
INE
D M
AN
AG
EM
EN
T R
EP
OR
T

S T R AT EG I C A N D O P ER AT I O N A L R I S K S
Access to investment opportunities: Tapping deal sources
Access to new investment opportunities is of key significance for our operations. Without a sufficient number of attractive investment opportunities we would be unable to successfully pursue our business model. Investors in DBAG funds expect investment activity to progress in a way that is commensurate with the committed fund size. If a part of the committed assets were not invested within the fixed investment period, this would diminish chances for raising a successor fund. The follow-on fund might then either be smaller in size, or, at worst, no new fund would come to pass at all. Fund investors in existing funds would possibly also want to lower fees for investment services to the funds.
However, we have no influence on developments in the private equity market. Recently, the competitive environment has changed: with a view to the persistent low-interest-rate phase and the abundant stream of capital associated with it, financial investors are not only competing with strategic investors, but, increasingly also with foundations and family offices seeking more profitable investment opportunities.
Our ability to mitigate the risks arising from a decline in the number of potential transactions is very limited. We address this risk, among other things, by originating transaction opportunities through a proprietary deal flow. That gives us greater independence from general market trends and increases the probability of completing transactions.
Our success also depends on gaining early knowledge of potential transactions in our market. We have built the resources and instruments to ensure a prospective high-quality deal flow.
In seeking informational leads, DBAG utilises existing contacts that stem from its long-standing market presence. We attach great importance to cultivating our network, which consists of board members, senior executives and partners of former portfolio companies, representatives of banks, consultants, attorneys and auditors. The network also includes a circle of experienced sectoral experts. In regular meetings with the members of our network, we regularly discuss transaction opportunities in specific core sectors, such as in mechanical engineering or the automotive supplier industry. Of particular significance is our investment team; boasting 23 members (including the two Board of Management members); it is one of the largest in our segment of the market. Targeted public relations activity and cultivation of our network assist in augmenting awareness of DBAG and strengthening our market presence. Compared with its mostly unquoted competitors, DBAG profits from its stock market listing. It creates higher awareness of DBAG’s activities among the general public and allows potential investment partners to gain insight into the investor. Moreover, the transparency and regulation linked to a stock market listing help to build confidence.
1 1 4 C O M B I N E D M A N A G E M E N T R E P O R T

Performance of investments: Addressed through close monitoring
Current income from the portfolio companies (dividends, profit distributions or interest income) is momentarily of subordinate importance for the performance of DBAG. This is rarely an issue in structuring MBOs; it can, however, play a greater role in expansion financings. DBAG’s strategy is primarily focused on increasing the value of the portfolio companies. A key business-linked risk is therefore attached to the portfolio companies’ performance. In extreme cases, this could lead to a total loss of the capital invested and possibly entail further adverse consequences, such as a loss of reputation.
We address this risk by a comprehensive set of instruments: we work on projects in project teams consisting of a number of staff and always involving a member of the Board of Management. We follow defined processes during the acquisition, holding and realisation phases. These measures are aimed at ensuring professional, systematic processes. They are designed to set the platform for successful purchasing and selling decisions. Moreover, we want to respond quickly both to developments that may either endanger the targeted value growth or possibly create opportunities for additional value appreciation.
During the acquisition phase only such investment projects are pursued as conform to our investment strategy. An exacting due diligence investigation precedes every investment decision or recommendation. This may include mandating external consultants. These procedures serve to identify the opportunities and risks inherent in an investment decision or recommendation with a high degree of certainty. We endeavour to limit, redeploy or otherwise mitigate exposure to risk. This is achieved, for instance, through the appropriate formulation of contract terms, warranty agreements or insurances.
We ordinarily finance our investments through equity and – for buyouts – bank loans. Beyond that, additional funding sources may be used, such as mezzanine capital and vendor loans. Structuring the financing is a key component in the acquisition phase. This is where all findings gained in the due diligence process and in developing the corporate plan are considered.
We attach great importance to a robust financing structure and therefore compile a detailed model calculation ahead of an investment. Debt levels should leave scope for the company to develop as projected and to service its debt. The financing should contain reserves in the event of the company’s underperformance.
During the development phase, meaning the holding period, we render our support primarily by taking offices on supervisory boards or advisory councils. The portfolio companies’ monthly financial metrics are processed in a standardised controlling procedure. The investment-controlling unit analyses the data independently. We review and discuss projects based on quarterly reports. We discuss events and developments of topical importance in meetings of the Board of Management and in the investment team’s project meetings.
A N N U A L R E P O R T 2 0 1 3 / 1 4 1 1 5
CO
MB
INE
D M
AN
AG
EM
EN
T R
EP
OR
T

We create the platform for an investment’s successful development as early as the acquisition phase. That includes considering who might be an interested party for the portfolio company at the end of the development phase that we supported. If DBAG and the DBAG fund merely hold a minority position, agreements on the ways and terms of ending the investment are regularly made at the onset of the investment. We will only enter into investments in portfolio companies whose development is assessed to be sustainably positive, where we can expect sufficient buying interest on the part of trade buyers or financial investors, or where prospective eligibility for flotation exists. Realisation opportunities are regularly discussed during the quarterly reviews of the portfolio companies’ performance.
The risk management instruments currently employed are, in our opinion, suited to ensuring early identification of possible negative developments in portfolio companies, thus allowing for any necessary counteraction to be taken. Concurrently, these instruments should enable us to identify opportunities that contribute towards optimising the performance of investments. These instruments, for example, include capital increases to enable the purchase of a complementary business, or adjusting the capital structure by a dividend distribution.
Fundraising: Track record a prerequisite for future DBAG funds
We will only be able to pursue our strategy in its present form in the long term, if we succeed in soliciting capital commitments to DBAG funds. This requires the ability of the Company or its investment team to boast a positive track record in making private equity investments that have generated attractive returns on the invested capital, which depends on the absolute performance of the investment and on the investment progress of a fund. Other key aspects from the investors’ point of view are the stability and experience of the investment team. Also of influence are the overall economic environment, sentiment in the equity markets and readiness on the part of private equity investors to make new capital commitments. We recently succeeded in keeping key parameters used to determine the fees for advising the funds stable. However, it cannot be ruled out that investors in follow-on funds will want to negotiate lower fees in some years’ time.
DBAG Fund VI, which currently invests in MBOs, has capital commitments from external investors of 567 million euros. The investment period began in February 2013, or less than two years ago. In a sector comparison, investors rate the two predecessor funds, DBAG Fund V and DBAG Fund IV, a success. The DBAG Expansion Capital Fund has only completed about half of its investment period. Thus, there are sufficient assets available for at least the next two years. Consequently, there is currently no identifiable risk for DBAG arising from competition for new capital commitments.
DBAG is a co-investor in relation to DBAG funds. Compared to DBAG, the DBAG funds provide the larger part of the capital. They have own structures that take decisions on acquisitions and disposals. DBAG has committed to enter into co-investments alongside the DBAG funds. This co-investment activity can, however, be terminated unilaterally by DBAG; in that scenario, however, DBAG would forfeit the opportunity of co-investing alongside the respective fund and would not have an influence on the management of the vintage portfolio entered into jointly with the respective fund.
Advantages of investing alongside DBAG funds page 56/57
1 1 6 C O M B I N E D M A N A G E M E N T R E P O R T

A Group company in which DBAG as a managing limited partner holds a 20 percent interest receives a profit priority share from the respective funds for investment services. DBAG is entitled to the full profit priority share of this Group company. The management position of Deutsche Beteiligungs AG may be revoked. Exposure to risk stemming from the revocation of contractual relations is currently deemed to be very low. Rules governing the revocation of management authority for DBAG Fund V, DBAG Fund VI and the DBAG Expansion Capital Fund are presented in the notes to the consolidated financial statements in section “Related party transactions”.
Personnel risk: Retaining highly qualified staff through competitive incentive systems
Performance in private equity is closely linked to the people acting in the field. This holds particularly true for the investment team. Our business is highly specialised, and in our lean organisation the contribution made by every single individual is important. For that reason, other corporate services that support the investment business also require highly qualified and motivated staff.
The Company boasts a very loyal staff. At the end of financial year 2013/14, the staff (without apprentices) had an average of eight years of service; the investment team members have also been with the Company for an average of more than eight years.
We address the risk of staff fluctuation by fostering a motivating corporate culture and systematically developing the skills and knowledge of our people. We regularly offer (individualised) training programmes and provide monetary incentives through, for instance, variable income components. The comparatively small number of staff allows us to align assignments and development potential to the needs and capabilities of each of our people.
To be able to meet potential human resources needs, we regularly follow personnel movements in our sector. In view of the Company’s current staffing, we do not expect bottlenecks to occur over the short or mid-term.
Operational risk: Regular IT security audits against cyber attack
Operational risk plays a subordinate role in view of the relatively low number of administrative transactions, the relatively small number of staff and the involvement of several people in larger transactions. Exposure to operational risk is largely avoided through appropriate organisational procedures. For instance, our liquidity management requires that larger drawdowns of liquid funds be made jointly by two members of the Board of Management, up to a specified base liquidity limit.
Other operational risks relate to corporate services that support the investment business. These include the organisational units of finance, human resources, legal and fiscal, organisation/IT and public relations/investor relations. We ensure proper organisational workflows in these corporate sectors through a sufficient number of qualified people and the provision of suitable equipment and financial resources. This past financial year we started a project aimed at assessing and improving the processes in these areas. First steps have already been taken, but the project has not yet been completed.
A N N U A L R E P O R T 2 0 1 3 / 1 4 1 1 7
CO
MB
INE
D M
AN
AG
EM
EN
T R
EP
OR
T

Our business not only requires suitable software and hardware, but also data security, data access by authorised persons at any time and protection against unauthorised data access. DBAG has its own qualified IT specialists; they are supported by external consultants, if needed. In addition to standard software for our office communication, we use further applications for special purposes, such as accounting, investment controlling and customer relations management (CRM). If necessary, we have standard software adapted to meet our requirements. The software we use is continually updated and upgraded. Data is saved by daily back-ups and additionally by secured data archiving. Redundant server architecture warrants permanent access. Sensitive data is protected by a comprehensive access authorisation system.
DBAG attempts to respond to the continually growing IT risk by, among other things, regular external reviews. In an additional security audit in October 2014, consultants verified that, in their opinion, DBAG’s network is sufficiently protected against cyber attack. In light of the audit findings, the Company believes that there are no risks that would endanger operations.
F I N A N C I A L R I S K S
Equity for the financing of investments: Sufficient financial resources available
Cash outflows to finance investments in portfolio companies as well as cash inflows from the investments – in particular, sales proceeds – constitute the main treasury activities at DBAG. These transactions cause irregular payment flows that are hardly calculable: neither are investments in portfolio companies in terms of their timing, number or amounts foreseeable, nor do we know when an investment will be exited. The Company aims to have sufficient financial resources available at all times in order to accommodate its portion of the finance for investment transactions. This requires Deutsche Beteiligungs AG having access to financial, credit and stock markets, if appropriate.
There is currently no recognisable risk arising from the funding of the Group. By continually addressing and maintaining contacts with existing and potential investors as a core activity of investor relations, we aim to create the platform for DBAG to access the stock market in order to generate additional equity, if necessary.
We chiefly hold our liquid reserves in the form of public-sector securities or of other issuers with highest credit ratings and – from case to case – in time deposits with banks, whose credit standing we consider to be good, based on their ratings. In view of its sizeable cash and securities position, the Company currently does not require credit facilities.
1 1 8 C O M B I N E D M A N A G E M E N T R E P O R T

Availability of debt finance for acquisitions: Acquisition loans not a limiting factor
Loans furnished by banks or funds are used – as is customary in the private equity sector – to finance MBOs. Acquisition finance is therefore required in adequate amounts and at acceptable terms to finance investment projects. Apart from the financing structure of a transaction, lines of credit are also required for capital expenditures and for financing portfolio companies’ business operations. Loan facilities depend on the economic environment and conditions in the credit markets; DBAG has no direct influence on these.
We aim to have banks and other financial partners see us as professional, sound and dependable partners. Our risk-conscious and analytical procedures in selecting and structuring investment projects support the readiness of banks to extend facilities. Focusing in our investment strategy on established companies, whose operations, in our opinion, have a comparatively low risk profile, also serves that purpose.
This past financial year, acquisition finance for our line of business – i.e. mid-market MBOs in select sectors and with moderate debt levels – was not a limiting factor. Beyond that, our financial resources occasionally allow us to initially fund an investment completely from equity and then arrange the debt financing after agreeing on the investment. Moreover, we should also stand to profit from our long market presence and good relationships with many banks when competing for lending facilities in the future. We therefore assess the risk of insufficient availability of debt financing for us as being low.
A possible restrictive policy on the part of banks in funding acquisitions can also hamper our activities in the event of a proposed disinvestment. Financial investors are regularly among the potential buyers for our investments, who for their part also depend on a sufficient supply of acquisition finance. Low availability of finance influences their investment behaviour and, consequently, the sales proceeds we are able to achieve.
A restrictive lending policy in the banking sector may also tend to encumber the portfolio companies’ operational and strategic development. Portfolio companies can also be directly affected when clients cut down on capital expenditures or do not place orders due to lack of funding. On the other hand, this also creates opportunities. Such situations can trigger demand for expansion funding, which we provide through the DBAG Expansion Capital Fund.
We expect that the supply of debt financing will remain constant and therefore at adequate levels for our requirements. However, we are not in a position to make reliable predictions on the future availability of borrowings.
A N N U A L R E P O R T 2 0 1 3 / 1 4 1 1 9
CO
MB
INE
D M
AN
AG
EM
EN
T R
EP
OR
T

Currency and interest rate risks
Exchange rate fluctuations, such as between the euro and the US dollar, have increased over the course of 2014. We therefore assess the currency risk as being greater than a year ago. The management, extent and sensitivity of currency and interest rate risks are detailed in section “Additional notes” in the notes to the consolidated financial statements. We refer to the information disclosed there.
D ES C R I P T I O N O F O P P O R T U N I T I ES
Opportunities inherent in external and sector changes
The value of our portfolio companies at a specific reporting date is significantly influenced by stock market conditions. This was again evidenced this past financial year: 8.2 million euros of the net result of valuation and disposal are attributable to higher stock market multiples and thereby to improved confidence on the part of market participants. Should the optimism in the stock markets continue to grow, this would lead to higher valuations, which, in turn, would have an influence on our valuations.
In view of the persistent low-interest-rate policy, we would not rule out that monetary flows will continue to be channelled into the stock markets and drive prices there. Should higher valuation levels also strike the M&A business, this could possibly lead to higher capital gains on disposals of our investments.
Strategic and operational opportunities
Competition for attractive investment opportunities has become more intense in recent years. A factor that is sometimes crucial in the competitive field is the ability to come to an agreement with the vendor within a tight time frame. Rapid availability of the required funding can shorten the acquisition process. In that respect, opportunities could arise for DBAG from its sizeable financial resources, which enable DBAG to make financing commitments under its own steam.
We continued to pursue a project in 2013/14 aimed at analysing our internal processes. The project accounts for the growth Deutsche Beteiligungs AG has exhibited in the past years: the investment team was expanded, and, since 2011, DBAG has managed or advised two funds that are concurrently in their investment phase. Based on the analysis, options for optimising our processes were identified, which we began to implement in 2013/14. After completion of the project, we may, for instance, be able to tap additional proprietary transaction opportunities or assess potential investments more specifically.
Disclosures on financial risks: Notes to the consolidated f inancial statements page 168
1 2 0 C O M B I N E D M A N A G E M E N T R E P O R T

Opportunities arising from changes in financing conditions and exchange rates
Deutsche Beteiligungs AG had financial resources of 150.7 million euros at the end of the period; these are largely invested at fixed interest rates. However, a part of these resources yields interest at the three- or six-month EURIBOR rate. Should these rates rise by one percentage point, this would result in interest income – irrespective of possible outflows of funds due to our investment activity or a dividend payment. An overall higher interest rate level would also allow us to reverse part of our pension provisions; this would increase the net asset value per share through higher other comprehensive income.
A lower interest rate level, on the other hand, could decrease the cost of acquisition finance; this would improve the return on debt-financed investments.
In addition to unchanged stock market ratios, our forecast also implies stable currency rates. Approximately 19 million euros of the portfolio value at 31 October 2014 are attributable to investments denominated and valued in US dollars. For example, an increase in the exchange rate of the US dollar against the euro would, viewed in isolation, trigger a positive valuation movement of 1.9 million euros.
G EN E R A L S TAT EM EN T O N O P P O R T U N I T I ES A N D R I S K S
Continuity of Group not at risk; no exceptional opportunities
In our estimation, there are currently no recognisable individual or cumulative risks that would endanger the continuity of DBAG or the Group as a going concern. This estimation is based on an analysis and assessment of the material individual risks to which the Company is exposed, as well as on the risk management system in place. An assessment of the exposure to risks is presented in the overview on page 111 of this combined management report. Neither do we currently recognise any exceptional opportunities.
There was no material change in the exposure to risks and opportunities compared with the preceding year. Overall, we presently judge the exposure to risks and opportunities as being balanced.
A N N U A L R E P O R T 2 0 1 3 / 1 4 1 2 1
CO
MB
INE
D M
AN
AG
EM
EN
T R
EP
OR
T

K E Y FE AT U R ES O F T H E ACCO U N T I N G - R EL AT ED I N T ER N A L CO N T RO L A N D R I S K M A N AG EM EN T S Y S T EM ( § 2 8 9 (5 ) A N D § 315 (2 ) N O. 5 G ER M A N CO M M ERC I A L CO D E – H G B)
The internal control system (ICS) is an integral constituent of the risk management system at Deutsche Beteiligungs AG. It is orientated around the internationally recognised framework document for internal control systems by the Committee of Sponsoring Organizations of the Treadway Commission (COSO). This framework underscores the fact that even when appropriate and functional systems have been put in place there can be no absolute guarantee that risks are identified and managed.
The extent and design of the internal control and risk management system are aligned to the special requirements of the fund management and advisory business. The duty of the internal audit is to monitor the functioning and effectiveness of the ICS independent of processes within the Group and at Deutsche Beteiligungs AG and thereby promote ongoing improvements to business processes. The accounting-related part of the ICS is subject to an annual review as to its effectiveness by the external auditor within the scope of a risk-oriented audit approach in spot tests. Finally, the Audi Committee has the oversight responsibility over the ICS, as is required by § 107 (3) of the German Stock Corporation Act (AktG).
DBAG prepares its separate and consolidated financial statements in conformity with the applicable accounting and valuation principles of the German Commercial Code (Handelsgesetzbuch – HGB) and the International Financial Reporting Standards (IFRS). The internal accounting guidelines are set out in an accounting manual and in valuation guidelines; they consider the different principles of the IFRS and HGB. New accounting rules are regularly reviewed as to their implications for DBAG and its subsidiaries and, if necessary, the accounting guidelines are adapted.
1 2 2 C O M B I N E D M A N A G E M E N T R E P O R T

Moreover, DBAG possesses clearly defined organisational, control and surveillance structures. Explicit assignments within the accounting process are in place. The IT systems used in accounting are largely operated with standard software products; these are protected against unauthorised access internally and externally by comprehensive access permissions. All individuals involved in the accounting process are qualified for their assignments. The number of individuals working here is sufficient to handle the workflow. The aim is to minimise the risk of erroneous accounting. The staff regularly participates in further education programmes and professional training sessions on tax and accounting-related topics. Additionally, advice from external experts is solicited on specific accounting issues.
Material accounting-related processes are regularly examined analytically in respect of the availability and operability of the installed internal controls. The completeness and validity of accounting data are regularly reviewed manually based on random samples and plausibility checks. For processes that are particularly relevant in accounting, the four-eyes principle is consistently employed.
The internal controls are designed to ensure that the external financial reporting by DBAG and the Group is reliable and in conformity with the valid accounting rules. The aim is to minimise the risk of possible misstatements on the actual asset, financial and earnings position. We also gain important insight into the quality and operability of accounting-related internal controls through the annual audit of the separate and consolidated financial statements.
A N N U A L R E P O R T 2 0 1 3 / 1 4 1 2 3
CO
MB
INE
D M
AN
AG
EM
EN
T R
EP
OR
T

R EP O R T O N E X P EC T ED D E V ELO P M EN T S
Period covered by this report: Short-term predictions do not do justice to business model
Our business lends itself to a medium- to long-term assessment, planning and prognosis horizon. That applies both to co-investment activity and to fund management and advisory services.
Events or trends that were not predictable at the beginning of a financial year frequently have a significant impact on the consolidated results of a period. These include realisations that, at times, achieve prices clearly in excess of their most recent valuation, as well as unexpected developments in portfolio companies’ consumer markets or in the stock market. This means that the results of a single financial year only conditionally reflect the long-term performance of our co-investments alongside the DBAG funds. This is also evidenced by the broad spread in which the return on net asset value fluctuated over the past ten years: that spread ranged from -17.5 percent to 56.2 percent, but averaged 15.3 percent; the two extreme values were incidentally recorded in two consecutive years.
The DBAG funds alongside which we co-invest have a term of ten years. The fees we receive for management or advisory services are methodically fixed over that term. That is why fee income is readily projectable over the short term, but at the same time it is also capped. An increase in fee income can only result after a follow-on fund has been closed. Its size and, consequently, potential fee income will be oriented around the investment performance of the original fund and will only be conclusively assessable at the end of that fund’s term. This, too, is indicative of the long-term orientation of our business.
In view of the high volatility of key financial performance indicators and the difficulty in planning individual income-relevant transactions, it is not possible to make either an interval forecast, or a point forecast of these indicators. We have therefore limited ourselves to making a qualified comparative forecast 16 on the expected development of underlying conditions and of individual components of the consolidated statement of financial position and the consolidated statement of comprehensive income for the coming financial year.
For the inputs, we use the previous year’s data based on the carried portfolio. Non-regularly recurrent components are adjusted. For instance, disposal results and performance-linked emoluments are not considered. In view of the high volatility inherent in our business, changes of up to ten percent are considered “slight”, and changes of more than ten percent but less than 20 percent are termed “moderate”. Changes of 20 percent and more are “significant”.
16 German Accounting Standard No. 20 (GAS 20) provides for three types of forecasts: the disclosure of a numerical value (“point forecast”), a range between two numerical values (“interval forecast”) and a change in relation to the actual value of the reporting period stating the direction and intensity of that change (“qualified comparative forecast”).
1 2 4 C O M B I N E D M A N A G E M E N T R E P O R T

E X P EC T E D D E V ELO P M EN T O F U N D ER LY I N G CO N D I T I O N S
Market: Supply of private equity capital growing more strongly than the deal flow
Based on the dynamism of the investment opportunities that have come to our knowledge over the past six months, we expect a constant demand in our market – both in number and value – for the current 2014/15 financial year.
Borrowings: Availability stable at high level
The debt market for acquisition finance has changed considerably in recent years. Following the banking and financial crisis in 2008, the availability of finance was significantly reduced. Since 2012 at the latest, the availability and terms of financing to structure MBOs have, however, again been sufficient. New lenders, such as debt funds, provide financings through unitranche or mezzanine 17 loans. Banks’ business in acquisition finance for private equity transactions is attractive. We therefore expect that such financings will continue to be sufficiently available; for financial year 2014/15, we expect the supply to remain constant.
Asset class of private equity: Still of fundamental significance
Private equity is firmly rooted as an asset class worldwide. It constitutes an integral part of the investment strategy of many institutional investors. The proportion of private equity in asset dissemination is not constant and may even decrease. However, we do not expect commitments to private equity funds to decline fundamentally. We successfully raised DBAG funds most recently in 2011 and 2012. Since their investment periods will end in 2017 and 2018 at the earliest, the question of whether we would be able to solicit sufficient capital commitments to a fund is not significant for 2014/15.
Macroeconomic environment: Basically positive, if geopolitical conflicts do not escalate
In its most recent annual economic report 18, the German Council of Economic Experts expects that the gross domestic product in Germany will grow by 1.0 percent. The Council primarily expects positive momentum to come from domestic demand. This would be beneficial for those portfolio companies whose operations are restricted to the German market. As in 2014, investments in machinery and equipment and in construction are not expected to generate any appreciable contributions to growth, and the Council assesses that dynamism in the export business will be low.
17 Unitranche: a type of loan, bond or debenture that combines senior and subordinated debt into one debt instrument; mezzanine: hybrid capital between voting capital and senior debt
18 “More confidence in market processes – Annual Economic Report 2014/15”, German Council of Economic Experts, Wiesbaden, November 2014
A N N U A L R E P O R T 2 0 1 3 / 1 4 1 2 5
CO
MB
INE
D M
AN
AG
EM
EN
T R
EP
OR
T

For most of our portfolio companies and, consequently, our investment performance, the economic trend in Germany or the eurozone is not the only decisive factor. Many of our investee businesses not only market their products and services worldwide, but also partially maintain global production structures. Thus, the business trend in emerging economies has an – in some instances, considerable – impact on the demand for the capital goods our portfolio companies provide. For the eurozone and other European countries, the German Council of Economic Experts expects that growth will be nearly unchanged compared with 2014; growth in the United States and major emerging countries (Brazil, India) will be stronger in 2015 than last year. The Chinese economy is expected to continue to grow at a comparatively high rate.
Assuming, as the Council of Economic Experts does, that geopolitical conflicts do not escalate, the scenario described would represent favourable underlying conditions for our portfolio companies in the new 2014/15 financial year.
E X P EC T E D BU S I N ES S D E V ELO P M EN T
Development of market position: Basis for continued performance
Deutsche Beteiligungs AG has a long-standing market presence. The shareholders of DBAG and the investors in DBAG funds have achieved superior returns. Not least due to our extensive investment experience do we expect to continue conducting the Company’s business successfully and maintain our strong position in our market segment despite more intense competition. We adhere to our objective of generating earnings in excess of the cost of equity on average in the long term. Large parts of our sizeable financial resources are invested in secure, but low-interest-bearing German government securities and Pfandbrief bonds. This makes it more difficult to reach our return target: over the long-term average, the return is to exceed the cost of equity. Nonetheless, we expect to generate a return in financial year 2014/15 within the range of the cost of equity.
We also adhere to our non-financial objectives. We want DBAG to remain a reputable investment partner for mid-market companies in German-speaking regions and a major player in the market for management buyouts and expansion financings. We want to remain a sought-after advisor to private equity funds as well as an esteemed employer in Germany’s private equity sector.
Portfolio: Value growth as planned
Our co-investment decisions are founded on an in-depth analysis that includes business plans for multi-year periods. We intend to support our portfolio companies over a period of five to seven years, during which the companies’ potential for development is to be turned into an appropriate value appreciation. Our assessment of the portfolio companies’ development potential at the time of our entry has basically remained unchanged. In light of that and with a view to the economic forecast, we expect the portfolio companies to continue their pattern of progress as scheduled in the current 2014/15 financial year.
Information on cyclical risks page 112
1 2 6 C O M B I N E D M A N A G E M E N T R E P O R T

Net result of investment activity: Moderately in excess of previous year on comparable basis
The item with the greatest weight for the Company’s performance – and with the greatest budgetary and forecast uncertainty – is the net result of valuation and disposal. It decisively determines the net result of investment activity, which includes current income from financial assets and loans and receivables.
The net result of valuation represents the net amount of positive and negative value movements of the portfolio companies. These value movements derive from the change in the fair value of
an investment in comparison to the preceding valuation date.
At each valuation date, we estimate the value for which an investment could be sold under current market conditions. We employ the same procedure for the period covered by this forecast. However, an investment may be sold in the course of that period. In the past, there were instances when sizeable capital gains were realised on disposals of investments because industrial buyers were willing to pay strategic premiums on the estimated fair value. Such events are not calculable. Our forecast assumption, therefore, is that disinvestments will be transacted at the investment’s estimated fair value and no gain or loss on disposal will be realised. Current income from financial assets and loans and receivables is also not forecast individually; we assume that generated earnings are ploughed back and therefore flow into the achievable market price to the same extent. Our forecast therefore does not differentiate between the net result of valuation and disposal and current income; rather, we project the overall contribution to income from investment activity.
Determining the fair value of every individual investment involves making forward-looking assumptions. These assumptions are subject to considerable uncertainty. The uncertainty is even greater when valuations are projected to a future date, as is the case for forecasts. We take that greater uncertainty into account by estimating the contribution to income for the total portfolio, instead of deriving it by netting the value movements of the individual portfolio companies. Past experience has shown that unexpected positive and unexpected negative developments in individual portfolio companies partly even one another out.
Projections of the contribution to income for the portfolio are based on current assumptions regarding the holding period and the average annual value appreciation of the investments during that holding period – irrespective of the fact that value growth is not linear every year to the same assumed extent.
On a comparable basis, i.e. without considering gains on disposals, our forecast for the net result on investment activity is that it will be moderately in excess of that of the preceding year. In 2013/14, the net result of investment activity contained a net result of disposal of 28.9 million euros.
Valuation methodology page 112
A N N U A L R E P O R T 2 0 1 3 / 1 4 1 2 7
CO
MB
INE
D M
AN
AG
EM
EN
T R
EP
OR
T

Fee income from fund investment services: Slightly below that of the prior year
Fee income from management and advisory services to funds is readily projectable, because it is largely based on the size of the fund. The conditions under which fees are paid for our management and advisory services are fixed for a fund’s entire term.
Up to the time a new DBAG fund is raised, fee income will tend to decline with every realisation from the portfolio. Due to the exits achieved this past financial year, we anticipate that this item will be slightly below that of the preceding year.
Other income/expenses: Significant increase in net expense ratio after historical low
Total other income/expenses can be understood as net expenses for managing our portfolio and for managing and advising DBAG funds. To assess the expenses in a financial year, this item needs to be adjusted for special effects. Such special effects are, for instance, expenses for raising a DBAG fund (not recurrent every year) and performance-related remuneration components (2013/14: 4.2 million euros). Management expenses are set against fee income from management and advisory services to funds, which is recognised in the net result of fund services and investment activity.
We consider total other income/expenses and fee income from fund management and advisory services as “net expenses” and measure these in relation to the Company’s average equity. In 2013/14, the net expense ratio was 0.7 percent – benefiting from a value-added tax refund that related to former years and a performance-linked profit share from an older DBAG fund. Based on our estimate of the development of key other income/expense items, we expect that the net expense ratio in 2014/15 will be significantly above that of the preceding financial year; however, the net expense ratio is not expected to exceed 2.0 percent.
Financial resources: Clearly lower by the end of the financial year
In line with our investment commitment to the funds, we aim to make an average of two to three new investments each financial year in both management buyouts and expansion financings. Based on an average sum of ten million euros for each investment, the liquidity requirement would amount up to 50 million euros annually. Acquisitions and realisations in the private equity business, however, take place at irregular intervals. For that reason, acquisitions (as in 2012/13) or realisations (as in 2013/14) may predominate in individual years.
The extent to which our operating business generates cash is largely determined by the cash flows from our investing activities. Should acquisitions predominate in a financial year, cash flows from investing activities may be negative in that period. In this event, the Group would be able to fall back on abundant liquidity reserves. If necessary, it could procure funding through borrowings or a capital increase. In line with the assumption that we intend to again focus on investments in 2014/15, we have budgeted an outflow of liquidity for 2014/15 and significantly lower FINANCIAL RESOURCES for the end of the financial year.
Fee income from fund management and advisory services page 57 and 77
1 2 8 C O M B I N E D M A N A G E M E N T R E P O R T

G EN ER A L F O R EC A S T
2014/15: Consolidated net income slightly above prior year on a comparable basis
Deutsche Beteiligungs AG is well placed. With a history of five decades, the Company is an established and successful player in the German private equity market. It has a solid financial base and good prerequisites for future fundraising campaigns. DBAG’s portfolio contains investments in attractive companies which have excellent potential for value growth. That growth may, however, not be linear from year to year. DBAG’s staff is experienced and highly motivated. These underlying conditions are, in our opinion, an outstanding platform on which Deutsche Beteiligungs AG and the company value can develop positively this current 2014/15 financial year.
On a comparable basis – that is, without considering gains on disposals and transaction-related variable remuneration – we expect a slight increase in consolidated net income for 2014/15 compared with the previous year (comparative basis of the previous year: 47.8 million euros, less 24.7 million euros, or 23.1 million euros). We are confident that the return on net asset value per share will reach the cost of equity – our minimum target for the long-term average.
Under the same premises for Deutsche Beteiligungs AG (separate financial statements based on the German Commercial Code – HGB), we expect the annual profit on a comparable basis to be significantly lower than that of the reporting year (comparable basis of the previous year: 65.4 million euros, less 54.4 million euros, or 11.0 million euros). The past year was marked by a highly successful disinvestment of a particularly large investment; our forecast for the coming period does not consider any divestments and, consequently, any capital gains on disposal.
We intend to adhere to our dividend policy. It provides for the payment of a consistent dividend, if possible, even for financial years ending with negative net income or in which there were no particularly profitable disposals. We expect that the retained profit of DBAG (after the distribution for financial year 2013/14) will enable the payment of such a base dividend for the current and for subsequent financial years. As before, surplus dividends remain tied to particularly profitable realisations, which, however, cannot be planned.
Frankfurt/Main, 19 December 2014
The Board of Management
A N N U A L R E P O R T 2 0 1 3 / 1 4 1 2 9
CO
MB
INE
D M
AN
AG
EM
EN
T R
EP
OR
T

F I N A N C I A L S TAT E M E N T S
1 3 0 C O N S O L I D AT E D F I N A N C I A L S TAT E M E N T S

132CO N S O L I DAT E D S TAT E M E N T O F CO M P R E H E N S I V E I N CO M E
133CO N S O L I DAT E D S TAT E M E N T O F C A S H F L O W S
134 CO N S O L I DAT E D S TAT E M E N T O F F I N A N C I A L P O S I T I O N
135 CO N S O L I DAT E D S TAT E M E N T O F CH A N G E S I N E Q U I T Y
136N O T E S T O T H E CO N S O L I DAT E D F I N A N C I A L S TAT E M E N T S
136 . GENERAL INFORMATION
136 . Principal activity
136 . Basis of preparation
137 . Changes in accounting methods
due to amended rules
143 . Consolidated group of companies
145 . Principles of consolidation
146 . Accounting and valuation policies
152 . Judgments in applying the accounting policies
152 . Future-oriented assumptions and other major
sources of estimation uncertainty
154 . NOTES TO THE CONSOLIDATED STATEMENT
OF COMPREHENSIVE INCOME
158 . NOTES TO THE CONSOLIDATED STATEMENT
OF FINANCIAL POSIT ION
167 . NOTES TO THE CONSOLIDATED STATEMENT
OF CASH FLOWS
168 . OTHER DISCLOSURES
168 . Financial risk disclosures
171 . Financial instruments
180 . Capital management
180 . Earnings per share based on IAS 33
180 . Segment reporting
181 . Declaration of Conformity pursuant to
§ 161 German Stock Corporation Act (AktG)
182 . Information based on IAS 24
191 . Fair value of financial instruments
191 . Risk management
191 . Audit fees and audit-related services
192 . Members of the supervisory Board
and Board of Management
194 . List of subsidiaries and associates
A N N U A L R E P O R T 2 0 1 3 / 1 4 1 3 1
FIN
AN
CIA
L S
TA
TE
ME
NT
S

CO N S O L I DAT ED S TAT EM EN T O F CO M P R EH EN S I V E I N CO M Efor the period from 1 November 2013 to 31 October 2014
T€ Notes1 Nov. 2013 to
31 Oct. 20141 Nov. 2012 to
31 Oct. 2013
Net result of valuation and disposal of financial assets and loans and receivables 9 50,280 34,489
Current income from financial assets and loans and receivables 10 4,225 6,519
Fee income from fund management and advisory services 11 21,736 18,889
Net result of fund services and investment activity 76,241 59,897
Personnel costs 12 (16,533) (13,793)
Other operating income 13 9,751 5,737
Other operating expenses 14 (21,229) (18,205)
Interest income 15 443 947
Interest expenses 16 (157) (831)
Total other income/expenses (27,725) (26,145)
Net income before taxes 48,516 33,752
Income taxes 17 (417) (482)
Net income after taxes 48,099 33,270
Minority interest (-) 28 (323) (976)
Net income 47,776 32,294
a) Items that will not be reclassified subsequently to profit or loss
Gains/(losses) on remeasurements of the net defined benefit liability (asset) 30 (6,695) (3,588)
b) Items that will be reclassified subsequently to profit or loss when specific conditions are met
Unrealised gains/(losses) on available-for-sale securities 23 306 (86)
Other comprehensive income (6,389) (3,674)
Total comprehensive income 41,387 28,620
Earnings per share in € (diluted and basic) 1 37 3.49 2.36
1 In compliance with IAS 33, earnings per share are based on consolidated net income divided by the weighted average number of DBAG shares outstanding in the financial year
1 3 2 C O N S O L I D AT E D F I N A N C I A L S TAT E M E N T S

CO N S O L I DAT ED S TAT EM EN T O F C A SH F LOW Sfor the period from 1 November 2013 to 31 October 2014
INFLOWS/(OUTFLOWS)
T€ Notes1 Nov. 2013 to
31 Oct. 20141 Nov. 2012 to
31 Oct. 2013
Consolidated net income 47,776 32,294
Valuation (gains)/losses on financial assets and loans and receivables, depreciation and amortisation on property, plant and equipment and intangible assets, (gains)/losses on long- and short-term securities 9, 18, 19, 20, 23 (20,815) (28,785)
(Gains)/losses from disposals of non-current assets 9, 18 (28,912) (5,315)
Increase/(decrease) in non-current liabilities 25, 28, 29, 30 6,250 1,510
(Increase)/decrease in income tax assets 25 (1,983) 3,422
Increase/(decrease) in tax provisions 25 394 (602)
Increase/(decrease) in other provisions 29 4,378 (1,143)
(Increase)/decrease in other assets (netted) 21, 23, 24, 25, 26 (2,515) (9,343)
Increase/(decrease) in other liabilities (netted) 29, 31 (5,949) (3,988)
Cash flows from operating activities 1 (1,376) (11,950)
Proceeds from disposals of property, plant and equipment and intangible assets 18 92 420
Purchase of property, plant and equipment and intangible assets 18 (686) (326)
Proceeds from disposals of financial assets and loans and receivables 9, 19, 20 90,815 60,398
Acquisition of non-current financial assets and investments in loans and receivables 9, 19, 20 (20,003) (41,747)
Proceeds from disposals of long- and short-term securities 23, 33 59,000 26,896
Acquisition of long- and short-term securities 23, 33 (92,905) (20,218)
Cash flows from investing activities 36,313 25,423
Payments to shareholders (dividends) 27 (16,412) (16,412)
Cash flows from financing activities (16,412) (16,412)
Change in cash funds from cash-relevant transactions 18,525 (2,939)
Cash funds at start of period 33 19,793 22,732
Cash funds at end of period 33 38,318 19,793
1 Contained therein are received and paid income taxes of T€2,024 (previous year: T€-44) as well as received and paid interest and received dividends of T€2,652 (previous year: T€630).
A N N U A L R E P O R T 2 0 1 3 / 1 4 1 3 3
FIN
AN
CIA
L S
TA
TE
ME
NT
S

CO N S O L I DAT ED S TAT EM EN T O F F I N A N CI A L P OS I T I O N at 31 October 2014
T€ Notes 31 Oct. 2014 31 Oct. 2013
ASSETS
Non-current assets
Intangible assets 18 151 34
Property, plant and equipment 18 1,304 1,273
Financial assets 19 135,047 166,752
Loans and receivables 20 25,947 14,110
Long-term securities 23 80,991 50,514
Other non-current assets 21, 25, 30 421 867
Total non-current assets 243,861 233,550
Current assets
Receivables 22 7,400 11,980
Short-term securities 23 31,344 28,028
Other financial instruments 24 2,245 2,401
Income tax assets 25 5,435 3,452
Cash and cash equivalents 38,318 19,793
Other current assets 26 18,486 11,448
Total current assets 103,228 77,102
Total assets 347,089 310,652
LIABIL IT IES
Equity 27
Subscribed capital 48,533 48,533
Capital reserve 141,394 141,394
Retained earnings and other reserves (4,616) 1,773
Consolidated retained profit 118,077 86,713
Total shareholders’ equity 303,388 278,413
Liabilities
Non-current liabilities
Minority interest 28 10,414 10,146
Provisions for pension obligations 30 9,385 3,419
Other provisions 29 235 218
Deferred tax liabilities 25 60 61
Total non-current liabilities 20,094 13,844
Current liabilities
Other current liabilities 31 2,908 2,468
Tax provisions 25 2,232 1,838
Other provisions 29 18,467 14,089
Total current liabilities 23,607 18,395
Total liabilities 43,701 32,239
Total shareholders’ equity and liabilities 347,089 310,652
1 3 4 C O N S O L I D AT E D F I N A N C I A L S TAT E M E N T S

CO N S O L I DAT ED S TAT EM EN T O F CH A N G E S I N EQ U I T Yfor the period from 1 November 2013 to 31 October 2014
T€ Notes1 Nov. 2013 to
31 Oct. 20141 Nov. 2012 to
31 Oct. 2013
Subscribed capital
At start and end of reporting period 48,533 48,533
Capital reserve
At start and end of reporting period 141,394 141,394
Retained earnings and other reserves
Legal reserve
At start and end of reporting period 403 403
First adoption IFRS
At start and end of reporting period 15,996 15,996
Reserve for gains/losses on remeasurements of the defined benefit liability (asset)
At start of reporting period (14,578) (10,990)
Change in reporting period (6,695) (3,588)
At end of reporting period (21,273) (14,578)
Change in unrealised gains/losses on available-for-sale securities
At start of reporting period (48) 38
Change in reporting period through other comprehensive income 23 263 (56)
Change in reporting period through profit or loss 23 43 (30)
At end of reporting period 258 (48)
At end of reporting period (4,616) 1,773
Consolidated retained profit
At start of reporting period 86,713 70,831
Dividends 27 (16,412) (16,412)
Consolidated net income 47,776 32,294
At end of reporting period 118,077 86,713
Total 303,388 278,413
A N N U A L R E P O R T 2 0 1 3 / 1 4 1 3 5
FIN
AN
CIA
L S
TA
TE
ME
NT
S
G EN ER A L I N F O R M AT I O N
1. P R I N C I PA L AC T I V I T Y
Deutsche Beteiligungs AG (DBAG) raises closed-end private equity funds (“DBAG funds”) for investments in equity or equity-like instruments chiefly in unquoted companies. As a financial investor, it enters into investments using its proprietary capital alongside these private equity funds. As a co-investor and fund manager (“adviser”), it focuses its investment activity on German “Mittelstand” businesses. DBAG generates its income by providing investment services to funds and by appreciating the value of the companies in which it is invested. The subsidiaries of the Group pursue the same business activities or provide supporting services.
Deutsche Beteiligungs AG is domiciled at Börsenstrasse 1 in 60313 Frankfurt/Main, Federal Republic of Germany.
2 . BA S I S O F P R E PA R AT I O N
The consolidated financial statements of Deutsche Beteiligungs AG at 31 October 2014 have been prepared in conformity with the International Financial Reporting Standards (IFRS) as issued by the International Accounting Standards Board (IASB) and endorsed by the European Union. The relevant interpretations of the International Financial Reporting Interpretations Committee (IFRIC) have also been applied. Additionally, the commercial law requirements stipulated in § 315a (1) of the German Commercial Code (HGB) have also been taken into account.
The consolidated financial statements fairly present the asset, financial and earnings position. To that end, the information contained therein constitutes a faithful representation of the effects of transactions, other events and conditions in conformity with the definitions and recognition criteria for assets, liabilities, income and expenses set out in the IFRS framework.
The consolidated financial statements of Deutsche Beteiligungs AG consist of the consolidated statement of comprehensive income, the consolidated statement of cash flows, the consolidated statement of financial position, the consolidated statement of changes in equity and these notes to the consolidated financial statements.
The consolidated financial statements have been structured in conformity with the rules of IAS 1.
As compared with the consolidated financial statements for the period ended 31 October 2013 (see page 144 ff. of the Annual Report), we have refrained from presenting a separate consolidated income statement and, in line with the one-statement approach, have instead presented “profit or loss” within the consolidated statement of comprehensive income. This is meant to enhance the clarity of the Group’s results in the period. The change in presentation does not change the amounts or earnings per share (diluted and basic) shown for past periods.
The consolidated net income is structured based on the nature of expense method. For the sake of presenting information that is relevant to the business of DBAG as a private equity company, the net result of investment activity has been disclosed instead of revenues. Fee income from fund management and advisory services of T€ 21,736 (previous year: T€ 18,889) were contained in item “Other operating income” in the past. “Other operating income” therefore no longer includes these amounts (see note 13). Separate disclosure of this position is in recognition of the importance that fee
N OT ES TO T H E CO N SO L I DAT ED F I N A N CI A L S TAT EM EN T SF O R F I N A N CI A L Y E A R 2013 /14
1 3 6 C O N S O L I D AT E D F I N A N C I A L S TAT E M E N T S

income from fund management and advisory services has on income. Items of other comprehensive income are stated after taking into account all tax effects in that context as well as the respective reclassified amounts. Reclassifications between other comprehensive income and profit or loss are presented in the notes to the consolidated financial statements.
In the consolidated statement of cash flows, inflows and outflows are differentiated according to operating activities and investment and financing activities (see note 33). Inflows and outflows ensuing from disposals of, or investment in long- and short-term securities are allocated to cash flows from investment activities. As per 31 October 2014, cash-relevant changes in long- and short-term securities will be presented by the direct method. This results in a reduction in cash flows from investment activities of T€ 106 (previous year: T€ 199) and an increase in cash flows from operating activities in equal amounts.
The presentation in the consolidated statement of financial position differentiates between short- and long-term assets and liabilities. Assets and liabilities are categorised as short-term, if they fall due or are met within twelve months after the closing date.
For the sake of clarity, individual items on the consolidated statement of comprehensive income and on the consolidated statement of financial position have been presented together. These items are disclosed and discussed separately in the notes to the consolidated financial statements. At 31 October 2014, this applies for the first time to “Depreciation and amortisation on property, plant and equipment and intangible assets” of T€416 (previous year: T€419). Because of their subordinate importance for the consolidated statement of comprehensive income, they will now be contained in “Other operating expenses” (see note 14). Consequently, “Other operating expenses” increased to T€ 21,229 (previous year: T€ 18,205).
The consolidated financial statements have been drawn up in euros. Except when stated otherwise, all amounts are presented in thousands of euros (T€). Commercial rounding has been used (round half up). Rounding differences may occur.
On 19 December 2014, the Board of Management of Deutsche Beteiligungs AG authorised the consolidated financial statements and the combined management report for issue to the Supervisory Board. The Supervisory Board will pass a vote on 20 January 2015 as to its approval of the consolidated financial statements.
3 . C H A N G ES I N ACCO U N T I N G M E T H O DS DU E TO A M EN D ED RU L ES
Standards and interpretations and amendments to standards and interpretations applicable for the first time that had effects on the reporting period ended 31 October 2014
In the consolidated financial statements at 31 October 2014, the following new standards and interpretations or amendments to standards and interpretations that had an impact on the reporting period were applied for the first time:
> IFRS 13 “Fair value measurement”
> Amendments to IAS 19 “Employee benefits”
IFRS 13 “Fair Value Measurement”
IFRS 13 “Fair Value Measurement” replaces and standardises the different definitions and measurement methods of fair value contained in the various standards and establishes a single source of guidance. Fair value as in IFRS 13 is defined as the price that would be received to sell an asset or paid to transfer a liability in an orderly transaction between market participants on the measurement date. Moreover, the standard introduces additional disclosure requirements on fair value measurement: for example, these relate to the valuation methodology and input factors as well as – for fair values classified in level 3 of the hierarchy – the effects on consolidated net income and on other comprehensive income. The first-time adoption of IFRS 13 does not have a material effect on the consolidated statement of comprehensive income, the consolidated statement of financial position and the consolidated statement of cash flows. The extended disclosures according to IFRS 13 are presented in note 35 of these notes to the consolidated financial statements.
A N N U A L R E P O R T 2 0 1 3 / 1 4 1 3 7
FIN
AN
CIA
L S
TA
TE
ME
NT
S

Amendments to IAS 19 “Employee Benefits”
The amended standard IAS 19 eliminates the corridor method as an option under which actuarial gains and losses were recorded. As DBAG has not been applying the corridor method since financial year 2009/10, this change has no effects on the consolidated financial statements. Additionally, IAS 19 amended requires determining the interest income from plan assets using the same discount rate that is used to determine the present value of pension obligations. Through this methodological change, interest income is calculated on the basis of higher expected returns (2.94 percent, following 1.35 percent in the preceding year). This had a positive effect on consolidated net income of T€446. Since the actual return on plan assets did not increase in financial year 2013/14, an appropriately greater loss is recognised in other comprehensive income in line item “Gains/(losses) on remeasurements of the net defined benefit liability (asset)”.
IAS 19 amended requires for the first time a sensitivity analysis for each significant actuarial assumption, a narrative description of any asset-liability matching strategies to manage risk and a description of the impact of the defined benefit plan on the Company’s future cash flows. We refer to the disclosures on “Amount, timing and uncertainty of future cash flows” in note 30.
Standards and interpretations and amendments to standards and interpretations applicable for the first time that had no impact on the reporting period ended 31 October 2014
In the consolidated financial statements at 31 October 2014, the following amendments to standards were mandatorily applicable for the first time:
> annual improvements to IFRS “2009 to 2011 Cycle”
> amendments to IFRS 1 “First-time Adoption of IFRS”
> amendments to IFRS 7 “Financial instruments Disclosures”
> amendments to IFRIC 14 “IAS 19 – The Limit on a Defined Benefit Asset, Minimum Funding Requirements and their Interaction”
> IFRIC 20 “Stripping Costs in the Production Phase of a Surface Mine”
Annual Improvements to IFRS “2009 to 2011 Cycle”
The following five standards were amended within the scope of the annual improvement project 2009 to 2011:
> AS 1 “Presentation of Financial Statements”
> IFRS 1 “First-time Adoption of IFRS”
> IAS 16 “Property, Plant and Equipment”
> IAS 32 “Financial Instruments: Presentation”
> IAS 34 “Interim Financial Reporting”
These primarily relate to terminology or editorial amendments aimed at clarifying guidance. The first-time adoption of the amendments had no effect on the consolidated financial statements for the periods presented.
Amendments to IFRS 1 “First-time Adoption of IFRS”
The amendments to IFRS 1 relate to a new exception concerning the retrospective adoption of the IFRS for first-time adopters and new regulations for those cases where a company was unable to apply IFRS rules for some time because its functional currency was subjected to hyperinflation. Both amendments are irrelevant for Deutsche Beteiligungs AG.
Amendments to IFRS 7 “Financial Instruments: Disclosures”
The amendments to IFRS 7 pertain to extended disclosure requirements in conjunction with the clarification of the rules of IAS 32 for offsetting financial assets and financial liabilities. The new disclosure requirements are meant to allow a better comparison with financial statements prepared in accordance with US GAAP. With the exception of pension obligations and plan assets, financial assets and financial liabilities are not offset in the consolidated financial statements of Deutsche Beteiligungs AG for the periods presented. The extended disclosure requirements under IFRS 7 therefore do not have an effect on the consolidated financial statements of Deutsche Beteiligungs AG.
1 3 8 C O N S O L I D AT E D F I N A N C I A L S TAT E M E N T S
IFRIC 20 “Stripping Costs in the Production Phase of a Surface Mine”
IFRIC 20 sets out when and how to account for costs arising from stripping activity in surface mining operations. The rules are irrelevant for Deutsche Beteiligungs AG.
New standards and interpretations that have not yet been applied
a) Endorsed by the European Union
The following standards and interpretations were issued by the IASB and IFRIC and endorsed by the European Commission for application in the European Union. The effective date, indicating when the respective standard or interpretation is required to be applied, is stated in parenthesis. Deutsche Beteiligungs AG intends to initially apply the respective standards and interpretations for the annual period that starts after that effective date. No use will therefore be made of voluntary early application of these standards and interpretations.
Annual Improvements to IFRS “2011 to 2013 Cycle” (1 January 2015)
The following four standards were amended within the scope of the annual improvement project 2011 to 2013:
> IFRS 1 “First-time Adoption of International Financial Reporting Standards”
> IFRS 3 “Business Combinations”
> IFRS 13 “Fair Value Measurements”
> IAS 40 “Investment Property”
These primarily relate to editorial amendments aimed at clarifying guidance. The first-time adoption of the amended standards is not expected to have an impact on the consolidated financial statements.
IFRS 10 “Consolidated Financial Statements” (1 January 2014)
The new standard IFRS 10 “Consolidated Financial Statements” replaces the sections of IAS 27 “Consolidated and Separate Financial Statements” relating to group accounting and the rules of SIC-12 “Consolidation – Special Purpose Entities”. It standardises the basis for consolidation by redefining control. This will apply to all entities, including special purpose entities. The principle of control as in IFRS 10 comprises three elements:
> power to direct the relevant activities
> variability of returns
> link between returns and power
It follows that parent-subsidiary relations may be based on voting rights or result from contractual arrangements. Consolidation decisions according to the rules of IFRS 10 are to be taken at the beginning of the period in which IFRS 10 is applied for the first time.
Based on IFRS 10, subsidiaries of investment entities are exempt from full consolidation. Instead, an investment entity is basically required to value its interests in subsidiaries at fair value through profit or loss in accordance with IAS 39 “Financial Instruments: Recognition and Measurement” or IFRS 9 “Financial Instruments”. Consolidation is only required for those subsidiaries of investment entities that operate as service providers for other investment entities or fund entities. As a private equity company, Deutsche Beteiligungs AG meets the definition of an investment entity as in IFRS 10.
Based on the new control concept, the following two entities qualify as subsidiaries for the first time and will be required to be consolidated beginning in financial year 2014/15:
> DBG Management GP (Guernsey) L.P.
> DBG Fund VI GP (Guernsey) L.P.
These entities act as the manager or investment manager for DBAG Fund VI. We assume that the consolidation of these two entities will not have a material impact on the presentation of the asset, financial and earnings position of the DBAG Group.
A N N U A L R E P O R T 2 0 1 3 / 1 4 1 3 9
FIN
AN
CIA
L S
TA
TE
ME
NT
S

Based on the exemption for investment entities, the following four subsidiaries will no longer be consolidated beginning in financial year 2014/15, but instead be held at fair value through profit or loss in the consolidated financial statements:
> DBG Fourth Equity Team GmbH & Co. KGaA
> DBAG Fund V Konzern GmbH & Co. KG
> DBAG Expansion Capital Fund Konzern GmbH & Co. KG
> DBAG Fund VI Konzern (Guernsey) L.P.
These entities are investment vehicles for co-investments of DBAG with DBAG Fund IV, DBAG Fund V, DBAG Expansion Capital Fund and DBAG Fund VI.
The assets of these entities largely consist of the investments in the portfolio companies, which in the past have already been recognised at fair value in the consolidated accounts. We therefore do not expect material effects on the asset, financial and earnings position of the Deutsche Beteiligungs AG Group from deconsolidation of these entities.
IFRS 11 “Joint Arrangements” (1 January 2014)
IFRS 11 revises the accounting for joint arrangements. It supersedes IAS 31 “Interests in Joint Ventures”. The previous option of proportionately consolidating jointly controlled entities has been eliminated. IFRS 11 requires using the equity method for consolidating jointly controlled entities. Application of the equity method is geared to the rules of IAS 28 “Investments in Associates and Joint Ventures”. At present, one jointly controlled company (Q.P.O.N. Beteiligungs GmbH) is proportionately consolidated in the Group’s financial statements. Based on the size of this jointly controlled company (proportionate total assets at 31 October 2014: T€ 13), the change in the accounting for this jointly controlled company from proportionate consolidation to the equity method will not have a material effect on the consolidated financial statements.
IFRS 12 “Disclosure of Interests in Other Entities” (1 January 2014)
This standard sets out the disclosure requirements for interests in subsidiaries, joint arrangements and associates. The new disclosure requirements are considerably more comprehensive than those that were previously required under IAS 27, IAS 28 and IAS 31. The effects of the adoption of IFRS 12 on the presentation of the asset, financial and earnings position of the Deutsche Beteiligungs AG Group are currently still being analysed. A conclusive assessment of the impact of this standard is not yet possible.
Amendments to IAS 27 “Separate Financial Statements” (1 January 2014)
The consolidation rules previously set out in IAS 27 “Consolidated and Separate Financial Statements” will be superseded by the new IFRS 10. IAS 27 amended now exclusively relates to the rules for separate financial statements. The provisions of IAS 27 concerning separate financial statements were not relevant for Deutsche Beteiligungs AG in the past; no impact is therefore expected from the amendments to IAS 27 relating to separate financial statements.
Amendments to IAS 28 “Investments in Associates and Joint Ventures” (1 January 2014)
The introduction of IFRS 11 “Joint Arrangements” abolishes the option of proportionately consolidating joint ventures. The equity method in accounting for joint ventures as stipulated under IFRS 11 is required to be implemented in conformity with the rules of IAS 28. To that end, the scope of IAS 28 was extended to include joint ventures and the standard was renamed. Moreover, the accounting treatment for planned disposals of portions of an investment in an associate or joint venture was changed. The portion of an investment held for sale is accounted for in accordance with IFRS 5 “Non-current Assets Held for Sale and Discontinued Operations”.
Application of IAS 28 amended is not expected to have a material impact on the presentation of the asset, financial and earnings position of the DBAG Group.
1 4 0 C O N S O L I D AT E D F I N A N C I A L S TAT E M E N T S

Amendments to IAS 32 “Financial Instruments: Presentation” (1 January 2014)
The amendments to IAS 32 clarify several requirements for offsetting financial assets and financial liabilities. The offsetting model currently valid under IAS 32 fundamentally remains unchanged. The adoption of IAS 32 amended is therefore not expected to have a material effect on the consolidated financial statements.
IFRIC 21 “Levies”
IFRIC 21 provides guidance on the recognition of levies imposed by a government that are accounted for in accordance with IAS 37 “Provisions, Contingent Liabilities and Contingent Assets”. The rules are irrelevant for Deutsche Beteiligungs AG.
b) Not yet endorsed by the European Union
The following standards have been issued by the IASB and the IFRIC, but have not yet been endorsed by the European Commission for adoption in the European Union.
Annual improvements to IFRS “2010 to 2012 Cycle”
The following seven standards were amended within the scope of the annual improvement project 2010 to 2012 cycle:
> IFRS 2 “Share-based payment”
> IFRS 3 “Business Combinations”
> IFRS 8 “Operating Segments”
> IFRS 13 “Fair Value Measurement”
> IAS 16 “Property, Plant and Equipment”/ IAS 38 “Intangible Assets”
> IAS 24 “Related Party Disclosures”
These primarily relate to editorial amendments aimed at clarifying guidance. The first-time adoption of the amended standards is not expected to have an impact on the consolidated financial statements.
Annual improvements to IFRS “2012 to 2014 Cycle”
The following standards were amended within the scope of the annual improvement project 2012 to 2014 cycle:
> IFRS 5 “Non-current Assets Held for Sale and Discontinued Operations”
> IFRS 7 “Financial instruments: Disclosures”
> IAS 19 “Employee Benefits”
> IAS 34 “Interim Financial Reporting”
These primarily relate to editorial amendments aimed at clarifying guidance. The first-time adoption of the amended standards is not expected to have an impact on the consolidated financial statements.
IFRS 9 “Financial Instruments”
The new IFRS 9 is to replace the present standard IAS 39 “Financial Instruments – Recognition and Measurement”. Like IAS 39, IFRS comprises the topics of classification and measurement, impairment and hedging transactions.
Classification and measurement of financial assets in accordance with IFRS 9 are based on the business model at the date of acquisition and the contractual cash flow characteristics. The combination of these two criteria determines the classification to one of three categories: “at amortised cost”, “at fair value through other comprehensive income” or “at fair value through profit or loss”.
The new impairment concept in IFRS 9 requires recognising expected credit and/or interest default events prospectively (so-called expected-loss model).
The new rules for hedging transactions provide for a closer alignment of risk management and hedge accounting.
The impact of the adoption of IFRS 9 on the asset, financial and earnings position of the Deutsche Beteiligungs AG Group is currently being analysed. A conclusive assessment of the effects of this standard on the consolidated financial statements is not yet possible.
A N N U A L R E P O R T 2 0 1 3 / 1 4 1 4 1
FIN
AN
CIA
L S
TA
TE
ME
NT
S

Amendments to IFRS 11 “Joint Arrangements”
The amendments to IFRS 11 clarify guidance on the accounting treatment for initial acquisitions and additional acquisitions of interests in joint operations in which the activity constitutes a business as defined in IFRS 2 “Business Combinations”. The amendments to IFRS 11 are not relevant for Deutsche Beteiligungs AG.
IFRS 14 “Regulatory Deferral Accounts”
The new IFRS 14 standard permits IFRS first-time adopters to continue to account for regulatory deferral account balances in accordance with their national GAAP in their IFRS-formatted financial statements. The new rules are not relevant for Deutsche Beteiligungs AG.
IFRS 15 “Revenue from Contracts with Customers”
The new standard superseded IAS 11 “Construction Contracts” and IAS 18 “Revenue” and the associated interpretations. The new IFRS 15 standardises past IFRS rules with those applied under US GAAP. IFRS 15 contains a new model for revenue recognition arising from contracts with customers. According to IFRS 15, revenue is considered realised when the customer acquires control over the agreed goods and services and is able to obtain the benefits from them. The impact arising from the adoption of IFRS 15 on the presentation of the asset, financial and earnings position of the Deutsche Beteiligungs AG Group is currently being analysed. A conclusive assessment of the effects on the consolidated financial statements is not yet possible.
Amendments to IAS 16 “Property, Plant and Equipment” and IAS 38 “Intangible Assets”
The amendments to IAS 16 and IAS 38 clarify guidance on acceptable methods of depreciation and amortisation on property, plant and equipment and intangible assets. The clarification relates in particular to revenue-based depreciation. The amendments are not expected to have any effects on the consolidated financial statements.
Amendments to IAS 16 “Property, Plant and Equipment” and IAS 41 “Agriculture”
The amendments to IAS 16 and IAS 41 comprise rules on the accounting treatment for bearer plants. The rules are irrelevant for Deutsche Beteiligungs AG.
Amendments to IAS 19 “Employee Benefits”
The amendments to IAS 19 introduce an option regarding the accounting for employee contributions to defined benefit plans. Employee contributions that are linked to service can be attributed to periods of service as a negative benefit. However, recognition of employee contributions in the period in which the corresponding service is rendered remains permissible. Deutsche Beteiligungs AG assumes that the amendments to IAS 19 will not have a material impact on the consolidated financial statements.
Amendments to IAS 27 “Separate Financial Statements”
The amendments to IAS 27 reinstate the equity method as an accounting option for investments in subsidiaries, joint ventures and associates in IFRS-formatted separate financial statements. The rules of IAS 27 on separate financial statements have not been relevant for Deutsche Beteiligungs AG in the past; no impact is therefore expected from the amendments to IAS 27 relating to separate financial statements.
1 4 2 C O N S O L I D AT E D F I N A N C I A L S TAT E M E N T S

4 . CO N S O L I DAT ED G RO U P O F CO M PA N I ES
Principles for consolidation of Group companies
In addition to the parent company, Deutsche Beteiligungs AG, all material SUBSIDIARIES are fully consolidated. Subsidiaries are those Group companies in which Deutsche Beteiligungs AG is able to exert control. Control is defined as when the power exists to govern the financial and operating policies of an enterprise in order to obtain benefits from its activities. This is generally the case when DBAG indirectly or directly holds more than half of the voting rights in a company.
The criterion for the materiality of subsidiaries is whether these are able, individually or collectively, to influence the economic decisions that users make on the basis of the financial statements. We consider subsidiaries to be immaterial in the following cases:
> The subsidiary is a shelf company that has not yet taken up activities after being founded. Shelf companies are usually founded with nominal capital of T€ 25. Shelf companies are used later on as a NewCo within the scope of investment transactions and sold for a price near book value.
> The subsidiary has discontinued operations and is to be liquidated. The entity is deconsolidated at a time when the remaining assets and liabilities are of subordinate significance.
> The subsidiary pursues only minor operating activities, e.g. as a personally liable partner in a limited partnership without a capital contribution, and the entity has no appreciable assets or liabilities.
In addition to the material subsidiaries, all SPECIAL PURPOSE
ENTITIES are fully consolidated if they are controlled by DBAG under the aspect of obtaining an economic benefit. Control is assumed if DBAG is entitled to the majority of opportunities and risks from the operating activities of these entities.
DBAG is proportionately invested as a partner company in a jointly controlled company. This JOINT VENTURE is recognised in the consolidated financial statements on a pro rata basis (proportionate consolidation).
A N N U A L R E P O R T 2 0 1 3 / 1 4 1 4 3
FIN
AN
CIA
L S
TA
TE
ME
NT
S

Reasons for the consolidation or non-consolidation of companies in the Group
The following companies were consolidated in the Group’s financial statements at 31 October 2014:
Deutsche Beteiligungs-gesellschaft mbH
DBG Advisors Kommandit-aktionär GmbH & Co. KG
Q.P.O.N. Beteiligungs GmbH
DBG Management GmbH & Co. KG
DBAG Fund V Konzern GmbH & Co. KG
DBG Managing Partner GmbH & Co. KG
DBG Fourth Equity Team GmbH & Co. KGaA
DBG New Fund Management GmbH & Co. KG
DBAG Expansion Capital Fund Konzern GmbH & Co. KG
DBAG Fund VI Konzern (Guernsey) L.P.
DBG Managing Partner Verwaltungs GmbH
1%
49%
100%
33.33%
99% 100%
100%
20%
100%
99%
99%
99.99%
The percentages relate to the proportionate share of equity.
DEUTSCHE BETEIL IGUNGS AG
1 4 4 C O N S O L I D AT E D F I N A N C I A L S TAT E M E N T S

DBG Beteiligungsgesellschaft mbH, in which Deutsche Beteiligungs AG indirectly holds 100 percent of the voting rights, was not consolidated, since the commercial risk for its business activities – and, consequently, the business policy – lies with other non-Group companies.
DBG Fifth Equity Team GmbH & Co. KGaA, in which a subsidiary of Deutsche Beteiligungs AG holds 100 percent of the limited partner’s shares, was not consolidated in the Group accounts, since significant and long-lasting restrictions exist that impair rights in respect of this company’s assets and management.
DBG Advisors Kommanditaktionär GmbH & Co. KG, in which a subsidiary of Deutsche Beteiligungs AG holds an equity share of 33.33 percent, was consolidated despite a minority interest, because DBAG has the power to appoint or remove the majority of the members of the executive body.
DBG Managing Partner GmbH & Co. KG, in which Deutsche Beteiligungs AG holds an equity share of 20 percent, was consolidated, since Deutsche Beteiligungs AG obtains the majority of the benefits from the activities of this company. We refer to note 40.
Q.P.O.N. Beteiligungs GmbH, a joint venture, was propor-tionately consolidated at a rate of 49 percent. Attributable to the 49-percent share are non-current assets and non-current liabilities of 0 euros (previous year: 0 euros), current assets of T€ 13 (previous year: T€ 15), current liabilities of T€ 1 (previous year: T€ 3), income of 2 euros (previous year: 0 euros) and expenses of T€ 1 (previous year: T€ 2).
Associates
Associates are companies in which DBAG is able to exert significant influence on the financial and business policies and yet which do not constitute either subsidiaries or jointly controlled companies. Associates are therefore the portfolio companies in which DBAG is invested as a financial investor and in which it holds, indirectly or directly, from 20 to 50 percent of the voting rights in that company.
For information on the number of associates, we refer to the list of shareholdings pursuant to § 313 (2) German Commercial Code (HGB), note 45.3. In financial year 2013/14, there was one disposal (Homag Group AG) among the associates.
Disclosures on list of shareholdings pursuant to § 313 (2) HGB
The disclosures on the list of shareholdings pursuant to § 313 (2) German Commercial Code (HGB) can be found in note 45.
5 . P R I N C I P L ES O F CO N S O L I DAT I O N
In addition to DBAG, eight of the other consolidated companies draw up their separate annual financial statements as at 31 October. The remaining consolidated companies’ reporting date is concurrent with the calendar year. For consolidation purposes, these companies prepare interim financial statements as at the reporting date of DBAG.
The financial statements of consolidated companies are drawn up based on uniform accounting policies.
Capital consolidation is performed using the purchase method based on the date that DBAG obtains control over the subsidiary (acquisition date). The carrying amounts are amortised in the subsequent periods. Acquisition costs are offset by the fair value of the acquired identifiable assets and assumed liabilities as well as contingent liabilities. Goodwill required to be capitalised has not yet occurred.
Intra-Group profits and losses and transactions as well as all unrealised income and expenses are eliminated when preparing the consolidated financial statements. Deferred income taxes are taken into account in consolidation procedures.
Jointly controlled companies are included in the Group financial statements by way of proportionate consolidation. To that end, the proportion of all of a jointly controlled company’s assets,
A N N U A L R E P O R T 2 0 1 3 / 1 4 1 4 5
FIN
AN
CIA
L S
TA
TE
ME
NT
S

liabilities and income attributable to DBAG is taken together within the relevant items in the financial statements of DBAG. Assets or liabilities are not offset against other liabilities or assets. The same applies to income and expenses.
6 . ACCO U N T I N G A N D VA LUAT I O N P O L I C I ES
The accounting and valuation policies as well as the commentary and disclosures in the consolidated financial statements are applied consistently, except when IFRS rules necessitate making changes (see note 3).
Recognition of assets and liabilities
Non-financial assets are recognised in the Group accounts if it is probable that the future economic benefit will flow to DBAG, and when their cost or other value can be reliably measured.
Non-financial liabilities are recognised in the Group accounts if it is probable that the settlement of a present obligation will require an outflow of resources embodying economic benefits, and when the amount of the settlement can be reliably measured.
Regular way purchase or sale of financial assets or financial liabilities as well as equity instruments (generally termed financial instruments under IAS 32) are consistently recognised or derecognised for all categories of financial instruments on the settlement date.
Categories of financial instruments
Financial instruments in the DBAG Group are designated in accordance with the categories defined in IAS 39. Financial instruments classified in level 3 are also classified by sectors. The sector categories are formed based on the market risks of the portfolio companies.
For financial assets that are measured at fair value through profit or loss, only such assets exist as are designated to this category upon initial recognition. These mainly relate to the investments. Financial assets classified as held for trading or as held to maturity do not exist.
Fair value measurement of financial assets through profit or loss
Due to the operating activities of the DBAG Group as a financial investor, the consolidated financial statements are largely characterised by the measurement of financial assets at fair value through profit or loss. Financial assets chiefly comprise:
> interests in associated companies (interests in portfolio companies with a proportion of the voting rights between 20 and 50 percent)
> other interests in portfolio companies, i.e. shares in portfolio companies with a proportion of the voting rights of less than 20 percent
> fund investments
> shelf companies
As a private equity firm in terms of IAS 28, DBAG makes use of the option of measuring the interests in associates in conformity with the rules of IAS 39 at fair value through profit or loss. Thus, no associates are carried at equity.
For other interests in portfolio companies, fund investments (shares in closed-end private equity funds) and shelf companies, use is made of the option of designating these at fair value through profit or loss upon initial recognition (fair value option in accordance with IAS 39.9).
Investments in financial assets are made by means of a documented risk management strategy. Their value movement is assessed at fair value in the DBAG Group. The requirements for opting to recognise these at fair value through profit or loss have thus been met.
The financial assets are measured initially and at all subsequent quarterly and annual reporting dates at fair value by a Valuation Committee. The Valuation Committee includes the members of the Board of Management, the Head of Finance and Accounting and the Accounting Officer.
1 4 6 C O N S O L I D AT E D F I N A N C I A L S TAT E M E N T S

Valuation guidelines have been adopted for the application of fair value accounting. DBAG employs valuation procedures that are commonly used by market participants in the private equity industry to value portfolio companies. This industry standard is detailed in the recommendations of the “International Private Equity and Venture Capital Valuation Guidelines” (IPEVG) dated December 2012.1
At initial recognition, the fair value corresponds to the transaction price. Ancillary costs of the transactions are not capitalised, but are immediately expensed. Ancillary costs attributable to a transaction include fees paid to intermediaries, consultants (e.g. legal or corporate consultants), agents and brokers, charges paid to regulatory authorities and stock exchanges as well as taxes and fees incurred in connection with the transaction. At subsequent reporting dates, the fair value is measured on a going-concern basis.
As far as possible, the fair value of a portfolio company is measured based on prices from transactions in the market that were observed on the valuation date or immediately prior to that date. This is normally possible for companies whose shares are quoted on the stock exchange. In determining prices, the principal market or the most advantageous market is used as the relevant stock exchange. These portfolio companies are valued at the closing rate on the valuation date or the closing rate on the last day of trading prior to this date. The fair value thus determined is neither reduced by discounts or premiums attached to the sale of larger blocks of shares, nor by deductions for disposal costs.
Should the sale be subject to contractually agreed restrictions (lock-up), a risk-adjusted deduction is made on the observed transaction price. The amount of the risk-adjusted deduction is at the discretion of the Valuation Committee. For unquoted companies, a valuation methodology may be considered that is based on a signed purchase agreement or a binding purchase bid, if the completion of the purchase agreement is sufficiently assured or if the purchase bid seems sufficiently realisable. If appropriate, valuations can be based on the price at which a significant amount of new investments into the portfolio company was made (financing rounds) or on significant comparative prices of recent transactions that have taken place in the market. If the transaction price observed in the market at the valuation date or the price of the most
recent investment made prior to the valuation date does not constitute a sufficiently reliable method – for instance, for reasons of lacking liquidity in the market or in the event of a forced transaction or distressed sale – the fair value is measured based on the valuation methodologies recommended by the IPEVG and applied by market participants in the private equity sector. These are the multiples method for interests in established companies, the discounted cash flow method (DCF method) for strongly growing companies, and, for interests in funds, either the net asset or DCF method.
For the multiples methods, the enterprise value is determined by applying a multiple to an appropriate indicator of the company’s value. That indicator is generally the company’s earnings before interest, taxes and amortisation (EBITA) and/or earnings before interest, taxes, depreciation and amortisation (EBITDA). The indicator derives from a portfolio company’s current financial metrics. To arrive at a maintainable indicator of value, these metrics are adjusted for special effects such as non-recurring expenses or discounts for risk projects. In addition, discounts or premiums are made on the applied indicators if there is current information that is not yet reflected in these financial metrics. The multiple is derived from the market capitalisation of a peer group. Companies are selected for the peer group that are comparable with the investee business to be valued as to their business model, the geographical focus of their operations as well as their size. If the company to be valued differs in certain aspects compared with features of companies in the peer group, discounts or premiums are applied to the relevant multiple. As long as these differences between the portfolio company to be valued and the peer group companies exist, these discounts or premiums are applied consistently. For reconciliation to the net asset value, which corresponds to the fair value, net liabilities are deducted from the enterprise value.
1 See http://www.privateequityvaluation.com / (Edition December 2012)
A N N U A L R E P O R T 2 0 1 3 / 1 4 1 4 7
FIN
AN
CIA
L S
TA
TE
ME
NT
S

In determining the fair value, critical judgments on the part of the Valuation Committee will become necessary to a certain extent, i.e. assumptions and estimates are required to be made. These are constructively substantiated by the Valuation Committee and documented in the valuation records. To that end, the assumptions and estimates are based on the premises of current knowledge and the experience of the Valuation Committee and are consistently applied without arbitrariness. If the portfolio company’s actual performance or the underlying conditions differ from the trend expected at the preceding valuation date, the premises and, if appropriate, the fair value are adjusted at the next valuation date.
In the DCF method, fair value is determined by discounting expected future cash flows. The portfolio company’s existing budgeting is used as the basis for projecting future cash flows. This is adjusted by discounts or premiums, if current findings exist that were not yet considered in the budgets. If there is no suitable basis for transition to a terminal value at the end of the forecast period, a less detailed trend phase follows. For the time following the forecast period and, if appropriate, the trend phase, a terminal value is used that may be adjusted by a growth rate. We derive the discount rate by the capital asset pricing model (CAPM) from a risk-free base rate and a risk premium to capture the business risk involved. For valuations of interests in international funds using the DCF method, the expected proceeds from the sale of portfolio companies are discounted to the present value by applying the appropriate rate.
Recognition of revenues
Due to the particularities arising from the operating activities of the DBAG Group as a financial investor, the net result of fund and investment activity is presented instead of revenues in the consolidated statement of comprehensive income. It consists of “Fee income from investment services to funds”, the “Net result of valuation and disposal of financial assets and loans and receivables” and “Current income from financial assets and loans and receivables”.
FEE INCOME FROM INVESTMENT SERVICES TO FUNDS is recognised when the services are delivered.
The NET RESULT OF VALUATION comprises movements in the fair value of financial assets and loans and receivables that are derived at each valuation date using the valuation principles described above.
The NET RESULT OF DISPOSAL contains profits that were realised upon disposal of financial assets and loans and receivables. For regular-way sales, disposals are recognised at the settlement date. The profits achieved on the sale are therefore recorded on that date. The settlement date is the day on which the contractually agreed obligations between the selling and purchasing parties to the contract have been fulfilled. In the DBAG Group, this is usually the transference of the interests in the divested portfolio company in exchange for the receipt of cash, a purchaser’s loan or other financial assets. In the event of contractually agreed retentions on the purchase price for representations and warranties or other risks, these are recognised at a future date at which claims to warranty obligations or other risks are no longer probable. This may also be done on a contractually agreed pro rata basis in partial amounts per period.
CURRENT INCOME comprises dividends and interest payments from portfolio companies as well as securities. This income is recognised on the day that dividends are declared, or, for interest payments, on a pro rata temporis basis or in the period in which they accrue.
Impairment test for financial assets at fair value outside profit or loss
An impairment test for financial assets measured at fair value outside profit or loss is conducted at each reporting date. At DBAG, these relate to financial assets falling under the categories of “loans and receivables” as well as “financial assets available for sale”. The impairment test is designed to identify whether there is objective evidence that an asset is impaired. Such objective evidence could be:
> significant financial difficulty of the issuer or obligor
> breach of contract, for example, default or delinquency in interest and principal payments
1 4 8 C O N S O L I D AT E D F I N A N C I A L S TAT E M E N T S

> concessions by the DBAG Group to a borrower for economic or legal reasons relating to the borrower’s financial difficulty
> the probability that the borrower will enter bankruptcy or other financial reorganisation
> the disappearance of an active market for that financial asset because of financial difficulties
> observable data, such as the payment status of borrowers or adverse changes in national or local economic conditions, indicating that there is a measurable decrease in the estimated future cash flows from the financial asset
Impaired financial assets are derecognised when there is objective evidence that a receivable is uncollectible or that future cash flows can no longer be expected.
Intangible assets/property, plant and equipment
Intangible assets and property, plant and equipment are valued at amortised cost, less regular straight-line depreciation based on normal useful life as well as any impairment losses.
Useful life for intangible assets is determinable and extends from two to five years. For property plant and equipment, useful economic life is termed from three to thirteen years. Additions are depreciated pro rata temporis beginning in the month of acquisition.
Beyond that, intangible assets and property, plant and equipment are subject to impairment review, if certain events and/or changes in circumstances indicate that the carrying amount may no longer be recoverable. An impairment loss amounting to the difference between the carrying amount and the recoverable amount is recognised. The recoverable amount is the higher of an asset’s fair value (less costs to sell) or its utility value.
Loans and receivables
Item ”Loans and receivables” comprises loans, shareholder loans and receivables with a fixed term and without an embedded derivative requiring separation.
Loans and receivables relate to financial assets within the meaning of IAS 39. These are designated to the category of “loans and receivables” and are carried at amortised cost. Loans and receivables are subject to an impairment test at each reporting date (see also section on impairment test above). Impairment losses on loans and receivables are recognised in item “Other operating expenses” in the consolidated statement of comprehensive income.
Securities
Securities comprise interest-bearing bonds. They are designated to the category of “available-for-sale financial assets”. Securities are designated to the category of “available-for-sale financial assets” because these may possibly be sold at any time to cover liquidity requirements arising from DBAG’s investment activity. The securities are initially recognised at fair value, which corresponds to their cost at the time of the transaction, and at fair value directly in “Other comprehensive income” at the subsequent reporting dates. Changes in fair value are recognised in “Retained earnings and other reserves” in the consolidated statement of financial position and in “Unrealised gains/(losses) on available-for-sale securities” in the consolidated statement of comprehensive income. An impairment test is conducted at each reporting date (see also section on impairment test above). If there is objective evidence of impairment, the aggregate loss recognised in reserves is reclassified to “Other operating expenses” through profit or loss in the consolidated statement of comprehensive income, even if the securities were not derecognised. An impairment account is used to record impairments. Gains and losses realised on disposal of securities of this category are reclassified accordingly, insofar as this has not occurred at earlier reporting dates by way of an impairment test.
A N N U A L R E P O R T 2 0 1 3 / 1 4 1 4 9
FIN
AN
CIA
L S
TA
TE
ME
NT
S

Other assets
“Other assets” comprise receivables from portfolio companies or DBAG funds, other receivables as well as prepaid expenses. Where applicable, this item also contains the net asset position arising from offsetting plan assets with pension obligations. With the exception of prepaid expenses, value-added tax and the net asset position arising from offsetting plan assets with pension obligations, these relate to financial assets as defined in IAS 39.
These financial assets are allocated to the category “available-for-sale financial assets” or “loans and receivables”. They are initially recognised at cost and are tested for impairment at the subsequent reporting dates (see section on impairment test). If there is objective evidence of impairment, the loss is recognised in “Other operating expenses” in the consolidated statement of comprehensive income.
Receivables
Line item “Receivables” contains receivables from portfolio companies. These relate to financial assets that are allocated to the category of “loans and receivables” upon initial recognition. They are initially valued at cost and are tested for impairment at the subsequent reporting dates (see section on impairment test). If there is objective evidence of impairment, the loss is recognised in item “Other operating expenses” in the consolidated statement of comprehensive income.
Other financial instruments
Item “Other financial instruments” contains equity shares in companies that will shortly be sold to the management of portfolio companies. These are financial assets within the meaning of IAS 39. Depending on their characteristics as equity or liability instruments, they are allocated either to the category “financial assets at fair value through profit or loss” or “loans and receivables”. In the event of an equity instrument, the fair value is measured in correspondence to the fair value of the portfolio company in item “Financial assets”. Changes in fair value are recognised either in “Other operating income” or in “Other operating expenses” of the consolidated statement of
comprehensive income. For debt instruments, an impairment test is conducted at every reporting date (see section on impairment test). If there is objective evidence of impairment, the loss is recognised in item “Other operating expenses” in the consolidated statement of comprehensive income.
Income tax assets
Item “Income tax assets” contains receivables from corporation and investment income tax. These relate to current taxes resulting from taxable income. Income tax assets are recognised in the relevant amount for tax purposes.
Cash and cash equivalents
“Cash and cash equivalents” relates to cash in banks, time deposits and overnight money. These are allocated to the category of “loans and receivables” and carried at amortised cost.
Deferred taxes
According to the IFRS, deferred taxes are recognised on temporary differences arising between the tax bases of assets and liabilities and their IFRS carrying amounts in the accounts (balance sheet-orientated method). Temporary differences based on the IFRS are any differences that are not of a permanent nature. The IFRS require recognition of both deferred tax assets and liabilities, if the criteria for recognition exist.
Additionally, expected tax reductions from loss carryovers are capitalised in the IFRS format, if an appropriate level of taxable income is expected to be achieved in the foreseeable future against which unused tax loss carryovers may be offset. The tax rates expected to apply at the balance sheet date are used to determine deferred taxes.
Changes to deferred taxes are basically recognised in profit or loss, insofar as the circumstances to which they relate were recognised in profit or loss and were not charged or credited to equity.
1 5 0 C O N S O L I D AT E D F I N A N C I A L S TAT E M E N T S

Minority interest
Minority interest is carried as a financial liability pursuant to IAS 39. Initial and subsequent valuation is at fair value. Item “Minority interest” in the consolidated statement of financial position contains the minority share ownership belonging to other investors in companies that are fully consolidated in the Group accounts. “Minority interest” is disclosed in liabilities, since it concerns shares in partnerships which do not meet the definition of equity in accordance with the IFRS.
Provisions for pension obligations and plan assets
Pension obligations arising from defined benefit plans exist at two Group companies. Application of the plans is subject to the date at which the respective employee joined the company. The amount of retirement benefits depends on the relevant pension scheme, the employee’s compensation and years of service.
Pension obligations of Group companies are set against assets of a legally independent entity (“contractual trust arrangement” in the form of a bilateral trust), which must be used exclusively to cover the pension commitments given and are not accessible to creditors (qualified plan assets).
Pension obligations arising from defined benefit plans are measured based on the projected unit credit method. For this method, future obligations are valued by the benefits proportionately accrued up to the reporting date. They show that part of pension obligations that has been recognised through profit or loss up to the reporting date. The measurement accounts for expected future trends in certain actuarial parameters, such as the life expectancy of beneficiaries, future salary and benefit increases and the discount rate. The
discount rate is calculated based on the returns that are valid at the reporting date for long-term industrial bonds with a comparable maturity of issuers with highest credit ratings.
Plan assets are measured at fair value.
For the presentation in the financial statements, the present value of pension obligations is netted against the fair value of plan assets of the respective Group company. The resulting company-related net asset or liability positions are neither aggregated nor offset. Should the fair value of plan assets exceed the present value of pension obligations, a net defined benefit asset is recognised in “Other non-current assets”. A net defined benefit liability is recognised in “Provisions for pension obligations”.
Service cost is recognised in “Personnel costs” and net interest on the net defined benefit liability (asset) in “Interest expenses”. Net interest comprises interest expenses on pension obligations and interest income on plan assets. It is calculated using the discount rate for pension obligations.
Remeasurements of the net defined benefit liability are recognised in “Other comprehensive income”. They comprise actuarial gains and losses from changes in financial and demographic assumptions as well as from experience-related changes.
Other provisions
Other provisions are carried in liabilities, if a third-party obligation and the probability of an outflow of resources to settle the obligation exist. Non-current provisions are discounted.
Other liabilities
Liabilities of the Group are carried in “Other liabilities” in conformity with IAS 39. They are initially recognised at cost. Subsequent measurement for discounted loans is at amortised cost using the effective interest method.
A N N U A L R E P O R T 2 0 1 3 / 1 4 1 5 1
FIN
AN
CIA
L S
TA
TE
ME
NT
S

Other financial commitments, contingent liabilities and trusteeships
Other financial commitments are recognised outside the balance sheet. They ensue to the extent that a legal or constructive third-party obligation exists for DBAG at the reporting date. This is measured on initial recognition at fair value.
Existing obligations arising from rental and lease contracts are carried as permanent debt obligations outside the balance sheet. Future payment commitments are discounted.
Contingent liabilities are disclosed at the settlement amount and trusteeships at their fair value in the notes to the consolidated financial statements.
Net result of valuation and disposal of financial assets and loans and receivables
This item contains realised gains and losses arising from disposals of financial assets and from changes in the fair value of financial assets. This caption also includes impairment losses on loans and receivables carried at amortised cost.
Other comprehensive income
In addition to net income, other comprehensive income is the second component of total consolidated comprehensive income. Through other comprehensive income, transactions are recognised outside profit or loss. Other comprehensive income is net of minority interest in the DBAG Group.
Offsetting
In preparing the consolidated statement of financial position and the consolidated statement of comprehensive income, assets and liabilities as well as income and expenses are basically not offset, unless this is stipulated or expressly permitted by a requirement.
Leases
Only operating lease commitments exist. Lease payments are recognised as an expense.
Foreign currency
Receivables and liabilities stated in foreign currency are recognised in the consolidated income statement using the closing-rate method. Since the group of consolidated companies of Deutsche Beteiligungs AG does not include foreign-based companies, there are no effects from currency translations in this context.
7. J U D G M EN T S I N A P P LY I N G T H E ACCO U N T I N G P O L I C I ES
The preparation of the consolidated financial statements in conformity with the IFRS requires the Board of Management to make accounting judgments. These judgments can materially influence the reported amounts in the financial statements. The accounting, valuation and consolidation methods applied that were based on judgments are detailed in notes 2 to 6. The amounts recognised in the financial statements were most significantly influenced by the decision to measure financial assets in accordance with IAS 39 at fair value through profit or loss (see “Fair value measurement of financial assets through profit or loss” in note 6). This has the advantage that the central performance measures in the private equity business, the total value and the value appreciation of the portfolio are easily perceptible directly from the consolidated financial statements.
8 . FU T U R E- O R I EN T ED A S SU M P T I O N S A N D OT H ER M A J O R S O U RC ES O F ES T I M AT I O N U N C ER TA I N T Y
Preparation of the consolidated financial statements in accordance with the IFRS requires the use of future-oriented assumptions and estimations. These can have a material impact on the carrying amounts of consolidated statement of financial position items as well as the level of income and expenses. Future-oriented assumptions and estimations both involve uncertainty about outcomes. The Board of Management takes decisions on assumptions and estimations after careful consideration of the most recently available reliable information and past experience. Assumptions and estimations also relate to
1 5 2 C O N S O L I D AT E D F I N A N C I A L S TAT E M E N T S

issues on which the Board of Management has no influence, for instance, economic or financial market conditions. The actual outcomes can differ from the assumptions and estimations underlying these consolidated financial statements. In the event that new data and information become available or that changes take place, the assumptions and estimations are adjusted accordingly. The effects of a change in an assumption or estimation is recognised in the financial year that the change takes place and, if appropriate, in later financial years in the carrying amount of that consolidated statement of financial position item as well as in the consolidated statement of comprehensive income.
The IFRS require the disclosure of which assets and liabilities, due to assumptions about the future and other major sources of estimation uncertainty, have a significant risk of resulting in a material adjustment to the carrying amounts within the next financial year. We judge the materiality by means of the effects on the consolidated net assets. We would consider an adjustment to the carrying amount in the range of three percent of total shareholders’ equity as being material.
A significant risk exists in financial assets and other financial instruments the fair value of which was determined using inputs not based on observable market data (hierarchy level 3, see note 35.2). These are contained in “Financial assets” in an amount of T€ 134,695 (previous year: T€ 110,713) and in “Other financial instruments” in an amount of T€ 2,245 (previous year T€ 2,401). They concern that part of financial assets and other financial instruments that is largely valued by the multiples method. The extent of possible effects in the event of a necessary adaption of assumptions and estimations is not quantifiable. However, should the underlying multiples change by +/- 1, this would result, ceteris paribus, in a fair value adjustment for this part of financial assets of +/- T€ 17,186 (previous year: T€ 12,037). This equates to six percent of total shareholders’ equity.
A N N U A L R E P O R T 2 0 1 3 / 1 4 1 5 3
FIN
AN
CIA
L S
TA
TE
ME
NT
S

Current income from financial assets exclusively contains distributions from corporations.
Current income from loans and receivables exclusively contains interest on profit-sharing certificates and loans to portfolio companies.
11. FEE I N CO M E FRO M I N V ES T M EN T S ERV I C ES TO FU N DS
Fee income from investment services to funds is composed of the following:
T € 2013/14 2012/13
DBG Fonds I 1,831 696
DBG Fonds III 20 20
DBAG Fund IV 418 614
DBAG Fund V 5,041 5,892
DBAG ECF 862 2,070
Other 28 29
Management fee income 8,200 9,321
Advisory fee income (DBAG Fund VI) 13,536 9,568
21,736 18,889
Management fee income stems from the management of private equity funds, alongside of which Deutsche Beteiligungs AG co-invests (see commentary in note 40).
Advisory fee income results from advisory services to the manage-ment company of DBAG Fund VI (see commentary in note 40).
12 . P ER S O N N EL CO S T S
T € 2013/14 2012/13
Wages and salaries 15,428 12,525
thereof variable income:
performance-related 4,356 3,520
transaction-related 4,161 137
Social contributions and expenses for pension plans 1,105 1,268
thereof service cost 393 479
thereof for defined contribution plans (including employer’s contributions to state pension plans) 426 452
16,533 13,793
NOTES TO THE CONSOLIDATED STATEMENT OF COMPREHENSIVE INCOME
9 . N E T R ESU LT O F VA LUAT I O N A N D D I S P O S A L O F F I N A N C I A L A S S E T S A N D LOA N S A N D R EC E I VA B L ES
T € 2013/14 2012/13
Net result of valuation – portfolio 21,572 31,288
Net result of disposal – portfolio 28,943 5,382
Net result of valuation and disposal – portfolio 50,515 36,670
Net result of valuation – other financial assets (235) (2,181)
50,280 34,489
The portfolio consists of interests in associates, other interests in portfolio companies and fund investments as well as liability instruments in that connection (see notes 19 and 20).
The net result of valuation and disposal derives exclusively from financial assets for the periods presented.
For further information on the net result of valuation and disposal, we refer to the management report (see page 75 f.).
10 . C U R R EN T I N CO M E FRO M F I N A N C I A L A S S E T S A N D LOA N S A N D R EC E I VA B L ES
T € 2013/14 2012/13
Current income from financial assets
Portfolio 2,206 2,085
Other financial assets 423 4,275
2,629 6,360
Current income from loans and receivables
Portfolio 1,596 159
4,225 6,519
1 5 4 C O N S O L I D AT E D F I N A N C I A L S TAT E M E N T S
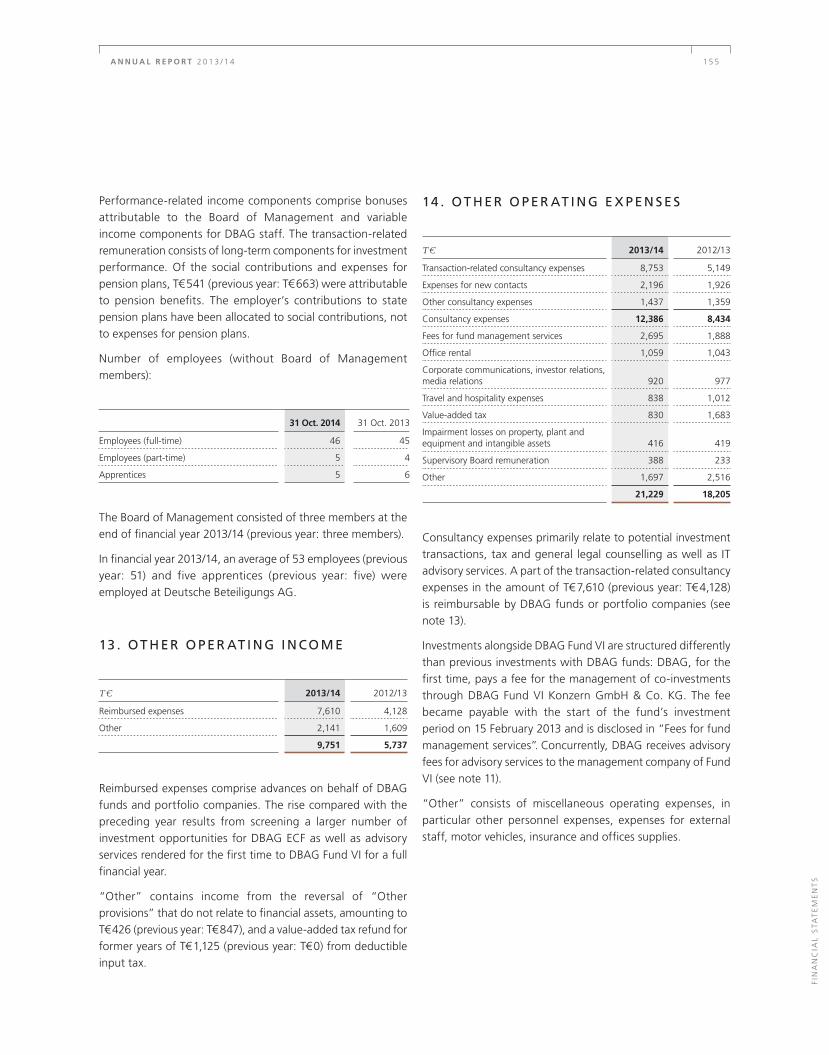
Performance-related income components comprise bonuses attributable to the Board of Management and variable income components for DBAG staff. The transaction-related remuneration consists of long-term components for investment performance. Of the social contributions and expenses for pension plans, T€ 541 (previous year: T€ 663) were attributable to pension benefits. The employer’s contributions to state pension plans have been allocated to social contributions, not to expenses for pension plans.
Number of employees (without Board of Management members):
31 Oct. 2014 31 Oct. 2013
Employees (full-time) 46 45
Employees (part-time) 5 4
Apprentices 5 6
The Board of Management consisted of three members at the end of financial year 2013/14 (previous year: three members).
In financial year 2013/14, an average of 53 employees (previous year: 51) and five apprentices (previous year: five) were employed at Deutsche Beteiligungs AG.
13 . OT H ER O P E R AT I N G I N CO M E
T € 2013/14 2012/13
Reimbursed expenses 7,610 4,128
Other 2,141 1,609
9,751 5,737
Reimbursed expenses comprise advances on behalf of DBAG funds and portfolio companies. The rise compared with the preceding year results from screening a larger number of investment opportunities for DBAG ECF as well as advisory services rendered for the first time to DBAG Fund VI for a full financial year.
“Other” contains income from the reversal of “Other provisions” that do not relate to financial assets, amounting to T€ 426 (previous year: T€ 847), and a value-added tax refund for former years of T€ 1,125 (previous year: T€ 0) from deductible input tax.
14 . OT H ER O P ER AT I N G E X P EN S ES
T € 2013/14 2012/13
Transaction-related consultancy expenses 8,753 5,149
Expenses for new contacts 2,196 1,926
Other consultancy expenses 1,437 1,359
Consultancy expenses 12,386 8,434
Fees for fund management services 2,695 1,888
Office rental 1,059 1,043
Corporate communications, investor relations, media relations 920 977
Travel and hospitality expenses 838 1,012
Value-added tax 830 1,683
Impairment losses on property, plant and equipment and intangible assets 416 419
Supervisory Board remuneration 388 233
Other 1,697 2,516
21,229 18,205
Consultancy expenses primarily relate to potential investment transactions, tax and general legal counselling as well as IT advisory services. A part of the transaction-related consultancy expenses in the amount of T€ 7,610 (previous year: T€ 4,128) is reimbursable by DBAG funds or portfolio companies (see note 13).
Investments alongside DBAG Fund VI are structured differently than previous investments with DBAG funds: DBAG, for the first time, pays a fee for the management of co-investments through DBAG Fund VI Konzern GmbH & Co. KG. The fee became payable with the start of the fund’s investment period on 15 February 2013 and is disclosed in “Fees for fund management services”. Concurrently, DBAG receives advisory fees for advisory services to the management company of Fund VI (see note 11).
“Other” consists of miscellaneous operating expenses, in particular other personnel expenses, expenses for external staff, motor vehicles, insurance and offices supplies.
A N N U A L R E P O R T 2 0 1 3 / 1 4 1 5 5
FIN
AN
CIA
L S
TA
TE
ME
NT
S

15 . I N T ER ES T I N CO M E
T € 2013/14 2012/13
Revenue office 105 420
Securities 153 248
Other 185 279
443 947
Interest income – Revenue office in the previous financial year related to an erroneous tax refund from the revenue office, which was corrected in the same financial year. The erroneous interest credit was reversed by a charge to interest expenses (see note 16).
Interest income is attributable to the following categories of financial instruments:
T € 2013/14 2012/13
Loans and receivables 290 679
Available-for-sale financial assets 153 248
Financial assets at fair value through profit or loss 0 20
443 947
16 . I N T ER ES T E X P EN S ES
T € 2013/14 2012/13
Interest expenses for pension provisions 917 788
Expected interest income on plan assets (824) (378)
Net interest on net defined benefit liability 93 410
Revenue office 5 420
Other 59 1
157 831
The rise in interest income on plan assets results from the first-time adoption of IAS 19. Please see the commentary in note 3 (Amendments to IAS 19 “Employee Benefits”). We refer to note 30 on the inputs for the two components of net interest on the net defined benefit liability.
Please see note 15 for details on the previous year’s “Interest expense – Revenue office”.
17. I N CO M E TA X ES
T € 2013/14 2012/13
Current taxes 418 500
Deferred taxes (1) (18)
417 482
In addition to tax expenses of T€ 401 for the 2013/14 reporting period, current taxes in financial year 2013/14 also contain taxes of T€ 17 for preceding years. An erroneous tax refund and its return payment to the revenue office were recorded in current taxes in the previous year (see also note 15).
Deferred taxes are based on the occurrence or reversal of temporary differences between the IFRS carrying amounts and the tax purpose-based carrying amounts of assets and debt. Temporary differences primarily exist for financial assets and pension provisions. This financial year, the Group companies have for the most part recorded a surplus in deferred tax assets that largely originated from existing loss carryforwards. Based on the type of business activities and their applicable tax treatment, it is not probable that sufficient taxable profit will be available against which they can be utilised. These deferred tax assets were therefore not capitalised. Deferred tax income totalling T€ 1 in the reporting year (previous year: T€ 18) is exclusively attributable to DBG Advisors Kommanditaktionär GmbH & Co. KG. At 31 October 2014, there were neither deferred income tax assets, nor deferred income tax liabilities taken directly to equity.
1 5 6 C O N S O L I D AT E D F I N A N C I A L S TAT E M E N T S

Reconciliation between the theoretically expected tax charge for an incorporated company and the current amount recognised in the consolidated financial statements of DBAG is as follows:
T € 2013/14 2012/13
Earnings before taxes 48,516 33,752
Applicable corporate tax rate % 31.93 31.93
Theoretical tax income/expenses 15,489 10,777
Change in theoretical tax income/expenses:
Tax-exempt positive net result of valuation and disposal (14,939) (10,466)
Other untaxed losses (previous year: non-capitalised gains) (2,335) 2,137
Non-capitalised tax loss carryforwards for current year 817 3
Non-deductible negative net result of valuation and disposal 2,850 1,022
Tax-exempt current income (561) (1,688)
Non-deductible expenses 88 73
Taxes from previous years 411 89
Adjustment of corporation tax credit based on tax audit 2000 – 2003 0 (41)
Use of non-capitalised tax loss carryforwards (361) (1,050)
Tax rate differential (1,385) (406)
Other effects 343 32
Income taxes 417 482
Taxation ratio % 0.86 1.43
A main pillar of DBAG’s business is the acquisition and disposal of investments alongside the DBAG funds. The investments relate to corporate enterprises; thus, in accordance with § 8 German Corporation Tax Act (KStG), the (positive) net result of valuation and disposal totalling T€ 14,939 (previous year: T€ -10,466) is tax-exempt.
Due to tax purpose-based negative income contributions by Group companies that largely exist, deferred taxes arising from temporary differences between the IFRS and tax-purpose-based carrying amounts were not recognised at Group level due to lack of recoverability. The tax-based reconciliation effect of T€ -2,335 (previous year: T€ 2,137) therefore reflects the carryforward of other temporary differences arising from differences between the IFRS and tax purpose-based accounting.
The expected tax rate for corporations is composed of corporation tax and a solidarity surcharge (15.83 percent) as well as municipal trade tax (16.10 percent). The tax rate for Deutsche Beteiligungs AG is 15.83 percent, since Deutsche Beteiligungs AG is recognised as an equity investment company and is exempt from municipal trade tax.
A N N U A L R E P O R T 2 0 1 3 / 1 4 1 5 7
FIN
AN
CIA
L S
TA
TE
ME
NT
S

N OT ES TO T H E CO NSO L I DAT ED S TAT EM EN T O F F I N A N CI A L P OS I T I O N
18 . I N TA N G I B L E A S S E T S / P RO P ER T Y, P L A N T A N D EQ U I P M EN T
Acquisition cost
T € 1 Nov. 2013 Additions Disposals 31 Oct. 2014
Intangible assets 336 135 3 468
Property, plant and equipment 2,468 551 282 2,737
2,804 686 285 3,205
Depreciation/amortisation Carrying amount
T € 1 Nov. 2013 Additions Disposals 31 Oct. 2014 31 Oct. 2014 31 Oct. 2013
Intangible assets 302 18 3 317 151 34
Property, plant and equipment 1,195 398 160 1,433 1,304 1,273
1,497 416 163 1,750 1,455 1,307
Depreciation and amortisation on property, plant and equip-ment and intangible assets in the reporting year exclusively relate to scheduled depreciation.
19 . F I N A N C I A L A S S E T S
Financial assets are composed of the following:
T € 31 Oct. 2014 31 Oct. 2013
Interests in associates 11,382 64,246
Other interests in portfolio companies 107,441 83,988
International fund investments 8,300 10,359
Portfolio 127,123 158,593
Other financial assets 7,924 8,159
135,047 166,752
Financial assets are measured at fair value through profit or loss (see note 6).
Other financial assets contain companies that are mainly attributable to third parties.
This item exhibited the following movements in the reporting year:
T €1 Nov. 2013 Additions Disposals
Value movements
31 Oct. 2014
Portfolio 158,593 10,321 63,363 21,572 127,123
Other financial assets 8,159 0 0 (235) 7,924
166,752 10,321 63,363 21,337 135,047
Movements in value are recorded under the caption ”Net result of valuation and disposal of financial assets and loans and receivables” in the consolidated statement of comprehensive income (see note 6).
1 5 8 C O N S O L I D AT E D F I N A N C I A L S TAT E M E N T S

by another portfolio company for a total of T€ 3,579. The previous year’s receivables from portfolio companies largely pertained to a short-term loan in conjunction with the acquisition of a portfolio company in the amount of T€ 8,930. This item also contains receivables from a clearing account with one portfolio company and interest receivable from portfolio companies.
These receivables are recognised at fair value outside profit or loss and are subjected to an impairment test at every reporting date (see note 6).
Impairment losses developed as follows:
T € 2013/14 2012/13
At start of financial year 60 654
Additions 0 0
Disposals 60 594
At end of financial year 0 60
Disposals in the amount of T€ 60 (previous year: T€ 594) relate to impairment losses on a receivable from a disinvested port-folio company. The receivable was derecognised through profit or loss in financial year 2013/14.
2 3 . S EC U R I T I ES
Securities held at 31 October 2014 were exclusively acquired as investments of cash and cash equivalents not immediately required.
Classification of securities in the statement of financial position:
T € 31 Oct. 2014 31 Oct. 2013
Long-term securities 80,991 50,514
Short-term securities 31,344 28,028
112,335 78,542
2 0 . LOA N S A N D R EC E I VA B L ES
T € 2013/14 2012/13
At start of financial year 14,110 2,925
Additions 14,582 11,407
Disposals 2,745 222
At end of financial year 25,947 14,110
Loans and receivables relate to claims arising from loan arrangements with portfolio companies. The additions in financial year 2013/14 contain loans, silent partnerships and profit-sharing certificates.
21. OT H ER N O N - C U R R EN T A S S E T S
T € 31 Oct. 2014 31 Oct. 2013
Pension obligations and plan assets 0 248
Tax assets 421 619
421 867
We refer to the commentary in notes 25 and 30.
2 2 . R EC E I VA B L ES
T € 31 Oct. 2014 31 Oct. 2013
Receivables from associates 25 63
Receivables from portfolio companies 7,375 11,917
7,400 11,980
Receivables from associates pertain to subsidiaries which, lacking materiality, were not consolidated (see note 4).
Receivables from portfolio companies relate, among other things, to two short-term loans in conjunction with the acquisition of a portfolio company and the funding of a purchase transaction
A N N U A L R E P O R T 2 0 1 3 / 1 4 1 5 9
FIN
AN
CIA
L S
TA
TE
ME
NT
S

Classification of securities by types:
T € 31 Oct. 2014 31 Oct. 2013
Floating-rate notes (3-month Euribor) 25,026 48,088
Floating-rate notes (6-month Euribor) 10,000 25,020
Fixed-rate securities 77,309 5,434
112,335 78,542
Classification of securities by maturity:
T € 31 Oct. 2014 31 Oct. 2013
Due within 1 year 31,344 28,028
Due between 1 and 2 years 3,921 21,449
Due between 2 and 3 years 5,000 29,065
Due between 3 and 4 years 0 0
Due between 4 and 5 years 22,773 0
Due > 5 years 49,297 0
112,335 78,542
All securities have been designated to the category of “available-for-sale financial assets” (see note 6).
The change in fair value of T€ 306 (previous year: T€ -86) is recognised in the consolidated statement of comprehensive income in “Unrealised gains/(losses) on available-for-sale securities”. A loss of T€ 43 (previous year: loss of T€ 30) arising from disposals of securities from this category in the reporting year was reclassified to consolidated net income.
24 . OT H ER F I N A N C I A L I N S T RU M EN T S
T € 31 Oct. 2014 31 Oct. 2013
Short-term equity shares 2,245 2,401
Short-term equity shares relate to shares that are to be sold to the managements of portfolio companies within a year.
25 . TA X A S S E T S , TA X P ROV I S I O N S A N D D EFER R ED TA X ES
T € 31 Oct. 2014 31 Oct. 2013
Tax assets
Other non-current assets 421 619
Income tax assets 5,435 3,452
Tax provisions 2,232 1,838
Deferred tax liabilities 60 61
Tax assets contain imputable taxes and corporation tax assets of Deutsche Beteiligungs AG capitalised at net present value. The major portion of income tax assets results from imputable investment income tax of T€ 2,506 (previous year: T€ 1,134) arising on a distribution by Deutsche Beteiligungsgesellschaft mbH as well as corporation tax credits of Deutsche Beteiligungs AG of T€ 652 (previous year: T€ 850). Another part of tax assets stems from imputable investment income taxes of T€ 140 arising from interest income on securities and bank accounts, as well as of T€ 419 from distributions from investments.
Tax provisions reflect expected tax expenses, without account-ing for imputable taxes and tax prepayments.
Deferred tax assets and liabilities are offset in conformity with IAS 12.74.
Tax loss carryforwards have been recognised in deferred taxes as follows:
T € 31 Oct. 2014 31 Oct. 2013
Tax loss carryforward, corporation tax 77,366 86,064
thereof usable 0 0
Tax loss carryforward, trade tax 17,676 14,981
thereof usable 0 0
Based on the type of business activities and their tax treatment, it is unlikely that the Group companies concerned will achieve sufficient future taxable profits against which the loss carry-forwards can be used.
Deferred tax liabilities are exclusively attributable to line item “Financial assets”.
1 6 0 C O N S O L I D AT E D F I N A N C I A L S TAT E M E N T S

26 . OT H E R C U R R EN T A S S E T S
T € 31 Oct. 2014 31 Oct. 2013
Receivables for advisory services 11,081 1,479
Receivables from DBAG funds 2,071 3,706
Purchase price retention 1,879 449
Value-added tax 1,026 1,371
Loans 573 1,001
Interest receivable on securities 478 251
Lease security deposit 405 405
Purchase price receivable 0 1,778
Other receivables 973 1,008
18,486 11,448
Receivables from DBAG funds largely comprise profit priority shares and reimbursable expenses.
Receivables from advisory services pertain to advisory services to the management company of DBAG Fund VI.
The movement in purchase price receivable in financial year 2013/14 relates to the receipt of payments due from the sale of two investments (see management report, section “Business and portfolio review”, page 72 f.)
The purchase price retention covers possible representation and warranty risks from the divestment of a portfolio company. The purchase price retention recognised in the prior year was reversed in financial year 2013/14.
Loans chiefly result from deferred purchase price payments extended to managers of portfolio companies from disposals of short-term shareholdings in incorporated companies.
Value-added tax pertains to outstanding refunds of input tax credits.
Other receivables largely constitute prepaid expenses.
27. EQ U I T Y
Subscribed capital/number of shares outstanding
All shares in Deutsche Beteiligungs AG were converted from bearer shares to no-par value registered shares at a ratio of 1:1 in financial year 2013/14. Each share is entitled to one vote.
The shares are admitted for trading on the Frankfurt Stock Exchange (Prime Standard) and the Dusseldorf Stock Exchange. Shares in the Company are also traded on the Open Market of the Berlin, Hamburg-Hanover, Munich and Stuttgart stock exchanges.
The number of shares outstanding was constantly 13,676,359 both in the reporting and the comparative period.
Arithmetically, the capital attributable to each share equals approximately 3.55 euros per share.
Sale of own shares to employees and retirees
The Company offers employees and retirees of Deutsche Beteiligungs AG and of a subsidiary an employee share purchase plan at preferential terms, which is orientated around tax legislation and limits. The following depicts the transactions involving own shares in financial year 2013/14:
Purchase/sales price per share
Share of subscribed capital
€
Number of shares T€ ‰
At 1 Nov. 2013 0 0 0.0
Date of purchase: 15 Oct. 2014 20.89 3,766 13 0.3
Date of sale/transfer: 28 Oct. 2014 14.98 3,766 13 0.3
At 31 Oct. 2014 0 0 0.0
A N N U A L R E P O R T 2 0 1 3 / 1 4 1 6 1
FIN
AN
CIA
L S
TA
TE
ME
NT
S

Authorised capital
The Board of Management is, with the consent of the Supervisory Board, authorised to raise the share capital of the Company until 23 March 2015 by up to a total of 24,266,665.33 euros through one or more issues of new no-par registered shares in exchange for cash or non-cash contributions (authorised capital). The number of shares in that context must be increased proportionately to the share capital.
Purchase of own shares
The Board of Management is, with the consent of the Supervisory Board, authorised until 22 March 2016 to purchase own shares by up to ten percent of the current share capital – or, in the event that this value is lower – of the share capital at the time the authorisation is exercised, for purposes other than trading in own shares.
Contingent capital
The Board of Management is authorised, with the consent of the Supervisory Board, to issue, by one or in several issues, bearer or registered warrant-linked bonds and/or convertible bonds (jointly referred to as “bonds”) in the period until 23 March 2015 with or without a maturity cap for a total nominal amount of up to €160,000,000.00. It is also authorised to grant holders of warrant-linked bonds warrants, and the holders or creditors of convertible bonds conversion rights, to registered shares in the Company with a proportionate share in the share capital of up to €24,266,665.33 under the conditions specified for the warrant-linked bonds or convertible bonds (jointly referred to as “bond conditions”).
In addition to euros, the bonds may also be denominated in an official currency of an OECD country, limited to the equivalent amount in euros.
The bonds may also be issued by affiliates in which the Company directly or indirectly holds a majority. In such an event, the Board of Management shall be authorised, with the consent of the Supervisory Board, to guarantee for the bonds and to grant the holders and/or creditors of such bonds option or conversion rights to bearer shares in the Company.
Capital reserve
The capital reserve, which was unchanged at T€ 141,394 (previous year: T€ 141,394), comprises amounts achieved from the issuance of shares in excess of the par value.
Retained earnings and other reserves
Retained earnings and other reserves comprise:
> the legal reserve, as stipulated by German stock corporation law
> first-time adopter effects from the IFRS opening balance at 1 November 2003
> provisions for actuarial gains/losses arising from defined benefit pension obligations/plan assets (see note 30)
> unrealised gains/losses on available-for-sale investments (see note 23)
Consolidated retained profit
At the Annual Meeting on 27 March 2014, shareholders voted to pay a dividend of 0.40 euros per share (5,470,543.60 euros) plus a surplus dividend of 0.80 euro per share (10,941,087.20 euros) for financial year 2012/13.
in € 2013/14 2012/13
Dividends paid 5,470,543.60 5,470,543.60
Surplus dividends paid 10,941,087.20 10,941,087.20
Total distribution 16,411,630.80 16,411,630.80
In its separate accounts consistent with the German Commercial Code (HGB), the retained profit of Deutsche Beteiligungs AG amounts to 92,276,031.02 euros (previous year: 43,259,096.88 euros). At the Annual Meeting, the Board of Management and the Supervisory Board will recommend paying a total dividend of 2.00 euros per share for financial year 2013/14, consisting of a base dividend of 0.40 euros per share and a surplus dividend of 1.60 euros per share.
In Germany, dividends paid to shareholding corporations are subject to a corporation tax rate of five percent plus a solidarity surcharge and, to the same extent, municipal trade tax, insofar as these do not relate to free-floating investments (i.e. interest of less than 15 percent). Dividends earned by natural persons
1 6 2 C O N S O L I D AT E D F I N A N C I A L S TAT E M E N T S

are subject to a flat rate withholding tax (“Abgeltungssteuer”) of 25 percent plus a solidarity surcharge and, if applicable, church tax, which the dividend-paying company pays directly to the taxation authority.
2 8 . M I N O R I T Y I N T E R ES T
T € 2013/14 2012/13
At start of financial year 10,146 12,086
Additions 46 312
Disposals 101 3,228
Profit share 323 976
At end of financial year 10,414 10,146
Minority interest relates to DBG Advisors Kommanditaktionär GmbH & Co. KG, DBAG Fund V Konzern GmbH & Co. KG, DBG Managing Partner GmbH & Co. KG, DBAG Expansion Capital Fund Konzern GmbH & Co. KG and DBAG Fund VI Konzern (Guernsey) L.P. For a commentary on minority interest, please refer to the information on DBAG funds in note 40.
Minority interest attributable to DBG Advisors Kommandit-aktionär GmbH & Co. KG (DBAG Fund IV) developed as follows:
T € 2013/14 2012/13
At start of financial year 9,929 11,602
Additions 0 0
Disposals 67 2,586
Profit share 87 913
At end of financial year 9,949 9,929
Minority interest attributable to DBAG Fund V Konzern GmbH & Co. KG (DBAG Fund V) developed as follows:
T € 2013/14 2012/13
At start of financial year 122 460
Additions 0 234
Disposals 33 642
Profit share 229 70
At end of financial year 318 122
Minority interest attributable to DBG Managing Partner GmbH & Co. KG (DBAG Fund V) developed as follows:
T € 2013/14 2012/13
At start of financial year 25 24
Additions 0 0
Disposals 0 0
Profit share 0 1
At end of financial year 25 25
Minority interest attributable to DBAG Expansion Capital Fund Konzern GmbH & Co. KG (DBAG Expansion Capital Fund) developed as follows:
T € 2013/14 2012/13
At start of financial year 69 0
Additions 46 77
Disposals 1 0
Profit share 7 (8)
At end of financial year 121 69
Minority interest attributable to DBAG Fund VI Konzern (Guernsey) L.P. (DBAG Fund VI) developed as follows:
T € 2013/14 2012/13
At start of financial year 1 0
Additions 0 1
Disposals 0 0
Profit share 0 0
At end of financial year 1 1
A N N U A L R E P O R T 2 0 1 3 / 1 4 1 6 3
FIN
AN
CIA
L S
TA
TE
ME
NT
S

2 9 . OT H ER P ROV I S I O N S
29.1 Current other provisions
T €1 Nov. 2013 Utilisations Reversals Additions
31 Oct. 2014
Personnel- related commitments 9,798 5,086 272 8,525 12,965
Financial assets 2,793 986 1,806 4,053 4,054
Other 1,498 1,256 154 1,360 1,448
14,089 7,328 2,232 13,938 18,467
Provisions for personnel-related commitments chiefly consist of performance-linked emoluments. These performance-linked emoluments contain components for the past financial year as well as components with long-term incentive effects. They pertain to members of the Board of Management and staff of Deutsche Beteiligungs AG. The performance-linked compensation scheme for staff largely corresponds to that of the members of the Board of Management. For information on the design of the individual elements of the compensation scheme, please refer to the commentary in the remuneration report, which is an integral part of the management report.
Provisions for financial assets are allocable to the investment business. These include representation and warranty commitments, transaction costs that incur on disposals of portfolio companies as well as reimbursable consultancy expenses.
“Other” contains provisions of T€ 762 (previous year: T€ 562) for tax consultancy and other external advisory services as well as T€ 336 (previous year: T€ 375) for the Annual Meeting in March 2015 and preparation of the current Annual Report.
29.2 Non-current other provisions
T €1 Nov. 2013 Utilisations Reversals Additions
31 Oct. 2014
Personnel-related commitments 218 47 0 25 196
Representations and warranties 0 0 0 39 39
218 47 0 64 235
Non-current personnel-related other provisions contain obligations arising from early retirement agreements.
Representations and warranties relate to commitments on the disinvestment of one portfolio company.
3 0 . P EN S I O N O B L I G AT I O N S A N D P L A N A S S E T S
The disclosure in the statement of financial position has been derived as follows:
T € 31 Oct. 2014 31 Oct. 2013
Present value of pension obligations 37,454 31,199
Fair value of plan assets (28,069) (28,028)
(Other non-current assets) 0 (248)
Provisions for pension obligations 9,385 3,419
The present value of pension obligations developed as follows:
T € 2013/14 2012/13
Present value of pension obligations at start of financial year 31,199 27,574
Interest expenses 917 788
Service cost 393 479
Benefits paid (967) (881)
Actuarial (gains)/losses 5,912 3,239
Present value of pension obligations at end of financial year 37,454 31,199
1 6 4 C O N S O L I D AT E D F I N A N C I A L S TAT E M E N T S

The present value of pension obligations is determined by means of an actuarial appraisal. The appraisal was based on the following actuarial assumptions:
31 Oct. 2014 31 Oct. 2013
Discount rate % 1.78 2.94
Salary trend rate (incl. career trend) % 2.50 2.50
Benefit trend rate % 2.00 2.00
Life expectancy based on modified actuarial charts by Dr Klaus Heubeck 2005 G 2005 G
Increase in income threshold for state pension plan % 2.00 2.00
The discount rate is based on the iBoxx corporate AA10+ index, which is determined by interest rates for high-quality long-term bonds.
The life expectancy assumptions are based on the 2005 G actuarial life tables by Dr Klaus Heubeck. They were modified as per 31 October 2013 to account for the particularities of the beneficiaries of the DBAG Group’s defined benefit plans and individual defined benefit commitments. A comparison with similar groups of individuals revealed an average longer life expectancy of three years for the DBAG scheme members and beneficiaries.
Plan assets developed as follows over the past financial year:
T € 2013/14 2012/13
Fair value of plan assets at start of financial year 28,028 27,999
Expected interest income 824 378
Actuarial gains/(losses) (783) (349)
Fair value of plan assets at end of financial year 28,069 28,028
The following amounts were recognised in consolidated net income:
T € 2013/14 2012/13
Service cost 393 479
Interest expenses 917 788
Expected interest income on plan assets (824) (378)
486 889
The net amount of interest expenses and expected interest income on plan assets is recognised in item “Interest expenses”.
“Gains/(losses) on remeasurements of the net defined benefit liability (asset)” recognised in other comprehensive income developed as follows in financial year 2013/14:
T € 2013/14 2012/13
Actuarial gains/(losses) at start of financial year (14,578) (10,990)
Gains/(losses) from difference between actual and expected returns on plan assets (783) (349)
Gains/(losses) from change in demographic assumptions 0 (2,967)
Gains/(losses) experience-related (5,912) (272)
Actuarial gains/(losses) at end of financial year (21,273) (14,578)
The greater loss of T€ -783 in financial year 2013/14 (previous year: T€ -349) results from the change in the accounting method in compliance with the amended rules of IAS 19 (see also note 3).
A N N U A L R E P O R T 2 0 1 3 / 1 4 1 6 5
FIN
AN
CIA
L S
TA
TE
ME
NT
S
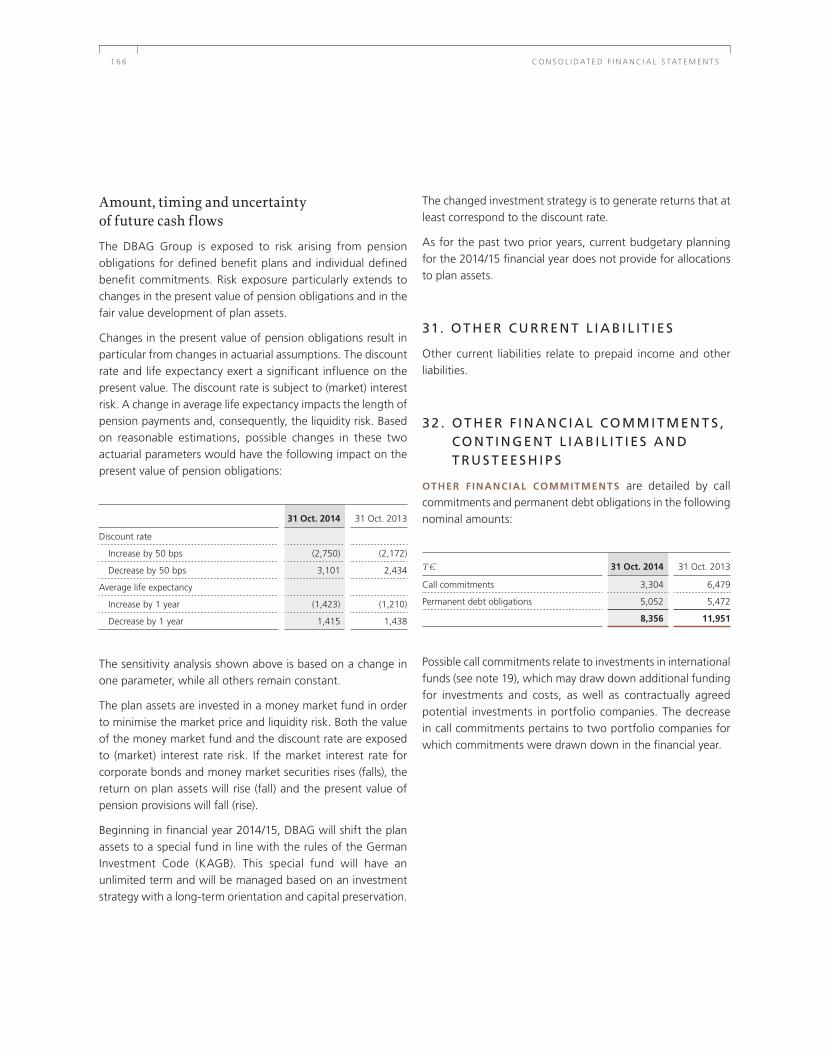
Amount, timing and uncertainty of future cash flows
The DBAG Group is exposed to risk arising from pension obligations for defined benefit plans and individual defined benefit commitments. Risk exposure particularly extends to changes in the present value of pension obligations and in the fair value development of plan assets.
Changes in the present value of pension obligations result in particular from changes in actuarial assumptions. The discount rate and life expectancy exert a significant influence on the present value. The discount rate is subject to (market) interest risk. A change in average life expectancy impacts the length of pension payments and, consequently, the liquidity risk. Based on reasonable estimations, possible changes in these two actuarial parameters would have the following impact on the present value of pension obligations:
31 Oct. 2014 31 Oct. 2013
Discount rate
Increase by 50 bps (2,750) (2,172)
Decrease by 50 bps 3,101 2,434
Average life expectancy
Increase by 1 year (1,423) (1,210)
Decrease by 1 year 1,415 1,438
The sensitivity analysis shown above is based on a change in one parameter, while all others remain constant.
The plan assets are invested in a money market fund in order to minimise the market price and liquidity risk. Both the value of the money market fund and the discount rate are exposed to (market) interest rate risk. If the market interest rate for corporate bonds and money market securities rises (falls), the return on plan assets will rise (fall) and the present value of pension provisions will fall (rise).
Beginning in financial year 2014/15, DBAG will shift the plan assets to a special fund in line with the rules of the German Investment Code (KAGB). This special fund will have an unlimited term and will be managed based on an investment strategy with a long-term orientation and capital preservation.
The changed investment strategy is to generate returns that at least correspond to the discount rate.
As for the past two prior years, current budgetary planning for the 2014/15 financial year does not provide for allocations to plan assets.
31. OT H ER C U R R EN T L I A B I L I T I ES
Other current liabilities relate to prepaid income and other liabilities.
32 . OT H ER F I N A N C I A L CO M M I T M EN T S , CO N T I N G EN T L I A B I L I T I ES A N D T RU S T EES H I P S
OTHER FINANCIAL COMMITMENTS are detailed by call commitments and permanent debt obligations in the following nominal amounts:
T € 31 Oct. 2014 31 Oct. 2013
Call commitments 3,304 6,479
Permanent debt obligations 5,052 5,472
8,356 11,951
Possible call commitments relate to investments in international funds (see note 19), which may draw down additional funding for investments and costs, as well as contractually agreed potential investments in portfolio companies. The decrease in call commitments pertains to two portfolio companies for which commitments were drawn down in the financial year.
1 6 6 C O N S O L I D AT E D F I N A N C I A L S TAT E M E N T S

The following provides an overview of the due dates of permanent debt obligations at 31 October 2014:
T € < 1 year 1–5 years > 5 years Total
Permanent debt obligations 846 2,951 1,255 5,052
thereof rental contracts 717 2,870 1,255 4,842
Permanent debt obligations pertain, in particular, to office rental for the premises on Börsenstrasse 1 in Frankfurt/Main. The non-terminable office rental contract began on 1 August 2011 and runs until 31 July 2021. Deutsche Beteiligungs AG is entitled to renew the rental contract twice for a period of five years each time.
As in the previous year, there were no CONTINGENT LIABI -
LITIES at 31 October 2014.
TRUST ASSETS totalled T€ 13,776 at 31 October 2014 (previous year: T€ 10,829). Of that amount, T€ 13,732 (previous year: T€ 10,753) are attributable to shares in two portfolio companies that are held by Group companies for two managed funds. Trust liabilities exist in an equivalent amount. DBAG does not achieve income from trustee activities.
N OT E S TO T H E CO N S O L I DAT ED S TAT EM EN T O F C A SH F LOW S
33 . G EN ER A L D I S C LO SU R ES O N T H E CO N S O L I DAT ED S TAT EM EN T O F C A S H FLOW S
The objective of consolidated statements of cash flows based on IAS 7 is to report on and create transparency in a group’s relevant flows of cash. Cashflows are differentiated according to operating activities as well as investing and financing activities. The indirect presentation method was applied for cash flows from operating activities. Cash flows from investment activities have been converted to the direct presentation method as of the reporting year.
Proceeds and payments relating to financial assets and to loans and receivables are recorded in cash flows from investing activities instead of in cash flows from operating activities, since this classification gives a truer representation, from our point of view.
Proceeds and payments arising from interest are presented in cash flows from operating activities.
There were no cash flows to be reported based on changes in the group of consolidated companies.
Cash funds at the beginning and end of the period existed in the form of cash deposits in banks. Cash funds of the proportionately consolidated Q.P.O.N. Beteiligungs GmbH amounted to T€ 13 (previous year: T€ 15).
Since financial year 2007/08, a part of the financial resources not needed in the near term has been invested in securities. The securities serve, as do cash and cash equivalents, to meet the Group’s payment obligations. According to IAS 7, these securities do not constitute financial resources, since their maturity has so far always been longer than three months from the date of acquisition. IAS 7.16 requires the purchase and sale of these securities to be recognised as cash flows from investing activities.
A N N U A L R E P O R T 2 0 1 3 / 1 4 1 6 7
FIN
AN
CIA
L S
TA
TE
ME
NT
S

OT H ER D I SCLOSU R E S
3 4 . F I N A N C I A L R I S K D I S C LO SU R ES
The DBAG Group is exposed to financial risks that arise from its investment activities in portfolio companies and from other financial instruments. The risk exposure attached to these financial instruments may reduce the value of assets and/or profits. There are no hedging relationships between financial instruments. Consequently, a basis for the application of hedge accounting does not exist.
The following describes the financial risks arising from financial instruments to which the DBAG Group is exposed in conformity with IFRS 7. The objectives and the methods used to manage these risks are also discussed. There has been no change com-pared with the previous year.
34.1 Market risk
The fair value of financial instruments or future cash flows of financial instruments may fluctuate due to changes in market prices. Based on IFRS 7, market risk comprises the components of currency risk, interest risk and other price risk. The Board of Management assesses these risks before taking investment decisions or before accessing other financial instruments. Exposure to market risk is regularly monitored in its entirety.
34.1.1 Currency risk
The DBAG Group’s exposure to currency risk relates to investments that are denominated in US dollars and in which future returns will be made in US dollars. Currency risk exposure arising from these investments concerns future proceeds from these portfolio companies and, consequently, also their fair value. Changes in exchange rates also have an influence on the operations and competitiveness of our portfolio companies in respect of their procurement and customer markets. The extent of that impact would depend in particular on the portfolio companies’ individual value creation structure and degree of internationalisation.
Currency risk management
Individual transactions denominated in foreign currency are not hedged, since both the holding periods of, and the proceeds from these investments are uncertain. The portfolio denominated in US dollars will decline with the receipt of returns from the remaining fund investments in this currency.
Extent of currency risk
Item “Financial assets” contains financial instruments amounting to T€ 19,449 (previous year: T€ 24,046) that are exposed to US dollar currency risk. The effects on income arising from exchange rate-related changes in the fair value of financial assets amounted to T€ 1,505 (previous year: T€ -1,172).
Exchange rate sensitivity
An increase/decrease in the euro/US dollar exchange rate by ten percent would result in an exchange rate-related decrease/increase in consolidated net income for the year and in the equity of the DBAG Group of T€ 1,945 (previous year: T€ 2,405).
34.1.2 Interest rate risk
Changes in market interest rates directly affect income from investments of financial resources and the valuations of our portfolio companies measured by the discounted cash flow method. Changes in market interest rates also have an influence on the profitability of portfolio companies.
Interest rate risk management
Financial resources are principally invested with a short-term horizon. Interest derivatives to hedge a certain interest rate level are not used, since the amount of financial resources is subject to strong fluctuations and not readily predictable.
Extent of interest rate risk
Financial resources (the sum of cash funds and interest-bearing securities) totalled T€ 150,653 (previous year: T€ 98,335). Interest income from the investment of these resources was T€ 153 (previous year: T€ 254).
1 6 8 C O N S O L I D AT E D F I N A N C I A L S TAT E M E N T S

Based on the capital structure of DBAG, no debt instruments (securities) exist that could constitute exposure to interest rate risk (see also note 36 Capital management).
Interest rate sensitivity
In relation to the portfolio companies valued by the discounted cash flow method, an increase/decrease of 100 basis points in the reference interest rate would result in a decrease/increase in consolidated net income for the year and in the equity of the DBAG Group of T€ 211 (previous year: T€ 260). For variable-interest securities total-ling T€ 35,026 at 31 October 2014, a change in the refer-ence interest rate of 100 basis points would have an effect of T€ 350 (previous year: T€ 731).
34.1.3 Other price risk
Exposure to other price risk primarily exists in future valu-ations of the DBAG Group’s portfolio companies. The portfolio companies are measured at fair value. Valuation changes are recognised directly in the consolidated statement of compre-hensive income. For details on the risk management system, we refer to the commentary in the combined management report in section “Opportunities and risks”.
Other price risk management
The Board of Management constantly monitors the market risk inherent in the portfolio investments. Towards that end, the DBAG Group receives reports on the portfolio companies’ course of business on a timely basis. Board of Management members or other members of the investment team hold offices on supervisory/advisory boards of portfolio companies. Additionally, the responsible investment team members monitor the progress of portfolio companies through formally implemented processes.
Extent of other price risk
Based on the measurement of financial assets at fair value through profit or loss, valuation movements in a period are directly recognised in the consolidated statement of comprehensive income. In financial year 2013/14, the net result of valuation was T€ 21,337 (previous year: T€ 29,107).
Other price risk sensitivity
The valuation of portfolio companies is influenced by a number of factors that relate to the financial markets on the one hand, and to the markets in which the portfolio companies operate on the other. These influential factors include valuation multiples, earnings and debt of the portfolio companies. The sensitivity to valuation is largely determined by the multiples used to measure the fair value of financial instruments categorised in level 3. A change in the multiples of +/- 0.1 would have an effect, ceteris paribus, of T€ 1,758 (previous year: T€ 1,204) on the fair value of level 3 financial instruments (see note 35.2).
34.2 Liquidity risk
There is currently no recognisable exposure to liquidity risk for the DBAG Group. Free cash funds amounted to T€ 38,318 (previous year: T€ 19,793). Together with general government securities or securities of issuers with highest ratings totalling T€ 112,335 (previous year: T€ 78,542), the DBAG Group has T€ 150,653 (previous year: T€ 98,335) at its disposal to fulfil its investment commitments to DBAG funds (see management report, page 86). This amount clearly exceeds total liabilities of T€ 43,701 (previous year: T€ 32,239). It is assumed that the securities are saleable at short notice, if necessary, and without any appreciable price loss, due to the issuers’ very good ratings and the short duration of the securities. Other current liabilities fall due within one year.
A N N U A L R E P O R T 2 0 1 3 / 1 4 1 6 9
FIN
AN
CIA
L S
TA
TE
ME
NT
S

34.3 Credit/default risk
Extent of credit/default risk
The following balance sheet items are basically exposed to a one-hundred percent credit/default risk:
T € 31 Oct. 2014 31 Oct. 2013
Financial assets 135,047 166,752
thereof hybrid instruments 0 0
thereof investments 135,047 166,752
Loans and receivables 25,947 14,110
Receivables 7,400 11,980
Securities 112,335 78,542
Cash and cash equivalents 38,318 19,793
Other financial instruments 2,245 2,401
Other current assets, if financial instruments 16,854 9,231
338,146 302,809
Credit/default risk management
Financial assets: Deutsche Beteiligungs AG addresses the risk of default through a comprehensive risk monitoring system, which is discussed in a review of individual risks in the combined management report.
Loans and receivables: Debtors are either current portfolio companies or parts of former portfolio companies. Deutsche Beteiligungs AG is kept informed regularly and promptly about
the course of business of debtor companies. If there is evidence that debtors may fail to meet obligations, debtors are asked to promptly propose and implement measures that will put them in a position to meet their obligations.
Receivables: See previous statement on loans and receivables.
Securities: This item contains German public sector bonds and mortgage bonds with a rating based on Moody’s or Standard and Poor’s of at least AA. Based on the issuers’ credit rating and Pfandbrief bonds, we assume that the credit risk to which these securities are exposed is small.
Cash and cash equivalents: Cash funds of Deutsche Beteiligungs AG are held in deposits with German banking institutions. To spread the risk, cash funds are generally disseminated over a number of banks. The deposits are integrated in the respective banks’ protection systems.
Other financial instruments: Other financial instruments of Deutsche Beteiligungs AG relate to shares that are to be sold to the managements of portfolio companies within one year.
Other current assets: Debtors are usually the DBAG funds of Deutsche Beteiligungs AG and managers of portfolio companies. Payment obligations by DBAG funds can be met by capital calls directed to their investors.
1 7 0 C O N S O L I D AT E D F I N A N C I A L S TAT E M E N T S

35 . F I N A N C I A L I N S T RU M EN T S
35.1 Categories of financial instruments
Financial instruments have been designated to the following categories:
VA L U AT I O N C AT E G O RY 1
T €Carrying amount
31 Oct. 2014Fair value
31 Oct. 2014Carrying amount
31 Oct. 2013Fair value
31 Oct. 2013
Financial assets at fair value through profit of loss
Financial instruments1 135,047 135,047 166,752 166,752
thereof hybrid instruments1 0 0 0 0
thereof equity instruments1 135,047 135,047 166,752 166,752
Other financial instruments1 2,245 2,245 2,401 2,401
137,292 137,292 169,153 169,153
Available-for-sale financial assets
Long-term securities 80,991 80,991 50,514 50,514
Short-term securities 31,344 31,344 28,028 28,028
112,335 112,335 78,542 78,542
Loans and receivables
Receivables 7,400 7,400 11,980 11,980
Loans and receivables 25,947 25,947 14,110 14,110
Cash and cash equivalents 38,318 38,318 19,793 19,793
Other current assets, if financial instruments2 16,854 16,854 9,231 9,231
88,519 88,519 55,114 55,114
Other financial liabilities
Minority interest 10,414 10,414 10,146 10,146
Other current liabilities 3 2,908 2,908 1,803 1,803
13,322 13,322 11,949 11,949
351,468 351,468 314,758 314,758
1 Designated as at fair value through profit or loss on initial recognition2 Does not include prepaid expenses, value-added tax and other totalling T€ 1,632 (previous year: T€ 2,217).3 Does not include prepaid income of T€ 0 (previous year: T€ 468) and value-added tax liabilities of T€ 0 (previous year: T€ 197).
A N N U A L R E P O R T 2 0 1 3 / 1 4 1 7 1
FIN
AN
CIA
L S
TA
TE
ME
NT
S

There were no impairments to financial assets designated as loans and receivables recognised in the reporting year, nor in the previous year.
Financial instruments in “loans and receivables”, “receivables” and “other current assets” chiefly relate to portfolio companies and DBAG funds. Due to close relationships to creditors, due dates are negotiated in individual instances and mutually agreed. Quantitative data on past due financial instruments is therefore not disclosed. These financial instruments are mostly not hedged.
Impairments are recognised when there is objective evidence that the obligor will not be able to meet his payment obligations in the future (see note 6). An assessment of obligors’ credit quality is derived from a regular exchange of information with the obligors.
35.2 Disclosures on hierarchy of financial instruments
All financial instruments are categorised according to the following levels, regardless of whether they are measured at fair value or not:
L E V E L 1 : Use of prices in active markets for identical assets or liabilities.
L E V E L 2 : Use of inputs that are observable, either directly (as prices) or indirectly (derived from prices).
L E V E L 3 : Use of inputs that are not materially based on observable market data (unobservable inputs). The materiality of these inputs is judged on the basis of their influence on fair value measurement.
1 7 2 C O N S O L I D AT E D F I N A N C I A L S TAT E M E N T S

35.2.1 Hierarchy of financial instruments measured at fair value on a recurring basis
I T E M I N S TAT E M E N T O F F I N A N C I A L P O S I T I O N
T €Fair value
31 Oct. 2014 Level 1 Level 2 Level 3
Financial assets at fair value through profit or loss
Financial assets 135,047 0 352 134,695
Other financial instruments 2,245 0 0 2,245
137,292 0 352 136,940
Available-for-sale financial assets
Long-term securities 80,991 0 80,991 0
Short-term securities 31,344 0 31,344 0
112,335 0 112,335 0
249,627 0 112,687 136,940
I T E M I N S TAT E M E N T O F F I N A N C I A L P O S I T I O N
T €Fair value
31 Oct. 2013 Level 1 Level 2 Level 3
Financial assets at fair value through profit or loss
Financial assets 166,752 56,039 0 110,713
Other financial instruments 2,401 0 0 2,401
169,153 56,039 0 113,114
Available-for-sale financial assets
Long-term securities 50,514 0 50,514 0
Short-term securities 28,028 0 28,028 0
78,542 0 78,542 0
247,695 56,039 78,542 113,114
Level 2 financial assets pertain to an investment which is measured at a purchase price indication in an illiquid market.
Level 2 securities relate to German public sector bonds as well as to securities of issuers with highest credit ratings, the liquidity of which is limited due to their trading in the secondary market.
For all financial instruments recognised in the statement of financial position at fair value in financial year 2013/14 and the preceding financial year, fair value measurement is recurring. Over that period of time, there were no assets or liabilities in the DBAG Group that were valued by non-recurring fair value measurement.
A N N U A L R E P O R T 2 0 1 3 / 1 4 1 7 3
FIN
AN
CIA
L S
TA
TE
ME
NT
S

Level 3 financial instruments are attributable to the following sectors:
I T E M I N S TAT E M E N T O F F I N A N C I A L P O S I T I O N
T €
Mechanical engineering/plant
construction Industrial servicesInternational fund
investments Other Total
Item in statement of financial position 31 Oct. 2014
Financial assets 69,617 25,132 8,300 31,646 134,695
Other financial instruments 1,908 337 0 0 2,245
71,525 25,469 8,300 31,646 136,940
Item in statement of financial position 31 Oct. 2013
Financial assets 58,764 19,942 10,359 21,648 110,713
Other financial instruments 1,476 925 0 0 2,401
60,240 20,867 10,359 21,648 113,114
Reconciliation of level 3 financial instruments in financial year 2013/14:
I T E M I N S TAT E M E N T O F F I N A N C I A L P O S I T I O N
T € 1 Nov. 2013 Additions Disposals Transfers
Gains/(losses) through profit
or loss 31 Oct. 2014
Financial assets
Mechanical engineering/plant construction 58,764 3,336 0 0 7,517 69,617
Industrial services 19,942 184 4,103 0 9,109 25,132
International fund investments 10,359 58 2,245 0 128 8,300
Other 21,648 6,927 3,748 (352) 7,171 31,646
110,713 10,505 10,096 (352) 23,925 134,695
Other financial instruments
Mechanical engineering/plant construction 1,476 1,050 745 0 127 1,908
Industrial services 925 0 465 0 (123) 337
2,401 1,050 1,210 0 4 2,245
113,114 11,555 11,306 (352) 23,929 136,940
The transfer dates between levels 1 to 3 correspond to the date of the event or of the change in circumstances that caused the transfer.
There were no transfers between level 1 and 2 in the reporting period. One investment was transferred from level 3 to level 2,
since its valuation at the measurement date had been based on a purchase price indication in an illiquid market.
Of the gains through profit or loss totalling T€ 23,929, T€ 23,925 were recognised in “Net result of valuation and disposal of financial assets” (thereof net result of disposal: T€ 2,588,
1 7 4 C O N S O L I D AT E D F I N A N C I A L S TAT E M E N T S

and net result of valuation: T€ 21,337 relating to financial instruments held at the end of the reporting period) and T€ 4 in “Other operating income”.
For level 3 financial instruments at fair value, the possible ranges for unobservable inputs are as follows:
I T E M I N S TAT E M E N T O F F I N A N C I A L P O S I T I O N
T €Fair value
31 Oct. 2014 Valuation method Unobservable inputs Range
Financial assets
Mechanical engineering/plant construction 69,617 Multiples methodAverage EBITDA/EBITA margin 5–12%
Net debt1 to EBITDA 1–4
Multiples discount 0–10%
Industrial services 25,132 Multiples methodAverage EBITDA/EBITA margin 4–11%
Net debt1 zu EBITDA 0–1
Multiples discount 0–15%
International fund investments 8,300 DCF n.a. n.a.
Other 31,646 Multiples methodAverage EBITDA/EBITA margin 5–22%
Net debt1 to EBITDA 0–3
Multiples discount 0
134,695
Other financial instruments
Mechanical engineering/plant construction 1,908 Multiples methodAverage EBITDA/EBITA margin 6–10%
Net debt1 to EBITDA 1–2
Multiples discount 0–10%
Industrial services 337 Multiples methodAverage EBITDA/EBITA margin n.a.
Net debt1 to EBITDA n.a.
Multiples discount n.a.
2,245
136,940
1 Net debt of portfolio company
A N N U A L R E P O R T 2 0 1 3 / 1 4 1 7 5
FIN
AN
CIA
L S
TA
TE
ME
NT
S

By reasonable estimate, changes in unobservable inputs would have the following effects on fair value measurement of level 3 financial assets:
I T E M I N S TAT E M E N T O F F I N A N C I A L P O S I T I O N
T €Fair value
31 Oct. 2014 Change in unobservable inputsChange in fair
value
Financial assets 1
Mechanical engineering and plant construction 69,617 EBITDA and EBITA +/- 10% 9,013
Net debt +/- 10% 2,867
Multiples discount +/- 5 percentage points 1,727
Industrial services 25,132 EBITDA and EBITA +/- 10% 2,556
Net debt +/- 10% 195
Multiples discount +/- 5 percentage points 1.415
International fund investments 8,300 n.a. n.a.
Other 31,646 EBITDA and EBITA +/- 10% 2,241
Net debt +/- 10% 765
Multiples discount +/- 5 percentage points n.a.
134,695
Other financial instruments
Mechanical engineering and plant construction 1,908 EBITDA and EBITA +/- 10% 211
Net debt +/- 10% 37
Multiples discount +/- 5 percentage points 40
Industrial services 337 EBITDA and EBITA +/- 10% 110
Net debt +/- 10% 18
Multiples discount +/- 5 percentage points 61
2,245
136,940
1 For financial assets acquired within the past 12 months, a change in the unobservable inputs has no effect on the fair value, since these are valued at their transaction price at the valuation date, in accordance with the IPEVG.
The difference between the unobservable inputs EBITDA and EBITA is depreciation on property, plant and equipment and intangible assets. The key factors influencing income have an effect on both unobservable inputs; consequently, there is an interrelationship between EBITDA and EBITA. For that reason, the change in fair value is shown together in the sensitivity
analysis for the two unobservable inputs, with all other inputs remaining constant.
The sensitivity analysis for net debt and multiples discount considers the effects of a change in one input, with all other inputs remaining constant.
1 7 6 C O N S O L I D AT E D F I N A N C I A L S TAT E M E N T S

35.2.2 Hierarchy of financial instruments measured at fair value on a non-recurring basis
I T E M I N S TAT E M E N T O F F I N A N C I A L P O S I T I O N
T €
Carrying amount
31 Oct. 2014Fair value
31 Oct. 2014 Level 1 Level 2 Level 3
Loans and receivables
Loans and receivables 25,947 25,947 0 25,947 0
Receivables 7,400 7,400 0 7,375 25
Cash and cash equivalents 38,318 38,318 38,318 0 0
Other current assets, if financial instruments 1 16,854 16,854 1,879 573 14,402
88,519 88,519 40,197 33,895 14,427
Other financial liabilities
Minority interest 10,414 10,414 0 0 10,414
Other current liabilities ² 2,908 2,908 0 0 2,908
13,322 13,322 0 0 13,322
I T E M I N S TAT E M E N T O F F I N A N C I A L P O S I T I O N
T €
Carrying amount
31 Oct. 2013Fair value
31 Oct. 2013 Level 1 Level 2 Level 3
Loans and receivables
Loans and receivables 14,110 14,110 0 14,110 0
Receivables 11,980 11,980 0 11,917 63
Cash and cash equivalents 19,793 19,793 19,793 0 0
Other current assets, if financial instruments 1 9,231 9,231 449 1,001 7,781
55,114 55,114 20,242 27,028 7,844
Other financial liabilities
Minority interest 10,146 10,146 0 0 10,146
Other current liabilities ² 1,803 1,803 0 0 1,803
11,949 11,949 0 0 11,949
1 Without prepaid expenses, value-added tax and others in the amount of T€ 1,632 (previous year: T€ 2,217)2 Without deferred income of T€ 0 (previous year: T€ 468) and value-added tax liabilities of T€ 0 (previous year: T€ 197)
Due to the short-term (residual) maturities of most financial instruments, there are no differences between the carrying value and fair value of financial instruments recognised in the statement of financial position categorised by non-recurring fair value measurements.
A N N U A L R E P O R T 2 0 1 3 / 1 4 1 7 7
FIN
AN
CIA
L S
TA
TE
ME
NT
S

35.3 Net gains/losses on financial instruments recognised at fair value in the statement of financial position
Net gains and losses on financial instruments at fair value recognised in the statement of financial position comprise fair value movements through profit or loss, realised gains or losses on disposal of financial instruments, impairment losses, reversals through profit or loss and currency rate changes.
Contained in the consolidated statement of comprehensive income are the following net gains/losses on financial instruments recognised at fair value in the statement of financial position:
N E T G A I N S / ( L O S S E S ) O N F I N A N C I A L A S S E T S AT FA I R VA L U E T H R O U G H P R O F I T O R L O S S
T € 2013/14 Level 1 Level 2 Level 3 2012/13 Level 1 Level 2 Level 3
Net result of investment activity
Net result of disposal 27,164 24,576 0 2,588 5,382 5,028 0 354
Net result of valuation 21,337 0 352 20,985 29,107 23,596 0 5,511
Net result of valuation and disposal of financial assets and loans and receivables 48,501 24,576 352 23,573 34,489 28,624 0 5,865
Current income from financial assets and loans and receivables 2,630 1,103 0 1,527 6,360 788 0 5,572
51,131 25,679 352 24,968 40,849 29,412 0 11,437
Other income/expenses
Other operating income 4 0 0 4 177 110 0 67
Other operating expenses (22) 0 0 (22) (148) 0 0 (148)
(18) 0 0 (18) 29 110 0 (81)
N E T G A I N S / ( L O S S E S ) O N AVA I L A B L E - F O R - S A L E F I N A N C I A L A S S E T S
T € 2013/14 Level 1 Level 2 Level 3 2012/13 Level 1 Level 2 Level 3
Other income/expenses
Other operating income 0 0 0 0 28 0 28 0
Other operating expenses (26) 0 (26) 0 0 0 0 0
(26) 0 (26) 0 28 0 28 0
Net result of valuation and disposal
Unrealised gains/(losses) on available-for-sale securities 306 0 306 0 (86) 0 (86) 0
thereof transfers from other comprehensive income to profit or loss 43 0 43 0 (30) 0 (30) 0
263 0 263 0 (56) 0 (56) 0
Interest income 153 0 153 0 248 0 248 0
1 7 8 C O N S O L I D AT E D F I N A N C I A L S TAT E M E N T S

Net gains and losses on financial assets at fair value through profit or loss result in their full amount from financial assets that were designated as at fair value through profit or loss on initial recognition.
The net result of liabilities to minority interest is disclosed in line item “Minority interest (gains)/losses” in the consolidated state-ment of comprehensive income. The net result derives from minority interest measured at fair value in fully consolidated entities. It amounts to T€ -323 for the reporting year (previous year: T€ -976).
35.4 Net gains/losses on financial instruments recognised at amortised cost in the statement of financial position
Net gains and losses on financial instruments recognised at amortised cost in the statement of financial position largely comprise fee income from fund management and advisory services, consultancy expenses and reimbursable costs as well as interest.
T € 2013/14 Level 1 Level 2 Level 3 2012/13 Level 1 Level 2 Level 3
Net result of fund services and investment activity
Current income from financial assets and loans and receivables 1,595 0 1,595 0 159 0 159 0
Fee income from fund management and advisory services 21,736 0 0 21,736 18,889 0 0 18,889
23,331 0 1,595 21,736 19,048 0 159 18,889
Other income/(expenses)
Other operating income 7,609 0 0 7,609 4,128 0 0 4,128
Other operating expenses (10,949) 0 0 (10,949) (7,075) 0 0 (7,075)
Net interest 185 0 185 0 258 0 258 0
(3,155) 0 185 (3,340) (2,689) 0 258 (2,947)
A N N U A L R E P O R T 2 0 1 3 / 1 4 1 7 9
FIN
AN
CIA
L S
TA
TE
ME
NT
S

3 6 . C A P I TA L M A N AG EM EN T
The objective of DBAG’s capital management is to ensure the Group’s long-term capital requirement and augment the net asset value per share by a rate that at least exceeds the cost of equity on a long-term average.
For longer planning horizons, the amount of equity is managed by dividend distributions and share repurchases and, if appropriate, capital increases.
Overall, the capital of DBAG is composed of the following:
T € 31 Oct. 2014 31 Oct. 2013
Liabilities
Minority interest 10,414 10,146
Provisions 30,319 19,564
Other liabilities 2,968 2,529
43,701 32,239
Equity
Subscribed capital 48,533 48,533
Reserves 136,778 143,167
Consolidated retained profit 118,077 86,713
303,388 278,413
Equity (% of total capital) 87.41 89.60
In addition to the capital requirement as stipulated by the German Stock Corporation Act, Deutsche Beteiligungs AG is subject to capital restrictions under the German Special Investment Company Act (Gesetz über Unter nehmens-beteiligungsgesellschaften – UBGG). To maintain the status of a special investment company, Deutsche Beteiligungs AG must have a paid-in capital contribution of T€ 1,000 to its capital stock. This amount was fully paid in, both in the reporting year and the preceding year.
37. E A R N I N G S P ER S H A R E BA S ED O N I A S 33
2013/14 2012/13
Consolidated net income for the year T€ 47,776 32,294
Shares issued at reporting date 13,676,359 13,676,359
Shares outstanding at reporting date 13,676,359 13,676,359
Weighted average number of shares 13,676,359 13,676,359
Basic and diluted earnings per share € 3.49 2.36
Basic earnings per share are computed by dividing the consolidated net income for the year attributable to Deutsche Beteiligungs AG by the weighted average number of shares outstanding during the reporting year.
So-called potential shares can dilute earnings per share within the scope of stock option programmes. Deutsche Beteiligungs AG does not have a stock option programme. There were no stock options outstanding at the reporting date. Diluted earn-ings were therefore equal to basic earnings.
3 8 . S EG M EN T R EP O R T I N G
The business policy of Deutsche Beteiligungs AG is geared to augmenting the value of DBAG over the long term through successful investments in portfolio companies in conjunction with sustainable income from management and advisory services to funds. The investments are always entered into alongside DBAG funds, either as majority investments by way of management buyouts (MBOs) or minority investments aimed at financing growth.
The Company’s value is largely determined by the market value of its investments, as reflected in the IFRS-based consolidated equity and in the income contribution rendered by the fund management and advisory business. The key performance measure by which the Company is governed and controlled is the return on net asset value.
The complete Board of Management (as the “chief operating decision maker” in terms of the IFRS) keeps itself regularly informed at an overall portfolio level about the portfolio’s
1 8 0 C O N S O L I D AT E D F I N A N C I A L S TAT E M E N T S

performance and the performance contributions of individual portfolio companies. The Board of Management takes decisions on the allocation of resources based on the overall portfolio or makes performance assessments on that basis.
Consequently, accounting-related information was only available at the reporting date for the Company as a whole. Expenditures, in particular, have until now not been allocated to specific parts of business operations, neither to types of investments (MBO or minority investments), nor to whether resources are invested from the Company’s own balance sheet or whether DBAG funds are managed or advised.
Consequently, the Deutsche Beteiligungs AG Group has been operating as a one-segment company. For an assessment of the financial effects of the business operations performed in this segment, we refer to the consolidated financial statements as a whole. Additional details on the economic environment in which Deutsche Beteiligungs AG and/or the Group operates are contained in the combined management report.
At the beginning of the new financial year, the Board of Management jointly decided to extend the internal reporting in order to separately control the two described business areas of DBAG in the future. Additionally, the operating income will then be disclosed for each business area. Beginning with the first quarter of financial year 2014/15, the business segments of direct investments as well as fund management and advisory services will be presented as reportable segments.
Products and services
DBAG invests as a co-investor in companies alongside DBAG funds by way of majority takeovers or minority investments. We basically structure majority takeovers as so-called management buyouts (MBOs). Expansion capital financings are made by way of a minority investment, for example, via a capital increase. Within the scope of its investment activity, DBAG achieved a net result of valuation and disposal as well as current income from financial assets totalling T€ 54,505 (previous year: T€ 41,008). Fee income for management and advisory services to funds amounted to T€ 21,736 in the reporting year (previous year: T€ 18,889).
Geographical activities and sector focus
Geographically, we concentrate our investments primarily on companies domiciled in German-speaking regions. Of the net result of valuation and disposal as well as current income from financial assets and loans and receivables, T€ 53,731 are attributable to companies domiciled in German-speaking regions and T€ 774 to companies located in the rest of the world.
DBAG prefers to invest in companies operating in mechanical engineering and plant construction and industrial services, but also invests in other sectors. The net result of valuation and disposal as well as current income from financial assets and loans and receivables are distributed over these sectors as follows:
T € 2013/14 2012/13
Mechanical engineering and plant construction 34,821 31,041
Industrial services 9,448 3,775
Other 10,236 6,192
54,505 41,008
Significant customers
DBAG’s customers are the investors in DBAG funds. The funds raised by DBAG bundle the assets committed by German and international organisations, especially by pension funds, funds of funds, banks, foundations, insurance companies or family offices.
DBAG generates its fee income from investors of whom none account for more than ten percent of total income.
3 9 . D EC L A R AT I O N O F CO N F O R M I T Y P U R SUA N T TO § 161 G ER M A N S TO C K CO R P O R AT I O N AC T ( A K TG)
A “Declaration of Conformity” pursuant to § 161 of the German Stock Corporation Act (Aktiengesetz – AktG) was submitted by the Board of Management and the Supervisory Board of Deutsche Beteiligungs AG and is permanently accessible to shareholders at the Company’s website.
A N N U A L R E P O R T 2 0 1 3 / 1 4 1 8 1
FIN
AN
CIA
L S
TA
TE
ME
NT
S

4 0 . I N F O R M AT I O N BA S E D O N I A S 24
Remuneration based on employment or service contracts for key management staff
Key management personnel in terms of IAS 24 are the members of the Board of Management and senior executives of Deutsche Beteiligungs AG. The basic principles of the remuneration system and the total remuneration paid to the members of the Board of Management, former Board of Management members and the members of the Supervisory Board are presented in the remuneration report. The remuneration report is an integral part of the combined management report. Personalised information in conformity with § 314 (1) no. 6 of the German Commercial Code (Handelsgesetzbuch – HGB) is also disclosed there.
Total payments to key management personnel consist of cash and non-cash remuneration. Total cash payments amounted to T€ 8,866 in the reporting year (previous year: T€ 8,322). Non-cash remuneration primarily consists of the amounts recognised in accordance with the tax basis for the use of company cars.
In the reporting year, a total of T€ 472 was allocated to pension provisions (previous year: T€ 726) as defined by the IFRS for key management staff (service cost and interest cost), thereof service cost: T€ 380 (previous year: T€ 419). Defined benefit obligations for key management staff amounted to T€ 6,710 (previous year: T€ 5,167) at the reporting date.
Loans in the amount of T€ 200 (previous year: T€ 0) were granted to key management staff. No loans or advances were granted to members of the Supervisory Board. The DBAG Group has not entered into any guarantees for members of the Board of Management or the Supervisory Board.
No member of the Supervisory Board or the Board of Management holds shares, share options or other derivatives representing one percent or more of the subscribed capital.
For financial year 2013/14, the members of the Supervisory Board received fixed fees and bonuses totalling T€ 388 (previous year: T€ 233).
Regarding transactions and balances of key management personnel in their capacity as minority partners in consolidated companies, please refer to note 28.
Participation in carried interest schemes by key management staff
Key management personnel have committed to invest in the DBAG Fund IV, DBAG Fund V, DBAG Fund VI and DBAG Expansion Capital Fund. For those participating, this can result in a superior profit share, if superior results are realised from the investments in a specified investment period. The profit shares are only paid if the Deutsche Beteiligungs AG Group and the investors in the respective DBAG fund have realised their invested capital plus a minimum return. This minimum return amounts to 8.0 percent annually for DBAG Fund IV, DBAG Fund V, DBAG Expansion Capital Fund and DBAG Fund VI. The structure of the profit share, its implementation and performance conditions are in conformity with common practice in the private equity industry and constitute a prerequisite for the placement of DBAG funds. For the individuals participating, their partnership status constitutes a privately carried investment risk and is aimed at promoting the staff’s initiative and dedication to the success of the investment.
DBAG Fund IV
DBAG Fund IV consists of the following fund companies that jointly acquire investments at a fixed ratio:
Fund company Qualification
Investment share held by
investment team (%)
Max. profit share
(%)
DBAG Fund IV GmbH & Co. KG Related party 1 20.8
DBAG Fund IV Inter-national GmbH & Co. KG Related party 1 20.8
DBG Fifth Equity Team GmbH & Co. KGaA Related party 0.67 approx. 30
DBG Fourth Equity Team GmbH & Co. KGaA Group company 0 0
For DBAG Fund IV, a group of key management personnel and former key management personnel have invested their own money at a fixed ratio in the companies listed above.
1 8 2 C O N S O L I D AT E D F I N A N C I A L S TAT E M E N T S

DBG Advisors IV GmbH & Co. KG, which is a related party and not included in the consolidated accounts of DBAG, acts as an intermediary for investments in the first two fund companies named above. Key management personnel are invested directly in DBG Advisors IV GmbH & Co. KG, or indirectly through DBG Investment Team GmbH & Co. KG.
Interests in DBG Fifth Equity Team GmbH & Co. KGaA are held indirectly through DBG Advisors Kommanditaktionär GmbH & Co. KG. Interests in DBG Advisors Kommanditaktionär GmbH & Co. KG are recognised in minority interest, since
DBG Advisors Kommanditaktionär GmbH & Co. KG is consolidated despite a minority interest because DBAG indirectly has the power to appoint or remove the majority of the members of the executive body. Key management personnel have not yet provided capital contributions amounting to T€ 69 (previous year: T€ 69) in DBG Advisors Kommanditaktionär GmbH & Co. KG.
Apart from that, no outstanding balances exist between DBG Advisors Kommanditaktionär GmbH & Co. KG and related parties.
OVERVIEW INVESTMENT STRUCTURE OF DBAG FUND IV
The percentages relate to the equity share
German investors as limited partners
DBAG Fund IV GmbH & Co. KG 2
Investments / Portfolio companies
DBG Investment Team GmbH & Co. KG / DBG Advisors IV
GmbH & Co. KG 1
DBG Advisors Kommanditaktionär
GmbH & Co. KG
DBG Fourth Equity Team GmbH & Co.
KGaA 4
Deutsche Beteiligungs gesellschaft
mbH
DBG Fifth Equity Team GmbH & Co. KGaA 2
International investors as limited partners
DBAG Fund IV International
GmbH & Co. KG 3
Deutsche Beteiligungs AG
33.33%
100%
66.67%
99% 99%
100%
99%
1%1% 1%
1 Investment vehicle for Board of Management and senior executives2 Investment vehicle for German investors
3 Investment vehicle for international investors4 Investment vehicle for Deutsche Beteiligungs AG
Consolidated company
A N N U A L R E P O R T 2 0 1 3 / 1 4 1 8 3
FIN
AN
CIA
L S
TA
TE
ME
NT
S

The key management personnel involved as well as former key management personnel have neither made investments in financial year 2013/14, nor did they receive repayments. In the preceding year, key management personnel made the following investments or had the following repayments from investment activity attributable to them:
Investments in the periodAggregate investment
at reporting date Repayments in the period
T €Management
BoardSenior
executivesManagement
BoardSenior
executives Management
BoardSenior
executives
Period from 1 Nov. 2013 to 31 Oct. 2014
DBG Advisors IV GmbH & Co. KG 0 0 430 0 0 0
DBG Advisors Kommanditaktionär GmbH & Co. KG 0 0 84 0 0 0
DBG Investment Team GmbH & Co. KG 0 0 325 740 0 0
Total 2013/14 0 0 839 740 0 0
Period from 1 Nov. 2012 to 31 Oct. 2013
DBG Advisors IV GmbH & Co. KG 6 0 430 0 2,940 0
DBG Advisors Kommanditaktionär GmbH & Co. KG 0 0 84 0 502 0
DBG Investment Team GmbH & Co. KG 5 10 325 740 2,237 4,792
Total 2012/13 11 10 839 740 5,679 4,792
DBAG Fund V
DBAG Fund V consists of the following fund companies that jointly acquire investments at a fixed ratio:
Fund company Qualification
Investment share held by
investment team (%)
Max. profit share of
investment team (%)
DBAG Fund V GmbH & Co. KG Related party 1 20.8
DBAG Fund V International GmbH & Co. KG Related party 1 20.8
DBAG Fund V Co-Investor GmbH & Co. KG Related party 1 approx. 45
DBAG Fund V Konzern GmbH & Co. KG Group company 1 20.8
For DBAG Fund V, a group of key management personnel as well as individual former key management personnel and other members of the investment team have invested their own money at a fixed ratio in all of the four fund companies listed above. The interests in DBAG Fund V GmbH & Co. KG and DBAG Fund V International GmbH & Co. KG are transacted through the investing general partner of these fund companies, DBG Advisors V GmbH & Co. KG, which is a related party to DBAG. DBG Advisors V GmbH & Co. KG acts as the sole limited partner of DBAG Fund V Co-Investor GmbH & Co. KG. DBG Advisors V GmbH & Co. KG is the sole general partner of DBAG Fund V Konzern GmbH & Co. KG.
The key management personnel involved as well as former key management personnel have made the following investments or have the following repayments from investment activity attributable to them:
1 8 4 C O N S O L I D AT E D F I N A N C I A L S TAT E M E N T S

OVERVIEW INVESTMENT STRUCTURE OF DBAG FUND V
The percentages relate to the equity share
German investors as limited partners
DBAG Fund V GmbH & Co. KG 2
Investments / Portfolio companies
DBG Advisors V GmbH & Co. KG 1
DBAG Fund V Konzern GmbH & Co. KG 4
Deutsche Beteiligungs AG
DBAG Fund V Co-Investor
GmbH & Co. KG 2
International investors as limited partners
DBAG Fund V International GmbH &
Co. KG 3
99% 99% 99%100%
1% 1% 1%
1 Investment vehicle for Board of Management and senior executives2 Investment vehicle for German investors
3 Investment vehicle for international investors4 Investment vehicle for Deutsche Beteiligungs AG
Consolidated company
Investments in the periodAggregate investment
at reporting date Repayments in the period
T €Management
BoardSenior
executivesManagement
BoardSenior
executives Management
BoardSenior
executives
Period from 1 Nov. 2013 to 31 Oct. 2014
DBG Advisors V GmbH & Co. KG 139 98 3,228 2,399 766 423
Period from 1 Nov. 2012 to 31 Oct. 2013
DBG Advisors V GmbH & Co. KG 731 507 3,089 2,301 1,357 719
A N N U A L R E P O R T 2 0 1 3 / 1 4 1 8 5
FIN
AN
CIA
L S
TA
TE
ME
NT
S

DBAG Expansion Capital Fund
DBAG Expansion Capital Fund consists of the following fund companies that jointly acquire investments at a fixed ratio:
Fund company Qualification
Investment share held by
investment team (%)
Max. profit share of
investment team (%)
DBAG Expansion Capital Fund GmbH & Co. KG Related party 1 20.8
DBAG Expansion Capital Fund International GmbH & Co. KG Related party 1 20.8
DBAG Expansion Capital Fund Konzern GmbH & Co. KG Group company 1 20.8
For the DBAG Expansion Capital Fund, a group of key management personnel as well as individual former key management personnel and other members of the investment team have invested their own money at a fixed ratio in all of the three fund companies listed above. The interests in DBAG Expansion Capital Fund GmbH & Co. KG and DBAG Expansion Capital Fund International GmbH & Co. KG are transacted through the investing general partner of these fund companies, DBG Advisors Expansion GmbH & Co. KG, which is a related party to DBAG. DBG Advisors Expansion GmbH & Co. KG is the sole general partner of DBAG Expansion Capital Fund Konzern GmbH & Co. KG.
OVERVIEW INVESTMENT STRUCTURE OF DBAG EXPANSION CAPITAL FUND
The percentages relate to the equity share
1 Investment vehicle for Board of Management and senior executives2 Investment vehicle for German investors
3 Investment vehicle for international investors4 Investment vehicle for Deutsche Beteiligungs AG
Consolidated company
German investors as limited partners
DBAG Expansion Capital FundGmbH & Co. KG 2
Investments / Portfolio companies
DBG Advisors Expansion
GmbH & Co. KG 1
DBAG Expansion Capital FundKonzern GmbH & Co. KG 4
International investors as limited
DBAG Expansion Capital FundInternational GmbH & Co. KG 3
99% 99% 99%
1% 1% 1%
Deutsche Beteiligungs AG
1 8 6 C O N S O L I D AT E D F I N A N C I A L S TAT E M E N T S

The key management personnel involved as well as former key management personnel have made the following investments or have the following repayments from investment activity attributable to them:
Investments in the periodAggregate investment at
reporting date Repayments in the period
T €Management
BoardSenior
executives Management
BoardSenior
executives Management
BoardSenior
executives
Period from 1 Nov. 2013 to 31 Oct. 2014
DBG Advisors Expansion GmbH & Co. KG (190) 273 62 273 0 0
Period from 1 Nov. 2012 to 31 Oct. 2013
DBG Advisors Expansion GmbH & Co. KG 252 0 252 0 0 0
The negative investments in the reporting year by Board of Management members result from a change in the partnership structure of DBG Advisors Expansion GmbH & Co. KG. Within the scope of this change, capital contributions so far held by current and former members of the Board of Management were sold at face value to senior executives and other members of the investment team. These negative amounts contain investments in the reporting year by Board of Management members of T€ 26 (previous year: T€ 252).
DBAG Fund VI
DBAG Fund VI consists of the following fund companies that make co-investments at a fixed ratio:
Fund company Qualification
Investment share held by
investment team 1 (%)
Max. profit share of
investment team
DBAG Fund VI (Guernsey) L.P. Related party 0.01 20.0
DBAG Fund VI Konzern (Guernsey) L.P. Group company 0.01 20.0
1 Without proportional direct investment by DBAG Advisors VI GmbH & Co. KG in investments of DBAG Fund VI of 1.25 percent
For DBAG Fund VI (consisting of DBAG Fund VI (Guernsey) L.P. and DBAG Fund VI Konzern (Guernsey) L.P.) through DBG Advisors VI GmbH & Co. KG, a group of key management personnel and individual former key management personnel as well as other members of the investment team are entitled to 20 percent of the profits of DBAG Fund VI, payable upon achieving a full repayment to German and international investors (limited partners). The full repayment is considered achieved when the limited partners of DBAG Fund VI receive cash or non-cash distributions in the amount of their paid-in capital in addition to a preferred return.
DBG Advisors VI GmbH & Co. KG is a related party to DBAG and serves the investment team as an investment vehicle. Supplemental to the 20-percent share of profits (after full repayment) of DBAG Fund VI, DBG Advisors VI GmbH & Co. KG makes a proportional direct investment in the investees of 1.25 percent. DBAG Fund VI Konzern (Guernsey) L.P. was a Group company of DBAG at the reporting date.
A N N U A L R E P O R T 2 0 1 3 / 1 4 1 8 7
FIN
AN
CIA
L S
TA
TE
ME
NT
S

OVERVIEW INVESTMENT STRUCTURE OF DBAG FUND VI
The percentages relate to the equity share
German and international investors as limited partners
DBG Advisors VI GmbH & Co. KG 1 Deutsche Beteiligungs AG
Investments / Portfolio companies
DBAG Fund VI (Guernsey) L.P. 2
DBAG Fund VI Konzern (Guernsey) L.P. 3
99.99% 99.99%
1.25%0.01% 0.01%
1 Investment vehicle for Board of Management and senior executives 2 Investment vehicle for investors
Consolidated company3 Investment vehicle for Deutsche Beteiligungs AG
The key management personnel involved as well as former key management personnel have made the following investments or have the following repayments from investment activity attributable to them:
Investments in the periodAggregate investment
at reporting date Repayments in the period
T €Management
BoardSenior
executives Management
BoardSenior
executives Management
BoardSenior
executives
Period from 1 Nov. 2013 to 31 Oct. 2014
DBG Advisors VI GmbH & Co. KG (735) 764 530 764 1 0
Period from 1 Nov. 2012 to 31 Oct. 2013
DBG Advisors VI GmbH & Co. KG 1,265 0 1,265 0 0 0
1 8 8 C O N S O L I D AT E D F I N A N C I A L S TAT E M E N T S

The negative investments in the reporting year result in part from a change in the partnership structure of DBG Advisors VI GmbH & Co. KG. Within the scope of this change, capital contributions so far held by current members of the Board of Management were sold at face value to senior executives and other members of the investment team. The negative invest-ments also result from repayment of a bridge-over loan granted within the scope of an investment transaction. These negative amounts contain investments in the reporting year by Board of Management members of T€ 290 (previous year: T€ 1,265).
Other related parties
DBAG manages or advises the following funds, alongside of which DBAG co-invests:
Funds Status
DBG Fonds I End of investment period on 31 Dec. 1997
DBG Fonds III End of investment period on 31 Oct. 2001
DBAG Fund IV End of investment period on 15 Feb. 2007
DBAG Fund V End of investment period on 15 Feb. 2013
DBAG Expansion Capital Fund Start of investment period on 27 Jan. 2011
DBAG Fund IV Start of investment period on 16 Feb. 2013
DBAG earned the following fee income for management ser-vices to the DBG Fonds and the DBAG Funds IV, V and ECF as well as for advisory services to DBAG Fund VI (see also note 11):
T € 2013/14 2012/13
DBG Fonds I 1,831 696
DBG Fonds III 20 20
DBAG Fund IV 418 614
DBAG Fund V 5,041 5,892
DBAG Expansion Capital Fund 862 2,070
DBAG Fund VI 13,536 9,568
Other 28 29
21,736 18,889
DBG Fonds I consists of the fund management company Deutsche Beteiligungsgesellschaft mbH & Co. Fonds I KG. DBG Fonds III comprises the fund management company Deutsche Beteiligungsgesellschaft Fonds III GmbH. DBAG Fund IV, DBAG Fund V and DBAG Expansion Capital Fund (ECF) consist of several entities that are shown in the overviews of fund structures.
DBG Fonds I, DBG Fonds III and DBAG Fund IV are directly managed by subsidiaries of DBAG.
The fund companies DBAG Fund V GmbH & Co. KG and DBAG Fund V International GmbH & Co. KG (DBAG Fund V) are man-aged by the managing general partner, DBG Managing Partner GmbH & Co. KG, a DBAG subsidiary. DBAG Fund V Co-Investor GmbH & Co. KG is managed through Group company DBG Management GmbH & Co. KG.
The fund companies DBAG Expansion Capital Fund GmbH & Co. KG and DBAG Expansion Capital Fund International GmbH & Co. KG are also managed by the managing general partner, DBG Managing Partner GmbH & Co. KG.
Deutsche Beteiligungs AG is the managing limited partner of DBG Managing Partner GmbH & Co. KG. Deutsche Beteiligungs AG itself holds a 20 percent interest in this company, and Mr Grede and Dr Scheffels each hold a 40-percent interest. Deutsche Beteiligungs AG receives 80 percent of this company’s profits for the management of the company as a profit priority share. After deducting the liability charges of the general partner and expenses for interest paid on balances in shareholders’ accounts, Deutsche Beteiligungs AG is also entitled to the company’s residual profits. The general partner of DBG Managing Partner GmbH & Co. KG can terminate the management agreement with DBAG at three months’ notice to the end of a quarter. In this case, Deutsche Beteiligungs AG would also be entitled to the total residual profits of DBG Managing Partner GmbH & Co. KG, after deducting the general partner’s liability charges, expenses for interest paid on balances in shareholders’ accounts and, if appropriate, expenses for setting up own operations for the management of DBAG funds. Expenses for setting up own business operations would incur if management services were no longer rendered by Deutsche Beteiligungs AG and were performed by DBG Managing Partner GmbH & Co. KG itself.
A N N U A L R E P O R T 2 0 1 3 / 1 4 1 8 9
FIN
AN
CIA
L S
TA
TE
ME
NT
S

The interests in the general partner of DBG Managing Partner GmbH & Co. KG are held by DBG Managing Partner GmbH & Co. KG itself; the principals of the general partner of DBG Managing Partner GmbH & Co. KG are Mr Grede and Dr Scheffels. Deutsche Beteiligungs AG is entitled to annual income for the management services described above for several of the DBAG Fund V and DBAG Expansion Capital Fund companies. For DBAG Fund V, this income, pursuant to the partnership agreement, amounts to 2.0 percent of the historical cost of the fund companies’ investments after the investment period has ended. For the DBAG Expansion Capital Fund, this income amounts to 1.75 percent of the capital commitments of 142 million euros, or 1.75 percent of the historical cost of the fund companies’ investments after the investment period has ended.
The fund company DBAG Fund VI (Guernsey) L.P. is managed by the managing partner DBG Fund VI GP (Guernsey) L.P. DBG Managing Partner GmbH & Co. KG advises the management company of fund manager DBAG Fund VI (Guernsey) L.P. Fee income from advisory services to DBAG Fund VI is based on a share of the profits of the management company, DBG Fund VI GP (Guernsey) L.P. For the management company and/or the fund manager of DBAG Fund VI, the income amounts to 2.0 percent of the capital commitments of 700 million euros, or 2.0 percent of the historical cost for the fund’s investments after the investment period has ended.
Concurrently, DBAG pays a fee through DBAG Fund VI Konzern (Guernsey) L.P. for the management of its co-investment. The advisory fee corresponds to 2.0 percent of the capital commit-ments totalling 133 million euros of DBAG Fund VI Konzern (Guernsey) L.P. as the co-investment vehicle of DBAG, or 2.0 percent of the historical cost for the fund’s investments after the investment period has ended.
A requirement for raising the fund commitments was that Mr Grede and Dr Scheffels would be available for the management of the fund companies over the long term, irrespective of whether they remain appointed as members of the Board of Management of Deutsche Beteiligungs AG. For that reason, the two individuals named have dormant employment contracts with DBG Managing Partner GmbH & Co. KG.
Key management personnel of Deutsche Beteiligungs AG partly serve on supervisory bodies of companies in the portfolio of Deutsche Beteiligungs AG as well as of the funds stated above. For the period from 1 November 2013 to 31 October 2014, they were entitled to compensation totalling T€ 290 (previous year: T€ 288) for these services, which has been transferred in full to Deutsche Beteiligungs AG and recognised in “Other operating income”.
Treuinvest Service GmbH and Deutsche Treuinvest Stiftung are related parties that act as trustees within the scope of a bilateral contractual trust arrangement for pension-related plan assets. Both companies together receive an annual net fee of T€ 7 euros for administration services.
In October 2010, Deutsche Beteiligungs AG established an incorporated foundation under civil law named “Gemein-nützige Stiftung der Deutschen Beteiligungs AG”. It was initially endowed with assets of T€ 100 in cash. In financial year 2013/14, another T€ 20 (previous year: T€ 20) were allocated to the Foundation’s endowment to pursue its tax-privileged objectives. At 31 October 2014, total allocations to the Foundation’s endowment amounted to T€ 140. The purpose of the Foundation is to support charitable causes. A further aim is to promote the arts and cultural projects in the greater Frankfurt area. The Foundation is considered a related party in terms of the IFRS.
1 9 0 C O N S O L I D AT E D F I N A N C I A L S TAT E M E N T S

41. FA I R VA LU E O F F I N A N C I A L I N S T RU M EN T S
The key items in the accounts of Deutsche Beteiligungs AG containing financial instruments are carried completely (financial assets and long- and short-term securities) at fair value. Financial instruments carried at amortised cost are largely recognised in current assets or current liabilities. Their term is less than one year. For these instruments, we assume that the carrying amount reflects their fair value.
4 2 . R I S K M A N AG EM EN T
For information on risk management objectives and methods, please refer to note 34 and the discussion in the combined management report.
43 . AU D I T FEES A N D AU D I T- R EL AT ED S ERV I C ES
Total fees paid to the auditor are comprised of the following:
2013/14
T €Parent
company Subsidiaries Total
Audit consolidated/separate financial statements 284 37 321
Tax advisory services 226 17 243
Other consultancy services (not reimbursable) 51 46 97
561 100 661
Other consultancy services (reimbursable) 92 101 193
653 201 854
Consultancy services were partially charged to DBAG funds and/or the portfolio companies.
A N N U A L R E P O R T 2 0 1 3 / 1 4 1 9 1
FIN
AN
CIA
L S
TA
TE
ME
NT
S

4 4 . M EM BE R S O F T H E SU P E RV I S O RY BOA R D A N D BOA R D O F M A N AG EM EN T
Supervisory Board *
A N D R E W R I C H A R D S ,
Bad Homburg v. d. Höhe (Chairman)
Executive Director of PARE-Unternehmensberatung GmbH, Bad Homburg v. d. Höhe
Comparable offices in Germany and internationally
> PINOVA Capital GmbH, Munich (Chairman)
G E R H A R D R O G G E M A N N ,
Hanover (Vice Chairman)
Vice Chairman of Canaccord Genuity Limited, London, Great Britain (until 31 August 2014)
Senior Advisor of Edmond de Rothschild Private Merchant Bank LLP, London, Great Britain (since 1 September 2014)
Statutory offices
> Deutsche Börse AG, Frankfurt/Main (Vice Chairman)
> Fresenius SE & Co. KGaA, Bad Homburg v. d. Höhe
> GP Günter Papenburg AG, Schwarmstedt (Chairman)
> WAVE Management AG, Hanover (since 19 November 2013; Vice Chairman)
R O L A N D F R O B E L ,
Isernhagen
Director of Administration and Finances, Dirk Rossmann GmbH, Burgwedel
Statutory offices
> SIMONA AG, Kirn (Vice Chairman)
Comparable offices in Germany and internationally
> Saxonia Holding GmbH, Wolfsburg (Chairman)
W I L K E N F R E I H E R R VO N H O D E N B E R G ,
Hamburg
Lawyer
Statutory offices
> Schloss Vaux AG, Eltville
> SLOMAN NEPTUN Schiffahrts-AG, Bremen (since 10 July 2014)
Comparable offices in Germany and internationally
> Dirk Rossmann GmbH, Burgwedel
P H I L I P P M Ö L L E R ,
Hamburg
Managing Partner of Möller & Förster GmbH & Co. KG, Hamburg
No statutory offices or comparable offices in Germany and internationally
D R H E N D R I K O T T O,
Dusseldorf
Member of the Board of Management of WEPA Industrieholding SE, Arnsberg
No statutory offices or comparable offices in Germany and internationally
* Statutory offices: offices held on other statutory supervisory boards; Comparable offices in Germany and internationally: offices held on comparable domestic and international supervisory bodies of commercial enterprises, at 31 October 2014
1 9 2 C O N S O L I D AT E D F I N A N C I A L S TAT E M E N T S

Board of Management *
T O R S T E N G R E D E ,
Frankfurt/Main (Spokesman)
Statutory offices
> Homag Group AG, Schopfloch (until 10 October 2014, Chairman)
Comparable offices in Germany and internationally
> Clyde Bergemann Power Group, Inc., Delaware, USA
> Treuburg Beteiligungsgesellschaft mbH, Ingolstadt (since 9 April 2014)
> Treuburg GmbH & Co. Familien KG, Ingolstadt (since 9 April 2014)
D R R O L F S C H E F F E L S ,
Frankfurt/Main
Statutory offices
> Preh GmbH, Bad Neustadt a. d. Saale (Vice Chairman)
Comparable offices in Germany and internationally
> FDG Group S.A.S., Orly, France
> Financière FDG S.A., Paris, France
> JCK Holding GmbH Textil KG, Quakenbrück
> Romaco Pharmatechnik GmbH, Karlsruhe
S U S A N N E Z E I D L E R ,
Bad Homburg v. d. Höhe (Chief Financial Officer)
Comparable offices in Germany and internationally
> DBG Fifth Equity Team GmbH & Co. KGaA, Frankfurt/Main (Vice Chairwoman)
* Statutory offices: offices held on other statutory supervisory boards; Comparable offices in Germany and internationally: offices held on comparable domestic and international supervisory bodies of commercial enterprises, at 31 October 2014
A N N U A L R E P O R T 2 0 1 3 / 1 4 1 9 3
FIN
AN
CIA
L S
TA
TE
ME
NT
S

4 5 . L I S T O F SU B S I D I A R I ES A N D A S S O C I AT ES
Name Domicile
Equity share
(%)
Equity capital
(T€)
Operating result of past financial year
(T€)
4 5 . 1 C O N S O L I D AT E D C O M PA N I E S
45.1.1 Consolidated companies
DBG Advisors Kommanditaktionär GmbH & Co. KG Frankfurt/Main 33.33 7,556 4,370
DBG Fourth Equity Team GmbH & Co. KGaA Frankfurt/Main 100.00 87 (5)
DBG Management GmbH & Co. KG Frankfurt/Main 100.00 260 934
DBG New Fund Management GmbH & Co. KG Frankfurt/Main 100.00 3 565
Deutsche Beteiligungsgesellschaft mbH Königstein / Taunus 100.00 24,223 382
DBAG Fund V Konzern GmbH & Co. KG Frankfurt/Main 99.00 64,308 7,884
DBG Managing Partner GmbH & Co. KG Frankfurt/Main 20.00 6,945 11,795
DBG Managing Partner Verwaltungs GmbH Frankfurt/Main 100.00 17 (1)
DBAG Expansion Capital Fund Konzern GmbH & Co. KG Frankfurt/Main 99.00 11,678 309
DBAG Fund VI Konzern (Guernsey) L.P. St. Peter Port (Guernsey) 99.99 24,573 799
45.1.2 Non-Consolidated companies
Bowa Beteiligungsgesellschaft mbH & Co. KG Frankfurt/Main 100.00 0 (7)
Bowa Geschäftsführungs GmbH Frankfurt/Main 100.00 61 2
DBG Beteiligungsgesellschaft mbH Frankfurt/Main 100.00 104 6
DBG Epsilon GmbH Frankfurt/Main 100.00 23 (1)
DBG Fifth Equity Team GmbH & Co. KGaA Frankfurt/Main 100.00 3,946 494
DBG Fourth Equity International GmbH Frankfurt/Main 100.00 35 0
DBG Lambda GmbH Frankfurt/Main 100.00 19 0
DBG My GmbH Frankfurt/Main 100.00 145 (4)
DBG UK Management Ltd. 1 London 100.00 – –
DBV Drehbogen GmbH Frankfurt/Main 100.00 33 (1)
Gizeh Verpackungen Beteiligungs-GmbH i. L. Bergneustadt 99.67 78 5
DBG Alpha 5 GmbH Frankfurt/Main 100.00 25 (4)
1 9 4 C O N S O L I D AT E D F I N A N C I A L S TAT E M E N T S

Name Domicile
Equity share
(%)
Equity capital
(T€)
Operating result of past financial year
(T€)
4 5 . 2 J O I N T V E N T U R E S
Q.P.O.N. Beteiligungs GmbH 2 Frankfurt/Main 49.00 25 1
4 5 . 3 A S S O C I AT E S
DBG Asset Management, Ltd. Jersey 50.00 276 (23)
DS Technologie Holding GmbH i. L. Frankfurt/Main 40.74 4,835 2,368
ECF Breitbandholding GmbH 3 Frankfurt/Main 41.78 – –
Grohmann Engineering GmbH Prüm 24.01 30,134 4,926
Plant Systems & Services PSS GmbH 3 Bochum 20.47 – –
RQPO Beteiligungs GmbH Frankfurt/Main 49.00 34 1
RQPO Beteiligungs GmbH & Co. Papier KG Frankfurt/Main 44.10 0 (8)
1 Consolidated/separate financial statements not issued 2 Proportionate consolidation3 Latest financial statements not available
4 5 . 4 O T H E R C O M PA N I E S
Based on its investment, DBAG holds more than five percent of the voting rights in the following corporations:
Broetje-Automation GmbH Wiefelstede
Clyde Bergemann Group Delaware, USA
Coveright Surfaces Beteiligungs GmbH i. L. Frankfurt/Main
FDG Holding S.à.r.l. Luxemburg
Formel D GmbH Troisdorf
Heytex Bramsche GmbH Bramsche
Romaco GmbH Karlsruhe
Spheros GmbH Gilching
Frankfurt/Main, 19 December 2014
The Board of Management
Torsten Grede Dr Rolf Scheffels Susanne Zeidler
A N N U A L R E P O R T 2 0 1 3 / 1 4 1 9 5
FIN
AN
CIA
L S
TA
TE
ME
NT
S

STATEMENT OF RESPONSIB I L I T Y
We confirm to the best of our knowledge and consistent with the applicable reporting principles for financial reporting that the consolidated financial statements give a true and fair view of the asset, financial and earnings position of the Group and that the management report presents a true and fair view of the business development and the position of the Group, including a discus-sion of the material risks and opportunities associated with the Group’s expected development.
Frankfurt/Main, 19 December 2014
The Board of Management
Torsten Grede Dr Rolf Scheffels Susanne Zeidler
1 9 6 M I S C E L L A N E O U S I N F O R M AT I O N

We have audited the consolidated financial statements prepared by the Deutsche Beteiligungs AG, Frankfurt/Main, comprising consolidated statement of financial position, statement of comprehensive income, consolidated statement of cash flows, consolidated statement of changes in equity and notes to the consolidated financial statements, together with its report on the position of the Company and the Group (hereinafter “combined management report”) for the business year from November 1st, 2013 to October 31st 2014. The preparation of the consolidated financial statements and the combined management report in accordance with IFRSs, as adopted by the EU, and the additional requirements of German commercial law pursuant to § 315a (1) HGB (Handelsgesetzbuch, “German Commercial Code”) are the responsibility of the parent company`s management. Our responsibility is to express an opinion on the consolidated financial statements and on the combined management report based on our audit.
We conducted our audit of the consolidated financial statements in accordance with § 317 HGB (Handelsgesetzbuch, “German Commercial Code”) and German generally accepted standards for the audit of financial statements promulgated by the Institut der Wirtschaftsprüfer (Institute of Public Auditors in Germany, IDW). Those standards require that we plan and perform the audit such that misstatements materially affecting the presentation of the net assets, financial position and results of operations in the consolidated financial statements in accordance with the applicable financial reporting framework and in the combined management report are detected with reasonable assurance. Knowledge of the business activities and the economic and legal environment of the Group and expectations as to possible misstatements are taken into account in the determination of audit procedures. The effectiveness of the accounting-related internal control system and the evidence supporting the disclosures in the consolidated financial statements and the combined management report are examined primarily on a test basis within the framework
AU D I TO R ’ S R EP O R T
of the audit. The audit includes assessing the annual financial statements of those entities included in consolidation, the determination of entities to be included in consolidation, the accounting and consolidation principles used and significant estimates made by management, as well as evaluating the overall presentation of the consolidated financial statements and the combined management report. We believe that our audit provides a reasonable basis for our opinion.
Our audit has not led to any reservations.
In our opinion, based on the findings of our audit, the consolidated financial statements comply with IFRSs, as adopted by the EU, the additional requirements of German commercial law pursuant to § 315a (1) HGB and give a true and fair view of the net assets, financial position and results of operations of the Group in accordance with these requirements. The combined management report is consistent with the consolidated financial statements and as a whole provides a suitable view of the Group’s position and suitably presents the opportunities and risks of future development.
Frankfurt/Main, 19 December 2014
KPMG AG Wirtschaftsprüfungsgesellschaft
Bertram Meister Wirtschaftsprüfer Wirtschaftsprüfer (German Public Auditor) (German Public Auditor)
A N N U A L R E P O R T 2 0 1 3 / 1 4 1 9 7

I N F O R M AT I O N F O R SH A R EH O L D ER S
D E U T S C H E B E T E I L I G U N G S AG
Investor Relations and Public Relations Thomas Franke
Börsenstraße 1 60313 Frankfurt/Main
Telephone: +49 69 95787-361 Fax: +49 69 95787-391
E-mail: [email protected] Internet: www.deutsche-beteiligung.de
F O RWA R D - LO O K I N G S TAT EM EN T S
This report contains forward-looking statements related to the prospects and progress of Deutsche Beteiligungs AG. These statements reflect the current views of the management of Deutsche Beteiligungs AG and are based on projections, estimates and expectations. Our assumptions are subject to risks and uncertainties, and actual results may vary materially. Although we believe these forward-looking statements to be realistic there can be no guarantee.
I M P R I N T
Published by: The Board of Management of Deutsche Beteiligungs AG Editing and coordination: Thomas Franke Design and realisation: Scheufele Hesse Eigler Kommunikationsagentur GmbH, Frankfurt /Main Printed by: Werbedruck GmbH Horst Schreckhas, Spangenberg Photography: Nils Hendrik Müller (pages 2 and 3), Martin Joppen (pages 4 and 41 centre), Stephan Cropp (pages 24, 30, 31, 33 – 35, 38 and 39);
Broetje-Automation GmbH (pages 26, 28 and 29), DBAG (page 51), dpa/picture alliance (pages 41 upper left, 42 top, 44 and 46 top); Grohmann Engineering GmbH (page 32), Schülerhilfe GmbH (page 36), Shutterstock (pages 43, 45, 49 and 51), thinkstock (pages 42 bottom, 47 and 48) As at 20 January 2015 © Deutsche Beteiligungs AG, Frankfurt /Main, Germany
D I SCL A I M ER
The amounts in this Annual Report are generally presented in thousands and millions of euros. Rounding differences can occur between the amounts presented and their exact value; these of course are not of a significant nature.
The Annual Report is published in German and in English. The German version of this report is authoritative.
carbon neutralnatureOffice.com | DE-140-312536
print production
1 9 8 M I S C E L L A N E O U S I N F O R M AT I O N

D R I V I N G E X PA N S I O N . E N S U R I N G C O N T I N U I T Y. I D R I V I N G E X PA N S I O N . E N S U R I N G C O N T I N U I T Y. I I
LO N G -T ER M P ER F O R M A N CE 2013 /14 H I G H L I G H T S
Net asset value rose after paying a dividend of 1.20 euros in March 2014 to 22.18 euros per share at 31 October 2014. This equates to a gain of 1.82 euros, or a return of 15.8 percent in financial year 2013/14. Thus, we exceeded both the cost of equity and the long-term average: over the past ten-year period, we generated an average return on net asset value per share of 15.3 percent.
More information on the historical return trend on page 88.
R E T U R N O N N E T A S S E T VA L U E P E R S H A R E (%)
60
50
40
30
20
10
0
(10)
(20)
04/05 05/06 06/07 07/08 08/09 09/10 10/11 11/12 12/13 13/14
20.0
36.4
56.2
7.3 12.7
(6.2)
16.811.5
15.8
(17.5)
In financial year 2013/14, the price of DBAG shares rose to 21.83 euros, up from 19.36 euros. Including the dividend of 1.20 euros that we paid per share in March 2014, we delivered a total return to our shareholders of 19.5 percent.Thus, DBAG shares outperformed the S-Dax – the benchmark index for German companies of a comparable size – and the LPX Direct – the benchmark index for directly investing private equity firms. Over a ten-year period, DBAG shares generated an average total return for our shareholders of 16.2 percent annually. That is roughly twice the return delivered by the benchmark indices.
More information on DBAG shares on page 14.
P E R F O R M A N C E O F D B A G S H A R E S A N D B E N C H M A R K I N D I C E S
(1 November 2004 to 31 October 2014, indexed to 1 November 2004 = 100)
450
400
350
300
250
200
150
100
50
DBAG
Dax
S-Dax
LPX Direct
1 Nov. 04 1 Nov. 06 1 Nov. 08 1 Nov. 10 1 Nov.12 1 Nov. 14
The consolidated net income of 47.8 million euros (previous year: 32.3 million euros) reflects profits from attractive divestments to strategic investors, very satisfactory progress on the part of most portfolio companies and higher fee income from investment services to funds.The net result of investment activity reached 54.5 million euros (previous year: 41.0 million euros); fee income from fund management and advisory services totalled 21.7 million euros (previous year: 18.9 million euros).
More information on the consolidated net income on page 75.
C O N S O L I D AT E D N E T I N C O M E (€mn)
120
100
80
60
40
20
0
(20)
(40)
04/05 05/06 06/07 07/08 08/09 09/10 10/11 11/12 12/13 13/14
136.5
(51.1)
82.7
19.6
(16.6)
34.144.5
32.3
47.841.3
D R I V I N G E X PA N S I O N . E N S U R I N G C O N T I N U I T Y. I I I
T EN -Y E A R F I N A N CI A L SU M M A RY
€mn 2004/05 2005/06 2006/07 2007/08 2008/09 2009/10 2010/11 2011/12 2012/13 2013/14
Development of portfolio and value
New investment 24 22 40 14 4 8 9 22 42 20
“Portfolio value” (31 Oct.) 1 197 121 189 127 123 118 84 143 173 153
Number of investments (31 Oct.) 35 32 30 21 19 17 16 18 20 19
Earnings position
EBIT 41.6 89.1 150.8 (60.5) 20.4 36.8 (23.0) 46.2 33.6 48.2
EBT 42.3 90.9 155.6 (55.3) 22.4 37.6 (19.9) 47.0 33.8 48.5
Consolidated net income/(loss) for the year 41.3 82.7 136.5 (51.1) 19.6 34.1 (16.6) 44.5 32.3 47.8
Consolidated retained profit 35.5 57.2 118.2 29.2 52.6 73.1 37.3 70.8 86.7 118.1
Financial position
Cash flows from operating activities (35.6) (4.1) (2.6) 3.0 (3.5) (12.8) 0.9 (9.6) (12.0) (1.4)
Cash flows from investing activities 132.2 169.3 65.4 11.2 28.8 36.3 34.1 (17.8) 18.7 70.8
thereof proceeds from disposals of financial assets 156.5 191.0 106.1 25.7 33.0 44.5 43.6 3.8 60.4 90.8
thereof purchase of financial assets (24.1) (21.7) (40.7) (14.5) (4.3) (8.2) (9.4) (21.6) (41.7) (20.0)
Cash flows from financing activities (57.1) (40.7) (71.4) (57.3) (5.5) (13.7) (19.1) (10.9) (16.4) (16.4)
Change in cash funds 2 39.5 124.0 (9.0) (50.5) 10.6 (70.9) 14.9 (38.7) (9.7) 52.4
Asset position
Non-current assets 201.1 124.6 211.3 147.2 161.2 244.3 228.6 238.7 233.6 243.9
thereof long-term securities 0 0 0 0 14.5 102.9 123.1 83.0 50.5 81.0
Current assets 65.2 195.5 183.0 125.1 127.1 71.8 51.3 59.5 77.1 103.2
thereof cash and short-term securities 40.7 164.7 155.8 105.2 109.5 37.8 32.5 27.8 47.8 69.7
Equity 246.6 289.0 353.6 244.8 256.8 273.9 238.9 266.2 278.4 303.4
Liabilities/provisions 19.7 31.1 40.8 27.4 31.5 42.2 41.0 32.8 32.2 43.7
Total assets 266.3 320.1 394.4 272.3 288.3 316.1 279.9 299.0 310.7 347.1
Key indicators
Return on NAV per share after taxes 3 (%) 18.1 36.4 56.2 (17.5) 7.3 12.7 (6.2) 16.7 11.5 15.8
Equity as a percentage of total assets 92.6 90.3 89.7 89.9 89.1 86.7 85.3 89.0 89.6 87.4
Information on shares 4
Earnings per share (€) 1.79 5.02 9.20 (3.73) 1.44 2.50 (1.22) 3.25 2.36 3.49
NAV per share (€) 14.64 19.07 25.09 17.90 18.77 20.03 17.47 19.46 20.36 22.18
Dividend per share (€; 2013/14: recommended) 0.33 0.50 1.00 0.40 0.40 0.40 0.40 0.40 0.40 0.40
Surplus dividend/bonus per share (€; 2013/14: recommended) 0.33 2.50 2.50 – 0.60 1.00 0.40 0.80 0.80 1.60
Total amount distributed 5 (2013/14: recommended) 11.1 45.5 47.9 5.5 13.7 19.1 10.9 16.4 16.4 27.4
Number of shares (end of FY) 16,837,329 15,153,864 14,403,864 13,676,359 13,676,359 13,676,359 13,676,359 13,676,359 13,676,359 13,676,359
thereof held by the Company 313.367
Share price (€; end of FY) 13.25 17.35 24.10 10.45 15.55 20.79 15.50 19.49 19.36 21.83
Market capitalisation (end of FY) 223.1 262.9 347.1 142.9 212.7 284.3 212.0 266.6 264.8 298.6
Number of employees 50 44 47 48 49 51 53 54 55 56
The table above contains data as originally reported in the respective annual consolidated financial statements. 1 Without interests in shelf companies and companies that are mainly attributable to third parties 2 Cash as well as short- and long-term securities3 Change in net asset value per share relative to opening net asset value per share at beginning of reporting period, less dividends per share4 Partly adjusted; earnings and cash flow per share relative to weighted average number of shares outstanding 5 Relates to respective financial year
C O N S O L I DAT E D N E T I N C O M E reaches
M I L L I O N E U R O S
R E T U R N O N N E T A S S E T VA L U E per share
P E R C E N T
T O TA L R E T U R N to shareholders
P E R C E N T
47.8
15.8
19.5
DRIV ING EXPANSION.ENSURING
CONTINUIT Y.M A K I N G S T R O N G
C O M P A N I E S S T R O N G E R .
A N N U A L R E P O R T
2 0 1 3 / 1 4
www.deutsche-beteiligung.de
ISSN
161
9-12
26
De
uts
che
Be
teil
igu
ng
s A
GA
nn
ua
l R
ep
ort
20
13
/14
C O N T E N T SA N N U A L R E P O R T 2 0 13 / 1 4
LONG-TERM PERFORMANCE I
2013/14 HIGHLIGHTS I I
T O O U R S H A R E H O L D E R S 2
LETTER FROM THE BOARD OF MANAGEMENT 2
BOARD OF MANAGEMENT 3
REPORT OF THE SUPERVISORY BOARD 4
CORPORATE GOVERNANCE 10
SHARES 14
O U R P O R T F O L I O 22
5 0 Y E A R S O F D B AG 40
C O M B I N E D M A N AG E M E N T R E P O R T 52
BUSINESS OVERVIEW 54
THE GROUP AND UNDERLYING CONDIT IONS 55
BUSINESS REVIEW OF THE GROUP 69
FINANCIAL REVIEW OF
DEUTSCHE BETEIL IGUNGS AG (COMMENTARY BASED
ON THE GERMAN COMMERCIAL CODE – HGB) 94
SIGNIFICANT EVENTS AFTER THE END
OF THE REPORTING PERIOD 100
ADDITIONAL STATUTORY INFORMATION
AND COMMENTARY 101
OPPORTUNITIES AND RISKS 108
REPORT ON EXPECTED DEVELOPMENTS 124
C O N S O L I DAT E D F I N A N C I A L S TAT E M E N T S 130
CONSOLIDATED STATEMENT OF
COMPREHENSIVE INCOME 132
CONSOLIDATED STATEMENT OF CASH FLOWS 133
CONSOLIDATED STATEMENT OF FINANCIAL POSIT ION 134
CONSOLIDATED STATEMENT OF CHANGES IN EQUITY 135
NOTES TO THE CONSOLIDATED FINANCIAL STATEMENTS 136
M I S C E L L A N E O U S I N F O R M AT I O N 196
STATEMENT OF RESPONSIBIL ITY 196
AUDITOR’S REPORT 197
CONTACT 198
IMPRINT 198
TEN-YEAR FINANCIAL SUMMARY I I I
F INANCIAL CALENDAR IV
F I N A N CI A L C A L EN DA R
2 2 J A N UA RY 2 015
Annual press conference 2013/14, Frankfurt / Main
2 2 J A N UA RY 2 015
Analysts’ conference, Frankfurt / Main
11 F E B R UA RY 2 015
Listed Private Equity Day, Zurich
18 /19 F E B R UA RY 2 015 Road Show Great Britain, London/Edinburgh
16 M A R C H 2 015
Report on the first quarter 2014/15, Analysts’ conference call
21 M A R C H 2 015 Börsentag Munich (SdK Stock Forum), Munich
2 4 M A R C H 2 015
Annual Meeting, Frankfurt /Main
2 5 M A R C H 2 015
Dividend payment 2015
14 A P R I L 2 015 Solventis Stock Forum, Frankfurt/Main
15 J U N E 2 015
Report on the second quarter 2014/15, Analysts’ conference call
14 S E P T E M B E R 2 015
Report on the third quarter 2014/15, Analysts’ conference call
I V

DRIV ING EXPANSION.ENSURING
CONTINUIT Y.M A K I N G S T R O N G
C O M P A N I E S S T R O N G E R .
A N N U A L R E P O R T
2 0 1 3 / 1 4
www.deutsche-beteiligung.de
ISSN
161
9-12
26
De
uts
che
Be
teil
igu
ng
s A
GA
nn
ua
l R
ep
ort
20
13
/14
C O N T E N T SA N N U A L R E P O R T 2 0 13 / 1 4
LONG-TERM PERFORMANCE I
2013/14 HIGHLIGHTS I I
T O O U R S H A R E H O L D E R S 2
LETTER FROM THE BOARD OF MANAGEMENT 2
BOARD OF MANAGEMENT 3
REPORT OF THE SUPERVISORY BOARD 4
CORPORATE GOVERNANCE 10
SHARES 14
O U R P O R T F O L I O 22
5 0 Y E A R S O F D B AG 40
C O M B I N E D M A N AG E M E N T R E P O R T 52
BUSINESS OVERVIEW 54
THE GROUP AND UNDERLYING CONDITIONS 55
BUSINESS REVIEW OF THE GROUP 69
FINANCIAL REVIEW OF
DEUTSCHE BETEIL IGUNGS AG (COMMENTARY BASED
ON THE GERMAN COMMERCIAL CODE – HGB) 94
SIGNIFICANT EVENTS AFTER THE END
OF THE REPORTING PERIOD 100
ADDIT IONAL STATUTORY INFORMATION
AND COMMENTARY 101
OPPORTUNITIES AND RISKS 108
REPORT ON EXPECTED DEVELOPMENTS 124
C O N S O L I DAT E D F I N A N C I A L S TAT E M E N T S 130
CONSOLIDATED STATEMENT OF
COMPREHENSIVE INCOME 132
CONSOLIDATED STATEMENT OF CASH FLOWS 133
CONSOLIDATED STATEMENT OF FINANCIAL POSIT ION 134
CONSOLIDATED STATEMENT OF CHANGES IN EQUITY 135
NOTES TO THE CONSOLIDATED FINANCIAL STATEMENTS 136
M I S C E L L A N E O U S I N F O R M AT I O N 196
STATEMENT OF RESPONSIBIL ITY 196
AUDITOR’S REPORT 197
CONTACT 198
IMPRINT 198
TEN-YEAR FINANCIAL SUMMARY I I I
F INANCIAL CALENDAR IV
F I N A N CI A L C A L EN DA R
2 2 J A N UA RY 2 015
Annual press conference 2013/14, Frankfurt / Main
2 2 J A N UA RY 2 015
Analysts’ conference, Frankfurt / Main
11 F E B R UA RY 2 015
Listed Private Equity Day, Zurich
18 /19 F E B R UA RY 2 015 Road Show Great Britain, London/Edinburgh
16 M A R C H 2 015
Report on the first quarter 2014/15, Analysts’ conference call
21 M A R C H 2 015 Börsentag Munich (SdK Stock Forum), Munich
2 4 M A R C H 2 015
Annual Meeting, Frankfurt /Main
2 5 M A R C H 2 015
Dividend payment 2015
14 A P R I L 2 015 Solventis Stock Forum, Frankfurt/Main
15 J U N E 2 015
Report on the second quarter 2014/15, Analysts’ conference call
14 S E P T E M B E R 2 015
Report on the third quarter 2014/15, Analysts’ conference call
I V