ContentsDr Haldor Topsoe Mr Qaiser Javed Brig Arshad Shah, SI(M) (Retired) Mr Zaigham Mahmood Rizvi...
123
Company Information 02 Board of Directors 04 Operating Highlights 06 Committees of BOD & Management 08 Notice of Meeting 10 Directors' Report 12 Statement of Compliance 46 Review Report to the Members 48 Auditors’ Report to the Members 49 Balance Sheet 50 Profit and Loss Account 52 Cash Flow Statement 53 Statement of Changes in Equity 54 Notes to the Financial Statements 55 Auditors’ Report on Consolidated Financial Statements 83 Consolidated Balance Sheet 84 Consolidated Profit and Loss Account 86 Consolidated Cash Flow Statement 87 Consolidated Statement of Changes in Equity 88 Notes to the Consolidated Financial Statements 89 Pattern of Shareholding 120 Form of Proxy Contents • • • • • • • • • • • • • • • • • • • • • •
Transcript of ContentsDr Haldor Topsoe Mr Qaiser Javed Brig Arshad Shah, SI(M) (Retired) Mr Zaigham Mahmood Rizvi...

Company Information 02Board of Directors 04Operating Highlights 06Committees of BOD & Management 08Notice of Meeting 10Directors' Report 12Statement of Compliance 46Review Report to the Members 48Auditors’ Report to the Members 49Balance Sheet 50Profit and Loss Account 52Cash Flow Statement 53Statement of Changes in Equity 54Notes to the Financial Statements 55Auditors’ Report on ConsolidatedFinancial Statements 83Consolidated Balance Sheet 84Consolidated Profit and Loss Account 86Consolidated Cash Flow Statement 87Consolidated Statement of Changes in Equity 88Notes to the Consolidated Financial Statements 89Pattern of Shareholding 120Form of Proxy
Contents•••••••••••••••
•••••••

B O A R D O F D I R E C T O R S
Lt Gen Syed Muhammad Amjad, HI, HI(M) (Retired)
� � � � � � � �
Lt Gen Mahmud Ahmed, HI(M) (Retired)
Chief Executive and Managing Director
Dr Haldor Topsoe
Mr Qaiser Javed
Brig Arshad Shah, SI(M) (Retired)
Mr Zaigham Mahmood Rizvi
Mr Tariq Iqbal Khan
Brig Aftab Ahmed, SI(M) (Retired)
Brig Ghazanfar Ali, SI(M) (Retired)
Syed Zaheer Ali Shah
Mr Khawar Saeed
Dr Nadeem Inayat
Mr Nadir Rahman
Company InformationS E C R E TA R Y
Brig Muhammad Saleem Suleman, SI(M) (Retired)
R E G I S T E R E D O F F I C E
93-Harley Street, Rawalpindi Cantt.
Website: www.ffc.com.pk
E-mail: [email protected]
P L A N T S I T E S
Goth Machhi, Sadikabad
(Distt : Rahim Yar Khan)
Mirpur Mathelo
(Distt: Ghotki)
M A R K E T I N G D I V I S I O N
Lahore Trade Centre,
11 Shahrah-e-Aiwan-e-Tijarat, Lahore
K A R A C H I O F F I C E
B-35, KDA Scheme No. 1
Karachi
A U D I T O R S
M/s Taseer Hadi Khalid & Co.
Chartered Accountants
2

We believe in timeliness, accuracy and transparency of our business reporting and remain accountable and accessible to our shareholders.
We believe in timeliness, accuracy and transparency of our business reporting and remain accountable and accessible to our shareholders.
3

Dr Haldor Topsoe Mr Qaiser Javed Brig Arshad Shah, SI(M) (Retired) Mr Zaigham Mahmood Rizvi
Mr Tariq Iqbal Khan Brig Aftab Ahmed, SI(M) (Retired) Brig Ghazanfar Ali, SI(M) (Retired) Syed Zaheer Ali Shah
Mr Khawar Saeed Dr Nadeem Inayat Mr Nadir Rahman Brig Muhammad Saleem SulemanSI(M) (Retired)
Company Secretary
Board of Directors
Lt Gen Syed Muhammad Amjad, HI, HI(M), (Retired)Chairman
Lt Gen Mahmud Ahmed, HI(M) (Retired)Chief Executive and Managing Director
4

The future challenge for our leadership and manpower is to perform better in a complex and evolving world market by discovering and exploiting new opportunities.
5

Operating Highlights 1 9 9 9 2 0 0 0 2 0 0 1 2 0 0 2 2 0 0 3 2 0 0 4
K E Y I N D I C AT O R S
Operating
Gross Margin % 50.47 45.35 46.90 39.78 34.86 37.42Pre Tax Margin % 44.91 41.07 41.68 28.83 23.44 29.02Net Margin % 29.51 25.92 26.74 18.31 14.95 19.04
Performance
Return on Assets % 34.19 27.06 35.74 17.18 18.11 23.08Assets Turnover 0.76 0.66 0.86 0.60 0.77 0.80Fixed Assets Turnover 3.40 4.40 7.85 1.76 2.27 2.29Inventory Turnover Days 4 4 12 19 16 11Return on Equity % 36.05 29.81 33.72 28.55 27.29 32.57Return on Capital Employed % 31.28 27.50 32.94 18.66 19.56 26.41Retention % 33.53 22.39 31.95 24.89 18.43 9.68
Leverage
Debt: Equity 13:87 8:92 2:98 35:65 28:72 19:81Leverage 11.71 13.58 19.14 8.24 10.47 17.36
Liquidity
Current 2.14 1.72 2.34 1.04 1.04 1.08Quick 1.76 1.48 1.90 0.79 0.76 0.86
Valuation
Earning per share (pre tax) Rs. 15.93 14.20 16.93 16.41 16.72 20.69Earning per share (after tax) Rs. 10.47 8.96 10.86 10.42 10.66 13.57Earning growth % (17.87) (14.36) 21.17 (4.00) 2.33 27.33Breakup value Rs. 33.38 34.58 37.04 41.96 44.92 41.68Dividend payout Rs. 8.00 8.00 8.50 9.00 10.00 12.00Payout ratio (after tax) % 66.47 77.61 68.05 75.11 81.57 80.72Price earning ratio 5.08 4.59 3.76 7.02 8.96 10.27Market price to breakup Val. Rs. 1.46 1.52 1.06 1.22 1.32 2.81Dividend yield % 16.46 15.19 21.61 17.51 16.86 10.24Market Value per Share Rs. 53.20 41.10 40.85 73.10 95.50 139.45Market capitalization (Rs. M) 13,646 10,542 10,478 18,750 24,495 41,134
Historical trends Rs. million
Trading resultsTurnover 10,463 10,201 11,982 16,787 21,035 21,027Gross Profit 5,281 4,600 5,620 6,678 7,333 7,869Profit before tax 4,699 4,190 4,994 4,839 4,931 6,103Profit after tax 3,087 2,644 3,204 3,073 3,145 4,004
Financial position
Shareholder's funds 8,563 8,869 9,502 10,763 11,523 12,295Property, Plant & Equipment 3,078 2,320 1,527 9,516 9,259 9,181Net current assets 3,866 3,991 5,586 396 309 673Long Term Assets 6,476 5,922 4,226 18,761 18,292 16,897Long term liabilities 1,305 744 224 5,704 4,557 2,868Liquid funds (net) 6,966 7,531 7,363 4,554 3,393 6,356
@ Retention is before final cash and bonus dividends.★ In addition, a Final Dividend of Rs. 3 per share was also declared by the Board on January 31, 2005.# P/E ratio is without the effect of Bonus Issue.
@
★
#
6

P R O F I T S v s G O V T. R E V E N U E S
10,000
9,000
8,000
7,000
6,000
5,000
4,000
3,000
2,000
1,000
0
Rs. Million
2000 2001 2002 2003 20041999
Net Profit Govt. RevenuesGross Profit
T U R N O V E R / N E T P R O F I TM o v e m e n t T r e n d ( G r o w t h )
50.0
40.0
30.0
20.0
10.0
0
(10.0)
(20.0)
(30.0)
(40.0)1999 2000 2001 2002 2003 2004
Revenue Net Profit
Percentage
C O M PA R I S O N O F P R O F I T2 0 0 4 v s 2 0 0 3
5,000
4,000
3,000
2,000
1,000
0
(1,000)
(2,000)
(3,000)
2003NP
Rs. Million
2004NP
UreaRev
ImpRev
COSurea
Dep COSImp
Dis.exp
Fincost
Other exp
Taxes
3,14
5
2,37
3
(1,6
39)
2,03
7
82
(72)
476
(313
)
4,00
4
(2,3
81)
148
148
Otherinc
A S S E T S & L I A B I L I T I E S
20,000
18,000
16,000
14,000
12,000
10,000
8,000
6,000
4,000
2,000
0
Rs. Million
2000 2001 2002 2003 20041999
Property, plant & equipment
Long term assets
Net current assets
Long term liabilities
S H A R E H O L D E R S ' E Q U I T YL i q u i d F u n d s
14,000
12,000
10,000
8,000
6,000
4,000
2,000
01999 2000 2001 2002 2003 2004
Rs. Million
Shareholders' Equity Liquid Fund
D I V I D E N D A N D PAY O U T R AT I O
13
12
11
10
9
8
7
6
5
4
3
2
11999 2000 2001 2002 2003 2004
Rupees
90
85
80
75
70
65
60
55
50
Dividend Payout Ratio
Percentage
7

Committees of the Board of Directors and Management
BOD COMMITTEES
Audit CommitteeChairman
Mr Tariq Iqbal KhanMembers
Mr Qaiser Javed Mr Khawar SaeedSyed Zaheer Ali ShahMr Nadir Rahman
Human Resources CommitteeChairman
Brig Arshad Shah, SI(M) (Retired)Members
Mr Qaiser JavedBrig Ghazanfar Ali (Retired)Dr Nadeem Inayat
System & Technology CommitteeChairman
Mr Zaigham Mahmood RizviMembers
Brig Aftab Ahmad (Retired) Brig Ghazanfar Ali (Retired)Dr Nadeem Inayat
MANAGEMENT COMMITTEES
Business Strategy CommitteeChairman
Lt Gen Mahmud Ahmed, HI(M) (Retired),(Chief Executive & Managing Director)
MembersMr Abdul Waheed Sheikh, General Manager (Technical & Operations)�������������������General Manager (Marketing)
�����������������General Manager (Finance)
EXECUTIVE COMMITTEE
ChairmanLt Gen Mahmud Ahmed, HI(M) (Retired),(Chief Executive & Managing Director)
MembersMr Abdul Waheed Sheikh, General Manager (Technical & Operations)�������������������General Manager (Marketing)�����������������General Manager (Finance)���������������General Manager Plant (Goth Machhi)Mr Tahir Javed, General Manager Plant (Mirpur Mathelo)
8

DIRECTORS' ATTENDANCE AT MEETIINGS
Human System &Board of Audit Resources Technology
Directors Directors Committee Committee Committee
Lt Gen Syed Muhammad Amjad, HI, HI(M) (Retired) 7 - - -Lt Gen Mahmud Ahmed, HI(M) (Retired) 6 - - -Dr Haldor Topsoe 0 - - -Mr Qaiser Javed 6 5 1 -Brig Arshad Shah, SI(M) (Retired) 6 3 2 -Mr Zaigham Mahmood Rizvi 5 - - 3Mr Tariq Iqbal Khan 5 5 - -Brig Aftab Ahmad, SI(M) (Retired) 7 2 - 1Brig Ghazanfar Ali, SI(M) (Retired) 7 - 1 3Syed Zaheer Ali Shah 2 1 - -Mr Khawar Saeed 6 4 - -Mr Nadeem Inayat 5 2 2 2Mr Nadir Rahman 2 2 - -
Number of Meetings Held 7 5 2 3
* Retired from Directorship
Mr Khalid Amin Qureshi 0 0 - -Mr Mohammad Farooq Saleem 0 0 - -Dr Salim Batla 2 - - 1Mr Hasan Aziz Bilgrami 2 - - -
9

1 0
Notice of Annual General Meeting
Notice is hereby given that the 27th Annual General Meeting of the Shareholders of Fauji Fertilizer Company Limited will be held at Pearl Continental Hotel, Rawalpindi on Monday, February 28, 2005 at 1100 hours to transact the following business:-
Ordinary Business
1. To confirm the minutes of Extraordinary General Meeting held on November 29, 2004.
2. To receive, consider and adopt the Audited Accounts of the Company together with the Auditors’ and the Directors’ Reports for the year ended December 31, 2004.
3. To appoint Auditors for the year 2005 and to fix their remuneration.
4. To approve payment of Final Dividend for the year ended December 31, 2004 as recommended by the Board of Directors.
Special Business
5. To consider and if thought fit, approve the following resolution as an ordinary resolution in respect of issue of bonus shares in the ratio of 15%, as recommended by the directors in their meeting held on January 31, �����
Resolution
“Resolved that a sum of Rs. 442,455,430/- (Rupees Four Hundred Forty Two Million Four Hundred Fifty Five Thousand and Four Hundred Thirty only) out of the Company’s Reserve for the issue of bonus shares be capitalized and applied for the issue of 44,245,543 ordinary shares of Rs. 10/- each and allotted as fully paid bonus shares to those members of the Company whose names appear in the Register of Members of the Company on February 22, 2005 in the ratio of 15 shares for every 100 share held and that such new shares shall rank pari passu in all respect with the existing ordinary shares of the Company.
Further resolved that the members entitled to fraction of shares as a result of their holding being less than 20 ordinary shares or in excess of an exact multiple of 20 ordinary shares shall be given the sale proceeds of their fractional entitlements for which purpose the fractions shall be consolidated into whole shares and sold on the Karachi Stock Exchange.
And Further resolved that for the purpose of giving effect to the foregoing, the Directors be and are hereby authorized to issue directions and take such actions as they deem fit to settle any question or any difficulties that may arise in the distribution of the said bonus shares or in the payment of the sale proceeds of the fractions.”
6. To transact any other business with the permission of the Chair.
By Order of the Board
Rawalpindi Brig Muhammad Saleem Suleman (Retired)February 06, 2005 Company Secretary
11
NOTES:
1. The share transfer books of the Company will remain closed from February 22, 2005 to February 28, 2005 (both days inclusive).
2. A member of the Company entitled to attend and vote at the Annual General Meeting may appoint a person/representative as proxy to attend and vote in place of the member at the Meeting. Proxies in order to be effective must be received at the Company’s Registered Office, 93-Harley Street, Rawalpindi not later than 48 hours before the time of holding the Meeting.
3. Any individual Beneficial Owner of CDC, entitled to vote at this meeting, must bring his/her original NIC with him/her to prove his/her identity, and in case of proxy, a copy of shareholder’s attested NIC must be attached with the proxy form. Representatives of corporate members should bring the usual documents required for such purpose.
Statement under section 160(1) (b) of the companies ordinance, 1984
This statement set out the material facts concerning the Special Business, given in agenda item No.5 of the Notice, to be transacted at the Annual General Meeting of the Fauji Fertilizer Company Limited to be held at Pearl Continental Hotel, Rawalpindi on Monday, February 28, 2005.
1. Issue of Bonus Shares
The Directors are of the view that Company’s financial position and its reserves justify the capitalization of free reserves amounting to Rs. 442,455,430/- for the issue of bonus shares in the ratio of 15 bonus shares for every 100 ordinary shares held. The Directors directly or indirectly, are not personally interested in this issue except to the extent of their shareholding in the Company.
Pursuant to rule 6 (iii) of the Companies (Issue of Capital) Rules 1996, the Auditors have certified that the free reserves and surpluses retained after the issue of the bonus shares will not be less than 25% of the ������������������

OVERVIEW
Let me summarize the achievements
which make 2004 an outstanding year
����������������
• Highest ever urea sales volume
of 2,376 thousand tonnes including
85 thousand tonnes of imported
urea.
• Record urea production of 2,174
thousand tonnes from all the three
plants despite maintenance
shutdowns and gas pressure
limitations.
• Highest urea market share of 63%,
including 580 thousand tonnes of
“Sona” urea granular marketed
on behalf of FFBL.
• Record urea sales revenue of
Rs. 18 billion. Total fertilizers
revenue stood at Rs. 21 billion.
• Highest ever gross and net profits
of Rs. 8 billion and Rs. 4 billion
respectively.
• Record per share earnings of
Rs. 13.57 despite dilution due to
increase in paid up share capital.
• Highest ever cash dividend of
Rs. 15 per share.
• First ever bonus shares issue of
30%.
• First ever dividend of 10% from
the subsidiary company.
• Top awards for our 2003 Annual
Report from ICAP & ICMAP joint
committee, NCCA – Karachi and
internationally from SAFA (South
Asian Federation of Accountants
representing the SAARC
countries).
• Tenth consecutive annual
placement in “Top twenty five
companies” on the Karachi Stock
Exchange based on 2003
performance.
• Meritorious award from the
Rawalpindi Chamber of
Commerce and Industry for good
��������������������
To our Shareholders,
On behalf of the Board, I am pleased to welcome our shareholders to the 27th annual review of the results of operations of Fauji Fertilizer Company Limited for the year ended December ���������
We regard 2004 as a memorable year in which we were able to attain new levels of performance and best ever results for the Company.
The Board has appended with this Report comprehensive financial indicators in the form of audited financial statements �������������������consolidated financial statements of the Company and Fauji Fertilizer Bin Qasim Limited (FFBL), along with Auditors’ Reports to the members.
Directors’ Report
1 2

MISSION STATEMENT
FFC’s mission is to sustain its role
as the leader in industrial and
agricultural advancement of Pakistan
by setting and achieving new and
higher goals, and taking initiatives.
The Company is committed to
ensuring safe and conducive work
environment, providing high quality
products and allied services to its
customers and profitable returns to
its shareholders.
VISION STATEMENT
FFC is focused on harmonizing its
capabilities and maximizing its
potential. FFC’s vision for the future
envisages diversification and
undertaking ventures at home and
abroad in collaboration with leading
international partners.
1 3

COMPANY PERFORMANCE
I am pleased to report the highest
ever after tax profit of Rs. 4.004 billion
for the year 2004, increase of 27%
over last year. The increase is due
to higher urea sales, savings in
distribution cost, lower finance cost
and dividend received from FFBL.
Urea sales revenue recorded a growth
of 20% over last year. As a result,
per share earnings of the Company
grew by Rs. 2.91 over earnings for
the previous year, despite increase
in the paid-up capital owing to bonus
issue. The dilution effect of bonus
shares on earnings for the year was
�������������������
The Company announced the first
ever bonus shares issue of 30% of
which 15% was approved by the
shareholders in their meeting held
on August 31, 2004. The members
further resolved to increase the
authorized capital of the Company
to Rs. 5 billion, as proposed by the
Board, for future capitalization
requirements.
The enclosed financial statements of
the Company and the group have
been prepared in accordance with
the revised fourth schedule of the
Companies Ordinance, 1984 and the
Auditors have issued an unqualified
audit report without any emphasis of
�������������������
Cash Flow Management
The Company has an effective Cash
Flow Management System in place
whereby cash inflows and cash
outflows are projected on regular
basis. Working capital requirements
of the Company are financed through
internal cash generations and short
term financing from external
resources. New investments and
growth opportunities are funded from
a mix of Company’s funds and
medium to long term financings. Major
portion of financing from external
sources is arranged from reputable
local and foreign banks at competitive
pricing. The Company places funds
for investment after thorough financial
evaluation. The investment portfolio
of the Company is fairly diversified,
ranging from investments in
Government bonds to mutual funds,
which aims at tapping the positive
developments in the financial sector.
Risk Mitigation
The Company is not exposed to any
major concentration of credit risk;
exposure is managed through
application of credit limits to its
customers in addition to obtaining
guarantees and by dealing with variety
of major banks and financial
institutions.
Cash Flow Risk associated with
floating rate financial instruments that
originates from interest rate
fluctuations is effectively mitigated
by holding ‘prepayment options’ and
establishing interest rate caps and
floors.
Prudent liquidity risk management
implies maintaining sufficient cash
and marketable securities, the
availability of funding to an adequate
amount of committed credit facilities
and the ability to close out market
positions due to the dynamic nature
of the business. The Company's
treasury aims at maintaining flexibility
in funding by keeping committed credit
������
1 4

Our business strategy is articulated to deliver exclusive value to our customers and shareholders.
Our business strategy is articulated to deliver exclusive value to our customers and shareholders.
1 5

Dividend Distribution
Fulfilling our mission to add
value to shareholders wealth
and profitable returns, the
Board is pleased to declare
highest ever dividends by
recommending final cash
dividend of Rs. 3 per share
and 15% bonus shares for
2004, in addition to Rs. 12
per share in cash and 15%
bonus issue declared earlier
on interim results, from the
available distributable profits
of the Company. Owing to the
increase in share capital, the
dividend percentage stands
diluted. On previous share
capital, the percentage
amounts to 192.75% including
bonus shares, as compared
to 100% paid last year.
The changes in the
Companies Ordinance, 1984
��������������������
subsequent to the financial
year end, including declaration
of dividends, should be
incorporated in the financial
period in which it is declared.
Therefore, the final dividend
for the year 2004, announced
on January 31, 2005 by the
Board, shall be reflected in
the financial statements for
the year 2005. This change
will have no impact on the
payment of dividends to
shareholders, which will
continue as before.
DIVIDEND AND EARNINGS PER SHARE
16
14
12
10
8
6
4
2
01999 2000 2001 2002 2003 2004
(Rupees)
Earning per Share Dividend
APPROPRIATION OF PROFIT
The net profit for the year is recommended by the Board
to be appropriated as follows:
Rupees “000”
Un-appropriated profit brought forward 197,753
Net profit after taxation 4,004,044
4,201,797
Transfer from general reserve 1,150,000
5,351,797
Appropriations
Dividend on ordinary shares
First interim Rs. 3.25 833,612
Second interim Rs. 4.75 1,218,356
Third interim Rs. 4.0 1,179,881
Transfer to reserve for issue of
bonus shares 827,199
4,059,048
Un-appropriated profit carried forward 1,292,749
1 6

Contribution to the National
Exchequer
The Company’s contribution to the
National Exchequer by way of taxes,
levies, excise duty, sales tax and gas
surcharge amounted to Rs 9.446
billion during the year. The total
contribution to the Exchequer since
inception now exceeds Rs. 61 billion.
Company’s contribution of Rs. 15.74
billion to the national economy by
way of value addition in 2004
increased by 5% over last year, in
addition to foreign exchange savings
of 544 million dollars through import
substitution on production of 2,174
thousand tonnes of urea fertilizer this
year.
VA L U E A D D I T I O N A N D D I S T R I B U T I O ND u r i n g 2 0 0 4
Government as taxes
Provider of capital
Shareholder as dividends
Rs. 15,740 Million
Employees as remuneration
Retained with the business
9,446
1,572
333
772
3,617
1 7

AGRICULTURE AND ECONOMIC ENVIRONMENT
Economy
The Country’s economy has exhibited
impressive growth for the second
consecutive year with real GDP growth
of 6.4% during 2003-2004 against 5.1%
growth in the previous period. Agriculture
is the largest sector with current
contribution of over 23 % to the GDP
and accounts for about 42% of the total
employed labour force. Out of nearly
five thousand industrial establishments
in the Country, about fifty eight percent
are related to agriculture through food
products, textile, leather, cotton yarn,
chemicals, fertilizers, pesticides,
agricultural machinery etc.
Agriculture Yields and Farmers’
Awareness
In order to achieve increased agriculture
productivity, the Country’s basic need
is realization of the full potential of our
natural resources (such as fertile land,
hardworking farmers, high yielding crop
varieties), in combination with modern
farming techniques, judicious regulation
of irrigation water and adequate supply
of indigenously manufactured fertilizers.
The Company devotes considerable
resources and efforts to promote
awareness regarding good farming
techniques and methods among our
farming community. This is done
systematically through timely
professional advice by holding regular
seminars and meetings, prolific
distribution of suitable literature and
radio/TV transmissions in the regional
languages.
The Company continues to enhance the
facility of providing farmers free farm
advisory services through Farm Advisory
Centers (FAC). These centres are
manned by well qualified agronomists
who extend free of cost and on the spot
services to the farmers in the form of
crop demonstrations, field days, farmers
meetings, group discussions, farm visits
and distribution of technical literature in
regional languages on important crops.
We have recently increased our advisory
centres from three to five by introducing
two new advisory centres one each at
D.I. Khan and Mirpur Khas. Farmers
are provided free soil and water testing
facility by our laboratories equipped with
state of the art equipment and
computerized recommendation systems.
Our advisory centre at Jhang is the only
private sector facility in the Country which
provides free micro nutrient testing
services to the farmers at their doorsteps.
Local seminars on production technology
and current crop situation concerning
rice/wheat sowing, cotton picking,
sugarcane harvesting etc are widely
held. Briefings about innovative
packages of technique adopted is also
carried out in situ on demo plots.
Interactive discussions in which the
farmers participate enthusiastically have
attained popularity throughout the
agrarian society. Among the vast variety
of subjects covered by the seminars and
meetings, our focus is on improving land
management, cropping techniques,
water availability, water conservation
techniques, alternative irrigation
methods, ways to increase area under
cultivation, enhancement of crop yield,
importance of soil/water analyses and
balanced plant nutrition through judicious
application of fertlizer.
FFC pursues an innovative education
oriented advertising policy utilizing
electronic/print media and roadside
advertising. FFC has also conducted
various international seminars on core
agricultural issues which were attended
by local and foreign luminaries.
1 8

1 9

Urea Market
Fertilizer is one of the key inputs to
agricultural production and is readily
available in the Country from local
producers at favourable rates as
compared to the international prices.
Prompted by high demand, the
fertilizer sector registered a growth
of 5% in urea offtake by selling 4,715
thousand tonnes of urea as
compared to 4,485 thousand tonnes
sold last year. The demand was
fuelled by increased farmer incomes
augmented by a bumper cotton crop,
improved crop prices and increased
liquidity through availability of
cheaper credit.
However, the demand surpassed
local production capacity due to
which the government had to import
179 thousand tonnes of urea to meet
the deficit. Industry urea output at
4,408 thousand tonnes was lower
than last year by 3% due to annual
maintenance turnarounds of six
fertilizer units including FFC’s Plants
I and II (Goth Machhi).
It is estimated that the Country's total
annual urea off-take during 2005
would be around 4,855 thousand
tonnes against estimated domestic
production of 4,508 thousand tonnes.
Establishment of new urea
production units is essential to reduce
growing urea imports.
The Fertilizer Policy 2001 is under
review by the Government aimed at
introducing more incentives for the
fertilizer industry to enhance
domestic urea production. Additional
investment to establish new fertilizer
manufacturing units is a dire
necessity to meet the ever growing
demand. Timely decision of changes
in the Fertilizer Policy would,
therefore, play a pivotal role in
meeting demand projections.
DAP Market
The DAP market also showed
increase of over 9% with an off-take
of 1,211 thousand tonnes during the
year of which 31% was contributed
by indigenously produced “Sona”
DAP by FFBL, while 836 thousand
tonnes were imported. The industry
carried DAP inventory of 53 thousand
tonnes at the end of 2004 compared
to 48 thousand tonnes at close of
2003.
Finance Bill 2004 reduced the GST
and withholding tax rates on DAP
to control high DAP prices. The
reduction in DAP sales price was,
however, short lived as the prices
moved up again due to increasing
DAP prices in the international
market and the deteriorating Rupee-
Dollar parity.
I N D U S T R Y U R E A M A R K E TS u p p l i e s v s D e m a n d
5,000
4,500
4,000
3,5001999 2000 2001 2002 2003 2004
Demand Supplies
000 tonnes
2 0

Our success depends upon effective automation, streamlining and integration of technical procedures.
Our success depends upon effective automation, streamlining and integration of technical procedures.
2 1
LISTING REGULATIONS AND CORPORATE GOVERNANCE
Compliance with listing
regulations
There have been no material
departures from the best practices
of corporate governance, as detailed
in the listing regulations. Appropriate
accounting policies have been
consistently applied, except change
in policy for accounting for investment
in associates, with which the Auditors
have concurred. Applicable
accounting standards were followed
in preparation of financial statements
of the Company and consolidated
financial statements on a going
concern basis for the financial year
ended December 31, 2004, which
present fairly the state of affairs,
results of its operations, profits, cash
flows and changes in equities of the
Company and its subsidiary for the
year under review.
Accounting estimates are based on
reasonable and prudent judgments
and there are no outstanding statutory
payments on account of taxes, duties,
levies and charges. Proper and
adequate accounting records have
been maintained by the Company in
accordance with the Companies
Ordinance, 1984. The Company’s
system of internal control is sound
in design and has been effectively
implemented and monitored for
safeguarding the assets of the
Company and for identifying,
evaluating and managing any
significant risks faced by the
Company.
As advised by the Audit Committee,
the Board is satisfied that the
Company has been in full compliance
with listing regulations of the Karachi,
Lahore and Islamabad Stock
Exchanges throughout the year.
Conformity with listing regulations
has also been stated in other relevant
parts of this report in addition to this
����������
Corporate governance
practices
Good governance has always been
viewed as an inspiration by the Board
in enhancing the timeliness, accuracy,
comprehensiveness and transparency
of financial and non-financial
information and the Board endorses
the practices contained in the code
of corporate governance of the listing
regulations in performance of the
Board’s duties and enforcement at
all management and non-
management levels.
We acknowledge our responsibility
for the overall strategy, assets
management and operations of the
Company and for identifying and
overcoming any challenges, business
and macroeconomic risks faced by
the Company and devising business
ventures for sustained growth in long
term profitability of the Company
aimed at enhancing the shareholders
���������
BOARD OF DIRECTORS
The Board comprises one executive
and twelve non-executive directors
of the Company who provide diverse
competencies and contribute
independent in-depth judgment to
matters brought before the Board.
The Chairman of the Board is from
non-executive directors while the
Chief Executive Officer is an executive
director and also heads the
Management of the Company in the
capacity of Managing Director.
2 2
The Board encourages effective
representation of independent non-
executive directors and minority
interests on the Board. Working or
whole time directors, including the
Chief Executive Officer, are less than
seventy-five percent of the elected
directors of the Company. Non-
executive directors include four
independent directors representing
institutional equity interest who
exercise outside judgment without
being subservient to any apparent
form of interference. These directors
have been nominated by the
institutions which they represent
through a resolution of their Board
of Directors.
No director of the Company is serving
as a director of more than ten other
listed companies except Mr. Tariq
Iqbal Khan, representing NIT, who
has been granted exemption by the
Securities and Exchange Commission
of Pakistan. All the directors are
registered tax payers in Pakistan
except Mr. Haldor Topsoe who is a
non-resident. None of them have been
convicted as a defaulter in payment
of any loan nor are they or their
spouses engaged in the business of
stock brokerage. The Board has
appended “Statement of Compliance
with the Code of Corporate
Governance” to this report, duly
reviewed and certified by the Auditors.
Change of Directors
The Board joins me in acknowledging
our appreciation for the participation
and contributions towards the affairs
of the Company by the outgoing
directors Mr. M Farooq Saleem,
Dr. Salim Batla, Mr. Hasan Aziz
Bilgrami and Mr. Khalid Amin Qureshi
during their respective terms.
We are also pleased to welcome Syed
Zaheer Ali Shah, Mr. Khawar Saeed,
Dr. Nadeem Inayat and Mr. Nadir
Rahman as fellow Board members.
We look forward to working in
partnership with them to benefit from
their vision and valued experiences
which I am confident will go a long
way in promoting the future growth
and prosperity of the Company.
2 3
RESPONSIBILITIES, POWERS AND FUNCTIONS OF BOARD OF DIRECTORS
The roles and responsibilities of the
Chairman and the Chief Executive
Officer are distinct, clearly defined
and formally documented and are
carried out separately by the two
offices. The Board exercises its
powers to carry out its fiduciary duties
with a sense of objective judgment
and independence in the best
interests of the Company and has
circulated a ‘Statement of Ethics and
Business Practices’ to establish a
standard of conduct, as a model
corporate citizen, for the Board and
employees of the Company. Each
year, the directors attend orientation
courses on their duties and
responsibilities to manage the affairs
of the Company on behalf of
shareholders; these courses are also
attended by the Management of the
Company.
The Board has also adopted mission
and vision statements and an overall
corporate strategy for the Company
and formulated policies including risk
management, procurement of goods
and services, marketing, terms of
credit and discount, acquisition and
disposal of fixed assets and write-off
of inventories, bad debts, loans and
advances, investments and
disinvestments of funds with maturity
period exceeding six months,
borrowings, donations, charities,
delegation of financial powers,
transactions with related parties, loans
and advances, human resource
management including succession
planning, health, safety and
environment, etc. Decisions on
material transactions or significant
matters are documented through
resolutions passed at their meetings
and circulated for approval.
The Board monitors the operations
of the Management through three
standing committees. Implementation
of the decisions, policies and
strategies along with maintenance of
their record have been delegated to
the Management under the
supervision of the Chief Executive
and Managing Director of the
Company and is executed and
controlled through management
committees.
MEETINGS OF THE BOARD
The Chairman presides over meetings
of the Board and encourages the
participation and contribution of
executive and non-executive directors.
The directors meet at least once in
each quarter. Additional meetings are
called upon when required. In 2004,
a total of seven meetings were held
which were also attended by the Chief
Financial Officer and the Company
Secretary. The Chief Financial Officer
and Company Secretary are
employees of the Company and are
not entitled to cast votes at the
meetings. Written notices of meetings
along with agenda and its details were
circulated seven days in advance.
Minutes of each meeting were
recorded and circulated by the
Company Secretary within thirty days.
Significant issues including approval
of quarterly, half yearly and annual
financial statements, annual business
plans, budgets, forecasts, cash flow
projections, performance monitoring,
internal audit reports, external
auditors’ recommendations,
agreements/contracts, amendment
of laws, agreement with staff union’s
Collective Bargaining Agent (CBA),
status of payment of debts and
obligations and repayment of loans,
findings and recommendations of
board committees etc, were placed
before the Board for information,
consideration and decision to
strengthen and formalize the
corporate decision-making process.
2 4

Importance of safe business practices, healthy employees and a stimulating environment have primacy over all business �������������
Importance of safe business practices, healthy employees and a stimulating environment have primacy over all business �������������
2 5

REPORTING
The Board places a high priority on completeness,
true and fair presentation and timely delivery of
its periodic financial statements and other financial
and non-financial information to the regulatory
authorities, the shareholders and other
stakeholders of the Company for assessing its
performance and forming business decisions.
Accordingly, periodic financial statements were
circulated to the directors duly endorsed by the
Chief Executive Officer and the Chief Financial
Officer for approval before publication. Quarterly
un-audited financial statements along with
Directors’ Review, were published within one
month while half yearly financial statements
reviewed by the Auditors were circulated within
two months of the end of the period. Annual
financial statements including consolidated
financial statements along with Auditors’ reports
and other statutory statements and information
are being circulated within two months from the
close of the financial year in compliance with
the listing regulations.
All material information relating to the business
and other affairs of the Company including
announcement of interim and final results, as
specified in the listing regulations, considered
to affect the shares market price during the year
were immediately disseminated to the stock
exchanges. The Company also determined a
closed period prior to each of the above decisions
and announcements which was also duly
communicated to all the stock exchanges.
The Company Secretary has furnished a
Secretarial Compliance Certificate as part of
annual return for the year 2003 with the Registrar
of Companies to certify that the secretarial and
corporate requirements of the Companies
Ordinance, 1984 have been duly complied with.
Company’s quarterly, half yearly and annual
reports are also available on the Company’s
website www.ffc.com.pk. Subsequent to a change
in the requirements of publishing quarterly
financial statements, the Company resolved
through a general meeting of its shareholders
2 6

to transmit its quarterly financial statements
through its website from September 2004
onwards. However, shareholders desirous of
obtaining hard copies would be provided printed
reports within one week of demand.
Excellence Awards
Our emphasis on timeliness, completeness and
transparency of information continues to earn
various awards.
It gives me a great pleasure to inform you that
this year we have been adjudged first in the
Manufacturing Sector for the “2003 Award of
Excellence for Corporate Reporting” by the
“South Asian Federation of Accountants (SAFA)”.
In addition, our Annual Report 2003 was selected
as the overall winner in the Annual Report
competition 2003, and was also adjudged best
in the chemical sector, jointly by the Institute of
Chartered Accountants of Pakistan and the
Institute of Cost and Management Accountants
of Pakistan. We are proud of the recognition of
our corporate reporting in 2003, both at home
and abroad, which is a singular honour for FFC,
the only Pakistani Company to have ever
received awards of excellence.
The Company has been able to further improve
its standing by securing first position for best
design, layout and graphics at the “Annual
International Graphic Print Material Exhibition
2004”, organized by the National Council of
Culture and Arts, Karachi.
The Company also continues to be the proud
winner of the Karachi Stock Exchange “Top 25
Companies Award” for listed companies for the
tenth consecutive year, and has further been
able to achieve recognition of the Rawalpindi
Chamber of Commerce and Industry for excellent
and meritorious performance in 2003.
The Company’s achievements are indeed a
reflection of our commitment to follow the listing
regulations and best corporate practices and
we are committed to maintain these honours.
Good governance has always been regarded as an inspiration and we are committed to ��������������������������������������
Good governance has always been regarded as an inspiration and we are committed to ��������������������������������������
2 7

BOARD COMMITTEES
Audit Committee
The directors have established an
Audit Committee comprising five
members, including the Chairman, all
of whom are non-executive directors
of the Company. The Committee
meets at least once every quarter of
the year prior to approval of interim
results of the Company by the Board
of Directors. Additional meetings are
held to review the business plans,
projections of the Company and other
matters as required or instructed by
the Board. During the year, the
Committee held five meetings and
minutes of these meetings were
circulated to all concerned.
The meetings were also attended by
the chief financial officer, the head of
internal audit and the external auditors
at which issues relating to accounts
and audit were discussed. During
these meetings, the Committee held
separate discussions with the internal
and external auditors without the
Management of the Company being
��������
The terms of reference of the Audit
Committee have been determined by
the Board in compliance with the
requirements of the Code of Corporate
Governance contained in the listing
regulations of the stock exchanges
and include matters relating to
safeguarding assets, monitoring
internal audit function, appointment
and remuneration of external auditors,
monitoring compliance with applicable
accounting standards /listing rules
and other duties assigned by the
Board.
Human Resources Committee
The Committee consists of four non-
executive directors and held two
meetings during the year. The role of
the Human Resources Committee is
to assist the Board of Directors in the
evaluation and approval of the
employee benefit plans, welfare
projects and retirement emoluments.
The Committee recommends any
adjustments which are fair and
required to attract/retain high calibre
staff.
System and Technology Committee
The System and Technology
Committee comprises four non
executive directors and is responsible
to provide assistance to the Board
on matters relating to safety, health,
environmental issues, technological
problems and operational risks. All
capital intensive technical projects
are reviewed by the System and
Technology Committee before final
approval of the Board. The Committee
held three meetings during the year.
MANAGEMENT
The Management has been entrusted
with ensuring smooth operations of
the Company and achieving the
objectives of the strategies adopted
by the Board and flow of quality and
timely information between the
Management and the Board to
facilitate the decision making process.
The Management operates under
authorized limits for procurement of
goods and services and has been
delegated financial powers for
approving transactions. It is also
responsible for preparation of budgets,
projections etc., monitoring control
and reporting deviations to the Board.
2 8

We aim to enhance ��������������standards through development of intellectual and creative potential of ����������resource.
We aim to enhance ��������������standards through development of intellectual and creative potential of ����������resource.
2 9

Executive Committee
The Executive Committee comprises
six members from the Management
of the Company and is responsible
for the management of the business
and affairs of the Company as
delegated by the Board and for
dealings on the Board’s behalf with
matters of urgent nature when the
Board of Directors is not in session
and any other duty delegated by the
Board. The Committee met on
required basis during the year.
Business Strategy Committee
Business Strategy Committee reviews
the strategy for the Company as
delegated to it by the Board. The
Committee is responsible for
remaining abreast with developments
and trends in the Industry which assist
the Committee in planning for future
capital intensive investments and
growth of the Company.
This Committee is also chaired by
the Chief Executive and Managing
Director of the Company and is
composed of members of
Management of the Company. The
Committee met on required basis
during the year.
INTERNAL AUDIT
The Board is responsible for effective
implementation of a sound internal
control system including compliance
with control procedures, safeguarding
of assets and risk management which
is implemented at all levels within the
Company and monitors the
performance of the Internal Audit
Department through the Audit
Committee. The scope of the
department has been defined by the
Audit Committee and the department
head has access to the Chairman of
the Audit Committee. Internal audit
reports were regularly furnished to
the Audit Committee and also
provided to the external auditors for
their review.
Internal audit is an independent in-
house function headed by a full-time
employee of the Company.
3 0

EXTERNAL AUDITORS
The external auditors of the Company,
Taseer Hadi Khalid and Company,
Chartered Accountants have been
given a satisfactory rating under the
Quality Control Review Programme
of the Institute of Chartered
Accountants of Pakistan (ICAP) and
the firm is fully compliant with the
International Federation of
Accountants' (IFAC) Guidelines on
Code of Ethics, as adopted by
the ICAP.
Neither the Chief Executive Officer,
nor the Chief Financial Officer, Internal
Auditor or any director of the
Company were partners, employees
or close relatives of partners or
employees of the firm of the external
auditors at any time during the last
two years.
The auditors attended the general
meetings of the Company during the
year and have confirmed attendance
of the 27th Annual General Meeting
of the Company scheduled for
February 28, 2005, at which audited
financial statements of the Company
and consolidated financial statements
of the Company and FFBL, for the
financial year 2004, shall be placed
for consideration and approval of
shareholders. The Auditors have also
confirmed that neither their firm nor
any of their partners, their spouses
or minor children at any time during
the year, held or traded in shares of
the Company or its subsidiary.
Services provided in addition to audit
during the year were non
management in nature and were
provided in accordance with the listing
regulations, observing applicable IFAC
guidelines.
The Auditors have completed their
assignment for the financial year
ended December 31, 2004 and shall
retire on the conclusion of the 27th
Annual General Meeting. Being
eligible for reappointment under the
listing regulations, they have offered
their services as Auditors of the
Company for the financial year 2005
on the same terms and conditions,
and based on the Audit Committee’s
proposal, the Board recommends their
reappointment for the ensuing year.
3 1

MARKETING
Ever since inception, the Company
has been operating nationwide, being
the leading fertilizer company
marketing its products in all parts of
the Country. The marketing network
is divided into three sales zones,
fourteen sales regions and sixty five
sales districts, manned by
professionals who market both prilled
and granular “Sona” urea, di-
ammonium phosphate (DAP),
sulphate of potash (SOP) and triple
super phosphate (TSP) through more
than 3,600 well trained Company
dealers all over Pakistan.
Owing to seasonality of fertilizer
consumption, the Company has also
developed a well planned network of
170 field warehouses in the Country
with a capacity of 367 thousand
tonnes to ensure that fertilizer supplies
to the farmers remain uninterrupted
especially during the peak
consumption months. “Sona” urea
prilled and “Sona” urea granular are
also dispatched directly from plantsites
to meet immediate demand and
ensure prompt delivery.
The Company was able to achieve
a record domestic urea sale of 2,376
thousand tonnes, which included 85
thousand tonnes of purchased urea
and was 13% in excess of sales last
year as compared to a 5 % growth
registered by the Industry. The sale
represented 105% of our production
and we closed the year with only 5
thousand tonnes of urea out of 31
thousand tonnes carried by the
industry.
Total urea offtake of 2,963 thousand
tonnes, including 580 thousand tonnes
of “Sona” - granular marketed on
behalf of FFBL, surpassed last year’s
sales by 11% and we were able to
improve our collective market share
to a record 63% as compared to 59%
achieved last year.
Fertilizer sales registered a record
3,491 thousand tonnes which included
DAP sales of 516 thousand tonnes,
of which 381 thousand tonnes
represented indigenously produced
“Sona” DAP by FFBL. Total fertilizer
sales by FFC recorded a growth of
11 % over last year while DAP market
participation of 43% was also attained.
3 2
U R E A S A L E S
2,500
2,000
1,500
1,000
500
01999 2000 2001 2002 2003 2004
000 tonnes

PLANTSITES
The year witnessed exceptional
performance at every level. Plant
operating efficiencies surpassed all
previous records with large margins.
Cost effective and professional
solutions were adopted to address
any major potential reliability threats.
Plants reliability improvement projects
remained of prime importance and
significant progress has been
achieved by addressing major
unreliable areas and chronic problems.
System implementation through
enforcement of FFC's operational,
maintenance, plant monitoring,
housekeeping and safety practices
remained in the lime-light and
deficiencies were overcome utilizing
the gap analysis approach.
The Company continued with selective
investments necessary to sustain
profitability, improve operations and
maintain its position as the leading
fertilizer manufacturer in the Country.
Plants I & II (Goth Machhi)
Operational performance of the Plants
I and II (Goth Machhi) was excellent
during the year with a total "Sona"
urea production of 1,458 thousand
tonnes. Plant I created a new record
of daily urea production this year.
Annual maintenance turnarounds of
both plants were carried out in the
first quarter of 2004 and were
executed safely and successfully
within the stipulated time.
Comprehensive inspections and major
overhauls of equipment and machines
were carried out in-house. Various
modification jobs were also executed
to improve operational efficiencies.
With on-going efforts to improve plant
reliability and performance,
maintenance turnarounds are now
scheduled on bi-annual basis.
The continuous decline in natural
gas supply pressure from Mari Gas
Field poses a new challenge with
a direct impact on production.
General water shortage in the
Country with frequent canal
closures and declining water flow
in the rivers in the past few years
has also put more strain on our
water supply wells. Dedicated
booster compressors have been
planned to be commissioned in the
first quarter of 2005 to boost gas
supply pressure and further
expansion of raw water resources
and its optimization is currently
underway to meet water
requirements.
In our endeavor for self-reliance in
areas of critical maintenance
activities, refurbishment of old
bimetallic stripper of Plant III (Mirpur
Mathelo) was successfully
completed in the fabrication shop
which made this expensive
equipment operational again at
Plant I. Detailed engineering of
Energy Revamp Project of Plant I
Ammonia Unit is under process
and commissioning is expected in
2006. This implementation would
result in an energy saving of 0.3
Gcal/MeT ammonia. Utilization of
the saved natural gas would also
result in 18 thousand tonnes of
additional urea production.
Evaluation of existing BFW heat
exchanger E-211 was carried out
for vibration and leakage
estimation. The exchanger has
completed its useful life and order
has been placed for a new
exchanger with modified design.
P R O D U C T I O N v s C A PA C I T Y 2 0 0 4
700,000
600,000
500,000
400,000
300,000
200,000
100,000
01st Qtr.
Tonnes
2nd Qtr. 3rd Qtr. 4th Qtr.
Production Capacity
3 3
U R E A P R O D U C T I O N
2,400
2,000
1,600
1,200
800
400
01999 2000 2001 2002 2003 2004
000 tonnes
Plants l&ll Plant lll Comb Plants l&ll Plant lll Comb
Plant III (Mirpur Mathelo)
Tapping the potential of our recently
acquired Plant III (Mirpur Mathelo)
has resulted in a noteworthy efficiency
of 125% of name plate capacity with
annual production of 716 thousand
tonnes, 14% in excess of last year’s
output.
We are pleased to report that the
Company was able to achieve the
required “Sona urea” quality level for
“FFC Urea” produced by the
Plant III, which was formally declared
as “Sona Urea” on March 03, 2004.
We are confident that benefits will
continue to accrue to the Company
by providing value added quality
products to our customers.
To fulfil our commitment with the GOP
for enhanced urea production, annual
maintenance turnaround of the plant
was deferred to 2005 after careful
technical review of efficiency
maintained during the period to meet
the increase in demand.
To meet its commitment to the
Government, FFC has also planned
de-bottlenecking of its Plant III for
increasing nameplate production
capacity to 725 thousand tonnes
annually in a normal operating year.
Almost all the piping isometrics of
Urea Hydrolyzer project have been
approved and most of the
piping/equipment erection work has
been completed. The project is ready
for commissioning after turnaround
2005 and will help reduce NH3
(Ammonia) contents of effluent water
and provide additional urea production
of 17 MTPD. Cooling tower packing
replacement for another two cells shall
be completed before the onset of next
summer season and is expected to
yield a saving of Rs. 12.50 million
per annum through improved energy
efficiency.
Information technology culture was
successfully inculcated at the plant
in order to reduce and simplify routine
workload and to keep pace with
modern technology. The landmarks
are modern fiber optic network, new
inventory management system and
computer training of all employees.
Technical Training
Our Technical Training Center at Goth
Machhi continues to extend
customized training services to other
companies including OMV Pakistan,
Pakistan Petroleum Ltd., Pakistan
Refinery Ltd. and Tullow Exploration
Pakistan. Craft Certificate Courses
were also conducted for local areas
as part of extension of technical
training to the local community.
Besides fulfilling the plant
requirements, services to surrounding
oil and gas companies and
maintenance engineering services to
OMV were also extended at their sites
as part of our professional
commitment to the community.
3 4

INVESTMENT IN FFBL
Our investment in FFBL has
commenced its pay back in the form
of returns through dividends. FFBL
has also announced its annual
financial results and it is encouraging
to note that through improved
profitability, consolidated earnings of
the Group have also increased over
last year and we are hopeful that profit
distributions would continue in the
future.
During the year, FFBL made a right
issue of 24.21 million shares. The
increase in share capital diluted the
Company’s holding in FFBL to 50.88%
as against 52.23% at the end of last
year. However, we have continued
to issue audited consolidated financial
statements of the Company and FFBL
in view of our sustained holding of
over 50% in FFBL. FFBL has issued
separate financial statements which
have been audited by the same
Auditors who have issued an
independent opinion on these
statements.
Sale of indigenous “Sona” DAP
production by FFBL improved
significantly over last year contributing
tremendously to the group’s
profitability.
OVERSEAS INVESTMENT (PAKISTAN MAROC PHOSPHORE – SA)
In order to ensure continuous supply
of phosphoric acid to FFBL, a project
is being setup in Morocco called
“Pakistan Maroc Phosphore – SA
(PMP)”. The project is being
sponsored collectively by Fauji
Foundation, FFCL and FFBL in
collaboration with OCP, Morocco.
Investment in PMP has been
approved by the shareholders of the
Company as proposed by the Board
of Directors in the Extraordinary
General Meeting held on
November 29, 2004.
The Company has recently remitted
the first tranche of Moroccan Dirhams
(MAD) 25 million, equivalent to Rs.
179 million, on account of 12.5%
investment share in PMP. Total
investment amounts to MAD 100
million which shall be injected upon
equity call by PMP.
The Company is restricted from
disposing the investment outside the
Fauji Group by the Shareholders
Agreement for a five years period
effective September 14, 2004. In case
of any legal restrictions on future
dividend distributions by PMP, the
investment is convertible into an
interest bearing loan.
3 5
PATTERN OF SHAREHOLDING
There were 4,841 Company shareholders as of December 31,
2004. Closely held shares (i.e. those held by the sponsors,
investment companies, financial institutions, foreign investors
and other corporate bodies) amount to 89% of the total shares
outstanding of which 3% were held by foreign shareholders.
Pattern of Shareholding No. of
Shares
National Investment Trust 29,616,765
Investment Corporation of Pakistan 1,709,245
Company Executives 306,665
Public Sector Companies and Corporations 8,742,796
Banks, Development Finance Institutions,
Non-Banking Finance Institutions,
Insurance Companies, Modarabas, Mutual Funds 46,491,728
Shareholders holding ten percent or
more voting interest - Fauji Foundation 130,811,580
Categories of No. of No. of %age
Shareholding shareholders shares held
Investment Companies 17 11,363,423 3.85
Insurance Companies 26 25,897,525 8.78
Joint Stock Companies 128 9,622,042 3.26
Financial Institutions 33 53,185,134 18.03
Modarabas 16 269,705 0.09
Foreign Investors 32 10,096,038 3.42
Leasing Companies 3 23,230 0.01
Charitable Trust & Others 103 153,286,225 51.97
Individuals 4,483 31,226,965 10.59
Total Shares 4,841 294,970,287 100.00
Ordinary shares of the Company are listed on the Karachi,
Lahore and Islamabad Stock Exchanges which continue to be
the driving force in maintaining the upward trend in the index.
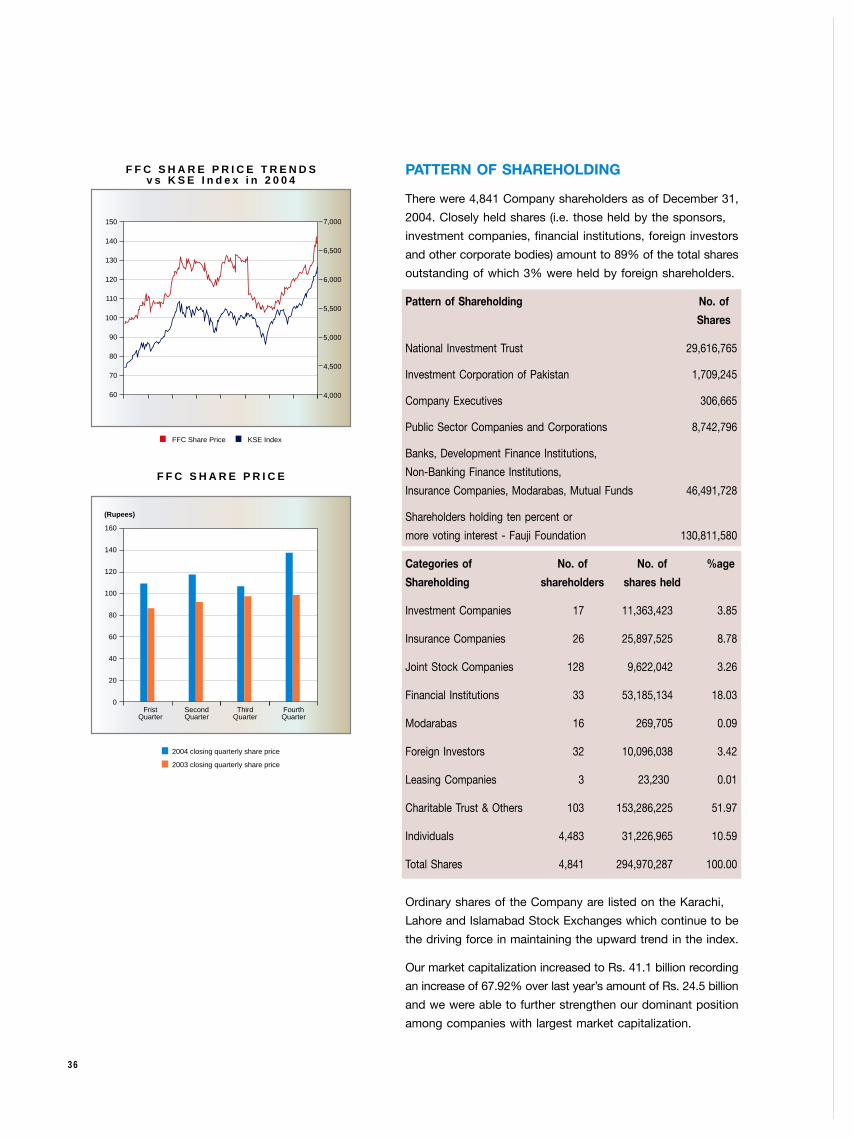
Our market capitalization increased to Rs. 41.1 billion recording
an increase of 67.92% over last year’s amount of Rs. 24.5 billion
and we were able to further strengthen our dominant position
among companies with largest market capitalization.
F F C S H A R E P R I C E T R E N D Sv s K S E I n d e x i n 2 0 0 4
150
140
130
120
110
100
90
80
70
60
7,000
6,500
6,000
5,500
5,000
4,500
4,000
FFC Share Price KSE Index
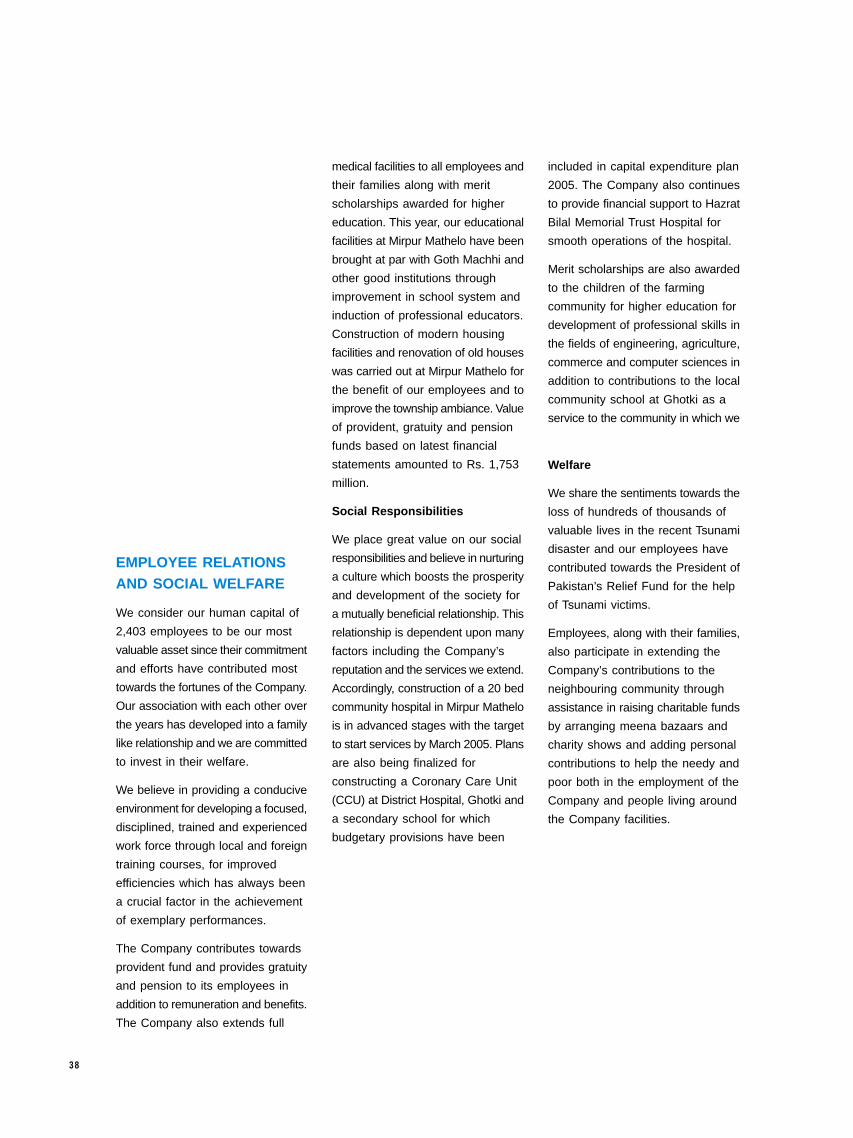
F F C S H A R E P R I C E
FristQuarter
SecondQuarter
ThirdQuarter
FourthQuarter
160
140
120
100
80
60
40
20
0
2003 closing quarterly share price
2004 closing quarterly share price
(Rupees)
3 6

Thorough research, ingenuity, skilful innovation stimulated by state of the art technology has resulted in efficient operational ������������
Thorough research, ingenuity, skilful innovation stimulated by state of the art technology has resulted in efficient operational ������������
3 7
EMPLOYEE RELATIONS AND SOCIAL WELFARE
We consider our human capital of
2,403 employees to be our most
valuable asset since their commitment
and efforts have contributed most
towards the fortunes of the Company.
Our association with each other over
the years has developed into a family
like relationship and we are committed
to invest in their welfare.
We believe in providing a conducive
environment for developing a focused,
disciplined, trained and experienced
work force through local and foreign
training courses, for improved
efficiencies which has always been
a crucial factor in the achievement
of exemplary performances.
The Company contributes towards
provident fund and provides gratuity
and pension to its employees in
addition to remuneration and benefits.
The Company also extends full
medical facilities to all employees and
their families along with merit
scholarships awarded for higher
education. This year, our educational
facilities at Mirpur Mathelo have been
brought at par with Goth Machhi and
other good institutions through
improvement in school system and
induction of professional educators.
Construction of modern housing
facilities and renovation of old houses
was carried out at Mirpur Mathelo for
the benefit of our employees and to
improve the township ambiance. Value
of provident, gratuity and pension
funds based on latest financial
statements amounted to Rs. 1,753
million.
Social Responsibilities
We place great value on our social
responsibilities and believe in nurturing
a culture which boosts the prosperity
and development of the society for
a mutually beneficial relationship. This
relationship is dependent upon many
factors including the Company’s
reputation and the services we extend.
Accordingly, construction of a 20 bed
community hospital in Mirpur Mathelo
is in advanced stages with the target
to start services by March 2005. Plans
are also being finalized for
constructing a Coronary Care Unit
(CCU) at District Hospital, Ghotki and
a secondary school for which
budgetary provisions have been
included in capital expenditure plan
2005. The Company also continues
to provide financial support to Hazrat
Bilal Memorial Trust Hospital for
smooth operations of the hospital.
Merit scholarships are also awarded
to the children of the farming
community for higher education for
development of professional skills in
the fields of engineering, agriculture,
commerce and computer sciences in
addition to contributions to the local
community school at Ghotki as a
service to the community in which we
���������
Welfare
We share the sentiments towards the
loss of hundreds of thousands of
valuable lives in the recent Tsunami
disaster and our employees have
contributed towards the President of
Pakistan’s Relief Fund for the help
of Tsunami victims.
Employees, along with their families,
also participate in extending the
Company’s contributions to the
neighbouring community through
assistance in raising charitable funds
by arranging meena bazaars and
charity shows and adding personal
contributions to help the needy and
poor both in the employment of the
Company and people living around
the Company facilities.
3 8

We are proud of our heritage.Efficiency, quality and hospitality are ingrained in our culture.
We are proud of our heritage.Efficiency, quality and hospitality are ingrained in our culture.
3 9

SAFETY, HEALTH AND ENVIRONMENT
Importance of safe practices, health
of employees and a highly conducive
environment cannot be
overemphasized; safety stewardship
and safe operations are ingrained in
our culture. The Company’s plants
operate under strict safety and
environmental controls with
immaculate monitoring.
The Company has obtained
certification for its Plants l & ll (Goth
Machhi) for international environment
standards, ISO-14001 and has further
been certified for international quality
standard, ISO 9001:2000 and
international safety standard, OHSAS-
18001. The Company has received
various awards of honour over the
years from National Safety Council,
U.S.A. which are the products of strict
compliance of plant safety standards
and reflect our corporate commitment
������������������
Progress has been achieved this year
in these critical areas including
improved environment through
rehabilitation of facilities. Development
of green belts and tree plantation for
a healthy and cleaner environment
has been undertaken in and around
our Mirpur Mathelo township.
Township has been given a new look
through extensive construction and
renovation work, a beautiful lush green
eco system and availability of clean
water through introduction of state of
the art polyethylene piping potable
water system.
Personnel safety has primacy over
all business requirements and we
remain fully committed to maintaining
the highest standards of health and
safety. Regular safety audits ensure
the compliance to safety and hygiene
standards. The Company achieved
the highest ever milestone of 23.46
million man-hours of safe operations
without loss time injury at Goth Machhi
in September 2004, which is reflective
of our safe practices.
Completion of first one million safe
man hours at Mirpur Mathelo and
changeover to environmental friendly
phosphate based cooling water
system are the main landmarks.
Promotion of safety culture through
training sessions on safety equipment
handling and emergency plan dry runs
����������
Product quality is accorded a high
priority and ISO-9002 certification for
“Sona” confirms the excellent
operational and maintenance skills
of the employees and their level of
performance.
4 0
FUTURE OUTLOOK AND WTO CHALLENGES
By the Grace of Allah since its
establishment FFC has performed
extremely well indeed. Short term
outlook appears encouraging with
significant projections for strong
demand for our fertilizers.
In the long term, the Company is
committed to achieve sustained levels
of operations at demonstrated
operating efficiencies through focus
on our fundamental strengths,
diversification and establishing
projects beyond the territorial limits
of the Country. Natural gas prices are
a key factor in developing the future
outlook along with farmer liquidity and
favourable weather conditions which
have a strong affect on the future
earnings of the Company. The most
important factor, however, is future
fertilizer demand which at the current
levels is surpassing the domestic
supply. With passage of time, this
deficit will increase further,
necessitating increased urea import.
This in turn demands enhancement
of indigenous production.
Work plans and schedules are being
finalized for proper execution of
Plant III’s turnaround 2005 within the
planned time frame and the
Management is confident that Phase-
1 of de-bottlenecking for capacity
enhancement of up to 125% shall be
�������������������
The expansion would result in
increased production to 725 thousand
tonnes per annum and we foresee
improved market share and
profitability for the Company which
would also leverage the shareholders
��������
We will continue to capitalize on our
intellectual prowess in enhancing
creativity and involving employees in
the development of the Company. We
have entered 2005 with a resolve to
further improve our performances and
setting new levels of excellence for
the Company and our stakeholders
through consolidation and better
management of our work force and
capital.
The increasing demand for fertilizer,
future dividend inflows from FFBL
and our sound financial position give
us the confidence to feel that the
Company is geared for a bright future.
WTO Challenges
Our quality product with international
certifications enables us to believe
that we are well equipped to face the
WTO challenges and “Sona” would
continue to be the preferred brand in
the Country.
The Management feels that WTO
implications would not have a negative
impact on the Company’s overall
operations.
4 1

CONCLUSION
Our employees’ consistent dedication,
toil and commitment have brought
outstanding achievements for the
Company and the Board of Directors
vision and expertise has contributed
in strategies to add value and
dynamism to the fortunes of the
Company.
We proudly translate our acronym
FFC also to mean “Farmer Friendly
Culture”. This is reflected in our
marketing strategy and efficient
function of the Farm Advisory Centres
which provide free advice and services
to our agrarian community at its
doorstep. Growth is the essence of
life; we believe that the Company’s
growth depends upon the growth of
our agrarian partners – the
hardworking farmers.
We look forward to presenting our
achievements to the shareholders in
the forthcoming general meeting. We
are extremely thankful for the trust
and faith reposed by them in the Board
as well as the Management of the
Company. Their support gives us
confidence and encouragement in
achieving the targets and strategies
formulated by the Board and gives
meaning to our efforts.
On behalf of the Board, I would also
like to express profound gratitude to
the GOP, to our valued customers/
business partners, Mari Gas Company
Limited, dedicated employees and
dynamic Management for their
outstanding support, effort and
leadership respectively which have
enabled FFC to prosper and achieve
exemplary results for the year 2004.
We look forward to continued
commitment of all stakeholders for
future progress of the Company.
CHAIRMAN
Lt Gen Syed Muhammad Amjad
HI, HI(M), Retired
Rawalpindi:
January 31, 2005
We are resolved to attain new levels of excellence with continued professional commitment, dedication �������������
We are resolved to attain new levels of excellence with continued professional commitment, dedication �������������
4 2

Code of ConductOur Code is built on a set of shared values
based on principles of honesty, integrity,
diligence, truthfulness and honour.
Core ValuesAt FFC we seek uncompromising integrity
through what each individual can contribute—
to our customers, our fellow employees, our
Company and our Country.
Our business success is dependent on
trusting relationships. Our reputation is
founded on the personal integrity of the
Company's personnel and our commitment
to our principles of:
honesty in communicating within the
Company and with our business
partners, suppliers and customers, while
at the same time protecting the
Company's confidential information and
�������������
excellence in our products and services,
by striving to provide high-quality
products and services to our customers
responsibility for our words and actions
compassion in our relationships with our
employees and the communities affected
by our business
fairness to our fellow employees,
stakeholders, business partners,
customers and suppliers through
adherence to all applicable laws,
regulations and policies, and a high
standard of behaviour
respect for our fellow employees,
stakeholders, business partners,
customers and suppliers while showing
willingness to solicit their opinions and
value their feedback
4 3

Growth is the essence of life.
4 4


46 F A U J I F E R T I L I Z E R C O M P A N Y L I M I T E D
This statement is being presented to comply with the Code of Corporate Governance contained in the listing regulations
of Karachi, Lahore and Islamabad Stock Exchanges for the purpose of establishing a framework of good governance,
whereby a listed company is managed in compliance with the best practices of corporate governance.
The Company has applied the principles contained in the Code in the following manner:
1. The Company encourages representation of independent non-executive directors and directors representing
minority interests on its Board of Directors. At present the Board includes at least 5 independent non-
executive directors, 1 executive director and 1 director representing minority shareholders.
2. The directors have confirmed that none of them is serving as a director in more than ten listed companies,
except Mr Tariq lqbal Khan for whom relaxation has been obtained by NIT and communicated to us vide
NIT's letter No. NIT/CG-05/FFCL/01975 dated January 18, 2005.
3. All the resident directors of the Company are registered as taxpayers and none of them has defaulted in
payment of any loan to a banking company, a DFI or an NBFI or, being a member of a stock exchange,
has been declared as a defaulter by that stock exchange.
4. Casual vacancies occurred in the Board during the year 2004 were filled up within 30 days of occurrence.
5. The Company has prepared a 'Statement of Ethics and Business Practices', which has been signed by all
the directors and employees of the Company.
6. The Board has developed a vision / mission statement, overall corporate strategy and significant policies
of the Company. A complete record of particulars of significant policies along with the dates on which they
were approved or amended has been maintained.
7. All the powers of the Board have been duly exercised and decisions on material transactions, including
appointment and determination of remuneration and terms and conditions of employment of the CEO have
been taken by the Board.
8. The meetings of the Board were presided over by the Chairman and the Board met at least once in every
quarter. Written notices of the Board meetings, along with agenda and working papers, were circulated at
least seven days before the meetings. The minutes of the meetings were appropriately recorded and
�����������
9. The Board arranged One orientation course for its directors during the year 2004 to apprise them of their
duties and responsibilities.
10. Officers having positions of CFO, Company Secretary and Head of Internal Audit were appointed prior to
the implementation of the Code of Corporate Governance. Terms of appointment, including remuneration
in case of future appointments on these positions will be approved by the Board.
Statement of ComplianceWith the Code of Corporate Governance

47A N N U A L R E P O R T 2 0 0 4
11. The directors' report for this year has been prepared in compliance with the requirements of the Code and
fully describes the salient matters required to be disclosed.
12. The financial statements of the Company were duly endorsed by CEO and CFO before approval of the Board.
13. The directors, CEO and executives do not hold any interest in the shares of the Company other than that
disclosed in the pattern of shareholding.
14. The Company has complied with all the corporate and financial reporting requirements of the Code.
15. The Board has formed an audit committee. It comprises Five members, who all are non-executive directors
including the chairman of the committee.
16. The meetings of the audit committee were held at least once every quarter prior to approval of interim and
final results of the Company and as required by the Code. The terms of reference of the committee have
been formed and advised to the committee for compliance.
17. The Board has set-up an effective internal audit function who are considered suitably qualified and
experienced for the purpose and are conversant with the policies and procedures of the Company and they
are involved in the internal audit function on a full time basis.
18. The statutory auditors of the Company have confirmed that they have been given a satisfactory rating under
the quality control review programme of the Institute of Chartered Accountants of Pakistan, that they or
any of the partners of the firm, their spouses and minor children do not hold shares of the Company and
that the firm and all its partners are in compliance with International Federation of Accountants (IFAC)
guidelines on code of ethics as adopted by Institute of Chartered Accountants of Pakistan.
19. The statutory auditors or the persons associated with them have not been appointed to provide other services
except in accordance with the listing regulations and the auditors have confirmed that they have observed
IFAC guidelines in this regard.
20. We confirm that all other material principles contained in the Code have been complied with.
Dated: January 31, 2005 Lt Gen Mahmud Ahmed, HI(M) (Retired)
Place: Rawalpindi Chief Executive & Managing Director
Statement of Compliance With the Code of Corporate Governance

48 F A U J I F E R T I L I Z E R C O M P A N Y L I M I T E D
Review Report to The Members on Statement of ComplianceWith Best Practices of Code of Corporate Governance
We have reviewed the Statement of Compliance with best practices contained in the Code of Corporate Governance
prepared by the Board of Directors of Fauji Fertilizer Company Limited, ("the Company") to comply with the Listing
Regulations of the Karachi, Lahore and Islamabad Stock Exchanges where the Company is listed.
The responsibility for compliance with the Code of Corporate Governance is that of the Board of Directors of the
Company. Our responsibility is to review, to the extent where such compliance can be objectively verified, whether
the Statement of Compliance reflects the status of the Company’s compliance with the provisions of the Code
of Corporate Governance and report if it does not. A review is limited primarily to inquiries of the Company personnel
and review of various documents prepared by the Company to comply with the Code.
As part of our audit of financial statements we are required to obtain an understanding of the accounting and
internal control systems sufficient to plan the audit and develop an effective audit approach. We have not carried
out any special review of the internal control system to enable us to express an opinion as to whether the Board’s
statement on internal control covers all controls and the effectiveness of such internal controls.
Based on our review, nothing has come to our attention, which causes us to believe that the Statement of
Compliance does not appropriately reflect the Company’s compliance, in all material respects, with the best
practices contained in the Code of Corporate Governance.
Dated: January 31, 2005 TASEER HADI KHALID & CO.
Islamabad CHARTERED ACCOUNTANTS

49A N N U A L R E P O R T 2 0 0 4
Auditors' Report to The Members
We have audited the annexed balance sheet of Fauji Fertilizer Company Limited ("the Company") as at
December 31, 2004 and the related profit and loss account, cash flow statement and statement of changes in
equity together with the notes forming part thereof, for the year then ended and we state that we have obtained
all the information and explanations which, to the best of our knowledge and belief, were necessary for the
purposes of our audit.
It is the responsibility of the Company's management to establish and maintain a system of internal control, and
prepare and present the above said statements in conformity with the approved accounting standards and the
requirements of the Companies Ordinance, 1984. Our responsibility is to express an opinion on these statements
�������������������
We conducted our audit in accordance with the auditing standards as applicable in Pakistan. These standards
require that we plan and perform the audit to obtain reasonable assurance about whether the above said statements
are free of any material misstatement. An audit includes examining, on a test basis, evidence supporting the
amounts and disclosures in the above said statements. An audit also includes assessing the accounting policies
and significant estimates made by management, as well as, evaluating the overall presentation of the above said
statements. We believe that our audit provides a reasonable basis for our opinion and, after due verification, we
report that:
(a) in our opinion, proper books of account have been kept by the Company as required by the Companies
Ordinance, 1984;
(b) in our opinion:
(i) the balance sheet and profit and loss account together with the notes thereon have been drawn up
in conformity with the Companies Ordinance, 1984, and are in agreement with the books of account
and are further in accordance with accounting policies consistently applied except for the changes
as indicated in notes 3.7.2 and 3.15 with which we concur;
(ii) the expenditure incurred during the year was for the purpose of the Company's business; and
(iii) the business conducted, investments made and the expenditure incurred during the year were in
accordance with the objects of the Company;
(c) in our opinion and to the best of our information and according to the explanations given to us, the balance
sheet, profit and loss account, cash flow statement and statement of changes in equity together with
the notes forming part thereof conform with approved accounting standards as applicable in Pakistan,
and give the information required by the Companies Ordinance, 1984, in the manner so required and
respectively give a true and fair view of the state of the Company's affairs as at December 31, 2004 and
of the profit, its cash flows and changes in equity for the year then ended;
(d) in our opinion Zakat deductible at source under the Zakat and Ushr Ordinance, 1980 (XVIII of 1980), was
deducted by the Company and deposited in the Central Zakat Fund established under section 7 of that
��������������
(e) the financial statements for the year ended December 31, 2003 were audited by another firm of accountants
who have issued unqualified opinion thereon.
Dated: January 31, 2005 TASEER HADI KHALID & CO.
Islamabad CHARTERED ACCOUNTANTS

50 F A U J I F E R T I L I Z E R C O M P A N Y L I M I T E D
2004 2003Note (Rupees '000)
SHARE CAPITAL AND RESERVES
Share capital 4 2,949,703 2,564,959
Capital reserve 5 160,000 160,000
Reserve for issue of bonus shares 442,455 –
Revenue reserves 6 8,742,749 8,797,753
12,294,907 11,522,712
NON CURRENT LIABILITIES 7 2,868,403 4,556,886
DEFERRED TAXATION 8 2,407,000 2,522,000
CURRENT LIABILITIES
Trade and other payables 9 5,831,105 3,356,904
Interest and mark - up accrued 10 74,233 83,562
Short term borrowings 11 100,000 2,972,333
Current portion of long term: 7
- Financing 2,184,088 1,447,011
- Loan 1,741 1,740
- Murabaha 83,333 41,667
Taxation 598,297 329,910
Proposed dividend – 384,743
8,872,797 8,617,870
CONTINGENCIES AND COMMITMENTS 12
26,443,107 27,219,468
The annexed notes 1 to 40 form an integral part of these financial statements.
Balance Sheet

51A N N U A L R E P O R T 2 0 0 4
As at December 31, 2004
2004 2003Note (Rupees '000)
PROPERTY, PLANT AND EQUIPMENT 13 9,180,716 9,259,008
GOODWILL 14 1,778,464 1,883,079
LONG TERM INVESTMENTS 15 5,866,999 7,083,151
LONG TERM LOANS AND ADVANCES 16 67,328 63,920
LONG TERM DEPOSITS AND PREPAYMENTS 17 3,492 3,040
CURRENT ASSETS
Stores, spares and loose tools 18 1,727,309 1,686,980
Stock in trade 19 219,180 681,297
Trade debts 20 1,407,736 1,876,381
Loans and advances 21 86,368 63,982
Deposits and prepayments 22 24,633 23,111
Other receivables 23 560,895 560,526
Short term investments 24 4,464,157 2,200,845
Cash and bank balances 25 1,055,830 1,834,148
9,546,108 8,927,270
26,443,107 27,219,468
Chairman Chief Executive Director

52 F A U J I F E R T I L I Z E R C O M P A N Y L I M I T E D
Profit and Loss AccountFor the year ended December 31, 2004
2004 2003Note (Rupees '000)
Sales 26 21,027,030 21,034,629
Cost of sales 27 13,157,653 13,701,319
GROSS PROFIT 7,869,377 7,333,310
Distribution cost 28 1,766,652 1,851,170
6,102,725 5,482,140
Finance cost 29 372,949 520,838
Other operating expenses 30 560,494 488,206
5,169,282 4,473,096
Other operating income 31 933,762 457,413
NET PROFIT BEFORE TAXATION 6,103,044 4,930,509
Provision for taxation 32 2,099,000 1,786,000
NET PROFIT AFTER TAXATION 4,004,044 3,144,509
Earnings per share - basic and diluted (Rupees) 33 13.57 10.66
The annexed notes 1 to 40 form an integral part of these financial statements.
Chairman Chief Executive Director

53A N N U A L R E P O R T 2 0 0 4
Cash Flow StatementFor the year ended December 31, 2004
2004 2003Note (Rupees '000)
CASH FLOWS FROM OPERATING ACTIVITIES
Cash generated from operations 35 10,001,809 5,308,962
Finance cost paid (410,332) (548,999)
Income tax paid (1,945,613) (2,600,050)
Payment to gratuity fund (43,681) (25,932)
Payment to pension fund (27,321) (23,207)
Net cash from operating activities 7,574,862 2,110,774
CASH FLOWS FROM INVESTING ACTIVITIES
Fixed capital expenditure (627,157) (468,209)
Proceeds from sale of property, plant and equipment 21,180 15,203
Interest received 356,643 471,520
Investment in FFBL – (750,000)
Advance against equity investment in foreign company (179,300) –
Decrease in other investments 1,023,625 132,341
Dividends received from FFBL 475,233 –
Net cash from / (used in) investing activities 1,070,224 (599,145)
CASH FLOWS FROM FINANCING ACTIVITIES
Long term financing - proceeds 600,000 1,705,910
- repayments (1,453,859) (1,881,057)
Long term loans - repayments (1,740) (1,740)
Long term murabaha - repayments (83,333) (83,333)
Short term borrowings (2,872,333) (416,564)
Dividends paid (3,765,585) (2,260,303)
Net cash used in financing activities (7,576,850) (2,937,087)
Net increase / (decrease) in cash and cash equivalents 1,068,236 (1,425,458)
Cash and cash equivalents at beginning of the year 3,039,894 4,465,580
Effect of exchange rate changes 200 (228)
Cash and cash equivalents at end of the year 36 4,108,330 3,039,894
The annexed notes 1 to 40 form an integral part of these financial statements.
Chairman Chief Executive Director

54 F A U J I F E R T I L I Z E R C O M P A N Y L I M I T E D
Statement of Changes in EquityFor the year ended December 31, 2004
Reserve forShare Capital issue of General Fair value Unappropriated Totalcapital reserve bonus shares reserve adjustment profit
(Rupees '000)
Balance at December 31, 2002 2,564,959 160,000 – 8,000,000 (180,105) 218,203 10,763,057
Net profit for the year ended December 31, 2003 – – – – – 3,144,509 3,144,509
Reversal of fair value adjustment due to
restatement of investment in subsidiary at cost – – – – 180,105 – 180,105
Transfer to general reserve – – – 600,000 – (600,000) –
Dividends
First interim Rs 3.00 per share – – – – – (769,488) (769,488)
Second interim Rs 2.25 per share – – – – – (577,116) (577,116)
Third interim Rs 3.25 per share – – – – – (833,612) (833,612)
Final Rs 1.50 per share – – – – – (384,743) (384,743)
Balance at December 31, 2003 2,564,959 160,000 – 8,600,000 – 197,753 11,522,712
Net profit for the year ended December 31, 2004 – – – – – 4,004,044 4,004,044
Transfer from general reserve – – 827,199 (1,150,000) – 322,801 –
Dividends
First interim Rs 3.25 per share – – – – – (833,612) (833,612)
Second interim Rs 4.75 per share – – – – – (1,218,356) (1,218,356)
Third interim Rs 4.00 per share – – – – – (1,179,881) (1,179,881)
Bonus shares issued 384,744 – (384,744) – – – –
Balance at December 31, 2004 2,949,703 160,000 442,455 7,450,000 – 1,292,749 12,294,907
The annexed notes 1 to 40 form an integral part of these financial statements.
Chairman Chief Executive Director

55A N N U A L R E P O R T 2 0 0 4
Notes to the Financial StatementsFor the year ended December 31, 2004
1. STATUS AND NATURE OF BUSINESS
Fauji Fertilizer Company Limited ("the Company") is a public company incorporated in Pakistan under the Companies Act, 1913, (now the Companies Ordinance, 1984) and its shares are quoted on the Karachi, Lahore and Islamabad stock exchanges of Pakistan. The registered office of the Company is situated in Rawalpindi, Pakistan. The principal activity of the Company is manufacturing, purchasing and marketing of fertilizers and chemicals, including investment in other fertilizer and chemical manufacturing operations.
2. STATEMENT OF COMPLIANCE
These financial statements have been prepared in accordance with approved accounting standards as applicable in Pakistan and the requirements of the Companies Ordinance, 1984. Approved accounting standards comprise of such International Accounting Standards as notified under the provisions of the Companies Ordinance, 1984. Wherever, the requirements of the Companies Ordinance, 1984 or directives issued by the Securities and Exchange Commission of Pakistan differ with the requirements of these standards, the requirements of the Companies Ordinance, 1984 or the requirements of the said directives �����������������
3. SUMMARY OF SIGNIFICANT ACCOUNTING POLICIES
3.1 Accounting convention
These financial statements have been prepared under the historical cost convention except that investments available for sale are measured at their fair value. The identifiable assets and liabilities of Pak Saudi Fertilizers Limited (PSFL) have been measured at their fair value on acquisition.
3.2 Retirement benefits
a) The Company has the following plans for its employees:
Funded Gratuity Scheme
Defined benefit funded gratuity for all eligible employees who complete qualifying period of service and age.
Funded Pension Scheme
Defined benefit funded pension for all eligible employees who complete qualifying period of service and age.
Contributory Provident Fund
Defined contributory provident fund for all eligible employees for which contributions are charged to profit and loss account.
These funds are administered by trustees. Annual contributions to the gratuity and management staff pension funds are based on actuarial valuation using Projected Unit Credit Method, related details of which are given in note 9.1 to the financial statements. All contributions are charged to profit and loss account for the year. Actuarial gains / losses in excess of corridor limit (10% of the higher of fair value of assets and present value of obligation) are recognised over the average remaining service life of the employees.
b) Compensated absences
The Company has the policy to provide for encashable compensated absences of its employees in accordance with respective entitlement on cessation of service; related expected cost thereof has been included in the financial statements.

56 F A U J I F E R T I L I Z E R C O M P A N Y L I M I T E D
Notes to the Financial StatementsFor the year ended December 31, 2004
3.3 Taxation
Provision for current taxation is based on taxable income at the current rates of taxation after taking into account tax credits and tax rebates, if any.
Deferred tax is accounted for using the balance sheet liability method in respect of all taxable temporary differences arising from differences between the carrying amount of assets and liabilities in the financial statements and the corresponding tax bases used in the computation of taxable profit. Deferred tax liabilities are recognised for all taxable temporary differences and deferred tax assets are recognised to the extent that it is probable that taxable profits will be available against which the deductible temporary differences, unused tax losses and tax credits can be utilised.
Deferred tax is calculated at the rates that are expected to apply to the period when the differences reverse, based on tax rates that have been enacted.
3.4 Property, plant and equipment and capital work in progress
Property, plant and equipment including those acquired on PSFL acquisition, are stated at cost less accumulated depreciation except freehold land and capital work in progress, which are stated at cost. Property, plant and equipment acquired on PSFL acquisition are stated at their cost to the Company, which represents their fair value on acquisition, less accumulated depreciation.
Depreciation is provided on a straight-line basis to write off the cost of an asset over its estimated useful life without taking into account any residual value. Full year's depreciation is charged on normal additions, while no depreciation is charged on items deleted during the year.
Maintenance and repairs are charged to profit and loss account as and when incurred. Major renewals and improvements are capitalised and the assets so replaced, if any, are retired. Gains and losses on disposal of assets, if any, are included in profit and loss account currently.
Initial fill of catalysts in the ammonia plant is capitalised with plant and machinery whereas costs of subsequent replacements of such catalysts are included in property, plant and equipment and depreciated on a straight line basis over their estimated useful lives.
3.5 Impairment
The carrying amount of the Company's assets are reviewed at each balance sheet date to identify circumstances indicating occurrence of impairment loss or reversal of previous impairment losses. If any such indications exist, the recoverable amounts of such assets are estimated and impairment losses or reversal of impairment losses are recognized in the profit and loss account. Reversal of impairment loss is restricted to the original cost of the asset.
3.6 Goodwill
On acquisition of an entity, difference between the purchase consideration and the fair value of the identifiable assets and liabilities acquired, is initially recognised as goodwill and amortised on a straight line basis over the estimated useful life of the acquired depreciable assets with reversal of related deferred tax liability.
3.7 Investments
3.7.1 Investment in subsidiary
Investments in subsidiaries are initially recognised at cost. At subsequent reporting dates, the recoverable amounts are estimated in order to determine the extent of impairment losses, if any, and carrying amounts of investments are adjusted accordingly. Impairment losses are recognised as expense. Where impairment losses subsequently reverse, the carrying amounts of the investments are increased to the revised recoverable amounts but limited to the extent of initial cost of investments. A reversal of impairment loss is recognised in profit and loss account.
57A N N U A L R E P O R T 2 0 0 4
Notes to the Financial StatementsFor the year ended December 31, 2004
3.7.2 Investment in associates
Investments are initially recognised at cost. At subsequent reporting dates, the recoverable amounts are estimated in order to determine the extent of impairment losses, if any, and carrying amounts of investments are adjusted accordingly. Impairment losses are recognised as expense. Where impairment losses subsequently reverse, the carrying amounts of the investments are increased to the revised recoverable amounts but limited to the extent of initial cost of investments. A reversal of impairment loss is recognised in profit and ���������������
Previously, the investments in associates were based on fair value method. Under the fair value method, such investments were initially recognised at cost and carried at fair value at the balance sheet date. Fair values of investments were determined on the basis of market value at the balance sheet date. Adjustment arising from remeasurement of investments to fair value was reflected through statement of changes in equity and was taken to profit and loss account on disposal of investments or when the investments were determined to be impaired. The policy has been changed to bring it in line with the Group's policy. This change in policy has no effect on the current or accumulated profits.
3.7.3 Investments available for sale
Investments available for sale are initially recognised at cost and at subsequent reporting dates are measured at their fair values. Gains or losses from changes in fair values, including the component of the change that relates to changes in foreign exchange rates in respect of investments in foreign currency, are recognised in the profit and loss account.
3.7.4 Investments held to maturity
Investments with fixed or determinable payments and fixed maturity, which the Company has the positive intent and ability to hold to maturity, are carried at amortised cost, using the effective interest rate method less impairment losses, if so determined.
3.8 Stores, spares and loose tools
These are valued at weighted average cost except for items in transit, which are valued at invoice price and related expenses incurred upto the balance sheet date. For items which are slow moving and / or identified as surplus to the Company's requirement, a provision is made for excess of book value over estimated realisable value.
3.9 Stock in trade
Stocks are valued at the lower of cost and net realisable value except for stock in transit which is valued at invoice price and related expenses incurred upto the balance sheet date.
Cost is determined as follows:
Raw materials at weighted average cost
Work in process ) at weighted average cost of purchases andFinished goods ) applicable manufacturing expenses
Net realisable value signifies the estimated selling price in the ordinary course of business less net estimated cost of completion and selling expenses.
3.10 Foreign currencies
Transactions in foreign currencies are recorded in the books at the rates of exchange prevailing on the date of transaction. Assets and liabilities in foreign currencies at the year end are translated into rupees at the rates prevailing on the balance sheet date. Exchange differences are included in the profit and loss account for the year.

58 F A U J I F E R T I L I Z E R C O M P A N Y L I M I T E D
Notes to the Financial StatementsFor the year ended December 31, 2004
3.11 Revenue recognition
Sales revenue is recognised at the time of despatch of goods to customers. Return on bank deposits and investments and interest on loans are accounted for on a time proportion basis using the applicable rate of return / interest. Scrap sales and miscellaneous receipts are recognised on realised amounts. Commission on sale of the subsidiary company products is recognised when such products are sold on its behalf. Dividend income is recognized when the right to receive the dividend is established.
3.12 Borrowing costs
Borrowing costs incurred upto the date of commencement of commercial production are capitalised. All other borrowing costs are recognised as an expense in the period in which these are incurred.
3.13 Provisions
Provisions are recognised when the Company has a present legal or constructive obligation as a result of past events, it is probable that an out flow of resources embodying economic benefits will be required to settle the obligation and a reliable estimate can be made of the amount of obligation.
3.14 Basis of allocation of common expenses
Selling and distribution expenses are allocated to the subsidiary company, in proportion to the sales volume handled on their behalf under the Inter Company Services Agreement.
3.15 Dividend appropriation
Dividend is recognized as a liability in the period in which it is declared. Upto previous year, dividends proposed after the balance sheet date but before the financial statements were authorised for issue were recorded as a liability. The change has been necessitated by revision in the 4th Schedule to the Companies Ordinance, 1984. Proforma information required under International Accounting Standard 8: "Net Profit or Loss for the Period, Fundamental Errors and Changes in Accounting Policies" is presented in note 38 to the financial statements.
3.16 Cash and cash equivalents
Cash and cash equivalents are carried in the balance sheet at cost. For the purpose of cash flow statement, cash and cash equivalents comprise cash in hand, cash with banks on current, saving and deposit accounts and other short term highly liquid investments that are readily convertible to known amounts of cash and which are subject to insignificant risk of change in value.
3.17 Related party transactions
All transactions involving related parties arising in the normal course of business are conducted at arm's length at normal commercial rates on the same terms and conditions as third party transactions using valuation modes, as admissible, except in extremely rare circumstances where, subject to the approval of the Board of Directors, it is in the interest of the Company to do so.
3.18 Offsetting
Financial assets and liabilities are offset and the net amount is reported in the balance sheet if the Company has a legally enforceable right to setoff the recognised amounts and the Company intends to settle either on a net basis or realise the asset and settle the liability simultaneously.

59A N N U A L R E P O R T 2 0 0 4
3.19 Financial instruments
Financial assets and financial liabilities are recognised when the Company becomes a party to the contractual provisions of the instrument and assets and liabilities are stated at fair value. The Company derecognises the financial assets and liabilities when it ceases to be a party to such contractual provisions of the instruments. The Company recognises the regular way purchase or sale of financial assets using settlement ����������������
a) Trade and other payablesLiabilities for trade and other payables are carried at cost which is the fair value of the consideration to be paid in the future for goods and services received.
b) Trade and other receivablesTrade and other receivables are recognised and carried at original invoice amount / cost less an allowance for any uncollectible amounts.
c) Derivative financial instrumentsAny gain or loss from remeasuring the hedging instrument at fair value is recognised in the profit and loss account.
d) Cash and bank balancesCash in hand and at banks are carried at cost.
3.20 Operating leases
Rentals payable under operating leases are charged to profit and loss account on a straight line basis over the term of the relevant lease.
4. SHARE CAPITAL 2004 2003
(Rupees '000) ISSUED, SUBSCRIBED AND PAID UP CAPITAL
2004 2003
256,495,902 256,495,902 Ordinary shares of Rs.10 each fully paid in cash 2,564,959 2,564,959
38,474,385 – Ordinary shares of Rs.10 each issued as fully paid bonus shares. 384,744 –
294,970,287 256,495,902 2,949,703 2,564,959
AUTHORISED SHARE CAPITAL
This represents 500,000,000 (2003: 300,000,000) ordinary shares of Rs 10 each.
4.1 Fauji Foundation held 44.35% (2003: 44.35%) ordinary shares of the Company at the year end.
Notes to the Financial StatementsFor the year ended December 31, 2004
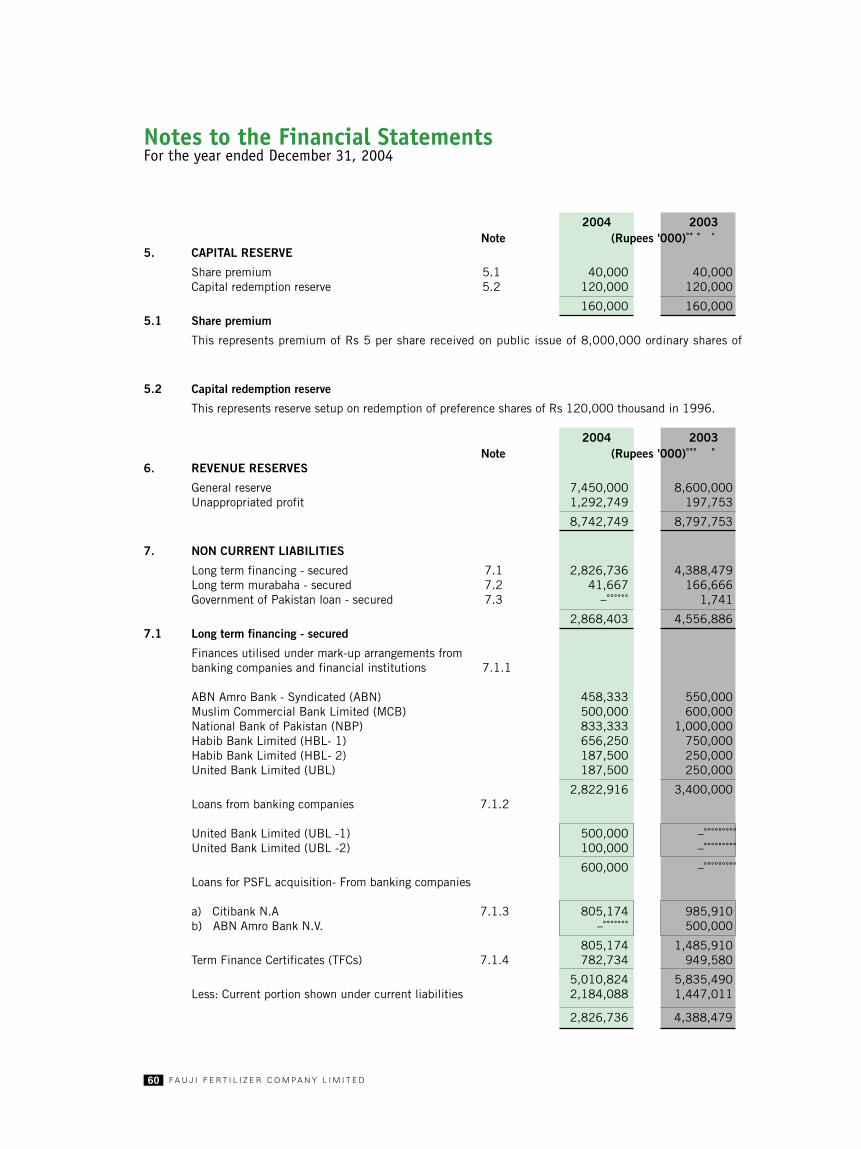
60 F A U J I F E R T I L I Z E R C O M P A N Y L I M I T E D
2004 2003 Note (Rupees '000)
5. CAPITAL RESERVE
Share premium 5.1 40,000 40,000 Capital redemption reserve 5.2 120,000 120,000
160,000 160,000 5.1 Share premium
This represents premium of Rs 5 per share received on public issue of 8,000,000 ordinary shares of �������������������
5.2 Capital redemption reserve
This represents reserve setup on redemption of preference shares of Rs 120,000 thousand in 1996.
2004 2003 Note (Rupees '000)
6. REVENUE RESERVES
General reserve 7,450,000 8,600,000 Unappropriated profit 1,292,749 197,753
8,742,749 8,797,753
7. NON CURRENT LIABILITIES
Long term financing - secured 7.1 2,826,736 4,388,479 Long term murabaha - secured 7.2 41,667 166,666 Government of Pakistan loan - secured 7.3 – 1,741
2,868,403 4,556,886 7.1 Long term financing - secured
Finances utilised under mark-up arrangements from banking companies and financial institutions 7.1.1
ABN Amro Bank - Syndicated (ABN) 458,333 550,000 Muslim Commercial Bank Limited (MCB) 500,000 600,000 National Bank of Pakistan (NBP) 833,333 1,000,000 Habib Bank Limited (HBL- 1) 656,250 750,000 Habib Bank Limited (HBL- 2) 187,500 250,000 United Bank Limited (UBL) 187,500 250,000
2,822,916 3,400,000 Loans from banking companies 7.1.2
United Bank Limited (UBL -1) 500,000 – United Bank Limited (UBL -2) 100,000 –
600,000 – Loans for PSFL acquisition- From banking companies
a) Citibank N.A 7.1.3 805,174 985,910 b) ABN Amro Bank N.V. – 500,000
805,174 1,485,910 Term Finance Certificates (TFCs) 7.1.4 782,734 949,580
5,010,824 5,835,490 Less: Current portion shown under current liabilities 2,184,088 1,447,011
2,826,736 4,388,479
Notes to the Financial StatementsFor the year ended December 31, 2004

61A N N U A L R E P O R T 2 0 0 4
7.1.1 Terms and conditions of long term finances are given below:
Lender Mark-up No of half- Date of finalrate p.a. yearly repayment
(%) instalmentsoutstanding
ABN 1 6 months Treasury Bill rate + 1.3 5 May 30, 2007MCB 6 months Treasury Bill rate + 1.3 5 May 30, 2007NBP 6 months Treasury Bill rate + 1.3 5 May 30, 2007HBL - 1 6 months Treasury Bill rate + 1.3 7 May 30, 2008HBL - 2 6 months Treasury Bill rate + 1.0 6 January 1, 2008UBL 6 months Treasury Bill rate + 1.0 6 January 1, 2008
All the above finances are secured by an equitable mortgage on the assets of the Company and hypothecation of all assets including plant, machinery, tools and spares, and all other moveable properties situated at Goth Machhi including stocks and book debts ranking pari passu with each other and with long term loans.
7.1.2 Terms and conditions of long term loans from banking companies are given below:
Lender Annual Repayment Date of finalinterest due repaymentrate (%)
UBL - 1 3.50 On maturity May 31, 2006UBL - 2 4.50 On maturity November 02, 2006
UBL - 1
This loan is secured against Pakistan Investment Bonds having face value of Rs. 500,000 thousand registered with the UBL's SGL account with the State Bank of Pakistan and ranking charge over plant and machinery amounting to Rs. 167 million.
UBL - 2
This loan is secured against Pakistan Investment Bonds having face value of Rs. 100,000 thousand registered with the UBL's SGL account with the State Bank of Pakistan.
7.1.3 Citibank N.A
This medium term loan was obtained for acquisition of PSFL. This represents US Dollar loan disbursed in Pak Rupees at the exchange rate prevailing on the date of disbursement and is secured against lien on Government of Pakistan Special US Dollar Bonds. The interest, payable half-yearly, as well as principal are to be repaid in equivalent amounts of local currency by applying the exchange rate prevailing on the respective payment dates. This loan carries interest at six months LIBOR + 3.1% p.a. Principal and interest are payable in half yearly instalments. The final repayment date is April 03, 2005.
7.1.4 Term Finance Certificates represent private placement with 3 institutional investors for periods ranging from 3 to 5 years. The annual rate of profit is State Bank of Pakistan discount rate plus 1.5% with a floor of 11% and cap of 16%. The principal amount of TFCs for 3 and 5 year tenure is to be repaid in 3 and 6 half-yearly instalments in arrears after a grace period of 18 months and 24 months respectively.
Notes to the Financial StatementsFor the year ended December 31, 2004

62 F A U J I F E R T I L I Z E R C O M P A N Y L I M I T E D
2004 2003(Rupees '000)
7.2 Long term murabaha - secured
Faysal Bank Limited (FBL) 125,000 208,333 Less: Current portion shown under current liabilities 83,333 41,667
41,667 166,666
The above murabaha financing carries mark-up at 4.5% p.a. Principal and mark-up are repayable in half yearly instalments upto May 31, 2007. This is secured by a registered charge on all present and future fixed and current moveable assets of the Company ranking pari passu with long term loans.
2004 2003(Rupees '000)
7.3 Government of Pakistan loan - secured
Government of Pakistan loan -5th Danish credit 1,741 3,481
Less: Current portion shown under current liabilities 1,741 1,740
– 1,741
This loan represents the onlent proceeds of credit obtained by the Government of Pakistan from an international agency.
This loan was disbursed in foreign currency and is repayable in local currency. Disbursements have been determined for repayment in Rupees by translation at the rates of exchange prevailing on the respective dates of disbursement. Interest on loan also includes the Government's exchange risk commission. The loan is to be secured by a mortgage in favour of the Government of Pakistan over the Company's fixed assets. This loan carries interest at 8.75% p.a. Principal and interest are payable in half yearly instalments. The final repayment date is October 01, 2005.
2004 2003Note (Rupees '000)
8. DEFERRED TAXATION
The balance of deferred tax is in respect of the following major temporary differences:
Accelerated depreciation (42,000) (108,000)Provision for slow moving / surplus spares, doubtful debts,
other receivables and short term investments (109,000) (79,000)Measurement to fair value of PSFL acquired fixed assets 2,558,000 2,709,000
2,407,000 2,522,000
9. TRADE AND OTHER PAYABLES
Creditors 490,354 249,474 Accrued liabilities 652,802 550,680 Payable to retirement benefits funds 9.1 – 14,659 Consignment account with FFBL 305,034 183,685 Other liabilities 14,131 12,780 Sales tax payable 319,168 323,431 Deposits 58,772 54,751 Retention money 14,742 12,443 Advances from customers 2,603,204 444,550 Workers' Profit Participation Fund 9.2 327,845 265,499 Workers' Welfare Fund 316,225 367,131 Unclaimed dividend 728,828 44,209 Dividend payable – 833,612
5,831,105 3,356,904
Notes to the Financial StatementsFor the year ended December 31, 2004
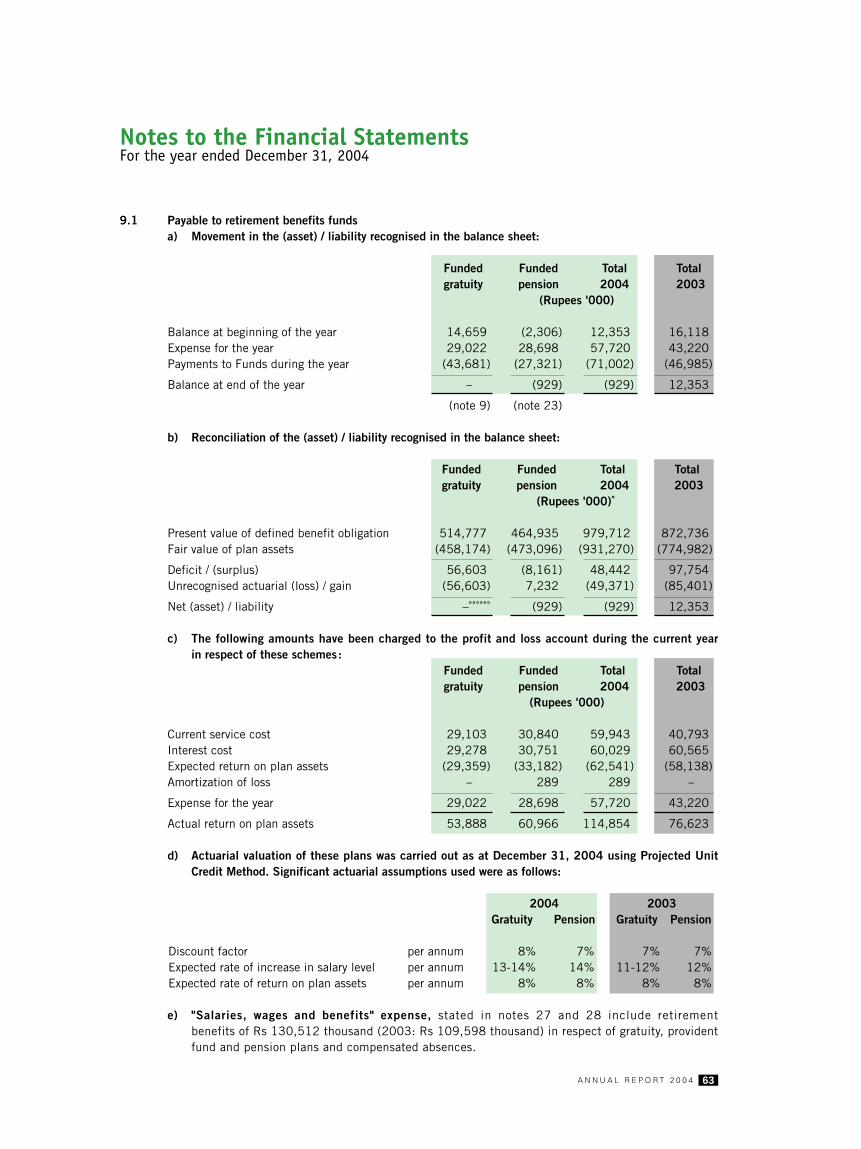
63A N N U A L R E P O R T 2 0 0 4
9.1 Payable to retirement benefits fundsa) Movement in the (asset) / liability recognised in the balance sheet:
Funded Funded Total Total gratuity pension 2004 2003
(Rupees '000)
Balance at beginning of the year 14,659 (2,306) 12,353 16,118 Expense for the year 29,022 28,698 57,720 43,220 Payments to Funds during the year (43,681) (27,321) (71,002) (46,985)
Balance at end of the year – (929) (929) 12,353
(note 9) (note 23)
b) Reconciliation of the (asset) / liability recognised in the balance sheet:
Funded Funded Total Total gratuity pension 2004 2003
(Rupees '000)
Present value of defined benefit obligation 514,777 464,935 979,712 872,736 Fair value of plan assets (458,174) (473,096) (931,270) (774,982)
Deficit / (surplus) 56,603 (8,161) 48,442 97,754 Unrecognised actuarial (loss) / gain (56,603) 7,232 (49,371) (85,401)
Net (asset) / liability – (929) (929) 12,353
c) The following amounts have been charged to the profit and loss account during the current year in respect of these schemes:
Funded Funded Total Total gratuity pension 2004 2003
(Rupees '000)
Current service cost 29,103 30,840 59,943 40,793 Interest cost 29,278 30,751 60,029 60,565 Expected return on plan assets (29,359) (33,182) (62,541) (58,138)Amortization of loss – 289 289 –
Expense for the year 29,022 28,698 57,720 43,220
Actual return on plan assets 53,888 60,966 114,854 76,623
d) Actuarial valuation of these plans was carried out as at December 31, 2004 using Projected UnitCredit Method. Significant actuarial assumptions used were as follows:
2004 2003Gratuity Pension Gratuity Pension
Discount factor per annum 8% 7% 7% 7%Expected rate of increase in salary level per annum 13-14% 14% 11-12% 12%Expected rate of return on plan assets per annum 8% 8% 8% 8%
e) "Salaries, wages and benefits" expense, stated in notes 27 and 28 include retirementbenefits of Rs 130,512 thousand (2003: Rs 109,598 thousand) in respect of gratuity, provident fund and pension plans and compensated absences.
Notes to the Financial StatementsFor the year ended December 31, 2004
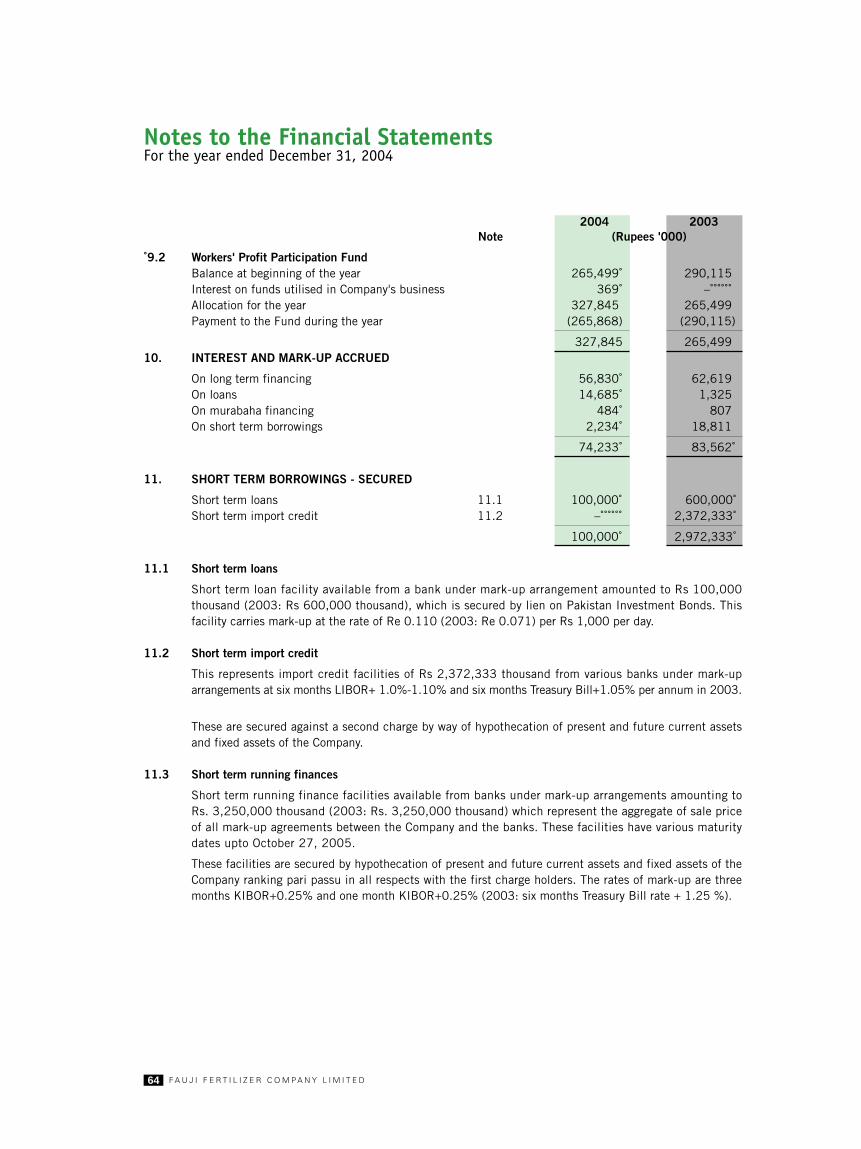
64 F A U J I F E R T I L I Z E R C O M P A N Y L I M I T E D
2004 2003Note (Rupees '000)
9.2 Workers' Profit Participation FundBalance at beginning of the year 265,499 290,115 Interest on funds utilised in Company's business 369 – Allocation for the year 327,845 265,499 Payment to the Fund during the year (265,868) (290,115)
327,845 265,499 10. INTEREST AND MARK-UP ACCRUED
On long term financing 56,830 62,619 On loans 14,685 1,325 On murabaha financing 484 807 On short term borrowings 2,234 18,811
74,233 83,562
11. SHORT TERM BORROWINGS - SECURED
Short term loans 11.1 100,000 600,000 Short term import credit 11.2 – 2,372,333
100,000 2,972,333
11.1 Short term loans
Short term loan facility available from a bank under mark-up arrangement amounted to Rs 100,000 thousand (2003: Rs 600,000 thousand), which is secured by lien on Pakistan Investment Bonds. This facility carries mark-up at the rate of Re 0.110 (2003: Re 0.071) per Rs 1,000 per day.
11.2 Short term import credit
This represents import credit facilities of Rs 2,372,333 thousand from various banks under mark-up arrangements at six months LIBOR+ 1.0%-1.10% and six months Treasury Bill+1.05% per annum in 2003.
These are secured against a second charge by way of hypothecation of present and future current assets and fixed assets of the Company.
11.3 Short term running finances
Short term running finance facilities available from banks under mark-up arrangements amounting to Rs. 3,250,000 thousand (2003: Rs. 3,250,000 thousand) which represent the aggregate of sale price of all mark-up agreements between the Company and the banks. These facilities have various maturity dates upto October 27, 2005.
These facilities are secured by hypothecation of present and future current assets and fixed assets of the Company ranking pari passu in all respects with the first charge holders. The rates of mark-up are three months KIBOR+0.25% and one month KIBOR+0.25% (2003: six months Treasury Bill rate + 1.25 %).
Notes to the Financial StatementsFor the year ended December 31, 2004

65A N N U A L R E P O R T 2 0 0 4
Notes to the Financial StatementsFor the year ended December 31, 2004
2004 2003 (Rupees '000)
12. CONTINGENCIES AND COMMITMENTS
a) Contingencies
i) Guarantees issued by banks on behalf of the Company. 26,828 15,659
ii) Demand in respect of import of duty-free first charge catalysts for the expansion unit, which matter has been decided in favour of the Company by the High Court of Sindh. This issue is currently pending in the Supreme Court on appeal filed by the Customs authorities. 179,000 179,000
iii) Disputed demand for Income tax and levy of contributionto Workers Welfare Fund related to former PSFL decided in favour of the Company by the Income Tax Appellate authorities, are currently in appeal by the department. The Company is confident that there are reasonablegrounds for a favourable decision. 295,590 295,590
iv) Income tax demands, not acknowledged as debt, havebeen challenged by the Company and are currentlyin appeal; the Company expects favourable outcomeof appeal. 66,000 96,000
v) Claims against the Company and / or potential exposurenot acknowledged as debt. 62,776 48,345
b) Commitments in respect of:
i) Capital expenditure-contracted 461,006 507,886
ii) Purchase of fertilizer, stores, spares and other revenue items. 254,212 182,266
iii) Commitment for equity investment in Pakistan Maroc Phosphore S.A. - note 15.2, Moroccan Dirhams 75,000thousand, equivalent approx. 545,903 –
iv) Rentals under lease agreements:
Premises - not later than one year 27,078 48,285 - later than one year and not later than five years
2006 19,059 16,499 2007 13,766 12,600 2008 13,276 12,574 2009 13,033 12,984
- later than five years 17,423 29,868
Vehicles - not later than one year 60,462 40,930 - later than one year and
not later than five years
2006 59,029 44,712 2007 52,529 43,140 2008 40,203 33,889 2009 34,264 22,477
- later than five years 5,513 10,761
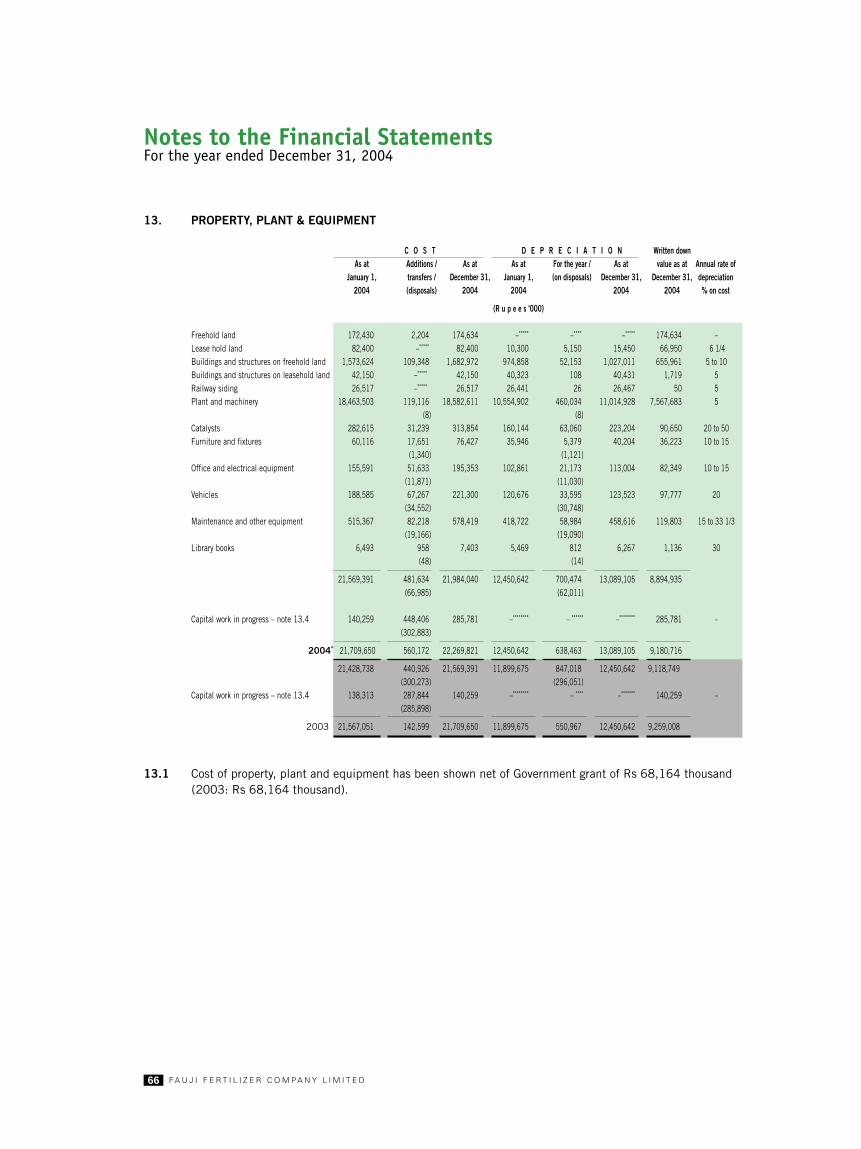
66 F A U J I F E R T I L I Z E R C O M P A N Y L I M I T E D
Notes to the Financial StatementsFor the year ended December 31, 2004
13. PROPERTY, PLANT & EQUIPMENT
C O S T D E P R E C I A T I O N Written downAs at Additions / As at As at For the year / As at value as at Annual rate of
January 1, transfers / December 31, January 1, (on disposals) December 31, December 31, depreciation2004 (disposals) 2004 2004 2004 2004 % on cost
(R u p e e s '000)
Freehold land 172,430 2,204 174,634 – – – 174,634 – Lease hold land 82,400 – 82,400 10,300 5,150 15,450 66,950 6 1/4Buildings and structures on freehold land 1,573,624 109,348 1,682,972 974,858 52,153 1,027,011 655,961 5 to 10 Buildings and structures on leasehold land 42,150 – 42,150 40,323 108 40,431 1,719 5 Railway siding 26,517 – 26,517 26,441 26 26,467 50 5 Plant and machinery 18,463,503 119,116 18,582,611 10,554,902 460,034 11,014,928 7,567,683 5
(8) (8)Catalysts 282,615 31,239 313,854 160,144 63,060 223,204 90,650 20 to 50 Furniture and fixtures 60,116 17,651 76,427 35,946 5,379 40,204 36,223 10 to 15
(1,340) (1,121)Office and electrical equipment 155,591 51,633 195,353 102,861 21,173 113,004 82,349 10 to 15
(11,871) (11,030)Vehicles 188,585 67,267 221,300 120,676 33,595 123,523 97,777 20
(34,552) (30,748)Maintenance and other equipment 515,367 82,218 578,419 418,722 58,984 458,616 119,803 15 to 33 1/3
(19,166) (19,090)Library books 6,493 958 7,403 5,469 812 6,267 1,136 30
(48) (14)
21,569,391 481,634 21,984,040 12,450,642 700,474 13,089,105 8,894,935(66,985) (62,011)
Capital work in progress – note 13.4 140,259 448,406 285,781 – – – 285,781 – (302,883)
2004 21,709,650 560,172 22,269,821 12,450,642 638,463 13,089,105 9,180,716
21,428,738 440,926 21,569,391 11,899,675 847,018 12,450,642 9,118,749 (300,273) (296,051)
Capital work in progress – note 13.4 138,313 287,844 140,259 – – – 140,259 – (285,898)
2003 21,567,051 142,599 21,709,650 11,899,675 550,967 12,450,642 9,259,008
13.1 Cost of property, plant and equipment has been shown net of Government grant of Rs 68,164 thousand (2003: Rs 68,164 thousand).

67A N N U A L R E P O R T 2 0 0 4
2004 2003 Note (Rupees '000)
13.2 Depreciation charge has been allocated as follows:
Cost of sales 27 683,860 829,866 Distribution cost 28 11,535 13,656 Charged to FFBL under Inter Company Services Agreement 5,079 3,496
700,474 847,018
13.3 Details of property, plant and equipment sold :Book Sale
Description Cost value proceeds
(Rupees '000)Vehicles
By Company policy to employees
Dr S.H.R Zaidi 996 199 442 Mr Taqi Ahmed Khan 734 147 300 Mr Muhammad Shuaib 863 173 354 Mrs Sadia Malik 734 147 300 Mr Tahir Jawed 892 178 365 Mr Ahsan Ali Zafar 540 108 261 Mr Sikandar Ali 175 123 142 Brig Umair Ahmed (Retd) 825 578 535 Mr Qaseem Arsal 450 315 315
By tender to outsiders
Mr Lal Muhammad 650 455 518 Mr Sohail Ahmed 300 211 290 Mr M. Hanif 225 158 140 Mr M. Nazir 300 210 438 Mr M. Nasir Khan 250 175 234 Mr Shams - ul - Kamar 100 70 146 Khawaja Mohammad Tariq 600 420 687 Mr Muhammad Arif 200 140 178
Furniture and fixtures, office and electrical equipment andmaintenance and other equipment
By Company policy to employee
Mr Aziz -ur-Rehman 148 74 74
Aggregate of other items of property, plant and equipmentwith individual book values not exceeding Rs 50 thousand 58,003 1,093 15,461
66,985 4,974 21,180
Notes to the Financial StatementsFor the year ended December 31, 2004

68 F A U J I F E R T I L I Z E R C O M P A N Y L I M I T E D
2004 2003 Note (Rupees '000)
13.4 CAPITAL WORK IN PROGRESS
Civil works 220,187 61,010 Plant, machinery and equipment 65,594 79,249
285,781 140,259 14. GOODWILL
Balance at beginning of the year 1,883,079 1,987,694 Less: Amortisation for the year 30 104,615 104,615
1,778,464 1,883,079 15. LONG TERM INVESTMENTS
Investment in subsidiary at cost 15.1
Fauji Fertilizer Bin Qasim Limited (FFBL) 4,752,330 4,572,225 Reversal of fair value adjustment due to restatement of investment at cost – 180,105
4,752,330 4,752,330 Advance against equity investment in foreign company 15.2Pakistan Maroc Phosphore S.A., Morocco Advance against issue of shares 179,300 –
Investments available for sale 15.3Certificates of investment 246,525 250,218 Government of Pakistan Special US Dollar Bonds 969,486 1,138,202 National Savings Certificates 500,000 1,000,000 Others 101,300 –
1,817,311 2,388,420
Investments held to maturity 15.4Pakistan Investment Bonds 700,000 700,000 Term Finance Certificates 20,355 148,380
720,355 848,380
7,469,296 7,989,130 Less: Current portion shown under short term investments 24
Investments available for saleCertificates of investment 12,456 76,746 Government of Pakistan Special US Dollar Bonds 969,486 201,208 National Savings Certificates 500,000 500,000
1,481,942 777,954 Investments held to maturityPakistan Investment Bonds 100,000 – Term Finance Certificates 20,355 128,025
120,355 128,025
1,602,297 905,979
5,866,999 7,083,151
Notes to the Financial StatementsFor the year ended December 31, 2004

69A N N U A L R E P O R T 2 0 0 4
15.1 Investment in subsidiary - quoted
Investment in subsidiary represents 475,233 thousand (2003: 475,233 thousand) fully paid ordinary shares of Rs 10 each representing 50.88% of FFBL share capital as at December 31, 2004 (2003: 52.23%). The dilution in holding is due to the right shares issued by FFBL during the year. The market value of the Company's investment as at December 31, 2004 was Rs 14,542,129 thousand (2003: Rs 8,364,101 thousand), whereas value based on net assets as per audited financial statements as at December 31, 2004 was Rs 3,635,888 thousand (2003: Rs 3,137,756 thousand).
15.2 Advance against equity investment in foreign company
The Company has committed 12.5% total equity participation in Pakistan Maroc Phosphore S.A. (PMP), amounting to Moroccan Dirhams (MAD) 100,000 thousand. First tranche of MAD 25,000 thousand equivalent to Rs 179,300 thousand has been remitted while the balance shall be paid upon further equity call by PMP.
According to the Shareholders' agreement, the Company cannot sell the shares of PMP outside Fauji Group (consisting of the Company, Fauji Foundation and FFBL) for a period of five years effective September 14, 2004. Further, if any legal restriction is laid on dividends by PMP, the same will be converted to interest bearing loan.
15.3 Investments available for sale
The Company has placements in certificates of investments of banks and financial institutions for periods ranging from one and a half to five years at profit rates ranging from 6% to 15% per annum (2003: 11% ������������������
Government of Pakistan Special US Dollar Bonds have been issued for a period of three years. Profit is payable on these bonds at a rate of 2% above six months LIBOR.
National Savings Certificates have been issued for a period of 5 years. Monthly profit is payable on these certificates at 14% per annum (2003: 14% to 16% per annum).
Other investments represent 10,000 thousand certificates of Rs 10 each in Shariah compliant closed end mutual fund. The fair value at the year end was Rs. 10.13 per certificate based on net asset value of the fund. Un-realised gain on re-measurement of these certificates to fair value amounting to Rs. 1,300 thousand is included in the profit and loss account.
Investments available for sale include Rs 1,345,568 thousand (2003: Rs 2,124,416 thousand) under lien of financial institutions against long term loans for PSFL acquisition and short term loans.
15.4 Investments held to maturity
PIBs have been issued for 5 to 10 years. Half-yearly profit is payable on these bonds at rates ranging from 11% to 14% per annum. These include Rs 700,000 thousand (2003: Rs 500,000 thousand) under lien of a bank against loan for PSFL acquisition. Fair value of these PIBs as at December 31, 2004 was Rs 703,970 thousand (2003: Rs 964,825 thousand).
Investment in TFC represents 500 certificates of Rs 100,000 each of Orix Leasing Limited. Half yearly profit is payable on these TFCs at 14% per annum (2003: 14% per annum). Fair value of TFCs of Orix Leasing Limited is Rs 20,827 thousand (2003: Rs 53,461 thousand).
Notes to the Financial StatementsFor the year ended December 31, 2004

70 F A U J I F E R T I L I Z E R C O M P A N Y L I M I T E D
2004 2003 Note (Rupees '000)
16. LONG TERM LOANS AND ADVANCES
Loans and advances, considered good, to:
Executives 65,266 39,712 Other employees 41,449 55,535
106,715 95,247 Less: Amount due within twelve months, shown under current loans and advances 21 39,387 31,327
67,328 63,920
16.1 Reconciliation of carrying amount of loans to executives and other employees:
Opening Disbursements Repayments Closing balance balance
as at January as at December1, 2004 31, 2004
(Rupees '000)
Executives 39,712 69,934 44,380 65,266 Other employees 55,535 40,386 54,472 41,449
95,247 110,320 98,852 106,715
These represent secured loans for house building, house rent advances and advances pursuant to agreement with workers which are repayable within one to ten years. Mark-up at 4% per annum (2003: 4% to 6% per annum) was charged on loans for house building during the year.
The maximum amount of advances to executives outstanding at the end of any month during the year was Rs 65,266 thousand (2003: Rs 58,680 thousand).
2004 2003 (Rupees '000)
17. LONG TERM DEPOSITS AND PREPAYMENTS
Deposits 2,452 1,872 Prepayments 1,040 1,168
3,492 3,040
18. STORES, SPARES AND LOOSE TOOLS
Stores 77,123 65,442
Spares 1,818,916 1,683,775 Provision for slow moving and surplus items (295,713) (203,226)
1,523,203 1,480,549 Loose tools 107 305 Items in transit 126,876 140,684
1,727,309 1,686,980
Notes to the Financial StatementsFor the year ended December 31, 2004

71A N N U A L R E P O R T 2 0 0 4
2004 2003 Note (Rupees '000)
19. STOCK IN TRADE
Raw materials 29,908 14,749 Work in process 10,192 21,410 Finished goods: Manufactured urea 22,384 542,436 Purchased fertilizers 156,696 102,702
219,180 681,297
20. TRADE DEBTS
Considered good 20.1 1,407,736 1,876,381 Considered doubtful 1,979 2,059
1,409,715 1,878,440 Provision for doubtful debts (1,979) (2,059)
1,407,736 1,876,381
20.1 This includes Rs 160 thousand (2003: Rs 18,162 thousand) due from Fauji Foundation, an associated undertaking. The maximum amount outstanding at the end of any month during the year was Rs 16,844 thousand (2003: Rs 20,276 thousand).
2004 2003Note (Rupees '000)
21. LOANS AND ADVANCES
Current portion of long term loans and advances 39,387 31,327 Advances to suppliers - considered good 46,981 32,655
86,368 63,982
22. DEPOSITS AND PREPAYMENTS
Deposits 1,422 2,750 Prepayments 23,211 20,361
24,633 23,111
23. OTHER RECEIVABLES
Accrued income on investments and bank deposits 48,927 43,680 Income tax recoverable 476,489 476,489 Receivable from retirement benefit fund - considered good 9.1 929 2,306
Other receivables - considered good 34,550 38,051 - considered doubtful 2,232 6,442
36,782 44,493 Provision for doubtful receivables (2,232) (6,442)
34,550 38,051
560,895 560,526
Notes to the Financial StatementsFor the year ended December 31, 2004

72 F A U J I F E R T I L I Z E R C O M P A N Y L I M I T E D
2004 2003 (Rupees '000)
24. SHORT TERM INVESTMENTS
Term deposits with banks and financial institutionsLocal currencyAvailable for sale (net of provision for doubtful recovery (Rs 13,000 thousand; 2003: Rs 13,000 thousand) 2,550,000 1,200,000 Foreign currency
Held to maturity 311,860 94,866 Current maturity of long term investments
Available for sale 1,481,942 777,954 Held to maturity 120,355 128,025
4,464,157 2,200,845 25. CASH AND BANK BALANCES
At banks:Deposit accounts
Local currency 499,333 810,813 Foreign currency – 297
Current accountsLocal currency (includes drafts under collection) 397,939 (20,934)Foreign currency 14,898 15,321
912,170 805,497 Drafts in hand and in transit 142,153 1,027,324 Cash in hand 1,507 1,327
1,055,830 1,834,148
Balances with banks include Rs 58,772 thousand (2003: Rs 54,751 thousand) in respect of security deposits received. Local currency deposit accounts include Rs 15,000 thousand (2003: Rs 15,000 thousand) under lien of the bank, against a guarantee issued by the bank on behalf of the Company.
26. SALES
Sales include Rs 3,379,630 thousand (2003: Rs 5,760,207 thousand) in respect of sale of purchased fertilizers and are exclusive of trade allowances and sales tax of Rs. 335,257 thousand and Rs 2,484,103 thousand respectively (2003: Rs 469,650 thousand and Rs 2,942,963 thousand respectively).
Notes to the Financial StatementsFor the year ended December 31, 2004

73A N N U A L R E P O R T 2 0 0 4
2004 2003 Note (Rupees '000)
27. COST OF SALES
Raw materials consumed 3,996,766 3,448,489Fuel and power 2,444,552 2,304,140Chemicals and supplies 114,750 105,663Salaries, wages and benefits 1,263,122 1,058,258Rent, rates and taxes 8,594 8,461Insurance 93,175 84,060Technical services 14,364 13,920Travel and conveyance 82,089 68,740Repairs and maintenance (includes stores and spares consumed of Rs 362,832 thousand; 2003: Rs 421,453 thousand) 487,116 547,321
Depreciation 13.2 683,860 829,866 Communication, establishment and other expenses 342,150 327,029 Provision for slow moving and surplus spares 92,487 51,501 Opening stock - work in process 21,410 12,312 Closing stock - work in process (10,192) (21,410)
Cost of goods manufactured 9,634,243 8,838,350
Add: Opening stock of manufactured urea 542,435 365,250
Less: Closing stock of manufactured urea (22,384) (542,436)
520,051 (177,186)
Cost of sales - own manufactured urea 10,154,294 8,661,164
Opening stock of purchased fertilizers 102,702 223,821 Purchase of fertilizers for resale 3,057,353 4,919,036
3,160,055 5,142,857 Less: Closing stock of purchased fertilizers (156,696) (102,702)
Cost of sales - purchased fertilizers 3,003,359 5,040,155
13,157,653 13,701,319
28. DISTRIBUTION COST
Product transportation 1,234,997 1,324,020 Salaries, wages and benefits 309,092 293,225 Rent, rates and taxes 49,381 52,501 Insurance 2,813 1,042 Technical services to farmers 3,050 2,461 Travel and conveyance 48,210 41,892 Sale promotion and advertising 37,865 45,412 Communication, establishment and other expenses 21,888 25,517 Warehousing expenses 47,821 51,444 Depreciation 13.2 11,535 13,656
1,766,652 1,851,170
Notes to the Financial StatementsFor the year ended December 31, 2004

74 F A U J I F E R T I L I Z E R C O M P A N Y L I M I T E D
2004 2003 (Rupees '000)
29. FINANCE COST
Interest and related charges on long term financing, loans and murabaha 290,061 426,163 Interest on Workers' Profit Participation Fund 369 – Mark up on short term finances 54,951 128,876 Exchange loss / (gain) on loans 24,461 (37,171)Bank charges 3,107 2,970
372,949 520,838
30. OTHER OPERATING EXPENSES
Amortisation of goodwill 104,615 104,615 Workers' Profit Participation Fund 327,845 265,499 Workers' Welfare Fund 126,021 113,965 Auditors' remunerationAudit fee 1,020 1,020 Fee for tax and other advisory services, half yearly review, audit of consolidated financial statements and funds and certifications for Government and related agencies 893 3,007 Out of pocket expenses 100 100
560,494 488,206
31. OTHER OPERATING INCOME
Income from financial assets
Income on loans, deposits and investments 316,356 362,990 Income on tax-exempt investments 45,534 36,629 Gain on re-measurement of investments available
for sale to fair value 1,300 – Exchange gain / (loss) on financial instruments 15,381 (19,013)
Income from subsidiary
Commission on sale of FFBL products 19,655 12,919 Dividend from FFBL 475,233 –
Income from non-financial assets
Gain on sale of property, plant and equipment 16,206 10,981 Other incomeOld liabilities written back 14,771 13,216 Others 29,326 39,691
933,762 457,413 32. TAXATION
Provision for taxation - current year 2,184,000 1,954,000 - prior year 30,000 – Deferred (115,000) (168,000)
2,099,000 1,786,000
Notes to the Financial StatementsFor the year ended December 31, 2004

75A N N U A L R E P O R T 2 0 0 4
2004 2003 % %
32.1 Reconciliation of tax charge for the year
Applicable tax rate 35.00 35.00 Add: Tax effect of amounts that are not
deductible for tax purpose 1.51 1.58 Tax effect of amounts relating to prior years' 0.49 –
Less: Tax effect of amounts exempt from tax (0.26) (0.35)Tax effect of amounts taxed at lower rates (2.34) – Tax effect of rebates and tax credit (0.01) (0.01)
Average effective tax rate charged on income 34.39 36.22
2004 2003 (Rupees '000)
33. EARNINGS PER SHARE
Net profit after tax (Rupees '000) 4,004,044 3,144,509
Weighted average number of shares in issue during the year 294,970 294,970
Basic and diluted earnings per share (Rupees) 13.57 10.66
There is no dilutive effect on the basic earnings per share of the Company.
Number of shares in issue during the year 2003 have been restated for the effect of bonus shares issued during the year 2004.
34. REMUNERATION OF CHIEF EXECUTIVE, DIRECTORS AND EXECUTIVES
The aggregate amounts charged in the accounts for the year for remuneration including benefits applicable to the chief executive, directors and executives of the Company are given below:
2004 2003 Chief Executives Chief Executives
Executive Executive(Rupees '000)
Managerial remuneration 2,021 308,026 1,831 233,114 Retirement benefits 623 42,907 964 29,055 Utilities and upkeep 609 19,256 572 15,248 Travel assistance 660 44,032 676 33,377 Bonus and other awards 110 28,035 100 30,853 Good performance award – 14,142 – 42,501 Others – 9,852 – 8,548
Total 4,023 466,250 4,143 392,696
No. of person(s) 1 198 1 155
The above were provided with medical facilities; the chief executive and certain executives were also provided with certain household equipment and use of vehicle in accordance with the Company's policy. Leave encashment of Rs Nil (2003: Rs 638 thousand) to chief executive and Rs 4,420 thousand (2003: Rs 3,755 thousand) to the executives was paid on separation, in accordance with the Company's policy.
In addition, 15 (2003: 15) directors were paid aggregate fee of Rs 186 thousand (2003: Rs. 138 thousand).
Notes to the Financial StatementsFor the year ended December 31, 2004

76 F A U J I F E R T I L I Z E R C O M P A N Y L I M I T E D
2004 2003(Rupees '000)
35. CASH GENERATED FROM OPERATIONS
Net profit before taxation 6,103,044 4,930,509 Adjustments for:
Depreciation 695,395 843,522 Amortisation of goodwill 104,615 104,615 Provision for slow moving and surplus spares 92,487 51,501 Provision for gratuity 29,022 25,932 Provision for pension 28,698 23,207 Finance cost 372,949 520,838 Income on loans, deposits and investments (361,890) (399,619)Gain on sale of property, plant and equipment (16,206) (10,981)Exchange gain 9,080 (18,158)Gain on re-measurement of available for sale investments to fair value (1,300) – Dividend from FFBL (475,233) – Old liabilities written back (14,771) (13,216)
462,846 1,127,641
6,565,890 6,058,150 Changes in working capital(Increase) / decrease in current assets:
Stores and spares (132,816) (120,108)Stock in trade 462,117 (50,489)Trade debts 468,725 (475,488)Loans and advances (22,386) (3,849)Deposits and prepayments (1,522) (855)Other receivables 7,711 32,854
Increase / (decrease) in current liabilities: Trade and other payables 2,657,950 (117,360)
3,439,779 (735,295)Changes in long term loans and advances (3,408) (13,783)Changes in long term deposits and prepayments (452) (110)
10,001,809 5,308,962
36. CASH AND CASH EQUIVALENTS
Cash and bank balances 1,055,830 1,834,148 Short term highly liquid investments 3,052,500 1,205,746
4,108,330 3,039,894
Notes to the Financial StatementsFor the year ended December 31, 2004
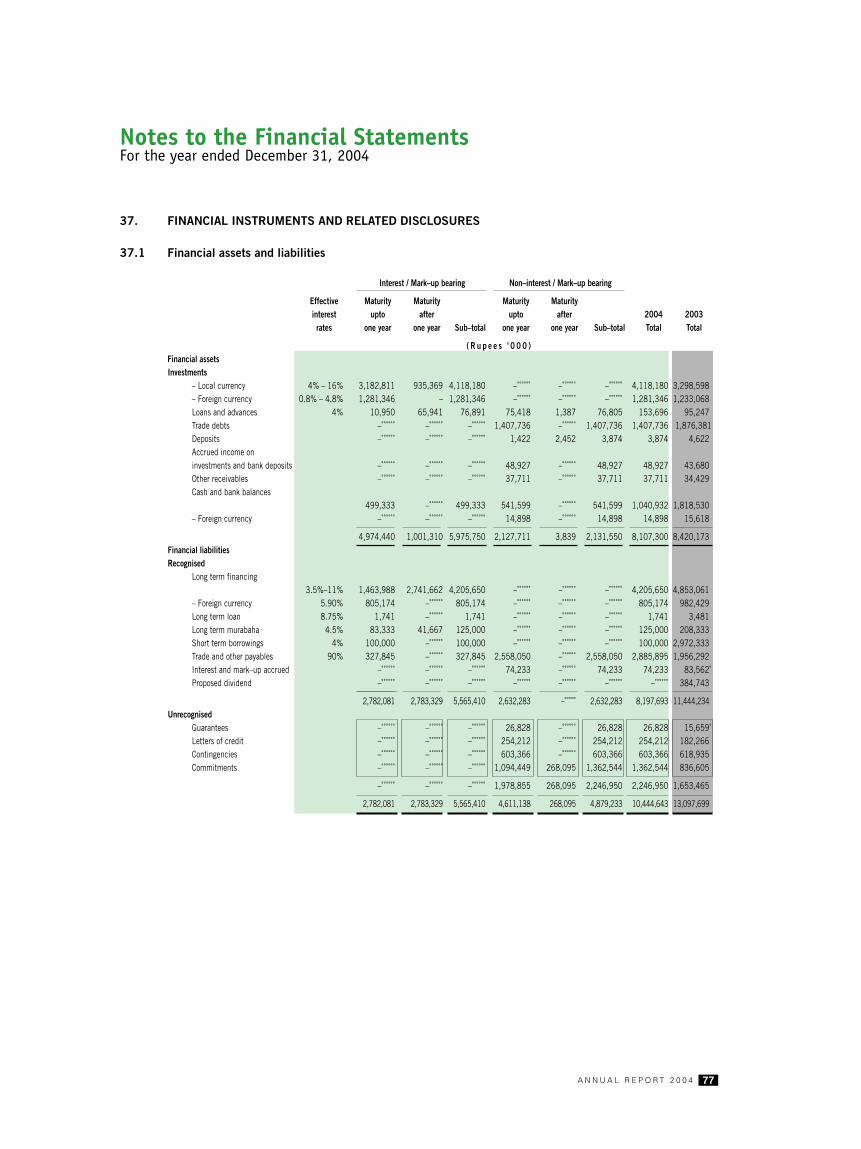
77A N N U A L R E P O R T 2 0 0 4
Notes to the Financial StatementsFor the year ended December 31, 2004
37. FINANCIAL INSTRUMENTS AND RELATED DISCLOSURES
37.1 Financial assets and liabilities
Interest / Mark–up bearing Non–interest / Mark–up bearing
Effective Maturity Maturity Maturity Maturityinterest upto after upto after 2004 2003rates one year one year Sub–total one year one year Sub–total Total Total
( R u p e e s ' 0 0 0 ) Financial assetsInvestments
– Local currency 4% – 16% 3,182,811 935,369 4,118,180 – – – 4,118,180 3,298,598 – Foreign currency 0.8% – 4.8% 1,281,346 – 1,281,346 – – – 1,281,346 1,233,068 Loans and advances 4% 10,950 65,941 76,891 75,418 1,387 76,805 153,696 95,247 Trade debts – – – 1,407,736 – 1,407,736 1,407,736 1,876,381Deposits – – – 1,422 2,452 3,874 3,874 4,622 Accrued income on investments and bank deposits – – – 48,927 – 48,927 48,927 43,680 Other receivables – – – 37,711 – 37,711 37,711 34,429 Cash and bank balances������������������ 499,333 – 499,333 541,599 – 541,599 1,040,932 1,818,530 – Foreign currency – – – 14,898 – 14,898 14,898 15,618
4,974,440 1,001,310 5,975,750 2,127,711 3,839 2,131,550 8,107,300 8,420,173 Financial liabilitiesRecognised
Long term financing����������������� 3.5%–11% 1,463,988 2,741,662 4,205,650 – – – 4,205,650 4,853,061 – Foreign currency 5.90% 805,174 – 805,174 – – – 805,174 982,429 Long term loan 8.75% 1,741 – 1,741 – – – 1,741 3,481 Long term murabaha 4.5% 83,333 41,667 125,000 – – – 125,000 208,333 Short term borrowings 4% 100,000 – 100,000 – – – 100,000 2,972,333 Trade and other payables 90% 327,845 – 327,845 2,558,050 – 2,558,050 2,885,895 1,956,292 Interest and mark–up accrued – – – 74,233 – 74,233 74,233 83,562 Proposed dividend – – – – – – – 384,743
2,782,081 2,783,329 5,565,410 2,632,283 – 2,632,283 8,197,693 11,444,234 Unrecognised
Guarantees – – – 26,828 – 26,828 26,828 15,659 Letters of credit – – – 254,212 – 254,212 254,212 182,266 Contingencies – – – 603,366 – 603,366 603,366 618,935 Commitments – – – 1,094,449 268,095 1,362,544 1,362,544 836,605
– – – 1,978,855 268,095 2,246,950 2,246,950 1,653,465
2,782,081 2,783,329 5,565,410 4,611,138 268,095 4,879,233 10,444,643 13,097,699

78 F A U J I F E R T I L I Z E R C O M P A N Y L I M I T E D
37.2 Risk management
a) Concentration of credit risk
Credit risk represents the accounting loss that would be recognised at the reporting date if counter parties failed completely to perform as contracted. All the financial assets except cash in hand, are subject to credit risk. The Company believes that it is not exposed to major concentration of credit risk. To manage exposure to credit risk, the Company applies credit limits to its customers besides obtaining guarantees and by dealing with variety of major banks and financial institutions.
b) Foreign exchange risk management
Financial assets and liabilities exposed to foreign exchange rate risk amount to Rs 984,384 thousand (2003:Rs 1,248,686 thousand) and Rs 805,174 thousand (2003: Rs 985,910 thousand) respectively at the year end.
Foreign currency risk arises mainly where receivables and payables exist due to transactions with foreign undertakings. Currently, the Company's foreign exchange risk exposure is restricted to foreign currency investments and financing. As both foreign currency assets and liabilities are denominated in US Dollar, the Company's exposure emanating from any fluctuations in the Pak Rupee / US Dollar parity gets hedged to a large extent.
c) Interest / Mark–up rate risk
Financial assets and liabilities include balances of Rs 1,689,841 thousand (2003: Rs 1,986,582 thousand) and Rs 4,410,824 thousand (2003: Rs 8,335,490 thousand) respectively, which are subject to interest rate risk. The Company has long term Rupee and foreign currency based loans at variable and fixed rates. Applicable interest rates for financial assets and liabilities have been indicated in respective notes.
Variable rate long term financing except Term Finance Certificates (TFCs) is hedged against interest rate risk by holding "prepayment option", which can be exercised upon any adverse movement in the underlying interest rates. TFCs are hedged against the interest rate risk by instituting interest rate caps and floors.
d) Liquidity risk
Prudent liquidity risk management implies maintaining sufficient cash and marketable securities, the availability of funding to an adequate amount of committed credit facilities and the ability to close out market positions due to the dynamic nature of the business. The Company's treasury aims at maintaining flexibility in funding by keeping committed credit lines.
37.3 Fair value of financial assets and liabilities
The carrying values of all financial assets and liabilities reflected in the financial statements approximate their fair values except investments held to maturity which are carried at amortised cost.
Notes to the Financial StatementsFor the year ended December 31, 2004

79A N N U A L R E P O R T 2 0 0 4
38. RE–STATED PROFORMA INFORMATIONSTATEMENT OF RETAINED EARNINGS
Actual ProformaRestated Restated
2004 2003 2004 2003(Rupees `000)
Opening balance as at January, 1 as previously reported 197,753 218,203 197,753 218,203 Change in accounting policyProposed final dividend 2003: Rs 1.50 (2002: Rs 1.00) per share 384,744 256,496Opening balance as at January, 1 restated 197,753 218,203 582,497 474,699 Profit for the year – – – – Transfer from / (to) general reserve 700,000 (600,000) 700,000 (600,000)Transfer to reserve for issue of ������������� (384,744) – (384,744) – Dividends (3,231,849) (2,564,959) (3,616,593) (2,436,712)
Closing balance as at December 31, (2,718,840) (2,946,756) (2,718,840) (2,562,013)
39. RELATED PARTY TRANSACTIONS
Fauji Foundation holds 44.35% (2003: 44.35%) shares of the Company at the year-end. Therefore all subsidiaries and associated undertakings of Fauji Foundation are related parties of the Company. The related parties comprise of directors, key management personnel, entities over which the directors are able to exercise influence and employees' funds. Amounts due from and due to these undertakings are shown under receivables and payables. The remuneration of chief executive, directors and executives is disclosed in note 34 to the financial statements.
2004 2003 (Rupees '000)
Transactions with related parties during the year are as follows:
Fauji FoundationOffice rent 2,431 2,401 Reimbursement of expenses on behalf of the Company 874 600 Sale of fertilizer 4,374 28,341 Medical services 42 674 Payment for shares of Pakistan Maroc Phosphore S.A. 179,300 –
Fauji Fertilizer Bin Qasim Limited (FFBL)Marketing of fertilizer on behalf of FFBL under sale on consignment basis 201,234 134,287 Commission on sale of FFBL products 19,655 12,919 Services and materials provided 17,108 8,293 Services and materials received 1,864 414 Equity injection in FFBL – 750,000 Reimbursement of expenses incurred by FFBL in relation to equity investment in foreign company 680 – Remittance of collections from FFBL debtors 12,720,771 6,149,745
Mari Gas Company LimitedPurchase of gas as feed and fuel stock 5,884,410 5,313,857
Haldor Topsoe A/s, DenmarkTechnical services received 14,364 13,920
Pakistan Maroc Phosphore S.A.Advance against issue of shares 179,300 –
Payment to:Employees' Provident Fund Trust 99,217 88,741 Employees' Gratuity Fund Trust 43,681 25,932 Employees' Pension Fund Trust 27,321 21,053
Notes to the Financial StatementsFor the year ended December 31, 2004
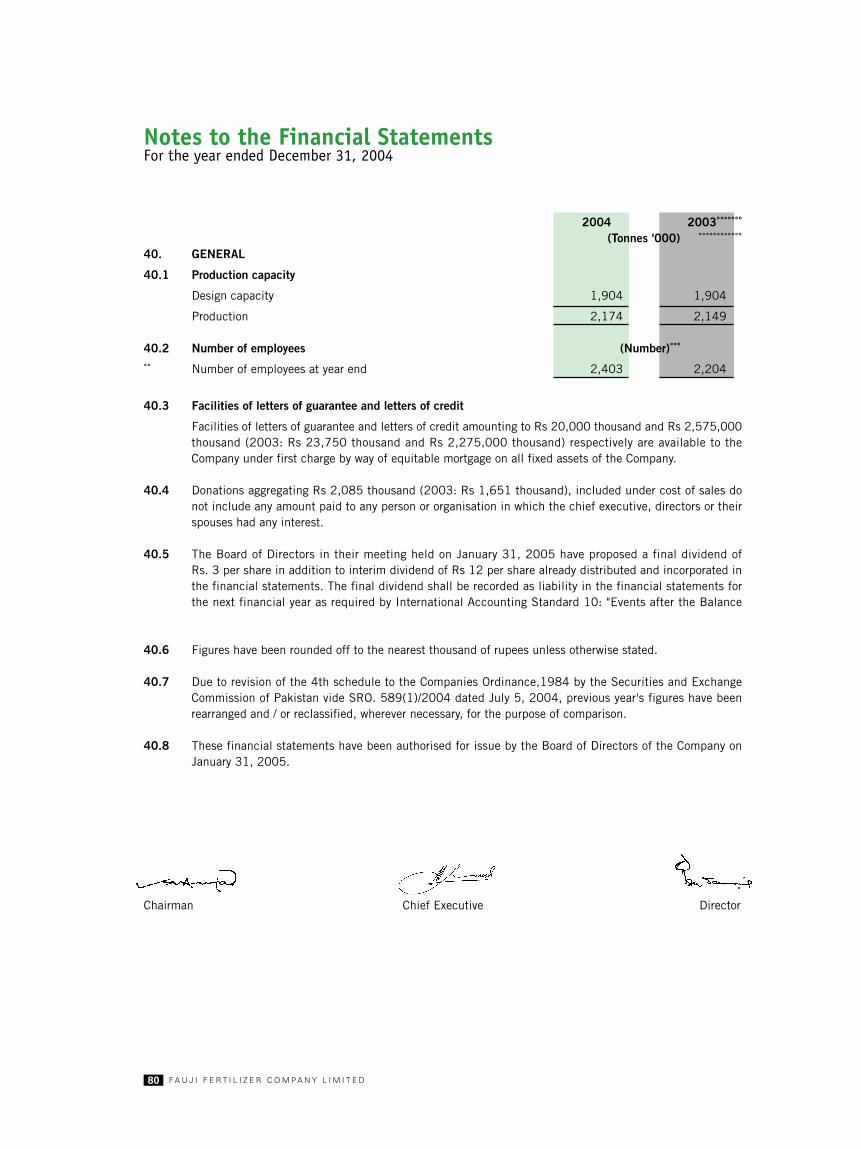
80 F A U J I F E R T I L I Z E R C O M P A N Y L I M I T E D
Notes to the Financial StatementsFor the year ended December 31, 2004
2004 2003 (Tonnes '000) 40. GENERAL
40.1 Production capacity
Design capacity 1,904 1,904
Production 2,174 2,149
40.2 Number of employees (Number)
Number of employees at year end 2,403 2,204
40.3 Facilities of letters of guarantee and letters of credit
Facilities of letters of guarantee and letters of credit amounting to Rs 20,000 thousand and Rs 2,575,000 thousand (2003: Rs 23,750 thousand and Rs 2,275,000 thousand) respectively are available to the Company under first charge by way of equitable mortgage on all fixed assets of the Company.
40.4 Donations aggregating Rs 2,085 thousand (2003: Rs 1,651 thousand), included under cost of sales do not include any amount paid to any person or organisation in which the chief executive, directors or their spouses had any interest.
40.5 The Board of Directors in their meeting held on January 31, 2005 have proposed a final dividend of Rs. 3 per share in addition to interim dividend of Rs 12 per share already distributed and incorporated in the financial statements. The final dividend shall be recorded as liability in the financial statements for the next financial year as required by International Accounting Standard 10: "Events after the Balance ������������
40.6 Figures have been rounded off to the nearest thousand of rupees unless otherwise stated.
40.7 Due to revision of the 4th schedule to the Companies Ordinance,1984 by the Securities and Exchange Commission of Pakistan vide SRO. 589(1)/2004 dated July 5, 2004, previous year's figures have been rearranged and / or reclassified, wherever necessary, for the purpose of comparison.
40.8 These financial statements have been authorised for issue by the Board of Directors of the Company on January 31, 2005.
Chairman Chief Executive Director


82 F A U J I F E R T I L I Z E R C O M P A N Y L I M I T E D

83C O N S O L I D AT E D A N N U A L R E P O R T 2 0 0 4
Auditors' Report to The Members
We have audited the annexed consolidated financial statements comprising consolidated balance
sheet of Fauji Fertilizer Company Limited and its subsidiary company as at December 31, 2004
and the related consolidated profit and loss account, consolidated cash flow statement and
consolidated statement of changes in equity together with the notes forming part thereof for
the year then ended. We have also expressed separate opinions on the financial statements of
Fauji Fertilizer Company Limited and its subsidiary company. These financial statements are
the responsibility of the Holding Company’s management. Our responsibility is to express an
opinion on these financial statements, based on our audit.
Our audit was conducted in accordance with the International Standards on Auditing and
accordingly included such tests of accounting records and such other auditing procedures as
we considered necessary in the circumstances.
In our opinion, the consolidated financial statements present fairly the financial position of
Fauji Fertilizer Company Limited and its subsidiary company as at December 31, 2004 and
the results of their operations for the year then ended.
The consolidated financial statements for the year ended December 31, 2003 were audited
by another firm of accountants who have issued unqualified opinion thereon.
Dated: January 31, 2005 TASEER HADI KHALID & CO.
Islamabad CHARTERED ACCOUNTANTS
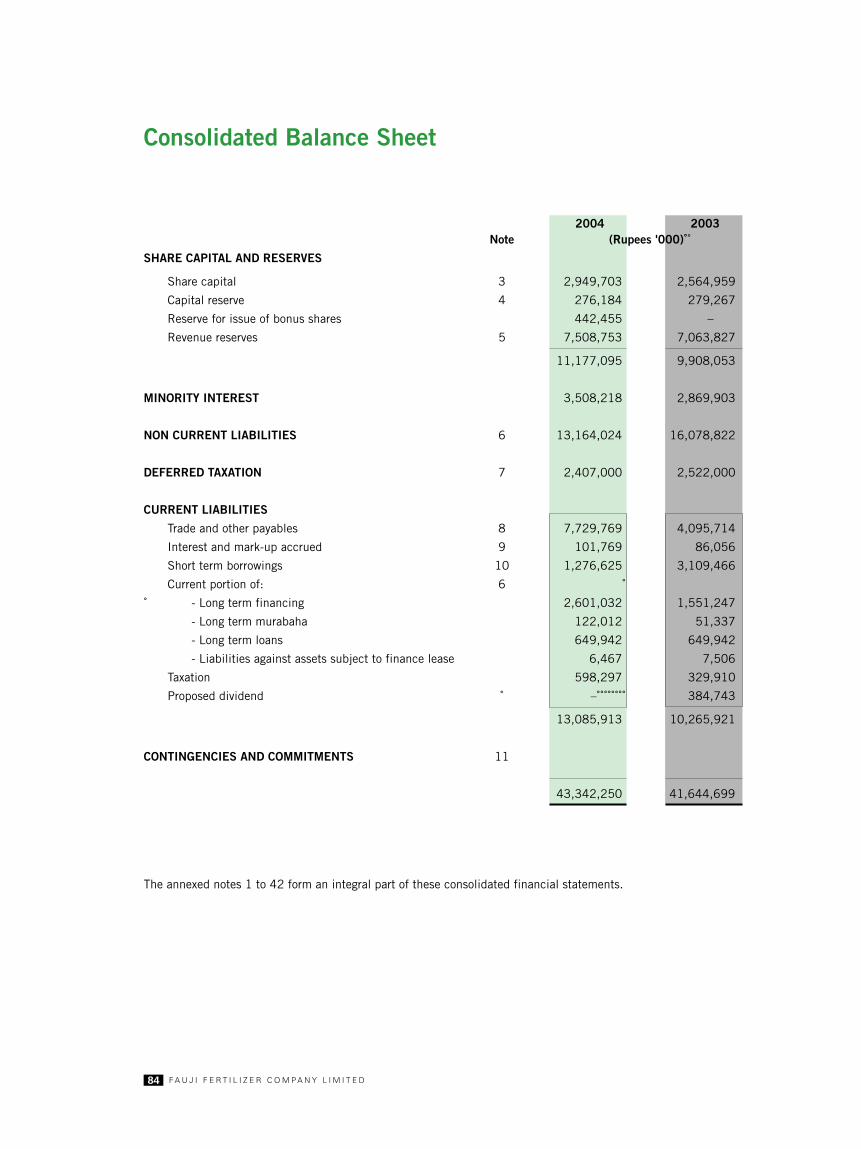
84 F A U J I F E R T I L I Z E R C O M P A N Y L I M I T E D
Consolidated Balance Sheet
2004 2003Note (Rupees '000)
SHARE CAPITAL AND RESERVES
Share capital 3 2,949,703 2,564,959
Capital reserve 4 276,184 279,267
Reserve for issue of bonus shares 442,455 –
Revenue reserves 5 7,508,753 7,063,827
11,177,095 9,908,053
MINORITY INTEREST 3,508,218 2,869,903
NON CURRENT LIABILITIES 6 13,164,024 16,078,822
DEFERRED TAXATION 7 2,407,000 2,522,000
CURRENT LIABILITIES
Trade and other payables 8 7,729,769 4,095,714
Interest and mark-up accrued 9 101,769 86,056
Short term borrowings 10 1,276,625 3,109,466
Current portion of: 6
- Long term financing 2,601,032 1,551,247
- Long term murabaha 122,012 51,337
- Long term loans 649,942 649,942
- Liabilities against assets subject to finance lease 6,467 7,506
Taxation 598,297 329,910
Proposed dividend – 384,743
13,085,913 10,265,921
CONTINGENCIES AND COMMITMENTS 11
43,342,250 41,644,699
The annexed notes 1 to 42 form an integral part of these consolidated financial statements.

85C O N S O L I D AT E D A N N U A L R E P O R T 2 0 0 4
As at December 31, 2004
2004 2003Note (Rupees '000)
PROPERTY, PLANT AND EQUIPMENT 12 23,720,065 24,437,864
INTANGIBLE ASSETS 13 1,778,464 1,906,765
LONG TERM INVESTMENTS 14 1,473,269 2,330,821
LONG TERM LOANS AND ADVANCES 15 67,328 63,920
LONG TERM DEPOSITS AND PREPAYMENTS 16 22,010 28,250
DEFERRED TAX ASSET 17 143,527 1,160,688
CURRENT ASSETS
Stores, spares and loose tools 18 2,247,710 2,142,895
Stock in trade 19 471,432 890,808
Trade debts 20 1,838,982 2,268,758
Loans and advances 21 293,759 75,868
Deposits and prepayments 22 26,975 25,701
Other receivables 23 660,129 658,636
Short term investments 24 4,464,157 2,200,845
Cash and bank balances 25 6,134,443 3,452,880
16,137,587 11,716,391
43,342,250 41,644,699
Chairman Chief Executive Director

86 F A U J I F E R T I L I Z E R C O M P A N Y L I M I T E D
Consolidated Profit and Loss AccountFor the year ended December 31, 2004
2004 2003Note (Rupees '000)
Sales 26 32,509,095 26,214,063
Cost of sales 27 21,362,763 17,704,185
GROSS PROFIT 11,146,332 8,509,878
Administrative expenses and distribution cost 28 2,788,791 2,516,186
8,357,541 5,993,692
Finance cost 29 457,766 677,543
Other operating expenses 30 674,178 508,176
7,225,597 4,807,973
Other operating income 31 546,562 487,895
NET PROFIT BEFORE TAXATION 7,772,159 5,295,868
Provision for taxation 32 2,871,161 1,405,496
NET PROFIT AFTER TAXATION AND ORDINARY ACTIVITIES 4,900,998 3,890,372
Extraordinary item
- Compensation received from Government of Pakistan (GOP) - net 455,000 455,000
NET PROFIT AFTER EXTRAORDINARY ITEM 5,355,998 4,345,372
Minority interest in profit of consolidated subsidiary 896,841 573,652
NET PROFIT AFTER TAXATION AND MINORITY INTEREST 4,459,157 3,771,720
Earnings per share - basic and diluted (Rupees) 34 15.12 12.79
The annexed notes 1 to 42 form an integral part of these consolidated financial statements.
Chairman Chief Executive Director

87C O N S O L I D AT E D A N N U A L R E P O R T 2 0 0 4
Consolidated Cash Flow StatementFor the year ended December 31, 2004
2004 2003Note (Rupees '000)
CASH FLOWS FROM OPERATING ACTIVITIES
Cash generated from operations 35 13,553,791 7,317,433
Payments for :
Finance cost paid (470,107) (731,392)
Income tax paid (1,988,746) (2,622,167)
Payment to pension fund (27,321) (23,207)
Payment to gratuity fund (50,353) (52,968)
(2,536,527) (3,429,734)
Extraordinary item- compensation
from Government of Pakistan-net 51,799 51,799
Net cash from operating activities 11,069,063 3,939,498
CASH FLOWS FROM INVESTING ACTIVITIES
Fixed capital expenditure (915,092) (676,508)
Proceeds from sale of property, plant and equipment 24,757 20,047
Interest received 431,598 500,363
Advance against equity investment in foreign company (537,900) –
Decrease in investments 1,023,625 132,341
Net cash from / (used in) investing activities 26,988 (23,757)
CASH FLOWS FROM FINANCING ACTIVITIES
Issue of share capital 242,086 250,000
Long term financing - proceeds 600,000 1,705,910
- repayments (1,662,333) (2,485,817)
Long term loans - repayments (1,740) (135,324)
Long term murabaha - repayments (102,672) (83,333)
Short term borrowings (2,872,333) (416,564)
Finance lease paid (9,624) (8,514)
Dividends paid (3,800,810) (2,260,303)
Net cash used in financing activities (7,607,426) (3,433,945)
Net increase in cash and cash equivalents 3,488,625 481,796
Cash and cash equivalents at beginning of the year 4,521,493 4,039,925
Effect of exchange rate changes 200 (228)
Cash and cash equivalents at end of the year 36 8,010,318 4,521,493
The annexed notes 1 to 42 form an integral part of these consolidated financial statements.
Chairman Chief Executive Director

88 F A U J I F E R T I L I Z E R C O M P A N Y L I M I T E D
Consolidated Statement of Changes in EquityFor the year ended December 31, 2004
Reserve forShare Capital issue of General Fair value Unappropriated Totalcapital reserve bonus shares reserve adjustment profit
(Rupees '000)
Balance at December 31, 2002 2,564,959 160,000 – 8,000,000 (180,105) 218,203 10,763,057
Share of subsidiary as at January 1, 2003 – 119,267 – – – (2,361,137) (2,241,870)
Net profit for the year ended December 31, 2003 – – – – – 3,771,720 3,771,720
Elimination of adjustment arising from
remeasurement to fair value of investment in
associated company on consolidation – – – – 180,105 – 180,105
Transfer to general reserve – – – 600,000 – (600,000) –
Dividends
First interim Rs 3.00 per share – – – – – (769,488) (769,488)
Second interim Rs 2.25 per share – – – – – (577,116) (577,116)
Third interim Rs 3.25 per share – – – – – (833,612) (833,612)
Final Rs 1.50 per share – – – – – (384,743) (384,743)
Balance at December 31, 2003 2,564,959 279,267 – 8,600,000 – (1,536,173) 9,908,053
Net profit for the year ended December 31, 2004 – – – – – 4,459,157 4,459,157
Adjustment of dilution in holding of FFBL shares – (3,083) – – – 44,817 41,734
Transfer from general reserve – – 827,199 (1,150,000) – 322,801 –
Dividends
First interim Rs 3.25 per share – – – – – (833,612) (833,612)
Second interim Rs 4.75 per share – – – – – (1,218,356) (1,218,356)
Third interim Rs 4.00 per share – – – – – (1,179,881) (1,179,881)
Bonus shares issued 384,744 – (384,744) – – – –
Balance at December 31, 2004 2,949,703 276,184 442,455 7,450,000 – 58,753 11,177,095
The annexed notes 1 to 42 form an integral part of these consolidated financial statements.
Chairman Chief Executive Director
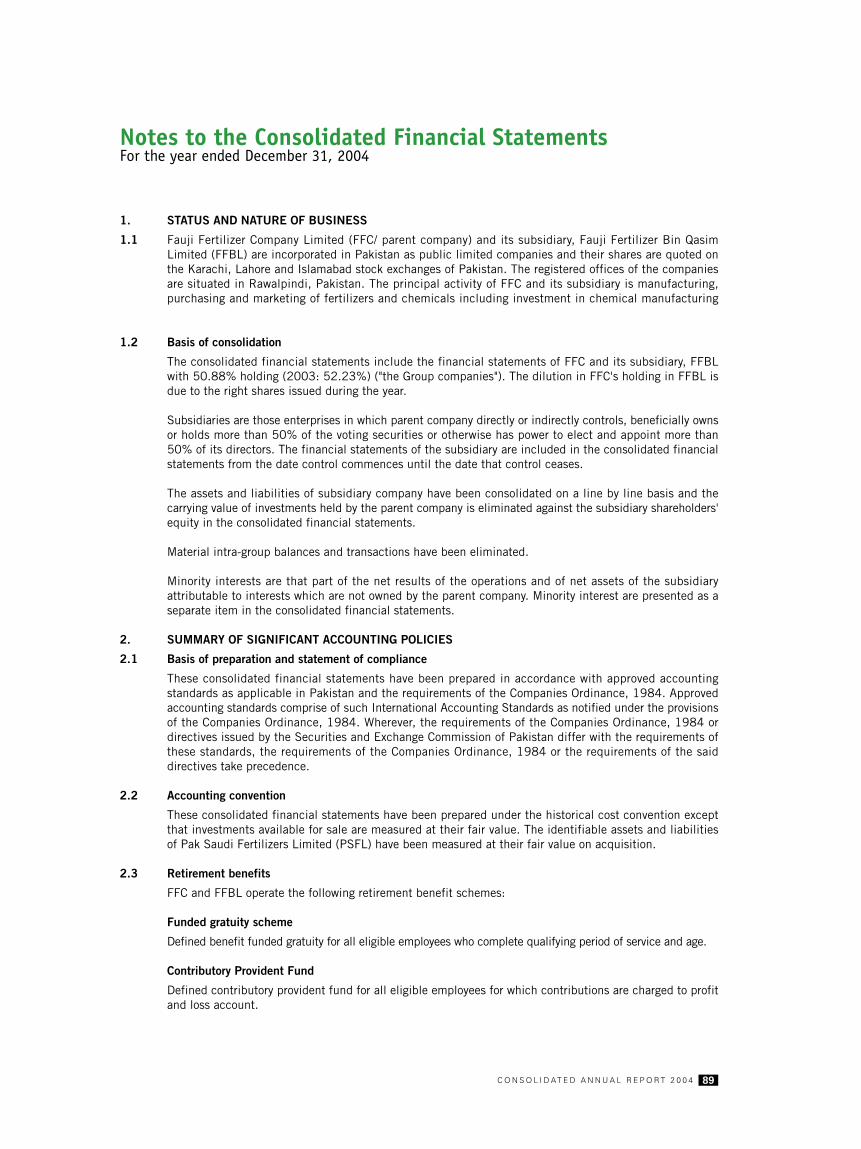
89C O N S O L I D AT E D A N N U A L R E P O R T 2 0 0 4
Notes to the Consolidated Financial StatementsFor the year ended December 31, 2004
1. STATUS AND NATURE OF BUSINESS
1.1 Fauji Fertilizer Company Limited (FFC/ parent company) and its subsidiary, Fauji Fertilizer Bin Qasim Limited (FFBL) are incorporated in Pakistan as public limited companies and their shares are quoted on the Karachi, Lahore and Islamabad stock exchanges of Pakistan. The registered offices of the companies are situated in Rawalpindi, Pakistan. The principal activity of FFC and its subsidiary is manufacturing, purchasing and marketing of fertilizers and chemicals including investment in chemical manufacturing �����������
1.2 Basis of consolidation
The consolidated financial statements include the financial statements of FFC and its subsidiary, FFBL with 50.88% holding (2003: 52.23%) ("the Group companies"). The dilution in FFC's holding in FFBL is due to the right shares issued during the year.
Subsidiaries are those enterprises in which parent company directly or indirectly controls, beneficially owns or holds more than 50% of the voting securities or otherwise has power to elect and appoint more than 50% of its directors. The financial statements of the subsidiary are included in the consolidated financial statements from the date control commences until the date that control ceases.
The assets and liabilities of subsidiary company have been consolidated on a line by line basis and the carrying value of investments held by the parent company is eliminated against the subsidiary shareholders' equity in the consolidated financial statements.
Material intra-group balances and transactions have been eliminated.
Minority interests are that part of the net results of the operations and of net assets of the subsidiary attributable to interests which are not owned by the parent company. Minority interest are presented as a separate item in the consolidated financial statements.
2. SUMMARY OF SIGNIFICANT ACCOUNTING POLICIES
2.1 Basis of preparation and statement of compliance
These consolidated financial statements have been prepared in accordance with approved accounting standards as applicable in Pakistan and the requirements of the Companies Ordinance, 1984. Approved accounting standards comprise of such International Accounting Standards as notified under the provisions of the Companies Ordinance, 1984. Wherever, the requirements of the Companies Ordinance, 1984 or directives issued by the Securities and Exchange Commission of Pakistan differ with the requirements of these standards, the requirements of the Companies Ordinance, 1984 or the requirements of the said directives take precedence.
2.2 Accounting convention
These consolidated financial statements have been prepared under the historical cost convention except that investments available for sale are measured at their fair value. The identifiable assets and liabilities of Pak Saudi Fertilizers Limited (PSFL) have been measured at their fair value on acquisition.
2.3 Retirement benefits
FFC and FFBL operate the following retirement benefit schemes:
Funded gratuity scheme
Defined benefit funded gratuity for all eligible employees who complete qualifying period of service and age.
Contributory Provident Fund
Defined contributory provident fund for all eligible employees for which contributions are charged to profit and loss account.

90 F A U J I F E R T I L I Z E R C O M P A N Y L I M I T E D
Notes to the Consolidated Financial StatementsFor the year ended December 31, 2004
Funded Pension Scheme
FFC has defined benefit funded pension for eligible employees who complete qualifying period of service and age.
These funds are administered by trustees. Annual contributions to the gratuity and management staff pension funds are based on actuarial valuation using Projected Unit Credit Method, related details of which are given in note 8 to the consolidated financial statements. All contributions are charged to profit and loss account for the year. The actuarial gains / losses in excess of corridor limit (10% of the higher of fair value of assets and present value of obligation) are recognized over the average remaining service life of the employees. Transitional liability in respect of FFBL is being recognized on a straight line basis over a period of five years.
Compensated absences
FFC and FFBL have the policy to provide for the encashable compensated absences of its employees in accordance with respective entitlement on cessation of service; related expected cost thereof has been included in the consolidated financial statements.
2.4 Taxation
Provision for current taxation is based on taxable income at the current rates of taxation after taking into account tax credits, tax rebates and exemptions available, if any, or minimum tax on turnover, whichever is higher.
Deferred tax is accounted for using the balance sheet liability method in respect of all temporary differences arising from differences between the carrying amount of assets and liabilities in the consolidated financial statements and the corresponding tax bases used in the computation of taxable profit. Deferred tax liabilities are recognized for all taxable temporary differences and deferred tax assets are recognized to the extent that it is probable that taxable profits will be available against which the deductible temporary differences, unused tax losses and tax credits can be utilized.
Deferred tax is calculated at the rates that are expected to apply to the period when the differences reverse, based on tax rates that have been enacted.
2.5 Property, plant and equipment and capital work in progress
Owned assets
Property, plant and equipment including those acquired on PSFL acquisition, are stated at cost less accumulated depreciation except freehold land and capital work in progress, which are stated at cost. Property, plant and equipment acquired on PSFL acquisition are stated at their cost to FFC, which represents their fair value on acquisition, less accumulated depreciation.
Depreciation is provided on the straight-line basis to write off the cost of an asset over its estimated useful life without taking into account any residual value. Full year's depreciation is charged on normal additions, while no depreciation is charged on items deleted during the year.
Maintenance and repairs are charged to profit and loss account as and when incurred. Major renewals and improvements are capitalized and the assets so replaced, if any, are retired. Gains and losses on disposal of property, plant and equipment, if any, are included in profit and loss account currently.
Initial fill of catalysts in the ammonia plant is capitalized with plant and machinery whereas costs of subsequent replacements of such catalysts are included in property, plant and equipment and depreciated on a straight line basis over their estimated useful lives.
Assets subject to finance lease
Leased property, plant and equipment in terms of which FFBL assumes substantially all the risks and rewards of ownership are classified as finance leases. Leased assets are stated at an amount equal to the lower of its fair value and the present value of minimum lease payments at the inception of the lease, less accumulated depreciation and impairment losses, if any.
Rental obligations of leased assets, net of finance charges not due are included in liabilities against assets subject to finance lease.

91C O N S O L I D AT E D A N N U A L R E P O R T 2 0 0 4
Notes to the Consolidated Financial StatementsFor the year ended December 31, 2004
Each lease payment is allocated between the liability and finance charge so as to achieve a constant rate on the balance outstanding. Finance charge on leased assets is charged to profit and loss account over ����������������
Depreciation on assets subject to finance lease is recognized in the same manner as for owned assets.
FFBL accounts for lease obligations by recording the asset and corresponding liability there against determined on the basis of discounted value of total minimum lease payments. Finance charge is recognized in the profit and loss account using the effective mark-up rate method.
2.6 Impairment
The carrying amount of the Group companies' assets are reviewed at each balance sheet date to identify circumstances indicating occurrence of impairment loss or reversal of previous impairment losses. If any such indications exist, the recoverable amounts of such assets are estimated and impairment losses or reversal of impairment losses are recognized in the profit and loss account. Reversal of impairment loss is restricted to the original cost of the asset.
2.7 Intangible assets
a) Goodwill
On acquisition of an entity, difference between the purchase consideration and the fair value of the identifiable assets and liabilities acquired, is initially recognized as goodwill and amortized on a straight line basis over the estimated useful life of the acquired depreciable assets with reversal of related deferred tax liability.
b) Process license fee
Process license fee is stated at cost less accumulated amortization. Amortization is charged to profit and loss account over a period of five years.
2.8 Investments
Investment in associates
Investments in associates where significant influence can be established are accounted for under the equity method. In case of investments accounted for under equity method, the method is applied from the date when control / significant influence commence until the date when that control / significant influence ceases. When the associates' share of losses exceed the carrying amount of investment in associates, the carrying amount is reduced to nil and the recognition of further losses is discontinued except to the extent that the parent company has incurred obligation in respect of the associate.
Investments available for sale
Investments available for sale are initially recognized at cost and at subsequent reporting dates are measured at their fair values. For investments traded in active market, fair value is determined by reference to quoted market price and the investments for which a quoted market price is not available, are measured at cost, subject to a review for impairment at each balance sheet date. Gains or losses from changes in fair values, including the component of the change that relates to changes in foreign exchange rates in respect of investments in foreign currency, are recognized in the profit and loss account.
Investments held to maturity
Investments with fixed or determinable payments and fixed maturity, which the Group companies have the positive intent and ability to hold to maturity, are carried at amortized cost, using the effective interest rate method less impairment losses, if so determined.
2.9 Stores, spares and loose tools
These are valued at weighted average cost except for items in transit, which are valued at invoice price and related expenses incurred upto the balance sheet date. For items which are slow moving and/or identified as surplus to the Group companies' requirement, a provision is made for excess of book value over estimated �����������������

92 F A U J I F E R T I L I Z E R C O M P A N Y L I M I T E D
Notes to the Consolidated Financial StatementsFor the year ended December 31, 2004
2.10 Stock in trade
Stocks are valued at the lower of cost and net realizable value except for stock in transit which is valued at invoice price and related expenses incurred upto the balance sheet date.
Cost is determined as follows:
Raw materials at weighted average cost
Work in process at weighted average cost of purchases andFinished goods applicable manufacturing expenses
Net realizable value signifies the estimated selling price in the ordinary course of business less net estimated cost of completion and selling expenses.
2.11 Rates of exchange
Transactions in foreign currencies are recorded in the books at the rates of exchange prevailing on the date of transaction. Assets and liabilities in foreign currencies at the year end are translated into rupees at the rates prevailing on the balance sheet date. Exchange differences are included in the profit and loss account for the year.
2.12 Revenue recognition
Sales revenue is recognized at the time of dispatch of goods to customers. Return on bank deposits and investments and interest on loans are accounted for on a time proportion basis using the applicable rate of return/interest. Scrap sales and miscellaneous receipts are recognized on realized amounts. Dividend income is recognized when the right to receive the dividend is established.
2.13 Government compensation
FFBL recognizes Government compensation received in lieu of the fertilizer policy, 1989 as income subject to compliance with the related conditions.
2.14 Borrowing costs
Borrowing costs incurred upto the date of commencement of commercial production are capitalized. All other borrowing costs are recognized as an expense in the period in which these are incurred.
2.15 Provisions
Provisions are recognized when, the Group companies have a present legal or constructive obligation as a result of past events, it is probable that an outflow of resources embodying economic benefits will be required to settle the obligation and a reliable estimate can be made of the amount of obligation.
2.16 Dividend appropriation
Dividend is recognized as a liability in the period in which it is declared. Upto previous year, dividends proposed after the balance sheet date but before the consolidated financial statements were authorised for issue were recorded as a liability. The change has been necessitated by revision in the 4th Schedule to the Companies Ordinance, 1984. Proforma information required under International Accounting Standard 8: "Net Profit or Loss for the Period, Fundamental Errors and Changes in Accounting Policies" is presented in note 38 to the consolidated financial statements.
2.17 Cash and cash equivalents
Cash and cash equivalents are carried in the balance sheet at their nominal values. For the purpose of cash flow statement, cash and cash equivalents comprise cash in hand, cash with banks on current, saving and deposit accounts, other short term highly liquid investments that are readily convertible to known amounts of cash which are subject to insignificant risk of change in value and short term running finances of FFBL.
2.18 Related party transactions
All transactions involving related parties arising in the normal course of business are conducted at arm's length at normal commercial rates on the same terms and conditions as third party transactions using valuation modes, as admissible, except in extremely rare circumstances where, subject to the approval of the Board of Directors, it is in the interest of the Group companies to do so.
}

93C O N S O L I D AT E D A N N U A L R E P O R T 2 0 0 4
2.19 Offsetting
Financial assets and liabilities are offset and the net amount is reported in the balance sheet if the Group companies have a legally enforceable right to setoff the recognised amounts and the Group companies intend to settle on a net basis, or realise the asset and settle the liability simultaneously.
2.20 Operating leases
Rentals payable under operating leases are charged to profit and loss account on a straight line basis over the term of the relevant lease.
2.21 Financial instruments
Financial assets and financial liabilities are recognised when the Group companies become a party to the contractual provisions of the instrument and assets and liabilities are stated at fair value. The Group companies derecognise the financial assets and liabilities when they cease to be a party to such contractual provisions of the instruments. The Group companies recognise the regular way purchase or sale of financial assets using settlement date accounting.
a) Trade and other payables
Liabilities for trade and other amounts payable are carried at cost which is the fair value of the consideration to be paid in the future for goods and services received.
b) Trade and other receivables
Trade and other receivables are recognised and carried at original invoice amount/cost less an allowance for any uncollectible amounts.
c) Derivative financial instruments
Any gain or loss from remeasuring the hedging instrument at fair value is recognised in the profit and loss account.
d) Cash and bank balances
Cash in hand and at banks are carried at cost.
3. SHARE CAPITAL 2004 2003
(Rupees '000) ISSUED, SUBSCRIBED AND PAID UP CAPITAL
2004 2003
256,495,902 256,495,902 Ordinary shares of Rs.10 each fully paid in cash 2,564,959 2,564,959
38,474,385 – Ordinary shares of Rs.10 each issued as fully paid bonus shares. 384,744 –
294,970,287 256,495,902 2,949,703 2,564,959
AUTHORISED SHARE CAPITAL
This represents 500,000,000 (2003: 300,000,000) ordinary shares of Rs 10 each.
3.1 Fauji Foundation held 44.35% (2003: 44.35%) ordinary shares of the FFC at the year end.
2004 2003 Note (Rupees '000)
4. CAPITAL RESERVE
Share premium 4.1 156,184 159,267 Capital redemption reserve 4.2 120,000 120,000
276,184 279,267 4.1 Share premium
This represents premium of Rs 5 per share received on public issue of 8,000 thousand ordinary shares of FFC in 1991 and its share in share premium of FFBL received on public issue of 45,670 thousandordinary shares in 1996 at the rate of Rs 5 per share.
Notes to the Consolidated Financial StatementsFor the year ended December 31, 2004
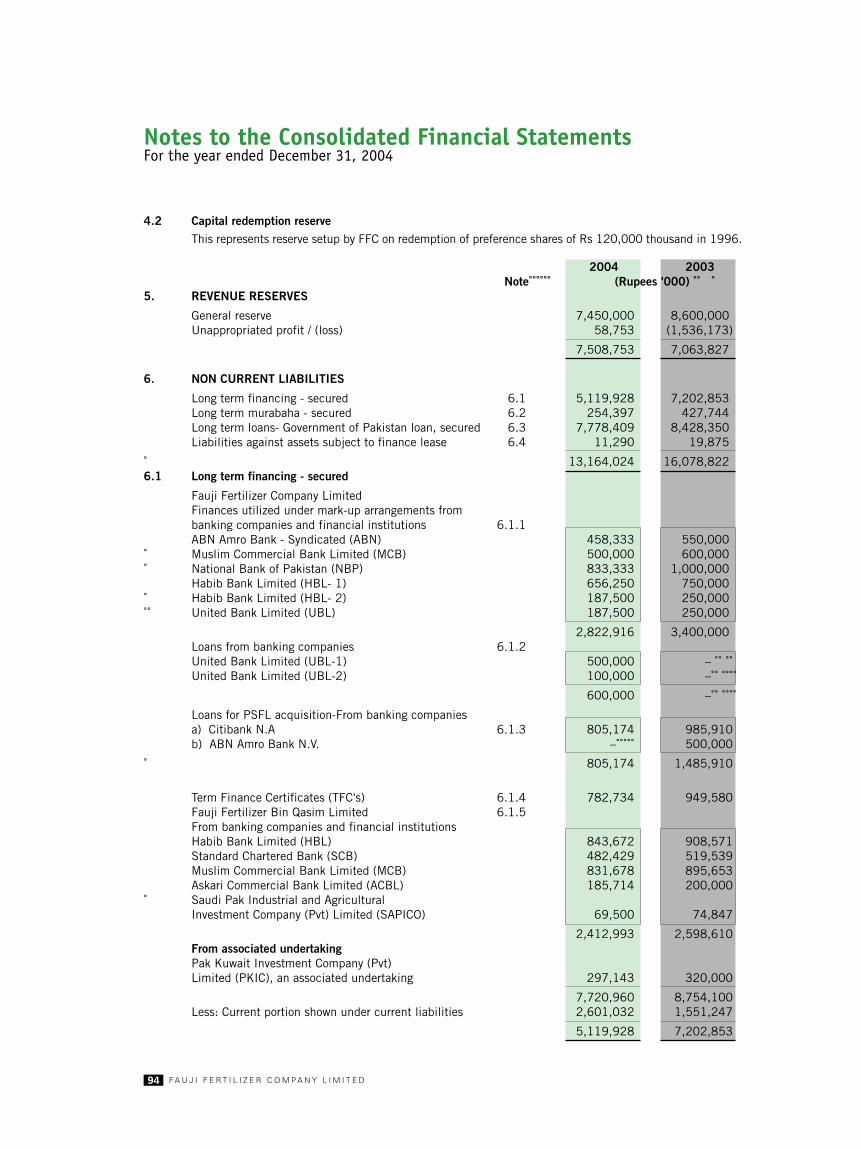
94 F A U J I F E R T I L I Z E R C O M P A N Y L I M I T E D
4.2 Capital redemption reserve
This represents reserve setup by FFC on redemption of preference shares of Rs 120,000 thousand in 1996.
2004 2003 Note (Rupees '000)
5. REVENUE RESERVES
General reserve 7,450,000 8,600,000 Unappropriated profit / (loss) 58,753 (1,536,173)
7,508,753 7,063,827
6. NON CURRENT LIABILITIES
Long term financing - secured 6.1 5,119,928 7,202,853 Long term murabaha - secured 6.2 254,397 427,744 Long term loans- Government of Pakistan loan, secured 6.3 7,778,409 8,428,350 Liabilities against assets subject to finance lease 6.4 11,290 19,875
13,164,024 16,078,822 6.1 Long term financing - secured
Fauji Fertilizer Company Limited Finances utilized under mark-up arrangements from banking companies and financial institutions 6.1.1ABN Amro Bank - Syndicated (ABN) 458,333 550,000
Muslim Commercial Bank Limited (MCB) 500,000 600,000 National Bank of Pakistan (NBP) 833,333 1,000,000
Habib Bank Limited (HBL- 1) 656,250 750,000 Habib Bank Limited (HBL- 2) 187,500 250,000 United Bank Limited (UBL) 187,500 250,000
2,822,916 3,400,000 Loans from banking companies 6.1.2United Bank Limited (UBL-1) 500,000 – United Bank Limited (UBL-2) 100,000 –
600,000 –
Loans for PSFL acquisition-From banking companies a) Citibank N.A 6.1.3 805,174 985,910 b) ABN Amro Bank N.V. – 500,000
805,174 1,485,910
Term Finance Certificates (TFC's) 6.1.4 782,734 949,580 Fauji Fertilizer Bin Qasim Limited 6.1.5From banking companies and financial institutionsHabib Bank Limited (HBL) 843,672 908,571 Standard Chartered Bank (SCB) 482,429 519,539 Muslim Commercial Bank Limited (MCB) 831,678 895,653 Askari Commercial Bank Limited (ACBL) 185,714 200,000
Saudi Pak Industrial and AgriculturalInvestment Company (Pvt) Limited (SAPICO) 69,500 74,847
2,412,993 2,598,610 From associated undertakingPak Kuwait Investment Company (Pvt)Limited (PKIC), an associated undertaking 297,143 320,000
7,720,960 8,754,100 Less: Current portion shown under current liabilities 2,601,032 1,551,247
5,119,928 7,202,853
Notes to the Consolidated Financial StatementsFor the year ended December 31, 2004

95C O N S O L I D AT E D A N N U A L R E P O R T 2 0 0 4
6.1.1 Terms and conditions of long term finances are given below:
Lender Mark-up No of half- Date of finalrate p.a. yearly repayment
(%) instalmentsoutstanding
ABN 6 months Treasury Bill rate + 1.3 5 May 30, 2007MCB 6 months Treasury Bill rate + 1.3 5 May 30, 2007NBP 6 months Treasury Bill rate + 1.3 5 May 30, 2007HBL - 1 6 months Treasury Bill rate + 1.3 7 May 30, 2008HBL - 2 6 months Treasury Bill rate + 1.0 6 January 1, 2008UBL 6 months Treasury Bill rate + 1.0 6 January 1, 2008
All the above finances are secured by an equitable mortgage on the assets of FFC and hypothecation of all assets including plant, machinery, tools and spares, and all other moveable properties situated at Goth Machhi including stocks and book debts ranking pari passu with each other and with long term loans.
6.1.2 Terms and conditions of long term loans from banking companies are given below:
Lender Annual Repayment Date of finalinterest due repaymentrate (%)
UBL - 1 3.50 On maturity May 31, 2006UBL - 2 4.50 On maturity November 02, 2006
UBL - 1
This loan is secured against Pakistan Investment Bonds having face value of Rs 500,000 thousand registered with the UBL's SGL accounts with the State Bank of Pakistan and ranking charge over plant and machinery amounting to Rs 167 million.
UBL - 2
This loan is secured against Pakistan Investment Bonds having face value of Rs 100,000 thousand registered with the UBL's SGL accounts with the State Bank of Pakistan.
6.1.3 Citibank N.A
This medium term loan was obtained for acquisition of PSFL. This represents US Dollar loan disbursed in Pak Rupees at the exchange rate prevailing on the date of disbursement and is secured against lien on Government of Pakistan Special US Dollar Bonds. The interest, payable half-yearly, as well as principal are to be repaid in equivalent amounts of local currency by applying the exchange rate prevailing on the respective payment dates. This loan carries interest at six months LIBOR + 3.1% p.a. Principal and interest are payable in half yearly instalments. The final repayment date is April 03, 2005.
6.1.4 Term Finance Certificates represent private placement to 3 institutional investors for periods ranging from 3 to 5 years. The annual rate of profit is State Bank of Pakistan discount rate plus 1.5% with a floor of 11% and cap of 16%. The principal amount of TFCs for 3 and 5 years tenure is to be repaid in 3 and 6 half-yearly instalments in arrears after a grace period of 18 months and 24 months respectively.
Notes to the Consolidated Financial StatementsFor the year ended December 31, 2004

96 F A U J I F E R T I L I Z E R C O M P A N Y L I M I T E D
6.1.5 Terms and conditions of long term finances availed by FFBL are given below:
Lender Mark-up No of Repaymentrate p.a quarterly commenced
(%) instalments fromoutstanding
HBL 12 months Treasury Bill rate 26 July 2004
SCB 12 months Treasury Bill rate 26 July 2004
MCB 12 months Treasury Bill rate 26 July 2004
ACBL 12 months Treasury Bill rate 26 July 2004
SAPICO 12 months Treasury Bill rate 26 July 2004
PKIC 12 months Treasury Bill rate 26 July 2004
These finances are secured by first equitable mortgage charge created on all immovable properties of FFBL and by way of hypothecation of movable properties of FFBL. These charges ranks pari passu with the charges already created or to be created in favour of other foreign and local lenders.
2004 2003 Note (Rupees '000)
6.2 Long term murabaha - secured
Faysal Bank Limited (FFC) 6.2.1 125,000 208,333 Faysal Bank Limited (FFBL) 6.2.2 251,409 270,748
376,409 479,081 Less: Current portion shown under current liabilities 122,012 51,337
254,397 427,744
6.2.1 This facility carries mark-up at 4.5% p.a. Principal and mark-up are repayable in half yearly instalments up to May 31, 2006. This is secured by a registered charge on all present and future, fixed and current moveable assets of FFC ranking pari passu with long term loans.
6.2.2 This facility carries mark-up at 12 months Treasury bill rate. Principal and mark-up are payable on a quarterly basis. The repayment of murabaha has commenced from July 2004. The facility is secured by first equitable mortgage charge created on all immovable properties of FFBL and by way of hypothecation of movable properties of FFBL. The charge ranks pari passu with the charges already created or to be created in favour of other foreign and local lenders.
2004 2003 (Rupees '000)
6.3 Government of Pakistan loanSecured
Government of Pakistan loan 5th Danish credit - FFC 1,741 3,481
UnsecuredGovernment of Pakistan (GOP) loan - FFBL 5,417,435 5,668,820 Deferred Government assistance - FFBL 3,009,175 3,405,991
8,426,610 9,074,811 Less: Current portion shown under current liabilities 649,942 649,942
7,778,409 8,428,350
Notes to the Consolidated Financial StatementsFor the year ended December 31, 2004

97C O N S O L I D AT E D A N N U A L R E P O R T 2 0 0 4
6.3.1 Government of Pakistan loans and deferred Government assistance
FFC
This loan represents the onlent proceeds of credit obtained by the Government of Pakistan from an international agency.
This loan was disbursed in foreign currency and is repayable in local currency. Disbursements have been determined for repayment in Rupees by translation at the rates of exchange prevailing on the respective dates of disbursement. Interest on loan also includes the Government's exchange risk commission. The loan is to be secured by a mortgage in favour of the Government of Pakistan over FFC's fixed assets. This loan carries interest rate at 8.75%. Principal and interest are repayable in half yearly instalments. The final repayment date of the loan is October 01, 2005.
FFBL
GOP loan of Rs 9,723,011 thousand is repayable in 16 years with 1 year grace at zero percent interest rate effective November 30, 2001. Final instalment will be paid in June 2017. This loan in accordance with International Accounting Standard-39 "Financial Instruments: Recognition and Measurement" is stated at its fair value and the difference is recognised as deferred Government assistance. Deferred Government assistance is being amortised to fully offset the financial charge on the loan at an imputed market rate of 7%. The amount amortised and offset against financial charges during the year amounted to Rs 396.816 ���������
Under the terms of restructuring with GOP, the excess cash, which may arise based on a pre-defined mechanism, shall be shared by FFBL with GOP through prepayment of GOP loan.
Loans from four Export Credit Agencies (ECA), which were assumed by the GOP, were initially secured by a guarantee issued by Habib Bank Limited (HBL) on behalf of a local syndicate of banks and financial institutions, which guarantee is secured by first equitable mortgage created on all immovable properties of FFBL and by way of hypothecation of movable properties of FFBL. The charge ranks pari passu with the charges to be created in favour of other foreign and local lenders. The local syndicate had requested FFBL to obtain an indemnity from GOP confirming that it is GOP's absolute obligation to indemnify and keep related banks and financial institutions harmless from any possible exposure on this account. Accordingly, on December 16, 2002, GOP had conveyed its agreement from assuming ECA loan liabilities by absolving related banks and financial institutions of their liabilities for which they had issued guarantees to ECA. As a result, two ECA have released the guarantee of HBL and have returned the original documents.
Since two ECA have yet to release HBL from their responsibility as guarantor therefore, the above referred guarantee and related charge on assets of FFBL have not been vacated upto December 31, 2004. FFBL is making efforts in getting this guarantee released.
6.4 LIABILITIES AGAINST ASSETS SUBJECT TO FINANCE LEASE
2004 2003
Minimum Financial Principal Minimum Financial Principallease charges for out lease charges for out-
payments future periods standing payments future periods standing
(Rupees '000)
Not later than one year 7,520 1,053 6,467 9,488 1,982 7,506 Later than one year but not later than five years 12,098 808 11,290 21,948 2,073 19,875
19,618 1,861 17,757 31,436 4,055 27,381
Lease rentals include finance charge ranging between 8% to 20% per annum, which have been used as discounting factor and are payable on monthly and quarterly basis. FFBL has an option to purchase the assets upon completion of lease period by adjusting the security deposits amounting to Rs 4,050 thousand (2003: Rs 5,619 thousand) and intends to exercise the option.
Notes to the Consolidated Financial StatementsFor the year ended December 31, 2004

98 F A U J I F E R T I L I Z E R C O M P A N Y L I M I T E D
Notes to the Consolidated Financial StatementsFor the year ended December 31, 2004
7. DEFERRED TAXATION
The balance of deferred tax is in respect of the following major temporary differences:
2004 2003 Note (Rupees '000)
Accelerated depreciation (42,000) (108,000)Provision for slow moving / surplus spares, doubtful debts,
other receivables and short term investments (109,000) (79,000)Measurement to fair value of PSFL acquired fixed assets 2,558,000 2,709,000
2,407,000 2,522,000
8. TRADE AND OTHER PAYABLES
Creditors 1,158,616 832,974 Accrued liabilities 896,268 725,527 Payable to retirement benefits funds 8.1 – 14,659 Other liabilities 8.2 86,471 19,169 Sales tax payable 366,048 323,431 Deposits 58,772 54,751 Retention money 14,742 12,443 Advances from customers 3,339,235 583,080 Workers' Profit Participation Fund 8.3 340,912 284,728 Workers' Welfare Fund 316,225 367,131 Unclaimed dividend 1,152,480 44,209 Dividend payable – 833,612
7,729,769 4,095,714
8.1 Payable to retirement benefits funds
a) Movement in the (asset) / liability recognised in the balance sheet:
Funded Funded Total Total gratuity pension 2004 2003
(Rupees '000)
Balance at beginning of the year 14,659 (2,306) 12,353 35,118 Expense for the year 35,694 28,698 64,392 51,256 Payments to funds during the year (50,353) (27,321) (77,674) (74,021)
Balance at end of the year – (929) (929) 12,353
(note 8) (note 23)
b) Reconciliation of the (asset) / liability recognised in the balance sheet:
Funded Funded Total Total gratuity pension 2004 2003
(Rupees '000)
Present value of defined benefit obligation 551,353 464,935 1,016,288 904,736 Fair value of plan assets (489,980) (473,096) (963,076) (801,549)
Deficit / (surplus) 61,373 (8,161) 53,212 103,187 Unrecognised actuarial (loss) / gain (57,752) 7,232 (50,520) (86,006)
Unrecognised transitional liability (3,621) – (3,621) (4,828)
Net (asset) / liability – (929) (929) 12,353
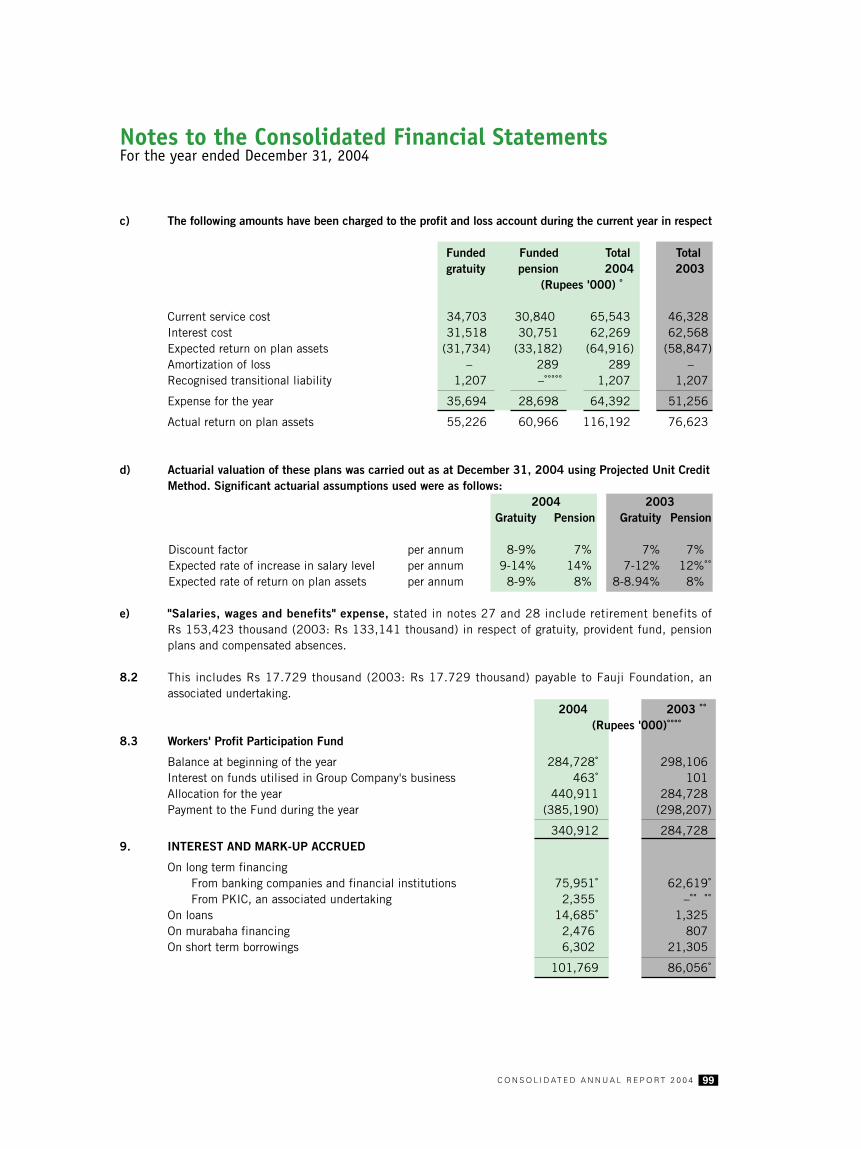
99C O N S O L I D AT E D A N N U A L R E P O R T 2 0 0 4
Notes to the Consolidated Financial StatementsFor the year ended December 31, 2004
c) The following amounts have been charged to the profit and loss account during the current year in respect�����������������
Funded Funded Total Total gratuity pension 2004 2003
(Rupees '000)
Current service cost 34,703 30,840 65,543 46,328 Interest cost 31,518 30,751 62,269 62,568 Expected return on plan assets (31,734) (33,182) (64,916) (58,847)Amortization of loss – 289 289 – Recognised transitional liability 1,207 – 1,207 1,207
Expense for the year 35,694 28,698 64,392 51,256
Actual return on plan assets 55,226 60,966 116,192 76,623
d) Actuarial valuation of these plans was carried out as at December 31, 2004 using Projected Unit CreditMethod. Significant actuarial assumptions used were as follows:
2004 2003 Gratuity Pension Gratuity Pension
Discount factor per annum 8-9% 7% 7% 7%Expected rate of increase in salary level per annum 9-14% 14% 7-12% 12% Expected rate of return on plan assets per annum 8-9% 8% 8-8.94% 8%
e) "Salaries, wages and benefits" expense, stated in notes 27 and 28 include retirement benefits ofRs 153,423 thousand (2003: Rs 133,141 thousand) in respect of gratuity, provident fund, pensionplans and compensated absences.
8.2 This includes Rs 17.729 thousand (2003: Rs 17.729 thousand) payable to Fauji Foundation, an associated undertaking.
2004 2003 (Rupees '000)
8.3 Workers' Profit Participation Fund
Balance at beginning of the year 284,728 298,106 Interest on funds utilised in Group Company's business 463 101 Allocation for the year 440,911 284,728 Payment to the Fund during the year (385,190) (298,207)
340,912 284,728 9. INTEREST AND MARK-UP ACCRUED
On long term financing From banking companies and financial institutions 75,951 62,619 From PKIC, an associated undertaking 2,355 –
On loans 14,685 1,325 On murabaha financing 2,476 807 On short term borrowings 6,302 21,305
101,769 86,056

100 F A U J I F E R T I L I Z E R C O M P A N Y L I M I T E D
Notes to the Consolidated Financial StatementsFor the year ended December 31, 2004
2004 2003 Note (Rupees '000)
10. SHORT TERM BORROWINGS - SECUREDShort term loans 10.1 100,000 600,000 Short term running finances 10.2 1,176,625 137,133 Short term import credit 10.3 – 2,372,333
1,276,625 3,109,466
10.1 Short term loans
Short term loan facility available from a bank under mark-up arrangement amounted to Rs 100,000 thousand (2003: Rs 600,000 thousand), which is secured by lien on Pakistan Investment Bonds. This facility carries mark-up at the rate of Re 0.110 (2003: Re 0.071) per Rs 1,000 per day.
10.2 Short term running finances
This represents short term facilities arranged by FFBL from various banks on mark-up basis aggregating Rs 2,300,000 thousand (2003: Rs 2,300,000 thousand). These facilities carry mark-up ranging from 3.75% to 5.69% per annum (2003: 3.05% to 3.35% per annum) at the year end and are secured by hypothecation of stocks and current assets of FFBL. The purchase prices are repayable on various ���������������
Short term running finance facilities are available to FFC from various banks under mark-up arrangements amounting to Rs 3,250,000 thousand (2003: Rs 3,250,000 thousand) which represent the aggregate of sale prices of all mark-up arrangements between FFC and the banks. These facilities have various maturity dates up to October 27, 2005. These facilities are secured by hypothecation of present and future current assets and fixed assets of FFC ranking pari passu in all respects with the first charge holders. The rates of mark-up are three months KIBOR+0.25% and one month KIBOR+0.25% per annum (2003:six months Treasury Bill rate+1.25%).
10.3 Short term import credit
This represents import credit facilities of Rs 2,372,333 thousand arranged by FFC from various banks under mark-up arrangements at six months LIBOR+ 1.0%-1.10% (2003: six months Treasury Bill+1.05% per annum). These are secured against a second charge by way of hypothecation of present and future current assets and fixed assets of FFC.

101C O N S O L I D AT E D A N N U A L R E P O R T 2 0 0 4
Notes to the Consolidated Financial StatementsFor the year ended December 31, 2004
2004 2003 (Rupees '000)
11. CONTINGENCIES AND COMMITMENTS
a) Contingencies
i) Guarantees issued by banks on behalf of the Group companies. 45,736 35,966
ii) Demand in respect of import of duty-free first charge catalysts for the expansion unit, which matter has been decided in favour of FFC by the High Court of Sindh. This issue is currently pending in the Supreme Court on appeal filed by the Customs authorities. 179,000 179,000
iii) Disputed demand for Income tax and levy of contributionto Workers Welfare Fund related to former PSFL decided in favour of FFC by the Income Tax Appellate authorities, are currently in appeal by the department. FFC is confident that there are reasonablegrounds for a favourable decision. 295,590 295,590
iv) Income tax demands, not acknowledged as debt, havebeen challenged by the Group Companies and are currentlyin appeal; the Group Companies expect favourableoutcome of appeal. 115,745 96,000
v) Claims against the Group Companies and/or potentialexposure not acknowledged as debt. 83,350 61,708
vi) Indemnity bonds and undertakings given to the Customsauthorities for the machinery imported by FFBL forinstallation at plant site 119,650 3,455,024
b) Commitments in respect of:
i) Capital expenditurecontracted 762,977 642,970Non-contracted 3,046,658 –
ii) Purchase of fertilizer, stores, spares and other revenue items. 624,075 710,668
iii) Commitment for equity investment in Pakistan Maroc Phosphore S.A. - note 14, Moroccan Dirhams 225,000thousand, equivalent approx. 1,637,708 –
iv) Rentals under lease agreements:
Premises - not later than one year 27,078 48,285 - later than one year and not later than five years
2006 19,059 16,499 2007 13,766 12,600 2008 13,276 12,574 2009 13,033 12,984
- later than five years 17,423 29,868
Vehicles - not later than one year 60,462 40,930 - later than one year and
not later than five years
2006 59,029 44,712 2007 52,529 43,140 2008 40,203 33,889 2009 34,264 22,477
- later than five years 5,513 10,761

102 F A U J I F E R T I L I Z E R C O M P A N Y L I M I T E D
Notes to the Consolidated Financial StatementsFor the year ended December 31, 2004
*
*
*
*
*
**
*
*
*
*
*
**
12. PROPERTY, PLANT AND EQUIPMENT
C O S T D E P R E C I A T I O N Written downAs at Additions / As at As at For the year / As at value as at Annual rate of
January 1, (disposals) / December 31, January 1, (on disposals) / December 31, December 31, depreciation2004 transfer * / 2004 2004 transfer * / 2004 2004 % on cost
adjustments** adjustments ** (R u p e e s '000)
Freehold land 172,430 2,204 174,634 – – – 174,634 – Lease hold land 295,639 – 295,639 55,536 9,785 65,321 230,318 6 1/4Buildings and structures on freehold land 1,573,624 109,348 1,682,972 974,858 52,153 1,027,011 655,961 5 to 10 Buildings and structures on leasehold land 1,502,274 1,299 1,503,573 215,457 43,951 259,408 1,244,165 5 Railway siding 26,517 – 26,517 26,441 26 26,467 50 5 Plant and machinery 35,512,762 255,725 35,774,467 13,927,290 1,321,804 15,250,463 20,524,004 5
5,988 1,377 (8) (8)
Catalysts 284,662 52,041 336,703 160,553 67,437 227,990 108,713 20 to 50 Furniture and fixtures 67,522 17,820 83,927 40,585 6,094 45,487 38,440 10 to 15
(1,415) (1,192)Office and electrical equipment 203,580 53,091 243,422 143,127 24,729 155,684 87,738 10 to 15
(13,249) (12,172)Vehicles 213,318 79,642 261,757 143,737 36,986 152,271 109,486 20
(38,078) (33,086)6,875 4,634
Maintenance and other equipment 540,710 85,597 607,141 441,914 61,550 484,374 122,767 15 to 33 1/3 (19,166) (19,090)
Library books 7,358 1,135 8,445 6,250 923 7,159 1,286 30 (48) (14)
40,400,396 657,902 40,999,197 16,135,748 1,625,438 17,701,635 23,297,562(71,964) (65,562)12,863 6,011
Assets subject to finance leasePlant and machinery 5,988 (5,988) – 1,377 (1,377) – – 5 Vehicles 34,832 – 27,003 12,575 5,135 12,695 14,308 20
(954) (381) (6,875) (4,634)
40,820 (13,817) 27,003 13,952 (1,257) 12,695 14,308
40,441,216 657,902 41,026,200 16,149,700 1,630,573 17,714,330 23,311,870 (72,918) (65,943)
Capital work in progress - note 12.4 146,348 677,004 408,195 408,195 (415,157)
2004 40,587,564 846,831 41,434,395 16,149,700 1,564,630 17,714,330 23,720,065
40,036,843 712,420 40,441,216 14,687,244 1,765,916 16,149,700 24,291,516 (307,995) (303,437)
(52) (23)Capital work in progress - note 12.4 190,540 341,124 146,348 146,348
(385,316)
2003 40,227,383 360,181 40,587,564 14,687,244 1,462,456 16,149,700 24,437,864
12.1 Cost of property, plant and equipment has been shown net of Government grant of Rs 68,164 thousand (2003: Rs 68,164 thousand).
*
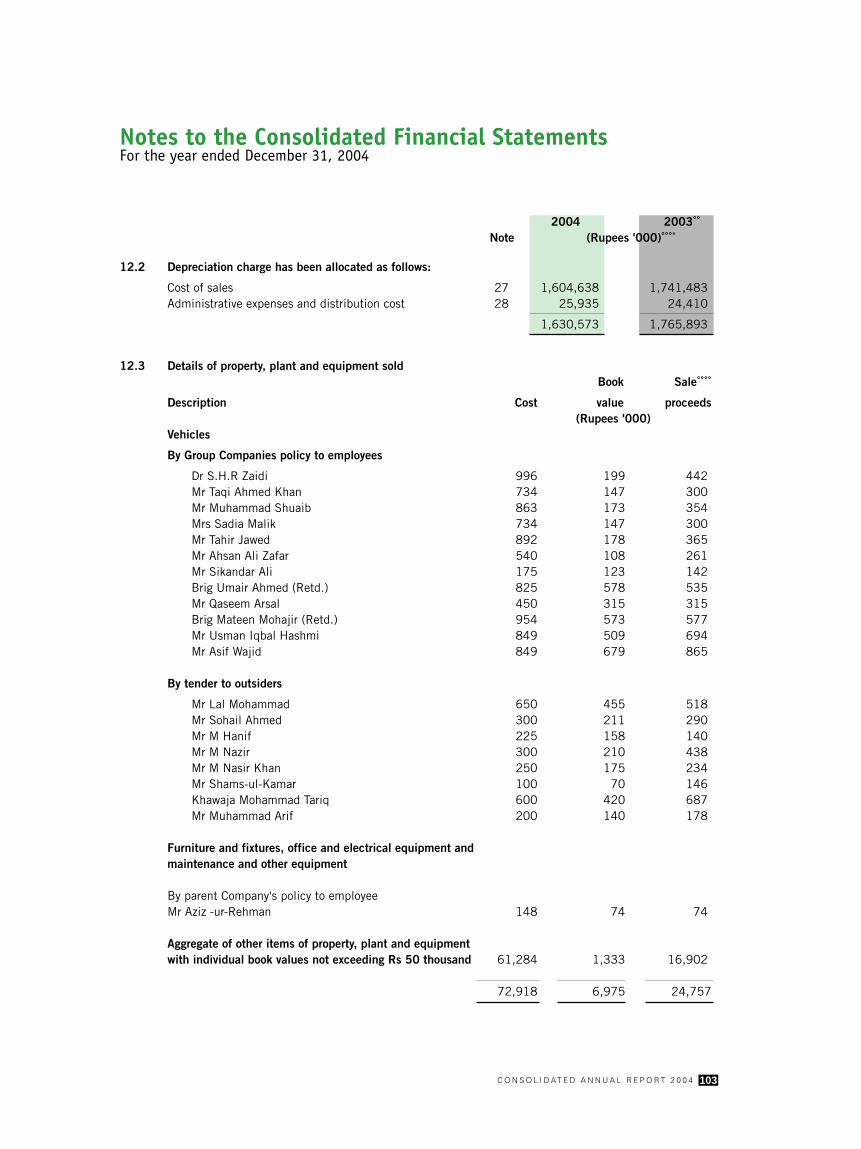
103C O N S O L I D AT E D A N N U A L R E P O R T 2 0 0 4
Notes to the Consolidated Financial StatementsFor the year ended December 31, 2004
2004 2003 Note (Rupees '000)
12.2 Depreciation charge has been allocated as follows:
Cost of sales 27 1,604,638 1,741,483 Administrative expenses and distribution cost 28 25,935 24,410
1,630,573 1,765,893
12.3 Details of property, plant and equipment soldBook Sale
Description Cost value proceeds(Rupees '000)
Vehicles
By Group Companies policy to employees
Dr S.H.R Zaidi 996 199 442 Mr Taqi Ahmed Khan 734 147 300 Mr Muhammad Shuaib 863 173 354 Mrs Sadia Malik 734 147 300 Mr Tahir Jawed 892 178 365 Mr Ahsan Ali Zafar 540 108 261 Mr Sikandar Ali 175 123 142 Brig Umair Ahmed (Retd.) 825 578 535 Mr Qaseem Arsal 450 315 315 Brig Mateen Mohajir (Retd.) 954 573 577 Mr Usman Iqbal Hashmi 849 509 694 Mr Asif Wajid 849 679 865
By tender to outsiders
Mr Lal Mohammad 650 455 518 Mr Sohail Ahmed 300 211 290 Mr M Hanif 225 158 140 Mr M Nazir 300 210 438 Mr M Nasir Khan 250 175 234 Mr Shams-ul-Kamar 100 70 146 Khawaja Mohammad Tariq 600 420 687 Mr Muhammad Arif 200 140 178
Furniture and fixtures, office and electrical equipment andmaintenance and other equipment
By parent Company's policy to employeeMr Aziz -ur-Rehman 148 74 74
Aggregate of other items of property, plant and equipmentwith individual book values not exceeding Rs 50 thousand 61,284 1,333 16,902
72,918 6,975 24,757

104 F A U J I F E R T I L I Z E R C O M P A N Y L I M I T E D
Notes to the Consolidated Financial StatementsFor the year ended December 31, 2004
2004 2003 Note (Rupees '000)
12.4 CAPITAL WORK IN PROGRESSAdvances to suppliers 117,061 – Civil works 222,380 61,392 Plant, machinery and equipment 68,754 84,956
408,195 146,348 13. INTANGIBLE ASSETS
Goodwill 13.1 1,778,464 1,883,079 Process license fee 13.2 – 23,686
1,778,464 1,906,765 13.1 Goodwill
Balance at beginning of the year 1,883,079 1,987,694 Less: Amortisation for the year 104,615 104,615
1,778,464 1,883,079 13.2 Process licence fee
Process license fee 118,422 118,422 Less: AmortisationOpening balance 94,736 71,052 Charge for the year 23,686 23,684
118,422 94,736
– 23,686 14. LONG TERM INVESTMENTS
Advance against equity investment in foreign companyPakistan Maroc Phosphore S.A.Advance against issue of shares 14.1 537,900 –
Investments available for sale 14.2Certificates of investment 246,525 250,218
Government of Pakistan Special US Dollar Bonds 969,486 1,138,202 National Savings Certificates 500,000 1,000,000 Others 101,300 –
Arabian Sea Country Club Limited (300,000 shares of Rs 10 each) 3,000 3,000 Less: Impairment in value of investment (3,000) (3,000)
– –
1,817,311 2,388,420 Investments held to maturity 14.3
Pakistan Investment Bonds 700,00 700,000 Term Finance Certificates 20,355 148,380
720,355 848,380
3,075,566 3,236,800 Less: Current portion shown under current assets 24 Investments available for sale
Certificates of investment 12,456 76,746 Government of Pakistan Special US Dollar Bonds 969,486 201,208 National Savings Certificates 500,000 500,000
1,481,942 777,954 Investments held to maturity
Pakistan Investment Bonds 100,000 – Term Finance Certificates 20,355 128,025
120,355 128,025
1,602,297 905,979
1,473,269 2,330,821

105C O N S O L I D AT E D A N N U A L R E P O R T 2 0 0 4
14.1 Advance against equity investment in foreign company
The Group companies have committed 37.5% total equity participation in Pakistan Maroc Phosphore S.A. (PMP), amounting to Moroccan Dirhams (MAD) 300,000 thousand. First tranche of MAD 75,000 thousand equivalent to Rs 537,900 thousand has been remitted while the balance shall be paid upon further equity call by PMP.
According to the Shareholders' agreement, the Group companies cannot sell the shares of PMP, outside Fauji Group (consisting of FFC, FFBL and Fauji Foundation) for a period of five years effective September 14, 2004. Further, if any legal restriction is laid on dividends by PMP, the same will be converted to interest bearing loan.
14.2 Investments available for sale
Term deposits are placed with banks and financial institutions for periods ranging from one and a half to five years at profit rates ranging from 6% to 15% per annum (2003: 11% to 15% per annum).
Government of Pakistan Special US Dollar Bonds have been issued for a period of three years. Profit is payable on these bonds at a rate of 2% above six months LIBOR.
National Savings Certificates have been issued for a period of 5 years. Monthly profit is payable on these certificates at 14% per annum.
Other investments represent 10,000 thousand certificates of Rs 10 each in Shariah compliant closed end mutual fund. The fair value at the year end was Rs 10.13 per certificate based on net asset value of the fund. Un-realised gain on re-measurement of these certificates to fair value amounting to Rs 1,300 thousand is included in the profit and loss account. Other investments also include investment of FFBL in 300,000 ordinary shares of Rs 10 each of Arabian Sea Country Club Limited (ASCCL) which has fully impaired. As per audited accounts of ASCCL for the year ended June 30, 2004, the break-up value of an ordinary share was Rs 5.89 (June 30, 2003: Rs 5.94).
Investments available for sale include Rs 1,345,568 thousand (2003: Rs 2,124,416 thousand) under lien of financial institutions against long term loans for PSFL acquisition and short term loans.
14.3 Investments held to maturity
PIBs have been issued for 5 to 10 years. Half-yearly profit is payable on these bonds at rates ranging from 11% to 14% per annum. These include Rs 700,000 thousand (2003: Rs 500,000 thousand) under lien of a bank against loan for PSFL acquisition. Fair value of these PIBs as at December 31, 2004 was Rs 703,970 thousand (2003: Rs 964,825 thousand).
Investment in TFC represents 500 certificates of Rs 100,000 each of Orix Leasing Limited. Half yearly profit is payable on these TFCs at 14% per annum (2003: 14% per annum). Fair value of TFCs of Orix Leasing Limited is Rs 20,827 thousand (2003: Rs 53,461 thousand) at the year-end.
Notes to the Consolidated Financial StatementsFor the year ended December 31, 2004

106 F A U J I F E R T I L I Z E R C O M P A N Y L I M I T E D
2004 2003 Note (Rupees '000)
15. LONG TERM LOANS AND ADVANCES
Loans and advances - considered good, to:
Executives 65,266 39,712 Other employees 41,449 55,535
106,715 95,247 Less: Amount due within twelve months, shown under current assets 21 39,387 31,327
67,328 63,920
15.1 Reconciliation of carrying amount of loans to executives and other employees:
Opening Disbursements Repayments Closing balance balance
as at January as at December1, 2004 31, 2004
(Rupees '000)
Executives 39,712 69,934 44,380 65,266 Other employees 55,535 40,386 54,472 41,449
95,247 110,320 98,852 106,715
These represent secured loans for house building, house rent advances and advances pursuant to agreement with workers which are repayable within one to ten years. Mark-up at 4% per annum (2003: 4% to 6% per annum) was charged on loans for house building during the year.
The maximum amount of advances to executives outstanding at the end of any month during the year was Rs 65,266 thousand (2003: Rs 58,680 thousand).
2004 2003 (Rupees '000)
16. LONG TERM DEPOSITS, PREPAYMENTS AND DEFERRED COSTS
Security deposits 17,760 17,232 Prepayments 1,040 1,168 Lease key money 4,050 5,619 Deferred costs – 5,240
22,850 29,259 Less : Current portion (840) (1,009)
22,010 28,250
17. DEFERRED TAX ASSET
The net balance of deferred taxation is in respect of the following major temporary differences:Accelerated depreciation 117,850 1,058,560 Unabsorbed business losses – 100,000 Provision against doubtful advances / receivables 19,463 835 Liabilities against assets subject to finance lease 6,214 9,583 Intangible assets – (8,290)
143,527 1,160,688
Notes to the Consolidated Financial StatementsFor the year ended December 31, 2004

107C O N S O L I D AT E D A N N U A L R E P O R T 2 0 0 4
2004 2003 Note (Rupees '000)
18. STORES, SPARES AND LOOSE TOOLS
Stores 134,446 137,681
Spares 2,226,988 2,033,567 Provision for slow moving and surplus items (295,713) (203,226)
1,931,275 1,830,341 Loose tools 107 590 Items in transit 181,882 174,283
2,247,710 2,142,895
19. STOCK IN TRADE
Raw materials 233,524 149,361 Work in process 14,674 27,875 Finished goods: Manufactured fertilizers 61,787 610,870 Purchased fertilizers 161,447 102,702
471,432 890,808
20. TRADE DEBTS
Considered good 1,838,398 2,248,877 Due from Fauji Foundation, an associated undertaking - considered good 20.1 584 19,881 Considered doubtful 1,979 2,059
1,840,961 2,270,817 Provision for doubtful debts (1,979) (2,059)
1,838,982 2,268,758
20.1 Maximum amount outstanding at the end of any month during the year was Rs 3,232 thousand (2003: Rs 23,518 thousand).
2004 2003 (Rupees '000)
21. LOANS AND ADVANCES
Advances to:Chief executive 21.1 – 68
Executives - considered good 21.2 573 65 Executives - considered doubtful 51 51
624 116 Provision for doubtful advances (51) (51)
573 65
Other - considered good 1,941 549 Other - considered doubtful 95 96
2,036 645 Provision for doubtful advances (95) (96)
1,941 549 Advances to suppliersConsidered good 251,858 43,859Considered doubtful 1,982 2,321
253,840 46,180Provision for doubtful advances (1,982) (2,321)
251,858 43,859 Current portion of long term loans and advances 39,387 31,327
293,759 75,868
Notes to the Consolidated Financial StatementsFor the year ended December 31, 2004

108 F A U J I F E R T I L I Z E R C O M P A N Y L I M I T E D
21.1 FFBL paid interest free house rent on behalf of the Chief Executive. Maximum amount outstanding on this account at the end of any month during the year was Rs 51 thousand (2003 : Rs 255 thousand).
21.2 This represents interest free house rent paid by FFBL on behalf of Executives. Maximum amount outstanding on this account at the end of any month during the year was Rs 625 thousand (2003: Rs 116 thousand).
2004 2003 Note (Rupees '000)
22. DEPOSITS AND PREPAYMENTS
Deposits (including current portion) 2,279 3,935 Prepayments 24,696 21,766
26,975 25,701
23. OTHER RECEIVABLES
Accrued income on investments and bank deposits 72,660 49,984 Income tax recoverable-net 545,209 502,076 Sales tax refundable – 14,884 Receivable from retirement benefit fund - considered good 8.1 929 2,306
Other receivables - considered good 23.1 40,053 87,932
- considered doubtful 55,714 53,629
95,767 141,561 Provision for doubtful receivables (55,714) (53,629)
40,053 87,932 Insurance claims 1,278 1,454
660,129 658,636
23.1 This includes Rs 680 thousand (2003: Nil) receivable from Fauji Foundation on account of expenses incurred on its behalf. The maximum amount due on this account at the end of any month during the year was Rs 680 thousand (2003: Rs Nil).
2004 2003 (Rupees '000)
24. SHORT TERM INVESTMENTS
Term deposits with banks and financial institutionsLocal currency
Available for sale (net of provision for doubtful recovery Rs 13,000 thousand; 2003: Rs 13,000 thousand) 2,550,000 1,200,000
Foreign currencyHeld to maturity 311,860 94,866 Current maturity of long term investments Available for sale 1,481,942 777,954 Held to maturity 120,355 128,025
4,464,157 2,200,845
Notes to the Consolidated Financial StatementsFor the year ended December 31, 2004

109C O N S O L I D AT E D A N N U A L R E P O R T 2 0 0 4
2004 2003 (Rupees '000)
25. CASH AND BANK BALANCESAt banks:
Deposit accountsLocal currency 5,554,086 2,417,814 Foreign currency – 297
Current accountsLocal currency (includes drafts under collection) 421,799 (16,229)Foreign currency 14,898 22,347
5,990,783 2,424,229 Drafts in hand and in transit 142,153 1,027,324 Cash in hand 1,507 1,327
6,134,443 3,452,880
Balances with banks include Rs 58,772 thousand (2003: Rs 54,751 thousand) in respect of security deposits received. Local currency deposit accounts include Rs 57,035 thousand (2003: Rs 37,439 thousand) under lien of the bank, against a guarantee issued by the bank on behalf of the Group companies. FFBL deposit accounts include Rs 695,317 thousand (2003: Rs 349,481 thousand) which are under pledge with commercial banks against letters of credit.
26. SALES
Sales include Rs 3,567,278 thousand (2003: Rs 5,760,207 thousand) in respect of sale of purchased fertilizers and are exclusive of commission, trade allowances and sales tax of Rs 455,944 thousand and Rs 3,414,103 thousand respectively (2003: Rs 601,574 thousand and Rs 3,645,589 thousand).
Notes to the Consolidated Financial StatementsFor the year ended December 31, 2004

110 F A U J I F E R T I L I Z E R C O M P A N Y L I M I T E D
2004 2003 (Rupees '000)
27. COST OF SALES
Raw materials consumed 9,565,912 5,047,717 Fuel and power 3,331,185 3,138,540 Chemicals and supplies 187,846 185,112 Salaries, wages and benefits 1,501,472 1,258,018 Rent, rates and taxes 28,586 27,386 Insurance 136,794 119,485 Technical services 14,364 13,920 Travel and conveyance 104,749 92,501 Repairs and maintenance (includes stores and spares consumed Rs 465,514 thousand; 2003: Rs 536,128 thousand) 678,310 739,255 Amortization of intangible assets-process license fee 23,686 23,684 Depreciation 1,604,638 1,741,483 Communication, establishment and other expenses 368,422 360,841 Provision for slow moving and surplus spares 92,487 51,501 (Reversal of provision)/provision for doubtful advances (340) 147 Opening stock - work in process 27,875 22,722 Closing stock - work in process (14,674) (27,875)
Cost of goods manufactured 17,651,312 12,794,437
Add: Opening stock of manufactured fertilizers 610,870 480,463 Less: Closing stock of manufactured fertilizers (61,787) (610,870)
549,083 (130,407)
Cost of sales - own manufactured fertilizers 18,200,395 12,664,030
Opening stock of purchased fertilizers 102,702 223,821 Purchase of fertilizers for resale 3,221,113 4,919,036
3,323,815 5,142,857 Closing stock of purchased fertilizers (161,447) (102,702)
Cost of sales - purchased fertilizers 3,162,368 5,040,155
21,362,763 17,704,185
28. ADMINISTRATIVE EXPENSES AND DISTRIBUTION COST
Product transportation 1,969,715 1,776,781 Salaries, wages and benefits 420,572 362,485 Rent, rates and taxes 68,705 64,988 Insurance 2,813 1,042 Technical services 4,237 3,091 Travel and conveyance 67,299 52,558 Sale promotion and advertising 52,604 57,038 Communication, establishment and other expenses 30,883 33,951 Warehousing expenses 64,730 62,365 Depreciation 25,935 24,410 Administrative expenses 81,298 77,477
2,788,791 2,516,186
Notes to the Consolidated Financial StatementsFor the year ended December 31, 2004

111C O N S O L I D AT E D A N N U A L R E P O R T 2 0 0 4
2004 2003 (Rupees '000)
29. FINANCE COST
Interest and related charges on long term financing, loans and murabaha [includes Rs Nil (2003: Rs 4,118 thousand) to CDC Holdings Sendirian Berhad (CDCH), an associated undertaing] 355,703 537,966 Mark up on long term financing from PKIC, an associated undertaking 7,321 9,218 Mark up on short term finances 63,660 143,863 Exchange loss / (gain) 24,755 (29,586)Interest on Workers' Profit Participation Fund 463 101 Finance charges on leased property, plant and equipment 1,880 2,469 Guarantee fee to banking company – 325 Guarantee fee to CDCH – 9,804 Bank charges 3,984 3,383
457,766 677,543 30. OTHER OPERATING EXPENSES
Amortisation of goodwill 104,615 104,615 Workers' Profit Participation Fund 440,911 284,728 Workers' Welfare Fund 126,019 113,965 Auditors' remunerationAudit fee 1,420 1,420 Fee for tax and other advisory services, half yearly review, audit of consolidated accounts and funds and certifications for Government and related agencies 993 3,242 Out of pocket expenses 220 206
674,178 508,176 31. OTHER OPERATING INCOME
Income from financial assetsIncome on loans, deposits and investments 408,739 392,993 Income on tax-exempt investments 45,534 36,629 Gain on remeasurement of investments available for sale to fair value 1,300 – Exchange gain / (loss) on financial instruments 15,381 (19,013)
Income from non-financial assetsGain on sale of property, plant and equipment 17,782 15,489
Other incomeOld liabilities written back 14,771 13,216 Others 43,055 48,581
546,562 487,895
Notes to the Consolidated Financial StatementsFor the year ended December 31, 2004

112 F A U J I F E R T I L I Z E R C O M P A N Y L I M I T E D
2004 2003 (Rupees '000)
32. PROVISION FOR TAXATION
Current - for the year 2,184,000 1,979,833 - for prior year 30,000 –
Deferred- for the year 657,161 (574,337)
2,871,161 1,405,496 32.1 Reconciliation of tax charge for the year
Profit before taxation 7,772,159 5,295,868 Compensation received from GOP 700,000 700,000
8,472,159 5,995,868
% % Applicable tax rate 35.00 35.00 Add: Tax effect of amounts that are not – –
deductible for tax purpose 12.87 (2.48)Tax effect of amounts relating to prior years' 0.36 Tax effect of intra group transactions 0.28
Less: Tax effect of amounts exempt from tax (0.19) (0.21)Tax effect of business losses-FFBL (0.98) (9.29)Tax effect of unabsorbed depreciation-FFBL (13.44) – Tax effect of rebates, tax credit and minimum tax on turnover due to brought forward losses (0.01) 0.42
Average effective tax rate charged on income 33.89 23.44
33. COMPENSATION RECEIVED FROM GOVERNMENT OF PAKISTAN - NET OF TAX
GOP had committed to pay Rs 5,000,000 thousand over a period of seven years in lieu of non-implementation of Fertilizer Policy, 1989. On this account, amounts aggregating Rs 2,400,000 thousand have been received from GOP up to December 31, 2004. Balance of Rs 2,600,000 thousand will be received in two instalments of Rs 700,000 thousand each during the years 2005 and 2006 and two instalments of Rs 600,000 thousand each during the years 2007 and 2008, subject to netting off the agreed GOP loan repayments of Rs 648,200 thousand to be made by FFBL each year. Tax amounting to Rs 245,000 thousand on Rs 700,000 thousand (2003: Rs 245,000 thousand on Rs 700,000 thousand) has been recognised in the profit and loss account during the year.
2004 2003
34. EARNINGS PER SHARE
Net profit after tax (Rupees '000) 4,459,157 3,771,720
Weighted average number of shares in issue during the year. 294,970 294,970
Basic and diluted earnings per share (Rupees) 15.12 12.79
There is no dilutive effect on the basic earnings per share of the Group companies.
Number of shares in issue during the year 2003 have been restated for the effect of bonus shares issued during the year 2004.
Notes to the Consolidated Financial StatementsFor the year ended December 31, 2004

113C O N S O L I D AT E D A N N U A L R E P O R T 2 0 0 4
Notes to the Consolidated Financial StatementsFor the year ended December 31, 2004
2004 2003 (Rupees '000)
35. CASH GENERATED FROM OPERATIONS
Net profit before taxation 7,772,159 5,295,868 Adjustments for:
Depreciation 1,630,573 1,765,916 Amortisation of goodwill, intangible asset and deferred costs 133,541 133,539 Provision for slow moving and surplus spares 92,487 51,501 (Reversal of provision)/ provision for doubtful advances (340) 147 Finance cost 457,766 677,543 Income on loans, deposits and investments (454,273) (429,622)Gain on sale of property, plant and equipment (17,782) (15,489)Adjustment to property, plant and equipment – 52 Provision for gratuity 35,694 33,968 Provision for pension 28,698 23,207 Exchange gain 9,080 (18,158)Gain on remeasurement of investment available for sale to fair value (1,300) – Old liabilities written back (14,771) (13,216)
1,899,373 2,209,388
9,671,532 7,505,256 Changes in working capital(Increase) / decrease in current assets:
Stores and spares (197,300) (111,009)Stock in trade 419,376 (129,326)Trade debts 429,856 (222,898)Loans and advances (217,552) 2,217 Deposits and prepayments (1,272) (2,260)Other receivables (316,012) (108,938)
Increase in current liabilities: Trade and other payables 3,767,571 399,282
3,884,667 (172,932)Changes in long term loans and advances (3,408) (13,783)Changes in long term deposits and prepayments 1,000 (1,108)
13,553,791 7,317,433 36. CASH AND CASH EQUIVALENTS
Cash and bank balances 6,134,443 3,452,880 Short term borrowings (1,176,625) (137,133)Short term highly liquid investments 3,052,500 1,205,746
8,010,318 4,521,493
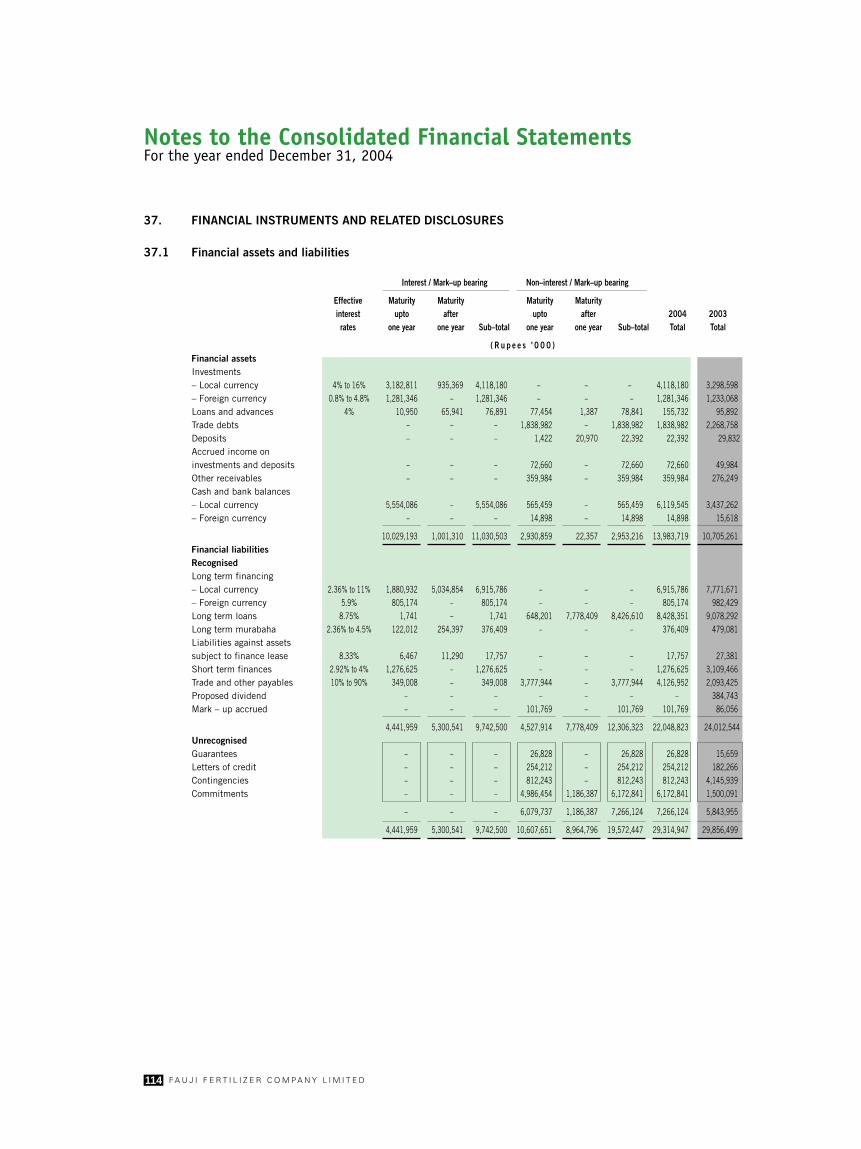
114 F A U J I F E R T I L I Z E R C O M P A N Y L I M I T E D
Notes to the Consolidated Financial StatementsFor the year ended December 31, 2004
37. FINANCIAL INSTRUMENTS AND RELATED DISCLOSURES
37.1 Financial assets and liabilities
Interest / Mark–up bearing Non–interest / Mark–up bearing
Effective Maturity Maturity Maturity Maturityinterest upto after upto after 2004 2003rates one year one year Sub–total one year one year Sub–total Total Total
( R u p e e s ' 0 0 0 ) Financial assetsInvestments– Local currency 4% to 16% 3,182,811 935,369 4,118,180 – – – 4,118,180 3,298,598 – Foreign currency 0.8% to 4.8% 1,281,346 – 1,281,346 – – – 1,281,346 1,233,068 Loans and advances 4% 10,950 65,941 76,891 77,454 1,387 78,841 155,732 95,892 Trade debts – – – 1,838,982 – 1,838,982 1,838,982 2,268,758 Deposits – – – 1,422 20,970 22,392 22,392 29,832Accrued income on investments and deposits – – – 72,660 – 72,660 72,660 49,984 Other receivables – – – 359,984 – 359,984 359,984 276,249 Cash and bank balances – Local currency 5,554,086 – 5,554,086 565,459 – 565,459 6,119,545 3,437,262 – Foreign currency – – – 14,898 – 14,898 14,898 15,618
10,029,193 1,001,310 11,030,503 2,930,859 22,357 2,953,216 13,983,719 10,705,261 Financial liabilitiesRecognisedLong term financing– Local currency 2.36% to 11% 1,880,932 5,034,854 6,915,786 – – – 6,915,786 7,771,671 – Foreign currency 5.9% 805,174 – 805,174 – – – 805,174 982,429 Long term loans 8.75% 1,741 – 1,741 648,201 7,778,409 8,426,610 8,428,351 9,078,292 Long term murabaha 2.36% to 4.5% 122,012 254,397 376,409 – – – 376,409 479,081 Liabilities against assets subject to finance lease 8.33% 6,467 11,290 17,757 – – – 17,757 27,381 Short term finances 2.92% to 4% 1,276,625 – 1,276,625 – – – 1,276,625 3,109,466 Trade and other payables 10% to 90% 349,008 – 349,008 3,777,944 – 3,777,944 4,126,952 2,093,425 Proposed dividend – – – – – – – 384,743 Mark – up accrued – – – 101,769 – 101,769 101,769 86,056
4,441,959 5,300,541 9,742,500 4,527,914 7,778,409 12,306,323 22,048,823 24,012,544Unrecognised Guarantees – – – 26,828 – 26,828 26,828 15,659 Letters of credit – – – 254,212 – 254,212 254,212 182,266 Contingencies – – – 812,243 – 812,243 812,243 4,145,939 Commitments – – – 4,986,454 1,186,387 6,172,841 6,172,841 1,500,091
– – – 6,079,737 1,186,387 7,266,124 7,266,124 5,843,955
4,441,959 5,300,541 9,742,500 10,607,651 8,964,796 19,572,447 29,314,947 29,856,499

115C O N S O L I D AT E D A N N U A L R E P O R T 2 0 0 4
37.2 Risk management
a) Concentration of credit risk
Credit risk represents the accounting loss that would be recognised at the reporting date if counter parties failed completely to perform as contracted. All the financial assets except cash in hand, are subject to credit risk. The Group companies believe that they are not exposed to major concentration of credit risk. To manage exposure to credit risk, the Group companies apply credit limits to its customers besides obtaining guarantees and by dealing with variety of major banks and financial institutions.
b) Foreign exchange risk management
Foreign currency risk arises mainly where receivables and payables exist due to transaction with foreign undertakings. Currently, the Group companies' foreign currency risk exposure is restricted to foreign currency investments and financing. As both foreign currency assets and liabilities are denominated in US Dollars, the Group companies' exposure emanating from any fluctuation in the Pak Rupee / US Dollar parity gets hedged to a large extent.
c) Interest rate risk
The Group companies have long term Rupee and foreign currency based loans at variable and fixed rates. Applicable interest rates for financial assets and liabilities have been indicated in respective notes. Variable rate long term financing except Term Finance Certificates (TFCs) is hedged against interest rate risk by holding "pre-payment option", which can be exercised upon any adverse movement in the underlying interest rates. TFCs are hedged against the interest rate risk by instituting interest rate caps and floors.
d) Liquidity risk
Prudent liquidity risk management implies maintaining sufficient cash and marketable securities, the availability of funding to an adequate amount of committed credit facilities and the ability to close out market positions due to the dynamic nature of the business. The Group companies' treasuries aim at maintaining flexibility in funding by keeping committed credit lines.
37.3 Fair value of financial assets and liabilities
The carrying values of all financial assets and liabilities reflected in the consolidated financial statements approximate their fair values except investments held to maturity which are carried at amortised cost.
Notes to the Consolidated Financial StatementsFor the year ended December 31, 2004

116 F A U J I F E R T I L I Z E R C O M P A N Y L I M I T E D
Notes to the Consolidated Financial StatementsFor the year ended December 31, 2004
38. RE–STATED PROFORMA INFORMATIONSTATEMENT OF RETAINED EARNINGS
Actual ProformaRestated Restated
2004 2003 2004 2003(Rupees `000)
Opening balance as at January 1, as previously reported (1,536,173) (2,142,934) (1,536,173) (2,142,934)Change in accounting policy–Proposed finaldividend 2003: Rs 1.5 (2002: Rs 1.0) per share – – 384,743 256,496
Opening balance as at January 1, restated (1,536,173) (2,142,934) (1,151,430) (1,886,438)Profit for the year 4,459,157 3,771,720 4,459,157 3,771,720 Adjustment of dilution in holding of FFBL shares 44,817 – 44,817 – Transfer from/ (to) general reserve 700,000 (600,000) 700,000 (600,000)Transfer to reserve for issue of bonus shares (384,744) – (384,744) – Dividends (3,231,849) (2,564,959) (3,616,592) (2,436,712)
Closing balance as at December 31, 51,208 (1,536,173) 51,208 (1,151,430)
39. REMUNERATION OF CHIEF EXECUTIVE, DIRECTORS AND EXECUTIVES
The aggregate amounts charged in the accounts for the year for remuneration including benefits applicable to the chief executive, directors and executives of the Group companies are given below:
2004 2003
Chief Executives Chief ExecutivesExecutive Executive
(Rupees `000)
Managerial remuneration 4,693 342,875 4,660 260,908 Retirement benefits 1,391 49,767 2,354 37,063 Utilities and upkeep 609 19,256 572 15,248 Travel assistance 1,284 46,523 1,924 35,157 Bonus and other awards 110 31,559 100 30,853 Good performance award 120 15,526 – 42,501 Others 142 11,443 78 10,023
Total 8,349 516,949 9,688 431,753
No. of persons 2 221 2 175
The above were provided with medical facilities; the chief executive and certain executives were also provided with certain household equipment and use of vehicles in accordance with the Group companies' policy. Leave encashment of Rs 685 thousand (2003: Rs 638 thousand) to chief executive and Rs 4,611 thousand (2003: Rs 4,954 thousand) to the executives was paid on separation, in accordance with the Group companies' policy.
In addition, 24 (2003: 24) directors were paid aggregate fee of Rs 226 thousand (2003: Rs 162 thousand).

117C O N S O L I D AT E D A N N U A L R E P O R T 2 0 0 4
Notes to the Consolidated Financial StatementsFor the year ended December 31, 2004
40. RELATED PARTY TRANSACTIONS
Fauji Foundation holds 44.35% (2003: 44.35%) shares of FFC at the year end. Therefore all subsidiaries and associated undertakings of Fauji Foundation are related parties of FFC and its subsidiary (FFBL). The related parties comprise of directors, key management personnel, entities over which the directors are able to exercise influence and employees' funds. Amounts due from and due to these undertakings are shown under receivables and payables. The remuneration of chief executive, directors and executives is disclosed in note 39 to the consolidated financial statements. Associated undertakings of the Group with whom such transactions have taken place are given below:
2004 2003 (Rupees '000)
Fauji FoundationOffice rent 3,071 3,015 Right shares issued 3,713 – Equity injection in FFBL – 250,000 Receipt on account of payment made to Pakistan MarocPhosphore S.A., on FF's behalf 358,600 – Payment for shares of Pakistan Maroc Phosphore S.A. 179,300 – Expenses related to long term investment incurred on FF's behalf 680 – Reimbursement of expenses on behalf of the Company 874 600 Sale of fertilizer 7,259 35,253 Medical services 42 674
Mari Gas Company LimitedPurchase of gas as feed and fuel 5,884,410 5,313,857
Haldor Topsoe A/s, DenmarkTechnical services received 14,364 13,920
CDC Holdings Sendirian BerhadRepayment of principal portion of loan – 93,679 Financial charges and guarantee commission paid – 13,922 Right shares issued 24,015 –
Pak Kuwait Investment Company (Pvt) LimitedRepayment of principal portion of loan 22,858 – Financial charges paid 7,321 9,218 Right shares issued 5,350 –
Maroc Phosphore S.A., Morocco Purchase of raw materials 3,445,394 –
Jordan Phosphate Mines Company LimitedFinancial charges paid – 34,671 Pakistan Maroc Phosphore S.A.Advance against issue of shares 537,900 –
Payment to:Employees' Provident Fund Trusts 107,375 103,055 Employees' Gratuity Fund Trusts 50,353 52,968 Employees' Pension Fund Trust 27,321 21,053
41. MAJOR CONTRACTS
FFBL has the following major agreements:
41.1 Gas supply agreement with Sui Southern Gas Company Limited. Feed gas is supplied to FFBL at subsidized rates under the Government policies.
41.2 Phosphoric acid supply agreement with Maroc Phosphore S.A., Morocco.

118 F A U J I F E R T I L I Z E R C O M P A N Y L I M I T E D
Notes to the Consolidated Financial StatementsFor the year ended December 31, 2004
2004 2003 (Tonnes '000) 42. GENERAL
42.1 Production capacity
Design capacityUrea 2,455 2,455
DAP 445 445Production
Urea 2,748 2,709
DAP 381 73
42.2 Number of employees (Number) Number of employees at year end 3,162 2,992
42.3 Facilities of letters of guarantee and letters of creditFacilities of letters of guarantee and letters of credit amounting to Rs 20,000 thousand and Rs 2,575,000 thousand (2003: Rs 23,750 thousand and Rs 2,275,000 thousand) respectively are available to FFC under first charge by way of equitable mortgage on all fixed assets of FFC.
42.4 Donations aggregating Rs 2,085 thousand (2003: Rs 1,651 thousand), included under cost of sales do not include any amount paid to any person or organisation in which the chief executive, directors or their spouses had any interest.
42.5 The Board of Directors of FFC in their meeting held on January 31, 2005 have proposed a final dividend of Rs 3 per share in addition to interim dividend of Rs 12 per share already distributed and incorporated in the consolidated financial statements. The final dividend shall be recorded as liability in the consolidated financial statements for the next financial year as required by International Accounting Standard 10: "Events after the Balance Sheet Date".
42.6 Figures have been rounded off to the nearest thousand of rupees unless otherwise stated.
42.7 Due to revision of the 4th schedule to the Companies Ordinance,1984 by the Securities and Exchange Commission of Pakistan vide SRO. 589(1)/2004 dated July 5, 2004, previous years' figures have been arranged and / or reclassified, wherever necessary, for the purpose of comparison.
42.8 These consolidated financial statements have been authorised for issue by the Board of Directors of FFC on January 31, 2005.
Chairman Chief Executive Director

120 F A U J I F E R T I L I Z E R C O M P A N Y L I M I T E D
Pattern of ShareholdingAs at December 31, 2004
Number of Shareholding Total Number
Shareholders From To of Shares
205 1 100 11,744715 101 500 197,946
1417 501 1,000 909,3471421 1,001 5,000 3,199,867
416 5,001 10,000 2,926,742191 10,001 15,000 2,311,430
80 15,001 20,000 1,416,63555 20,001 25,000 1,262,24040 25,001 30,000 1,134,88921 30,001 35,000 696,48512 35,001 40,000 448,70717 40,001 45,000 718,43021 45,001 50,000 1,004,04011 50,001 55,000 571,09020 55,001 60,000 1,160,05013 60,001 65,000 814,445
8 65,001 70,000 547,55014 70,001 75,000 1,019,100
4 75,001 80,000 309,4607 80,001 85,000 573,7055 85,001 90,000 439,5865 90,001 95,000 464,0357 95,001 100,000 692,8504 100,001 105,000 410,5605 110,001 115,000 572,0001 115,001 120,000 115,9202 120,001 125,000 241,5002 125,001 130,000 258,1503 135,001 140,000 411,7052 140,001 145,000 287,5302 145,001 150,000 295,7002 150,001 155,000 305,0951 155,001 160,000 158,0104 160,001 165,000 654,5652 165,001 170,000 336,8892 170,001 175,000 342,9752 175,001 180,000 354,6601 180,001 185,000 184,0002 185,001 190,000 378,2351 190,001 195,000 192,8254 195,001 200,000 797,7751 200,001 205,000 201,7502 210,001 215,000 425,5001 215,001 220,000 217,9252 225,001 230,000 460,0002 230,001 235,000 465,2201 235,001 240,000 239,5001 240,001 245,000 244,0003 245,001 250,000 748,3101 250,001 255,000 254,2851 265,001 270,000 265,8902 275,001 280,000 551,3101 280,001 285,000 281,1051 295,001 300,000 300,0001 310,001 315,000 315,0001 315,001 320,000 316,2502 320,001 325,000 645,7851 325,001 330,000 327,4051 330,001 335,000 331,1252 345,001 350,000 698,495

121C O N S O L I D A T E D A N N U A L R E P O R T 2 0 0 4
Pattern of ShareholdingAs at December 31, 2004
Number of Shareholding Total Number
Shareholders From To of Shares
2 350,001 355,000 703,8322 355,001 360,000 715,4302 360,001 365,000 724,0001 370,001 375,000 373,8002 380,001 385,000 766,6951 395,001 400,000 400,0001 405,001 410,000 409,0151 450,001 455,000 454,2501 470,001 475,000 472,6501 500,001 505,000 500,6251 515,001 520,000 518,1001 525,001 530,000 530,0001 530,001 535,000 533,0001 540,001 545,000 544,4101 555,001 560,000 559,5001 560,001 565,000 563,5004 570,001 575,000 2,295,7451 575,001 580,000 577,8751 590,001 595,000 593,6003 600,001 605,000 1,807,9251 615,001 620,000 619,8301 645,001 650,000 647,1551 665,001 670,000 667,7851 685,001 690,000 690,0001 695,001 700,000 700,0001 715,001 720,000 718,8651 720,001 725,000 722,4001 745,001 750,000 749,6852 800,001 805,000 1,600,5801 810,001 815,000 811,2101 870,001 875,000 871,3551 880,001 885,000 883,7001 910,001 915,000 912,5651 1,025,001 1,030,000 1,029,5101 1,095,001 1,100,000 1,098,7701 1,165,001 1,170,000 1,168,5561 1,175,001 1,180,000 1,176,7001 1,305,001 1,310,000 1,309,5441 1,345,001 1,350,000 1,349,0951 1,705,001 1,710,000 1,708,6701 1,740,001 1,745,000 1,741,9501 1,840,001 1,845,000 1,842,3251 2,000,001 2,005,000 2,001,1151 2,070,001 2,075,000 2,074,1251 2,075,001 2,080,000 2,079,0501 2,425,001 2,430,000 2,428,8001 2,430,001 2,435,000 2,433,7001 2,890,001 2,895,000 2,890,3451 3,650,001 3,655,000 3,652,7381 3,690,001 3,695,000 3,692,9951 3,810,001 3,815,000 3,813,8151 4,390,001 4,395,000 4,390,5021 5,495,001 5,500,000 5,500,0001 8,665,001 8,670,000 8,667,6331 18,505,001 18,510,000 18,506,9551 28,545,001 28,550,000 28,545,4101 130,810,001 130,815,000 130,811,580
4841 294,970,287

122 F A U J I F E R T I L I Z E R C O M P A N Y L I M I T E D
Pattern of ShareholdingAs at December 31, 2004
No of No of PercentageSerial Categories of Shareholders share- Shares % No. holders held
1. Investment Companies 17 11,363,423 3.85
2. Insurance Companies 26 25,897,525 8.78
3. Joint Stock Companies 128 9,622,042 3.26
4. Financial Institutions 33 53,185,134 18.03
5. Modarabas 16 269,705 0.09
6. Foreign Investors 32 10,096,038 3.42
7. Leasing Companies 3 23,230 0.01
8. Charitable Trust & Others 103 153,286,225 51.97
9. Individuals 4483 31,226,965 10.59
Total 4,841 294,970,287 100.00
NIT & ICP (namewise details) No of Shares
National Investment Trust 29,616,765Investment Corporation of Pakistan 1,709,245
Executives 306,665
Public Sector Companies and Corporations 8,742,796
Banks, Development Finance Institutions, Non-Banking Finance Institutions, 46,491,728Insurance Companies, Modarabas, Mutual Funds
Shareholders holding ten percent or more voting interest
Fauji Foundation 130,811,580

Form of Proxy27th Annual General Meeting
I/We
of
being a member(s) of Fauji Fertilizer Company Limited hold
Ordinary Shares hereby appoint Mr/Mrs/Miss
��� or failing him/her
of as my/our proxy in my / our absence to attend and vote for
me / us and on my / our behalf at the Twenty Seventh Annual General Meeting of the Company to be held on
February 28, 2005 and / or any adjournment thereof.
As witness my / our hand seal this day of 2005.
Signed by
in the presence of
Folio No. CDC Account No.
Participant I.D. Account No.
Signature onFive Rupees
Revenue Stamp
The Signature shouldagree with the
specimen registeredwith the Company
Important:
1. This Proxy Form, duly completed and signed, must be received at the Registered Office of the Company,
93-Harley Street, Rawalpindi not less than 48 hours before the time of holding the meeting.
2. If a member appoints more than one proxy and more than one instruments of proxies are deposited by
a member with the Company, all such instruments of proxy shall be rendered invalid.
3. For CDC Account Holders/Corporate Entities
In addition to the above the following requirements have to be met.
(i) Attested copies of NIC or the passport of the beneficial owners and the proxy shall be provided with
the proxy form.
(ii) The proxy shall produce his original NIC or original passport at the time of the meeting.
(iii) In case of a corporate entity, the Board of Directors resolution/power of attorney with specimen
signature shall be submitted (unless it has been provided earlier alongwith proxy form to the Company).

AFFIXCORRECTPOSTAGE
Company SecretaryFAUJI FERTILIZER COMPANY LIMITED93-Harley Street,Rawalpindi.
119C O N S O L I D A T E D A N N U A L R E P O R T 2 0 0 4