Contents Chemical Engineering and Processing: Process...
14
Numerical simulation of mixing at 1–1 and 1–2 microfluidic junctions Sourav Sarkar a , K.K. Singh b, *, V. Shankar a , K.T. Shenoy b a Department of Chemical Engineering, Indian Institute of Technology, Kanpur 208016, India b Chemical Engineering Division, Bhabha Atomic Research Centre, Trombay, Mumbai 400085, India A R T I C L E I N F O Article history: Received 5 April 2014 Received in revised form 28 July 2014 Accepted 23 August 2014 Available online 30 August 2014 Keywords: Microchannel Microfluidics Mixing CFD Junction A B S T R A C T Computational fluid dynamics (CFD) simulations are carried out to evaluate mixing in different types of 1–1 and 1–2 microfluidic junctions. Computational approach adopted in the study is validated by comparing its predictions with theoretical and experimental results. Asymmetric microfluidic junctions are found to show better mixing than symmetric microfluidic junctions. Among asymmetric microfluidic junctions, mixing is found to improve with increasing skewness of the junction. A new 1–1 microfluidic junction named as OA 10 0 –20 0 W-junction is found to give the best mixing among all 1–1 microfluidic junctions evaluated in this study. Based on this new 1–1 microfluidic junction, several 1–2 microfluidic junctions are conceptualized. Among these 1–2 microfluidic junctions a junction named as 10 0 –20 0 –165 0 WY-junction is found to give the best mixing. Different approaches to improve microfluidic mixing viz simple-junction–complex-layout, complex-junction–simple-layout and complex-junction–complex-layout, are compared. ã 2014 Elsevier B.V. All rights reserved. 1. Introduction In recent years a large number of studies have been reported in the field of chemical microprocessing which deals with carrying out unit operations and unit processes in channels having characteristic diameter of the order of 100 microns. There are several advantages associated with chemical microprocessing. High surface to volume ratio in microchannels ensures intensified heat transfer. Since the flow cross-sections are small, very high specific interfacial areas can be obtained in two-phase reactive/non-reactive systems. Inventories in microchannels are very small. This makes them intrinsically safe for processes involving hazardous and toxic chemicals. Since the setups based on microchannels are very compact, they can be used for distributed and point-of-use production of chemicals. Uncertainties in scale up of processes based on microchannels are less due to numbering up approach followed in scale up. Although the above advantages make chemical microprocessing very attractive, a few limitations or disadvantages of chemical microprocessing need to be overcome. One possible limitation is inadequate mixing if micro- channels are to be used for carrying out reactions. Since equivalent diameters are very small, flow in a microchannel is typically laminar. This is not good for mixing as mixing is mainly by molecular diffusion. Poor mixing may render a significant fraction of the length of a microchannel underutilized thus defeating the very purpose of miniaturization. Therefore, enhancement of mixing in microchannels has been an active area of research as evident by a large number of studies reported in literature [1–3]. Several review papers on mixing in microchannels provide a comprehensive account of the research in this field [4,5]. Different types of studies have been reported on mixing in microchannels. While there are many studies on mixing at simple microfluidic junctions [6–9], studies focused on proposing and evaluating new designs of microfluidic junctions are also reported [10–12]. Studies proposing modifications in the layout of the channel after the microfluidic junction to enhance mixing are also reported [13–16]. While there are several experimental studies [7,16–18], in majority of the studies numerical simulations have been used. Though most of the studies are on liquid phase mixing, studies on gas phase mixing have also been reported [6]. Several studies from the vast literature in this field are summarized in Table 1. As can be observed, different ideas such as putting obstacles in the main channel, using pulsating flow, using ultrasound, modification in geometry of the junction and layout of the channel have been tried to enhance mixing. In this study also several new ideas to improve mixing in microchannels are presented and evaluated using CFD simulations as a virtual prototyping tool. Specifically, two new designs of microfluidic junctions which show better mixing than more conventional microfluidic junctions are proposed. A concept of skewness of 1–1 microfluidic junctions is also put forth. The computational approach used in numerical simulations has been validated by comparing its predictions with the experimental and theoretical results. * Corresponding author. Tel.: +91 2225592601; fax: +91 2225505151. E-mail address: [email protected] (K.K. Singh). http://dx.doi.org/10.1016/j.cep.2014.08.010 0255-2701/ ã 2014 Elsevier B.V. All rights reserved. Chemical Engineering and Processing 85 (2014) 227–240 Contents lists available at ScienceDirect Chemical Engineering and Processing: Process Intensification journal homepa ge: www.elsev ier.com/locate/cep
Transcript of Contents Chemical Engineering and Processing: Process...

Chemical Engineering and Processing 85 (2014) 227–240
Numerical simulation of mixing at 1–1 and 1–2 microfluidic junctions
Sourav Sarkar a, K.K. Singh b,*, V. Shankar a, K.T. Shenoy b
aDepartment of Chemical Engineering, Indian Institute of Technology, Kanpur 208016, IndiabChemical Engineering Division, Bhabha Atomic Research Centre, Trombay, Mumbai 400085, India
A R T I C L E I N F O
Article history:Received 5 April 2014Received in revised form 28 July 2014Accepted 23 August 2014Available online 30 August 2014
Keywords:MicrochannelMicrofluidicsMixingCFDJunction
A B S T R A C T
Computational fluid dynamics (CFD) simulations are carried out to evaluate mixing in different types of1–1 and 1–2 microfluidic junctions. Computational approach adopted in the study is validated bycomparing its predictions with theoretical and experimental results. Asymmetric microfluidic junctionsare found to show better mixing than symmetric microfluidic junctions. Among asymmetricmicrofluidic junctions, mixing is found to improve with increasing skewness of the junction. A new1–1 microfluidic junction named as OA 100–200 W-junction is found to give the best mixing among all1–1 microfluidic junctions evaluated in this study. Based on this new 1–1 microfluidic junction, several1–2 microfluidic junctions are conceptualized. Among these 1–2 microfluidic junctions a junction namedas 100–200–1650 WY-junction is found to give the best mixing. Different approaches to improvemicrofluidic mixing viz simple-junction–complex-layout, complex-junction–simple-layout andcomplex-junction–complex-layout, are compared.
ã 2014 Elsevier B.V. All rights reserved.
Contents lists available at ScienceDirect
Chemical Engineering and Processing:Process Intensification
journal homepa ge: www.elsev ier .com/locate /cep
1. Introduction
In recent years a large number of studies have been reported inthe field of chemical microprocessing which deals with carryingout unit operations and unit processes in channels havingcharacteristic diameter of the order of 100 microns. There areseveral advantages associated with chemical microprocessing.High surface to volume ratio in microchannels ensures intensifiedheat transfer. Since the flow cross-sections are small, very highspecific interfacial areas can be obtained in two-phasereactive/non-reactive systems. Inventories in microchannels arevery small. This makes them intrinsically safe for processesinvolving hazardous and toxic chemicals. Since the setups based onmicrochannels are very compact, they can be used for distributedand point-of-use production of chemicals. Uncertainties in scale upof processes based on microchannels are less due to numbering upapproach followed in scale up. Although the above advantagesmake chemical microprocessing very attractive, a few limitationsor disadvantages of chemical microprocessing need to beovercome. One possible limitation is inadequate mixing if micro-channels are to be used for carrying out reactions. Since equivalentdiameters are very small, flow in a microchannel is typicallylaminar. This is not good for mixing as mixing is mainly bymolecular diffusion. Poor mixing may render a significant fractionof the length of a microchannel underutilized thus defeating the
* Corresponding author. Tel.: +91 2225592601; fax: +91 2225505151.E-mail address: [email protected] (K.K. Singh).
http://dx.doi.org/10.1016/j.cep.2014.08.0100255-2701/ã 2014 Elsevier B.V. All rights reserved.
very purpose of miniaturization. Therefore, enhancement ofmixing in microchannels has been an active area of research asevident by a large number of studies reported in literature [1–3].Several review papers on mixing in microchannels provide acomprehensive account of the research in this field [4,5]. Differenttypes of studies have been reported on mixing in microchannels.While there are many studies on mixing at simple microfluidicjunctions [6–9], studies focused on proposing and evaluating newdesigns of microfluidic junctions are also reported [10–12]. Studiesproposing modifications in the layout of the channel after themicrofluidic junction to enhance mixing are also reported [13–16].While there are several experimental studies [7,16–18], in majorityof the studies numerical simulations have been used. Though mostof the studies are on liquid phase mixing, studies on gas phasemixing have also been reported [6]. Several studies from the vastliterature in this field are summarized in Table 1. As can beobserved, different ideas such as putting obstacles in the mainchannel, using pulsating flow, using ultrasound, modification ingeometry of the junction and layout of the channel have been triedto enhance mixing.
In this study also several new ideas to improve mixing inmicrochannels are presented and evaluated using CFD simulationsas a virtual prototyping tool. Specifically, two new designs ofmicrofluidic junctions which show better mixing than moreconventional microfluidic junctions are proposed. A concept ofskewness of 1–1 microfluidic junctions is also put forth. Thecomputational approach used in numerical simulations has beenvalidated by comparing its predictions with the experimental andtheoretical results.

Notations
c Concentration (mol/m3)ci Concentration at ith cell in the flow cross-section of
interest (mol/m3)c Average concentration in the cross-section of interest
(mol/m3)DAB Diffusivity of binary mixture of A and B (m2/s)i Index of computational cell (�)I Mixing index (�)m number of cells in computational domain (�)n̂ Unit vector representing outward normal to a boundary/
surface~N Molar flux (mol/m2 s)p Pressure (Pa)p0 Pressure at outlet (Pa)~v Velocity vector (m/s)V0 Average velocity at inlet (m/s)x Axial distance from the junction (m)
Greek symbolsd Diffusion zone thickness (m)h Number of nodes in the cross section of interest (�)y Kinematic viscosity (m2/s)r Density (Kg/m3)s2 Variance of concentration (mol2/m6)s2max Maximum variance of concentration (mol2/m6)
228 S. Sarkar et al. / Chemical Engineering and Processing 85 (2014) 227–240
2. Computational approach
2.1. Description of the system and geometries
The physics to be simulated involves mixing of two streams of thesame liquid. One stream contains a solute to be mixed and the otherdoes not. Two types of microfluidic junctions,1–1 type and 1–2 type,are evaluated. There are two inlets and one outlet in 1–1 typemicrofluidicjunctions.Inthesejunctionsthereisonlyoneinletforeachliquid stream to be mixed and hence the name 1–1. There are 3 inletsand1outletin1–2typemicrofluidicjunctions.Inthesejunctionsoneofthe liquid streams to be mixed is split into two streams before it iscontacted with the other stream. Since there is 1 inlet for one streamand2inletsfortheotherstream,thesejunctionshavebeencalledas1–2 junctions. All the inlets are defined as velocity inlets with flowentering perpendicularly. The inlet channels and the main channel inall the microchannels have 500 mm � 500 mm square cross-sectionexcept for the simulations in which effect of aspect ratio on mixing isstudied. All the microchannels are 5 mm long. The completedescription of the geometries is given in subsequent sections. Theinletflowratesofthetwoliquidstreamsbeingmixedaresame,exceptfor the simulations in which effect of unequal flow of the streams onmixingisstudied.In1–2junctions,oneofthetwoliquidstreamsissplitintotwoequalparts.Velocityattheinletsof thesplitstreamishalf thevalueofthevelocityattheinletoftheintactstream.Thiscorrespondstoequalsplitting.However,afewsimulationsarealsocarriedouttostudythe effectof unequalsplitting on mixing.One of the two streams to bemixed carries a solute, concentration of which is specified at the inlet(s). Reynolds numbers reported in this study are calculated using thehydraulic diameter and velocity in the main channel.
2.2. Governing equations
The computational approach used in this study involvesnumerical solution of the Navier–Stokes equations and
convection–diffusion equation for steady-state flow of an incom-pressible fluid. The equations are:
r �~v ¼ 0 (1)
~v � r~v ¼ �1rrp þ yr2~v (2)
ð~v � rÞc ¼ DABr2c (3)
Where~v is the velocity vector, DAB is the molecular diffusivity and cis the concentration. In all simulations density r and viscosity mare kept constant at 998.2 kg/m3 and 0.00103 Pa s (liquid water atroom temperature). Molecular diffusivity is 10�9m2/s. A commer-cial solver COMSOL Multiphysics 4.2 has been used to carry out thenumerical simulations.
2.3. Boundary conditions
The velocity and concentration boundary conditions at theinlets can be written as:
~v ¼ �v0n̂ (4)
c ¼ c0 (5)
where appropriate values are assigned to v0 and c0. c0 is taken as1 mol/m3 in all the simulations reported in this study. No slip andzero flux conditions are used at the walls of the channels. Theseboundary conditions can be written as:
~v ¼ 0 (6)
�n̂ � ~N ¼ 0 (7)
where ~N denotes the flux of the solute getting mixed and consistsof the convective and diffusive flux. Expression for~N is given by thefollowing equation:
~N ¼ ðc~v � DABrcÞ (8)
Pressure outlet with zero viscous stress and convective fluxboundary conditions are used at the outlet. The relevant equationsare:
p ¼ p0 ¼ 0; m rv* þ rv
*� �T� �
� n̂ ¼ 0 (9)
�n̂ � DABrc ¼ 0 (10)
2.4. Quantification of mixing
As reported in several other studies on mixing in microchannels[10,14] mixing is quantified using a mixing index defined as:
I ¼ 1 �ffiffiffiffiffiffiffiffiffiffiffis2
s2max
s !� 100 (11)

Table 1Summary of some representative studies on mixing in microchannels.
Reference Type of micromixer/microfluidic junction Remarks/findings
[6] Opposed T-junction, Y-junctions (with different included anglesbetween the two inlets), Y-junction with throttling at the junction
Numerical simulations were carried out to study gas phase mixing inmicrochannels having different types of microfluidic junctions. Effects of velocityand geometry of the microfluidic junction on mixing length and pressure dropwere studied. Throttling effect was found to improve mixing but at the expense ofincrease in pressure drop.
[17] Opposed T-junction Experimental and computational studied were carried out to study mixing atopposed T-junction. Presence of asymmetrical flow velocities at the inlets anddissimilar viscosities of the two liquids were found to result in swirling flowcausing enhancement in mixing.
[18] Opposed T-junction Both experimental and numerical studies were carried out to identify differentflow regimes affecting mixing in an opposed T-mixer. Three regimes – laminarregime, vortex regime and engulfment regimes – were identified. Mixing wasfound to be the best in engulfment regime.
[16] Y-junction microchannels with obstacles in the main channel Both experimental and computational studies were carried out to studyenhancement of mixing due to diamond-shaped obstacles placed in the straightchannel following the Y-junction. Numerical simulations were carried out forobstacles having different shapes such as circular, triangular, smooth and steppeddiamond. Mixing efficiency was found to be the best for circular obstacles.
[10] Opposed T-junction, Y-junctions (with different angles), throttleopposed T-junction and TT junction with circular obstacles in the mainchannel
Both experimental and computational studies were carried out. Throttle opposedT-junction and TT- junction (two back-to-back opposed T-junctions) havingcylindrical obstacles on the downstream side are the two new designs. In the TT-junction both the streams to be mixed are split. The split streams are applied atdiagonally opposite inlets.
[7] Opposed T-junction Residence time distributions in microchannel were studied experimentally as wellas by carrying out numerical simulations. The main objective of the study was toshow that numerical simulations can be used to predict the residence timedistributions in microchannels.
[8] Opposed T-junction Possibility of enhancement in mixing by using pulsating flow was explored usingnumerical simulations. Optimum conditions to maximize mixing were suggested.
[15] No microfluidic junction, simulations were carried out for a singlerepetitive unit of the microchannel
Mixing in different types of serpentine microchannels such as zigzag square anglemicrochannel, curvilinear microchannel, and square-wave microchannel wasstudied using numerical simulations. Curvilinear and square-wave microchannelswere found to be more efficient than zigzag microchannels.
[9] Cross T-junction and cross-junction Numerical simulations were carried out to study mixing at cross T-junction andcross-junction. Reynolds numbers were in the range in which mixing was mainlyby molecular diffusion. Effect of the position of interface on mixing was found to bemore pronounced for lower Reynolds number (�10) than for higher Reynoldsnumbers.
[11] A 3D microchannel geometry with periodic splitting and joiningstructures
Thrust of this numerical study was to identify the effect of false diffusion in theresults predicted by numerical simulations.
[14] Opposed T-junction with curved main channel with and withoutgrooves on the wall
In this study involving numerical simulations, mixing in curved microchannelshaving grooves and without having grooves in the wall was compared.Microchannel with grooves showed better mixing with lower pressure drop.
[13] Opposed T-junction with periodic structures in the main channel Enhancement in mixing due to periodic obstructing structures in the main channelwas investigated using numerical simulations and experiments. Mixing is found tobe almost complete after 24 periodic structures.
[19] Y-junction microchannel with the main channel having rectangularprotrusions
Mixing performance of Y-junction microchannels with the main channel havingrectangular protrusions (symmetric and staggered) was studied using numericalsimulations. Effects of depth, width, distance between protrusions and number ofprotrusions on mixing and pressure drop were studied. Mixing in microchannelshaving symmetric and staggered protrusions was found to be similar but thepressure drop was less in the microchannels having staggered protrusions. Hence,staggered protrusions were adjudged better than the symmetric protrusions.
[12] Split and recombine micromixer with tapered curved microchannel Study comprises of experiments and numerical simulations. Curves in themicrochannel were found to induce Dean vortices which improve mixing. Unevensplitting of stream due to tapering of cross-section and impingement effect onrecombination were also found to improve mixing.
[20] Y-junctions of different angles Mixing in Y-junction microchannels having different angles (+300, �600, �900,and �1200) was experimentally studied using micro laser induced fluorescence(mLIF) and micro particle image velocimetry (mPIV). Y-junction with �600 anglebetween the inlets was found to give the best mixing.
[21] Y-junction, T-junction, Lambda shape junction Enhancement of microfluidic mixing due to high frequency ultrasound wasstudied experimentally.
S. Sarkar et al. / Chemical Engineering and Processing 85 (2014) 227–240 229
s2 ¼ 1h
Xhi¼1
ðci � cÞ2 (12)
where ci is the concentration of the solute at the ith element of theoutlet, c is the average concentration of the solute at the outlet andh is the number of elements at the outlet face. For the meshes usedin the final simulations typical value of h is about 1150. s2 and
s2max denote actual variance and maximum possible variance at
the outlet. s2max corresponds to zero mixing. s2
max for equal flowrates of the streams to be mixed is calculated by taking c equal to0.5 and ci zero for half of the cross-section and 1 for the remaininghalf. Thus, value of s2
max in case of equal flow of the streams is0.25. The mixing index can have maximum value of 100representing complete mixing and minimum value of 0 indicatingno mixing. When flow rates of the streams to be mixed are unequal,appropriate values of c are used for calculating s2 and s2
max.
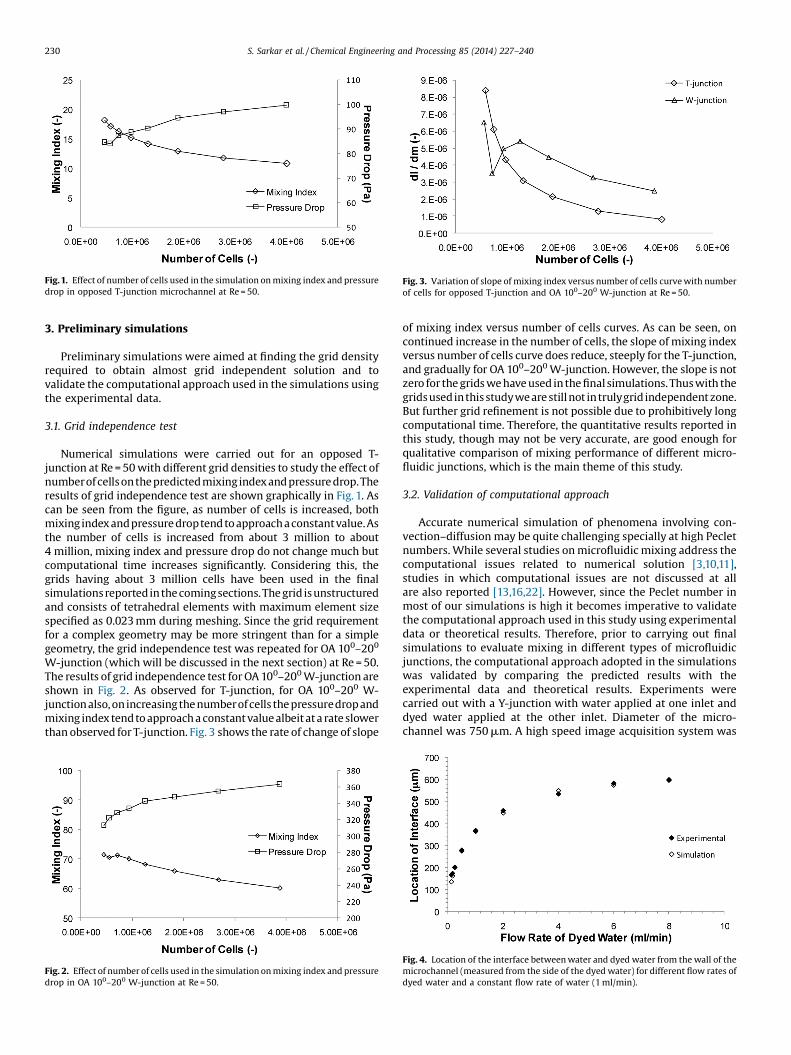
Fig.1. Effect of number of cells used in the simulation on mixing index and pressuredrop in opposed T-junction microchannel at Re = 50.
Fig. 3. Variation of slope of mixing index versus number of cells curve with numberof cells for opposed T-junction and OA 100–200 W-junction at Re = 50.
230 S. Sarkar et al. / Chemical Engineering and Processing 85 (2014) 227–240
3. Preliminary simulations
Preliminary simulations were aimed at finding the grid densityrequired to obtain almost grid independent solution and tovalidate the computational approach used in the simulations usingthe experimental data.
3.1. Grid independence test
Numerical simulations were carried out for an opposed T-junction at Re = 50 with different grid densities to study the effect ofnumberof cellson thepredictedmixing index and pressure drop.Theresults of grid independence test are shown graphically in Fig. 1. Ascan be seen from the figure, as number of cells is increased, bothmixing index andpressure droptend to approach aconstantvalue.Asthe number of cells is increased from about 3 million to about4 million, mixing index and pressure drop do not change much butcomputational time increases significantly. Considering this, thegrids having about 3 million cells have been used in the finalsimulationsreportedin the comingsections. The grid isunstructuredand consists of tetrahedral elements with maximum element sizespecified as 0.023 mm during meshing. Since the grid requirementfor a complex geometry may be more stringent than for a simplegeometry, the grid independence test was repeated for OA 100–200
W-junction (which will be discussed in the next section) at Re = 50.The results of grid independence test for OA 100–200W-junction areshown in Fig. 2. As observed for T-junction, for OA 100–200 W-junction also, on increasing the numberof cells the pressuredropandmixing index tend to approach a constant value albeit at a rate slowerthan observed for T-junction. Fig. 3 shows the rate of change of slope
Fig. 2. Effect of number of cells used in the simulation on mixing index and pressuredrop in OA 100–200 W-junction at Re = 50.
of mixing index versus number of cells curves. As can be seen, oncontinued increase in the number of cells, the slope of mixing indexversus number of cells curve does reduce, steeply for the T-junction,and gradually for OA 100–200W-junction. However, the slope is notzero for the grids we have used in the final simulations. Thus with thegridsusedinthisstudyweare stillnot intrulygrid independent zone.But further grid refinement is not possible due to prohibitively longcomputational time. Therefore, the quantitative results reported inthis study, though may not be very accurate, are good enough forqualitative comparison of mixing performance of different micro-fluidic junctions, which is the main theme of this study.
3.2. Validation of computational approach
Accurate numerical simulation of phenomena involving con-vection–diffusion may be quite challenging specially at high Pecletnumbers. While several studies on microfluidic mixing address thecomputational issues related to numerical solution [3,10,11],studies in which computational issues are not discussed at allare also reported [13,16,22]. However, since the Peclet number inmost of our simulations is high it becomes imperative to validatethe computational approach used in this study using experimentaldata or theoretical results. Therefore, prior to carrying out finalsimulations to evaluate mixing in different types of microfluidicjunctions, the computational approach adopted in the simulationswas validated by comparing the predicted results with theexperimental data and theoretical results. Experiments werecarried out with a Y-junction with water applied at one inlet anddyed water applied at the other inlet. Diameter of the micro-channel was 750 mm. A high speed image acquisition system was
Fig. 4. Location of the interface between water and dyed water from the wall of themicrochannel (measured from the side of the dyed water) for different flow rates ofdyed water and a constant flow rate of water (1 ml/min).

Fig. 5. Comparison of the images obtained from the experiments and simulations.
Fig. 6. Variation of transverse diffusion zone thickness with axial distance in theopposed T-junction microchannel at Re = 50.
S. Sarkar et al. / Chemical Engineering and Processing 85 (2014) 227–240 231
used to visualize mixing at the junction. Distance of the interfacebetween water and dyed water from one of the walls of themicrochannel was measured at a distance of one channel diameterfrom the junction. This measurement was done for differentcombinations of flow rates of water and dyed water. Simulationswere performed for the exact conditions of the experiments. Fig. 4shows the location of the interface between water and dyed waterfrom the wall of the channel as obtained from the simulations andas measured in the experiments. Fig. 5 shows the comparison ofthe images obtained from experiments and simulations. Figs. 4 and5 show a very good quantitative and qualitative agreement,respectively, between the results of the experiments and thesimulations, and thus, validate the adequacy of the computationalapproach adopted in this work to predict the flow field. Toascertain the accuracy of the computational approach forpredicting mixing, variation of width of transverse diffusion zonewith axial distance was measured using the results obtained fromthe numerical simulations of the opposed T-junction for Re = 50. Alog–log plot between width of the transverse diffusion zone andaxial distance is found to give a very good straight line fit as shownin Fig. 6. As can be seen the width of the transverse diffusion zonescales as �x0.454. This value of the exponent obtained from thesimulations is very close to 0.5, the value that can be obtained fromtheoretical analysis [23] and also reported in an experimentalstudy [24]. This validation using theoretical results and experi-mental data thus shows that though there might be somenumerical errors as we are not in strictly grid independent zone,the errors are not likely to be significant.
4. Simulations of 1–1 microfluidic junctions
4.1. Comparison of different 1–1microfluidic junctions
After validation of the computational approach, simulations of1–1 microfluidic junctions were carried out. 1–1 microfluidicjunctions are the ones in which the two inlet streams being mixedare not split before they are brought into contact at the microfluidicjunction. The 1–1 microfluidic junctions evaluated are opposed T-junction, cross T-junction, 450 Y-junction, 1350 Y-junction, 450 1-junction and 450–450 W-junction. In the name of the Y-junctions,the angle denotes half of the included angle between the two inletsseen from the left side. In the name of 1-junction, the angle denotesthe angle included between the main channel and the first inletstarting anticlockwise from the main channel. In the name of 450–450 W-junction, the first angle is the angle between the mainchannel and the first inlet starting anticlockwise from the mainchannel and the second angle is the included angle between thetwo inlets. Some of these 1–1 junctions like opposed T-junction,cross T-junction and Y-junctions can be called as conventionalmicrofluidic junctions as they have been reported in severalstudies. 450 1-junction and 450–450 W-junction are two newdesigns and, to the best of our knowledge, have not been reportedso far. 1–1 microfluidic junctions can broadly be classified in twogroups-symmetric junctions (opposed T-junction, 450 Y-junction,1350 Y-junction) and asymmetric junctions (cross T-junction, 450
1-junction and 450–450 W-junction). The top views of thesejunctions are shown in Fig. 7.
Pressure drop values and mixing index at the outlets of 1–1 junctions as obtained from numerical simulations carried out forRe = 50 are summarized in Table 2. It is found that mixing inasymmetric junctions is better than in symmetric junctions,though at the cost of marginally higher pressure drop. 450 Y-junction and 450–450 W-junction are found to show the worst andthe best mixing performance, respectively. As can be seen fromTable 2, while the pressure drop in 450–450 W-junction is onlyabout 1.1 times of the same in 450 Y-junction, mixing index is about2.36 times more.
Fig. 8 shows the concentration contour plots at the outlets ofthe different 1–1 microfluidic junctions. It is seen that the interfacebetween the two inlet streams is distorted more in asymmetricjunctions. This provides more area for the diffusion of the soluteresulting in better mixing in asymmetric junctions. Amongasymmetric junctions, distortion of the interface in the 450–450
W-junction is the highest causing the mixing to be the best in thismicrofluidic junction. Here we put forth a concept of skewness forasymmetric microfluidic junctions. The skewness can be defined asthe average value of the angles the inlet channels make with the

Fig. 7. Top views of different 1–1 microfluidic junctions evaluated for mixing.
Table 2Mixing index and pressure drop for different 1–1 microfluidic junctions at Re = 50.
Junction type Pressure drop (Pa) Mixing index (�)
450Y-junction 93 11.4Opposed T-junction 94 13.01350Y-junction 95 13.6Cross T-junction 99 16.44501-junction 100 19.8450–450W-junction 102 26.8
232 S. Sarkar et al. / Chemical Engineering and Processing 85 (2014) 227–240
main channel. The smaller the value of the average angle, moreskewed is the microfluidic junction. The average angles for cross T-junction, 450 1-junction and 450–450 W-junction can be evaluatedto be 1350, 900 and 67.50, respectively. Therefore, 450–450 W-junction is the most skewed among all the asymmetric junctionsevaluated here. Since 450–450 W-junction gives the best mixing, itis concluded that the more skewed an asymmetric 1–1 microfluidicjunction is, better will be its performance for mixing.
4.2. Further modifications of the W-junction
In the previous section, several 1–1 microfluidic junctions werecompared and 450–450 W-junction was found to be the best. Butthe mixing index of 450–450 W-junction was not high. Furthersimulations were carried out to explore the possibility ofenhancement of mixing at the W-junction. Effects of the anglesthe inlet channels make with the main channel, shape of thejunction at the point of meeting of the inlet streams and aspectratio on mixing were studied.
4.2.1. Effect of angles on mixing at W-junctionsTo find out the effect of the angles the inlet channels make
with the main channel, simulations were performed for severalgeometries of the W-junctions. Although several designs of W-junctions were evaluated only two of them are discussed here forbrevity. These are 300–300 W-junction and 100–200 W-junction.The top views of these junctions along with the 450–450 W-junction evaluated in the previous section are shown in Fig. 9.Mixing index and pressure drop for these three W-junctions forRe = 50 are summarized in Table 3. It is found that 100–200 W-junction gives better mixing than 300–300 and 450–450 W-junctions. Better mixing in 100–200 W-junction than other twoW-junctions can be explained in terms of its skewness. Theaverage angle the inlet channels make with the main channel in100–200 W-junction is 200 whereas the same for 300–300 W-junction and 450–450 W-junction are 450 and 67.50, respectively.This makes 100–200 W-junction the most skewed among thethree W-junctions evaluated here which results in its betterperformance for mixing. The pressure drop in the 100–200 W-junction is also higher than in 300–300 W-junction and 450–450
W-junctions. While improvement in mixing compared to 450–450
W-junction is about 24%, increase in pressure drop is also aboutthe same at 27%. The contours of the concentration at the outletsare shown in Fig. 10. As can be seen in Fig. 10, the distortion of theinterface between two inlet streams is more in 100–200 W-junction than in other two W-junctions leading to more diffusedconcentration field at its outlet and better performance formixing.
4.2.2. Effect of shape on mixing in 100–200 W-junctionsThough 100–200 W-junction gives better mixing than 300–300
and 450–450 W-junctions, the mixing index is still far fromsatisfactory. To explore the possibility of further enhancement inmixing three different designs of 100–200 W-junction wereevaluated. Top views of these three designs of 100–200 W-junctionare shown in Fig. 11. These junctions have been named as acuteangle (AA) 100–200 W-junction, right angle (RA) 100–200 W-junction and obtuse angle (OA) 100–200 W-junction depending onthe value of the angle included between the left most edge and thebottom most edge in the top view of the junctions. The obtuseangle in OA 100–200 W-junction is 1050. The results of thesimulations of these junctions are given in Table 4. As can be seen,the OA 100–200 W-junction gives the highest mixing index. Theconcentration contours at the outlets of these three types of 100–
200W-junctions are shown in Fig. 12 and clearly show much bettermixing in OA 100–200 W-junction. The mixing is, however, at thepenalty of the pressure drop which is about 350 Pa at Re = 50. Thepressure drop and mixing index in OA 100–200 W-junction areabout 3.5 times and 2 times of the same in AA 100–200W-junction,respectively. However, if we compare the performance of the OA100–200W-junction with 450 Y-junction, the mixing index is about5.5 times more but the pressure drop is only 3.8 times more. Bettermixing in OA 100–200 W-junction can be attributed to theconverging shape that forces streams to interpenetrate each other.

Fig. 8. Concentration contour plots at the outlets of different 1–1 junctions at Re = 50.
Fig. 9. Geometries of different W-junctions evaluated for mixing.
S. Sarkar et al. / Chemical Engineering and Processing 85 (2014) 227–240 233
4.2.3. Effect of aspect ratio on mixing in OA 100–200 W-junctionsTo explore possibility of further improvement in mixing,
simulations of OA 100–200 W-junctions of different aspect ratiosbut having same flow cross-sectional area were carried out. Theaspect ratio is defined as the ratio of height and the width of themicrochannel. The results obtained from the simulations are givenin Table 5.
It is seen that while there is a significant effect of aspect ratio onpressure drop, the effect on mixing is only marginal. The bestmixing is achieved for aspect ratios close to 1. The highest value ofthe mixing index achieved is 63.3 for aspect ratio 1.1:1. Pressuredrop for this aspect ratio is 332 Pa. Mixing index of the junctionhaving aspect ratio 2 is 58.7 which is only about 7% lower than the
Table 3Mixing index and pressure drop in different W-junctions at Re = 50.
Junction type Pressure drop (Pa) Mixing index (�)
100–200 130 35.5300–300 105 28.3450–450 102 26.8
mixing index of the junction having aspect ratio 1:1. However, thepressure drop in the junction having aspect ratio 2 is about 42%lower than the same in the junction having aspect ratio 1.1:1. Thus,considering both mixing index and pressure drop aspect ratiosother than 1 are worth considering.
5. Simulations of 1–2 microfluidic junctions
5.1. Comparison of different 1–2 microfluidic junctions
In the previous section several designs of 1–1 microfluidicjunctions were evaluated and OA 100–200W-junction was found tobe the best among the evaluated designs. To further improvemixing, several designs of 1–2 microfluidic junctions in which oneof the two liquid streams being mixed is split into two parts andthen contacted with the other stream were evaluated. The idea is toenhance mixing by increasing the interfacial area between the twostreams to be mixed. Though there are several studies on mixing inconventional 1–2 microfluidic junctions [9,10], in this study somenew designs of 1–2 microfluidic junctions are conceptualized andevaluated along with some conventional 1–2 junctions such ascross junction and C-junctions. All the new designs are derivedfrom OA 100–200 W-junction which is found to be the best 1–1 junction. The first of these designs is 100–200–200 WV-junctionwhich is a modified version of OA 100–200 W-junction in which athird inlet is added at an angle of 200 from the second inlet. Thesecond newly conceptualized design is also based on OA 100–200
W-junction in which a third inlet is added opposite to the mainchannel. This junction is named as OA 100–200–1950 WV-junction.The third angle in the name refers to the angle between the mainchannel and the third inlet measured anticlockwise. It may benoted that this angle could be 1800 but it is kept 1950 so that thestream entering the third inlet meets the streams coming from thefirst inlet and the second inlet obliquely. This is likely to result inbetter mixing. The third newly conceptualized design is OA 100–
200–1650 WY-junction. This is also based on OA 100–200 W-junction with the third inlet added opposite to the second inlet.However, the third inlet is not exactly opposite to the second inlet,instead the second and the third inlets make a Y-junction. Theincluded angle between the second and the third inlet is 1650. Thefourth design is called OA 100–200 WT-junction in which the thirdinlet is placed opposite to the first inlet such that it makes anopposed T-junction with the first inlet.

Fig. 10. Concentration contours at the outlets of different W-junctions for Re = 50.
Fig. 11. Different shapes of 100–200 W-junctions evaluated for mixing.
234 S. Sarkar et al. / Chemical Engineering and Processing 85 (2014) 227–240
Top views of these 1–2 junctions are shown in Fig. 13. Theresults obtained from the simulations of these 1–2 junctions aresummarized in Table 6. OA 100–200–1650 WY-junction is found tobe the best among evaluated junctions showing mixing index ashigh as 86.4 at Re = 50 which is nearly 23% more than the best 1–1junction i.e., OA 100–200 W-junction at the same Re with almostsame pressure drop. OA 100–200 WT-junction also gives goodmixing with mixing index close to 75. The OA 100–200–200 WV-junction and OA 100–200–1950WV-junction give marginally bettermixing than 1–1 OA 100–200 W-junction but at much lower
Table 4Mixing index and pressure drop in 100–200 W-junctions of different shapes atRe = 50.
Junction type Pressure drop (Pa) Mixing index (–)
AA 100–200 W-junction 102 30.4RA 100–200 W-junction 130 35.5OA 100–200 W-junction 355 63.0
pressure drops. The contours of tracer concentration at the outletsfor different 1–2 junctions are shown in Fig.14. As can be seen, verygood mixing is achieved in OA 100–200–1650 WY-junction withalmost uniform concentration at the outlet. As for 1–1 junctions,mixing is found to be much better in asymmetric 1–2 junctionsthan in symmetric 1–2 junctions.
5.2. Ability of OA 100–200–1650 WY-junction to handle unequalsplitting
Though 1–2 junctions provide better mixing than 1–1 junctions,splitting one of the streams into two exactly equal streams may bea difficult task in itself. Therefore, any proposed design of a 1–2 junction should be such that it ensures mixing in case splitting isnot equal. To ascertain the versatility of OA 100–200–1650 WY-junction in handling unequal splitting of the stream to be split,simulations were carried out for different flow rate ratios of thesplit streams applied at the first inlet and third inlet startinganticlockwise from the main channel. The flow rate ratios forwhich simulations were carried out are 2:1, 1:2, 3:1, 1:3, 3:2 and2:3, respectively, keeping the total flow rate same and equal to theintact stream. The worst mixing is observed for the case whensplitting is in the ratio of 3:1. However, for this case the reduction inmixing from equal splitting case is about 15% only. Pressure drop isnot affected much by unequal splitting. For splitting ratio 1:2 or2:1, the mixing index is within 10% of the mixing index for the caseof equal splitting. Thus it can be concluded that OA 100–200–1650
WY-junction is versatile enough in case splitting of the stream tobe split is not perfect. Mixing index and pressure drop values fordifferent ratios of flow rates of the streams resulting from splittinghave been summarized in Table 7. Concentration contour plots areshown in Fig. 15.
5.3. Mixing in OA 100–200–1650WY-junction for unequal flow rates ofthe streams being mixed
Simulations were also carried out to study the mixing in casethe flow rates of the two liquids being mixed are not same. Flowrate ratio of 2:1, 1:2, 3:1, 1:3, 2:3 and 3:2 were evaluated keepingthe total flow rate same so that the Reynolds number in the mainchannel is 50. Equal splitting of the stream to be split is considered.It is observed that mixing index changes as the flow rate ratiochanges but the change in mixing index is well within �10%.

Fig. 12. Concentration contours at the outlets of 100–200 W-junctions of different shapes for Re = 50.
S. Sarkar et al. / Chemical Engineering and Processing 85 (2014) 227–240 235
Mixing index and pressure drop for different ratios of flow rateshave been tabulated in Table 8. Concentration contour plots at theoutlet are shown in Fig. 16. Flow rate ratio used in Table 8 andFig. 16 is the ratio of the flow rate of the stream to be split and theintact stream. The intact stream contains the species that is gettingmixed. Thus, it can be concluded that OA 100–200–1650 WY-junction is versatile enough to ensure good mixing in case flowrates of the streams to be mixed are not equal.
6. Comparison of different approaches to enhance mixing
The simulations reported in the previous sections focus onmodifying the microfluidic junction to enhance mixing. Two newdesigns of microfluidic junctions are reported. One of them is 1–1 type and the other is 1–2 type microfluidic junction. The layout ofthe microchannel after the junction is straight in both the designs.This approach to enhance mixing can be called as complex-junction–simple-layout approach. Another approach to improvemixing can be modification of the layout of the channel aftermicrofluidic junction, keeping the microfluidic junction simple.This approach, called here as simple-junction–complex-layoutapproach, to enhance mixing is reported in several studies[11,13,25]. A hybrid approach based on modification in themicrofluidic junction as well as layout of the main channel canalso be thought of. In this section the three approaches ofenhancing microfluidic mixing are evaluated. As the representativeof the simple-junction–complex-layout approach, opposed T-junctions having 6 periodic contractions (250 mm long, 150 mmwide, 500 mm deep) or square bends (250 mm long, 250 mm wide,500 mm deep) in the main channel have been considered. Center to
Table 5Mixing index and pressure drop in OA 100–200 W-junctions of different aspectratios at Re = 50.
Aspect ratio Pressure drop (Pa) Mixing index (–)
0.5 904 61.10.75 510 61.51 355 63.01.1 332 63.31.2 295 63.21.25 285 62.91.5 239 61.42 192 58.7
Fig. 13. Geometries of different 1–2 junctions evaluated for mixing.

Table 6Mixing index and pressure drop for different 1–2 junctions at Re = 50.
Junction type Pressure drop (Pa) Mixing index (–)
450 C-junction 97 28.3Cross junction 95 31.31350 C-junction 93 32.4OA 100–200–200WV-junction 114 67.0OA 100–200–1950 WV-junction 231 69.0OA 100–200–1650 WY-junction 340 86.4OA 100–200 WT-junction 301 74.6
236 S. Sarkar et al. / Chemical Engineering and Processing 85 (2014) 227–240
center distance between two consecutive bends or contraction is500 mm. Number of bends or contractions have been restricted to6 as with 6 bends or contractions pressure drop is close to pressuredrop in OA 100–200–1650 WY-junction. The representatives of thecomplex-junction–simple-layout approach are OA 100–200 W-junction and OA 100–200–1650 WY-junction simulations of whichare reported in the previous sections. The representatives of thehybrid approach are OA 100–200–1650 WY-junction and OA 100–
200 W-junction having square bends. These microchannels areshown in Fig. 17. Pressure drop and mixing index in thesemicrochannels at Re = 50 are summarized in Table 9. Table 9 alsolists the data for opposed T-junction, OA 100–200 W-junction andOA 100–200–1650 WY-junction for sake of comparison. As seenfrom Table 9, opposed T-junction with bends gives better mixingthan opposed T-junction with periodic contractions, so in the
Fig. 14. Concentration contour plots at the out
hybrid approach to improve mixing OA 100–200–1650WY-junctionand OA 100–200 W-junction with square bends only are reported.The contours of tracer concentration at the outlets of thesemicrochannels are shown in Fig. 18.
It is observed that for OA 100–200–1650 WY-junction inclusionof bends in the main channel improves mixing index by 6.43% butpressure drop is increased by 98%. Provision of rectangular bendsafter the OA 100–200 W-junction improves mixing index by 31.2%whereas the pressure drop is increased by about 93%. Providingrectangular bends after opposed T-junction enhances mixing indexby 354% whereas the pressure drop is increased by 333%. Thissuggests that for simple microfluidic junctions it makes sense to gofor channels with complex layout as improvement in mixing issignificant compared to the additional pressure drop incurred. Butcoupling complex layout with complex microfluidic junction doesnot help much in enhancing mixing. The results also show thatcomplex-junction–simple-layout approach is better than simple-junction–complex-layout approach e.g., mixing index in OA 100–
200W-junction and OA 100–200–1650 WY-junction are better thanopposed T-junction with square bends or contractions atcomparable pressure drop. Complex-junction–simple-layout ap-proach is better than simple-junction–complex-layout approachalso because in the former the difficulty in fabrication is only at onelocation i.e., at the junction. If it is required, a hybrid approachcomprising of complex-junction–complex-layout can be used toachieve very high mixing if it is extremely important to have highmixing irrespective of the pressure drop.
lets of different 1–2 junctions for Re = 50.

Table 7Mixing index and pressure drop in OA 100–200–1650 WY-junction for different flow rate ratios of the streams generated from splitting one of the streams to be mixed atRe = 50.
Flow rate ratio of the split streams Pressure drop (Pa) Mixing index (–)
1:1 340 86.42:1 337 78.81:2 334 87.03:1 335 74.71:3 346 84.03:2 338 82.52:3 342 88.0
Fig. 15. Concentration contour plots at the outlet of 100–200–1650 WY-junction for different flow rate ratio of the streams generated form splitting of one of the two liquidstreams to be mixed at Re = 50.
S. Sarkar et al. / Chemical Engineering and Processing 85 (2014) 227–240 237
7. Effect of Reynolds number on mixing
Mixing at a microfluidic junction is strongly dependent onReynolds number. At very low Reynolds number flow may bestratified with streams not interpenetrating each other causingmixing to be poor. But at low flow rates residence time is morewhich compensates to some extent for poor mixing due tostratified flow. As Reynolds number is increased stratified flowcontinues but residence time reduces causing mixing to reducemarginally. When Reynolds number is high enough the streamsinterpenetrate resulting in better mixing [1]. Any new microfluidicjunction proposed should ensure good mixing over a wide range ofReynolds number. In the previous sections all the simulations werecarried out for Re = 50. This section reports the results of thesimulations carried out for different Reynolds numbers to checkthe versatility of the designs conceptualized and recommended inthe previous sections. Additionally, simulations of a few conven-tional microfluidic junctions are also carried out for comparison.The results are shown in Fig. 19.
Fig. 19 shows that 450 Y-junction which represents aconventional 1–1 junction shows poor mixing for the entire range
Table 8Mixing index and pressure drop in OA 100–200–1650 WY-junction for different flow ra
Flow rate ratio of the streams being mixed
1:1
2:1
1:2
1:3
3:1
2:3
3:2
of Reynolds number explored in Fig. 19 with the highest mixingindex for Re = 1. The RA 450–450 W-junction shows a minimummixing index at Re = 5 with mixing index increasing on either side.OA 100–200 W-junction which was found to be the best 1–1 junction at Re = 50, is not found to give good mixing at lowerReynolds number. The OA 100–200–1650 WY-junction which wasfound to be the best 1–2 junction at Re = 50 gives good mixing atlower Reynolds number also and hence turns out to be a versatilemicrofluidic junction capable of handling a wide range of Reynoldsnumber. The same applies to the OA 100–200–1650 WY-junctionwith periodic square bends, though its pressure drop is higher thanthe OA 100–200–1650 WY-junction.
It may be noted that the new designs proposed in this studyensure good mixing but at pressure drops apparently much higherthan observed in conventional microfluidic junctions. This,however, should not be treated as the drawback of the proposeddesigns. The comparison of a simple and a complex microfluidicjunction should be done for a desired mixing index. If mixing ashigh as observed in a complex microfluidic junction is to beachieved using a conventional microfluidic junction, a long lengthwill be required and the pressure drop owing to the long length
te ratios of the two streams being mixed at Re = 50.
Pressure drop (Pa) Mixing index (–)
340 86.4328 93.3352 83.0359 84.4340 89.7347 81.9333 91.8

Fig. 16. Concentration contour plots at the outlet of 100–200–1650 WY-junction for different flow rate ratios of the two liquid streams being mixed at Re = 50.
Fig. 17. Microchannels evaluated to compare different approaches to enhance mixing.
238 S. Sarkar et al. / Chemical Engineering and Processing 85 (2014) 227–240
may turn out to be as high as the pressure drop in a complexmicrofluidic junction. The only difference will be that while in aconventional microfluidic junction pressure drop will be moreuniformly distributed over a long length, in the complex junction itwill be concentrated mainly at the microfluidic junction. Using theresults from numerical simulation carried out at Re = 50, mixingindex and pressure at different axial locations in opposed T-junction were obtained.
Table 9Mixing index and pressure drop in different microchannels evaluated to compare diffe
Microchannel
Opposed T-junction
Opposed T-junction with periodic contractions
Opposed T-junction with periodic square bends
OA 100–200–1650 WY-junction
OA 100–200 W-junction
OA 100–200 W-junction with square bends
OA 100–200–1650 WY-junction with square bends
Using this data, the length of opposed T-junction required toachieve mixing index same as in OA 100–200W-junction at Re = 50,is evaluated to be about 320 mm. Pressure drop in the opposed T-junction of this length is estimated to be about 3586 Pa which is 10times more than the pressure drop in the OA 100–200 W-junctionat Re = 50. This clearly shows for the same high mixing index to beachieved the pressure drop in the complex junctions as proposedin this study will be much less than in a conventional microfluidicjunction. Also due to longer length, inventory in a conventional
rent approaches to enhance mixing at Re = 50.
Pressure drop (Pa) Mixing index (–)
94 13.0332 29.7408 59.0340 86.4355 63.0686 82.8673 92.0

Fig. 18. Concentration contour plots at the outlets of microchannels evaluated to compare different approaches to enhance mixing at Re = 50.
Fig. 19. Mixing performance of different types of microfluidic junctions at differentReynolds numbers.
S. Sarkar et al. / Chemical Engineering and Processing 85 (2014) 227–240 239
microfluidic junction will also be higher causing mixing time toincrease drastically, defeating very objective of miniaturization.
8. Conclusions
A study involving numerical simulations to propose newdesigns of microfluidic junctions giving good mixing is presented.The computational approach adopted in the numerical simulationshas been validated using experimental data as well as theoreticalresults. 1–1 and 1–2 type microfluidic junctions are evaluated. In
both cases, asymmetric junctions are found to give better mixingperformance than symmetric junctions. Several new 1–1 micro-fluidic junctions named as W-junctions are evaluated and found tobe better than conventional 1–1 microfluidic junctions. Mixing inW-junctions is found to be mildly dependent on the angles theinlet channels make with the main channel and stronglydependent on the angle enclosed between the left most edgeand the bottom most edge of the junction. Mixing is found to bebetter when this enclosed angle is an obtuse angle and a 1–1junction called as OA 100–200 W-junction is found to give the bestmixing performance among all evaluated 1–1 microfluidic junc-tions. Mixing is found to be better in 1–2 microfluidic junctionsthan in 1–1 microfluidic junctions. Among 1–2 junctions, mixing isfound to be substantially enhanced in a microfluidic junction calledhere as OA 100–200–1650 WY-junction. This junction is found toensure good mixing for a wide range of Reynolds number (1–100),for cases of unequal flow rates of the streams being mixed andunequal splitting of the stream being split. A comparison betweenthree approaches of enhancing mixing i.e., simple-junction–complex-layout, complex-junction–simple-layout and complex-junction–complex-layout shows that the last approach also calledhere as the hybrid approach can provide very high mixing butshould be used only if high mixing is required instantaneouslyirrespective of the pressure drop. Of the other two approaches toenhance mixing the complex-junction–simple-layout is found tobe better than simple-junction–complex-layout-approach. Thenewly proposed designs apparently give good mixing at the cost ofhigh pressure drop. This is, however, a misnomer. The comparison

240 S. Sarkar et al. / Chemical Engineering and Processing 85 (2014) 227–240
should be on the basis of pressure drop required for achieving samemixing. Such a comparison clearly shows that for achieving highmixing the new designs are better than the conventional designs.
The microfluidic junctions reported to provide good mixing areapparently complex. However, with rapid strides in the field ofmicrofabrication, fabrication and numbering up for high through-put applications of these microfluidic junctions should not bedifficult.
Acknowledgement
SS is thankful to the Department of Atomic Energy, India forproviding fellowship under DAE Graduate Fellowship Scheme.
References
[1] M. Engler, N. Kockmann, T. Kiefer, P. Woias, Numerical and experimentalinvestigations on liquid mixing in static micromixers, Chem. Eng. J. 101 (2004)315–322.
[2] S. Ehlers, K. Elgeti, T. Menzel, G. Wießmeier, Mixing in the off-stream of amicrochannel system, Chem. Eng. Process 39 (2000) 291–298.
[3] V. Mengeaud, J. Josserand, H.H. Girault, Mixing processes in a zigzagmicrochannel: finite element simulations and optical study, Anal. Chem. 74(2002) 4279–4286.
[4] N.T. Nguyen, Z. Wu, Micromixers – a review, J. Micromech. Microeng. 15 (2005)R1–R16.
[5] J.M. Ottino, S. Wiggins, Introduction: Mixing in microfluidics, Philos. Trans. R.Soc. London Ser. A 362 (2004) 923–935.
[6] D. Gobby, P. Angeli, A. Gavriilidis, Mixing characteristics of T-type microfluidicmixers, J. Micromech. Microeng. 11 (2001) 126–132.
[7] J.T. Adeosun, A. Lawal, Numerical and experimental studies of mixingcharacteristics in a T-junction microchannel using residence-time distribu-tion, Chem. Eng. Sci. 64 (2009) 2422–2432.
[8] W.B. Mao, J.L. Xu, Micromixing enhanced by pulsating flows, Int. J. Heat MassTransfer 52 (2009) 5258–5261.
[9] M.A. Ansari, K.Y. Kim, S.M. Kim, Numerical study of the effect on mixing of theposition of fluid stream interfaces in a rectangular microchannel, Microsyst.Technol. 16 (2010) 1757–1763.
[10] A. Soleymani, E. Kolehmainen, I. Turunen, Numerical and experimentalinvestigations of liquid mixing in T-type micromixers, Chem. Eng. J. 135 (Suppl.1) (2008) S219–S228.
[11] M. Liu, Computational study of convective–diffusive mixing in a microchannelmixer, Chem. Eng. Sci. 66 (2011) 2211–2223.
[12] T.S. Sheu, S.J. Chen, J.J. Chen, Mixing of a split and recombine micromixer withtapered curved microchannels, Chem. Eng. Sci. 71 (2012) 321–332.
[13] Y. Fang, Y. Ye, R. Shen, P. Zhu, R. Guo, Y. Hu, L. Wu, Mixing enhancement bysimple periodic geometric features in microchannels, Chem. Eng. J. 187 (2012)306–310.
[14] A. Alam, K.Y. Kim, Analysis of mixing in a curved microchannel withrectangular grooves, Chem. Eng. J. 181–182 (2012) 708–716.
[15] C. Nonino, S. Savino, S.D. Giudice, Numerical assessment of the mixingperformance of different serpentine microchannels, Heat Transfer Eng. 30(2009) 101–112.
[16] A.A.S. Bhagat, E.T.K. Peterson, I. Papautsky, A passive planar micromixer withobstructions for mixing at low Reynolds numbers, J. Micromech. Microeng. 17(2007) 1017–1024.
[17] S.H. Wong, M.C.L. Ward, C.W. Wharton, Micro T-mixer as a rapid mixingmicromixer, Sens. Actuators B 100 (2004) 359–379.
[18] D. Bothe, C. Stemich, H.J. Warnecke, Fluid mixing in a T-shaped micro-mixer,Chem. Eng. Sci. 61 (2006) 2950–2958.
[19] Sahu, A. Golia, A.K. Sen, Investigations into mixing of fluids in microchannelswith lateral obstructions, Microsyst. Technol. 19 (2013) 493–501.
[20] S.S. Hsieh, J.W. Lin, J.H. Chen, Mixing efficiency of Y-type micromixers withdifferent angles, Int. J. Heat Fluid Flow 44 (2013) 130–139.
[21] M. Faryadi, M. Rahimi, S. Safari, N. Moradi, Effect of high frequency ultrasoundon micromixing efficiency in microchannels, Chem. Eng. Process.: ProcessIntensif. 77 (2014) 13–21.
[22] L.M. Fu, W.C. Fang, H.H. Hou, Y.N. Wang, T.F. Hong, Rapid vortex micofluidicmixer utilizing double-heart chamber, Chem. Eng. J. 249 (2014) 246–251.
[23] W.M. Deen, Analysis of Transport Phenomena, second ed., Oxford universityPress, New York, 2014.
[24] R.F. Ismagilov, A.D. Stroock, P.J.A. Kenis, G. Whitesides, H.A. Stone, Experimentaland theoretical scaling laws for transverse diffusive broadening in two-phaselaminar flows in microchanenls, Appl. Phys. Lett. 76 (17) (2000) 2376–2378.
[25] W.W.F. Leung, Y. Ren, Crossflow and mixing in obstructed and width-constricted rotating radial microchannel, Int. J. Heat Mass Transfer 64 (2013)457–467.