Contents · With achievement of Quality Management System certification in Goth Machhi, FFC became...
202
Transcript of Contents · With achievement of Quality Management System certification in Goth Machhi, FFC became...

Contents
01 2014 in Numbers 02 The Way So far03 2014 Highlights04 Vision & Mission Statements05 Corporate Strategy05 Policy Statement of Ethics & Business Practices05 Code of Conduct05 Core Values06 Management Objectives07 Significant Changes in Objective & Strategies07 Critical Performance Indicators and Measures07 Geographical Presence08 Company Information09 Profile of the Board14 Board Committees17 Management Committees 18 Organizational Chart19 Business Model20 Product Portfolio21 Stakeholders’ Engagement22 Notice of Meeting24 Financial Performance27 Six year analysis of Financial Position & Performance29 SWOT Analysis30 Horizontal Analysis - Balance Sheet31 Vertical Analysis - Balance Sheet
32 Horizontal & Vertical Analysis - Profit and Loss Account33 Quarterly Analysis
Directors’ Report
36 Chairman’s Review38 CE & MD’s Remarks40 Financial Review56 Operational Performance58 Market Overview60 Human Capital61 Corporate Governance69 Information Technology70 Corporate Social Responsibility72 Forward Looking Statement
Financial Statements FFC
78 Report of the Audit Committee on adherence to the Code of Corporate Governance80 Statement of Compliance with the Code of Corporate Governance 82 Review Report to the Members 83 Auditors’ Report to the Members 84 Balance Sheet 86 Profit and Loss Account 87 Statement of Comprehensive Income 88 Cash Flow Statement 89 Statement of Changes in Equity 90 Notes to and forming part of the Financial Statements
Consolidated Financial Statements
131 Auditors’ Report to the Members 132 Consolidated Balance Sheet 134 Consolidated Profit and Loss Account 135 Consolidated Statement of Comprehensive Income136 Consolidated Cash Flow Statement 137 Consolidated Statement of Changes in Equity 138 Notes to and forming part of the Consolidated Financial Statements188 Pattern of Shareholding 194 Financial Calendar 195 Definitions & Glossary of Terms Form of Proxy

2014 in numbers
Annual Report of Fauji Fertilizer Company Limited 2014

the Way so Far
2014
2012
2010
2004
2003
2002
1997
1993
1992
1991
1982
1978
2008
2011
2013
FFC Energy Limited achieved Tariff True-up and completed first year of commercial operations.
Received first ever dividend of Rs. 544 million from Askari Bank Limited (AKBL).
Inauguration of FFC Energy Limited.
Inauguration of new state of the art HO Building in Rawalpindi.
Investment in FFC Energy Limited, Pakistan’s first wind power electricity generation project.
With investment in Pakistan Maroc Phosphore, Morocco S.A., of Rs. 706 million, FFC has equity participation of 12.5% in PMP.
FFC obtained certification of Occupational Health & Safety Assessment Series, OHSAS-18001:1999.
FFC acquired Ex-Pak Saudi Fertilizers Limited (PSFL) Urea Plant situated in Mirpur Mathelo (Plant III) with annual capacity of 574 thousand tonnes of urea which was the largest industrial sector transaction in Pakistan at that time.
With achievement of Quality Management System certification in Goth Machhi, FFC became the first fertilizer plant in Pakistan to achieve this distinction.
Initial investment in Fauji Fertilizer Bin Qasim Limited (FFBL), a DAP and Urea manufacturing concern which currently stands at Rs. 4.66 billion representing 49.88% equity share.
Commissioning of Plant II, Goth Machhi with annual capacity of 635 thousand tonnes of Urea.
Through DBN program, the production capacity of Plant I was increased to 695 thousand tonnes per year.
Listed with Islamabad Stock Exchange.
Listed with Karachi and Lahore Stock Exchange.
Commissioning of Plant I, Goth Macchi with annual capacity of 570 thousand tonnes.
Incorporation of the Company.
De-Bottle Necking (DBN) of Plant III was executed and commissioned successfully for enhancement of capacity to 125% of design i.e. 718 thousand tonnes annually.
Investment of Rs. 1.5 billion in Fauji Cement Company Limited, currently representing 6.79% equity participation.
SAP-ERP implemented in the Company, improving business processes by reducing time lags and duplication of work.
Acquisition of 100% equity stake in FFF (formerly Al-Hamd Foods Limited), a pioneer Individually Quick Freeze (IQF) fruits and vegetables project.
Acquisition of 43.15% equity stake in AKBL representing the Company’s first ever venture into financial sector.
Commencement of Commercial Operations by FFC Energy Limited.
2

Annual Report of Fauji Fertilizer Company Limited 2014
3

Vision & mission statements
Vision
To be a leading national enterprise with global aspirations, effectively pursuing multiple growth opportunities, maximizing returns to the stakeholders, remaining socially and ethically responsible.
mission
To provide our customers with premium quality products in a safe, reliable, efficient and environmentally sound manner, deliver exceptional services and customer support, maximizing returns to the shareholders through core business and diversification, providing a dynamic and challenging environment for our employees.
4

Corporate strategyMaintaining our competitive position in the core business, we employ our brand name, unique organizational culture, professional excellence and financial strength diversifying in local and multinational environments through acquisitions and new projects thus achieving synergy towards value creation for our stakeholders.
poliCy statement oF ethiCs & business praCtiCes
• It is the policy of FFC to follow the highest business ethics and standards of conduct. It is the obligation of every one of us to act responsibly; that is, to be honest, trustworthy, conscientious and dedicated to the highest standards of ethical business practices.
• The Company’s reputation and its actions as a legal entity depend on the conduct of its directors and employees. Each one of us must endeavor to act according to the highest ethical standards and to be aware of and abide by applicable laws.
• We all must ensure that our personal conduct is above reproach and complies with the highest standards of conduct and business ethics and have the obligation to ensure that the conduct of those who work around us complies with these standards. The Company’s Code of Business Ethics and Code of Conduct will be enforced at all levels fairly and without prejudice.
• This code to which the Company is committed in maintaining the highest standards of conduct and ethical behavior is obligatory, both morally as well as legally and is equally applicable to all the directors and employees of the Company who all have been provided with a personal copy.
Code oF ConduCt• We shall conduct our employment activities with the highest
principles of honesty, integrity, truthfulness and honour. To this end, we are to avoid not only impropriety, but also the appearance of impropriety.
• We shall not make, recommend, or cause to be taken any action, contract, agreement, investment, expenditure or transaction known or believed to be in violation of any law, regulation or corporate policy.
• We shall not use our respective positions in employment to force, induce, coerce, harass, intimidate, or in any manner influence any person, including subordinates, to provide any favor, gift or benefit, whether financial or otherwise, to ourselves or others.
• In business dealings with suppliers, contractors, consultants, customers and government entities, we shall not provide or offer to provide any gratuity, favour or other benefit and all such activities shall be conducted strictly on an arm’s length business basis.
• While representing the Company in dealings with third parties we shall not allow ourselves to be placed in a position in which an actual or apparent conflict of interest exists. All such activities shall be conducted strictly on an arm’s length business basis.
• All of us shall exercise great care in situations in which a pre-existing personal relationship exists between an individual and any third party or Government employee or official of an agency with whom the Company has an existing or potential business relationship. Where there is any doubt as to the propriety of the relationship, the individual shall report the relationship to management so as to avoid even the appearance of impropriety.
• We shall not engage in outside business activities, either directly or indirectly, with a customer, vendor, supplier or agent of the Company, or engage in business activities which are inconsistent with, or contrary to, the business activities of the Company.
• We shall not use or disclose the Company’s trade secret, proprietary or confidential information, or any other confidential information gained in the performance of Company duties as a means of making private profit, gain or benefit.
Core Values
At FFC we seek uncompromising integrity through each individual’s effort towards quality product for our customers, maximizing returns to the shareholders and sizable contribution to the national exchequer.
Our business success is dependent on trusting relationships. Our reputation is founded on the integrity of the Company’s personnel and our commitment to the principles of:
• Honesty in communicating within the Company and with our business partners, suppliers and customers, while at the same time protecting the Company’s confidential information and trade secrets.
• Excellence in high-quality products and services to our customers.
• Consistency in our word and deed.
• Compassion in our relationships with our employees and the communities affected by our business.
• Fairness to our fellow employees, stakeholders, business partners, customers and suppliers through adherence to all applicable laws, regulations and policies and a high standard of moral behaviour.
Annual Report of Fauji Fertilizer Company Limited 2014
5

management objeCtiVes
Objective 1 Enhance agricultural productivity through balanced fertilizer application
Strategy Educate farmers regarding fertilizer usage through Farm Advisory Centers (FAC)Priority HighStatus Ongoing Process – Plans for the year achievedOpportunities / Threats Per acre production in Pakistan is lower than recorded in developed parts of the world providing room for
improvement. However, lack of farmer education and willingness to adopt modern farming practices is a threat in achieving this objective.
Objective 2 Maintain industry leadership
Strategy Stay abreast of technological advancements and continuously upgrade production facilities to maximize efficiency
Priority HighStatus Ongoing Process – Targets for the year achievedOpportunities / Threats With the passage of time, upgradation and maintenance may result in high costs both directly and in terms of
production downtime.
Objective 3 Expand sales
Strategy Sales expansion through geographical diversification and improved farmer awarenessPriority HighStatus Annual targets achievedOpportunities / Threats There are still untapped opportunities to expand our distribution network within and outside the Country.
The prevailing shortage of gas is however a cause for concern and would impede progress in the long run if not addressed by the Government.
Additionally, in case international prices fall below the rising domestic price (impact of gas curtailment and imposition of GIDC), increased imports would hamper growth.
Objective 4 Create / enter new lines of business to augment profitability and achieve sustained economic growth
Strategy Continuously seek avenues to diversify within and outside the Fertilizer IndustryPriority HighStatus An evolving process – Plans for 2014 achievedOpportunities / Threats Diversifying into a new line of business is a high cost decision both on account of initial capital outlay and
increased management expertise required. FFC, however, through its firm financial standing and experienced management pool is in the right position to invest and diversify.
Objective 5 Maintain operational efficiency to achieve synergies
Strategy Synchronize our business processes, reducing time and money lossesPriority HighStatus Ongoing process – Targets for the year achieved.Opportunities / Threats There is always room for improvement in efficiency. With focused management strategies, operational efficiencies
can be enhanced.
Objective 6 Economize on costs by eliminating redundancies
Strategy Keeping our resource utilization at an optimum level through strict governance policiesPriority HighStatus Current year targets achievedOpportunities / Threats The time for flow of information can be reduced through reorganizing business processes in line with our SAP-
ERP system.
6

signiFiCant Changes in objeCtiVes & strategies
FFC’s business objectives and strategies are well planned and no significant changes have occurred during the year to affect our course of action for achievement of these objectives.
In order to measure the Company’s performance against the stated objectives, our management regularly monitors certain Critical Performance Indicators (CPIs).
CritiCal perFormanCe indiCators and measures
geographiCal presenCe
No Objective CPIs Monitored Future Relevance
1 Enhance agricultural productivity through balanced fertilizer application
Funds allocation to Farm Advisory Centers
The management believes in enhancement of Pakistan’s per acre production. The impact of FFC initiatives is analyzed on annual basis.
2 Maintain industry leadership, operationalefficiency & expand sales
Market share and production efficiency ratio
The CPI’s shall remain relevant in the future.
3 Diversification Annual resource allocated for expansion of the projects already acquired in addition to identification of new investment projects.
4 Economize on costs – eliminating redundancies
Gross Profit Margin & Net Profit Margin
5 Shareholder value EPS, ROE, Asset Turnover and DPS
6 Sustainability Current Ratio, Gearing and Interest Cover
CasablancaJorf Lasfar
Bin Qasim
Sahiwal
Mirpur Mathelo
Goth Machhi
Jhimpir
Rawalpindi
Lahore
Pakistan Morocco
Pakistan Rawalpindi /
FFC Head Office Islamabad
AKBL Head Office FCCL Head Office Lahore FFC Marketing Office Sahiwal FFF Food Business Goth Machhi FFC Urea Plant I & II Mirpur Mathelo FFC Urea Plant III Jhimpir FFCEL Wind Power Project Bin Qasim FFBL DAP & Urea Plant Morocco Casablanca PMP Head Office Jorf Lasfar PMP Plantsite
Islamabad
Annual Report of Fauji Fertilizer Company Limited 2014
7

Company inFormation
Board of Directors
Lt Gen Khalid Nawaz Khan,HI(M), Sitara-i-Esar (Retired)Chairman
Lt Gen Naeem Khalid Lodhi,HI(M) (Retired)Chief Executive and Managing Director
Mr Qaiser JavedNon-Executive Director
Dr Nadeem InayatNon-Executive Director
Mr Jorgen MadsenNon-Executive Director
Engr Rukhsana ZuberiIndependent Director
Mr Farhad Shaikh MohammadIndependent Director
Maj Gen Ghulam Haider, HI(M) (Retired)Non-Executive Director
Mr Khizar Hayat KhanNon-Executive Director
Maj Gen Muhammad Farooq Iqbal,HI(M) (Retired)Non-Executive Director
Brig Dr Gulfam Alam,SI(M) (Retired)Non-Executive Director
Mr Shahid GhaffarIndependent Director
Ms Nargis GhalooIndependent Director
Chief Financial Officer
Syed Shahid HussainTel: 92-51-8456101Fax: 92-51-8459961E-mail: [email protected]
Company Secretary
Brig Sher Shah, SI(M) (Retired)Tel: 92-51-8453101Fax: 92-51-8459931E-mail: [email protected]
Registered Office
156 The Mall, Rawalpindi Cantt, PakistanTel: 92-51-111-332-111, 92-51-8450001Fax: 92-51-8459925E-mail: [email protected]: www.ffc.com.pk or scan QR code
Plantsites
Goth Machhi, Sadiqabad
(Distt: Rahim Yar Khan), PakistanTel: 92-68-5786420-9Fax: 92-68-5786401
Mirpur Mathelo
(Distt: Ghotki), PakistanTel: 92-723-661500-09Fax: 92-723-661462
Marketing Division
Lahore Trade Centre,11 Shahrah-e-Aiwan-e-Tijarat,Lahore, PakistanTel: 92-42-36369137-40Fax: 92-42-36366324
Karachi Office
B-35, KDA Scheme No. 1,Karachi, PakistanTel: 92-21-34390115-16Fax: 92-21-34390117, 34390122
Auditors
A.F. Ferguson & Co.Chartered AccountantsPIA Building, 3rd Floor49, Blue Area, P.O. Box 3021Islamabad, PakistanTel: 92-51-2273457-60Fax: 92-51-2277924, 2206473
Shares Registrar
THK Associates (Pvt) LimitedGround Floor, State Life Building - 3Dr Ziauddin Ahmed RoadKarachi - 75530Tel: 92-21-111-000-322Fax: 92-21-35655595
Cost Auditors
BDO Ebrahim & Co. Chartered Accountants3rd Floor, Saeed Plaza, 22 East, Blue Area, Jinnah Avenue, IslamabadTel: 92-51-2604461-5Fax: 92-51-2277995
Bankers
Al Baraka Bank (Pakistan) LimitedAllied Bank LimitedAskari Bank LimitedBank Al Habib LimitedBank Alfalah LimitedBank Islami Pakistan LimitedBarclays Bank PLC, PakistanBurj Bank LimitedDeutsche Bank AGDubai Islamic Bank Pakistan LimitedFaysal Bank LimitedFirst Women Bank LimitedHabib Bank LimitedHabib Metropolitan Bank LimitedIndustrial and Commercial Bank of ChinaJS Bank LimitedKASB Bank LimitedMCB Bank LimitedMeezan Bank LimitedNational Bank of PakistanNIB Bank LimitedSAMBA Bank LimitedSilk Bank LimitedSoneri Bank LimitedStandard Chartered Bank (Pakistan) LimitedSummit Bank LimitedThe Bank of PunjabUnited Bank Limited
8

proFile oF the board
Lt Gen Khalid Nawaz KhanHI(M), Sitara-i-Esar (Retired)(Chairman & Non-Executive Director)
Joined the Board on January 2, 2015.
He is the Managing Director of Fauji Foundation, Fauji Oil Terminal & Distribution Company Limited and also the Chairman on the Boards of the following:
• Fauji Fertilizer Bin Qasim Limited• Fauji Cement Company Limited• Mari Petroleum Company Limited• Fauji Kabirwala Power Company Limited• Foundation Power Company (Daharki)
Limited• Daharki Power Holding Company• Fauji Akbar Portia Marine Terminals
(Pvt.) Limited• Foundation Wind Energy - I Limited• Foundation Wind Energy - II (Pvt.) Limited• Askari Cement Limited• Askari Bank Limited• FFC Energy Limited• Fauji Meat Limited• Fauji Foods Limited• Fauji Fresh n Freeze Limited• FFBL Power Company Limited
Was commissioned in the Pakistan Army in April 1975 with the coveted Sword of Honour. He has a vast and varied experience in various command, staff and instructional assignments including command of an Infantry Division and a Corps. The General also remained Commandant of the prestigious Command and Staff College Quetta, in addition to having served on the faculties of School of Infantry, Command & Staff College and National Defence University.
He is a graduate of Armed Forces War College (National Defence University) and Command and General Staff College, Fort Leavenworth, USA. He holds Masters Degrees in War Studies, Art and Science of Warfare and General Studies.
In recognition of his meritorious services, he has been awarded Hilal-e-Imtiaz (Military). He was also conferred upon the award of Sitara-i-Esar for his leadership role in disaster management during the devastating 2005 Earthquake in Azad Kashmir.
Lt Gen Naeem Khalid LodhiHI(M) (Retired)(Chief Executive & Managing Director)
Mr Qaiser Javed
(Non-Executive Director)
Joined the Board on March 26, 2012.
He is also Chief Executive & Managing Director of FFC Energy Limited and Fauji Fresh n Freeze Limited and holds directorship on the Boards of following:
• Fauji Fertilizer Bin Qasim Limited• Askari Bank Limited• Fauji Foods Limited• Fauji Meat Limited• Pakistan Maroc Phosphore S.A.• FFBL Power Company Limited
He is Chairman of Sona Welfare Foundation (SWF), a member of the Board of Governors of Foundation University, Islamabad and Director on the Board of International Fertilizer Industry Association (IFA) France.
Was commissioned in Pakistan Army in 1974. During his long meritorious service in the Army, he had been employed on various prestigious command, staff and instructional assignments including Corps Commander. He is a graduate of Command and Staff College Quetta and Armed Forces War College (National Defence University) Islamabad.
He holds Bachelors in Civil Engineering and Masters degrees in Defence Studies and International Relations. He attended Financial Management Programs at the Columbia University USA and the INSEAD School of Business, France, a Mergers & Acquisitions Program at the University of California, Los Angeles, USA and an Executive Program at Pakistan Institute of Management.
The General is considered an expert in the field of strategy and has remained on faculty of National Defence University and NUST (Military College of Engineering). After his retirement from the Army, he remained Secretary of Defence, Pakistan as well. He is on the advisory board of Army Green Book; a prestigious publication on defence and security.
Joined the Board on October 15, 1999.
Joined Fauji Foundation in 1976 and is currently working as Director Finance. He has the honour of being member on Board of Directors of 20 Companies, he holds the following major positions:
• Foundation University - Director Finance• Dharaki Power Holdings Limited - CEO• Foundation Wind Energy – I Limited -
CEO• Foundation Wind Energy – II (Pvt.)
Limited - CEO• Fauji Fertilizer Bin Qasim Limited -
Director• Mari Petroleum Company Limited -
Director• Fauji Cement Company Limited -
Director• Fauji Kabirwala Power Company Ltd -
Director• Fauji Oil Terminal and Distribution
Company Limited - Director• Foundation Power Company Dharaki Ltd
- Director• Fauji Akbar Portia Marine Terminal Ltd -
Director• FFC Energy Limited - Director• The Hub Power Company Limited -
Director• Laraib Energy Limited - Director• Askari Bank Ltd - Director• Askari Cement Limited - Director• Fauji Fresh n Freeze Limited - Director• Fauji Foods Limited - Director• Fauji Meat Limited - Director• FFBL Power Company Limited - Director
He is a Fellow Member of the Institute of Chartered Accountants of Pakistan and the Institute of Taxation Management of Pakistan.
He is a member of the Audit Committee and Project Diversification Committee of FFC.
Annual Report of Fauji Fertilizer Company Limited 2014
9

Dr Nadeem Inayat
(Non-Executive Director)
Mr Jorgen Madsen
(Non-Executive Director)
Engr Rukhsana Zuberi
(Independent Director)
Joined the Board on May 27, 2004.
Besides being Director Investment Fauji Foundation, he is on the Board of following entities:
• Fauji Fertilizer Bin Qasim Limited• Fauji Cement Company Limited• Fauji Akbar Portia Marine Terminals
(Pvt.) Limited• Fauji Oil Terminal & Distribution
Company Limited• Mari Petroleum Company Limited• Askari Cement Limited• Daharki Power Holding Limited• Pakistan Maroc Phosphore S.A.• Foundation Wind Energy - I Limited• Foundation Wind Energy - II (Pvt.)
Limited• Fauji Fresh n Freeze Limited• Fauji Foods Limited• Fauji Meat Limited• Foundation University• FFBL Power Company Limited• Askari Bank Limited• Fauji Infraavest Foods Limited
He is also a Board member of different public sector universities. He has conducted various academic courses on Economics, International Trade and Finance at reputed institutions of higher education in Pakistan. He is also a member of Pakistan Institute of Development Economics (PIDE).
He holds a Doctorate in Economics and has over 27 years of diversified domestic as well as international experience in the financial sector. He has vast experience in corporate governance, policy formulation and deployment, project appraisal, implementation, monitoring & evaluation, restructuring, and collaboration with donor agencies.
He is Chairman of Project Diversification Committee and member of the Audit, Human Resource & Remuneration and System & Technology Committees of FFC.
Joined the Board on September 16, 2009.
During his career he has held positions as Process Engineer, Project Manager and Manager of the Ammonia Process Engineering Department until 1995, when he took over as Manager of the Engineering Division and simultaneously became a Member of the Board of Haldor Topsoe’s subsidiary in erstwhile Soviet Union, now Russia. He is currently engaged as General Manager in the R&D Division of Haldor Topsoe A/S, since 2006 with the main responsibility of transferring new pilot scale technologies to industrial scale technologies.
He has an engineering degree in chemical engineering from the Technical University of Denmark. He has worked with Topsoe Ammonia Technologies for more than 25 years, engaged in design and supervising, construction, commissioning and start-ups of ammonia plants. Besides Ammonia Technology he has a broad knowledge of all available technologies at Topsoe.
He has no involvement / engagement in other companies as CEO, Director, CFO or trustee.
Joined the Board on September 16, 2012.
She is President TEC Education Foundation, associated with Microsoft, Pearson Vue, New Horizons and Certiport which are global training and testing organizations.
She enabled participation of Pakistani youth in Microsoft World Championship, California in 2014 offering great opportunities for Pakistani youth to showcase their IT skills on the World Forum.
Her major achievements during her illustrious career include the following:
• Initiated Skills Development and Vocational Training for women
• International recognition of Pakistan’s Engineering Qualifications
• Initiated Pakistan’s first on Grid solar power system
• Introduced and facilitated online testing and certification programs in Pakistan, enabling Country’s youth to get international qualifications and career opportunities
She is Pakistan’s first lady mechanical engineer and in addition to being the Chairperson of Pakistan Engineering Council, Pakistan Institute of Costs & Contracts, Women In Energy, she is also a Fellow member of Institute of Engineers Pakistan. She held various prestigious positions during her political and professional career including membership of Senate of Pakistan, Provincial Assembly Sindh, Karachi University Syndicate, Board of Governors of NUST, Engineering Development Board, President’s Task Force on Alternate Energy Options for Pakistan and Finance House Committee of Senate etc.
She is Chairperson of the Audit Committee of FFC.
proFile oF the board
10

Mr Farhad Shaikh Mohammad
(Independent Director)
Maj Gen Ghulam HaiderHI(M) (Retired)(Non-Executive Director)
Mr Khizar Hayat Khan
(Non-Executive Director)
Joined the Board on September 16, 2012.
He also holds directorship of:
• Din Textile Mills Limited• Din Leather (Pvt.) Limited• Din Energy Limited
His other engagements include:
• Chairman of Young Entrepreneurs & Youth Affairs
• Vice Chairman of Law and Order of Korangi Association of Trade and Industry
• Executive member of Burns Centre, Civil Hospital, Karachi
His major achievements during his educational and professional career are as follows:
• KASB securities awarded “Best Performance Certificate” in Equity & Research Department
• Fred Villari’s Studios’ “Self Defense Certificate of Achievement” in Canada
• Dean’s List in American University in Dubai
• Awarded Gold Medal in recognition of outstanding work for humanity by Chairman Quaid-e-Azam Gold Award Committee.
He did his graduation in Finance and Banking from American University in Dubai, followed by an executive development course on Corporate Financial Management from LUMS. He has participated in various courses relating to corporate governance, leadership and corporate finance management at Pakistan Institute of Corporate Governance (PICG). He is also a Certified Director by PICG/International Finance Corporation.
Joined the Board on March 01, 2014.
He is working as Director Welfare (Health) Fauji Foundation Head Office, Rawalpindi andalso holds directorship on the following boards:
• FFC Energy Limited • Fauji Fresh n Freeze Limited• Fauji Fertilizer Bin Qasim Limited• Mari Petroleum Company Limited• Fauji Kabirwala Power Company Limited
Was commissioned in Pakistan Army in April 1972. He is a graduate of Command and Staff College Quetta and National Defence University, Islamabad and holds a Masters Degree in War Studies from Quaid-e-Azam University, Islamabad. He has vast experience in Inventory Control, Supply Chain Management, Defence Procurement and Human Resource Management.
During his distinguished career spanning over 37 years, he held varied command, staff and instructional appointments. He has been on the faculty of Command & Staff College, Quetta, Army School of Logistics, Kuldana, Murree and Ordnance School, Karachi. Besides service in various logistic installations, the General has also served in Kingdom of Saudi Arabia as adviser on Inventory Management. In recognition of his outstanding services, he was awarded Hilal-i-Imtiaz (Military).
He is Chairman of Human Resources & Remuneration Committee and member of System & Technology Committee of FFC.
Joined the Board on April 9, 2013.
He is working as Additional Secretary Ministry of Industries and Production, Government of Pakistan and is chairman governing bodies of Pakistan Industrial Technical Assistance Center (PITAC). He holds directorship in the following companies:
• Technology Up-gradation and Skill Development Company (TUSDEC)
• Pakistan Stone Development Company (PASDEC)
• Pakistan Industrial Development Corporation (PIDC)
• Utility Stores Corporation (USC)• National Productivity Corporation
(NPO)
He holds Masters in International Relations and a Masters in Development Administration, USA.
Annual Report of Fauji Fertilizer Company Limited 2014
11

Maj Gen Muhammad Farooq IqbalHI(M) (Retired)(Non-Executive Director)
Brig Dr Gulfam AlamSI(M) (Retired)(Non-Executive Director)
Mr Shahid Ghaffar
(Independent Director)
Joined the Board on June 2, 2014.
He is Director Banking, Industries and Trading (BI&T), Fauji Foundation. He has a diverse corporate governance exposure in fertilizer, power, banking, cement and FMCG sectors. He holds directorship in the following companies:
• Fauji Fertilizer Bin Qasim Limited• Fauji Cement Company Limited• Foundation Power Company Daharki
Limited• Daharki Power Holding Limited• Askari Cement Limited• Fauji Infraavest Foods Limited
He is in charge of all wholly-owned business projects of Fauji Foundation, adviser to Chairman Askari Bank Limited and CEO of Fauji Infraavest Foods Limited. Served on various military command and staff appointments and remained Director General of inventory control & management and procurement in the Pakistan Army.
He is a graduate of Command & Staff College, Quetta and National Defence University, Islamabad and also holds a Masters degree in International Defence & Strategic Studies from Quaid-e-Azam University, Islamabad.
He has undergone various corporate trainings from reputed National and International Institutes / Universities and is a fellow of the Chartered Institute of Logistics and Transportation (CILT) since 2009.
Originally joined the Board on August 17, 2011, retired on March 01, 2014 and rejoined on June 02, 2014.
Director of Planning and Development at Fauji Foundation and holds directorship of the following associated companies in the Fauji Group:
• Fauji Fertilizer Bin Qasim Limited• Fauji Cement Company Limited• Fauji Akbar Portia Marine Terminals
(Pvt.) Limited• Mari Petroleum Company Limited• Foundation Wind Energy - I Limited• Foundation Wind Energy - II (Pvt.)
Limited• FFBL Power Company Limited
He was commissioned in Pakistan Army (Corps of Engineers) in 1978 and was employed on numerous important assignments including Director Planning and Works at Engineer-in-Chief Branch, GHQ, Deputy Group Commander in Frontier Works Organization and Technical Member to Pakistan Commission for Indus Water.
As Director Planning & Development, he is heading the Planning & Development portfolio of Fauji Foundation.
He was awarded a Doctorate in Civil Engineering (Structures) from University of Illinois at Urbana – Champaign (United States of America) and has more than 25 years of diversified domestic as well as international exposure in the construction field. His working experience can be broadly categorized into policy formulation, evaluation, planning / development, implementation / monitoring and collaboration with donor agencies.
He is Chairman of System and Technology Committee and member of the Project Diversification Committee of FFC.
Joined the Board on October 20, 2014.
He holds directorship in the following companies:
• Mari Petroleum Company Limited• Bank Al Habib Limited
He is presently Managing Director, National Investment Trust Limited (NIT) where he had also served in different capacities in the Asset Management Division. He participated in the reconstruction of NIT during the crisis period i.e. 1996-1998.
He has held key positions in the areas of asset management, capital market regulation and governance. At Securities and Exchange Commission of Pakistan (SECP) he served as Executive Director / Commissioner and played a vital role towards implementation of wide ranging reforms in the capital market and capacity building of Securities Market Division at SECP. While working as Managing Director / CEO of Karachi Stock Exchange he introduced effective risk management measures and implemented automation of share trading.
He has worked as Head of Investor Relations and Corporate Representation as well as member of Management Forum at Habib Bank Limited (HBL) and Chief Executive Officer of HBL Asset Management Limited.
He holds a Masters Degree in Business Administration. He has attended several courses on securities regulations, securities markets development and portfolio management including the prestigious course conducted by Securities and Exchange Commission, in Washington, DC in the United States.
proFile oF the board
12

Ms Nargis Ghaloo
(Independent Director)
Syed Shahid Hussain
(Chief Financial Officer)
Brig Sher ShahSI(M) (Retired)(Company Secretary)
Joined the Board on November 5, 2014.
She holds directorship of the following companies:
• Sui Southern Gas Company Limited• Orix Leasing Pakistan• International Industries • Sui Northern Gas Pipelines Limited
She is the Chairperson of State Life Insurance Corporation of Pakistan.
Besides various administrative assignments at provincial and federal level, she held the positions of Additional Secretary Cabinet Division, DG President Secretariat, Secretary Women Development and Executive Director State Life Insurance Corporation.
She participated in Negotiation and Dispute Resolution Workshop in Singapore, Executive Leadership Development Program at John F. Kennedy School of Government, Harvard University, National Management Course at National Management College Lahore and Public Sector Administration and Financial Management at Singapore.
She holds a Masters Degree in English from University of Sindh and joined civil service in 1982.
Appointed as CFO on November 3, 2008.
He joined the Company in 1981 and has served in various capacities in the Finance Group before being appointed as the Chief Financial Officer of the Company in 2008. With over 30 years of experience in various positions, he plays an active role in the financial / strategic planning of the Company.
He is also a director on the Board of Askari General Insurance Company Limited, Chief Financial Officer of Fauji Fresh n Freeze Limited and has previously held the office of CFO of FFC Energy Limited.
Prior to his appointment as CFO of the Company, he served as Company Secretary and Director Finance of an offshore joint venture project in Morocco (Pakistan Maroc Phosphore S.A.) from 2005 to 2008 where he was conferred the “Wissam Alouite” award by H.E. King Mohammed VI for his invaluable services to the project.
He is a fellow Member of the Institute of Chartered Accountants of Pakistan.
Appointed as Company Secretary on February 5, 2013. He is also holding the appointment of Company Secretary in FFC Energy Limited.
Besides various command, staff and instructional assignments in the Army, he has been Associate Dean at National University of Sciences & Technology. He also served on the faculty of National Defense University Islamabad, in the department of National Security Policy and Strategy. He had a stint as Director in the Defense Science and Technology Organization.
He is an alumni of National Defense University, Quaid-e-Azam University and the University of Maryland, USA. Holds Masters degrees in International Relations, Defence & Strategic Studies and War Studies and a Diploma in Corporate and Commercial Law. He has also attended MBA workshop by American Management Association, USA.
He has been regularly contributing research papers to publications of national and international repute.
Annual Report of Fauji Fertilizer Company Limited 2014
13

board Committees
salient Features & terms oF reFerenCe
The Audit Committee is, among other things, responsible for recommending to the Board of Directors the appointment of external auditors by Company’s shareholders and considers any questions of resignation or removal of external auditors, audit fees and provision by external auditors of any service to the Company in addition to audit of its financial statements. In the absence of strong grounds to proceed otherwise, the Board of Directors acts in accordance with the recommendations of the Audit Committee in the following matters:
a) Determination of appropriate measures to safeguard the Company’s assets.
b) Review of preliminary announcements of results prior to publication.
c) Review of quarterly, half yearly and annual financial statements of the Company, prior to their approval by the Board of Directors, focusing on:
• Major judgmental areas,
• Significant adjustments resulting from the audit,
• The going concern assumption,
• Any change in accounting policies and practices,
• Compliance with applicable accounting standards, and
• Compliance with listing regulations and other statutory and regulatory requirements.
d) Facilitating the external audit and discussion with external auditors of major observations arising from interim and final audits and any matter that the auditors may wish to highlight (in the absence of Management, where necessary).
e) Review of Management Letter issued by external auditors and Management’s response thereto.
f ) Ensuring coordination between the internal and external auditors of the Company.
g) Review of the scope and extent of internal audit and ensuring that the internal audit function has adequate resources and is appropriately placed within the Company.
h) Consideration of major findings of internal investigations and Management’s response thereto.
i) Ascertaining that the internal control system including financial and operational controls, accounting system and reporting structure are adequate and effective.
j) Review of the Company’s statement on internal control systems prior to endorsement by the Board of Directors and internal audit reports.
k) Instituting special projects, value for money studies or other investigations on any matter specified by the Board of Directors, in consultation with the CE&MD and to consider remittance of any matter to the external auditors or to any other external body.
l) Determination of compliance with relevant statutory requirements.
m) Monitoring compliance with the best practices of corporate governance and identification of significant violations thereof.
n) Review of Related Party transactions entered into during the year and recommending approval of the Board of Directors thereon.
o) Consideration of any other issue or matter as may be assigned by the Board of Directors.
audit Committee
Composition Engr. Rukhsana Zubairi Chairperson Mr Qaiser Javed Member Dr Nadeem Inayat Member Maj Gen Muhammad Farooq Iqbal, HI(M) (Retired) Member
Total Directors 22nd 24th 22nd 27th 15th Meetings January April July October December Attended
Engr Rukhsana Zuberi P P P P P 5
Mr Qaiser Javed P P P P P 5
Dr Nadeem Inayat O P P P P 4
Maj Gen Muhammad – – – P P 2 Farooq Iqbal Appointed HI(M), (Retired) as member w.e.f 18th
Sep, 2014
14

human resourCe & remuneration Committee
salient Features & terms oF reFerenCe
The role of the Human Resources & Remuneration Committee is to assist the Board of Director in its oversight of the evaluation and approval of the employee benefit plans, welfare projects and retirement emoluments. The Committee recommends any adjustments, which are fair and required to attract / retain high calibre staff, for consideration and approval. The Committee has the following responsibilities, powers, authorities and discretion:
a) Conduct periodic reviews of the Good Performance Awards, 10 C Bonuses, and Maintenance of Industrial Peace Incentives (MOIPI) as per the CBA agreements, Long Term Service Award Policy and Safety Awards for safe plant operations.
b) Periodic reviews of the amount and form of reimbursement for terminal benefits in case of retirement and death of any employee in relation to current norms.
c) Consider any changes to the Company’s retirement benefit plans including gratuity, pension and post-
Composition Maj Gen Ghulam Haider, HI(M) (Retired) Chairman Dr Nadeem Inayat Member Maj Gen Muhammad Farooq Iqbal, HI(M) (Retired) Member
2nd
Total Directors
December Meetings
Attended
Maj Gen Ghulam Haider, HI(M) (Retired) P 1
Dr Nadeem Inayat O –
Maj Gen Muhammad Farooq Iqbal, HI(M) (Retired) P 1
retirement medical treatment, based on the actuarial reports, assumptions and funding recommendations.
d) Review organizational policies concerning housing / welfare schemes, scholarship and incentives for outstanding performance and paid study leave beyond one year.
e) Recommend financial package for CBA agreement to the Board of Directors.
f ) Ensure, in consultation with the CE&MD that succession plans are in place and review such plans at regular intervals for those executives, whose appointment requires Board approval (under Code of Corporate Governance), namely, the Chief Financial Officer, the Company Secretary and the Head of Internal Audit, including their terms of appointment and remuneration package in accordance with market positioning.
g) Review and recommend compensation / benefits for the CE&MD in consultation with the Company Secretary.
h) Conduct periodic reviews of the
amount and form of Directors’ compensation for Board and Committee services in relation to current norms. Recommend any adjustments for Board consideration and approval.
The Committee meets on as required basis or when directed by the Board of Directors. The Company Secretary sets the agenda, time, date and venue of the meeting in consultation with the Chairman of the Committee. The General Manager Human Resources acts as Secretary of the Committee and submits the minutes of the meeting duly signed by its Chairman to the Company Secretary. These minutes are then circulated to the Board of Directors.
Annual Report of Fauji Fertilizer Company Limited 2014
15

board Committees
Composition Dr Nadeem Inayat Chairman Mr Qaiser Javed Member Brig Dr Gulfam Alam, SI(M) (Retired) Member
28th 17th
Total Directors
January June Meetings
Attended
Dr Nadeem Inayat P P 2
Mr Qaiser Javed P P 2
Brig Dr Gulfam Alam, SI(M) (Retired) O P 1
salient Features & terms oF reFerenCe
The role of System & Technology Committee is as follows:
a) Review any major change in system and procedures suggested by the Management.
b) Review the proposals suggested by the Management on the recent trends in use of technology in production and marketing of fertilizers.
c) Review the recommendations of the Management:
• On options available for addressing major plant upgradation and technology improvements with relevant cost benefit analysis, and
• On Information Technology
system & teChnology Committee
projeCt diVersiFiCation Committee
d) Guidance in the development of concept paper for keeping abreast with the Continuous Improvement in Technological Advancements, its implementation in manufacturing, marketing and at administrative levels with periodic review.
e) Promote awareness of all stakeholders on needs for investment in chemical (specifically Fertilizer) technology and related research work.
f ) Promote awareness of all stakeholders on needs for investment in technology and related research work.
g) Review IT proposals suggested by Management and send recommendations to the Board of Directors.
h) Consider such other matters as may be referred to it by the Board of Directors.
salient Features & terms oF reFerenCe
This Committee meets on required /directed basis to evaluate and discuss feasibilities for potential projects and new avenues for diversified investment of Company resources. The Committee presents its findings for Board’s review and seeks approval for acquisition or expansion involving attractive returns, satisfactory growth and success potential.
Composition Brig Dr Gulfam Alam, SI(M) (Retired) Chairman Dr Nadeem Inayat Member Maj Gen Ghulam Haider, HI(M) (Retired) Member
15th 2nd
Total Directors
July December Meetings
Attended
Brig Dr Gulfam Alam, SI(M) (Retired) P P 2
Dr Nadeem Inayat O O –
Maj Gen Ghulam Haider, HI(M) (Retired) P P 2
16

management Committees
Composition
Lt Gen Naeem Khalid Lodhi, HI(M) (Retired), CE&MD Chairman Syed Iqtidar Saeed, CTO Member Syed Shahid Hussain, CFO Member Mr Mohammad Munir Malik, GGM-MKT Member Mr Muhammad Shuaib, GM-IA Member Brig Dr Mukhtar Hussain SI(M) (Retired), GM-IS Member Brig Tariq Javaid SI(M) (Retired), GM-HR Member Mr Naveed Ahmad Khan, GM-M&O (Goth Machhi) Member Mr Pervez Fateh, A/GM-M&O (Mirpur Mathelo) Member Brig Sher Shah SI(M) (Retired), Company Secretary Member Brig Sajid Nisar Khan SI(M) (Retired), CCO Member / Secretary
Composition
Lt Gen Naeem Khalid Lodhi, HI(M) (Retired), CE&MD Chairman Syed Iqtidar Saeed, CTO Member Syed Shahid Hussain, CFO Member Mr Mohammad Munir Malik, GGM-MKT Member Mr Naveed Ahmed Khan, GM-M&O (Goth Machhi) Member Brig Sher Shah, SI(M) (Retired), Company Secretary Member Brig Sajid Nisar Khan SI(M) (Retired), CCO Member / Secretary
Composition
Lt Gen Naeem Khalid Lodhi, HI(M) (Retired), CE & MD Chairman Syed Iqtidar Saeed, CTO Member Syed Shahid Hussain, CFO Member Mr Muhammad Munir Malik, GGM – MKT Member Brig Sher Shah, SI(M) (Retired), Company Secretary Member Brig Sajid Nisar Khan, SI(M) (Retired), CCO Member Brig Munawar Hayat Khan Niazi, SI(M) (Retired), SM- CSR Member / Secretary
exeCutiVe Committee
business strategy Committee
Csr Committee
Annual Report of Fauji Fertilizer Company Limited 2014
17

OrganizatiOnal Chart
Board ofDirectors
Chief Executive & Managing Director
AuditCommittee
Human Resource & Remuneration Committee
System & Technology Committee
Project DiversificationCommittee
Chief Technical Officer
Group General Manager Marketing
Chief Financial Officer
Chief Internal Auditor
Senior Manager Engineering
Plant GM
T&NP HO
PlantMM
Senior Manager Corporate Social
Responsibility
Senior Manager Coordination
Office
Senior Manager Procurement
General Manager Human Resource
General Manager Information Technology
Manager Legal and Labour
Affairs
ManagerCorporate
Communication
Functional reporting
Administrative reporting
CompanySecretary
Senior Manager Civil Works
Senior Manager Human Resource
Services
Senior Manager Administration
18

business model
Growth Drivers FFC’s growth is primarily driven by expansion in sales revenue, powered by strong demand for our product and effective distribution network all over the Country.
Efficiency enhancement is our long term goal. We continuously seek opportunities to improve efficiency of our business processes to optimize costs, utilizing less to produce more.
Our sales are largely cash based, which gives us the margin to effectively utilize available cash resources to fulfill Company’s working capital requirements, and hence minimize external funding requirements resulting in reduced finance cost.
Our Key AssetsHuman capital is by far our most valuable asset, directly affecting performance while ensuring success each year.
Among our valuable assets is our brand name ‘Sona’, which is the soul behind our existence, growth and prosperity.
We are continuously investing in our production facilities to enhance operational efficiency and fuel the key growth drivers. Our extensive distribution network extends to all provinces of the Country, ensuring maximum market presence.
Leveraging our AssetsOur assets in turn are leveraged by our management excellence and our consumer centric approach. Our strategies are focused around consumer satisfaction and quality perfection.
The pursuit of excellence in every sphere of operation is our aim which ensures continued success. Our farsighted management strategies are focused on development of our key assets which form the foundation for future growth.
Cost Sales CashOptimisation Growth Utilisation
People Market Efficient Distribution Goodwill Production Network
Consumer Execution Planning forSatisfaction Excellence the Future
GrowthDrivers
Our KeyAssets
Leveragingour Assets
Annual Report of Fauji Fertilizer Company Limited 2014
19

Urea FertilizerFFC & FFBLUsed in grain and cotton crops, at the time of last cultivation before planting. In irrigated crops, urea can be applied dry to the soil. During summer, it is often spread just before rain to minimize losses from vitalization process. Urea produced by FFBL is in Granular form, being the only of its kind in Pakistan.
Industrial Use
Raw material in manufacture of plastics, adhesives and industrial feedstock.
DAP FertilizerFFC & FFBLSona DAP is the most concentrated phosphatic fertilizer containing 46% P2O5 and 18% Nitrogen. The solubility of DAP is more than 95%, which is highest among the phosphatic fertilizers available in the country. Further, on account of its nitrogen content, it temporarily increases the soil pH.
Industrial Use
Fire retardant used in commercial firefighting products. Other uses are as metal finisher, yeast nutrient, nicotine enhancer in cigarettes and sugar purifier.
SOP FertilizerFFCSOP is an important source of Potash, a quality nutrient for production of crops especially fruits and vegetables. FFC SOP contains 50% K2O in addition to 18% sulphur, which is an important nutrient especially for oil seed crops with an ameliorating effect on salt-affected soils. Potash is an important nutrient for activation of enzymes in the plant body and helps increase sugar and starch contents in cultivation.
Potash improves the resistance of plants against pests, diseases and stresses like water / frost injury etc.
Renewable EnergyFFCELThe company has been incorporated to operate a 49.5 MW wind power generation facility and its onward supply to Pakistan’s National Grid (NTDC).
Financial ServicesAKBLOperating through a network of 321 full service / sub branches with a Wholesale Bank Branch in the Kingdom of Bahrain, AKBL offers a wide range of banking activities including commercial & corporate lending, trade businesses, Islamic, consumer, agriculture & investment banking, equity trading and treasury operations. The Bank is also engaged in the business of mutual funds and share brokerage, investment advisory and related services through its subsidiary companies, Askari Investment Management Limited and Askari Securities Limited.
The Bank also offers branchless banking service under the brand name ‘Timepey’. A wide network of Timepey shops across Pakistan are fully equipped to handle day to day needs of the customers including; money transfer, bill payment and mobile top-up etc.
Frozen Fruits & VegetablesFFF (formerly Al-Hamd Foods Limited)Construction work on the Individually Quick Freeze (IQF) Plant of Fauji Fresh n Freeze, is progressing as per plan with scheduled inauguration during 2015.
produCt portFolio
20

stakeholders’ engagement
Stakeholders Management of Stakeholders’ Engagement Effect and value to FFC
Institutional Investors / Shareholders
The Company acknowledges and honors the trust our investors put in us by providing a steady return on their investment. We enforce rigorously a transparent relationship with all our stakeholders.
The providers of capital allow FFC the means to achieve its vision.
Customers & Suppliers
FFC has invested significantly over the years in customer relationship management going beyond extending credit facilities and trade discounts. Through Agri services, FFC has been continuously inducing changes in agricultural production and are highlighting the importance of rapid and efficient transfer of advanced knowledge to farmers for their sustainable economic growth.
Our continuous and sustainable growth is also attributable to engaging reputed and dependable suppliers as business partners for supply of raw material, industrial inputs, equipment and machinery.
Our success and performance depends upon the loyalty of our customers, their preference of the ‘Sona’ brand and our supply chain management.
Banks and other lenders
Banks and other financial institutions are engaged by the Company on an on-going basis in relation to negotiation of rates, lending purposes, short term financing, deposits and investments. Banks are also consulted on issues linked with letters of credit and payments to suppliers, along with other disbursements of operational nature.
Dealings with banks and lenders is key to the Company’s performance in terms of the following:
• Access to better interest rates and loan terms,
• Minimal fees,• Higher level of customer service, and• Helpful in planning for the future.
Media Different communication mediums are used on need basis to apprise the general public about new developments, activities and philanthropic initiatives of the Company.
By informing the media of the developments and activities of FFC, more awareness of the Company is developed along with the awareness of products and services offered, indirectly impacting the performance of the Company.
Regulators FFC prides itself in being a responsible corporate citizen and abides by the laws and regulations of Pakistan. FFC consciously ensures that all the legal requirements of other countries are also fulfilled while conducting business outside Pakistan. FFC has paid a total of Rs. 45 billion in taxes and duties this year and continues to be one of the highest tax payers of Pakistan.
Laws and regulations,determination of prices and other factors controlled by theGovernment affect FFC and its performance.
Analysts In order to attract potential investors, the company regularly engages with analysts on details of projects already disclosed to the regulators, with due regard to regulatory restrictions imposed on inside information and / or trading, to avoid any negative impact on the Company’s reputation or the share price.
Providing all the required information to analysts helps in clarifying any misconception / rumour in the market.
Employees Our commitment to our most valued resources, a committed and competent workforce, is at the core of our Human Resource strategy. FFC provides a nurturing and employee friendly environment while investing heavily in local and foreign employee trainings. Besides monetary compensations, FFC has invested in health and fitness activities for its employees.
Employees are at the heart of our organization, implementing every strategic and operational decision of the management. Our employees represent us in the industry and community.
Local community and general public
In addition to local communities near plant sites, the Company engages with general public at large through its CSR Department. This engagement helps to identify needed interventions in the field of education, health and uplift of the society.
The people of our Country provide the grounds for us to build our future.
Annual Report of Fauji Fertilizer Company Limited 2014
21

notiCe oF meeting
Notice is hereby given that the 37th Annual General Meeting of the shareholders of Fauji Fertilizer Company Limited will be held at FFC Head Office, 156 The Mall, Rawalpindi on Tuesday, March 17, 2015 at 1500 hours to transact the following business:-
Ordinary Business
1. Confirmation of the minutes of 36th Annual General Meeting held on March 14, 2014.
2. Consideration, approval and adoption of annual audited accounts and the consolidated audited accounts of FFC and its subsidiaries alongwith Directors’ and Auditors’ Reports thereon for the year ended December 31, 2014.
3. Appointment of Auditors for the year 2015 and to fix their remuneration.
The retiring Auditors M/s A.F.Ferguson & Co, Chartered Accountants being eligible have offered themselves for re-appointment for the year 2015. Besides this, a notice has been received from a member in terms of Section 253(2) of the Companies Ordinance 1984, recommending appointment of M/s KPMG Taseer Hadi & Co., Chartered Accountants as Auditors of the Company, in place of retiring Auditors at the Annual General Meeting of the Company.
4. Approval of Final Dividend for the year ended December 31, 2014 as recommended by the Board of Directors.
5. Transact any other business with the permission of the Chair.
By Order of the Board
Brig Sher Shah (Retired)Company Secretary
RawalpindiFebruary 23, 2015
NOTES:
1. The share transfer books of the Company will remain closed from March 11, 2015 to March 17, 2015 (both days inclusive) and no request for transfer of shares will be accepted for registration. Transfers received at Company’s Share Registrar namely THK Associates (Pvt) Limited, 2nd Floor, State Life Building No. 3, Dr. Ziauddin Ahmed Road, Karachi – 75530, Pakistan by the close of business on March 10, 2015 will be considered in time for the purpose of payment of final dividend to the transferees.
2. A member of the Company entitled to attend and vote at the Meeting may appoint a person/representative as proxy to attend and vote in place of the member. Proxies in order to be effective must be received at the Company’s Registered Office, 156-The Mall, Rawalpindi, Pakistan not later than 48 hours before the time of holding the Meeting. A member shall not be entitled to appoint more than one proxy.
3. Any Individual Beneficial Owner of CDC, entitled to vote at this Meeting, must bring his/her original Computerized National Identity Card (CNIC) to prove identity, and in case of proxy, a copy of shareholder’s attested CNIC must be attached with the proxy form. Representatives of corporate members should bring the usual documents required for such purpose.
CDC Account Holders will also have to follow the under mentioned guidelines as laid down in Circular 1 dated January 26, 2000 issued by the Securities and Exchange Commission of Pakistan.
A. For attending the Meeting:
(i) In case of individuals, the account holder or sub-account holder and/or the person, whose securities are in group account and their registration details are
uploaded as per the regulations, shall authenticate identity by showing his/her original Computerized National Identity Card (CNIC) or original passport at the time of attending the Meeting.
(ii) Members registered on CDC are also requested to bring their particulars, I.D. Numbers and account numbers in CDS.
(iii) In case of corporate entity, the Board of Directors’ resolution/power of attorney with specimen signature of the nominee shall be produced (unless it has been provided earlier) at the time of Meeting.
B. For appointing proxies:
(i) In case of individuals, the account holder or sub-account holder and/or the person whose securities are in group account and their registration detail is uploaded as per the regulations, shall submit the proxy form as per the above requirement.
(ii) The proxy form shall be witnessed by the person whose name, address and CNIC number shall be mentioned on the form.
(iii) Attested copies of CNIC or the passport of the beneficial owners and the proxy shall be furnished with the proxy form.
(iv) The proxy shall produce his/her original CNIC or original passport at the time of Meeting.
(v) In case of corporate entity, the Board of Directors’ resolution/power of attorney with specimen signature shall be submitted (unless it has been provided earlier) along with proxy form to the Company.
22

4. Consent for Video Conference Facility
As allowed by SECP vide Circular No. 10 of 2014 dated May 21, 2014, members can avail video conference facility for this Annual General Meeting, at Lahore and Karachi provided the Company receives consent from the members holding in aggregate 10% or more shareholding, residing at above mentioned locations, atleast 10 days prior to date of the meeting.
Subject to the fulfillment of the above conditions, members shall be informed of the venue, 5 days before the date of the General Meeting alongwith complete information necessary to access the facility.
In this regard please send a duly signed request as per following format at the registered address of the Company 10 days before holding of general meeting.
I/We, __________________ of ______________, being a member Fauji Fertilizer Company Limited, holder of _______ Ordinary Share(s) as per Registered Folio No. ______ hereby opt for video conference facility at __________.
5. Annual Accounts of the Company for the financial year ended December 31, 2014 have been provided on the Company’s website i.e. www.ffc.com.pk
6. Members are hereby informed that pursuant to SECP SRO 787(1)/2014 dated September 8, 2014, circulation of Audited Financial Statements and Notice of Annual General Meeting has been allowed in electronic format through email.
In compliance with the above requirements, soft copies of the Annual Report 2014 are being emailed to the members having opted to receive such communication in
electronic format. Other members who wish to receive the Annual Report in electronic form may file an application as per the format provided on the Company’s website in compliance with the subject SRO. The members who have provided consent to receive Annual Report through email can subsequently request a hard copy which shall be provided free of cost within seven days; however, the Company shall continue to send hard copy to all other members as per practice in vogue.
Members are also requested to intimate any change in their registered email addresses on a timely manner, to ensure effective communication by the Company.
7. WITHHOLDING TAX ON DIVIDENDS
Government of Pakistan through Finance Act, 2014 has made certain amendments in section 150 of the Income Tax Ordinance, 2001 whereby different rates are prescribed for deduction of withholding tax on the amount of dividend paid by the companies. These tax rates are as under:
(a) For filers of income tax returns: 10%
(b) For non-filers of income tax returns: 15%
To enable the Company to make tax deduction on the amount of cash dividend @ 10% instead of 15%, all the shareholders whose names are not entered into the Active Tax-payers List (ATL) provided on the website of FBR, despite the fact that they are filers, are advised to make sure that their names are entered into ATL before the date for approval of the cash dividend i.e. March 17, 2015 otherwise tax on their cash dividend will be deducted @ 15% instead of 10%.
For any further assistance, the members may contact the Company or the Share Registrar at the following phone numbers, email addresses:-
FFC Shares Department Telephone: +92-51-8453235 Email: [email protected]
THK Associates (Pvt) Ltd Telephone: +92-21-111-000-322
Email: [email protected] & [email protected]
The corporate shareholders having CDC accounts are required to have their National Tax Number (NTN) updated with their respective participants, whereas corporate physical shareholders should send a copy of their NTN certificate to the Company or its Share Registrar i.e. THK Associates (Pvt) Limited, Karachi. The shareholders while sending NTN or NTN certificates, as the case may be, must quote Company name and their respective folio numbers.
Annual Report of Fauji Fertilizer Company Limited 2014
23

FinanCial perFormanCe
2014 2013 2012 2011 2010 2009
Profitability Ratios Gross profit ratio % 38.29 46.36 48.47 62.20 43.60 43.27 Net Profit to Sales % 22.37 27.03 28.07 40.73 24.58 24.40 EBITDA margin to sales % 35.61 42.74 44.99 63.64 41.43 41.68 Operating leverage ratio Times 1.19 1.11 3.73 4.12 1.00 1.65 Return on equity (Profit After tax) % 70.79 80.05 80.96 99.17 71.40 67.44 Return on equity (Profit Before tax) % 102.22 116.97 120.51 146.23 105.59 99.81 Return on capital employed % 64.50 68.41 70.38 88.60 57.25 49.96 Pre tax margin % 32.30 39.50 41.78 60.06 36.35 36.11 Return on assets % 20.99 29.68 34.38 40.50 25.61 22.89 Growth in EBTDA % (9.64) (4.20) (5.58) 96.27 23.91 29.29 Earning before Interest, Depreciation and Tax Rs. in Million 28,930 31,832 33,437 35,141 18,591 15,071 Earnings growth % (9.79) (3.48) (7.24) 103.92 24.93 35.20
Liquidity Ratios Current ratio Times 0.67 0.77 1.14 1.04 0.86 0.84 Quick / Acid test ratio Times 0.59 0.66 1.01 0.93 0.73 0.66 Cash to Current liabilities Times 0.28 0.38 0.61 0.38 0.32 0.12 Cash flow from Operations to Sales Times 0.36 0.34 0.25 0.35 0.33 0.25
Activity / Turnover Ratios Inventory turnover ratio Times 148 188 152 162 283 236 No. of Days in Inventory Days 2 2 2 2 1 2 Debtors turnover ratio Times 107 35 40 248 146 96 No. of Days in Receivables Days 3 11 9 1 3 4 Creditors turnover ratio - GIDC Times 3 9 61 33 60 55 - without GIDC Times 124 144 61 33 60 55 No. of Days in Payables - GIDC Days 124 42 6 11 6 7 - without GIDC Days 3 3 6 11 6 7 Total assets turnover ratio Times 0.94 1.10 1.23 0.99 1.04 0.94 Fixed assets turnover ratio Times 4.04 4.04 4.15 3.24 2.82 2.58 Operating cycle - GIDC Days (119) (29) 5 (8) (2) (1) - without GIDC Days 2 10 5 (8) (2) (1)
Investment / Market Ratios Earnings per Share (EPS) and Diluted EPS Rs. 14.28 15.83 16.40 17.68 8.67 6.94 Price Earning ratio Times 8.20 7.07 7.14 8.46 14.52 14.83 Dividend yield ratio % 11.99 13.77 12.29 16.51 14.24 14.93 Dividend Payout ratio - Cash (Interim & Proposed Final) % 95.57 96.99 94.53 75.42 79.98 98.12 - Cash & Stock (Interim & Proposed Final) % 95.57 96.99 94.53 94.27 95.36 105.11 Dividend cover ratio Times 1.05 1.03 1.06 0.71 0.56 0.49 Cash Dividend per share (Interim & Proposed Final) Rs. 13.65 15.35 15.50 20.00 13.00 13.15 Stock Dividend per share (Interim & Proposed Final) % - - - 50.00 25.00 10.00 Market value per share - Year end Rs. 117.11 111.96 117.14 149.54 125.86 102.93 - High during the year Rs. 125.92 121.60 190.95 198.35 128.50 109.20 - Low during the year Rs. 106.51 100.00 105.75 109.82 101.10 61.66 Break up value (Net assets per share) - without Revaluation Reserves Rs. 20.18 19.77 20.26 26.75 22.77 19.28 - with Revaluation Reserves * Rs. N/A Retention (after interim & proposed cash ) % 4.43 3.01 5.47 24.58 20.02 1.88 Change in Market Value Added % 5.14 (4.85) 18.35 48.86 23.25 239.94 Market price to breakup value Times 5.64 5.64 6.22 5.66 4.78 5.34
Capital Structure Ratios
Financial leverage ratio Times 0.62 0.51 0.40 0.58 0.73 0.95 Weighted average cost of debt % 10.48 10.08 12.47 14.50 13.49 14.64 Debt to Equity ratio 9:91 15:85 13:87 10:90 20:80 26:74 Interest cover ratio Times 31.91 39.91 32.08 43.20 16.00 14.82
* Note: Breakup value with revaluation reserves does not apply as FFC has no revaluation reserves.
24

Rs. in Million 2014 2013 2012 2011 2010 2009
Summary of Balance Sheet Share capital 12,722 12,722 12,722 8,482 6,785 6,785 Reserves 12,948 12,429 13,045 14,199 8,662 6,297 Shareholder’s funds / Equity 25,670 25,151 25,767 22,681 15,447 13,082 Long term borrowings 2,500 4,280 3,870 2,704 3,819 4,579 Capital employed 28,170 29,431 29,637 25,385 19,266 17,661 Deferred liabilities 4,574 4,078 3,915 3,623 3,807 3,036 Property, plant & equipment 20,094 18,444 17,819 17,051 15,934 13,994 Long term assets 50,679 41,501 29,716 27,895 25,837 23,635 Net current assets / Working capital (17,935) (7,992) 3,836 1,114 (2,764) (2,938)Liquid funds (net) 2,117 5,298 7,830 14,603 7,830 5,298
Summary of Profit & Loss
Sales 81,240 74,481 74,323 55,221 44,874 36,163 Gross profit 31,103 34,532 36,023 34,349 19,564 15,648 Operating profit 24,672 28,365 30,469 29,977 15,620 12,473 Profit before tax 26,241 29,419 31,052 33,166 16,310 13,057 Profit after tax 18,171 20,135 20,860 22,492 11,029 8,823 EPS - Basic & Diluted 14.28 15.83 16.40 17.68 8.67 6.94
Summary of Cash Flows Net cash flow from Operating activities
Net profit before taxation 26,241 29,419 31,052 33,166 16,310 13,057 Adjustments for non cash & other items (1,832) (1,831) (1,867) (4,093) (568) (549)Changes in working capital 14,774 8,182 (272) 1,795 3,662 1,185 Changes in long term loans and advances, deposits, prepayments and deferred liabilities 9 14 3 (68) (51) (179) 14,783 8,196 (269) 1,727 3,611 1,006 39,192 35,784 28,936 30,800 19,353 13,514 Finance cost paid (753) (759) (1,054) (844) (1,096) (992)Income tax paid (9,349) (9,755) (9,235) (10,398) (3,488) (3,604)Net cash flow generated from Operating activities 29,090 25,270 18,646 19,558 14,769 8,918
Net cash flow from Investing activities
Fixed capital expenditure (3,479) (2,295) (2,270) (2,314) (3,314) (2,344)Interest received 1,283 1,242 1,276 1,481 501 491 (Increase) / Decrease in investments - net (8,534) (10,267) 2,870 (4,032) 1,114 (1,538)Dividends received 2,578 2,586 2,815 4,842 2,575 2,003 Others 420 51 28 14 83 16 Net cash (used in) / generated from investing activities (7,731) (8,683) 4,720 (9) 960 (1,372)
Net cash flow from Financing activities
Long term financing - disbursements - 1,950 3,000 500 1,500 1,000 - repayments (1,460) (1,514) (2,016) (1,759) (2,299) (743)Dividends paid (17,583) (20,678) (17,750) (14,774) (10,622) (6,448)Net cash used in from financing activities (19,043) (20,241) (16,765) (16,033) (11,422) (6,191)Net increase / (decrease) in cash and cash equivalents 2,316 (3,654) 6,601 3,516 4,307 1,355 Cash and cash equivalents at beginning of the year 13,013 16,571 9,963 6,423 2,096 740 Effect of exchange rate changes (48) 96 8 24 19 1 Cash and cash equivalents at end of the year 15,281 13,012 16,572 9,963 6,422 2,096
Others
Market capitalization (Rs. in Million) 148,992 142,413 149,002 126,810 85,396 69,838 Numbers of shares issued (Million) 1,272 1,272 1,272 848 679 679 Contribution to National Exchequer (Rs. in Million) 45,027 43,534 43,189 28,081 14,647 13,634 Savings through Import Substitution (Million US$ ) 833 969 1,061 1,126 756 679
Annual Report of Fauji Fertilizer Company Limited 2014
25

FinanCial perFormanCe
2014 2013 2012 2011 2010 2009
Quantitative Data Designed Capacity
Plant I - Goth Machhi KT 695 695 695 695 695 695 Plant II - Goth Machhi KT 635 635 635 635 635 635 Plant III - Mirpur Mathelo KT 718 718 718 718 718 718 Total Designed Capacity KT 2,048 2,048 2,048 2,048 2,048 2,048
Plant wise Production - Sona Urea
Plant I - Goth Machhi KT 816 775 799 842 867 807 Plant II - Goth Machhi KT 804 803 772 782 807 847 Plant III - Mirpur Mathelo KT 783 830 834 772 811 810 Total Production - Sona Urea KT 2,403 2,408 2,405 2,396 2,485 2,464
Capacity Utilization
Plant I - Goth Machhi % 117 112 115 121 125 116Plant II - Goth Machhi % 127 126 122 123 127 133Plant III - Mirpur Mathelo % 109 116 116 108 113 113Total Capacity Utilization % 117 118 117 117 121 120 Sona Urea - Sales KT 2,371 2,409 2,399 2,406 2,482 2,464 Imported Fertilizer - Sales KT 140 81 74 10 87 41
Direct Method Cash flow
Rs. in Million 2014 2013
CASH FLOWS FROM OPERATING ACTIVITIES Cash receipts from customers - net 81,080 78,377 Cash paid to suppliers / service providers and employees - net (39,316) (40,253)Payment to gratuity fund (586) (92)Payment to pension fund (94) (47)Payment to Workers’ Welfare fund - net (417) (624)Payment to Workers’ Profit Participation fund - net (1,475) (1,577)Finance cost paid (753) (759)Income tax paid (9,349) (9,755) 29,090 25,270 CASH FLOWS FROM INVESTING ACTIVITIES Fixed capital expenditure (3,479) (2,295)Proceeds from sale of property, plant and equipment 45 50 Interest received 1,283 1,243 Investment in FFC Energy Limited - (138)Investment in Askari Bank Limited - (10,462)Investment in Fauji Fresh n Freeze Limited (formerly Al-Hamd Foods Limited) (450) (586)Sale of shares in Fauji Fertilizer Bin Qasim Limited 375 - (Increase) / Decrease in other investment - net (8,083) 919 Dividends received 2,578 2,586 Net cash used in investing activities (7,731) (8,683) CASH FLOWS FROM FINANCING ACTIVITIES Long term financing - disbursements - 1,950 - repayments (1,460) (1,514)Dividends paid (17,583) (20,677)Net cash used in financing activities (19,043) (20,242)Net increase / (decrease) in cash and cash equivalents 2,316 (3,654)Cash and cash equivalents at beginning of the year 13,013 16,571 Effect of exchange rate changes (48) 96 Cash and cash equivalents at end of the year 15,281 13,012
26

Equity and LiabilitiesShareholders’ Equity
Aggregate equity of the Company has almost doubled over the past 6 years, and has also registered an increase of 2% compared to last year. The share capital stands increased to Rs. 12.72 billion as a result of bonus issues of 25% in 2011 and 50% during 2012. Reserves of the Company decreased from Rs. 14.20 billion in 2011 to Rs. 12.43 billion in 2013 because of profitability decline, but increased subsequently by 4% in 2014 to Rs. 12.95 billion because of higher retention.
Non-current Liabilities
Total non-current liabilities comprising of long term loans, deferred taxation and long term portion of compensated leave absences, have remained fairly constant during the past 6 years. Long term loans reduced by Rs. 1.78 billion during the year on account of repayment, while deferred liabilities increased by 12% compared to 2013. Long term financing has been utilized for asset
acquisition, equity investments and plant maintenance turnarounds.
Current Liabilities
Current liabilities of the Company increased from Rs. 17.86 billion in 2009 to Rs. 53.82 billion in 2014, primarily on account of retained GIDC obligations, increase in short term borrowings and customer advances which is fairly in line with the Company’s growth and changes in its operating cycle.
AssetsNon-current Assets
Non-current assets of the Company including property, plant and equipment, intangible assets and long term investments, depicted a steady growth over the past 6 years. Property, plant and equipment valued at Rs. 20 billion registered an increase of Rs. 6.1 billion since 2009 primarily because of procurement of plant and machinery, catalysts and other fixed assets in addition to construction of office buildings.
Long term investments increased by Rs. 20.41 billion since 2009 to Rs. 28.13 billion in 2014, primarily on account of investments in AKBL of Rs. 10.46 billion, Rs. 1.04 billion in FFF and Rs. 2.43 billion in FFCEL.
Current Assets
Current assets include trade debts, stock, short term investments and cash & bank balances. With an aggregate balance of Rs. 35.88 billion at the end of 2014, the assets recorded an increase of Rs. 20.97 billion since 2009, mainly on account of increase in short term investments, under Company policy for placement of surplus funds in term deposits for generation of incremental income.
Profit and LossRevenue & Cost of sales
Sales revenue registered a compounded annual growth of 18% over the 6 years, on account of higher fertilizer sales and increase in selling prices because of inflation and rise in raw material costs. The Company earned
six year analysis oF FinanCial position & perFormanCe
Annual Report of Fauji Fertilizer Company Limited 2014
27

record revenue of Rs. 81.24 billion in 2014, an improvement of 9% from 2013, while cost of sales increased by 26% from last year to Rs. 50.14 billion in 2014 and has more than doubled since 2009 mainly of account of increase in raw material cost, manpower cost and general inflation.
Gross Profit
Gross profitability has almost doubled over the last 6 years with the Company reporting a gross profit of Rs. 31.10 billion for 2014. The profitability was however 10% lower than last year, on account of higher cost of production, resulting in a gross profit margin of 38% compared with 46% last year.
Distribution Cost & Operating Profit
Distribution costs represented an average of 8% of the Company’s sales revenue over the last six years. The rise in distribution costs by 4% in 2014 compared with last year led to a reduction in operating profits by 13%.
Cash FlowsCash and cash equivalents as at December 31, 2014 were recorded at Rs. 15.28 billion in comparison with Rs. 13.01 billion for 2013, with an increase of 17% from last year and recorded an overall improvement over the past 6 years. Tax and interest payments for the year were comparable with the trends for the previous years and the growth pattern of the Company. Further investment in FFF, incremental investment in FFCEL and acquisition of equity stake in AKBL during the previous years constitute the main factors for increase in cash outflow from investing activities, whereas dividend payments and repayment of long term loans
were the main factors for the consistent decrease in net cash used for financing activities over the 6 years.
Ratio AnalysisProfitability Ratios
Rise in cost of sales owing to increased raw material cost and GIDC resulted in a reduction in gross and net profit margins for 2014, depicting a decrease of 8% and 5% respectively from last year. Consequently, return on equity (post tax) and capital employed were also lower by 9% and 4% respectively in comparison with 2013. Excluding exceptional performances in 2011 and 2012, profitability ratios of the Company were in concurrence with overall performance during the 6 years.
Operating performance / Liquidity
Current ratio for 2014 depicted a minimal decrease of 0.10 times as compared with 2013 due to increase in trade creditors, while ‘cash to current liabilities’ and ‘cash flow from operations / sales’ witnessed an increase of 0.04 times and 0.06 times respectively (excluding 2011 & 2012) over the historic average of 6 years.
Activity / Turnover ratios
Inventory turnover days were in line with past trends at 2 days, while debtor turnover days improved in comparison with last year and were consistent with the historic average of 3 days over the past 6 years (excluding 2011 & 2012). Number of days in payables stood at 124 days due to non-payment of GIDC under various Court decisions, however, number of days without considering GIDC payable remained at 3 days against average of 6 days over last six years. Total asset turnover ratio recorded at
0.94 times was in line with the historical 6 year average of the Company but recorded a decrease of 0.16 times as compared with 2013.
Investment / Market ratios
As a result of decline in profits, the Company’s earnings per share was recorded at Rs. 14.28 per share. Price to earnings ratio however improved by 1.13 times as compared to 2013 as the market price of Company’s share rose from Rs. 111.96 at the close of 2013 to Rs. 117.11 for the year ended December 31, 2014.
Dividend payout ratio for 2014 was recorded at 95.57% against an average of 97% for the 6 years, to maintain a steady stream of income for the shareholders. Consequently, the Company recorded a total cash dividend per share of Rs. 13.65 for the year.
Capital Structure Ratios
Financial leverage ratio of 0.62 times for 2014 is consistent with the average for the past 6 years. Debt to equity ratio improved to 9:91 indicating the lowest amount of long term debt in the last 6 years. Company’s interest cover ratio doubled to 32 times in comparison with 15 times in 2009 as a result of lower finance cost to profitability ratio.
six year analysis oF FinanCial position & perFormanCe
28

sWot analysis
S Strengths
Solid financial positionState of the art production facilities
Fertilizer products are high in demand by agriculture sectorDevelopment of new and eco-friendly formulations
Competent & committed human resourceWell diversified investment portfolio
Brand preferenceWell established distribution network
Technical Competence
O Opportunities
Horizontal as well as vertical diversificationIncrease in product line covering Macro and Micro nutrients
Less potential for new entrants in the industry Absence of substitute productsOpportunity to export fertilizer
T Threats
Inconsistent Government policies for fertilizer industry Depleting natural gas reserves & gas curtailment
Excessive fertilizer imports by the Govt. and marketing at subsidized rates
Continuous increase in raw material/fuel prices and levies (GIDC)
Declining international fertilizer prices
W Weaknesses
Mature industry with clogged overall market shareReliance on depleting natural resource
Fixed customer baseNarrow product line
Annual Report of Fauji Fertilizer Company Limited 2014
29

horizontal analysis - balanCe sheet
0 10% 20% 30% 40% 50% 60% 70% 80% 90% 100%
Balance Sheet Analysis (Assets)(%)
Fixed Assets
2014
2013
2012
2011
2010
2009
Long term Assets Current Assets
Rs. in Million 2014 14 Vs. 13 2013 13 Vs. 12 2012 12 Vs. 11 2011 11 Vs. 10 2010 10 Vs. 09 2009 09 Vs. 08 Rs % Rs % Rs % Rs % Rs % Rs %
EQUITY AND LIABILITIES EQUITY Share capital 12,722 - 12,722 - 12,722 49.99 8,482 25.01 6,785 - 6,785 37.49 Capital reserve 160 - 160 - 160 - 160 - 160 - 160 - Revenue reserves 12,788 4.23 12,269 (4.78) 12,885 (8.22) 14,039 65.13 8,502 38.54 6,137 (14.65) 25,670 2.06 25,151 (2.39) 25,767 13.61 22,681 46.83 15,447 18.08 13,082 6.49
NON - CURRENT LIABILITIES Long term borrowings 2,500 (41.59) 4,280 10.59 3,870 43.12 2,704 (29.20) 3,819 (16.60) 4,579 (14.86) Deferred taxation 4,574 12.16 4,078 4.16 3,915 8.06 3,623 (4.83) 3,807 25.40 3,036 24.84 7,074 (15.36) 8,358 7.36 7,785 23.04 6,327 (17.03) 7,626 0.14 7,615 (2.50) CURRENT LIABILITIES Trade and other payables 37,904 73.44 21,854 35.52 16,126 30.79 12,330 36.65 9,023 12.75 8,003 33.52 Interest and mark - up accrued 30 36.36 22 (12.00) 25 (68.75) 80 (42.03) 138 (6.12) 147 (24.62) Short term borrowings 11,603 65.76 7,000 40.28 4,990 (42.88) 8,736 54.87 5,641 (7.36) 6,089 95.54 Current portion of long term borrowings 1,780 21.92 1,460 1.81 1,434 (11.26) 1,616 (8.13) 1,759 (2.22) 1,799 142.13 Taxation 2,501 (37.22) 3,984 (12.30) 4,543 20.76 3,762 9.81 3,426 88.55 1,817 2.19 53,818 56.81 34,320 26.56 27,118 2.24 26,524 32.71 19,987 11.94 17,855 51.01 TOTAL EQUITY AND LIABILITIES 86,562 27.62 67,829 11.80 60,670 9.25 55,532 28.96 43,060 11.69 38,552 20.78
ASSETS NON - CURRENT ASSETS Property, plant & equipment 20,094 8.95 18,444 3.51 17,819 4.50 17,051 7.01 15,934 13.86 13,994 9.92 Intangible assets 1,611 (2.48) 1,652 (1.61) 1,679 7.01 1,569 - 1,569 - 1,569 - Log term investments 28,135 36.17 20,662 117.22 9,512 9.85 8,659 10.03 7,870 1.84 7,728 (0.22) Long term Loans & advances 823 11.22 740 5.56 701 15.68 606 33.19 455 34.62 338 107.36 Long term deposits & prepayments 16 433.33 3 (40.00) 5 (44.44) 9 - 9 50.00 6 200.00 50,679 22.12 41,501 39.66 29,716 6.53 27,894 7.96 25,837 9.32 23,635 6.42 CURRENT ASSETS Stores, spares and loose tools 3,315 2.16 3,245 4.71 3,099 26.64 2,447 0.29 2,440 (18.59) 2,997 (1.22) Stock in trade 982 225.17 302 (31.67) 442 (30.61) 637 200.47 212 47.22 144 (44.19) Trade debts 822 17.26 701 (80.59) 3,611 4,050.57 87 (75.70) 358 39.30 257 (48.19) Loans and advances 1,059 14.98 921 35.84 678 56.94 432 28.57 336 158.46 130 (5.11) Deposits and prepayments 26 (44.68) 47 30.56 36 (34.55) 55 10.00 50 31.58 38 (64.49) Other receivables 1,072 35.70 790 34.13 589 (33.97) 892 44.34 618 (15.80) 734 (40.47) Short term investments 27,433 44.69 18,960 1.12 18,750 (13.97) 21,794 81.31 12,020 77.60 6,768 92.71 Cash and bank balances 1,174 (13.80) 1,362 (63.67) 3,749 189.72 1,294 8.83 1,189 (69.11) 3,849 312.98 35,883 36.29 26,328 (14.94) 30,954 12.00 27,638 60.47 17,223 15.46 14,917 53.64 TOTAL ASSETS 86,562 27.62 67,829 11.80 60,670 9.25 55,532 28.96 43,060 11.69 38,552 20.78
30

VertiCal analysis - balanCe sheet
0 10% 20% 30% 40% 50% 60% 70% 80% 90% 100%
Balance Sheet Analysis (Equity & Liabilities)(%)
Equity Non-current Liabilities Current Liabilities
2014
2013
2012
2011
2010
2009
Rs. in Million 2014 2013 2012 2011 2010 2009 Rs % Rs % Rs % Rs % Rs % Rs %
EQUITY AND LIABILITIES EQUITY Share capital 12,722 14.70 12,722 18.76 12,722 20.97 8,482 15.27 6,785 15.76 6,785 17.60 Capital reserve 160 0.18 160 0.24 160 0.26 160 0.29 160 0.37 160 0.42 Revenue reserves 12,788 14.77 12,269 18.09 12,885 21.24 14,039 25.28 8,502 19.74 6,137 15.91 25,670 29.66 25,151 37.08 25,767 42.47 22,681 40.84 15,447 35.87 13,082 33.93
NON - CURRENT LIABILITIES Long term borrowings 2,500 2.89 4,280 6.31 3,870 6.38 2,704 4.87 3,819 8.87 4,579 11.88 Deferred liabilities 4,574 5.28 4,078 6.01 3,915 6.45 3,623 6.52 3,807 8.84 3,036 7.87 7,074 8.17 8,358 12.32 7,785 12.83 6,327 11.39 7,626 17.71 7,615 19.75 CURRENT LIABILITIES Trade and other payables 37,904 43.79 21,854 32.22 16,126 26.58 12,330 22.20 9,023 20.95 8,003 20.76 Interest and mark - up accrued 30 0.03 22 0.03 25 0.04 80 0.14 138 0.32 147 0.38 Short term borrowings 11,603 13.40 7,000 10.32 4,990 8.22 8,736 15.73 5,641 13.10 6,089 15.80 Current portion of long term borrowings 1,780 2.06 1,460 2.15 1,434 2.36 1,616 2.91 1,759 4.09 1,799 4.67 Taxation 2,501 2.89 3,984 5.87 4,543 7.49 3,762 6.78 3,426 7.96 1,817 4.71 53,818 62.17 34,320 50.60 27,118 44.69 26,524 47.76 19,987 46.42 17,855 46.32 TOTAL EQUITY AND LIABILITIES 86,562 100.00 67,829 100.00 60,670 100.00 55,532 100.00 43,060 100.00 38,552 100.00
ASSETS NON - CURRENT ASSETS Property, plant & equipment 20,094 23.21 18,444 27.19 17,819 29.37 17,051 30.69 15,934 37.00 13,994 36.30 Intangible assets 1,611 1.86 1,652 2.44 1,679 2.77 1,569 2.83 1,569 3.64 1,569 4.07 Log term investments 28,135 32.50 20,662 30.46 9,512 15.68 8,659 15.59 7,870 18.28 7,728 20.04 Long term Loans & advances 823 0.95 740 1.09 701 1.16 606 1.09 455 1.06 338 0.88 Long term deposits & prepayments 16 0.02 3 0.00 5 0.01 9 0.02 9 0.02 6 0.02 50,679 58.55 41,501 61.19 29,716 48.98 27,894 50.23 25,837 60.00 23,635 61.31 CURRENT ASSETS Stores, spares and loose tools 3,315 3.83 3,245 4.78 3,099 5.11 2,447 4.41 2,440 5.67 2,997 7.77 Stock in trade 982 1.13 302 0.45 442 0.73 637 1.15 212 0.49 144 0.37 Trade debts 822 0.95 701 1.03 3,611 5.95 87 0.15 358 0.83 257 0.67 Loans and advances 1,059 1.22 921 1.36 678 1.12 432 0.78 336 0.78 130 0.34 Deposits and prepayments 26 0.03 47 0.07 36 0.06 55 0.10 50 0.12 38 0.10 Other receivables 1,072 1.24 790 1.16 589 0.97 892 1.60 618 1.44 734 1.90 Short term investments 27,433 31.69 18,960 27.95 18,750 30.90 21,794 39.25 12,020 27.91 6,768 17.56 Cash and bank balances 1,174 1.36 1,362 2.01 3,749 6.18 1,294 2.33 1,189 2.76 3,849 9.98 35,883 41.45 26,328 38.82 30,954 51.02 27,638 49.77 17,223 40.00 14,917 38.69 TOTAL ASSETS 86,562 100.00 67,829 100.00 60,670 100.00 55,532 100.00 43,060 100.00 38,552 100.00
Annual Report of Fauji Fertilizer Company Limited 2014
31

Horizontal Analysis Rs. in Million
2014 14 Vs. 13 2013 13 Vs. 12 2012 12 Vs. 11 2011 11 Vs. 10 2010 10 Vs. 09 2009 09 Vs. 08 Rs % Rs % Rs % Rs % Rs % Rs %
Sales 81,240 9.07 74,481 0.21 74,323 34.59 55,221 23.06 44,874 24.09 36,163 18.21 Cost of Sales 50,137 25.50 39,949 4.31 38,300 83.50 20,872 (17.53) 25,310 23.37 20,515 12.50 Gross profit 31,103 (9.93) 34,532 (4.14) 36,023 4.87 34,349 75.57 19,564 25.03 15,648 26.62 Distribution cost 6,431 4.28 6,167 11.04 5,554 27.04 4,372 10.85 3,944 24.22 3,175 18.96 24,672 (13.02) 28,365 (6.91) 30,469 1.64 29,977 91.91 15,620 25.23 12,473 28.73 Finance cost 849 12.30 756 (24.32) 999 27.10 786 (27.69) 1,087 15.03 945 35.97 Other expenses 2,303 (9.97) 2,558 (4.77) 2,686 1.17 2,655 92.95 1,376 8.18 1,272 41.96 21,520 (14.10) 25,051 (6.47) 26,784 0.93 26,536 101.69 13,157 28.29 10,256 26.65 Other income 4,721 8.08 4,368 2.34 4,268 (35.63) 6,630 110.28 3,153 12.57 2,801 44.16 Net profit before taxation 26,241 (10.80) 29,419 (5.26) 31,052 (6.37) 33,166 103.35 16,310 24.91 13,057 30.04 Provision for taxation 8,070 (13.08) 9,284 (8.91) 10,192 (4.52) 10,674 102.12 5,281 24.73 4,234 20.42 Net profit after taxation 18,171 (9.75) 20,135 (3.48) 20,860 (7.26) 22,492 103.94 11,029 25.00 8,823 35.22
Vertical Analysis Rs. in Million
2014 2013 2012 2011 2010 2009 Rs % Rs % Rs % Rs % Rs % Rs %
Sales 81,240 100.00 74,481 100.00 74,323 100.00 55,221 100.00 44,874 100.00 36,163 100.00 Cost of Sales 50,137 61.71 39,949 53.64 38,300 51.53 20,872 37.80 25,310 56.40 20,515 56.73 Gross profit 31,103 38.29 34,532 46.36 36,023 48.47 34,349 62.20 19,564 43.60 15,648 43.27 Distribution cost 6,431 7.92 6,167 8.28 5,554 7.47 4,372 7.92 3,944 8.79 3,175 8.78 24,672 30.37 28,365 38.08 30,469 41.00 29,977 54.29 15,620 34.81 12,473 34.49 Finance cost 849 1.05 756 1.02 999 1.34 786 1.42 1,087 2.42 945 2.61 Other expenses 2,303 2.83 2,558 3.43 2,686 3.61 2,655 4.81 1,376 3.07 1,272 3.52 21,520 26.49 25,051 33.63 26,784 36.04 26,536 48.05 13,157 29.32 10,256 28.36 Other income 4,721 5.81 4,368 5.86 4,268 5.74 6,630 12.01 3,153 7.03 2,801 7.75 Net profit before taxation 26,241 32.30 29,419 39.50 31,052 41.78 33,166 60.06 16,310 36.35 13,057 36.11 Provision for taxation 8,070 9.93 9,284 12.46 10,192 13.71 10,674 19.33 5,281 11.77 4,234 11.71 Net profit after taxation 18,171 22.37 20,135 27.03 20,860 28.07 22,492 40.73 11,029 24.58 8,823 24.40
horizontal and VertiCal analysis - proFit and loss aCCount
0 10% 20% 30% 40% 50% 60% 70% 80% 90% 100%
Profit & Loss Analysis (Income)(%)
Sales
2014
2013
2012
2011
2010
2009
Other Income
32

YEAR 2014 1st Quarter 2nd Quarter 3rd Quarter 4th Quarter
Sales 17,573 18,423 19,042 26,202 Cost of sales 10,091 11,588 11,579 16,879 Gross profit 7,482 6,835 7,463 9,323
Distribution Cost 1,490 1,534 1,586 1,821 5,992 5,301 5,877 7,502
Finance cost 217 212 176 244 Other expenses 591 452 589 671 5,184 4,637 5,112 6,587
Other income 1,536 281 1,672 1,232 Net profit before taxation 6,720 4,918 6,784 7,819
Provision for tax 2,162 1,314 1,984 2,610 Net profit after taxation 4,558 3,604 4,800 5,209
0 10% 20% 30% 40% 50% 60% 70% 80% 90% 100%
Profit & Loss Analysis (Expenses)(%)
Cost of Sales
2014
2013
2012
2011
2010
2009
Distribution Cost Finance Cost Other Expenses Taxation
Cash Flow Analysis (Rs. in million)
Operating Activities
30,000
20,000
10,000
0
(10,000)
(20,000)
(30,000)
Investing Activities Financing Activties
Quarterly analysis Rs. in Million
Annual Report of Fauji Fertilizer Company Limited 2014
33

Quarterly analysis
Quarter Production Sales, Revenues &
Income
Operating costs (cost of sales and distribution costs)
Profit Net assets
Q1 Aggregate ‘Sona’ urea production of 594 thousand tonnes by the three Plants was 4% higher than the corresponding quarter, with an improved operating efficiency of 118% against 113% last year.
‘Sona’ urea sales for the period at 574 thousand tonnes were higher by 2% compared to the corresponding period of last year, due to increase in selling price of urea bag, yielding aggregate highest ever first quarterly sales revenue of Rs. 17.57 billion.
Dividend income of Rs. 1.14 billion was received during the first quarter.
Incremental GIDC imposition on old plants effective January 01, 2014 resulted in an increase in cost of production, which was not allowed to be fully passed on, leading to a competitive disadvantageous position for the Company.
Foregoing in view, the revenue growth of the Company was curtailed resulting in lower margins and reduced profitability as profits for the first quarter were 7% lower as compared to the same quarter of last year, mainly because of increase in operating costs comprising of incremental levy of GIDC of Rs. 103/MMBTU on feed gas and Rs. 50/MMBTU on fuel gas, effective January 1, 2014.
The asset base of the Company reduced by 11% to Rs. 60.28 billion during the first quarter as short term investments were liquidated to pay off short term borrowings and final dividend for the year 2013.
Q2 ‘Sona’ urea production for the second quarter stood at 580 thousand tonnes, marginally down by 2% compared to the first quarter of 2014, owing to plant maintenance shutdown and gas curtailment.
Urea sales for the quarter were higher by 5% compared to the previous quarter of 2014 as 600 thousand tonnes were sold.
Sales revenue at Rs. 18.42 billion increased by 5% compared to the first quarter mainly because of higher urea offtake, whereas no dividend income was received during the second quarter.
Notwithstanding higher revenues, margins of the Company declined owing to lower productivity, absorption of the cost of GIDC and other operating expenses due to inflation. The Company reported cost of sales of Rs. 11.59 billion, 15% higher than the first quarter while distribution cost at Rs. 1.53 billion marginally increased by 3% on account of general inflation.
As compared with first quarter of 2014, profitability was down by 21% mainly because of absence of dividend income in the quarter.
Net assets increased by 19% to Rs. 71.75 billion in comparison with the first quarter of 2014, primarily due to an increase in long and short term investments as the Company invested Rs. 1.41 billion in financial instruments and injected further equity into FFF.
Quarterly Analysis (%)
0 20% 40% 60% 80% 100%
Production
Sales
OperatingCost
Profit
Revenue &Income
25% 24% 25% 26%
24% 25% 25% 26%
22% 23% 23% 32%
20% 23% 23% 33%
20% 20% 26% 33%
1st Quarter 2nd Quarter 3rd Quarter 4th Quarter
34

Quarter Production Sales, Revenues &
Income
Operating costs (cost of sales and distribution costs)
Profit Net assets
Q3 ‘Sona’ urea production for the third quarter at 594 thousand tonnes was 1% higher than average output for the first two quarters of 2014 because of lower maintenance shutdown days and improved production efficiencies.
In addition to production of urea, the Company imported around 69 thousand tonnes of DAP during the quarter in view of demand supply gap.
Urea offtake recorded in the third quarter was almost in line with the average offtake during the first two quarters with aggregate sales of 589 thousand tonnes.
Sales revenue for the quarter at Rs. 19.04 billion registered an increase of 6% over the average revenue for the previous quarters because of increase in sale price of urea bag, whereas a dividend income of Rs. 1.09 billion was reported for the third quarter, including first ever dividend receipt of Rs. 544 million from AKBL.
Cost of sales at Rs. 11.58 billion increased by 7% over the average for the previous quarters mainly because of planned repair and maintenance cost of Plant III - Mirpur Mathelo and further imposition of GIDC of Rs. 50/MMBTU on fuel gas.
Distribution costs at Rs. 1.59 billion showed a minimal increase of 5% over the previous quarters mainly because of rise in transportation costs.
As a result of increased sales revenue, net margin of the Company at Rs. 4.8 billion increased by 18% as compared to the average for the previous two quarters.
The third quarter recorded further equity injection of Rs. 350 million into FFF bringing the total investment to Rs. 1,036 million. The Company also increased investments in financial instruments by Rs. 2.56 billion during the quarter raising the asset base to Rs. 73.54 billion.
Q4 Urea Production during the last quarter of 2014 was the highest during all the four quarters with an output of 635 thousand tonnes, 8% higher than the previous three quarters, resulting in aggregate yearly production of 2,403 thousand, in line with the output for the previous year.
The Company also imported 54 thousand tonnes of DAP during the quarter, resulting in total DAP imports during the year to 123 thousand tonnes.
Urea sales for the quarter stood at 608 thousand tonnes higher by 3% in comparison with the average for the previous three quarters.
The entire stock of imported DAP was liquidated during the quarter and the Company achieved sales revenue of Rs. 26.20 billion, which included Rs. 7.63 billion from marketing of DAP. Aggregate revenue was up by 43% compared to the average for the previous three quarters, bringing the total revenue for the year 2014 to a record level of Rs. 81.24 billion, 9% higher than last year.
Cost of sales of Rs. 16.88 billion was 52% higher than the average for the first three quarters of 2014, mainly because of additional cost of imported DAP. The Company recorded an aggregate cost of sales of Rs. 50.14 billion, 26% higher than 2013.
Distribution costs at Rs. 1.82 billion registered an increase of 18.49% over the three quarters’ average on account of increased warehousing costs of DAP, whereas annual distribution costs were recorded at Rs. 6.43 billion, marginally higher by 4% compared to 2013.
The fourth quarter registered an increase in profits by 21% to Rs. 5.2 billion as compared with the previous three quarters’ average, and the Company recorded annual profits of Rs. 18.17 billion for the year 2014, lower by 10% only compared to 2013, despite adverse market conditions.
Company’s asset base stood at Rs. 86.56 billion as at December 31, 2014, an increase of Rs. 13.02 billion from the third quarter of 2014, with net assets increasing to Rs. 25.67 billion and registering a 4% increase from the previous quarter, primarily on account of an increase in long term investments, financial instruments and available for sale investments.
Annual Report of Fauji Fertilizer Company Limited 2014
35

direCtors’ report
“Characteristics of endeavoring in innovative technologies and forging ahead with unparalleled determination have made FFC one of the preeminent companies of Pakistan”
Chairman’s Review
Lt Gen Khalid Nawaz KhanHI (M), Sitara-i-Esar (Retired)Chairman
Directors’ Report
36

I feel privileged to assume responsibilities as Chairman of FFC’s Board of Directors post retirement of Lt Gen Muhammad Mustafa Khan HI(M) (Retired), whose contributions led to immense progress and growth of the Company.
I am very pleased to inform that the Company has attained all its major targets for the year 2014 in terms of profitability, diversification and good governance besides maintaining the stakeholders’ trust in our product quality and business practices.
As we consolidate our diversification initiatives undertaken recently, we remain focused on exploring further avenues for growth and with a view to establishing an international foothold, the Company is evaluating the prospects for setting up of an offshore fertilizer plant in Tanzania, in collaboration with internationally reputed partners.
Post divestment of 1% equity share of FFBL, the status of FFBL and AKBL has now changed to associated entities of FFC. The Board is confident that the Company’s stream of income from these organizations shall remain fairly consistent with the earlier trends.
The shareholders would be pleased to note that besides immense contribution to the national economy including agricultural sector and import substitution, FFC extends significant support to the National Exchequer by way of taxes / levies, and in recognition, the Company has been awarded the fifth highest taxpayer position. The total contribution for the year 2014 amounts to over Rs. 45 billion, which is more than twice the amount of net earnings for the period.
Based on strong Company performance with net earnings of Rs. 18.17 billion, the Board is pleased to announce final dividend of Rs. 3.50 per share, aggregating to annual payout of around 96%, including interim distributions of Rs. 10.15 per share.
Lt Gen Khalid Nawaz KhanHI (M), Sitara-i-Esar (Retired)Chairman
RawalpindiJanuary 30, 2015
Annual Report of Fauji Fertilizer Company Limited 2014
37

“Despite numerous economic impediments, the Company remained focused on optimizing shareholders’ return while looking for new growth horizons.”
CE & MD’s Remarks
Lt Gen Naeem Khalid Lodhi
HI (M) (Retired)Chief Executive & Managing Director
direCtors’ report
38
Directors’ Report

On behalf of the Management of the Company and on my own behalf, I welcome Lt Gen Khalid Nawaz Khan HI(M) (Retired) as the new Chairman of FFC Board of Directors.
I am pleased to report net earnings of Rs. 18.17 billion with per share earnings of Rs. 14.28, marginally down from last year because of higher gas cost (GIDC), negatively impacting the margins for the period owing to substantial absorption of the incremental costs by the Company.
We are however confident that as a result of our expansion strategies and measures taken for increased production, operational efficiencies, besides economizing on costs, the revenues are Insha Allah likely to increase over the years.
FFC Energy Limited attained first full year of successful operations in May 2014 and has further been able to achieve Tariff True-up, impacting positively on the future cashflows and profitability of the Company. The project operated at 97% of average availability factor and has to date supplied around 265 GWh of electricity to the national grid valued at over Rs. 4.20 billion. Construction work on the Individually Quick Freeze (IQF) Plant of Fauji Fresh n Freeze Limited, is progressing as per plan with scheduled inauguration during March 2015.
The Company is evaluating the proposal for installation of Coal Fired Boilers to conserve gas, being used for power generation, which can then be utilized for increased production, impacting positively on the net earnings.
As a part of our diversification strategy, we are also exploring the potential of coal mining in the Thar Coal area. In this regard, the Company has received encouraging response from the Government of Sindh for initial allocation of a coal block in the Thar area. Further decision on the project shall be taken after detailed technical, geographical & commercial evaluation and feasibility studies.
Based on persistent FFC efforts, Pakistan has been allocated permanent representation on the Board of Directors of International Fertilizer Industry Association (IFA), with FFC CE&MD being appointed as a Director from South Asia. FFC has also been conferred with ‘Taxpayers Privilege and Honour Card’ in recognition of Company’s tax compliant culture and significant contributions to the National Exchequer.
Lt Gen Naeem Khalid Lodhi
HI (M) (Retired)Chief Executive & Managing Director
RawalpindiJanuary 30, 2015
Annual Report of Fauji Fertilizer Company Limited 2014
39

FinanCial reVieW
Macro-economic Overview
Pakistan’s economy witnessed broad based economic development in 2014 with GDP progression accelerating to 4.1% compared with 3.7% in 2013, which was also the highest during the last six years. The growth momentum was mainly supported by industrial and services sectors of the economy.
Agriculture Sector
Agriculture is a key sector of the economy as it is the main source of livelihood for the rural population, in addition to providing raw materials to main industrial units besides its significant contribution towards export earnings of the Country. The sector accounts for 21% of GDP and absorbs around 44% of the Country’s work force.
The performance of this sector in the outgoing fiscal year remained moderate, recording a growth of 2.1% compared with 2.9% last year due to a drop in crop production owing to poor weather conditions.
Fiscal Development
Pakistan’s fiscal deficit reduced to 3.2% against 4.7% in 2013 on account of reforms initiated for improvement of the tax system in addition to enhancement of the tax to GDP ratio by broadening the tax base.
Investments
Total investments classified into ‘Fixed’ and ‘Private’ were recorded at 14% of GDP, down from 14.6% last year whereas total Foreign Direct Investments (FDI) rose to US $ 4.40 billion during 2014, about three times the size of US $ 1.58 billion FDI during 2013.
Money and Credit
In order to deal with the balance of payment position and stabilize the inflationary outlook, the State Bank of Pakistan had tightened its monetary policy during November 2013 when it increased the discount rate to 10%. However, on account of shrinking budget deficits and contained government borrowing the discount rate was reduced to 9.5% in November 2014.
Inflation
Inflation was recorded at an average of 7.2% during 2014, a decline of 0.5% from last year. Reaching a high of 9.2% in April 2014 as a result of increasing food prices due to demand supply gap and rising imported food prices due to increase in global market. However, appreciation of the Pak Rupee and reduction in fuel prices reduced inflation to 4.3% by December 2014.
Currency Appreciation
The Pakistani Rupee recorded an appreciation of about 4.5% against the US Dollar during 2014 owing to reduction in international oil prices, increase in Foreign Direct Investment and extended fund facility of US $ 6.6 billion by the IMF against US $ 1.6 billion in 2013.
40
Directors’ Report

FFC PerformanceProfit and Loss Analysis
FFC recorded net earnings of Rs. 18.17 billion during the year 2014, with an
overachievement against targets except
for the increase in GIDC cost, which was
beyond the Company’s control and had to
be significantly absorbed by the Company,
resulting in net profitability decline by
around 10% compared to last year.
The achievement was supported by production efficiencies and marketing operations, in addition to a strong return of around Rs. 1.86 billion from treasury operations. Analysis of operating performance of the Company is presented in the following sections.
Aggregate urea output was recorded at 2,403 thousand tonnes by three Plants, in line with last year, effectively mitigating gas deficiencies through efficiency improvements, attaining capacity utilization of 117%.
Despite availability of imported product, Sona urea sales were recorded at 2,371 thousand tonnes and the Company captured
Maintenance of a dynamic and flexible investment portfolio resulted in increased investment income of Rs. 2.14 billion, 14% higher than last year, with a contribution of 12% to our net profitability. Other income included a gain of Rs. 282 million on divestment of 1% equity stake in FFBL to Fauji Foundation, at market price prevailing on the transaction date.
The decline in dividend receipts from FFBL was compensated by incremental income from Fauji Cement in addition to the first ever dividend receipt of Rs. 544 million from Askari Bank, resulting in 3% higher aggregate dividend income of Rs. 2.58 billion in comparison with 2013.
The results of the above operations translated into per share earnings of Rs. 14.28 as compared to Rs. 15.83 during 2013, owing to increased levy of GIDC, which was significantly absorbed by the Company, impacting negatively on profitability for the year.
Financial Position Analysis
Company reserves depicted a slight improvement mainly because of higher un-appropriated profit of Rs. 5.7 billion as compared to Rs. 5.5 billion last year, in
a combined FFC/FFBL urea market share of 46% compared to 45% last year owing to customer brand preference, whereas the joint DAP market share of FFC & FFBL stood at 49%. (Source: NFDC)
The Company earned record turnover of Rs. 81.24 billion, through incremental revenue generation of Rs. 6.76 billion mainly from higher marketing of 123 thousand tonnes of DAP compared to 73 thousand tonnes last year.
Persistent gas shortage, increased GIDC costs and incremental DAP sales were the major factors behind the increase in cost of
sales by 26% from the previous year. As a result, gross profit of Rs. 31.10 billion went down by 10% compared to last year. Distribution costs were recorded at Rs. 6.43 billion, with a marginal increase of 4% from last year mainly due to increased transportation costs and general inflation.
The rise in bank margins and KIBOR rates resulted in increased finance costs which were however curtailed to Rs. 849 million with an increase of 12% only compared to last year, through effective working capital management.
2009 2010 2011 2012 2013 2014
Dividend per share, Earnings per share & Net Assets per share(Rupees per share)
Dividend per shareEarnings per share
Bonus shareNet assets per share
0
10
20
30
2009 2010 2011 2012 2013 2014
Profitability(Rs. in million)
0
5,000
10,000
15,000
20,000
25,000
30,000
35,000
40,000
Gross pro�tPro�t after tax
2009 2010 2011 2012 2013 2014
Return on Equity &Capital Employed (%)
0
10
20
30
40
50
60
70
80
90
100
Return on EquityReturn on Capital Employed
41
Annual Report of Fauji Fertilizer Company Limited 2014

FinanCial reVieW
addition to net valuation gain of around Rs. 293 million on available for sale investments which is required to be reported in the Statement of Comprehensive Income. Company’s net worth thus stood at Rs. 25.7 billion as at December 31, 2014, 2% higher than 2013 with a breakup value of Rs. 20.18 per share.
Retention of GIDC remittances under Court rulings was the main cause for the increase in trade payables to Rs. 37.90 billion in 2014, compared with Rs. 21.85 billion last year.
Contingencies include a penalty of Rs. 5.5 billion imposed by the Competition Commission of Pakistan (CCP) in 2013 on grounds of alleged unreasonable increase in urea prices during 2011, whereas the factors including production shortfall due to gas curtailment, delayed imports and other market dynamics, were ignored by CCP. The Company has filed an appeal before the Competition Appellate Tribunal and is confident of a favourable decision.
Financial commitments of the Company stood at an aggregate of Rs. 6.5 billion at the close of 2014 in respect of equity investments, purchase of goods and services and capital expenditure. Details of these commitments are disclosed in the relevant notes to the financial statements.
Increase of 9% in property, plant &
equipment mainly includes procurement of plant and machinery including catalysts for Plant III at Mirpur Mathelo, acquisition of land for office buildings in addition to other fixed assets.
Long term loans and advances witnessed increase of 11% to Rs. 823 million from last year on account of additional disbursements of loans to Company employees during the year, under their terms of employment.
Trade debts showed a 17% increase to Rs. 822 million, whereas stock in trade stood at Rs. 982 million at the close of the year, primarily representing unsold urea stock of around 37 thousand tonnes, which however was also liquidated in January 2015.
The Company’s asset base thus recorded an increase of Rs. 18.73 billion to Rs. 86.56 billion compared to last year, primarily due to an increase in long term investments in financial instruments, additional equity injection in Fauji Fresh n Freeze and retention of GIDC funds, invested in short term profitable investments.
Liquidity Position AnalysisCompany’s working capital comprises of Short term investments and Cash & bank
balances which stood at an aggregate of Rs. 28.61 billion at the close of 2014, with an improvement of Rs. 8.28 billion over last year, mainly because of placement of surplus funds in term deposits for generation of incremental income for the Company.
Liquidity and Treasury ManagementStrategy to overcome liquidity problems
FFC maintains a strong liquidity position through an effective liquidity management system to ensure availability of sufficient working capital besides identification and mitigation of cashflow risks. Further, the Company has implemented an efficient Treasury Management System for generation of incremental cashflows and revenues for the Company.
The main working capital requirements of the Company are managed through internal liquidity generation sources comprising of sales revenues and dividend receipts in addition to investment income, with minimal recourse to external means of financing. Sales revenue receipts are managed through optimized control of customer credit, in addition to securing advance customer orders. Regular forecasting of cash flows is also carried out to maintain an optimum working capital cycle.
Liquidity generation from dividends is attributable to Company’s portfolio of equity investments comprising of FFBL, FCCL, PMP and AKBL.
42
Directors’ Report

Treasury Management
“FFC maintains a dynamic and flexible portfolio of investments to augment profitability and increase shareholders’ return, through placement of cash surpluses in money market and government securities, in compliance with applicable statutory requirements.”
Treasury Management System comprises of the following objectives / tools while remaining within acceptable level of risk and exposure:
• Periodic evaluation of planned revenues from sales / investment income and comparison with the timing and quantum of working capital requirements
• Identification of cash surpluses for investment in suitable opportunities offering optimal returns while providing preservation of invested capital
• Matching of maturity dates of investments with working capital / other funding requirements
• Maintenance of a fairly diversified portfolio to earn maximum returns, remaining within prudent levels of exposure
• Investment options may include short / long term placements, with high credit rated institutions
The placement of funds is arranged with target maturity dates to ensure availability of sufficient liquidity for working capital / investment requirements, besides generation of incremental income.
Repayment of debts and recovery of losses
The Company carried a minimal long term financing balance of Rs. 2.50 billion at the close of 2014, down by Rs. 1.80 billion compared to last year as no additional funds were borrowed on long term basis during the year.
Short term borrowings were recorded at Rs. 11.60 billion, representing an increase of Rs. 4.60 billion from last year, whereas short term investments increased by Rs. 8.47
billion to Rs. 27.43 billion, resulting in net surplus liquidity of Rs. 3.87 billion.
Cash flow projections for the future also indicate availability of sufficient funding for timely retirement of long term debt, in addition to generation of incremental income / liquidity through efficient placement of surplus funds, for sustained Company profitability.
DuPont AnalysisNet profit margin of the Company decreased to 22% during the year as compared to 27% in 2013 as a result of increase in raw material cost and GIDC. Asset turnover and ownership ratio reduced to 0.94 and 9.6% respectively in 2014 owing to an increase in the asset base of the Company, primarily on account of an increase in long term investments. Consequently, the Company reported a return on equity of 71% in 2014 compared to 80% last year.
Return on Equity 71%
Return on Assets 21%
OwnershipRatio 29.6%
Assets turnover 0.94
Owners’Equity
25,670
TotalAssets
86,562
Owners‘Equity
25,670
Non-currentLiabilites 7,074
Current Liabilites
53,818
Non-currentAssets 50,679
Current Assets
35,883
TotalCost
63,069
Sales 81,240
TotalLiabilites
60,892
TotalAssets
86,562
Sales 81,240
Net Profit
18,171
Net profitMargin 22%
2014 2013
Tax burden 31% 32%Interest burden 3% 3%EBIT margin 33% 41%Asset turnover 0.94 1.1Leverage 70% 63%Return on Equity 71% 80%
DuPont Analysis
43
Annual Report of Fauji Fertilizer Company Limited 2014

Cashflows & Financing Arrangements
Cashflow Analysis
Analysis of FFC cash flows for the year 2014 is presented through the following major liquidity generation activities: Operating activities
Net cash generation from operations stood at Rs. 29 billion, up by 15% compared to last year, after adjustment of finance cost of Rs. 753 million and income tax payments aggregating to Rs. 9.35 billion during the year.
Investing activities
The Company incurred fixed capital expenditure of Rs. 3.48 billion during the year, representing an increase of Rs. 1.18 billion from last year and comprised mainly of additions to other items of plant and machinery in addition to catalysts procurement.
Cashflows on account of interest income increased by 3% to Rs. 1.28 billion as compared to last year on account of efficient portfolio management. The Company also
injected additional equity of Rs. 450 million in FFF, resulting in aggregate investment of FFC in FFF to Rs. 1,036 million.
The Company sold 1% equity stake in FFBL during the year to Fauji Foundation against an aggregate consideration of Rs. 375 million, resulting in conversion of FFBL status from a subsidiary to an associated company of FFC.
Dividends receipts during the year stood at Rs. 2.58 billion, in line with last year whereas investment in financial instruments on long term basis increased by Rs. 7.1 billion during the year.
Consequently, net cash used in investing activities stood at Rs. 7.7 billion, down by around Rs. 1 billion from 2013.
Financing activities
The Company repaid long term loan installments of Rs. 1.46 billion whereas payments on account of dividends to shareholders aggregated to Rs. 17.58 billion during 2014, resulting in net cash utilization of Rs. 19.04 billion in financing activities during the year.
Cash and cash equivalents at year end
The Company recorded a net increase in cash and cash equivalents of Rs. 2.3 billion during 2014 with a balance of Rs. 15.28 billion, as compared to a net decrease recorded in cash and cash equivalents last year.
Financing Arrangements
The Company carries an efficient liquidity management system with minimal reliance on external financing, to minimize financing costs.
External financing is arranged after extensive cash flow forecasting for working capital, investment or asset acquisition requirements, with a higher reliance on short term debt as compared to long term financing.
Because of a strong liquidity position, the Company carried a minimal long term debt of Rs. 2.5 billion, against an aggregate debt raising capacity of over Rs. 77 billion (at three times the Company’s net worth of Rs. 25.7 billion). This indicates that the Company had around 96.8% of unutilized debt raising capacity at the year end.
Short term borrowings of the Company stood at Rs. 11.6 billion at year end against aggregate financing facilities of Rs. 13.30 billion comprising of short term running finance and Istisna arrangements with various banks, under mark-up / profit arrangements. Additionally, letters of credit lines upto Rs. 11.23 billion are available against lien on shipping / title documents and charge on FFC assets, in addition to corporate guarantees issued by banks on behalf of FFC upto Rs. 100 million.
Capital Structure of FFCFFC’s capital structure comprised of Rs. 12.72 billion of share capital representing 1,272 million ordinary shares of Rs. 10 each, with net worth of Rs. 25.67 billion which improved
FinanCial reVieW
2009 2010 2011 2012 2013 2014
Inventory, Debtors and Creditors Turnover (days)
0
2
4
6
8
10
12
Inventory Turnover Debtors TurnoverCreditors Turnover
2009 2010 2011 2012 2013 2014
Leverage & Liquidity Ratios
0
10
20
30
40
50
Debt/Equity (%) Interest Cover (times)Current Ratio (times) Quick Ratio (times)
0.4
0.6
0.8
1.0
1.2
Cur
rent
& q
uick
ratio
Deb
t / E
quity
& In
tere
st C
over
44
Directors’ Report

Appropriations
Rs. in Rs. per Million share
Opening Reserves 12,429 Final Dividend – 2013 (5,089) 4.00Net Profit 2014 18,171 14.28Other Comprehensive Income 350 Available for Appropriation 25,861
Appropriations First Interim Dividend 2014 (3,817) 3.00Second Interim Dividend 2014 (4,326) 3.40Third Interim Dividend 2014 (4,771) 3.75Closing Reserves 12,947
by 2% from last year. Fauji Foundation continues to be the major shareholder with 44.35% equity holding.
Long term debt of the Company stood at Rs. 2.5 billion at close of the year, with a debt / equity ratio of 9:91 as compared to 15:85 in 2013, whereas financial leverage was recorded at 0.62.
The above indicators provide adequate evidence as to the adequacy of the capital structure for the foreseeable future.
Capital Market & Market CapitalizationThe Company is listed on all the three stock exchanges of Pakistan including the Karachi Stock Exchange (KSE) which is the Country’s largest and most liquid stock exchange, offering an orderly and reliable market place for its investors.
As at December 31, 2014, KSE had a market capitalization of Rs. 7,381 billion, with an increase of 126% over 2010.
However, the number of companies listed on KSE depicted a year on year decline by delisting of 87 companies since 2010, resulting in a reduced number of 557 listed
2009 2010 2011 2012 2013 2014
Market Capitalization &Market Price
0
20
40
60
80
100
120
140
160
Market Capitalization(Rs. billion)
Market Value - Close(Rs.)
companies at the close of 2014. Total capital listed on the exchange rose to Rs. 1,168 billion, 3% higher than last year. As at December 31, 2014, market capitalization of FFC’s shares stood at Rs. 149 billion, up by 5% from last year. Trading at an average of Rs. 113.80 per share, market price experienced major fluctuations between the highest of Rs. 125.92 per share to the lowest of Rs. 106.51 per share. Trading in FFC’s equity during the year however declined to 287 million shares, a substantial drop of 29% as compared to last year.
Fluctuations are principally caused by market psychology, speculative investors and material events occurring during the year.
Profit Distribution & Reserve AnalysisThe Company carried opening reserves of Rs. 12.43 billion at the start of 2014 of which, Rs. 5.09 billion were distributed as final dividend as approved by the shareholders, signifying 97% aggregate payout for the year 2013.
Net earnings of Rs. 18.17 billion were recorded by the Company during the year, against which, an aggregate of Rs. 12.91 billion were distributed on account of three interim dividends, while no transfers were carried out to the general reserves.
The Company carried net reserves of Rs. 12.95 billion as at the close of the year in the form of Reserves and un-appropriated profit as shown in ‘Appropriations’ table below.
Sensitivity AnalysisFFC is exposed to several external factors, beyond management’s control which can affect performance and profitability and therefore alter annual results.
Sensitivity analysis is performed on regular basis to minimize the risk of these external factors. This involves analysing trends, yearly results and testing the effect of various critical and non-critical variables on the overall profitability of the Company.
Mitigation of key sensitivities and other risks has been discussed in detail in the ‘Risk &
Opportunity’ section of this Report.
Annual Report of Fauji Fertilizer Company Limited 2014
45

Key Sensitivities Urea production & cost of sales
Despite efficient plant operations, urea production has been exposed to consistent gas curtailment, resulting in production losses. In addition, maintenance turnarounds above planned levels can also significantly impact production and the Company profitability.
Looking ahead, depleting gas reserves pose a major risk to sustained production and profitability.
Cost of production continues to escalate due to incremental GIDC levy each year, part of which had to be absorbed by the Company during the previous years owing to market conditions.
Sensitivity Analysis
The Company however remains committed towards efficiency enhancements in addition to cost cuts for mitigating these risks and sensitivities. In order to maintain the operating efficiency, regular inspection and maintenance is carried out at all plants to reduce production downtime.
The un-judicious diversion of FFC gas quota of 34 MMSCF previously allocated to the power sector, to another fertilizer company by the Government, is an added factor behind declining Company margins.
Sales volume & prices
Sales volume is defined by plant production, fertilizer demand and environmental conditions in addition to excessive fertilizer imports.
Although selling prices are determined internally, these may be significantly impacted by competitor prices, market conditions, international market trends, subsidies on imported fertilizer and lately, the absorption of GIDC costs, resulting in costs absorption and decline in Company profitability.
As a result, sales volume and revenues have become increasingly sensitive to external factors, with the potential to alter overall Company productivity and profitability.
Average selling price of fertilizer bag during 2014 remained depressed with only a minor increase from last year because of market forces, adding further pressure on Company profitability.
Dividend income
Dividend income from our strategic investments depends upon the related parties’ yearly performance and is thus beyond the Company’s control. A significant part of dividend income comes from FFBL and recently, FCCL and AKBL have also started contributing to the dividend stream.
Considering similar core competencies, factors that impact FFC also influence FFBL’s performance. FCCL and AKBL
operate in different sectors and are subject to different sensitivities than FFC.
Other income
Income on deposits with banks and other financial institutions rely on the Company’s competence to efficiently generate funds in excess of working capital / other requirements, in addition to their deployment in profitable options. However, any return on deposits and investments are subject to interest / policy rates and market conditions, which are beyond the Company’s control.
Finance cost
Long and short term borrowings and the resultant finance costs have a significant impact on the Company’s profitability. Although margins on loans are negotiated by the management, the KIBOR / interest rate fluctuations are subject to market & economic conditions and are thus beyond the Company’s control.
Foreign exchange risk
Foreign currency monetary assets and liabilities expose our Company to foreign exchange risk on account of unpredictability in exchange rates. Exchange valuation, carried out at the balance sheet date is therefore material in respect of profitability.
Relationship between the Company’s results and Management’s objectivesObjectives set by the management are subject to various sensitivities including strategic, commercial, operational and financial risks, which may affect the Company’s performance. These risks
FinanCial reVieW
Sales Volume (+/- 1%)
NPAT (Rs. M) EPS (Rs) 233 0.18
Gas Consumption/ Price (+/- 1%)
NPAT (Rs. M) EPS (Rs) 157 0.12
Dividend Income (+/- 5%)
NPAT (Rs. M) EPS (Rs) 129 0.10
Selling Price (+/- 1%)
NPAT (Rs. M) EPS (Rs) 467 0.37
Downtime (+/- 2 days)
NPAT (Rs. M) EPS (Rs) 136 0.11
Exchange Valuation (+/- 5%)
NPAT (Rs. M) EPS (Rs) 131 0.10
Income on Deposits (+/- 5%)
NPAT (Rs. M) EPS (Rs) 53 0.04
Finance Cost (+/- 5%)
NPAT (Rs. M) EPS (Rs) 27 0.02
46
Directors’ Report

alongwith their levels of exposure and mitigating strategies and opportunities have been discussed in the ‘Risk and
Opportunity Report’ section.
With the exception of price gains in 2011 impacting positively on net earnings of the Company, and the inverse / negative impact of GIDC on profitability during 2013 and 2014, the Company has maintained a steady growth momentum, expanding into core competencies in addition to significant diversification initiatives into the financial sector, food business, power generation and lately in 2014, in offshore fertilizer projects.
Sustained returns to the shareholders, consolidation of diversification projects including incremental receipts, successful operations of FFC Energy Limited, and maintenance of good governance practices are testaments to FFC’s performance and achievements over the years.
Incremental dividend income from FCCL and commencement of dividend stream from AKBL, with the first ever dividend receipt of Rs. 544 million during the year 2014, support the management’s assessments of target achievement.
Prospects of the Entity including targets for Financial and Non-Financial MeasuresProspects of the Entity
Efficiency improvements, costs economization, incremental dividend income and planned diversification projects provide sufficient support to the management’s projection of sustained profitability and return to the shareholders.
The Company’s wind power project FFC Energy Limited has attained True-up of its electricity supply Tariff, resulting in improved project revenues, and incremental future earnings for the Company.
Construction work on the Individually Quick Freeze (IQF) Plant of Fauji Fresh n Freeze Limited (formerly Al-Hamd Foods Limited), is progressing as per plan with scheduled inauguration during 2015.
In October, 2014 FFC signed a Consortium Agreement with internationally reputed partners for setting up of an offshore fertilizer project in Tanzania, which shall allow potential for export of fertilizer to neighbouring landlocked countries, the Middle East and South Asia.
Financial Measures
An estimation of various factors and variables were used to project targets for 2014. Most of these parameters are outside the control of the Company while others can either be monitored or their impact can be alleviated to a possible extent.
Fluctuations in currency, government regulation in the form of taxes, duties and levies, price of raw materials, gas diversions and curtailments etc. are all external factors affecting the Company’s cost of production.
Thorough evaluation and effective implementation has been carried out during the year to achieve set goals and targets. This is evident from the fact that despite major gas curtailment during the year, sustained production levels were achieved and operating targets were met.
Fertilizer selling prices registered only a marginal increase from last year, whereas gas costs depicted a significant increase resulting in decline in Company profitability by 10% compared to last year. However, the Company’s diversification initiatives enabled the Company to earn a net profit of Rs. 18.17 billion despite adverse market conditions.
Looking forward, the supply of gas to our competitors at concessionary rates, in addition to increase in gas costs, continue to pose profitability risks to the Company. Further, declining international urea prices also pose a risk to future margins. The Company is however fully geared to mitigate these sensitivities to ensure sustained Company profitability.
Non-financial Measures
The Company has identified the following areas as key non-financial performance measures:
• Stakeholders’ engagement• Relationship with customers and
business partners • Employee satisfaction• Maintenance of product quality for
fulfillment of buyer needs• Responsibilities towards the society• Healthy and safe environment • Transparency, accountability and good
governance
Responsibility for implementation has been delegated to the management, with continuous monitoring and control by the Board.
Cost Accounting Record and AuditIn compliance with the provisions of Companies (Audit of Cost Accounts) Rules, 1998, the Company has established a system for maintenance of Cost Accounting Records. The specified Cost Accounting Statements, the Report and other information for the financial year ended December 31, 2013 were submitted to the Securities and Exchange Commission of Pakistan (SECP) and the Registrar, alongwith the Cost Auditor’s Report thereon, within the stipulated timeframe.
47
Annual Report of Fauji Fertilizer Company Limited 2014

The Cost Auditors are required to be different from the Auditors of financial statements of the Company and the Board of Directors has re-appointed BDO Ebrahim & Company, Chartered Accountants, as Cost Auditors of the Company for the financial year ended December 31, 2014, under approval and in compliance with the criteria specified by the SECP including relevant experience and availability of sufficient qualified staff.
Corporate AwardsBest Presented Report Awards 2013
The Annual Report of the Company for the year 2013 was awarded the top position in the Manufacturing Sector, for the Best Presented Annual Report competition by the South Asian Federation of Accountants (SAFA), in addition to being awarded a Certificate of Merit for ‘Corporate Governance Disclosures’.
The Annual Report for 2013 was also adjudged amongst the best reports in the Fertilizer and Chemical sector, in the “Best Presented Accounts Award” competition for 2013 by the Joint Committee of the Institute of Chartered Accountants of
Syed Shahid Hussain (CFO) receiving MAP Award 2013 Mr Farhad Sheikh Mohammad (Director) receiving Best Corporate & Sustainability Report Award 2013
FinanCial reVieW
Pakistan (ICAP) and the Institute of Cost and Management Accountants of Pakistan (ICMAP). The awards represent FFC’s commitment towards promotion of transparency, accountability and good governance practices.
KSE Top Companies 2013
Karachi Stock Exchange acknowledged outstanding performance of FFC by adjudging overall winner of Top 25 companies for the fourth consecutive year, in 2013. This was also the twentieth successive placement in the top companies list. The achievement was conferred on the basis of FFC performance with regard to the top KSE companies’ criteria in terms of dividend payout, capital efficiency, profitability, free-float of shares, and compliance with listing regulations, in addition to transparency and investor relations.
Sustainability Report Award
FFC’s Sustainability Report for the year 2013, prepared in consultation with the Global Reporting Initiative (GRI-Holland), was awarded the second prize in the Sustainability Report Category by the ICAP / ICMAP, in terms of transparency
and social & environmental footprints. The Company has further been presented with the ‘Socially Responsible Investing’ Award at the CSR Awards 2015 by the National Forum of Environment and Health (NFEH).
Rawalpindi Chamber of Commerce & Industry (RCCI) Platinum Award
In 2014, FFC was also awarded the RCCI Platinum Award for being the leading company, mainly in terms of investment, total taxes paid, establishment of new industries amongst other factors.
Management Association of Pakistan (MAP) Awards
2013 is accredited with another achievement for FFC as being the top Company in terms of Management and Corporate Governance practices, in the Chemical Industry Sector by the Management Association of Pakistan (MAP).
Information Security Leadership (ISLA) Award
The Company has additionally achieved the prestigious Information Security Achievement (ISLA) Award for Asia Pacific, presented in recognition of pioneering information security culture at FFC by the International Information Systems Security Certification Consortium (ISC)2.
48
Directors’ Report

Consolidated Operations /Segmental Review of Business PerformanceGroup sales revenue for 2014 was recorded at Rs. 84.01 billion with net profit of Rs. 34.64 billion compared to Rs. 23.66 billion in 2013, higher by 46% mainly because of gain accrued on account of discontinued operations of FFBL. FFBL’s performance has been excluded from the consolidated results post the change in the company’s status from subsidiary to an associated entity of FFC, consequent to disposed of 1% FFBL equity by the Company.
Brief analysis of each Group company’s performance is presented below:
Fauji Fertilizer Bin Qasim Limited (FFBL)
FFBL was incorporated as FFC-Jordan Fertilizer Company Limited in 1993 and subsequent to restructuring in 2003 was renamed as Fauji Fertilizer Bin Qasim Limited. FFBL is a public limited company
and is listed on the Karachi, Lahore and Islamabad Stock Exchanges.
FFBL has a modern Granular Urea and Di-Ammonium Phosphate (DAP) fertilizer manufacturing complex located in Bin Qasim, Karachi. Principal objective of the company is manufacturing, purchasing and marketing of fertilizers with a current design capacity of 551 thousand tonnes of Urea and 650 thousand tonnes of DAP per annum. FFBL is the sole producer of DAP in Pakistan.
In October 2014, FFC sold 1% equity stake in FFBL aggregating to 9.34 million
ordinary shares to Fauji Foundation at the prevailing market price. FFC now holds 465.89 million shares of FFBL, representing 49.88% of FFBL’s equity.
FFBL recorded net earnings of Rs. 4.0 billion, 31% lower than last year, representing an earnings per share of Rs. 4.30. During the year, FFBL produced 213 thousand tonnes of ‘Sona’ Urea (Granular) and 702 thousand tonnes of DAP which were marketed by FFC Marketing Group on behalf of FFBL, earning Rs. 49.45 billion as sales revenue for FFBL.
2009 2010 2011 2012 2013 2014
Group Profits(Rs. million)
0
10,000
20,000
30,000
40,000
50,000
60,000
Group Net Pro�t Group Gross Pro�t
0 10% 20% 30% 40% 50% 60% 70% 80% 90% 100%
Group Shareholding (%)
FF
FFF
AKBL
FFCEL
PMP
FCCL
FFBL
FFC
FFC FFBL Others
2009 2010 2011 2012 2013 2014
Return on FFBL Investment
0
500
1,000
1,500
2,000
2,500
3,000
3,500
4,000
4,500
5,000
0
20
40
60
80
100
120
FFBL Dividend(Rs. million)
Rate of Return(%)
49
Annual Report of Fauji Fertilizer Company Limited 2014

Dividend receipts of Rs. 1.89 billion by FFC from FFBL during 2014 were 20% lower than last year because of reduced FFBL earnings during the period.
Meeting of the Board of Directors of FFBL was held on January 30, 2014, in which a final cash dividend of Rs. 2.25 per share i.e. 22.5% was declared. Total FFBL payout for the year thus stands at Rs. 4.00 per share i.e. 93.02%.
Pakistan Maroc Phosphore S.A., (PMP) – Morocco
PMP is a joint venture between FFC (shareholding of 12.5%), Fauji Foundation (12.5%), FFBL (25%) and the Moroccan state owned Officie Cherifien Des Phosphates (50%).
PMP was incorporated in Morocco in 2004 with the principal activity to manufacture and market phosphoric acid, fertilizer and other related products in Morocco and internationally.
PMP has a production capacity of 375 thousand tonnes of industrial phosphoric acid, a substantial portion of which is supplied to FFBL as raw material for production of DAP fertilizer with any excess sold in the international market. FFC invested Rs. 706 million in the Company and has earned Rs. 43 million in terms of dividend since the date of investment.
Fauji Cement Company Limited (FCCL)
FCCL is a public listed company incorporated in 1992 and is listed on the Karachi, Lahore and Islamabad Stock Exchanges. Principal activity of the company is manufacturing and sale of ordinary Portland cement. The company’s plant is located at Jhang Bahtar, District Attock with a current installed capacity of 3.43 million
metric tons. FFC holds Rs. 1.5 billion stake in FCCL, which amounts to 6.79% of FCCL’s equity.
During the quarter ended September 30, 2014, the first quarter of FCCL’s fiscal year 2014-15, the company earned a net profit of Rs. 602 million as compared to Rs. 582 million in the same period of last year and capacity utilization improved to 68% as compared to 67% in the corresponding period of the previous year. Local dispatches increased by 5.4% while exports declined by 11% as compared to the same quarter of last year.
FFC earned dividend income of Rs. 141 million from Fauji Cement during the year 2014. FFC Energy Limited (FFCEL)
FFCEL is an unlisted public limited company incorporated in 2009 and is presently a wholly owned subsidiary of FFC. The company was incorporated for the purpose of implementing a project comprising establishment and operation of a 49.5 MW wind power generation facility and its onward supply to National Transmission & Dispatch Company (NTDC).
In 2014, FFCEL completed its first year of commercial operations. The project operated at 97% of average availability factor and has to-date billed around 265 GWh of electricity to the national grid valued at over Rs. 4.2 billion.
The company’s petition for Tariff True-up was approved during the year, enabling FFCEL to invoice the tariff provided under the Energy Purchase Agreement, as opposed to claiming the value of energy supplied on the basis of Reference Tariff previously.
FinanCial reVieW
The company achieved sales revenue of Rs. 2.76 billion during the year, including the differential between the Reference and True-up tariffs for electricity supplied to-date, whereas net earnings stood at Rs. 735 million. Trade receivables of the company stood at Rs. 1.4 billion at year end.
Askari Bank Limited (AKBL)
AKBL was incorporated in 1991 as a public limited company and is listed on the Karachi, Lahore and Islamabad Stock Exchanges. AKBL is a scheduled commercial bank and is principally engaged in the business of banking with 321 branches including a Wholesale Bank Branch in the Kingdom of Bahrain. FFC has a 43.15% stake in the bank with a total investment of Rs. 10.46 billion
In view of reduction in FFC’s equity stake in FFBL, the status of AKBL has also changed from an indirect subsidiary to an associated concern of FFC.
As per the financial statements for the period ended September 30, 2014, AKBL reported per share earnings for the nine months period at Rs. 2.47 against last year’s loss per share of Rs. 3.13.
AKBL had a total asset base of Rs. 409 billion as of September 30, 2014, rising from Rs. 395 billion as at December 31, 2013, while gross advances rose to Rs. 195 billion. Non-performing loans improved by 5.5% during the nine months; from Rs. 33.1 billion at December 31, 2013 to Rs. 31.3 billion at September 30, 2014.
The year 2014 also marks the first ever dividend receipt of Rs. 544 million from AKBL by the Company.
50
Directors’ Report

Fauji Fresh n Freeze Limited (FFF) (formerly Al-Hamd Foods Limited - AHFL)
FFF was incorporated as an unlisted public limited company and was acquired by FFC in October, 2013 as a platform to enter the foods business. FFF is a 100% owned subsidiary of FFC and its principal activity is processing of frozen fruits, vegetables and ready to eat meals using state of the art Individually Quick Freeze (IQF) technology.
Construction work on IQF Plant of FFF, is progressing as per plan with scheduled inauguration during 2015.
As of December 31, 2014, the asset base of the company was valued at Rs. 1.97 billion, while the net worth of the company stood at Rs. 689 million. The company received additional equity funding of Rs. 450 million from FFC, in addition to financing of Rs. 627 million from the project lenders with aggregate debt financing of Rs. 1.22 billion at the close of the year.
Risk and Opportunity ReportKey sources of uncertainty
Preparation of financial statements in conformity with the approved accounting standards require management to make judgments, estimates and assumptions that affect the application of accounting policies and the reported amounts of assets and liabilities, income and expenses. The estimates and associated assumptions are based on historical experience and various other factors that are believed to be reasonable under the circumstances, the results of which form the basis of making the judgments about carrying values of assets and liabilities that are not readily apparent from other sources. Actual results may differ from these estimates.
The estimates and underlying assumptions are reviewed on an ongoing basis. Revisions to accounting estimates are recognised in the period in which the estimates are revised if the revision affects only that period, or in the period of the revision and future periods. Detail of significant accounting estimates and judgments including retirement benefits, estimation of useful life of property, plant and equipment, intangible
assets, recoverable amount of goodwill and investment in associated companies along with provision of taxation have been disclosed in note 3 of FFC’s financial statements and consolidated financial statements.
Strategic, commercial operational and financial risks
The Company is exposed to the risks identified in the following sections, which are subject to diverse levels of uncertainty against which the Company has implemented effective mitigating strategies as discussed below.
The strategic, commercial, operational and financial risks can emanate from uncertainty in financial markets, project failures, legal liabilities, credit risk, accidents, natural causes and disasters as well as deliberate aggressive actions from an adversary, or events of uncertain or unpredictable nature.
These key sources of uncertainty in estimation carry a significant risk of causing a material adjustment to the carrying amounts of assets and liabilities within the next financial year.
Strategic risks
Strategic risks are associated with operating in a particular industry and are beyond our control.
0
10
20
30
40
50
60
70
80
90
Growth & Acquisitions(Rs. billion)
Asset Base
1982 1992 1993 2002 2003 2006 2008 2009 2010 2011 2012 2013 2014
Net Worth Cum. Investments
Plant I(570 MT)
Plant I DBN(695 MT)
Plant II(1,330 MT)
Plant III(1,904 MT)
Plant III DBN(2,048 MT)
FFCEL0.65 B
FFCEL0.8 B
FFCEL0.85 B
AKBL10.46 B
FFF0.59 B
FFF0.45 B
FFBL4.66 B
PMP0.7 B
FCCL1.5 B
51
Annual Report of Fauji Fertilizer Company Limited 2014

Operational risks
These are risks associated with operational and administrative procedures, such as workforce turnover, supply chain disruption, IT system shutdowns, changes in Board structure or control failures.
Commercial risks
These risks emanate from the commercial substance of an organization. Cut down in an entity’s market share, product price regulation or a new constitutional amendment posing adverse threat to the organization’s profitability and commercial viability are a few examples of this risk.
Financial risks
Financial risks are divided in the following categories:
Credit risk
Credit risk is the risk of financial loss to a company if a customer or counterparty to a financial instrument fails to meet their contractual obligations, and arises principally from investments, loans and advances, deposits, trade debts, other receivables, short term investments and bank balances.
We limit our exposure to credit risk by investing only in liquid securities and only with counterparties that have high credit ratings. Management actively monitors credit ratings and given that the Company has invested in securities with high credit ratings only, management does not expect any counterparty to fail in meeting its obligations.
Market risk
Market risk is the risk that value of financial instruments may fluctuate as a result of changes in market interest rates or the market price due to change in credit rating of the issuer or the instrument, change in
FinanCial reVieW
market sentiments, speculative activities, supply and demand of securities and liquidity in the market. The Company incurs financial liabilities to manage its market risk. All such activities are carried out with the approval of the Board.
Liquidity risk
Liquidity risk is the risk that the Company will not be able to meet its financial obligations as they fall due.
The Company’s approach to managing liquidity is to ensure, as far as possible, that it will always have sufficient liquidity to meet its liabilities when due, under both normal and stressed conditions, without incurring unacceptable losses or risking damage to the Company’s reputation. The Company uses different methods to assist in monitoring cash flow requirements and optimizing its cash return on investments.
Typically the Company ensures that it has sufficient cash on demand, including lines of credit, to meet expected operational expenses for a reasonable period, including the servicing of financial obligation; this excludes the potential impact of extreme circumstances that cannot reasonably be predicted, such as natural disasters.
Plans and strategies for mitigating these risks and potential opportunities
Risk Governance
The roles and responsibilities at various levels of our risk management program are outlined in our risk governance structure.
I. Board and Committees
The Board oversees the risk management process primarily through its committees:
• The Audit Committee monitors the Company’s risk management process quarterly, or more frequently if required, focusing primarily on
financial and regulatory compliance risks.
• The Human Resource & Remuneration Committee focuses on risks in its area of oversight, including assessment of compensation programs to ensure they do not escalate corporate risk, in addition to succession planning with a view to ensure availability of talented functionaries in each area of critical Company operations.
• The System & Technology Committee reviews the need for technological upgradation in various processes to reduce the risk of obsolescence and inefficiency in plant operations.
• The Project Diversification Committee focuses on exploring new avenues for expansion and risk portfolio diversification.
II. Policies & Procedures
Board and its committees have adopted a set of policies and procedures, to promote a culture of ethics and values and delegate the authority to senior management for implementation of approved policies and procedures.
III. Control Activities
Senior management assess the risks and place appropriate controls to mitigate these risks.
IV. Performance Management
A continuous cycle of monitoring performance of the implemented controls has been established to identify weaknesses and devising strategic plans for improvement, which has enabled aversion of majority of performance risks.
V. Internal Audit
Provides independent & objective evaluations and reports directly to Audit Committee on the effectiveness of governance, risk management and control processes.
52
Directors’ Report

Risk Level Risk description Mitigating strategy
Strategic risk
Low Technological shift rendering FFC's production process
obsolete or cost inefficient.
Balancing, modernization and replacements
carried out at all the production facilities, ensuring
our production Plants are state of the art while
utilizing latest technological developments for cost
minimization and output optimization.
Moderate Decline in international price of urea, forcing a local price fall. Maintaining healthy margins through cost
minimization and output optimization strategies.
Strategic risk
Low Over-diversification leading to inadequate management
expertise for managing investments.Investing through a thorough diligence process
critically viewing worst case scenarios of return on
investment, taking account of management expertise
and where required, bringing on board experts of the
respective sectors.
Low Investing in companies that yield insufficient returns, tying up
shareholders’ funds and impacting profitability.
Commercial risk
Low Strong market competition lowering demand for FFC’s
product.
FFC combined with FFBL currently holds 46% urea
market share, and continuous efforts are made to
sustain production and maintain our market share.
Low Outdated farming techniques employed by farmers leading to
poor crop health and declining per hectare output.
Provision of farm advisory services and establishment
of soil & water testing laboratories, micro-nutrient
and plant tissue analysis laboratories.
Low Variations in commodity prices of agricultural products
negatively affecting liquidity of customers.
Ensuring provision of locally manufactured fertilizer
at competitive rates lower than internationally
prevailing market rates.
High Increasing production and distribution costs affecting pass
through ability of the Company.
Increasing levies on raw material and escalating
pressure on fertilizer pricing by the Government
cannot be controlled by the Company. FFC however
is committed to improving operational efficiencies
and cost optimization to mitigate this risk to the
maximum extent possible.
Moderate Supplies and untimely influx of urea imported by TCP. These variables are outside management control.
Operational risk
Low Turnover of trained employees at critical positions may render
the operations incapacitated.
FFC has a detailed succession plan and a culture of
employee training and development, continuously
promoting and rotating employees within the
departments. Formal work procedures and work
instructions are also in place to provide guidance
regarding any process undertaken by a new employee.
High Gas reserves depletion. Investing in alternate sources of raw material and
power through coal fired boilers and multiple fuel
co-generation, in addition to diversified business
portfolio.
Mitigating Strategies
Annual Report of Fauji Fertilizer Company Limited 2014
53

Risk Level Risk description Mitigating strategy
Operational risk
Low IT security risk. State of the art IT controls are in place to prevent
unauthorized access to confidential information.
Regular IT audits and trainings are conducted to
monitor and minimize the risk of breaches, errors or
other irregularities.
Low Climatic uncertainties including floods, water scarcity and
drought.
FFC has established a disaster recovery plan that is
implemented at all locations and the staff is fully
equipped to quickly recover from a natural disaster.
Low Risk of major accidents impacting employees, records and
property.
Implementation of strict and standardized operating
procedures, employee trainings, operational discipline
and regular safety audits.
Financial risk
Moderate Rise in KIBOR rates inflating the borrowing costs. A “prepayment option”, which can be exercised upon
any adverse movement in the underlying interest
rates, hedges the Company against this risk.
Low Default by customers and banks in payments to FFC. Most of our sales are either against cash or advance,
providing adequate cover against this risk. For credit
sales, credit limits have been assigned to customers,
backed by bank guarantees. Risk of default by banks
has been mitigated by diversification of placements
among ‘A’ ranked banks and financial institutions.
Low Insufficient cash available to pay liabilities resulting in a
liquidity problem.
Cash management system at FFC is proactive and
adequate funds are kept available for any unforeseen
situation. Committed credit lines from banks are also
available to bridge a liquidity gap, if any.
Low Fluctuations in foreign currency rates. FFC’s foreign currency exchange rate risk is limited
to foreign currency investments and bank balances
bearing interest. Any fluctuation in exchange rates
would be mitigated to some extent by resultant
change in interest rates.
Compliance risk
Low Modifications in the legal framework by regulatory bodies. Rigorous checks on latest updates in regulatory
framework are carried out to prevent any breach of
law. Trainings are conducted to keep the employees
abreast of all latest developments in law and
regulation.
FinanCial reVieW
54
Directors’ Report

Opportunities Opportunities have been discussed on page 29 of the Annual Report in the ‘SWOT
Analysis’ section. Materiality approach adopted by the Management
In general, matters are considered to be material if, individually or in aggregate, they are expected to significantly affect the performance and profitability of the Company.
Powers of the Board of Directors and the Management of the Company have been defined with special reference to, and in
compliance of the Companies Ordinance, 1984, the Code of Corporate Governance, the Articles of Association of the Company, guidelines and frameworks issued by professional bodies and best practices.
The Board powers include approvals for capital expenditure, disposal of fixed assets, annual business plans, policy formulation, risk management, human resource management, donations, matters relating to health, safety and the environment, and other matters required by law, or internal policies.
Determination of materiality levels, other than those provided under the
regulations, is judgmental and varies between organizations. Authorizations for transactions and delegation of powers have also been defined clearly and carried out through formalized processes.
Materiality levels are reviewed periodically and appropriately updated.
Subsequent EventsThe Board of Directors in its meeting held on January 30, 2015 is pleased to announce a final cash dividend of Rs. 3.50 per share i.e. 35% for the year ended 2014, taking the total payout for the year to Rs. 13.65 per share i.e. 95.57%.
Risk Level Risk description Mitigating strategy
Reputational risk
Low Loss of farmer confidence in the ‘Sona’ brand name adversely
impacting sales.
FFC has built its brand recognition through years
of quality fertilizer supply in addition to direct
relationship with the farming community and shall
continue to strengthen this reputation through
enhanced initiatives for farmer awareness through
model crop farms, balanced fertilizer application and
sustained product quality.
Political / economical
Low Volatile law and order situation affecting the Country’s
economy.
This risk cannot be mitigated through internal
strategies.
Low Increased Government intrusion over price regulations and
offtake monitoring.
FFC regularly monitors the markets and follows the
market prices trying its best to avoid any unnecessary
price hikes. All price increases are based on prevailing
market conditions as FFC does not follow the market
leadership strategy.
Annual Report of Fauji Fertilizer Company Limited 2014
55

operational perFormanCe
Aggregate ‘Sona’ urea production of all three Plants was recorded at 2,403 thousand tonnes, in line with the targets and consistent with the previous year despite the turnaround of Plant-III, operating at 117% of the combined nameplate capacity of 2,048 thousand tonnes.
This was achieved with the collective hard work and diligence of our team, upholding the highest standards of excellence synonymous with the ‘Sona’ urea brand.
Production during 2014 represented about 49% of the aggregate domestic production of 4,898 thousand tonnes.
Plant I & IIGoth Machhi Plant
Operational performance of both Plants at Goth Machhi was satisfactory during 2014. “Sona” urea production of 1,620 thousand tonnes was recorded at an operating efficiency of 122% of designed capacity, 3% higher than the output for last year.
Integrated Management System
Re-certification of Quality, Occupational Health & Safety and Environmental Management Systems under the requirements of ISO 9001:2008, OHSAS 18001:2007 and ISO 14001:2004 international standards was successfully accomplished in October 2014.
Major ProjectsNatural gas compression projects
Natural gas pressure at Mari gas field is continuously declining due to which minimum suction pressure requirements of existing natural gas compressors may not be fulfilled beyond 2015. In this context, installation of new pressure booster compressors is being pursued. Purchase order for three compressor units has been placed with AG Equipment, USA. Estimated time of arrival is March 2015. Detailed engineering of the project is in progress.
Gas Turbine Control System Upgrade
Gas turbine, TG-701 obsolete control system is being replaced with a modern control system, commissioning of which is expected in 2015.
Plant-II Ammonia reactor shell, basket and catalyst replacement
Plant-II Ammonia reactor shell is being replaced for reliability improvement; whereas, basket and catalyst are being replaced for efficiency enhancement. New basket and catalyst have been received at site. New shell shall also arrive at site before the planned Plant turnaround in April 2015.
Plant-II Additional cooling tower cell
Cooling tower is being uprated by addition of a new cell to lower the cooling water supply temperature. This shall result in fuel gas savings at boiler, thus improving the overall energy efficiency. Subsequently, it shall also help improve the plant capacity and Sona Urea product quality in peak summer season.
Urea bag price printing
Pursuant to the GoP instruction, mandating all fertilizer manufacturers to print prices on urea bags, FFC has commissioned price tag printing system at all three Plants.
Security at Plantsite Goth Machhi
Security at Plantsite has been enhanced and upgraded through “State of the Art” security devices and cameras installation, which are being monitored round the clock through a Central Control Room.
56
Directors’ Report

Plant IIIMirpur Mathelo
During year 2014, Mirpur Mathelo Plant achieved the highest annual production for any turnaround year. Annual urea production of 783 thousand tonnes was recorded, slightly lower than the last year, but in line with the yearly planned target.
By the grace of Almighty Allah, another milestone of 4 million Man-hours of safe operation was achieved.
Maintenance turnaround 2014
After about 3.5 years of operational run, Plant maintenance turnaround was undertaken in September 2014. The turnaround was completed ahead of the scheduled target without any safety incident.
Remarkable efficiency improvement was observed after Plant turnaround, whereby, specific energy consumption was decreased by 1.3%.
Following major jobs were completed during the Plant turnaround:
• Replacement of two waste heat boilers
• Shift converter catalyst replacement
• Ammonia compressor turbine rotor replacement
• Inspection and overhauling of various machines
• Installation of high efficiency vane unit at high pressure ammonia separator
• Installation of high efficiency trays in Urea Reactor
Integrated Management System
Integrated Management System (IMS) surveillance audit by M/S Bureau Veritas, was carried out in November 2014; all systems and procedures were found in-line with the requirements of international standards.
Major ProjectsNatural gas compression project
To cater for the declining natural gas pressure, a new natural gas booster compressor has been successfully commissioned in September 2014.
In the next phase, a new natural gas transmission line shall be laid from the Mari gas field to the Plantsite, commissioning of which is expected in 2016.
Urea bags loader
At the Bagging & Shipping Plant, all urea bag loaders have been replaced with a new design to increase machine reliability and personnel safety.
2009 2010 2011 2012 2013 2014
Production Capacity & Efficiency
2,000
2,050
2,100
2,150
2,200
2,250
2,300
2,350
2,400
2,450
2,500
Production(thousand tonnes)
Operational E�ciency(%)
110
112
114
116
118
120
122
Plant wise Production
0
1,000
2,000
3,000
Plant I Goth Machhi Plant II Goth Machhi
Design Capacity
Plant III Mirpur Mathelo
(thousand tonnes)
2009 2010 2011 2012 2013 2014
Turnaround Cost
0
50
100
150
200
250
300
3502500
2480
2460
2440
2420
2400
2380
2360
2340
Turn around cost (Rs. million)
Production (�ousand Tonnes)
40
42
44
46
48
50
52
2009 2010 2011 2012 2013 2014ProductionTurnaround
2014 2015 2016 2017 20180
50
100
150
200
250
300
GM MM
Gas Shortage Inc. Curtailment
Gas Projection(Gas Supply, MMSCFD)
Annual Report of Fauji Fertilizer Company Limited 2014
57

International Fertilizer MarketIn view of strong crop prices and increased demand in South Asia, world fertilizer offtake grew by 3% during the year 2014, to 184 million tonnes from 179 million tonnes last year.
Prominent challenges to the fertilizer industry during 2014 were nutrient management in crops and improving fertilizer use efficiency to reduce production costs. Fertilizer demand in North America contracted slightly owing to declining crop prices and unfavourable weather conditions at the beginning of 2014. This was, however, offset by increased demand in the rest of the world, with a firm recovery in South Asia and high growth rates of 5% and more in Oceania, Latin America and Africa, with the largest volume based increases in Asia.
International Urea prices experienced a continuing downhill trend from early 2013 as Ex-China prices at US$ 340 FOB per tonne at the start of the year dropped to US $ 245 FOB per tonne in June 2014, the lowest price during the year, with prices recovering from July onwards and closing at US $ 295 FOB per tonne by December 2014.
In contrast with urea prices, International DAP market continued its upward trend as prices jumped from US $ 390 FOB per tonne (Ex-China) at the start of 2014 to US $ 480 FOB per tonne by end of October 2014, highest of the year, closing at US $ 470 FOB per tonne by December 2014.
Global demand was adequately met in 2014, owing to increased production. On average, the world fertilizer industry operated at 78% of installed capacity.
market oVerVieW
A positive outlook for 2015 is anticipated as global fertilizer demand is estimated to expand by 2.1% to around 188 million tonnes. Demand for Nitrogen, Phosphorous and Potassium (major fertilizer types) is also expected to increase in line with overall fertilizer demand.
Domestic Fertilizer MarketDomestic fertilizer market fluctuated during the year owing to lower fertilizer supply in the third quarter leading to an increase in market price.
Urea
With an installed capacity of roughly 6.9 million tonnes, industry urea production operated at 71% capacity, with production of 4,898 thousand tonnes in 2014, 1% higher than last year.
Urea off-take, however, decreased to 5,618 thousand tonnes in 2014, 5% lower than last year, on account of delayed urea imports at the start of Rabi season and production constraints faced by plants. The Government imported 769 thousand tonnes of urea during 2014, 21% lower than 2013 and the industry carried urea inventory of 305 thousand tonnes at the close of 2014, 4% lower than last year.
DAP
FFBL DAP output stood at 702 thousand tonnes whereas DAP imports witnessed an increase to 993 thousand tonnes, 14% higher than last year as a result of rise in domestic demand. DAP off-take of 1,710 thousand tonnes recorded an increase of 3% over 2013 while closing DAP inventory stood at 131 thousand tonnes.
FFC MarketingFFC is providing premium quality fertilizer to the farming community in an environmentally sound manner. With an ever evolving network, the Group is currently spread over three zones, fourteen regions, sixty six sales districts and over 3,700 dealers spread across Pakistan.
Sona Urea sales by the Company were recorded at 2,371 thousand tonnes during the year, marginally down by 2% compared to last year, capturing combined FFC/FFBL urea market share of 46% as opposed to 45% last year. Marketing of imported DAP by FFC stood at 123 thousand tonnes which combined with sales of 709 thousand tonnes of Sona DAP on behalf of FFBL, resulted in aggregate FFC/FFBL DAP market share of 49% (Source: NFDC)
Through FFC’s Agri. Services Department, a comprehensive package of fertilizer services are offered, augmenting the farmer’s capacity to do productive farming. With the help of the Department’s officers, laboratories and Farm Advisory Centers (FACs) information regarding nutrient deficiencies in soils, water problems and modern farming techniques is disseminated to the farmers. Our FACs offer modern soil testing laboratories making our services unique in comparison with other farm advisory facilities.
Sona Urea DAP
Aggregate Market Share (FFC / FFBL)
40
42
44
46
48
50
2013 2014
45% 46%
50% 49%
58
Directors’ Report

Geographical presence Province wise sales performance Punjab
Punjab is the largest consumer of fertilizer in the Country. Sona Urea (Prilled) sales for Punjab were 1,596 thousand tonnes representing 67% of sales in the Country, achieving a contribution percentage similar to last year.
Aggregate Sona Urea sales including FFBL product, were 1,739 thousand tonnes with a contribution percentage of 67% of Sona Urea sold in the Country. Sona DAP sales during 2014 were 536 thousand tonnes representing 76% of total quantity sold.
Sindh
A total of 402 thousand tonnes of Sona Urea (Prilled) was sold in the province representing 17% of total product sold in the Country. Sindh is the second largest fertilizer market and also falls in the freight economic zone for FFC.
Combined FFC/FFBL urea sales stood at 465 thousand tonnes which represents 18% of total quantity sold by FFC and a 2% increase from last year.
Sona DAP sales were 109 thousand tonnes in the province; representing 15% of Sona DAP sales in the Country reflecting an increase of 2 thousand tonnes as compared to 2013, despite an 8% decrease in Sona DAP sales in the Country due to product limitation.
Khyber Pakhtunkhwa
Sona Urea (Prilled) sales in the province were 227 thousand tonnes for 2014 compared to 246 thousand tonnes last year. Contribution in Country wide sales of Sona Urea (Prilled) by FFC was 10%, in line with 2013.
Aggregate sales of Sona Urea and Sona DAP in the province represented 9% and 6% respectively out of aggregate Country wide sales of the Company.
Balochistan
Sona Urea (Prilled) sales in the province were 146 thousand tonnes as compared to 140 thousand tonnes last year. Sales contribution of 6% for the province was the same as in 2013.
Aggregate sales of Sona Urea were 150 thousand tonnes in 2014 as compared to 144 thousand tonnes during 2013 while 21 thousand tonnes of Sona DAP was sold during the year which was the same tonnage sold last year.
Contribution of Sona Urea and Sona DAP towards the province compared with total Country wide sales for the Company stood at 6% and 3% respectively.
Products & Services Quality AssuranceFFC’s dedication towards maintenance of excellent product quality is evident from brand preference by the farmers, which has enabled sustained fertilizer sales over the years, despite adverse market conditions.
Extensive quality assurance measures have been implemented by the Company to provide the best ‘value for money’ products, through the following measures:
Standard weight of fertilizer bags is ensured and a regular quality analysis of product samples is performed based on the following parameters:
• Average Prill Size, mm• Biuret Wt %• Moisture, Wt %• Crushing Strength, Grams• Total Fines, Wt %
Additionally, packaging of product is carried out in line with the best industry standards to ensure weight accuracy, product quality and nutrient protection.
Sale prices are printed on all fertilizer bags, in addition to affixation of security labels “Pehchan Sticker” to ensure authenticated and quality product delivery. Oxo bio-degradable liners have also been introduced.
Country wide dealer network ensures prompt product delivery whereas “Customer Satisfaction Measurement Surveys” are conducted on bi-annual basis to obtain feedback from dealers.
Quality Agriculture Extension Services are delivered to farmers all over the Country through 5 Farm Advisory Centres and 18 Regional Agri. Offices. FFC field officers present at all regional offices provide guidance and swift handling of any customer complaints or grievances.
Province wise sales(%)
Punjab Sindh KPK Balochistan
17%
6%
10%
67%
2014Sona Urea Sales
2,371 thousand tonnes
Annual Report of Fauji Fertilizer Company Limited 2014
59

human Capital
FFC considers its Human Capital to be the Company’s most valuable resource, with significant contributions over the years towards its growth and maintenance of best governance practices. The Company accordingly ensures provision of the best employee development programs, health care, safety and market commensurate compensation packages.
Succession PlanningThe Company has formulated a firm succession plan which includes performance evaluation and appropriate training requirements for development of potential future leaders. Detail of Succession Planning is available in the Human Resources portion of the ‘Corporate Governance’ Section.
Retirement Benefit - Assets & Liabilities
0
1,000
2,000
3,000
4,000
5,000
2013 2014
De�ned bene�tobligation (present value)
Fair Value of Plan Assets
(Rs. in million)
Retirement Benefit PlansThe Company has a number of retirement benefit plans in place for its employees ensuring financial security upon retirement. These include, a funded gratuity and pension scheme, contributory provident fund and a policy to provide for compensated absences of its employees in accordance with respective entitlement on cessation of service.
Fair value of plan assets of the Company’s funded gratuity and funded pension schemes stood at Rs. 1.85 billion and Rs. 2.55 billion respectively at the close of 2014, representing an accumulative increase of Rs. 0.91 billion compared to last year. Detail of retirement benefit funds have been disclosed in note 11 of the financial statements.
60
Directors’ Report

With a view to ensuring long term satisfaction of our shareholders, creditors, employees, customers, suppliers and regulators, we have ensured existence of transparency and good governance at the very core of our business strategies and practices.
The Code of Conduct, sound internal controls, Whistle Blowing Policy, compliance of specified regulations and criteria in addition to other best practices, hold prominence in the Company’s governance structure, which are applicable at all levels of Company management and operations.
Compliance with the Best Corporate Practices At FFC, we have surpassed the legal requirements through voluntary adoption of best business practices and standards. Our testament to compliance with the Code of
Corporate Governance of Pakistan forms part of FFC Annual Report 2014, alongwith the Auditors’ Report thereon.
Directors’ Compliance StatementDirectors are pleased to state that:• The financial statements, prepared by
the Management of the Company, present fairly its state of affairs, the result of its operations, cash flows and changes in equity
• Proper books of account of the Company have been maintained
• Appropriate accounting policies
Corporate goVernanCe
have been consistently applied in preparation of the financial statements and accounting estimates are based on reasonable and prudent judgment
• International Financial Reporting Standards, as applicable in Pakistan, have been followed in preparation of the financial statements and any departure there from has been adequately disclosed
• The system of internal control is sound in design and has been effectively implemented and monitored
• There are no significant doubts regarding the Company’s ability to continue as a going concern
• There has been no material departure from the best practices of corporate governance, as detailed in the Listing Regulations
• Information regarding outstanding taxes and levies, as required by Listing Regulations, is disclosed in the notes to the financial statements
Statement of Value of Investments in respect of employees’ retirement plans has been disclosed in note 11 of the financial statements
Ethics and Compliance At FFC, we ensure high level of ethical behaviour in all aspects of business conduct and decision making. Code of Conduct and ethical principles have been formulated and disseminated to all our employees in compliance with the Code of Corporate Governance. Proper systems and controls are in place for identification and redress of grievances arising as a result of any unethical practice.
Conformity with applicable regulations and organizational objectives is ensured through a set of values and ethical standards
to promote confidence and trust between individuals and entities. Upholding the highest standards of ethical behaviour is therefore a driver of business growth.
Conflict of Interest among BOD membersFFC employs a formal Code of Business
Ethics in addition to compliance of regulatory requirements, for formal disclosure of vested interests if any, to allow avoidance of known or perceived conflicts of interests.
All the directors exercise their due rights of participation in Board proceedings, which are generally undertaken through consensus.
Concerns of the Board members on any agenda point are duly noted in the minutes of the proceedings for further evaluation of actual existence in addition to quantification of any conflict of interest before finalization of any agenda point.
IT Governance PolicyInformation technology governance at FFC provides advice, oversight and contributes to the overall strategic decision making by the management keeping in view the impact of information technology on shareholders’ value and returns.
Towards this end, the Company continuously explores the prospects of implementing the best and latest IT technologies and infrastructure to enable efficient and timely decision making, in addition to economising on the costs related to operating and decision making processes.
Annual Report of Fauji Fertilizer Company Limited 2014
61

FFC’s IT Governance Policy encompasses:
• Engaging stakeholders to establish priorities for technology investment that are aligned with institutional goals and priorities
• Influencing development and design of technology services, policies and solutions
• Promoting governance, transparency, accountability and dialogue about technology that facilitates effective strategy adoption
• Ensuring compatibility, integration and avoiding redundancy
• Maximizing return on technology investment and controlling spending, while providing FFC with a coherent, integrated IT architecture and management structure
• Securing the Company’s data• Keeping the IT function proactive
from an innovation perspective, providing ideas to the business
Whistle Blowing PolicyIn order to ensure accountability and integrity in our conduct, we have devised a transparent and effective whistle blowing mechanism for sounding of alerts against deviations from policies, controls, applicable regulations, or violation of the code of professional ethics / conduct.
The Whistle Blowing Policy is applicable to all employees, management & the Board and extends to every individual associated with the Company including contractors, suppliers, business partners and shareholders etc., who can participate effectively and in confidentiality, without fear of reprisal or repercussions. The employees are required to report concerns directly to immediate supervisors. However, where reporting to supervisors is impracticable, the level may be raised to the senior management.
The policy has been designed to encourage all stakeholders to raise questions and
concerns, monitor the progress of resultant inquiries, provide feedback and where required, also voice concerns against any unsatisfactory inquiry or proceeding.
The Policy covers unethical conduct, offence, breach of law or failure to comply with legal obligations and possible fraud / corruption. Due emphasis has also been placed on health, safety and environmental risks. Inappropriate or malicious reporting leading to wrongful convictions have been specifically forbidden, with clear definition of consequences for the persons making wrongful accusations.
Instances during the year
No material incidence was reported to the Audit Committee during the year regarding improprieties in financial, operating, legal or other matters. All minor events requiring management’s attention were duly addressed with dissemination of messages across the Company for avoidance of such incidents in the future.
Human Resource Management Policy & Succession PlanningAs a policy, FFC attracts the finest talent for induction in all functions of the Company and ensures provision of a conducive environment to stimulate performance, in addition to market commensurate remuneration to retain quality workforce, and developing and refining their abilities for prospective leadership roles.
The Company also ensures availability of competent personnel in each department through a comprehensive Succession Planning Policy, carried out in terms of an individual’s potential, qualification, period of service and professional attitude
amongst other criteria. The succession policy is updated periodically in line with the Company’s requirements and career development objectives.
Social and Environmental Responsibility PolicyFFC is committed to act responsibly towards the community and environment for our mutual benefit as FFC believes that the success of the Company emanates from the development of the community. Our Social and Environmental practices have been elaborated in the section relating to ‘Corporate Social Responsibility’, with the following distinct features:
• Community investment & welfare schemes
• Rural development programmes• Corporate Social Responsibility• Environmental protection measures• Occupational health & safety • Business ethics & anti-corruption
measures• Consumer protection measures• Energy conservation• Industrial relations• Employment of special persons• National cause donations• Contribution to National Exchequer
Investors’ Grievance Policy / Redressal of Investors’ complaintsThe Company believes in allowing full access to all shareholders including potential investors, to call for information or detail on
Corporate goVernanCe
62
Directors’ Report

Company operations, in addition to details relating to his/her specific investment, dividend distribution or circulation of regulatory publications by the Company, with endeavours for prompt provision of information or resolution of query/grievance in accordance with the statutory guidelines.
During the year, withholding tax on dividends was increased from 10% to 15% for non-filers of income tax returns. The Company responded by informing the shareholders through newspaper notices, for provision of National Tax Number (NTN) certificates to the Company to avoid excessive tax withholding on dividend payments.
Investor grievances are managed centrally by the Corporate Affairs Department, through an effective grievance management mechanism for handling of investor queries and complaints, through the following key measures:
• Increasing the investor’s awareness relating to modes for filing of queries
• Handling of investor grievances in a timely manner
• Grievances are handled honestly and in good faith by FFC employees and without prejudice
• Any grievances requiring attention of the management or the Board of Directors, are escalated to the appropriate levels with full facts of the case, for judicious settlement of the grievance
• Investigations are also carried out to inquire whether the cause of the grievance was a weakness in the system or negligence/willful act on part of any employee
• Appropriate remedial action is taken immediately to ensure avoidance in the future
Stakeholders’ EngagementThe development of sustained stakeholder relationships is paramount to the performance of any company. From short term assessments to longer term strategic relationship building, ‘Stakeholders’
Engagement’ lies at the core of our business practices to promote improved risk management, compliance with regulatory and lender requirements in addition to overall growth of the Company.
Frequency of Engagements
The frequency of engagements is based on business and corporate requirements as specified by the Code of Corporate Governance, contractual obligations or on requirements basis, with the following stakeholders, as elaborated on page 21 of the Annual Report 2014 which includes the mode of engagement in addition to the impact of each stakeholder on Company’s operations:
• Institutional Investors / Shareholders• Customers and Suppliers• Banks and other lenders• Media • Regulators• Analysts• Employees• Local community and general public
Investors’ Relations Section on FFC websiteDetailed Company information regarding financial highlights, investor information, share pattern/value and other requisite information specified under the relevant regulations, has been placed on the corporate website of the Company, which is updated on regular basis.
In order to promote investor relations and facilitate access to the Company for grievance
/ other query registration, an ‘Investors’
Relations’ section has also been introduced on FFC website www.ffc.com.pk
Policy for Safety of RecordsThe Company has established a policy for preservation of record / documentation of material / significant or permanent value for commercial and / or legal purposes and claims in line with good governance practices including Business Continuity Planning (BCP).
The record includes books of account, documentation pertaining to secretarial, legal, contractual, taxation and other matters, which have been archived where needed, for periods well in excess of the legally required timeframes, in a well preserved and secure manner as follows:
• Establishment of secure storage centers to protect documentation from unauthorized access in addition to damage caused by fire, natural calamities and physical deterioration etc.
• Formation of an E-DOX computer system to provide backup for electronic data enabling prompt retrieval of relevant documents in a secure environment based on appropriate access controls and authorization systems
• Establishment of on-site and remote reserve sites to maintain real-time backup of all primary data
• Implementation of a comprehensive password authorization matrix for security of electronic documentation including the Company’s SAP-ERP system
• Determination of responsibility for all Company departments for safeguarding of their respective record
• Immediate reporting of breach of security or damage of record to the management
Annual Report of Fauji Fertilizer Company Limited 2014
63

• Establishment of on-site and remote Disaster Recovery areas to provide immediate backup of all primary data, in line with Business Continuity Practices
Composition of the Board of DirectorsThe qualification and composition of the Board of Directors has been defined by the regulatory framework, which has been fully implemented by the Company to ensure transparency, good governance and awareness of Board responsibilities for smooth functioning of business operations.
The Board consists of 13 directors, effectively representing the interest of shareholders including minority holders. There are 12 non-executive directors and only 1 executive director. The non-executive directors include four independent directors and one representing the non-controlling / minority interests, with atleast two independent and two other non-executive directors possessing relevant industry experience.
The Board comprises of a group of highly qualified professionals from varied disciplines in order to ensure effective and efficient decision making. Management professionals from Armed Forces, engineering, commerce, Government and the financial sector form a nonpareil combination of knowledge, experience and expertise to run the affairs of the Company. Furthermore, gender representation is also encouraged on FFC’s Board of Directors.
Detailed profiles of directors including the names, status (independent/non-executive/executive), in addition to industry experience and directorship of other companies, has been stated in the beginning of the Annual Report 2014. The status of directorship (independent, executive, non-
executive) is indicated in the Statement of Compliance with the Code of Corporate
Governance, issued by the Company.
Composition of the Audit CommitteeThe Committee comprises of four non-executive directors with the Chairperson being an independent non-executive director. One director is a Chartered Accountant whereas another holds a Doctorate in Economics, lending significant financial and accounting insight to the proceedings of the Audit Committee.
Composition of Human Resource and Remuneration CommitteeAll three members of the Human Resource and Remuneration Committee are non-executive directors. They were neither involved in the Management of the Company previously nor are connected with any business or other relationships that could interfere materially with, or appear to affect, their judgment.
Meetings of the BoardLegally, the Board is required to meet at least once per quarter to monitor the Company’s performance aimed at effective and timely accountability of its Management. Special meetings were also called during the year to discuss other important matters on required basis. The Board held 6 meetings during the year, the notices / agendas of which were circulated in advance, in a timely manner.
Decisions made by the Board during the meetings were clearly stated in the minutes of the meetings maintained by the Company Secretary, and were duly circulated to all the directors for endorsement and were approved in the subsequent Board meetings.
All meetings of the Board during the year had attendance more than requisite quorum prescribed by the Code of Corporate Governance and were also attended by the Chief Financial Officer and the Company Secretary.
163rd
BOD164th
BOD165th
BOD166th
BOD167th
BOD168th
BOD
Attendance at BOD Meetings
0
5
10
15
Attendance(Number)
Quorum Required(Number)
Balance of Non-Executive &Executive Directors
Executive DirectorNon-Executive DirectorIndependent DirectorsGoP Nominee
31%
8%8%
53%
Corporate goVernanCe
64
Directors’ Report

Board meetings held outside Pakistan In spite of the upcoming offshore business interests, no Board meetings were held outside the Country by FFC during the year, to economise on resources, as also encouraged by SECP Guidelines.
Roles and Responsibilities of the Board of DirectorsThe directors are fully aware of the level of trust shareholders entrust in them and the immense responsibility they have bestowed on them for smooth running of the Company and safeguarding their interests.
Name of Director Meetings held Meetings attended
Lt Gen Muhammad Mustafa Khan, HI(M) (Retired) 6 6
Lt Gen Naeem Khalid Lodhi, HI(M) (Retired) 6 6
Mr Qaiser Javed 6 6
Dr Nadeem Inayat 6 6
Mr Jorgen Madsen 6 4
Engr Rukhsana Zuberi 6 6
Mr Farhad Shaikh Mohammad 6 6
Brig Parvez Sarwar Khan, SI(M) (Retired) * 2 2
Mr Khizar Hayat Khan 6 5
Mr Manzoor Ahmed * 4 1
Maj Gen Nasir Mahmood, HI(M) (Retired) * 2 2
Mr Alamuddin Bullo * 2 1
Maj Gen Ghulam Haider, HI(M) (Retired) * 5 5
Maj Gen Muhammad Farooq Iqbal, HI(M) (Retired) * 4 3
Brig Dr Gulfam Alam, SI(M) (Retired) * 5 5
Mr Muhammad Raeesuddin Paracha * 3 3
Mr Shahid Ghaffar * 2 2
Ms Nargis Ghaloo * 1 1
* Maj Gen Ghulam Haider, HI(M) (Retired) appointed in place of Brig Dr Gulfam Alam, SI(M) (Retired) w.e.f March 01, 2014 Maj Gen Muhammad Farooq Iqbal, HI(M) (Retired) appointed in place of Maj Gen Nasir Mahmood, HI(M) (Retired) w.e.f June 02, 2014 Brig Dr Gulfam Alam, SI(M) (Retired) appointed in place of Brig Parvez Sarwar Khan, SI(M) (Retired) w.e.f June 02, 2014 Mr Muhammad Raeesuddin Paracha appointed in place of Mr Alamuddin Bullo w.e.f June 02, 2014 Mr Shahid Ghaffar appointed in place of Mr Manzoor Ahmed w.e.f October 20, 2014 Ms Nargis Ghaloo appointed in place of Mr Muhammad Raeesuddin Paracha w.e.f. November 05, 2014
The Board participates actively in major decisions of the Company including appointment of key management, approval of budgets for capital expenditures, investments in new ventures, issuance of shares to raise capital and approval of related party transactions. The Board also monitors Company’s operations by approval of financial statements and dividend, review of internal and external audit observations regarding internal controls and their effectiveness.
For the purpose of ensuring consistency and standardization, the Board has devised formal policies for conducting business and ensures their monitoring through an independent Internal Audit Department, which continuously monitors adherence to Company policies.
Changes to the BoardDuring the year, six of our fellow Board members retired and we would like to record our appreciation for the invaluable
contributions made by Lt Gen Muhammad Mustafa Khan HI(M) (Retired), Brig Parvez Sarwar Khan, SI(M) (Retired), Mr Manzoor Ahmed, Maj Gen Nasir Mahmood, HI(M) (Retired), Mr Alamuddin Bullo and Mr Muhammad Raeesuddin Paracha during their tenure as Board members.
The Board also welcomes Lt Gen Khalid Nawaz Khan HI(M) (Retired), Maj Gen Ghulam Haider, HI(M) (Retired), Maj Gen Muhammad Farooq Iqbal, HI(M) (Retired), Mr Shahid Ghaffar and Ms. Nargis Ghaloo as new fellow members joining during the year. We hope this change in composition of the Board will bring new vision and spirit to FFC and the members of the Board would work cohesively as a team for the benefit of the organization and to generate new ideas for progress and improvement.
Directors’ RemunerationFFC has established formal and transparent procedures for fixing the remuneration
Annual Report of Fauji Fertilizer Company Limited 2014
65

packages of the directors. As per these procedures and in compliance with legal requirements, no director is involved in deciding his / her own remuneration.
The directors’ remuneration packages affixed at FFC encourage value creation within the Company. Levels of remuneration are ensured to be appropriate in order to attract and retain directors needed to govern the Company successfully. However, it is ensured that remuneration levels set are not at a level that could be perceived to compromise the independence of non-executive directors at FFC.
Evaluation of Board’s PerformanceIn line with globally implemented / designed Board Performance Evaluation mechanisms, FFC has devised a methodology for evaluating the Board’s performance as an entity, by the members of the Board themselves, on the basis of following factors: • Board composition, organization,
scope etc.• Board functions and responsibilities• Monitoring of Company’s performance Evaluation proformas are circulated to the members and each member is required
to return duly filled in proformas to the Company Secretary. Divergence of opinions and weak areas indicated in the proformas are identified through a specially designed computer program. The results are consolidated and discussed in the next Board meeting to formulate strategy for effecting improvement in the Board’s performance.
Offices of the Chairman & CE&MD (CEO)As part of our governance structure, the position of the Chairman of the Board of Directors and the office of the Chief Executive are held separately, with clear division of roles and responsibilities.
Brief Role & responsibilities of Chairman & CEOThe Chairman represents the non-executive directors of the Board and is entrusted with the leadership of the Board’s proceedings.
The Chairman acts as the head of the Board meetings and is responsible for avoidance of conflicts of interests. He has the power to set the agenda, give directions and sign the minutes of the Board meetings. The Chairman is also responsible for assessing and making recommendations regarding the effectiveness of the Board, the committees and individual directors. The Chairman ensures effective role of the Board in fulfilling all its responsibilities.
The CEO is an executive director who also acts as the head of the Company’s Management in the capacity of Managing Director. Authority for implementing the Board’s policies is delegated to the Managing Director within limits defined by the Board. He is entrusted with responsibility of:
• Safeguarding of Company assets• Creation of shareholder value• Identification of potential
diversification / investment projects• Implementation of projects approved
by the Board • Ensuring effective functioning of the
internal control system• Identifying risks and designing
mitigation strategies• Preservation of the Company’s image • Development of human capital and
good investors’ relations• Compliance with regulations and best
practices
CEO Performance Review by the Board Appointment of the CEO is approved by the Board of Directors for a tenure of 3 years and the performance of the CEO is reviewed by the Board on annualised basis, with regard to the roles and responsibilities stated above, in addition to responsibilities assigned by the statute.
Directors’ Qualification
Business / FinanceEngineeringOther
54
4
(Number)Directors’ Tenure
0-3 years3-6 yearsOver 6 years
2
9
2
(Years)
Corporate goVernanCe
66
Directors’ Report

CEO’s achievements for the year 2014 are supported by strong Company profitability, acquisitions, commercial / construction, progress of diversified projects, identification of new investment opportunities, in addition to transparency and good governance. Nomination of CE&MD of FFC on the Board of Directors of International Fertilizer Association is also a testimony to international recognition.
Formal Orientation at InductionEach new member of the Board is taken through a detailed orientation process at the time of induction, and is trained extensively for enhancement of management skills. A formal familiarization program mainly features the following:
• The Company’s visions and strategies • Company’s core competencies,
investments, diversification ventures, etc.
• Organizational / group structure, subsidiaries, associations and other related parties
• Summary of the Company’s major assets, liabilities, noteworthy contracts and major competitors
• Major risks both external and internal, including legal and regulatory risks and constraints
• Important documents pertaining to the Company’s legal status
• Critical performance indicators• Summary of major members,
stakeholders, suppliers and auditors• Role and responsibility of the Director
as per the Companies’ Ordinance, including Code of Corporate Governance and any other regulatory laws applicable in Pakistan
• FFC’s expectations from the Board, in terms of output, professional behaviour, values and ethics
• Policy on Directors’ fees and other expenses
• Facets of the Company’s business including:• Strategic plans• Marketing analysis • Forecasts, budget and 5 year
business plans• Latest financial statements• Important minutes of past
meetings • Major litigations, current and
potential• Policy in relation to dividends,
health & safety, environment, ethics, corporate social responsibility, bribery, whistleblowing and conflict of interest, among others
Apart from an official orientation, Directors of FFC were sent abroad for trainings to enhance their management skills and keep them abreast with the best management
practices and policies adopted by developed nations across the globe.
These courses help the directors reassess their role in the Company’s progress and hone their competencies for the betterment of the Company in line with Code of Corporate Governance.
Directors’ Training ProgramRemaining well ahead of the requirements of Code of Corporate Governance to obtain Directors’ Certification by 2016, all directors on FFC Board were appropriately certified by April 2014 from SECP approved institution. Two of these directors were subsequently replaced by two new Board members and certification of the two new Board members is also scheduled during the current year to ensure certification of the entire FFC Board, well in advance of the prescribed timeframe.
Names of the directors who have attained the specified certification are given in the attached table:
1 Lt Gen Naeem Khalid Lodhi, HI(M) (Retired)
2 Mr Qaiser Javed3 Dr Nadeem Inayat4 Mr Jorgen Madsen5 Maj Gen Ghulam Haider, HI(M)
(Retired)
Annual Report of Fauji Fertilizer Company Limited 2014
67

6 Brig Dr Gulfam Alam, SI(M) (Retired)7 Mr Khizar Hayat Khan8 Engr Rukhsana Zuberi9 Mr Farhad Shaikh Mohammad10 Mr Shahid Ghaffar11 Ms Nargis Ghaloo
Issues raised at last AGM Company’s shareholders raised a concern during the 36th Annual General Meeting of the Company held on March 14, 2014, regarding the cost of publishing of Company’s annual report and requested reduction in the printing costs. The matter was taken up with SECP and as a result of Company’s efforts, SECP allowed circulation of annual reports to the shareholders in electronic format through email, enabling savings in terms of time and costs through utilization of cost effective and efficient technology.
Trading in shares by Directors and ExecutivesExecutives of the Company traded in a total of 53,120 shares of FFC during the year. Besides this, no other trading was conducted by the directors, executives and their spouses and minor children. KSE is being regularly updated on trading of Company’s shares by Management Employees.
The threshold for identification of “Executives” in addition to those already specified by the Code of Corporate Governance, is determined by the Board in compliance with the Code, which is reviewed on annual basis.
Review of Related Party TransactionsIn compliance with the Code of Corporate Governance and applicable laws & regulations, details of all related party transactions are placed before the Audit Committee and upon recommendations of the Audit Committee, the same are placed before the Board for review and approval.
Quarterly and Annual Financial Statements Periodic financial statements of the Company during 2014 were circulated to directors, duly endorsed by the CEO and the Chief Financial Officer. Quarterly financial statements of the Company, along with consolidated financial statements of the Group, were approved, published and circulated to shareholders within one month of the closing date, while Half Yearly financial statements of the Company and consolidated financial statements of the Group were reviewed by the external auditors, approved by the Board, published and circulated to shareholders within the permitted time of two months after period end.
The annual financial statements along with consolidated financial statements have also been audited by the external auditors and approved by the Board within one month after the closing date and will be presented to the shareholders in the Annual General Meeting for approval.
Other non-financial information to be circulated to governing bodies and other stake holders were also delivered in an accurate and timely manner.
AuditorsA.F.Ferguson & Co. Chartered Accountants have completed the annual audit for the year ended December 31, 2014, and have issued an unqualified audit report. The auditors will retire on the conclusion of the upcoming Annual General Meeting of the Company, and being eligible, have offered themselves for reappointment for the year ending December 31, 2015.
Based on a notice received from a shareholder to change the Auditors and in view of good governance, the Audit Committee has recommended the appointment of KPMG Taseer Hadi & Co. Chartered Accountants as External Auditors of the Company for the year ending December 31, 2015.
Pattern of shareholdingDuring the year, the Sponsor’s, Directors and Executives of the Company held the following number of shares,
Particulars Number of shares held as at December 31, 2014
Sponsors 564,204,254Directors 800,000Executives 996,513
A detailed pattern of shareholding is disclosed on page 188 of the Annual Report.
Corporate goVernanCe
68
Directors’ Report

The Company remains focused on continuous exploration of best technologies and infrastructure, to enable efficient and timely decision making, in addition to economising on the costs related to operating and decision making processes. At FFC, IT governance is aligned to promote transparency, accountability and dialogue in our technological / infrastructure development activities, in addition to safeguarding of Company’s information / data bank and maximizing the return on technology investment and controlled spending.
Review by the Board of Disaster Recovery &Business Continuity PlanningThe Company has implemented an effective Disaster Recovery System, for sustained business operations in the event of a disruption / disaster, in addition to safeguarding of Company assets, employees, intellectual property / IT Structure and customer satisfaction.
inFormation teChnology
Business Continuity PlanningIn today’s era of technological dominance and extreme competition, sustained / continued business operations is critical and the Company has undertaken effective measures to enhance the resilience and endurance capacities of its business and operations, against disruptions / calamities. External as well as internal stake holders from all critical departments of the Company have been engaged in the system for identification and mitigation of critical activities, in addition to the following objectives:
Investors
Business Continuity Planning (BCP) shows our investors that we take our business seriously and are prepared to maintain productivity regardless of difficulty.
Employees
Instils employee satisfaction about the Company’s concerns related to their safety.
Customers
Inculcates confidence of customers in business by ensuring them that required measures are in place to continue business and fulfill Company’s commitment with them in case of any unforeseen disaster.
Organization
A Business Continuity plan helps protect the Company’s image, brand and reputation.
Disaster Recovery PlanningAs part of BCP, a Disaster Recovery site (DR) has been established to further strengthen the availability of IT/SAP services in case of a disaster. The site hosts backup servers for shifting of services during a disaster. A comprehensive set of policies and procedures have also been implemented to ensure a hassle free movement of transactions from primary site to DR site. Detailed responsibilities, actions and procedures have been defined to recover computer, communications and network environment in the event of an unexpected and unscheduled interruption. An organization wide information security department has also been established for enhancing overall security posture of the organization.
Safety & security of IT recordSafety and security of IT data / record is ensured through effective implementation of the Company’s policy for “Safety of
Records’ which includes access controls by way of security codes/passwords etc., in addition to establishment of on-site and remote reserve sites to maintain real-time backup of all primary data.
Annual Report of Fauji Fertilizer Company Limited 2014
69

Corporate soCial responsibility
SustainabilityFFC is pleased to enter its 32nd year of sustainable and responsible business practices. With a contribution of over
1% of after tax profitability towards CSR
initiatives during 2014, our commitment towards the development of the society remains strong, fully aligned with the evolving dynamics of the 21st century.
In FFC, CSR is a management process that integrates the Company’s socio-economic concerns with its business operations and the interests of all its stakeholders. The Company has diversified its field of interventions by venturing into more critical challenging and extensive programs in 2014, as highlighted below:
• Provision of education to the underprivileged
• Development of health care facilities• Environmental conservation
• Community support and uplift• Disaster relief and rehabilitation • Development of partnerships with
reputable social organizations• Promotion of sports in the Country
Corporate / Social Responsibility InitiativeEducationRehabilitation of schools at Goth Machhi and Jhimpir
FFC through its CSR Program is committed to the provision of quality education to the underprivileged and deprived children of Pakistan. In pursuance of this a comprehensive infrastructure uplift and rehabilitation program was successfully concluded for over 50 schools in Goth Machhi and Jhimpir, entailing the following:
• Construction of new class rooms and associated facilities at Govt. Girls Primary School Wahid Buksh Lar
• Infrastructure development of three Primary Schools at Jhimpir
• Uplift of Govt. Higher Secondary School Old, Sadiqabad
Tameer-e-Millat Foundation (TMF)
TMF is a reputed ‘Not for profit’ organization working for the provision of cost effective & quality education to talented and deserving students from across Pakistan. FFC contributed to the cause by donating 5 vehicles for the transportation of students and faculty and provided full sponsorship to 5 deserving talented students for 3 years Diploma of Associate Engineering Programs inclusive of boarding and lodging expense.
FFC collaborates with leading
academia and educational institutes
Complete support was extended to 2 students at NAMAL College, by donating
70
Directors’ Report

Rs. 2.4 million for a four year degree program and to 2 students at Lahore University of Management Sciences (LUMS) through its National Outreach Program. Rs. 3.6 million have been extended to LUMS covering entire academic, living and associated expenses till date.
FFC continues to fund the Student Support Program of Forman Christian College, Lahore. Presently sponsoring 7 students for their education and associated expenses, FFC extended Rs. 1.83 million for the subject sponsorship in year 2014.
Support to Cadet College, Larkana and Hasan Abdal was also extended through establishment of residence facilities for cadets and provision of ambulance for medical needs respectively. Currently, 18 students enrolled at Cadet College Ghotki are being fully sponsored by FFC.
Wards of Farmer Scholarship
FFC initiated the 10th season of its annual scholarship program for the talented and deserving “Wards of Farmers” across Pakistan. The Scholarship program covers a wide range of disciplines and in 2014, 73 new scholarships were awarded increasing the list of students to 258.
Health CareSheikh Zayed Hospital Rahim Yar Khan
In continuation of its support to Sheikh Zayed Hospital, which initiated in 2013, FFC extended a further Rs. 10 million to the establishment of a Burn Centre at the hospital which is home to quality medical and educational facilities for surrounding communities of Rahim Yar Khan.
Hazrat Bilal Trust, Goth Machhi
Hazrat Bilal Trust Hospital was established by FFC in 1986 and is being administered by the Company since its establishment.
FFC contributed for the free treatment of patients to ensure quality health care to local people of Goth Machhi and the establishment of X-ray unit at Hazrat Bilal Trust.
Sona Welfare Hospital (SWH), Mirpur Mathelo
SWH one of FFC’s projects in the Health Care sector was established in 2006, is continuously providing quality healthcare to the deserving natives of Mirpur Mathelo.
Sports Promotion & Development
In 2013, FFC took the development of women tennis in Pakistan under its patronage. Sponsorship was extended to talented players, Ushna Sohail and junior champions Alina and Mahin Aftab including training at reputed foreign academies in Europe & Asia and participation in internationally ranked tournaments. In just over a year’s time, FFC’s efforts have resulted in remarkable progress as Ushna Sohail made history by becoming the 1st Pakistani Woman Tennis player to attain WTA ranking point in addition to her participation in Asian Games 2014. Similarly, Alina & Mahin Aftab represented Pakistan at Juniors Tennis Championship (ITF) 2014 in India.
FFC co-sponsored SAFF Women Football championship 2014, which was hosted in Pakistan and contested by 8 countries. FFC also co-sponsored India and Pakistan blind cricket series by contributing Rs. 0.45 million to the event.
Sports sponsorship to Rawalpindi Polo Club for the upgradation of the polo field was also extended. FFC also undertook the renovation of synthetic tennis courts at Farhad Sports Complex, Risalpur and restoration of Mangla skeet and archery club.
Financial assistance amounting to Rs. 0.2 million was also provided to Pakistan Taekwondo Federation for organizing the National Taekwondo Championship.
Energy ConservationAs part of sustainable business practices, a number of energy conservation measures were taken by FFC during the year:
• Sona Welfare Hospital, Mirpur Mathelo has been transformed into a state of the art facility with a 5 KW solar power system. The facility is now self-reliant, with sustained electricity
• Umar Chang, a model village in Jhimpir has been solarized as part of FFC’s energy conservation and rural uplift program
• A number of schools have been provided solar lighting including Omar Chang Primary School at Jhimpir
• Solar powered sweet water facility has been constructed at Sanjan Pur village for the surrounding community of FFC plant site
• 62 KW solar power system at the recently constructed Fauji Foundation Complex at Kot Ghulam Muhammad has also been installed
Energy Saving measures at FFC Plants
Efficient use of limited energy resources remains the Priority of the Company.Successful turnaround at Plant III brought desired results of efficient performance in addition to overall improvement in energy consumption indices.
One of the major projects of adding two ‘Cooling Tower Cells’ for removal of capacity bottleneck at Plant II has also resulted in improvement of energy index of the Plant.
Annual Report of Fauji Fertilizer Company Limited 2014
71

Environmental Protection Measures / Environment Related InitiativesFFC is continually striving for environmental protection through adoption of cleaner technologies and efficient processes. Regardless of the economic impact, several major projects are being pursued in fulfilment of our commitment to the environment:
• In order to decrease the overall environmental footprint of our plants, a purge gas ammonia recovery project and an upgraded waste water treatment facility is near completion at Plant I
• At Plant I & II, replacement of chlorine with a safer alternate is being evaluated
• Plant startup vents noise abatement have been installed in Plant III
• Use of Oxo-biodegradable bags is also being carried out to minimize the environmental impact of packing material
FFC collaborates with World Wide Fund for Nature (WWF)
WWF Pakistan is working for the conservation of nature and endangered species throughout Pakistan. In 2014, FFC sponsored WWF’s Nature Carnival by donating Rs. 1 million to the event, proceeds of which are utilized for various ongoing WWF programs and raising awareness among masses on wildlife preservation.
Mitigating the adverse impact of industrial effluents at FFC PlantsIn order to reduce the detrimental effects of industrial effluents the following projects are being undertaken at FFC Plants:
Plant-I Process Condensate Treatment Section Up-gradation
Plant-I Urea process condensate treatment section has been uprated. The condensate is now being reused as boiler feed water.
Hypochlorite Disinfection System replacing Chlorine at Plant-I & Plant-II
Chlorine gas is widely used as an industrial cooling water disinfectant. In regards to the environment and the personnel safety, use of this toxic gas is now being eradicated by replacement with a safer alternate, sodium hypochlorite.
Community Awareness and Emergency Response Program
FFC has developed and implemented an active “Community Awareness and Emergency Response” (CAER) program in line with best industrial practices. The program aims to create awareness among the community living adjacent to operational facilities.
Environmental standards
Environmental protection remains one of the major priorities of the Company; ‘ISO 14001 Environment Management
System’ has been implemented at Plantsites and Head Office to mitigate the adverse impact of industrial effluents according to international standards.
Plant-III Start-up Vents Noise Abatement
In order to reduce noise pollution during startup of turbine a silencer system has been installed at Plant III.
Synthesis Machine Turbine uprate
Synthesis machine turbines of Plant-I and Plant-II are being evaluated with respect to uprate for efficiency improvement. Outsourced study has revealed significant energy saving potential.
Urea Reactor high efficiency Trays
Plant-III urea reactor trays are being replaced with high efficiency SuperCups™ trays. Two trays have been installed during turnaround 2014 on trial basis
Alternate energy projects
In the backdrop of gas curtailment, the Company is also actively involved in the identification of alternate energy sources. Installation of coal fired boilers in phases is being evaluated to complement the low availability of natural gas. Work on Environmental and Social Impact Assessment (ESIA) study of the Coal Fired Boiler Project has been initiated.
Other major initiatives
• Plant-III Installation of Finned Coil at E-205 C for efficient waste heat recovery.
• Plant-III Replacement of inefficient turbines with motors.
• Plant-III Modification to restore cooling tower performance.
Corporate soCial responsibility
72
Directors’ Report

Community Investment & Welfare SchemesAutism Society Pakistan (ASP)
ASP is working for the special educational requirements of children with autism and providing them with rehabilitation through its Autism Resource Center established in Rawalpindi. In 2014, FFC contributed Rs. 1.45 million to ASP for the support of its resource center.
SABA Homes
SABA Homes is providing shelter and education to orphans. FFC contributed Rs. 0.48 million in the form of an audio and video library.
SOS Village
SOS Village is home to young orphans from across Pakistan, with quality living, education and grooming facilities. To recognize this role, FFC extended Rs. 0.8 million for the establishment of a children playing area at its centre in Rawalpindi.
Consumer Protection Measures The Company greatly values the requirement for protection of consumer rights and interests and has set in place an effective system to ensure that consumer interests are safeguarded, through the following salient measures:
• In order to control dumping, malpractices and pilferage of the product, special colored stitching thread is used, which is changed after a specific time.
• Our extensive dealer and warehousing network ensures that the product
is delivered at the doorstep of our customers throughout the Country.
• Well trained field officers employed at established and strategically located regional / district offices efficiently handle customer complaints and simultaneously provide guidance to consumers.
• Customers are provided business related information regularly so that they remain abreast with latest developments in the fertilizer market.
• Regular “Customer Satisfaction Measurement Surveys” are conducted to gain customer feedback.
• Broad based Agriculture Extension Services are provided to the farmers of the country through fourteen regional offices and five independent Farm Advisory Centers located throughout the Country.
Procedures adopted for quality assurance of products/services FFC goes beyond basic recognition of customer rights and believes in providing the best value for money products and in this regard, we are proud of sustained brand preference by the farmers which has contributed significantly towards the Company’s growth over the years.
The Company has implemented an extensive and effective quality assurance system for its products, as detailed in the ‘Market
Overview’ section.
Industrial Relations Our engagement with employees is vital for maintaining a sustainable mutually
beneficial relationship and in this regard, the Company ensures provision of a conducive working environment in addition to appropriate pay packages above the statutory limits, in line with best practices. Employees are required to ensure compliance with regulations and the Company fully recognises employee rights including the Collective Bargaining Agent (CBA). Performance of employees is duly rewarded without discrimination and special incentives have been designed for maintenance of industrial peace.
Employment of special personsThe Company considers it a social and moral responsibility to accommodate special persons; it goes great lengths in ensuring there are ample opportunities for their hiring and retention.
Extra efforts are made for training of special persons to enable them to compete with others and provide equal incentives for career growth and development. Further, health care and other allied facilities required for the optimum performance of such individuals are addressed on priority with due consideration to their disabilities.
Occupational Health & Safety (OHS)At FFC, we are committed to maintaining a safe and healthy working environment for our employees. Health management at FFC goes beyond legal requirements and involves strengthening our employees’ physical, mental and social wellbeing.
+
FFC Sona Welfare
Special Persons
=53 18 71
Annual Report of Fauji Fertilizer Company Limited 2014
73

Contribution to National ExchequerContribution to National Exchequer of Rs. 45 billion for the year comprises of taxes, levies and accrued GIDC. The total contribution is the highest in the Company’s history bringing the cumulative contribution as at December 31, 2014 to around Rs. 293 billion.
Value addition in terms of foreign exchange savings worked out to US $ 833 million through import substitution based on 2,403 thousand tonnes of urea manufactured during the year.
Total value addition to the economy in 2014 was Rs. 75.47 billion.
Our approach to OHS is proactive and oriented toward long term development; inculcating safety culture through training, incentives and effective OHS management system. We ensure that occupational safety is upheld by contract workforce through Code of Conduct for contractors.
FFC continued with its commitment towards Occupational Health and Safety by getting voluntary certification of OHSAS
18001:2007 Management Standards at Head Office in addition to re-certification of already implemented ISO Management Systems at both the Plantsites.
Business Ethics & Anti-Corruption MeasuresFFC ensures ethical compliance with all regulatory and governing bodies while conducting its operations. The Company has formulated a “Code of Conduct”, “Whistle Blowing Policy” in addition to a policy on “Sexual Harassment”. Effective implementation of these policies is continuously monitored to ensure fairness and honesty in all business practices and activities, by all FFC functions, through the following salient measures:
• Conduct activities with honesty, integrity, truthfulness and honour
• Compliance and respect of applicable laws and regulations and to refrain from any illegal activity
• Respect of fellow members and employees and not to use one’s position for undue coercion, harassment or intimidation
• Impartiality in business dealings and refraining from any transaction involving personal interest on behalf of the Company
• Avoidance of conflict of interest by
directors, or appropriate disclosure in case of inability to avoid conflict
• In case of unavoidable personal interest extreme care shall be exercised and matter should be reported
• Refrain from businesses or dealings conflicting with Company’s interests
• Confidentiality of Company’s sensitive information by directors and employees of the Company
• Discourage any kind of discrimination among the employees
• Raising of alarms by a Company employee or stakeholder, wherever any unfair/dishonest activities are suspected or noticed
• Prompt action by the Management to check such unfair practices and ensure that such activities are not repeated
National Cause DonationsAssistance to drought hit areas in Tharparkar
FFC responded to the devastating calamity that hit Tharparkar at the onset of 2014 by providing 22 tons of ration and medicines. FFC was one of the first organizations to provide assistance to the drought hit areas and ongoing efforts are still being made as the relentless conditions continue to prevail in this region.
FFC partners with Muslim Aid
Muslim Aid is a UK based non-profit organization having its field office in Pakistan, delivering education, economic empowerment and humanitarian relief to impoverished areas in the Country. FFC contributed towards the efforts of this organization by assisting in health projects being undertaken.
Internally Displaced Person (IDP) Relief Fund
During 2014, FFC along with its employees contributed Rs. 27 million towards the IDP Relief Fund.
2009 2010 2011 2012 2013 2014
NPBT & Contribution toNational Exchequer (Rs. million)
0
10000
20000
30000
40000
50000
Contribution to Natonal ExchequerPro�t Before Tax
Corporate soCial responsibility
74
Directors’ Report

Rural Development ProgrammesRural development at Jhimpir
FFC has played an exceptionally vital role in the development of Jhimpir, and during 2014, inaugurated projects worth Rs. 6.5 million which included the following:
• Construction of a maternity center and an operation theater
• Construction of solar model village• Solar lighting for Omar Chang
Primary School• Provision of school furniture • Renovation of central town Jamia
Masjid• Construction of water tanks at village
Omar Chang, Suleman Palari and Khamiso Shoro
Fauji Foundation Rural Welfare Complex at Kot Ghulam Muhammad
Construction of a multifaceted rural welfare complex at Kot Ghulam Muhammad comprising of the following facilities was inaugurated during the year:
• Model School• Vocational Training Center• Technical Training Center• Dispensary• Accommodation block and hostels• Energy efficient cooling system• Primary power through 62 KW solar
power system• Water storage capacity of 175
thousand gallons
Rural development through technical training
Technical Training Centre Dharki is a reputed institution providing skill development and technical expertise to Mirpur Mathelo and surrounding communities. A multi-purpose hall is under construction with the Company contribution catering for training requirements.
2014 2013
Rs. million % Rs. million %Wealth Generated Total revenue inclusive of sales tax and other income 100,149 132.7% 92,333 120.2%Purchases - material and services (net) 24,679 32.7% 15,498 20.2% 75,470 100.0% 76,835 100.0%Wealth Distribution To Employees as remuneration Salaries, wages and other benefits including retirement benefits 6,661 8.8% 5,708 7.4% To Government as taxes Income tax, sales tax, excise duty and custom duty* 43,135 57.2% 41,348 53.8%WPPF and WWF 1,892 2.5% 2,201 2.9% To Shareholders as dividend 17,583 23.3% 20,678 26.9%To providers of finance as financial charges 753 1.0% 759 1.0%Retained within the business 5,258 7.0% 5,695 7.4%To Society Donations and welfare activities 188 0.2% 446 0.6% 75,470 100.0 76,835 100
Economic Value Added 13,632 15,395
2014 Rs. millionEducation 67Health care & Environment 66Sports development 1Community Welfare 19National Cause 24General donations 11 188
Value Added – 2014
9%
60%
23%
7%0.3%
1%
To Government as taxesTo Shareholders as dividendsTo providers of �nance as �nancial chargesRetained within the businessTo Employees as remunerationTo Society
Value Added – 2013
7%
57%
27%
7%0.6%
1%
To Government as taxesTo Shareholders as dividendsTo providers of �nance as �nancial chargesRetained within the businessTo Employees as remunerationTo Society
Statement of Charity Account
Statement of Value Added
* includes accrued GIDC
Annual Report of Fauji Fertilizer Company Limited 2014
75

ForWard looking statement
2014 witnessed increase in GIDC cost at the beginning of the year and again during July 2014. A significant portion of this price increase had to be absorbed because of market conditions, negatively impacting the Company margins.
The Company however attained all of the Board’s objectives in terms of profitability, diversification and good governance.
Going forward, Company urea production and sales are expected to remain fairly consistent whereas operating and other costs, except for the cost of feed/fuel gas, are projected to move in line with historical trends. However, our performance is based on a variety of external factors many of which are beyond the Company’s control. A higher than projected change in these factors can lead to material variances between actual and projected performance. Quantification of projections / forecasts can therefore expose FFC towards the possibility of over / under valuation of Company equity, by the market.
The achievement of Tariff True-up by FFC Energy during 2014 shall add to the revenues of the wind power project and returns for the Company. Incremental
dividend receipt from Fauji Cement and first ever dividend distribution from Askari Bank provide further confidence of sustained profitability, as a result of strategic objectives of the Company. Construction work on the Individually Quick Freeze (IQF) Plant of Fauji Fresh n Freeze Limited (formerly Al-Hamd Foods Limited), is progressing as per plan with scheduled inauguration during 2015.
FFC is also evaluating further diversification, this time into establishing an offshore fertilizer plant in Tanzania, which offers strong prospective fertilizer demand within Tanzania and its neighbouring landlocked countries, to augment Company profitability in addition to extension of technical / professional services to other fertilizer complexes. We are further exploring the prospects of coal mining and the Company is considering undertaking of initial technical, geographical and commercial evaluation before final decision on project implementation.
Pursuant to our drive for energy conservation and identification of alternate energy sources, FFC is evaluating the installation of coal fired boilers to hedge against gas curtailment and declining gas reserves.
The Board is confident that with the implementation of effective mitigation strategies, cost economization and consolidation of our diversification initiatives, we shall continue to provide sustained returns to our shareholders, in addition to maintaining our reputation for good governance.
Favourable Governmental policies in line with the Fertilizer Policy 2001 shall play a vital role towards ensuring the availability of affordable indigenous fertilizers for the farming community, in addition to assisting the Government not only in terms of foreign exchange and subsidy savings, but also towards ensuring food security in the Country.
On behalf of the Board,
Lt Gen Khalid Nawaz KhanHI (M), Sitara-i-Esar (Retired)ChairmanRawalpindiJanuary 30, 2015
76
Directors’ Report

Financial Statements of Fauji Fertilizer Company Limited 2014
77
77
Financial StatementsFauji Fertilizer Company Limited

78
78
The Audit Committee has concluded its annual review of the conduct and operations of the Company during 2014, and
reports that:
• The Company has issued a “Statement of Compliance with the Code of Corporate Governance” which has also been reviewed and certified by the Auditors of the Company.
• Understanding and compliance with Company codes and policies has been affirmed by the members of the Board, the Management and employees of the Company individually. Equitable treatment of shareholders has also been ensured.
• Appropriate accounting policies have been consistently applied. All core & other applicable International Accounting Standards were followed in preparation of financial statements of the Company and consolidated financial statements on a going concern basis, for the financial year ended December 31, 2014, which present fairly the state of affairs, results of operations, profits, cash flows and changes in equities of the Company and its subsidiaries for the year under review.
• The Chief Executive and the CFO have endorsed the financial statements of the Company, consolidated financial statements and the Directors’ Report. They acknowledge their responsibility for true and fair presentation of the Company’s financial condition and results, compliance with regulations and applicable accounting standards and establishment and maintenance of internal controls and systems of the Company.
• Accounting estimates are based on reasonable and prudent judgment. Proper and adequate accounting records have been maintained by the Company in accordance with the Companies Ordinance, 1984. The financial statements comply with the requirements of the Fourth Schedule to the Companies Ordinance, 1984 and the external reporting is consistent with Management processes and adequate for shareholder needs.
• All Directors have access to the Company Secretary. All direct or indirect trading and holdings of Company’s shares by Directors & executives or their spouses were notified in writing to the Company Secretary along with the price, number of shares, form of share certificates and nature of transaction which were notified by the Company Secretary to the Board within the stipulated time. All such holdings have been disclosed in the Pattern of Shareholdings. The Annual Secretarial Compliance Certificates are being filed regularly within stipulated time.
• Closed periods were duly determined and announced by the Company, precluding the Directors, the Chief Executive and executives of the Company from dealing in Company shares, prior to each Board meeting involving announcement of interim / final results, distribution to shareholders or any other business decision, which could materially affect the share market price of Company, along with maintenance of confidentiality of all business information.
INTERNAL AUDIT
• The internal control framework has been effectively implemented through an independent in-house Internal Audit function established by the Board which is independent of the External Audit function.
• The Company’s system of internal control is sound in design and has been continually evaluated for effectiveness and adequacy.
• The Audit Committee has ensured the achievement of operational, compliance, risk management, financial reporting and control objectives, safeguarding of the assets of the Company and the shareholders wealth at all levels within the Company.
Report of the Audit Committeeon Adherence to the Code of Corporate Governance

Financial Statements of Fauji Fertilizer Company Limited 2014
79
79
• The Internal Audit function has carried out its duties under the charter defined by the Committee. The Committee has reviewed material Internal Audit findings, taking appropriate action or bringing the matters to the Board’s attention where required.
• The Head of Internal Audit has direct access to the Chairperson of the Audit Committee and the Committee has ensured staffing of personnel with sufficient internal audit acumen and that the function has all necessary access to Management and the right to seek information and explanations.
• Coordination between the External and Internal Auditors was facilitated to ensure efficiency and contribution to the Company’s objectives, including a reliable financial reporting system and compliance with laws and regulations.
EXTERNAL AUDITORS
• The statutory Auditors of the Company, A.F. Ferguson & Co., Chartered Accountants, have completed their Audit assignment of the “Company’s Financial Statements”, the “Consolidated Financial Statements” and the “Statement of Compliance with the Code of Corporate Governance” for the financial year ended December 31, 2014 and shall retire on the conclusion of the 37th Annual General Meeting.
• The Audit Committee has reviewed and discussed Audit observations and Draft Audit Management Letter with the External Auditors. Final Management Letter is required to be submitted within 45 days of the date of the Auditors’ Report on financial statements under the listing regulations and shall accordingly be discussed in the next Audit Committee Meeting. Audit observations for interim review were also discussed with the Auditors.
• The Auditors have been allowed direct access to the Committee and the effectiveness, independence and objectivity of the Auditors has thereby been ensured. The Auditors attended the General Meetings of the Company during the year and have confirmed attendance of the 37th Annual General Meeting scheduled for March 17, 2015 and have indicated their willingness to continue as Auditors.
• Based on a notice received from a shareholder to change the Auditors and in view of the good governance, the Audit Committee has recommended the appointment of KPMG Taseer Hadi & Co., Chartered Accountants as External Auditors of the Company for the year ending December 31, 2015.
Engr Rukhsana Zubari
Chairperson - Audit Committee
Rawalpindi
January 30, 2015

80
80
This statement is being presented to comply with the Code of Corporate Governance (CCG) contained in listing regulations of Karachi, Lahore and Islamabad stock exchanges for the purpose of establishing a framework of good governance, whereby a listed Company is managed in compliance with the best practices of corporate governance.
The Company has applied the principles contained in the CCG in the following manner:-
1. The Company encourages representation of independent non-executive directors and directors representing minority interests on its Board of directors. At present the Board includes:-
Category of Directors Names
Non-Executive Lt Gen Khalid Nawaz Khan, HI(M) (Retd) Non-Executive Mr. Qaiser Javed Non-Executive Dr. Nadeem Inayat Non-Executive Mr. Jorgen Madsen Non-Executive Maj Gen Ghulam Haider, HI(M) (Retd) Non-Executive Brig Dr. Gulfam Alam, SI(M) (Retd) Non-Executive Mr. Khizar Hayat Khan Non-Executive Maj Gen Muhammad Farooq Iqbal, HI(M) (Retd) Executive Lt Gen Naeem Khalid Lodhi, HI(M) (Retd) Independent Engr Rukhsana Zuberi Independent Mr. Farhad Shaikh Mohammad Independent Mr. Shahid Ghaffar Independent Ms. Nargis Ghaloo
(The independent directors meet the criteria of independence under clause i (b) of the CCG).
2. The directors have confirmed that none of them is serving as a director on more than seven listed companies, including this Company.
3. All the resident directors of the Company are registered as taxpayers and none of them has defaulted in payment of any loan to a banking Company, a DFI or an NBFI or, being a member of a stock exchange, has been declared as a defaulter by that stock exchange.
4. Following casual vacancies occurring in the Board during the year 2014 were filled up by the directors within 7 days:
• Maj Gen Ghulam Haider, HI(M) (Retd) appointed in place of Brig Dr. Gulfam Alam, SI(M) (Retd) w.e.f March 01, 2014
• Maj Gen Muhammad Farooq Iqbal, HI(M) (Retd) appointed in place of Maj Gen Nasir Mahmood, HI(M) (Retd) w.e.f June 02, 2014
• Brig Dr. Gulfam Alam, SI(M) (Retd) appointed in place of Brig Parvez Sarwar Khan, SI(M) (Retd) w.e.f June 02, 2014
• Mr. Muhammad Raeesuddin Paracha appointed in place of Mr. Alamuddin Bullo w.e.f June 02, 2014
• Mr. Shahid Ghaffar appointed in place of Mr. Manzoor Ahmed w.e.f October 20, 2014
• Ms Nargis Ghaloo appointed in place of Mr. Muhammad Raeesuddin Paracha w.e.f. November 05, 2014
• Lt Gen Khalid Nawaz Khan, HI(M) (Retd) appointed in place of Lt Gen Muhammad Mustafa Khan, HI(M) (Retd) w.e.f January 02, 2015
5. The Company has prepared a “Code of Conduct” and has ensured that appropriate steps have been taken to disseminate it throughout the Company along with its supporting policies and procedures.
6. The Board has developed a vision / mission statement, overall corporate strategy and significant policies of the Company. A complete record of particulars of significant policies along with the dates on which they were approved or amended has been maintained.
Statement of Compliance with the Code of Corporate Governance

Financial Statements of Fauji Fertilizer Company Limited 2014
81
81
7. All the powers of the Board have been duly exercised and decisions on material transactions, including appointment and determination of remuneration and terms and conditions of employment of the CEO and non-executive directors, have been taken by the Board / shareholders.
8. All the meetings of the Board were presided over by the Chairman and the Board met at least once in every quarter. Written notices of the Board meetings, along with agenda and working papers, were circulated within due time before the meetings. The minutes of the meetings were appropriately recorded and circulated.
9. Eleven of the directors have attended directors’ training program during the year 2014. The remaining two directors shall obtain certification under directors’ training program upto 2016.
10. The Board has approved appointment of the Chief Financial Officer (CFO), Company Secretary and Head of Internal Audit, including their remuneration and terms & conditions of employment.
11. The Directors’ Report for this year has been prepared in compliance with the requirements of the CCG and fully describes the salient matters required to be disclosed.
12. The financial statements of the Company were duly endorsed by CEO and CFO before approval of the Board.
13. The directors, CEO and executives do not hold any interest in the shares of the Company other than that disclosed in the pattern of shareholding.
14. The Company has complied with the corporate and financial reporting requirements of the CCG.
15. The Board has formed an Audit Committee. It comprises of four members, three of whom are non-executive directors and the Chairperson of the committee is an independent non - executive director.
16. The meetings of the Audit Committee were held at least once every quarter prior to approval of interim and final results of the Company and as required by the CCG. The terms of reference of the Committee have been formed and advised to the Committee for compliance.
17. The Board has formed a Human Resources and Remuneration Committee. It comprises three members, all of whom are non-executive directors including the Chairman of the Committee.
18. The Board has set up an effective Internal Audit function which is considered suitably qualified and experienced for the purpose and is conversant with the policies and procedures of the Company.
19. The statutory auditors of the Company have confirmed that they have been given a satisfactory rating under the Quality Control Review program of the ICAP, that they or any of the partners of the firm, their spouses and minor children do not hold shares of the Company and that the firm and all its partners are in compliance with International Federation of Accountants (IFAC) guidelines on Code of Ethics as adopted by the ICAP.
20. The statutory auditors or the persons associated with them have not been appointed to provide other services except in accordance with the Listing Regulations and the auditors have confirmed that they have observed IFAC guidelines in this regard.
21. The ‘closed period’, prior to the announcement of interim / final results, and business decisions, which may materially affect the market price of Company’s securities, was determined and intimated to the directors, employees and stock exchanges.
22. Material / price sensitive information has been disseminated among all market participants at once through the stock exchanges.
23. We confirm that other material principles enshrined in the CCG have been complied with.
Lt Gen Naeem Khalid Lodhi, HI(M) (Retired)Rawalpindi Chief Executive & Managing Director
January 30, 2015

82
82
Review Report to the Memberson Statement of Compliance with Code of Corporate Governance
We have reviewed the Statement of Compliance with the best practices contained in the Code of Corporate Governance
(the Code) prepared by the Board of Directors (the Board) of Fauji Fertilizer Company Limited (the Company) for the
year ended December 31, 2014, to comply with the requirements of Listing Regulation No. 35 of the respective Stock
Exchanges where the Company is listed.
The responsibility for compliance with the Code is that of the Board of the Company. Our responsibility is to review, to the
extent where such compliance can be objectively verified, whether the Statement of Compliance reflects the status of the
Company’s compliance with the provisions of the Code and report if it does not and to highlight any non-compliance with
the requirements of the Code. A review is limited primarily to inquiries of the Company’s personnel and review of various
documents prepared by the Company to comply with the Code.
As a part of our audit of the financial statements we are required to obtain an understanding of the accounting and internal
control systems sufficient to plan the audit and develop an effective audit approach. We are not required to consider
whether the Board’s statement on internal control covers all risks and controls or to form an opinion on the effectiveness of
such internal controls, the Company’s corporate governance procedures and risks.
The Code requires the Company to place before the Audit Committee, and upon recommendation of the Audit Committee,
place before the Board for their review and approval its related party transactions distinguishing between transactions
carried out on terms equivalent to those that prevail in arm’s length transactions and transactions which are not executed at
arm’s length price and recording proper justification for using such alternate pricing mechanism. We are only required and
have ensured compliance of this requirement to the extent of the approval of the related party transactions by the Board
upon recommendation of the Audit Committee. We have not carried out any procedures to determine whether the related
party transactions were undertaken at arm’s length price or not.
Based on our review, nothing has come to our attention which causes us to believe that the Statement of Compliance does
not appropriately reflect the Company’s compliance, in all material respects, with the best practices contained in the Code
as applicable to the Company for the year ended December 31, 2014.
A. F. FERGUSON & CO.
CHARTERED ACCOUNTANTS
Engagement Partner: M. Imtiaz Aslam
Islamabad
January 30, 2015

Financial Statements of Fauji Fertilizer Company Limited 2014
83
83
Auditor’s Report to the Membersof Fauji Fertilizer Company Limited
We have audited the annexed balance sheet of Fauji Fertilizer Company Limited (the Company) as at December 31, 2014 and the related profit and loss account, statement of comprehensive income, cash flow statement and statement of changes in equity together with the notes forming part thereof, for the year then ended and we state that we have obtained all the information and explanations which, to the best of our knowledge and belief, were necessary for the purposes of our audit.
It is the responsibility of the Company’s management to establish and maintain a system of internal control, and prepare and present the above said statements in conformity with the approved accounting standards and the requirements of the Companies Ordinance, 1984. Our responsibility is to express an opinion on these statements based on our audit.
We conducted our audit in accordance with the auditing standards as applicable in Pakistan. These standards require that we plan and perform the audit to obtain reasonable assurance about whether the above said statements are free of any material misstatement. An audit includes examining, on a test basis, evidence supporting the amounts and disclosures in the above said statements. An audit also includes assessing the accounting policies and significant estimates made by management, as well, evaluating the overall presentation of the financial statements. We believe that our audit provides a reasonable basis for our opinion and, after due verification, we report that:
(a) in our opinion, proper books of account have been kept by the Company as required by the Companies Ordinance, 1984;
(b) in our opinion -
(i) the balance sheet and profit and loss account together with the notes thereon have been drawn up in conformity with the Companies Ordinance, 1984 and are in agreement with the books of account and are further in accordance with accounting policies consistently applied,
(ii) the expenditure incurred during the year was for the purpose of the Company’s business; and
(iii) the business conducted, investments made and the expenditure incurred during the year were in accordance with the objects of the Company.
(c) in our opinion and to the best of our information and according to the explanations given to us, the balance sheet, profit and loss account, statement of comprehensive income, cash flow statement and statement of changes in equity together with the notes forming part thereof conform with the approved accounting standards as applicable in Pakistan, and give the information required by the Companies Ordinance, 1984, in the manner so required and respectively give a true and fair view of the state of the Company’s affairs as at December 31, 2014 and of the profit, total comprehensive income, its cash flows and changes in equity for the year then ended; and
(d) in our opinion Zakat deductible at source under the Zakat and Ushr Ordinance, 1980 (XVIII of 1980) was deducted by the Company and deposited in the Central Zakat Fund established under section 7 of that Ordinance.
A. F. FERGUSON & CO.
CHARTERED ACCOUNTANTS
Engagement Partner: M. Imtiaz Aslam
Islamabad
January 30, 2015

84
84
Balance Sheetas at December 31, 2014
2014 2013 Note (Rupees ‘000)
EQUITY AND LIABILITIES
EQUITY
Share capital 5 12,722,382 12,722,382
Capital reserves 6 160,000 160,000
Revenue reserves 7 12,483,585 12,258,373
Surplus on remeasurement of investments
available for sale to fair value 303,564 10,508
25,669,531 25,151,263
NON - CURRENT LIABILITIES
Long term borrowings 8 2,500,000 4,280,000
Deferred liabilities 9 4,574,028 4,078,369
7,074,028 8,358,369
CURRENT LIABILITIES
Trade and other payables 10 37,904,434 21,854,125
Interest and mark-up accrued 12 30,117 22,098
Short term borrowings 13 11,602,443 7,000,000
Current portion of long term borrowings 8 1,780,000 1,460,000
Taxation 2,501,109 3,983,215
53,818,103 34,319,438
TOTAL EQUITY AND LIABILITIES 86,561,662 67,829,070
CONTINGENCIES AND COMMITMENTS 14
The annexed notes 1 to 42 form an integral part of these financial statements.

Financial Statements of Fauji Fertilizer Company Limited 2014
85
85
2014 2013 Note (Rupees ‘000)
ASSETS
NON - CURRENT ASSETS
Property, plant and equipment 15 20,093,898 18,444,188
Intangible assets 16 1,611,204 1,651,592
Long term investments 17 28,134,520 20,662,532
Long term loans and advances 18 823,188 740,408
Long term deposits and prepayments 19 15,624 2,654
50,678,434 41,501,374
CURRENT ASSETS
Stores, spares and loose tools 20 3,314,823 3,244,645
Stock in trade 21 981,750 301,957
Trade debts 22 822,460 700,541
Loans and advances 23 1,058,754 921,460
Deposits and prepayments 24 26,376 37,225
Other receivables 25 1,072,461 799,922
Short term investments 26 27,432,837 18,960,295
Cash and bank balances 27 1,173,767 1,361,651
35,883,228 26,327,696
TOTAL ASSETS 86,561,662 67,829,070
Chairman Chief Executive Director

86
86
Profit and Loss Accountfor the year ended December 31, 2014
2014 2013 Note (Rupees ‘000)
Sales 28 81,240,187 74,480,611
Cost of sales 29 50,136,749 39,948,572
GROSS PROFIT 31,103,438 34,532,039
Distribution cost 30 6,431,667 6,167,280
24,671,771 28,364,759
Finance cost 31 848,940 756,215
Other expenses 32 2,302,937 2,557,937
21,519,894 25,050,607
Other income 33 4,720,866 4,367,941
NET PROFIT BEFORE TAXATION 26,240,760 29,418,548
Provision for taxation 34 8,070,000 9,284,000
NET PROFIT AFTER TAXATION 18,170,760 20,134,548
Earnings per share - basic and diluted (Rupees) 35 14.28 15.83
The annexed notes 1 to 42 form an integral part of these financial statements.
Chairman Chief Executive Director

Financial Statements of Fauji Fertilizer Company Limited 2014
87
87
Statement of Comprehensive Incomefor the year ended December 31, 2014
2014 2013 (Rupees ‘000)
Net profit after taxation 18,170,760 20,134,548
Other comprehensive income
Gain on remeasurement of staff retirement benefit plans - net of tax 56,621 47,791
Surplus on remeasurement of investments available for sale to fair value - net of tax 293,056 2,813
Other comprehensive income - net of tax 349,677 50,604
Total comprehensive income for the year 18,520,437 20,185,152
The annexed notes 1 to 42 form an integral part of these financial statements.
Chairman Chief Executive Director

88
88
Cash Flow Statementfor the year ended December 31, 2014
2014 2013 Note (Rupees ‘000)
CASH FLOWS FROM OPERATING ACTIVITIES
Cash generated from operations 37 39,191,657 35,783,891
Finance cost paid (753,024) (759,038)
Income tax paid (9,349,085) (9,754,711)
Net cash generated from operating activities 29,089,548 25,270,142
CASH FLOWS FROM INVESTING ACTIVITIES
Fixed capital expenditure (3,478,894) (2,295,269)
Proceeds from disposal of property, plant and equipment 45,286 49,583
Interest received 1,283,293 1,242,488
Sale of shares in Fauji Fertilizer Bin Qasim Limited 375,139 –
Investment in Askari Bank Limited – (10,461,921)
Investment in FFC Energy Limited – (138,250)
Investment in Fauji Fresh n Freeze Limited (formerly Al-Hamd
Foods Limited) (450,000) (585,500)
(Increase) / decrease in other investment - net (8,083,631) 919,406
Dividends received 2,578,319 2,586,042
Net cash used in investing activities (7,730,488) (8,683,421)
CASH FLOWS FROM FINANCING ACTIVITIES
Long term financing - disbursements – 1,950,000
- repayments (1,460,000) (1,513,750)
Dividends paid (17,582,658) (20,677,553)
Net cash used in financing activities (19,042,658) (20,241,303)
Net increase / (decrease) in cash and cash equivalents 2,316,402 (3,654,582)
Cash and cash equivalents at beginning of the year 13,012,602 16,571,069
Effect of exchange rate changes (47,862) 96,115
Cash and cash equivalents at end of the year 38 15,281,142 13,012,602
The annexed notes 1 to 42 form an integral part of these financial statements.
Chairman Chief Executive Director

Financial Statements of Fauji Fertilizer Company Limited 2014
89
89
Balance at January 1, 2013 12,722,382 160,000 5,502,360 7,374,769 7,695 25,767,206 Transfer to general reserve – – 1,300,000 (1,300,000) – – Total comprehensive income for the year Profit after taxation – – – 20,134,548 – 20,134,548 Other comprehensive income - net of tax – – – 47,791 2,813 50,604 – – – 20,182,339 2,813 20,185,152 Distribution to owners Final dividend 2012: Rs 5.00 per share – – – (6,361,191) – (6,361,191)First interim dividend 2013: Rs 3.50 per share – – – (4,452,834) – (4,452,834)Second interim dividend 2013: Rs 3.75 per share – – – (4,770,893) – (4,770,893)Third interim dividend 2013: Rs 4.10 per share – – – (5,216,177) – (5,216,177) – – – (20,801,095) – (20,801,095)
Balance at December 31, 2013 12,722,382 160,000 6,802,360 5,456,013 10,508 25,151,263 Transfer to general reserve – – – – – – Total comprehensive income for the year Profit after taxation – – – 18,170,760 – 18,170,760 Other comprehensive income - net of tax – – – 56,621 293,056 349,677 – – – 18,227,381 293,056 18,520,437Distribution to owners Final dividend 2013: Rs 4.00 per share – – – (5,088,952) – (5,088,952)First interim dividend 2014: Rs 3.00 per share – – – (3,816,714) – (3,816,714)Second interim dividend 2014: Rs 3.40 per share – – – (4,325,610) – (4,325,610)Third interim dividend 2014: Rs 3.75 per share – – – (4,770,893) – (4,770,893) – – – (18,002,169) – (18,002,169)Balance at December 31, 2014 12,722,382 160,000 6,802,360 5,681,225 303,564 25,669,531 The annexed notes 1 to 42 form an integral part of these financial statements.
Statement of Changes in Equityfor the year ended December 31, 2014
Revenue reserves Surplus on Share Capital remeasurement
capital reserves General Unappropriated of investments Total reserve profit available for sale
to fair value
(Rupees ‘000)
Chairman Chief Executive Director

90
90
Notes to and forming part of the Financial Statementsfor the year ended December 31, 2014
1. LEGAL STATUS AND NATURE OF BUSINESS
Fauji Fertilizer Company Limited (the Company) is a public company incorporated in Pakistan under the Companies Act, 1913, (now the Companies Ordinance, 1984) and its shares are quoted on the Karachi, Lahore and Islamabad stock exchanges of Pakistan. The registered office of the Company is situated at 156 - The Mall, Rawalpindi, Pakistan. The Company is domiciled in Rawalpindi. The principal activity of the Company is manufacturing, purchasing and marketing of fertilizers and chemicals, including investment in other fertilizer, chemical, other manufacturing, energy generation and banking operations.
These financial statements are the separate financial statements of the Company in which investments in
subsidiary companies, associates and jointly controlled entities are accounted for on the basis of direct equity interest rather than on the basis of reported results. Consolidated financial statements are prepared separately.
2. STATEMENT OF COMPLIANCE
These financial statements have been prepared in accordance with the approved accounting standards as applicable in Pakistan. Approved accounting standards comprise of such International Financial Reporting Standards (IFRS) issued by the International Accounting Standards Board as are notified under the Companies Ordinance, 1984, provisions of or the directives issued under the Companies Ordinance, 1984. In case requirements differ, the provisions or directives of the Companies Ordinance, 1984 shall prevail.
3. USE OF ESTIMATES AND JUDGEMENTS
The preparation of financial statements in conformity with the approved accounting standards requires management to make judgments, estimates and assumptions that affect the application of accounting policies and the reported amounts of assets and liabilities, income and expenses. The estimates and associated assumptions are based on historical experience and various other factors that are believed to be reasonable under the circumstances, the results of which form the basis of making the judgments about carrying values of assets and liabilities that are not readily apparent from other sources. Actual results may differ from these estimates.
The estimates and underlying assumptions are reviewed on an ongoing basis. Revisions to accounting estimates
are recognised in the period in which the estimates are revised if the revision affects only that period, or in the period of the revision and future periods. Judgments made by management in application of the approved accounting standards that have significant effect on the financial statements and estimates with a significant risk of material adjustments in the next year are discussed in respective policy notes. The areas where various assumptions and estimates are significant to the Company’s financial statements or where judgment was exercised in application of accounting policies are as follows:
(i) Retirement benefits - note 11 (ii) Estimate of useful life of property, plant and equipment - note 15 (iii) Estimate of useful life of intangible assets - note 16 (iv) Estimate of recoverable amount of goodwill - note 16 (v) Estimate of recoverable amount of investment in associated companies - note 17 (vi) Provision for taxation - note 34
4. SUMMARY OF SIGNIFICANT ACCOUNTING POLICIES
The accounting policies set out below have been applied consistently to all periods presented in these financial statements.
4.1 Basis of measurement
These financial statements have been prepared under the historical cost convention except for certain financial instruments, which are carried at their fair values and employees’ retirement gratuity and pension which are
carried at present value of defined benefit obligation net of fair value of plan assets.

Financial Statements of Fauji Fertilizer Company Limited 2014
91
91
4.2 Functional and presentation currency
Items included in the financial statements are measured using the currency of the primary economic environment
in which the Company operates. These financial statements are presented in Pak Rupees, which is the Company’s
functional currency.
4.3 Staff Retirement benefits
(a) The Company has the following plans for its employees:
Funded Gratuity and Pension Fund:
Defined benefit funded gratuity and pension fund for all eligible employees who complete qualifying period of
service and age.
These funds are administered by trustees. Annual contributions to the gratuity and management staff pension
funds are based on actuarial valuation using Projected Unit Credit Method, related details of which are given in
note 11 to the financial statements. All contributions are charged to profit or loss for the year.
Calculation of gratuity and pension requires assumptions to be made of future outcomes which mainly include
increase in remuneration, expected long-term return on plan assets and the discount rate used to convert future
cash flows to current values. Calculations are sensitive to changes in the underlying assumptions.
Contributory Provident Fund
Defined contribution provident fund for all eligible employees for which the Company’s contributions are charged
to profit or loss at the rate of 10% of basic salary.
(b) Compensated absences
The Company has the policy to provide for compensated absences of its employees in accordance with respective
entitlement on cessation of service; related expected cost thereof has been included in the financial statements.
4.4 Taxation
Income tax expense comprises of current and deferred tax.
Current tax
Provision for current taxation is based on taxable income at the applicable rates of taxation after taking into
account tax credits and tax rebates, if any. Income tax expense is recognised in profit or loss except to the extent
that it relates to items recognised directly in equity or in other comprehensive income.
Deferred tax
Deferred tax is accounted for using the balance sheet liability method in respect of temporary differences
arising from differences between the carrying amount of assets and liabilities in the financial statements and the
corresponding tax bases used in the computation of taxable profit. Deferred tax liabilities are recognised for all
taxable temporary differences and deferred tax assets are recognised to the extent that it is probable that taxable
profits will be available against which the deductible temporary differences, unused tax losses and tax credits can
be utilized. Deferred tax assets are reviewed at each reporting date and are reduced to the extent that it is no
longer probable that the related tax benefit will be realised. Deferred tax is not recognised on temporary differences
arising from the initial recognition of assets or liabilities in a transaction that is not a business combination and that
affects neither accounting nor taxable profit or loss, and differences arising on the initial recognition of goodwill.
Notes to and forming part of the Financial Statementsfor the year ended December 31, 2014

92
92
Deferred tax is calculated at the rates that are expected to apply to the period when the differences reverse, based
on tax rates that have been enacted. Deferred tax assets and liabilities are offset if there is a legally enforceable
right to offset current tax liabilities and assets, and they relate to income taxes levied by the same tax authority on
the same taxable entity, or on different taxable entities, but they intend to settle current tax liabilities and assets on
a net basis or their tax assets and liabilities will be realised simultaneously.
The Company takes into account the current income tax law and decisions taken by the taxation authorities.
Instances where the Company’s views differ from the income tax department at the assessment stage and where
the Company considers that its view on items of material nature is in accordance with law, the amounts are shown
as contingent liabilities.
4.5 Property, plant and equipment and capital work in progress
Property, plant and equipment are stated at cost less accumulated depreciation and impairment losses, if any
except freehold land and capital work in progress, which are stated at cost less impairment losses, if any. Cost
comprises acquisition and other directly attributable costs.
Depreciation is provided on a straight-line basis and charged to profit or loss to write off the depreciable amount of
each asset over its estimated useful life at the rates specified in note 15. Depreciation on addition in property, plant
and equipment is charged from the date when the asset becomes available for use upto the date of its disposal.
The cost of replacing part of an item of property, plant and equipment is recognised in the carrying amount of the
item if it is probable that the future economic benefits embodied within the part will flow to the Company and its
cost can be measured reliably. The carrying amount of the replaced part is derecognised, if any. The costs of the
day-to-day servicing of property, plant and equipment are recognised in profit or loss as incurred.
Gains and losses on disposal of an item of property, plant and equipment are determined by comparing the
proceeds from disposal with the carrying amount of property, plant and equipment, and are recognised net within
other income in profit or loss.
The Company reviews the useful life and residual value of property, plant and equipment on a regular basis. Any
change in estimates in future years might affect the carrying amounts of the respective items of property, plant and
equipment with a corresponding effect on depreciation charge and impairment.
4.6 Impairment
The carrying amount of the Company’s assets are reviewed at each balance sheet date to determine whether
there is any indication of impairment. If such indications exist, the asset’s recoverable amount is estimated in
order to determine the extent of the impairment loss, if any. Impairment loss is recognised as an expense in the
profit or loss. An impairment loss is reversed only to the extent that the asset’s carrying amount does not exceed
the carrying amount that would have been determined, net of depreciation or amortisation, if no impairment loss
had been recognised. For non-financial assets and available-for-sale financial assets that are debt securities, the
reversal is recognised in profit or loss. For available-for-sale financial assets that are equity securities, the reversal
is recognised directly in statement of comprehensive income.
4.7 Goodwill
On acquisition of an entity, excess of the purchase consideration over the fair value of the identifiable assets and
liabilities acquired is initially recognised as goodwill and thereafter tested for impairment annually. Subsequent to
initial recognition goodwill is recognised at cost less impairment, if any. In respect of equity accounted investees,
goodwill is included in the carrying amount of investment.
Notes to and forming part of the Financial Statementsfor the year ended December 31, 2014

Financial Statements of Fauji Fertilizer Company Limited 2014
93
93
4.8 Investments
4.8.1 Investment in subsidiaries
Investment in subsidiary is initially recognised at cost. At subsequent reporting date, recoverable amounts are
estimated to determine the extent of impairment loss, if any, and carrying amount of investment is adjusted
accordingly. Impairment losses are recognised as expense in profit or loss. Where impairment loss is subsequently
reversed, the carrying amounts of investment are increased to its revised recoverable amount but limited to the
extent of initial cost of investment. Reversal of impairment losses are recognised in the profit or loss.
The profits and losses of subsidiaries are carried forward in their financial statements and not dealt within these
financial statements except to the extent of dividend declared by the subsidiaries. Gains and losses on disposal of
investment are included in other income. When the disposal of investment in subsidiary resulted in loss of control
such that it becomes an associate, the retained investment is carried at cost.
4.8.2 Investment in associates and jointly controlled entities
Investments in associates and jointly controlled entities are initially recognised at cost. At subsequent reporting
date, the recoverable amounts are estimated to determine the extent of impairment losses, if any, and carrying
amounts of investments are adjusted accordingly. Impairment losses are recognised as expense in the profit
or loss. Where impairment losses are subsequently reversed, the carrying amounts of these investments are
increased to the revised recoverable amounts but limited to the extent of initial cost of investments. A reversal of
impairment loss is recognised in the profit or loss.
The profits and losses of associates and jointly controlled entities are carried forward in their financial statements
and not dealt within these financial statements except to the extent of dividend declared by the associates and
jointly controlled entities. Gains and losses on disposal of investments are included in other income.
4.8.3 Investment available for sale
These are initially measured at their fair value plus directly attributable transaction cost and at subsequent
reporting dates measured at fair values and gains or losses from changes in fair values other than impairment loss
are recognised in other comprehensive income until disposal at which time these are recycled to profit or loss.
Impairment loss on investments available for sale is recognised in the profit or loss.
4.8.4 Acquisition under common control
Acquisition under common control of the shareholders are initially recognised using exchange transaction basis.
All the acquisitions under common control are accounted for from the year in which the acquisition takes place
without restating the Company’s (acquirer) comparative financial statements.
4.8.5 Investments at fair value through profit or loss
Investments which are acquired principally for the purpose of selling in the near term or the investments that are
part of a portfolio of financial instruments exhibiting short term profit taking, are classified as fair value through
profit or loss and designated as such upon initial recognition. These are stated at fair values with any resulting
gains or losses recognized directly in profit or loss.
The Company recognizes the regular way purchase or sale of financial assets using settlement date accounting.
4.8.6 Loans and receivables
Investments are classified as loans and receivables which have fixed or determinable payments and are not quoted
in an active market. These investments are measured at amortised cost using the effective interest method, less
any impairment losses.
Notes to and forming part of the Financial Statementsfor the year ended December 31, 2014

94
94
4.9 Stores, spares and loose tools
Stores, spares and loose tools are valued at weighted average cost less impairment. The Company reviews the
carrying amount of stores and spares on a regular basis and provision is made for obsolescence if there is any
change in usage pattern and physical form of related stores, spares and loose tools. Impairment is also made for
slow moving spares. Stores in transit are stated at invoice value plus other charges paid thereon.
4.10 Stock in trade
Stocks are valued at the lower of cost and net realisable value.
Cost is determined as follows:
Raw materials at weighted average purchase cost and directly attributable expenses Work in process and finished goods at weighted average cost of purchase, raw materials and
applicable manufacturing expenses
Net realisable value signifies the estimated selling price in the ordinary course of business less the estimated costs
of completion and the estimated costs necessary to make the sale.
The Company reviews the carrying amount of stock in trade on a regular basis and as appropriate, inventory
is written down to its net realizable value or provision is made for obsolescence if there is any change in usage
pattern and / or physical form of related inventory.
4.11 Foreign currency transaction and translation
Transactions in foreign currency are accounted for at the exchange rates prevailing on the date of transactions. All
monetary assets and liabilities denominated in foreign currencies at the year end are translated at exchange rates
prevailing at the balance sheet date. Non monetary items that are measured in terms of historical cost in a foreign
currency are translated using exchange rate at the date of transaction. Exchange differences are included in profit
or loss for the year.
4.12 Revenue recognition
Sales revenue is recognised when the goods are dispatched and significant risks and rewards of ownership are
transferred to the customer. Revenue from sale of goods is measured at the fair value of consideration received or
receivable, net of returns and trade discounts. Scrap sales and miscellaneous receipts are recognised on realised
amounts. Commission on sale of subsidiary company products is recognised when such products are sold on its
behalf.
4.13 Borrowing costs
Borrowing costs which are directly attributable to the acquisition, construction or production of a qualifying asset
are capitalised as part of the cost of that asset. Borrowing cost includes exchange differences arising from foreign
currency borrowings to the extent these are regarded as an adjustment to borrowing costs. All other borrowing
costs are charged to profit or loss.
4.14 Research and development costs
Research and development costs are charged to profit or loss as and when incurred.
Notes to and forming part of the Financial Statementsfor the year ended December 31, 2014

Financial Statements of Fauji Fertilizer Company Limited 2014
95
95
4.15 Provisions
Provisions are recognised when the Company has a present legal or constructive obligation as a result of past
events, it is probable that an outflow of resources embodying economic benefits will be required to settle the
obligation and a reliable estimate can be made of the amount of obligation. Provisions are reviewed at each
balance sheet date and adjusted to reflect current best estimate.
4.16 Basis of allocation of common expenses
Selling and distribution expenses are allocated to Fauji Fertilizer Bin Qasim Limited (FFBL), in proportion to the
sales volume handled on its behalf under the Inter Company Services Agreement.
4.17 Dividend and reserve appropriation
Dividend is recognized as a liability in the period in which it is declared. Movement in reserves is recognised in the
year in which it is approved.
4.18 Cash and cash equivalents
Cash and cash equivalents comprise cash in hand, cash with banks on current, saving and deposit accounts,
short term borrowings and other short term highly liquid investments that are readily convertible to known amounts
of cash and which are subject to insignificant risk of change in value.
4.19 Financial instruments
Financial assets and liabilities are recognised when the Company becomes a party to the contractual provisions
of the instrument and de-recognised when the Company loses control of the contractual rights that comprise
the financial assets and in case of financial liabilities when the obligation specified in the contract is discharged,
cancelled or expired. All financial assets and liabilities other than at fair value through profit or loss are initially
recognised at fair value plus transaction costs. Financial assets and liabilities carried at fair value through profit or
loss are initially recognised at fair value, and transaction costs are charged to profit or loss for the year. Any gain
or loss on derecognition of financial assets and financial liabilities is included in profit or loss for the year.
Financial assets and liabilities are offset and the net amount is reported in the balance sheet if the Company has
a legally enforceable right to setoff the recognised amounts and the Company intends to settle on a net basis, or
realise the asset and settle the liability simultaneously.
4.20 Mark-up bearing borrowings
Mark-up bearing borrowings are recognised initially at fair value being consideration received less attributable
transactions costs. Subsequent to initial recognition, mark-up bearing borrowings are stated at amortised cost.
4.21 Trade and other payables
Liabilities for trade and other payables are carried at their amortised cost which approximates the fair value of the
consideration to be paid in the future for goods and services received.
Notes to and forming part of the Financial Statementsfor the year ended December 31, 2014

96
96
4.22 Trade debts and other receivables
Trade debts and other receivables are recognised and carried at their amortised cost less an allowance for any
uncollectable amounts. Carrying amounts of trade debts and other receivables are assessed on a regular basis
and if there is any doubt about the realisability of these receivables, appropriate amount of provision is made.
4.23 Earnings per share
The Company presents basic and diluted earnings per share (EPS) data for its ordinary shares. Basic EPS is
calculated by dividing the profit or loss attributable to ordinary shareholders of the Company by the weighted
average number of ordinary shares outstanding during the year. Diluted EPS is determined by adjusting the profit
or loss attributable to ordinary shareholders and the weighted average number of ordinary shares outstanding for
the effects of all dilutive potential ordinary shares.
4.24 Finance income and finance costs
Finance income comprises interest income on funds invested (including available-for-sale financial assets),
dividend income, gain on disposal of available-for-sale financial assets and changes in fair value of investments
held for trading. Interest income is recognised as it accrues in profit or loss, using effective interest method.
Dividend income is recognised in profit or loss on the date that the Company’s right to receive payment is
established.
Finance costs comprise interest expense on borrowings, changes in fair value of investment carried at fair value
through profit or loss and impairment losses recognised on financial assets. Borrowing costs that are not directly
attributable to the acquisition, construction or production of a qualifying asset are recognised in profit or loss using
effective interest method.
Foreign currency gains and losses are reported on a net basis.
4.25 Operating leases
Rentals payable under operating leases are charged to profit or loss on a straight line basis over the term of the
relevant lease.
4.26 Intangible assets
Intangibles are stated at the cash price equivalent of the consideration given less accumulated amortization
and impairment loss, if any. Intangibles with finite useful lives are amortized over the period of their useful lives.
Amortization is charged on a straight line basis over the estimated useful life and is included in the profit or loss.
4.27 Contingent Liabilities
A contingent liability is disclosed when the Company has a possible obligation as a result of past events, whose
existence will be confirmed only by the occurrence or non-occurrence, of one or more uncertain future events
not wholly within the control of the Company; or the Company has a present legal or constructive obligation that
arises from past events, but it is not probable that an outflow of resources embodying economic benefits will be
required to settle the obligation, or the amount of the obligation cannot be measured with sufficient reliability.
Notes to and forming part of the Financial Statementsfor the year ended December 31, 2014

Financial Statements of Fauji Fertilizer Company Limited 2014
97
97
4.28 New accounting standards, amendments and IFRIC interpretations that are not yet effective
Standards, amendments and interpretations to existing standards that are not yet effective and have not been
early adopted by the Company:
Effective date (annual
reporting periods
beginning on or after)
IAS 27 Separate financial statements (Amendments) January 1, 2015
IAS 39 Financial instruments: Recognition and measurement (Amendments) January 1, 2015
IFRS 10 Consolidated financial statements (Amendments) January 1, 2015
IFRS 11 Joint Arrangements January 1, 2015
IFRS 12 Disclosure of interests in other entities (Amendments) January 1, 2015
IFRS 13 Fair value measurement January 1, 2015
The management anticipate that the adoption of the above standards, amendments and interpretations in future
periods, will have no material impact on the financial statements other than in presentation / disclosures.
Further, the following new standards and interpretations have been issued by the International Accounting
Standards Board (IASB), which are yet to be notified by the Securities and Exchange Commission of Pakistan, for
the purpose of their applicability in Pakistan:
Effective date (annual
reporting periods
beginning on or after)
IFRS 1 First-time adoption of International Financial Reporting standards July 1, 2009
IFRS 9 Financial instruments January 1, 2015
IFRS 14 Regulatory Deferral accounts January 1, 2014
IFRS 15 Revenue from customers January 1, 2014
IFRIC 21 Levies January 1, 2014
The following interpretations issued by the IASB have been waived off by SECP effective January 16, 2012:
IFRIC 4 Determining whether an arrangement contains lease
IFRIC 12 Service concession arrangements
Notes to and forming part of the Financial Statementsfor the year ended December 31, 2014

98
98
5. SHARE CAPITAL
AUTHORISED SHARE CAPITAL
This represents 1,500,000,000 (2013: 1,500,000,000) ordinary shares of Rs 10 each amounting to Rs 15,000,000
thousand (2013: Rs 15,000,000 thousand).
ISSUED, SUBSCRIBED AND PAID UP CAPITAL
2014 2013 2014 2013
(Numbers) (Rupees ‘000)
256,495,902 256,495,902 Ordinary shares of Rs 10 each issued for consideration in cash 2,564,959 2,564,959 1,015,742,345 1,015,742,345 Ordinary shares of Rs 10 each issued as fully paid bonus shares 10,157,423 10,157,423
1,272,238,247 1,272,238,247 12,722,382 12,722,382
5.1 Fauji Foundation held 44.35% (2013: 44.35%) ordinary shares of the Company at the year end.
2014 2013 Note (Rupees ‘000)
6. CAPITAL RESERVES
Share premium 6.1 40,000 40,000
Capital redemption reserve 6.2 120,000 120,000
160,000 160,000
6.1 Share premium
This represents premium of Rs 5 per share received on public issue of 8,000,000 ordinary shares of
Rs 10 each in 1991.
6.2 Capital redemption reserve
This represents reserve setup on redemption of preference shares of Rs 120,000 thousand in 1996.
2014 2013 (Rupees ‘000)
7. REVENUE RESERVES
General reserve 6,802,360 6,802,360
Unappropriated profit 5,681,225 5,456,013
12,483,585 12,258,373
Notes to and forming part of the Financial Statementsfor the year ended December 31, 2014

Financial Statements of Fauji Fertilizer Company Limited 2014
99
99
8.1 Terms and conditions of these borrowings are as follows:
No of Date of final
Lenders Mark-up rates p.a. (%) installments repayment outstanding
AIBL 6 Months KIBOR+0.50 1 half yearly June 27, 2015
DIBL - 1 6 Months KIBOR+0.35 1 half yearly June 30, 2015
DIBL - 2 6 Months KIBOR+0.35 7 half yearly June 26, 2018
MBL 6 Months KIBOR+0.50 2 half yearly December 31, 2015
BOP - 1 6 Months KIBOR+0.50 2 half yearly December 30, 2015
BOP - 2 6 Months KIBOR+0.50 6 half yearly December 27, 2017
ABL 6 Months KIBOR+0.50 4 half yearly December 23, 2016
UBL 6 Months KIBOR+0.35 8 half yearly December 27, 2018
These finances are secured by an equitable mortgage on the Company’s assets and hypothecation of all
Company’s assets including plant and machinery, stores, spares and loose tools and all other moveable properties
including stocks and book debts, ranking pari passu with each other with 25% margin.
2014 2013 Note (Rupees ‘000)
9. DEFERRED LIABILITIES
Deferred taxation 9.1 3,650,872 3,259,563
Provision for compensated leave absences 9.2 923,156 818,806
4,574,028 4,078,369
2014 2013 Note (Rupees ‘000)
8. LONG TERM BORROWINGS
Loans from banking companies - secured 8.1
Al - Baraka Bank (Pakistan) Limited (AIBL) 25,000 75,000
Dubai Islamic Bank (Pakistan) Limited (DIBL - 1) 30,000 90,000
Dubai Islamic Bank (Pakistan) Limited (DIBL - 2) 350,000 450,000
Meezan Bank Limited (MBL) 250,000 500,000
Bank of Punjab (BOP - 1) 125,000 250,000
Bank of Punjab (BOP - 2) 750,000 1,000,000
Allied Bank Limited (ABL) 1,250,000 1,875,000
United Bank Limited (UBL) 1,500,000 1,500,000
4,280,000 5,740,000
Less: Current portion shown under current liabilities 1,780,000 1,460,000
2,500,000 4,280,000
Notes to and forming part of the Financial Statementsfor the year ended December 31, 2014

100
100
2014 2013 (Rupees ‘000)
9.1 Deferred taxation The balance of deferred tax is in respect of the following temporary differences:
Accelerated depreciation / amortisation 3,765,586 3,539,000 Provision for slow moving spares, doubtful debts, other receivables and investments (139,565) (116,000) Retirement benefit obligation (132,949) (163,437) Remeasurement of investment available for sale 157,800 – 3,650,872 3,259,563 The gross movement in the deferred tax liability during the year is as follows: Balance at the beginning 3,259,563 3,147,962 Tax charge recognised in profit and loss account 203,021 89,000 Tax charge recognised in other comprehensive income 188,288 22,601 Balance at the end 3,650,872 3,259,563 9.2 Movement of provision for compensated leave absences: Balance at the beginning 818,806 767,297 Provision during the year 172,284 156,899 991,090 924,196 Encashed during the year (67,934) (105,390)
Balance at the end 923,156 818,806
Acturial valuation has not been carried out as the impact is considered to be immaterial. 2014 2013 (Rupees ‘000)
10. TRADE AND OTHER PAYABLES Creditors 25,417,864 8,663,733 Accrued liabilities 2,415,831 3,297,691 Consignment account with Fauji Fertilizer Bin Qasim Limited - unsecured 131,667 347,142 Sales tax payable - net 1,090,128 814,939 Deposits 215,453 196,107 Retention money 162,956 123,418 Advances from customers 6,378,845 6,417,376 Workers’ Welfare Fund 1,191,661 1,073,544 Payable to gratuity fund – 436,283 Unclaimed dividend 866,481 446,970 Other liabilities 33,548 36,922
37,904,434 21,854,125
Creditors include Rs 24,740,966 thousand (2013: Rs 8,532,062 thousand) on account of Gas Infrastructure Development Cess (GIDC). In accordance with GIDC Act, 2011 the Company was required to pay GIDC at the rates specified in the second schedule. During the year the Honorable Supreme Court dismissed appeals against an earlier decision of the Honorable Peshawar High Court which declared GIDC Act, 2011 Ultra Vires to the Constitution. The President of Pakistan promulgated the GIDC Ordinance, 2014 on September 25, 2014 with retrospective effect which ordinance is yet to be passed by the National Assembly. The Honorable Islamabad High Court has granted stay against recovery of GIDC through a stay order in December 2014.
Notes to and forming part of the Financial Statementsfor the year ended December 31, 2014

Financial Statements of Fauji Fertilizer Company Limited 2014
101
101
Funded Funded 2014 2013 gratuity pension Total Total
(Rupees ‘000)
11. RETIREMENT BENEFIT FUNDS
i) The amounts recognized in the balance sheet are as follows:
Present value of defined benefit obligation 1,818,169 2,491,821 4,309,990 3,915,304
Fair value of plan assets (1,846,259) (2,550,840) (4,397,099) (3,488,780)
(Asset) / Liability (28,090) (59,019) (87,109) 426,524
ii) Amount recognised in the profit and loss account is as follows:
Current service cost 96,564 101,942 198,506 170,499
Net interest cost 53,354 1,884 55,238 49,250
149,918 103,826 253,744 219,749
iii) Movement in the present value of defined benefit
obligation:
Present value of defined benefit obligation at beginning 1,609,419 2,305,885 3,915,304 3,604,654
Current service cost 96,564 101,942 198,506 170,499
Interest cost 201,411 294,552 495,963 428,478
Benefits paid (118,692) (115,654) (234,346) (297,779)
Remeasurement of defined benefit obligation 29,467 (94,904) (65,437) 9,452
Present value of defined benefit obligation at end 1,818,169 2,491,821 4,309,990 3,915,304
iv) Movement in fair value of plan assets:
Fair value of plan assets at beginning 1,173,136 2,315,644 3,488,780 3,186,349
Expected return on plan assets 148,057 292,668 440,725 379,228
Contributions 586,201 94,067 680,268 139,120
Benefits paid (118,692) (115,654) (234,346) (297,779)
Remeasurement of plan assets 57,557 (35,885) 21,672 81,862
Fair value of plan assets at end 1,846,259 2,550,840 4,397,099 3,488,780
v) Actual return on plan assets 205,614 256,783 462,397 461,090
vi) Contributions expected to be paid to the
plan during the next year 102,983 100,199 203,182 253,744
vii) Plan assets comprise of:
Investment in debt securities 621,981 1,594,151 2,216,132 2,013,030
Investment in equity securities 800,646 802,931 1,603,577 1,178,073
Deposits with banks 256,635 125,568 382,203 149,296
Mutual Funds 166,997 28,190 195,187 148,381
1,846,259 2,550,840 4,397,099 3,488,780
viii) The expected return on plan assets is based on the market expectations and depends upon the asset portfolio of the Funds, at the beginning of the year, for returns over the entire life of the related obligations.
Notes to and forming part of the Financial Statementsfor the year ended December 31, 2014

102
102
Funded gratuity Funded pension 2014 2013 2014 2013 (Rupees ‘000) (Rupees ‘000) ix) Movement in (asset) / liability recognised in balance sheet: Opening liability 436,283 367,962 (9,759) 50,343 Cost for the year recognised in profit or loss 149,918 125,368 103,826 94,381 Employer’s contribution during the year (586,201) (91,929) (94,067) (47,191) Total amount of remeasurement recognised in Other Comprehensive Income (OCI) during the year (28,090) 34,882 (59,019) (107,292) Closing (asset) / liability (28,090) 436,283 (59,019) (9,759) x) Remeasurements recognised in OCI during the year: Remeasurment (loss) / gain on obligation (29,467) (61,243) 94,904 51,791 Remeasurment gain / (loss) on plan assets 57,557 26,361 (35,885) 55,501 Remeasurment gain / (loss) recognised in OCI 28,090 (34,882) 59,019 107,292 2014 2013 Funded Funded Funded Funded gratuity pension gratuity pension
(Percentage)xi) Principal actuarial assumptions used in the actuarial valuations are as follows: Discount rate 11.50 11.50 13.00 13.00 Expected rate of salary growth Management 11.50 11.50 13.00 13.00 Non - Management 10.50 – 12.00 – Expected rate of return on plan assets 11.50 11.50 13.00 13.00 Expected rate of increase in post retirement pension – 5.50 – 7.00 Demographic assumptions Mortality rates (for death in service) SLIC SLIC SLIC SLIC (2001-05)-1 (2001-05)-1 (2001-05) (2001-05) Rates of employee turnover Management Moderate Moderate Moderate Moderate Non - Management Light – Light –
xii) Sensitivity analysis
The calculation of the defined benefit obligation is sensitive to assumptions set out above. The following table summarizes how the impact on the defined benefit obligation at the end of the reporting period would have increased / (decreased) as a result of a change in respective assumptions by one percent.
Defined benefit obligation Effect of 1 Effect of 1 percent percent increase decrease (Rupees ‘000)
Discount rate (346,853) 409,786
Future salary growth 138,515 (127,863)
Future pension 187,001 (160,730)
The impact of changes in financial assumptions has been determined by revaluation of the obligations on different rates.
Notes to and forming part of the Financial Statementsfor the year ended December 31, 2014

Financial Statements of Fauji Fertilizer Company Limited 2014
103
103
xiii) The weighted average number of years of defined benefit obligation is given below:
Gratuity Pension (Years)
Plan Duration December 31, 2014 6.50 7.00
xiv) The Company contributes to the pension and gratuity funds on the advice of the fund’s actuary. The contributions are equal to the current service cost with adjustment for any deficit. If there is a surplus, the Company takes a contribution holiday.
xv) Projected benefit payments from funds are as follows: Gratuity Pension (Rupees ‘000)
FY 2015 153,782 185,543
FY 2016 332,651 193,880
FY 2017 207,577 207,691
FY 2018 284,307 248,255
FY 2019 232,016 209,189
FY 2020 - FY 2024 1,456,111 1,507,877
FY 2025 - FY 2029 1,926,038 2,179,571
xvi) “Salaries, wages and benefits” expense, stated in notes 29 and 30 include retirement benefits in respect of gratuity, provident fund, pension plan and compensated absences amounting to Rs 149,918 thousand, Rs 112,607 thousand, Rs 103,826 thousand and Rs 172,284 thousand respectively (2013: Rs 125,368 thousand, Rs 102,393 thousand, Rs 94,381 thousand and Rs 156,899 thousand respectively). These are reduced by the amount of charges debited to Fauji Fertilizer Bin Qasim Limited under Inter Company Services Agreement.
2014 2013 Total Total (Rupees ‘000)
11.1 Defined contribution plan Details of the Employees’ Provident Fund based on unaudited financial statements
for the year ended December 31, 2014 are as follows: Size of the fund (total assets) 5,273,006 4,309,085 Cost of investments made 4,533,096 3,657,124 Fair value of investments made 4,737,691 3,860,364 % % Percentage of investments made 90 90
2014 2013 Rupees ‘000 % age Rupees ‘000 % age
Breakup of investment - at cost
Term deposits and funds with scheduled banks 2,697,876 60 2,002,931 55
Government securities 276,299 6 37,908 1
Listed securities, mutual funds and term
finance certificates 1,558,921 34 1,616,285 44
4,533,096 100 3,657,124 100 Investments out of provident funds have been made in accordance with the provisions of section 227 of the Companies
Ordinance, 1984 and the rules formulated for the purpose, except for the prescribed limit for listed securities.
Notes to and forming part of the Financial Statementsfor the year ended December 31, 2014

104
104
2014 2013 Note (Rupees ‘000)
12. INTEREST AND MARK - UP ACCRUED
On long term borrowings 7,333 9,222
On short term borrowings 22,784 12,876
30,117 22,098
13. SHORT TERM BORROWINGS
Short term running finance facilities from
banking companies - secured 13.1
MCB Bank Limited (MCB - 1) 1,300,000 1,200,000
MCB Bank Limited (MCB - 2) 100,000 –
Allied Bank Limited (ABL) 2,000,000 2,000,000
Bank Al-Habib Limited (BAHL) 989,393 –
United Bank Limited (UBL) 750,000 –
Askari Bank Limited (AKBL) 491,576 –
Bank Alfalah Limited (BAF) 499,985 –
Habib Bank Limited (HBL) 1,596,489 –
Istisna facilities
Meezan Bank Limited (MBL - 1) 2,925,000 1,200,000
Meezan Bank Limited (MBL - 2) 500,000 2,000,000
Bank Islami Pakistan Limited (BIPL) – 600,000
Dubai Islamic Bank (Pakistan) Limited (DIBL) 450,000 –
11,602,443 7,000,000
13.1 Terms and conditions of these borrowings are as follows:
Lender
Mark-up rate p.a. Maturity date
(%)
MCB Bank Limited (MCB - 1) 1 month KIBOR + 0.08 May 31, 2015
MCB Bank Limited (MCB - 2) 1 month KIBOR + 0.35 May 31, 2015
Allied Bank Limited (ABL) 3 month KIBOR + 0.15 July 31, 2015
Bank Al-Habib Limited (BAHL) 1 month KIBOR + 0.05 June 30, 2015
United Bank Limited (UBL) 1 month KIBOR + 0.25 January 31, 2015
Askari Bank Limited (AKBL) 1 month KIBOR + 0.20 June 30, 2015
Bank Alfalah Limited (BAF) 3 month KIBOR + 0.10 March 31, 2015
Habib Bank Limited (HBL) 1 month KIBOR + 0.30 April 30, 2015
Meezan Bank Limited (MBL - 1) 3 month KIBOR + 0.10 May 31, 2015
Meezan Bank Limited (MBL - 2) 3 month KIBOR + 0.05 March 26, 2015
Dubai Islamic Bank (Pakistan) Limited (DIBL) 1 month KIBOR + 0.10 June 30, 2015
These represent amounts available against facilities available from various banking companies under mark-up /
profit arrangements amounting to Rs 13.30 billion (2013: Rs 10.35 billion) which represent the aggregate of sale
prices of all mark-up / profit agreements between the Company and respective banks.
The facilities are secured by pari passu and ranking hypothecation charges on assets of the Company. Facilities
amounting to Rs 1.0 billion (2013: Rs 2.0 billion) are secured against lien over Term Deposit Receipts / PIBs.
Notes to and forming part of the Financial Statementsfor the year ended December 31, 2014

Financial Statements of Fauji Fertilizer Company Limited 2014
105
105
2014 2013 (Rupees ‘000)
14. CONTINGENCIES AND COMMITMENTS
a) Contingencies:
i) Guarantees issued by banks on behalf of the Company 50,997 59,281
ii) Claims against the Company and / or potential exposure not
acknowledged as debt 50,696 50,696
iii) The Competition Commission of Pakistan has imposed a penalty of Rs 5.5 billion on the Company for alleged
unreasonable increase in urea prices in 2011. However, the fact remains that price increase was essentially
caused by extended gas curtailment and delayed urea imports by the Government of Pakistan resulting in
product shortage leading to market imbalance and price hike. The Company has filed an appeal against the
above penalty before the Competition Appellate Tribunal. Based on legal advice from the Company’s legal
advisor, the Company is confident that there are reasonable grounds for a favourable decision.
2014 2013 (Rupees ‘000)
b) Commitments in respect of:
i) Capital expenditure 2,913,033 1,302,329
ii) Purchase of fertilizer, stores, spares and other operational items 2,869,125 1,768,194
iii) Investment in Fauji Fresh n Freeze Limited (formerly Al-Hamd
Foods Limited) 435,000 550,000
iv) Rentals under lease agreements:
Premises - not later than one year 71,398 88,464
- later than one year and not later than:
two years 31,740 47,878
three years 26,394 23,740
four years 27,262 26,395
five years 27,342 879
Vehicles - not later than one year 33,538 33,292
- later than one year and not later than:
two years 23,263 21,596
three years 15,376 18,695
four years 12,592 11,679
five years 10,691 6,363
Notes to and forming part of the Financial Statementsfor the year ended December 31, 2014

106
106
As
at J
anua
ry 1
, 201
3
Cos
t
534
,811
1
78,7
50
4,8
88,4
62
42,
150
2
6,51
7 2
6,37
1,12
8 1
,149
,115
4
57,4
42
198
,215
4
31,0
28
1,5
19,5
71
20,
194
2,0
02,1
91
37,
819,
574
Acc
umul
ated
Dep
reci
atio
n -
(106
,599
) (1
,808
,180
) (4
1,29
9)
(26,
517)
(15,
640,
906)
(5
75,4
01)
(291
,980
) (1
05,2
69)
(266
,428
) (1
,120
,396
) (1
7,84
4)
-
(20,
000,
819)
Net
Boo
k Va
lue
534
,811
7
2,15
1
3,08
0,28
2
851
-
1
0,73
0,22
2
573,
714
1
65,4
62
92,
946
1
64,6
00
399
,175
2
,350
2,
002,
191
17
,818
,755
Year
end
ed D
ecem
ber
31, 2
013
Ope
ning
Net
Boo
k Va
lue
534
,811
7
2,15
1
3,08
0,28
2
851
-
1
0,73
0,22
2
573,
714
1
65,4
62
92,
946
1
64,6
00
399
,175
2
,350
2,
002,
191
17
,818
,755
Add
ition
s -
-
4
18,1
68
-
-
1
,056
,589
2
88,7
39
434
,910
1
10,0
31
97,
134
2
22,3
74
1,9
02
2,25
4,91
2
4,8
84,7
59
Dis
posa
ls
C
ost
-
-
(17,
127)
-
-
(1
22)
-
(1
9,90
1)
(4,2
07)
(43,
370)
(1
2,67
5)
-
-
(97,
402)
D
epre
ciat
ion
-
-
-
-
-
5
0
-
1
5,33
5
3,5
73
43,
370
1
2,49
9
-
-
74,
827
-
-
(17,
127)
-
-
(7
2)
-
(4
,566
) (6
34)
-
(1
76)
-
-
(22,
575)
Tran
sfer
s -
-
-
-
-
-
-
-
-
-
-
-
(2,6
08,7
94)
(2,6
08,7
94)
Dep
reci
atio
n C
harg
e -
(14,
071)
(2
09,7
65)
(106
) -
(834
,957
) (2
34,2
28)
(97,
285)
(2
6,27
4)
(56,
356)
(1
53,6
03)
(1,3
12)
-
(1,
627,
957)
Clo
sing
Net
Boo
k Va
lue
534
,811
5
8,08
0
3,27
1,55
8
745
-
1
0,95
1,78
2
628,
225
4
98,5
21
176
,069
2
05,3
78
467
,770
2
,940
1,
648,
309
18
,444
,188
As
at J
anua
ry 1
, 201
4
Cos
t
534
,811
1
78,7
50
5,2
89,5
03
42,
150
2
6,51
7 2
7,42
7,59
5 1
,437
,854
8
72,4
51
304
,039
4
84,7
92
1,7
29,2
70
22,
096
1,6
48,3
09
39,
998,
137
Acc
umul
ated
dep
reci
atio
n -
(120
,670
) (2
,017
,945
) (4
1,40
5)
(26,
517)
(16,
475,
813)
(8
09,6
29)
(373
,930
) (1
27,9
70)
(279
,414
) (1
,261
,500
) (1
9,15
6)
-
(21,
553,
949)
Net
Boo
k Va
lue
534
,811
5
8,08
0
3,27
1,55
8
745
-
1
0,95
1,78
2
628,
225
4
98,5
21
176
,069
2
05,3
78
467
,770
2
,940
1,
648,
309
18
,444
,188
Year
end
ed D
ecem
ber
31, 2
014
Ope
ning
Net
Boo
k Va
lue
534
,811
5
8,08
0
3,27
1,55
8
745
-
1
0,95
1,78
2
628,
225
4
98,5
21
176
,069
2
05,3
78
467
,770
2
,940
1,
648,
309
18
,444
,188
Add
ition
s 9
,436
-
306
,957
2
16,2
40
-
1,3
81,1
34
583
,853
9
8,83
9
48,
136
1
08,3
01
254
,171
1
,434
2,
640,
753
5
,649
,254
Dis
posa
ls
C
ost
-
-
(1
,578
) -
-
(8
,672
) (2
13,7
69)
(18,
149)
(1
,238
) (3
9,63
0)
(16,
994)
-
-
(3
00,0
30)
D
epre
ciat
ion
-
-
1,0
51
-
-
2,1
73
213
,769
1
7,85
4
1,2
09
34,
957
1
6,80
6
-
-
287
,819
-
-
(527
) -
-
(6
,499
) -
(295
) (2
9)
(4,6
73)
(188
) -
-
(1
2,21
1)
Tran
sfer
s -
-
-
-
-
-
-
-
-
-
-
-
(2,1
79,1
62)
(2,1
79,1
62)
Adj
ustm
ents
C
ost
-
-
(1
,733
,407
) 1,7
33,4
07
-
-
-
-
-
-
-
-
-
-
A
ccum
ulat
ed d
epre
ciat
ion
-
-
108
,459
(1
08,4
59)
-
-
-
-
-
-
-
-
-
-
-
-
(1
,624
,948
) 1,6
24,9
48
-
-
-
-
-
-
-
-
-
-
Dep
reci
atio
n C
harg
e -
(14,
072)
(1
34,2
05)
(91,
880)
-
(887
,061
) (2
67,7
60)
(105
,214
) (2
9,03
1)
(69,
360)
(2
08,1
27)
(1,4
61)
-
(1,
808,
171)
Bal
ance
as
at D
ecem
ber
31, 2
014
544
,247
4
4,00
8
1,81
8,83
5 1
,750
,053
-
1
1,43
9,35
6
944,
318
4
91,8
51
195
,145
2
39,6
46
513
,626
2
,913
2,
109,
900
20
,093
,898
As
at D
ecem
ber
31, 2
014
Cos
t
544
,247
1
78,7
50
3,8
61,4
75
1,99
1,79
7
26,
517
28,
800,
057
1,8
07,9
38
953
,141
3
50,9
37
553
,463
1
,966
,447
2
3,53
0 2
,109
,900
4
3,16
8,19
9
Acc
umul
ated
dep
reci
atio
n -
(134
,742
) (2
,042
,640
) (2
41,7
44)
(26,
517)
(17,
360,
701)
(8
63,6
20)
(461
,290
) (1
55,7
92)
(313
,817
) (1
,452
,821
) (2
0,61
7)
-
(23,
074,
301)
Net
Boo
k Va
lue
544
,247
4
4,00
8
1,81
8,83
5 1
,750
,053
-
1
1,43
9,35
6
944,
318
4
91,8
51
195
,145
2
39,6
46
513
,626
2
,913
2,
109,
900
20
,093
,898
Rat
e of
dep
reci
atio
n /
amor
tisat
ion
in %
-
61/
4 to
91/
4 5
to 1
0 5
5 5
20
15
10
20
15 -
33
1/3
30
-
-
Bui
ldin
gs a
nd
Bui
ldin
gs a
nd
O
ffice
and
C
apita
l wor
k
Fr
eeho
ld
Leas
ehol
d st
ruct
ures
on
stru
ctur
es o
n R
ailw
ay
Plan
t and
C
atal
ysts
el
ectri
cal
Furn
iture
Ve
hicl
es
Mai
nten
ance
and
Li
brar
y in
pro
gres
s To
tal
land
la
nd
freeh
old
land
le
aseh
old
land
si
ding
m
achi
nery
equi
pmen
t an
d fix
ture
s
othe
r equ
ipm
ent
book
s (n
ote
15.3
)
(Rup
ees
‘000
)
15
. P
RO
PE
RT
Y, P
LA
NT
AN
D E
QU
IPM
EN
T
Notes to and forming part of the Financial Statementsfor the year ended December 31, 2014

Financial Statements of Fauji Fertilizer Company Limited 2014
107
107
2014 2013 Note (Rupees ‘000)
15.1 Depreciation charge has been allocated as follows: Cost of sales 29 1,717,142 1,538,622 Distribution cost 30 73,479 72,024 Charged to FFBL under Inter Company Services Agreement 17,550 17,311
1,808,171 1,627,957
15.2 Details of property, plant and equipment disposed off:
Mode of Original Book Sale Description disposal Cost value proceeds ( Rupees ‘000 )
Office and electrical equipment, furniture and
fixture and maintenance and other equipment
EFU Insurance Insurance claim 16,989 11,282 22,115
Aggregate of other items of property, plant and
equipment with individual book values not
exceeding Rs 50 thousand 283,041 929 23,171
2014 300,030 12,211 45,286
2013 97,402 22,575 49,583
2014 2013 Note (Rupees ‘000)
15.3 Capital Work in Progress Civil works including mobilization advance 220,820 360,579 Plant and machinery including advances to suppliers 1,889,080 1,282,190 Intangible assets under development – 5,540 2,109,900 1,648,309
16. INTANGIBLE ASSETS Computer software 16.1 41,970 82,358 Goodwill 16.2 1,569,234 1,569,234 1,611,204 1,651,592
16.1 Computer software Balance at the beginning 82,358 109,405 Additions during the year 8,802 19,304 Amortisation charge for the year (49,190) (46,351) Balance at the end 41,970 82,358 Amortisation rate 33 1/3% 33 1/3% Amortisation charge has been allocated as follows: Cost of sales 29 37,484 31,762 Distribution cost 30 11,706 14,589 49,190 46,351
Notes to and forming part of the Financial Statementsfor the year ended December 31, 2014

108
108
16.2 Goodwill
This represents excess of the amount paid over fair value of net assets of Pak Saudi Fertilizer Company Limited (PSFL) on its acquisition. The recoverable amount of goodwill was tested for impairment by allocating the amount of goodwill to respective assets on which it arose, based on value in use in accordance with IAS-36 “Impairment of Assets”. The value in use calculations are based on cash flow projections. These are then extrapolated for a period of 5 years using a steady long term expected demand growth of 2% and terminal value determined based on long term earning multiples. The cash flows are discounted using a discount rate of 16.4%. Based on this calculation no impairment is required to be accounted for against the carrying amount of goodwill.
2014 2013 Note (Rupees ‘000)
17. LONG TERM INVESTMENTS Investment in Associated Companies (Quoted) - at cost Fauji Cement Company Limited (FCCL) 17.1 1,500,000 1,500,000 Fauji Fertilizer Bin Qasim Limited (FFBL) 17.2 4,658,919 – Askari Bank Limited (AKBL) 17.3 10,461,921 – Investment in joint venture (Unquoted) - at cost Pakistan Maroc Phosphore S.A., Morocco (PMP) 17.4 705,925 705,925 Investment in Subsidiary Companies - at cost Quoted: Fauji Fertilizer Bin Qasim Limited (FFBL) 17.2 – 4,752,330 Askari Bank Limited (AKBL) 17.3 – 10,461,921 Unquoted: FFC Energy Limited (FFCEL) 17.5 2,438,250 2,438,250 Fauji Fresh n Freeze Limited (FFFL) - Formerly Al-Hamd Foods Limited (AHFL) 17.6 1,035,500 585,500 Investments available for sale 17.7 Certificates of Investment 113,868 118,239 Pakistan Investment Bonds 7,178,198 59,497 Term Finance Certificates 99,500 96,000 7,391,566 273,736 28,192,081 20,717,662 Less: Current portion shown under short term investments Investments available for sale Certificates of Investment 27,094 26,005 Pakistan Investment Bonds 30,467 29,125 Term Finance Certificates – – 26 57,561 55,130 28,134,520 20,662,532
17.1 Investment in FCCL - at cost
Investment in FCCL represents 93,750 thousand fully paid ordinary shares of Rs 10 each representing 6.79% of its share capital as at December 31, 2014. The Company is committed not to dispose off its investment in FCCL so long as the loan extended to FCCL by Faysal Bank Limited, remains outstanding or without prior consent of FCCL. Market value of the Company’s investment as at December 31, 2014 was Rs 2,422,500 thousand (2013: Rs 1,495,313 thousand).
17.2 Investment in FFBL - at cost
Investment in FFBL represents 465,892 thousand fully paid ordinary shares of Rs 10 each representing 49.88% of FFBL’s share capital as at December 31, 2014. Market value of the Company’s investment as at December 31, 2014 was Rs 21,062,973 thousand (2013: Rs 20,819,958 thousand; 475,233 thousand fully paid ordinary shares of Rs 10 each representing 50.88% of FFBL’s share capital).
Notes to and forming part of the Financial Statementsfor the year ended December 31, 2014

Financial Statements of Fauji Fertilizer Company Limited 2014
109
109
During the year, 1% equity of FFBL aggregating to 9,341,100 ordinary shares, held by FFC, sold to FF on October 03, 2014 at the closing market price.
Further, FFC irrevocably appointed FF as its proxy, to represent FFC in the general meetings of FFBL and AKBL allowing FF to vote for and on behalf of FFC and resolved that representatives of FF may be elected or co-opted or appointed on the Board of Directors of FFBL and AKBL, as nominated by FF. This resulted in loss of control of FFBL and AKBL. Accordingly, the status of FFBL and AKBL has changed to associated companies of FFC.
17.3 Investment in AKBL - at cost
Investment in AKBL represents 543,768 thousand fully paid ordinary shares of Rs 10 each representing 43.15% (2013: 43.15%) of AKBL’s share capital. Market value of the Company’s investment as at December 31, 2014 was Rs 12,544,728 thousand (2013: Rs 7,613,315). Pursuant to sale of 1% equity of Fauji Fertilizer Bin Qasim Limited (FFBL) and issuance of irrevocable proxies as referred to above in note 17.2, the status of AKBL has been changed from subsidiary to associate.
17.4 Investment in joint venture - at cost
The Company has 12.5% equity participation in PMP, amounting to Moroccan Dirhams (MAD) 100,000 thousand equivalent to Rs 705,925 thousand. PMP is a joint venture between the Company, Fauji Foundation, FFBL and Office Cherifien Des Phosphates, Morocco. The principal activity of PMP is to manufacture and market Phosphoric acid, fertilizer and other related products in Morocco and abroad.
According to the Shareholders’ agreement, if any legal restriction is laid on dividends by PMP, the investment will be converted to interest bearing loan. The Company has also committed not to pledge shares of PMP without prior consent of PMPs’ lenders.
17.5 Investment in FFCEL - at cost
FFCEL is presently a wholly owned subsidiary of FFC. Investment in FFCEL represents 243,825 thousand fully paid ordinary shares of Rs 10 each. FFCEL has been incorporated for the purpose of implementing a project comprising establishment and operation of wind power generation facility and supply of electricity. The Company currently holds 100% shareholding interest in FFCEL, out of which 70,000 shares amounting to Rs 700 thousand are held in the name of seven nominee directors of the Company in FFCEL.
17.6 Investment in FFFL (formerly AHFL) - at cost
Investment in FFFL represents 93,937 thousand fully paid ordinary shares of Rs 10 each. The Company currently holds 100% shareholding interest in FFFL, out of which 7,000 shares amounting to Rs 70 thousand are held in the name of seven nominee directors of the Company.
17.7 Investments available for sale
Certificates of Investment (COI)
These represent placements in Certificates of Investment / Term deposits receipts of financial institution for periods ranging from one to five years having returns in the range of 7.58% to 12.32% per annum (2013: 7.58% to 14.18% per annum). Cost of these investments at year end amounted to Rs 113,868 thousand (2013: Rs 118,239 thousand). Pakistan Investment Bonds (PIBs)
PIBs ranging from 3 to 7 years were purchased and are due to mature within a period of 5 years. Profit is receivable on half yearly basis with coupon rates ranging from 11.25% to 11.75% per annum (2013: 8% to 11.75% per annum). Cost of these investments at year end amounted to Rs 6,710,676 thousand (2013: Rs 39,576 thousand).
Term Finance Certificates (TFCs)
These include 20,000 certificates of Rs 5,000 each of Engro Fertilizer Limited (EFL). Profit is receivable on half yearly basis at the rate of six months’ KIBOR + 1.55% per annum. Cost of these investments at year end amounted to Rs 100,000 thousand (2013: Rs 100,000 thousand).
Notes to and forming part of the Financial Statementsfor the year ended December 31, 2014

110
110
2014 2013 Note (Rupees ‘000)
18. LONG TERM LOANS AND ADVANCES - SECURED Loans and advances - considered good, to: Executives 769,788 693,808 Other employees 338,839 285,950 1,108,627 979,758 Less: Amount due within twelve months, shown under current loans and advances 23 285,439 239,350 823,188 740,408
18.1 Reconciliation of carrying amount of loans and advances: Other 2014 2013
Executives employees Total Total
(Rupees ‘000) Balance at January 1 693,808 285,950 979,758 939,698 Disbursements 346,518 127,156 473,674 427,975 1,040,326 413,106 1,453,432 1,367,673 Repayments 270,538 74,267 344,805 387,915 Balance at December 31 769,788 338,839 1,108,627 979,758
These represent secured house building loans, house rent advances and advances pursuant to agreement with employees which are repayable within one to ten years. House building loans carry mark - up at 7% per annum.
The maximum amount of loans and advances to executives outstanding at the end of any month during the year was Rs 772,804 thousand (2013: Rs 769,035 thousand).
2014 2013 Note (Rupees ‘000)
19. LONG TERM DEPOSITS AND PREPAYMENTS Deposits 12,388 2,092 Prepayments 3,236 562 15,624 2,654
20. STORES, SPARES AND LOOSE TOOLS Stores 266,801 271,818 Spares 3,127,230 2,921,028 Provision for slow moving spares 20.1 (390,866) (332,172) 2,736,364 2,588,856 Loose tools 132 108 Items in transit 311,526 383,863 3,314,823 3,244,64520.1 Movement of Provision for slow moving spares Balance at the beginning 332,172 302,164 Provision during the year 58,694 30,008 Balance at the end 390,866 332,172
21. STOCK IN TRADE Raw materials 223,630 153,461 Work in process 64,860 67,903 Finished goods - manufactured urea 584,930 71,424 - purchased fertilizer 21,504 – Stocks in transit 86,826 9,169 981,750 301,957
Notes to and forming part of the Financial Statementsfor the year ended December 31, 2014

Financial Statements of Fauji Fertilizer Company Limited 2014
111
111
2014 2013 Note (Rupees ‘000)
22. TRADE DEBTS
Considered good: Secured 772,417 622,725 Unsecured 50,043 77,816 Considered doubtful 1,758 1,758 824,218 702,299 Provision for doubtful debts (1,758) (1,758) 822,460 700,541 22.1 These debts are secured by way of bank guarantees.
23. LOANS AND ADVANCES Current portion of long term loans and advances 18 285,439 239,350 Loans and advances to employees - unsecured - considered good - Executives 55,019 385,981 - Others 28,905 107,771 Advance to subsidiary company - FFC Energy Limited 23.1 540,386 – Advances to suppliers - considered good 149,005 188,358 1,058,754 921,460
23.1 This represents aggregate unsecured advance to subsidiary company under a revolving credit facility upto an amount of Rs 1,500,000 thousand to meet debt servicing obligations and other working capital requirements. This carries markup at 1 month KIBOR+60bps. The maximum outstanding amount at the end of any month during the year was Rs 540,386 thousand (2013: Nil).
2014 2013
Note (Rupees ‘000)
24. DEPOSITS AND PREPAYMENTS Deposits 966 956 Prepayments 25,410 36,269 26,376 37,225
25. OTHER RECEIVABLES Accrued income on investments and bank deposits 534,777 166,219 Sales tax receivable related to PSFL 42,486 42,486 Advance tax 25.1 322,368 322,368 Receivable from Workers’ Profit Participation Fund - unsecured 25.2 55,300 59,495 Receivable from subsidiary companies 25.3 Fauji Fresh n Freeze Limited (formerly AHFL) - unsecured 116 10,448 FFC Energy Limited - unsecured 14,445 118,989 Due from Gratuity Fund 28,090 – Due from Pension Fund 59,019 9,759 Other receivables considered good 15,860 70,158 considered doubtful 2,232 2,232 Provision for doubtful receivables (2,232) (2,232) 15,860 70,158 1,072,461 799,922
Notes to and forming part of the Financial Statementsfor the year ended December 31, 2014

112
112
25.1 This represents tax paid by PSFL in excess of admitted tax liabilities net of adjustments of determined refunds. The Company intends to adjust the remaining amount after finalisation of pending re-assessments by the taxation authorities.
2014 2013
Note (Rupees ‘000)
25.2 Workers’ Profit Participation Fund (WPPF)
Balance at beginning 59,495 69,919
Allocation for the year (1,409,278) (1,580,082)
Adjustment for prior years – (6,790)
Receipt from fund 25.2.1 (69,917) (73,552)
Payment to fund 1,475,000 1,650,000
55,300 59,495
25.2.1 This represents amount paid to WPPF in prior years’ in excess of the Company’s obligation.
25.3 The maximum amount of receivable from Fauji Fresh n Freeze Limited and FFC Energy Limited during the
year was Rs 77,116 thousand (2013: Rs 10,448 thousand) and Rs 96,418 thousand (2013: Rs 747,257)
respectively.
2014 2013
Note (Rupees ‘000)
26. SHORT TERM INVESTMENTS
Term deposits with banks and financial institutions
Loans and receivables 26.1
Local currency - Net of provision for doubtful recovery
Rs 3,900 thousand (2013: Rs 3,900 thousand) 25,400,000 17,420,000
Foreign currency 1,309,818 1,335,731
26,709,818 18,755,731
Investments at fair value through profit or loss 26.2
Meezan Balanced Fund 167,979 142,000
Market Treasury Bills 489,380 –
KASB Cash Fund 8,099 7,434
665,458 149,434
Current maturity of long term investments
Available for sale 17 57,561 55,130
27,432,837 18,960,295
26.1 These represent investments having maturities ranging between 1 to 12 months and are being carried at cost
as management expects there would be insignificant change in the rate of returns on comparable investments.
Term deposits receipts amounting to Rs 500,000 thousand (2013: Rs 2,000,000 thousand) are under lien of an
Islamic financial institution in respect of Istisna facility availed.
26.2 Fair values of these investments are determined using quoted market / repurchase price.
Notes to and forming part of the Financial Statementsfor the year ended December 31, 2014

Financial Statements of Fauji Fertilizer Company Limited 2014
113
113
2014 2013
(Rupees ‘000)
27. CASH AND BANK BALANCES
At banks
Deposit accounts
Local currency 1,169,384 1,358,530
Foreign currency (US$ 29,000; 2013: US$ 7,000) 2,919 751
1,172,303 1,359,281
Cash in hand 1,464 2,370
1,173,767 1,361,651
27.1 Balances with banks include Rs 653,943 thousand (2013: Rs 567,735 thousand) in respect of security deposits received.
27.2 Balances with banks carry markup ranging from 5% to 10% (2013: 5% to 10.25%) per annum.
28. SALES
Sales include Rs 8,734,079 thousand (2013: Rs 4,774,850 thousand) in respect of sale of purchased fertilizers and are exclusive of sales tax of Rs 14,188,461 thousand (2013: Rs 13,484,281 thousand).
2014 2013 Note (Rupees ‘000)
29. COST OF SALES Raw materials consumed 24,372,474 18,614,731 Fuel and power 7,707,652 6,817,258 Chemicals and supplies 366,674 377,799 Salaries, wages and benefits 5,002,549 4,070,292 Training and employees welfare 833,770 708,160 Rent, rates and taxes 13,533 21,644 Insurance 184,768 197,739 Travel and conveyance 29.1 478,674 390,715 Repairs and maintenance (includes stores and spares consumed of Rs 1,239,353 thousand; (2013: Rs 1,267,633 thousand) 1,357,448 1,406,520 Depreciation 15.1 1,717,142 1,538,622 Amortisation 16.1 37,484 31,762 Communication and other expenses 29.2 1,627,187 1,827,762 43,699,355 36,003,004 Opening stock - work in process 67,903 45,216 Closing stock - work in process (64,860) (67,903) 3,043 (22,687) Cost of goods manufactured 43,702,398 35,980,317 Opening stock of manufactured urea 71,424 80,055 Closing stock of manufactured urea (584,930) (71,424) (513,506) 8,631 Cost of sales - own manufactured urea 43,188,892 35,988,948 Opening stock of purchased fertilizers – 274,029 Purchase of fertilizers for resale 6,969,361 3,685,595 6,969,361 3,959,624 Closing stock of purchased fertilizers (21,504) – Cost of sales - purchased fertilizers 6,947,857 3,959,624 50,136,749 39,948,572
Notes to and forming part of the Financial Statementsfor the year ended December 31, 2014

114
114
29.1 These include operating lease rentals amounting to Rs 45,478 thousand (2013: Rs 41,670 thousand).
29.2 This includes provision for slow moving spares amounting to Rs 58,694 thousand (2013: Rs 30,008 thousand).
2014 2013
Note (Rupees ‘000)
30. DISTRIBUTION COST
Product transportation 3,970,241 3,797,513
Salaries, wages and benefits 1,322,121 1,311,875
Training and employees welfare 80,924 82,640
Rent, rates and taxes 105,131 101,768
Technical services to farmers 14,795 10,558
Travel and conveyance 30.1 198,186 162,629
Sale promotion and advertising 190,876 123,027
Communication and other expenses 394,451 420,259
Warehousing expenses 69,757 70,398
Depreciation 15.1 73,479 72,024
Amortisation 16.1 11,706 14,589
6,431,667 6,167,280
30.1 These include operating lease rentals amounting to Rs 130,420 thousand (2013: Rs 110,477 thousand).
2014 2013
(Rupees ‘000)
31. FINANCE COST
Mark-up on long term borrowings 567,836 502,496
Mark-up on short term borrowings 173,538 168,689
Bank and other charges 19,669 85,030
Exchange loss 87,897 –
848,940 756,215
32. OTHER EXPENSES
Research and development 355,424 372,447
Workers’ Profit Participation Fund (WPPF) 1,409,278 1,580,082
Workers’ Welfare Fund 535,526 603,028
Auditors’ remuneration
Audit fee 1,650 1,500
Fee for half yearly review, audit of consolidated financial statements &
review of Code of Corporate Governance 804 730
Out of pocket expenses 255 150
2,709 2,380
2,302,937 2,557,937
In addition to the auditor’s remuneration above, communication and other expenses stated in note 29 and note
30 include Rs 26,384 thousand (2013: Rs 8,145 thousand) on account of fee for taxation services and audit of
employees’ funds.
Notes to and forming part of the Financial Statementsfor the year ended December 31, 2014

Financial Statements of Fauji Fertilizer Company Limited 2014
115
115
2014 2013 (Rupees ‘000)
33. OTHER INCOME Income from financial assets Income on loans, deposits and investments 1,651,851 1,310,555 Gain on re-measurement of investments classified as fair value through profit or loss 34,622 231,194 Dividend income – 92,689 Exchange gain – 119,313 Gain on disposal of FFBL shares 281,728 – Income from subsidiary Commission on sale of FFBL products – 19,979 Dividend from FFBL 1,544,507 2,376,165 Dividend from AKBL 543,768 – Income from associates Dividend from FFBL 349,419 – Dividend from FCCL 140,625 117,188 Income from non-financial assets Gain on disposal of property, plant and equipment 33,075 27,008 Commission on sale of FFBL products 18,185 – Other income Scrap sales 19,373 10,689 Others 103,713 63,161 4,720,866 4,367,941 34. PROVISION FOR TAXATION Current tax 7,866,979 9,195,000 Deferred tax 203,021 89,000 8,070,000 9,284,000 Reconciliation between tax expense and accounting profit Accounting profit before taxation 26,240,760 29,418,548 2014 2013 % % Applicable tax rate 33.00 34.00 Tax effect of income that is exempt or taxable at reduced rates (2.61) (2.38) Effect of change in tax rate 0.38 (0.32) Others (0.02) 0.26 Average effective tax rate charged on income 30.75 31.56
Notes to and forming part of the Financial Statementsfor the year ended December 31, 2014

116
116
2014 2013
35. EARNINGS PER SHARE - Basic and diluted
Net profit after tax (Rupees ‘000) 18,170,760 20,134,548
Weighted average number of shares in issue (‘000) 1,272,238 1,272,238
Basic and diluted earnings per share (Rupees) 14.28 15.83
There is no dilutive effect on the basic earnings per share of the Company.
36. REMUNERATION OF CHIEF EXECUTIVE, DIRECTORS AND EXECUTIVES
The aggregate amounts charged in these financial statements in respect of remuneration including benefits
applicable to the chief executive, directors and executives of the Company are given below:
2014 2013 Chief Executive Chief Executive Executive Executive
(Rupees ‘000) (Rupees ‘000)
Managerial remuneration 8,561 1,445,955 7,510 1,231,613
Contribution to provident fund 615 90,516 518 77,355
Bonus and other awards 3,703 1,766,538 5,261 1,344,210
Allowances and contribution to retirement benefit plans 6,398 1,102,304 8,738 942,546
Total 19,277 4,405,313 22,027 3,595,724
No. of person(s) 1 723 1 623
The above were provided with medical facilities; the chief executive and certain executives were also provided
with some furnishing items and vehicles in accordance with the Company’s policy. Gratuity is payable to the chief
executive in accordance with the terms of employment while contributions for executives in respect of gratuity
and pension are based on actuarial valuations. Leave encashment of Rs 43,480 thousand (2013: Rs 58,749
thousand) were paid to executives on separation, in accordance with the Company’s policy.
In addition, 18 (2013: 14) directors were paid aggregate fee of Rs 5,570 thousand (2013: Rs 5,125 thousand).
Notes to and forming part of the Financial Statementsfor the year ended December 31, 2014

Financial Statements of Fauji Fertilizer Company Limited 2014
117
117
2014 2013
(Rupees ‘000)
37. CASH GENERATED FROM OPERATIONS
Net profit before taxation 26,240,760 29,418,548
Adjustments for:
Depreciation and amortisation 1,839,811 1,656,997
Provision for slow moving spares 58,694 30,008
Finance cost 848,940 756,215
Income on loans, deposits and investments (1,651,851) (1,310,555)
Gain on remeasurement of investments classified at fair value
through profit or loss (34,622) (231,194)
Dividend income (2,578,319) (2,586,042)
Exchange gain – (119,313)
Gain on disposal of FFBL shares (281,728) –
Gain on disposal of property, plant and equipment (33,075) (27,008)
(1,832,150) (1,830,892)
24,408,610 27,587,656
Changes in working capital
(Increase) / decrease in current assets
Stores and spares (128,872) (175,715)
Stock in trade (679,793) 140,182
Trade debts (121,919) 2,910,935
Loans and advances (137,294) (243,483)
Deposits and prepayments 10,849 (11,314)
Other receivables 183,128 (133,429)
Increase in current liabilities
Trade and other payables 15,648,348 5,694,715
14,774,447 8,181,891
Changes in long term loans and advances (82,780) (39,622)
Changes in long term deposits and prepayments (12,970) 2,457
Changes in deferred liabilities 104,350 51,509
39,191,657 35,783,891
38. CASH AND CASH EQUIVALENTS
Cash and bank balances 1,173,767 1,361,651
Short term borrowings (11,602,443) (7,000,000)
Short term highly liquid investments 25,709,818 18,650,951
15,281,142 13,012,602
Notes to and forming part of the Financial Statementsfor the year ended December 31, 2014

118
118
39. FINANCIAL INSTRUMENTS AND RISK MANAGEMENT
39.1 Financial instruments by category
December 31, 2014 Loans and Available Fair value receivables for sale through profit Total investments or loss
(Rupees ‘000)
Financial assets Maturity up to one year Trade debts - net of provision 822,460 – – 822,460 Loans and advances 909,749 – – 909,749 Deposits 966 – – 966 Other receivables 565,198 – – 565,198 Short term investments 26,709,818 57,561 665,458 27,432,837 Cash and bank balances 1,173,767 – – 1,173,767 Maturity after one year Long term investments – 7,334,005 – 7,334,005 Long term loans and advances 823,188 – – 823,188 Deposits 12,388 – – 12,388 31,017,534 7,391,566 665,458 39,074,558
Other financial Total liabilities
(Rupees ‘000)
Financial liabilities Maturity up to one year Trade and other payables 29,243,800 29,243,800 Interest and mark-up accrued 30,117 30,117 Current portion of long term borrowings 1,780,000 1,780,000 Short term borrowings 11,602,443 11,602,443 Maturity after one year Long term borrowings 2,500,000 2,500,000 45,156,360 45,156,360
December 31, 2013 Loans and Available Fair value receivables for sale through profit Total investments or loss
(Rupees ‘000)
Financial assets Maturity up to one year Trade debts - net of provision 700,541 - - 700,541 Loans and advances 733,102 - - 733,102 Deposits 956 - - 956 Other receivables 365,814 - - 365,814 Short term investments 18,755,731 55,130 149,434 18,960,295 Cash and bank balances 1,361,651 - - 1,361,651 Maturity after one year Other long term investments - 218,606 - 218,606 Long term loans and advances 740,408 - - 740,408 Deposits 2,092 - - 2,092 22,660,295 273,736 149,434 23,083,465
Notes to and forming part of the Financial Statementsfor the year ended December 31, 2014

Financial Statements of Fauji Fertilizer Company Limited 2014
119
119
Other financial Total liabilities
(Rupees ‘000)
Financial liabilities Maturity up to one year Trade and other payables 13,548,266 13,548,266 Interest and mark-up accrued 22,098 22,098 Current portion of long term borrowings 1,460,000 1,460,000 Short term borrowings 7,000,000 7,000,000 Maturity after one year Long term borrowings 4,280,000 4,280,000 26,310,364 26,310,364
39.2 Credit quality of financial assets
The credit quality of company’s financial assets have been assessed below by reference to external credit rating of counterparties determined by the Pakistan Credit Rating Agency Limited (PACRA) and JCR - VIS Credit Rating Company Limited (JCR - VIS). The counterparties for which external credit ratings were not available have been assessed by reference to internal credit ratings determined based on their historical information for any default in meeting obligations.
2014 2013 Rating (Rupees ‘000)
Trade Debts
Counterparties without external credit ratings
Existing customers with no default in the past 822,460 700,541
Loans and advances
Counterparties without external credit ratings
Loans and advances to employees 369,363 733,102
Loan to subsidiary company 540,386 –
909,749 733,102
Deposits
Counterparties without external credit ratings
Others 13,354 3,048
Other receivables
Counterparties with external credit ratings A1 + 438,517 127,928
A1 96,260 38,291
Counterparties without external credit ratings
Advances to related parties 14,561 129,437
Others 15,860 70,158
565,198 365,814
Short term investments
Counterparties with external credit ratings A1 + 23,824,739 15,418,578
A1 3,608,099 2,741,717
A2 – 800,000
27,432,838 18,960,295
Bank balances
Counterparties with external credit ratings A1 + 997,166 1,088,383
A1 175,137 270,898
1,172,303 1,359,281
Notes to and forming part of the Financial Statementsfor the year ended December 31, 2014

120
120
39.3 Financial risk factors
The Company has exposures to the following risks from its use of financial instruments:
- Credit risk; - Liquidity risk; and - Market risk. The Board of Directors has overall responsibility for the establishment and oversight of the Company’s risk
management framework. The Board is also responsible for developing and monitoring the Company’s risk management policies.
The Company’s risk management policies are established to identify and analyze the risks faced by the Company,
to set appropriate risk limits and controls, and to monitor risks and adherence to limits. Risk management policies and systems are reviewed regularly to reflect changes in market conditions and the Company’s activities. The Company, through its training and management standards and procedures, aims to develop a disciplined and constructive control environment in which all employees understand their roles and obligations.
The Audit Committee oversees how management monitors compliance with the Company’s risk management
policies and procedures, and reviews the adequacy of the risk management framework in relation to the risks faced by the Company. The Audit Committee is assisted in its oversight role by Internal Audit. Internal Audit undertakes both regular and ad hoc reviews of risk management controls and procedures, the results of which are reported to the Audit Committee.
a) Credit risk
Credit risk is the risk of financial loss to the Company if a customer or counterparty to a financial instrument fails to meet its contractual obligations, and arises principally from investments, loans and advances, deposits, trade debts, other receivables, short term investments and bank balances. The carrying amount of financial assets represents the maximum credit exposure. The maximum exposure to credit risk at the reporting date was:
2014 2013 (Rupees ‘000)
Long term investments 7,334,005 218,606
Loans and advances 1,732,937 1,473,510
Deposits 13,354 3,048
Trade debts - net of provision 822,460 700,541
Other receivables - net of provision 565,198 365,814
Short term investments - net of provision 27,432,837 18,960,295
Bank balances 1,172,303 1,359,281
39,073,094 23,081,095
2014 2013 Rating (Rupees ‘000)
Long term investments
Counterparties with external credit ratings AA - 6,722,322 96,000
AA 611,683 92,234
AA + – 30,372
7,334,005 218,606
Long term loans and advances
Counterparties without external credit ratings
Loans and advances to employees 823,188 740,408
Notes to and forming part of the Financial Statementsfor the year ended December 31, 2014

Financial Statements of Fauji Fertilizer Company Limited 2014
121
121
Geographically there is no concentration of credit risk. The maximum exposure to credit risk for trade debts at the reporting date is with dealers within the country . The Company’s most significant amount receivable is from a bank which amounts to Rs 6,000,000 thousand
(2013: Rs 6,220,038 thousand). This is included in total carrying amount of investments as at reporting date.
Trade debts amounting to Rs 772,417 thousand (2013: Rs 622,725 thousand) are secured against letter of
guarantee. The Company has placed funds in financial institutions with high credit ratings. The Company assesses the credit quality of the counter parties as satisfactory. The Company does not hold any collateral as security against any of its financial assets other than trade debts.
The Company limits its exposure to credit risk by investing only in liquid securities and only with counterparties
that have high credit rating. Management actively monitors credit ratings and given that the Company only has invested in securities with high credit ratings, management does not expect any counterparty to fail to meet its obligations.
Impairment losses
The aging of trade debts at the reporting date was: Gross Impairment Gross Impairment 2014 2014 2013 2013
(Rupees ‘000)
Not yet due 748,271 – 680,304 –
Past due 1-30 days 50,926 – 20,230 –
Past due 31-60 days 23,263 – 7 –
Past due 61-90 days – – – –
Over 90 days 1,758 1,758 1,758 1,758
824,218 1,758 702,299 1,758
Based on past experience, the management believes that no impairment allowance is necessary in respect of trade debts.
b) Liquidity risk
Liquidity risk is the risk that the Company will not be able to meet its financial obligations as they fall due. The Company’s approach to managing liquidity is to ensure, as far as possible, that it will always have sufficient liquidity to meet its liabilities when due, under both normal and stressed conditions, without incurring unacceptable losses or risking damage to the Company’s reputation. The Company uses different methods which assists it in monitoring cash flow requirements and optimizing its cash return on investments. Typically the Company ensures that it has sufficient cash on demand to meet expected operational expenses for a reasonable period, including the servicing of financial obligation; this excludes the potential impact of extreme circumstances that cannot reasonably be predicted, such as natural disasters. In addition, the Company maintain lines of credit as mentioned in note 13 to the financial statements.
Notes to and forming part of the Financial Statementsfor the year ended December 31, 2014

122
122
The following are the contractual maturities of financial liabilities, including expected interest payments and
excluding the impact of netting agreements: Carrying Contractual Six months Six to twelve One to Two to Five years
amount cash flows or less months two years five years onwards
2014 (Rupees ‘000)
Long term borrowings 4,287,333 5,111,551 1,132,872 1,065,226 1,610,427 1,303,026 –
Trade and other payables 29,243,800 29,243,800 29,243,800 – – – –
Short term borrowings 11,625,227 11,795,110 9,675,300 2,119,810 – – –
45,156,360 46,150,461 40,051,972 3,185,036 1,610,427 1,303,026 –
Carrying Contractual Six months Six to twelve One to Two to Five years
amount cash flows or less months two years five years onwards
2013 (Rupees ‘000)
Long term borrowings 5,749,222 7,300,334 1,062,825 1,045,412 2,260,769 2,931,328 –
Trade and other payables 13,548,266 13,548,266 13,548,266 – – – –
Short term borrowings 7,012,876 7,177,835 7,177,835 – – – –
26,310,364 28,026,435 21,788,926 1,045,412 2,260,769 2,931,328 –
It is not expected that the cash flows included in the maturity analysis could occur significantly earlier or at
significantly different amounts.
The contractual cash flow relating to long and short term borrowings have been determined on the basis
of expected mark-up rates. The mark-up rates have been disclosed in notes 8 and 13 to these financial
statements.
c) Market risk
Market risk is the risk that the value of the financial instrument may fluctuate as a result of changes in market
interest rates or the market price due to change in credit rating of the issuer or the instrument, change in market
sentiments, speculative activities, supply and demand of securities and liquidity in the market. The Company
incurs financial liabilities to manage its market risk. All such activities are carried out with the approval of the
Board. The Company is exposed to interest rate risk, currency risk and market price risk.
i) Currency risk
Currency risk is the risk that the fair value or future cash flows of a financial instrument will fluctuate because of
changes in foreign exchange rates. Currency risk arises mainly from future commercial transactions of receivables
and payables that exist due to transactions in foreign currencies.
Exposure to Currency Risk
The Company is exposed to currency risk on bank balances and investments which are denominated in currency
other than the functional currency of the Company. The Company’s exposure to foreign currency risk is as
follows: 2014 2013
Rupees ‘000 US Dollar ‘000 Rupees ‘000 US Dollar ‘000
Bank balance 2,919 29 751 7
Investments (Term deposit receipts) 1,309,818 13,046 1,335,731 12,748
Notes to and forming part of the Financial Statementsfor the year ended December 31, 2014

Financial Statements of Fauji Fertilizer Company Limited 2014
123
123
The following significant exchange rates applied during the year: Average rates Balance sheet date rate
2014 2013 2014 2013
US Dollars 100.19 100.71 100.40 104.78
Sensitivity analysis
A 10% strengthening of the functional currency against foreign currencies at December 31 would have decreased profit and loss by Rs 87,953 thousand (2013: Rs 88,208 thousand). A 10% weakening of the functional currency against foreign currencies at December 31 would have had the equal but opposite effect of these amounts. The analysis assumes that all other variables remain constant.
ii) Interest rate risk
The interest rate risk is the risk that the fair value or the future cash flows of a financial instrument will fluctuate because of changes in market interest rates. Majority of the interest rate exposure arises from short term borrowings, long term borrowings, long term investments, loans and advances, short term investments and deposits with banks. At the balance sheet date the interest rate risk profile of the Company’s interest bearing
financial instruments is: Carrying Amount
2014 2013
(Rupees ‘000)
Fixed rate instruments
Financial assets 35,174,187 20,292,748
Variable rate instruments
Financial assets 639,886 96,000
Financial liabilities 15,882,443 12,740,000
Fair value sensitivity analysis for fixed rate instruments
The Company is not exposed to variations in profit and loss on its fixed rate financial instruments.
Cash flow sensitivity analysis for variable rate instruments
A change of 100 basis points in interest rates at the reporting date would have increased / (decreased) profit or loss by the amounts shown below. This analysis assumes that all other variables, in particular foreign currency rates, remain constant. The analysis is performed on the same basis for 2013.
100 basis points 100 basis points increase decrease
(Rupees ‘000)
December 31, 2014
Cash flow sensitivity - Variable rate instruments (49,672) 49,672
December 31, 2013
Cash flow sensitivity - Variable rate instruments (44,836) 44,836
Notes to and forming part of the Financial Statementsfor the year ended December 31, 2014

124
124
iii) Price risk
Price risk represents the risk that the fair value or future cash flows of a financial instrument will fluctuate because of changes in market prices (other than those arising from interest rate risk or currency risk), whether those changes are caused by factors specific to the individual financial instrument or its issuer, or factors affecting all similar financial instruments traded in the market.
Sensitivity analysis – price risk
For quoted investments classified as available for sale, a 1 percent increase in market price at reporting date would have increased equity by Rs 48,761 thousand after tax (2013: Rs 1,026 thousand); an equal change in the opposite direction would have decreased equity after tax by the same amount. For investments classified as fair value through profit or loss, the impact on profit or loss would have been an increase or decrease by Rs 4,459 thousand after tax (2013: Rs 1,012 thousand). The analysis is performed on the same basis for 2013 and assumes that all other variables remain the same.
39.4 Fair values
Fair value versus carrying amounts
The fair values of financial assets and liabilities, together with the carrying amounts shown in the balance sheet, are as follows:
December 31, 2014 December 31, 2013 Carrying Fair Carrying Fair amount value amount value Note (Rupees ‘000)
Assets carried at amortised cost
Loans and advances 18 and 23 1,732,937 1,732,937 1,473,510 1,473,510
Deposits 19 and 24 13,354 13,354 3,048 3,048
Trade debts - net of provision 22 822,460 822,460 700,541 700,541
Other receivables 25 565,198 565,198 365,814 365,814
Short term investments 26 27,432,837 27,432,837 18,960,295 18,960,295
Cash and bank balances 27 1,173,767 1,173,767 1,361,651 1,361,651
31,740,553 31,740,553 22,864,859 22,864,859
Assets carried at fair value
Long term investments 17 7,334,005 7,334,005 218,606 218,606
Short term investments 26 723,019 723,019 204,564 204,564
8,057,024 8,057,024 423,170 423,170
Liabilities carried at amortised cost
Long term borrowings 8 4,287,333 4,287,333 5,749,222 5,749,222
Trade and other payables 10 29,243,800 29,243,800 13,548,266 13,548,266
Short term borrowings 13 11,625,227 11,625,227 7,012,876 7,012,876
45,156,360 45,156,360 26,310,364 26,310,364
The basis for determining fair values is as follows:
Interest rates used for determining fair value
The interest rates used to discount estimated cash flows, when applicable, are based on the government yield curve at the reporting date plus an adequate credit spread. For instruments carried at amortized cost, since the majority of the interest bearing investments are variable rate based instruments, there is no difference in carrying amount and the fair value. Further, for fixed rate instruments, since there is no significant difference in market rate and the rate of instrument and most of the fixed rate instruments are short term in nature, therefore fair value significantly approximates to carrying value.
Notes to and forming part of the Financial Statementsfor the year ended December 31, 2014
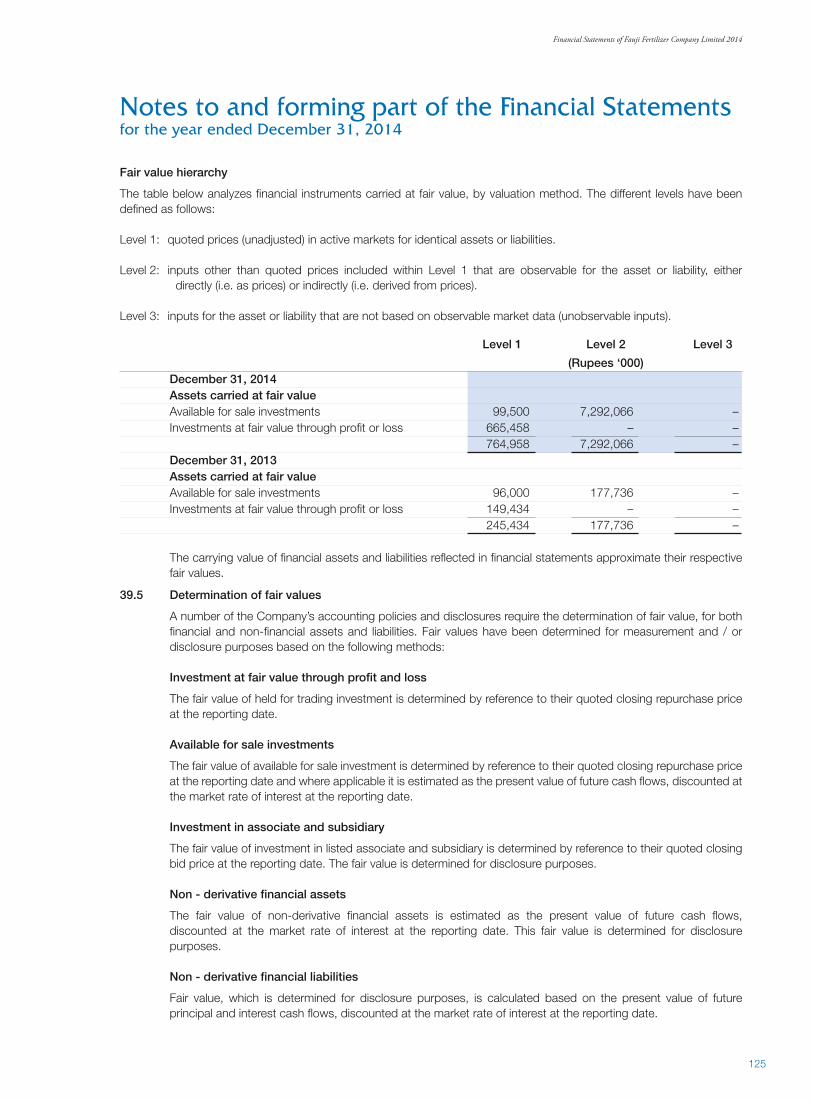
Financial Statements of Fauji Fertilizer Company Limited 2014
125
125
Level 1 Level 2 Level 3
(Rupees ‘000) December 31, 2014 Assets carried at fair value Available for sale investments 99,500 7,292,066 – Investments at fair value through profit or loss 665,458 – – 764,958 7,292,066 – December 31, 2013 Assets carried at fair value Available for sale investments 96,000 177,736 – Investments at fair value through profit or loss 149,434 – – 245,434 177,736 –
The carrying value of financial assets and liabilities reflected in financial statements approximate their respective fair values.
39.5 Determination of fair values
A number of the Company’s accounting policies and disclosures require the determination of fair value, for both financial and non-financial assets and liabilities. Fair values have been determined for measurement and / or disclosure purposes based on the following methods:
Investment at fair value through profit and loss
The fair value of held for trading investment is determined by reference to their quoted closing repurchase price at the reporting date.
Available for sale investments
The fair value of available for sale investment is determined by reference to their quoted closing repurchase price at the reporting date and where applicable it is estimated as the present value of future cash flows, discounted at the market rate of interest at the reporting date.
Investment in associate and subsidiary
The fair value of investment in listed associate and subsidiary is determined by reference to their quoted closing bid price at the reporting date. The fair value is determined for disclosure purposes.
Non - derivative financial assets
The fair value of non-derivative financial assets is estimated as the present value of future cash flows, discounted at the market rate of interest at the reporting date. This fair value is determined for disclosure purposes.
Non - derivative financial liabilities
Fair value, which is determined for disclosure purposes, is calculated based on the present value of future principal and interest cash flows, discounted at the market rate of interest at the reporting date.
Fair value hierarchy
The table below analyzes financial instruments carried at fair value, by valuation method. The different levels have been defined as follows: Level 1: quoted prices (unadjusted) in active markets for identical assets or liabilities. Level 2: inputs other than quoted prices included within Level 1 that are observable for the asset or liability, either
directly (i.e. as prices) or indirectly (i.e. derived from prices). Level 3: inputs for the asset or liability that are not based on observable market data (unobservable inputs).
Notes to and forming part of the Financial Statementsfor the year ended December 31, 2014

126
126
2014 2013 (Rupees ‘000)
Transactions with subsidiary companies Expenses charged on account of marketing of fertilizer on behalf of subsidiary company 513,009 835,558 Commission on sale of subsidiary company’s products 10,904 19,979 Services and materials provided – 55,150 Payments under consignment account 34,056,198 66,026,408 Services and materials received 6,281 10,889 Dividend income 2,088,275 2,376,165 Balance payable at the year end - unsecured – 347,142 Balance receivable at the year end - unsecured 556,428 118,989 Investments in TDRs issued by subsidiary company and outstanding at the year end – 2,570,000 Bank balance at the year end – 62,306 Long term investments - additions 450,000 2,267,750 Long term investments - disposals 93,411 – Transactions with associated undertakings / companies due to common directorship Expenses charged on account of marketing of fertilizer on behalf of associated company 326,791 – Commission on sale of subsidiary company’s products 7,281 – Services and materials provided – 91 Payments under consignment account 25,125,468 – Purchase of gas as feed and fuel stock 30,476,475 23,915,067 Services and materials received 371,989 358,494 Sale of fertilizer 2,162 4,825 Donations 95,371 445,558 Dividend income 490,044 117,185 Dividend paid 7,983,961 9,225,286 Investments in TDRs issued by associated company and outstanding at the year end 3,200,000 – Bank balance at the year end 22,955 – Balance receivable at the year end 8,353 8,726 Balance payable at the year end 26,119,281 9,262,274
39.6 Capital management
The Board’s policy is to maintain a strong capital base so as to maintain investor, creditor and market confidence and to sustain future development of the business. The Board of Directors monitors the return on capital, which the Company defines as net profit after taxation divided by total shareholders’ equity. The Board of Directors also monitors the level of dividend to ordinary shareholders. There were no changes to the Company’s approach to capital management during the year and the Company is not subject to externally imposed capital requirements.
40. RELATED PARTY TRANSACTIONS
Fauji Foundation holds 44.35% (2013: 44.35%) shares of the Company at the year end. Therefore all subsidiaries and associated undertakings of Fauji Foundation are related parties of the Company. The related parties also comprise of directors, major shareholders, key management personnel, entities over which the directors are able to exercise influence, entities under common directorship and employees’ funds. Transactions with related parties and the balances outstanding at the year end are given below. Loans and advances to executives and remuneration of chief executive, directors and executives are disclosed in notes 18, 23 and 36 to the financial statements respectively.
Notes to and forming part of the Financial Statementsfor the year ended December 31, 2014
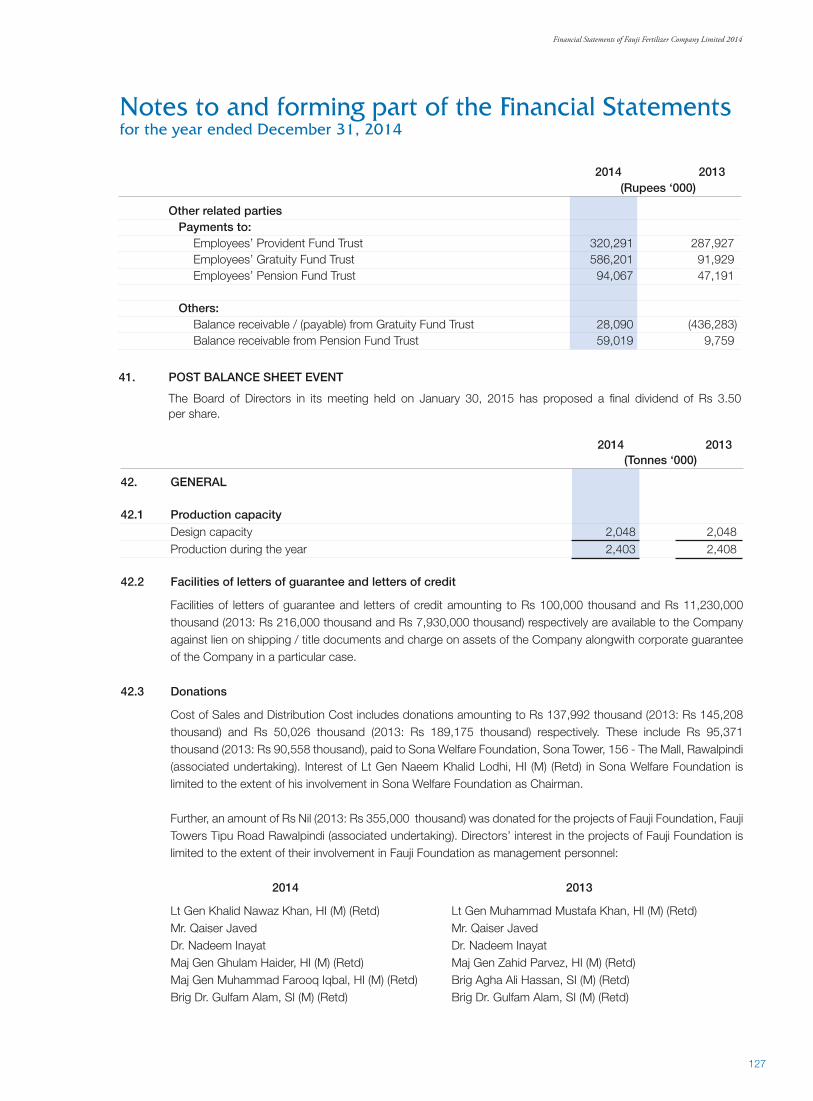
Financial Statements of Fauji Fertilizer Company Limited 2014
127
127
2014 2013 (Rupees ‘000)
Other related parties Payments to: Employees’ Provident Fund Trust 320,291 287,927 Employees’ Gratuity Fund Trust 586,201 91,929 Employees’ Pension Fund Trust 94,067 47,191 Others: Balance receivable / (payable) from Gratuity Fund Trust 28,090 (436,283) Balance receivable from Pension Fund Trust 59,019 9,759
41. POST BALANCE SHEET EVENT
The Board of Directors in its meeting held on January 30, 2015 has proposed a final dividend of Rs 3.50 per share.
2014 2013 (Tonnes ‘000)
42. GENERAL
42.1 Production capacity Design capacity 2,048 2,048 Production during the year 2,403 2,408 42.2 Facilities of letters of guarantee and letters of credit
Facilities of letters of guarantee and letters of credit amounting to Rs 100,000 thousand and Rs 11,230,000 thousand (2013: Rs 216,000 thousand and Rs 7,930,000 thousand) respectively are available to the Company against lien on shipping / title documents and charge on assets of the Company alongwith corporate guarantee of the Company in a particular case.
42.3 Donations
Cost of Sales and Distribution Cost includes donations amounting to Rs 137,992 thousand (2013: Rs 145,208 thousand) and Rs 50,026 thousand (2013: Rs 189,175 thousand) respectively. These include Rs 95,371 thousand (2013: Rs 90,558 thousand), paid to Sona Welfare Foundation, Sona Tower, 156 - The Mall, Rawalpindi (associated undertaking). Interest of Lt Gen Naeem Khalid Lodhi, HI (M) (Retd) in Sona Welfare Foundation is limited to the extent of his involvement in Sona Welfare Foundation as Chairman.
Further, an amount of Rs Nil (2013: Rs 355,000 thousand) was donated for the projects of Fauji Foundation, Fauji Towers Tipu Road Rawalpindi (associated undertaking). Directors’ interest in the projects of Fauji Foundation is limited to the extent of their involvement in Fauji Foundation as management personnel:
2014 2013
Lt Gen Khalid Nawaz Khan, HI (M) (Retd) Lt Gen Muhammad Mustafa Khan, HI (M) (Retd) Mr. Qaiser Javed Mr. Qaiser Javed Dr. Nadeem Inayat Dr. Nadeem Inayat Maj Gen Ghulam Haider, HI (M) (Retd) Maj Gen Zahid Parvez, HI (M) (Retd) Maj Gen Muhammad Farooq Iqbal, HI (M) (Retd) Brig Agha Ali Hassan, SI (M) (Retd) Brig Dr. Gulfam Alam, SI (M) (Retd) Brig Dr. Gulfam Alam, SI (M) (Retd)
Notes to and forming part of the Financial Statementsfor the year ended December 31, 2014

128
128
2014 2013
42.4 Number of employees
Total number of employees at end of the year 2,333 2,319 Average number of employees for the year 2,314 2,312
42.5 Rounding off
Figures have been rounded off to the nearest thousand of rupees unless otherwise stated. 42.6 Date of authorisation
These Financial Statements have been authorised for issue by the Board of Directors of the Company on January 30, 2015.
Notes to and forming part of the Financial Statementsfor the year ended December 31, 2014
Chairman Chief Executive Director

Consolidated Financial Statements of Fauji Fertilizer Company Limited 2014
129
129
Consolidated Financial StatementsFauji Fertilizer Company Limited

130
130

Consolidated Financial Statements of Fauji Fertilizer Company Limited 2014
131
131
Auditor’s Report to the Membersof Fauji Fertilizer Company Limited
We have audited the annexed consolidated financial statements comprising consolidated balance sheet of Fauji Fertilizer
Company Limited (the Holding Company) and its subsidiary companies, FFC Energy Limited and Fauji Fresh n Freeze
Limited (formerly AI Hamd Foods Limited) as at December 31, 2014 and the related consolidated profit and loss account,
consolidated statement of comprehensive income, consolidated cash flow statement and consolidated statement of
changes in equity together with the notes forming part thereof, for the year then ended. We have also expressed separate
opinion on the financial statements of Fauji Fertilizer Company Limited. The financial statements of the subsidiary companies,
FFC Energy Limited and Fauji Fresh n Freeze Limited (formerly AI Hamd Foods Limited), and FFBL results for the period
January 1, 2014 to October 3, 2014 have been audited by another firm of chartered accountants whose reports have been
furnished to us and our opinion, in so far as it relates to the amounts included for such companies, is based solely on the
reports of such other auditor. These financial statements are the responsibility of the Holding Company’s management. Our
responsibility is to express an opinion on these financial statements based on our audit.
Our audit was conducted in accordance with the Auditing Standards as applicable in Pakistan and accordingly included
such tests of accounting records and such other auditing procedures as we considered necessary in the circumstances.
In our opinion, the consolidated financial statements present fairly the financial position of Fauji Fertilizer Company Limited
and its subsidiary companies FFC Energy Limited and Fauji Fresh n Freeze Limited (formerly AI Hamd Foods Limited) as at
December 31, 2014 and the results of their operations for the year then ended.
A. F. FERGUSON & CO.
CHARTERED ACCOUNTANTS
Engagement Partner: M. Imtiaz Aslam
Islamabad
January 30, 2015

132
132
Consolidated Balance Sheetas at December 31, 2014
2014 2013 Note (Rupees ‘000)
EQUITY AND LIABILITIES
ATTRIBUTABLE TO EQUITY HOLDERS
OF FAUJI FERTILIZER COMPANY LIMITED
Share capital 5 12,722,382 12,722,382
Capital reserves 6 611,592 1,330,727
Revenue reserves 7 30,032,528 14,376,567
Surplus on remeasurement of investments
available for sale to fair value 303,564 10,508
43,670,066 28,440,184
NON - CONTROLLING INTERESTS – 6,757,655
TOTAL EQUITY 43,670,066 35,197,839
NON - CURRENT LIABILITIES
Long term borrowings 8 11,406,203 14,391,192
Deferred liabilities 9 4,574,028 7,538,766
Liability against assets subject
to finance lease 2,893 564
15,983,124 21,930,522
CURRENT LIABILITIES
Trade and other payables 10 38,526,069 30,466,496
Interest and mark-up accrued 12 115,891 290,784
Short term borrowings 13 11,602,443 14,985,128
Current portion of long term borrowings 8 3,054,000 3,812,186
Current portion of liability against
assets subject to finance lease 238 849
Taxation 2,501,510 4,710,797
55,800,151 54,266,240
TOTAL EQUITY AND LIABILITIES 115,453,341 111,394,601
CONTINGENCIES AND COMMITMENTS 14
The annexed notes 1 to 43 form an integral part of these consolidated financial statements.

Consolidated Financial Statements of Fauji Fertilizer Company Limited 2014
133
133
2014 2013 Note (Rupees ‘000)
ASSETS
NON - CURRENT ASSETS
Property, plant and equipment 15 33,104,620 44,314,880
Intangible assets 16 1,974,531 2,014,919
Long term investments 17 41,787,131 23,478,872
Long term loans and advances 18 823,188 740,408
Long term deposits and prepayments 19 17,804 83,055
77,707,274 70,632,134
CURRENT ASSETS
Stores, spares and loose tools 20 3,314,823 5,352,138
Stock in trade 21 985,347 1,431,214
Trade debts 22 2,221,263 2,871,255
Loans and advances 23 531,379 1,500,047
Deposits and prepayments 24 27,589 74,255
Other receivables 25 1,182,227 1,056,198
Short term investments 26 27,432,837 24,283,431
Cash and bank balances 27 2,050,602 4,193,929
37,746,067 40,762,467
TOTAL ASSETS 115,453,341 111,394,601
Chairman Chief Executive Director

134
134
Consolidated Profit and Loss Accountfor the year ended December 31, 2014
(Re-presented) 2014 2013 Note (Rupees ‘000)
Sales 28 84,013,999 75,977,433
Cost of sales 29 50,878,238 40,417,170
GROSS PROFIT 33,135,761 35,560,263
Administrative and distribution expenses 30 6,617,040 6,237,555
26,518,721 29,322,708
Finance cost 31 2,149,262 1,373,425
Other expenses 32 2,303,562 2,557,862
22,065,897 25,391,421
Other income 33 1,913,622 1,891,983
Share in profit / (loss) of equity accounted investments 1,476,057 (8,781)
NET PROFIT BEFORE TAXATION 25,455,576 27,274,623
Provision for taxation 34 8,076,881 9,247,990
NET PROFIT AFTER TAXATION FROM
CONTINUING OPERATIONS 17,378,695 18,026,633
Discontinued operations - net of tax 35 17,259,744 5,634,511
Profit for the year 34,638,439 23,661,144
ATTRIBUTABLE TO:
Equity holders of Fauji Fertilizer Company Limited 33,615,001 20,908,121
Non - Controlling Interests 1,023,438 2,753,023
34,638,439 23,661,144
Earnings per share - basic and diluted (Rupees) 36
Continuing operations 13.66 14.17
Discontinued operations 13.57 4.43
27.23 18.60
The annexed notes 1 to 43 form an integral part of these consolidated financial statements.
Chairman Chief Executive Director

Consolidated Financial Statements of Fauji Fertilizer Company Limited 2014
135
135
Consolidated Statement of Comprehensive Incomefor the year ended December 31, 2014
(Re-presented) 2014 2013 Note (Rupees ‘000)
Net profit after taxation 34,638,439 23,661,144
Other comprehensive income
Gain on remeasurement of staff retirement benefit plans - net of tax 56,621 47,791
Surplus on remeasurement of investments
available for sale to fair value - net of tax 293,056 2,813
Exchange difference on translating foreign investment (67,963) 163,452
Other comprehensive income from
continuing operations - net of tax 281,714 214,056
Discontinued Operations - net of tax 35 (162,439) 287,628
119,275 501,684
Total comprehensive income for the year 34,757,714 24,162,828
ATTRIBUTABLE TO:
Equity holders of Fauji Fertilizer Company Limited 33,814,067 21,268,522
Non - Controlling interests 943,647 2,894,306
34,757,714 24,162,828
The annexed notes 1 to 43 form an integral part of these consolidated financial statements.
Chairman Chief Executive Director

136
136
(Re-presented) 2014 2013 Note (Rupees ‘000)
CONTINUING OPERATIONS
CASH FLOWS FROM OPERATING ACTIVITIES
Cash generated from operations 38 41,007,491 37,636,465
Finance cost paid (2,000,206) (1,346,698)
Income tax paid (9,355,565) (9,736,363)
Net cash generated from operating activities 29,651,720 26,553,404
CASH FLOWS FROM INVESTING ACTIVITIES
Fixed capital expenditure (4,295,821) (4,459,344)
Proceeds from disposal of property, plant and equipment 47,260 51,639
Interest received 1,298,540 1,279,859
Investment in Askari Bank Limited – (10,461,921)
Investment in Fauji Fresh n Freeze Limited (formerly Al-Hamd
Foods Limited) – (585,500)
Sale of shares in Fauji Fertilizer Bin Qasim Limited 375,139 –
(Increase) / decrease in other investment - net (8,083,631) 919,406
Dividends received 2,578,319 2,586,042
Net cash used in investing activities (8,080,194) (10,669,819)
CASH FLOWS FROM FINANCING ACTIVITIES
Long term financing - disbursements 653,130 3,787,078
- repayments (1,803,504) (2,328,613)
Dividends paid (17,582,659) (20,677,553)
Net cash used in financing activities (18,733,033) (19,219,088)
CASH FLOWS FROM DISCONTINUED OPERATIONS
Operating cash flows (1,276,675) 9,939,754
Investing cash flows (2,721,686) (10,245,513)
Financing cash flows 1,541,562 (1,369,143)
Cash and cash equivalents (585,607) -
Net cash used in discontinued operations (3,042,406) (1,674,902)
Net decrease in cash and cash equivalents (203,913) (5,010,405)
Cash and cash equivalents at beginning of the year 16,409,752 21,324,043
Effect of exchange rate changes (47,862) 96,114
Cash and cash equivalents at end of the year 38.1 16,157,977 16,409,752
The annexed notes 1 to 43 form an integral part of these consolidated financial statements.
Consolidated Cash Flow Statementfor the year ended December 31, 2014
Chairman Chief Executive Director

Consolidated Financial Statements of Fauji Fertilizer Company Limited 2014
137
137
Cha
irman
C
hief
Exe
cutiv
e D
irect
or
At
tribu
tabl
e to
equ
ity h
olde
rs o
f Fau
ji Fer
tilize
r Com
pany
limite
d
Surp
lus
on
Cap
ital r
eser
ves
Rev
enue
rese
rves
re
mea
sure
men
t of
Non
-con
trollin
g
Sh
are
Shar
e C
apita
l Tr
ansl
atio
n
Stat
utor
y G
ener
al
Una
ppro
pria
ted
avai
labl
e fo
r sal
e in
tere
sts
Tota
l
capi
tal
prem
ium
re
dem
ptio
n re
serv
e re
serv
e re
serv
e pr
ofit
inve
stm
ent t
o
re
serv
e
fa
ir va
lue
(R
upee
s ‘0
00)
Consolidated Statement of Changes in Equityfor the year ended December 31, 2014
B
alan
ce a
s at
Jan
uary
1, 2
013
12,
722,
382
1
56,1
84
120
,000
7
18,4
42
6,4
36
5,5
02,3
60
8,7
39,2
58
7,6
95
6,1
57,7
34
34,
130,
491
Tr
ansf
er to
gen
eral
rese
rve
–
–
–
–
– 1
,300
,000
(1
,300
,000
) –
–
–
To
tal c
ompr
ehen
sive
inco
me
for t
he y
ear
Pr
ofit a
fter t
axat
ion
–
–
–
–
–
–
20,
908,
121
–
2,7
53,0
23
23,
661,
144
O
ther
com
preh
ensi
ve in
com
e –
net o
f tax
–
–
–
329
,665
–
–
2
7,92
3
2,8
13
141
,283
5
01,6
84
–
–
–
3
29,6
65
–
–
20,
936,
044
2
,813
2
,894
,306
2
4,16
2,82
8
Dis
trib
utio
n to
ow
ners
FFC
divi
dend
s:
Fi
nal d
ivide
nd 2
012:
Rs
5.00
per
sha
re
–
–
–
–
–
–
(6
,361
,191
) –
–
(6
,361
,191
)
Firs
t int
erim
divi
dend
201
3: R
s 3.
50 p
er s
hare
–
–
–
–
–
–
(4
,452
,834
) –
–
(4
,452
,834
)
Seco
nd in
terim
divi
dend
201
3: R
s 3.
75 p
er s
hare
–
–
–
–
–
–
(4
,770
,893
) –
–
(4
,770
,893
)
T
hird
inte
rim d
ivide
nd 2
013:
Rs
4.10
per
sha
re
–
–
– –
–
–
(5,2
16,1
77)
–
–
(5,2
16,1
77)
D
ivide
nd b
y FF
BL to
non
– c
ontro
lling
inte
rest
hol
ders
Fi
nal d
ivide
nd 2
012:
Rs
2.25
per
ord
inar
y sh
are
–
–
–
–
–
–
–
–
(1
,032
,460
) (1
,032
,460
)
Firs
t int
erim
divi
dend
201
3: R
s 1.
75 p
er o
rdin
ary
shar
e
–
–
– –
–
–
–
–
(803
,043
) (8
03,0
43)
Se
cond
inte
rim d
ivide
nd 2
013:
Rs
1.00
per
ord
inary
sha
re
–
–
– –
–
–
–
–
(458
,882
) (4
58,8
82)
–
–
–
–
–
–
(20,
801,
095)
–
(2,2
94,3
85)
(23,
095,
480)
B
alan
ce a
s at
Dec
embe
r 31,
201
3 1
2,72
2,38
2
156
,184
1
20,0
00
1,0
48,1
07
6,4
36
6,8
02,3
60
7,5
74,2
07
10,
508
6
,757
,655
3
5,19
7,83
9
Tran
sfer
to g
ener
al re
serv
e –
– –
– –
– –
– –
–
Tota
l com
preh
ensi
ve in
com
e fo
r the
yea
r
Profi
t afte
r tax
atio
n –
–
–
–
–
–
3
3,61
5,00
1
–
1
,023
,438
3
4,63
8,43
9
Oth
er c
ompr
ehen
sive
inco
me
– ne
t of t
ax
–
–
–
(1
37,1
20)
–
–
43,
130
2
93,0
56
(79,
791)
1
19,2
75
–
–
–
(1
37,1
20)
–
–
33,
658,
131
2
93,0
56
943
,647
3
4,75
7,71
4
Dis
trib
utio
n to
ow
ners
FFC
divi
dend
s:
Fi
nal d
ivide
nd 2
013:
Rs
4.00
per
sha
re
–
–
–
–
–
–
(5,0
88,9
52)
–
–
(5,0
88,9
52)
Fi
rst i
nter
im d
ivide
nd 2
014:
Rs
3.00
per
sha
re
–
–
–
–
–
–
(3,8
16,7
14)
–
–
(3,8
16,7
14)
Se
cond
inte
rim d
ivide
nd 2
014:
Rs
3.40
per
sha
re
–
–
–
–
–
–
(4,3
25,6
10)
–
–
(4,3
25,6
10)
Th
ird in
terim
divi
dend
201
4: R
s 3.
75 p
er s
hare
–
–
–
–
–
–
(4
,770
,894
) –
–
(4
,770
,894
)
Divi
dend
by
FFB
L to
non
– c
ontro
lling
inte
rest
hol
ders
Fi
nal d
ivide
nd 2
013:
Rs
2.25
per
ord
inar
y sh
are
–
–
–
–
–
–
–
–
(1
,032
,473
) (1
,032
,473
)
Firs
t int
erim
divi
dend
201
4: R
s 1.
00 p
er o
rdin
ary
shar
e
–
–
–
–
–
–
–
–
(458
,876
) (4
58,8
76)
–
–
–
–
–
–
(1
8,00
2,17
0)
–
(1
,491
,349
) (1
9,49
3,51
9)
Dis
cont
inue
d op
erat
ions
– n
ote
35
–
(1
16,1
84)
– (4
59,3
95)
(6,4
36)
–
–
–
(6
,209
,953
) (6
,791
,968
)
Bal
ance
as
at D
ecem
ber 3
1, 2
014
12,
722,
382
4
0,00
0
120
,000
4
51,5
92
–
6
,802
,360
2
3,23
0,16
8
303
,564
–
43,
670,
066
Th
e an
nexe
d no
tes
1 to
43
form
an
inte
gral
par
t of t
hese
con
solid
ated
fina
ncia
l sta
tem
ents
.

138
138
1. LEGAL STATUS AND NATURE OF BUSINESS
1.1 Fauji Fertilizer Company Limited (the Group) comprises of Fauji Fertilizer Company Limited (FFC / parent company) and its subsidiaries, FFC Energy Limited (FFCEL) and Fauji Fresh n Freeze Limited (FFFL) (formerly Al-Hamd Foods Limited) are incorporated in Pakistan as public limited companies.
The shares of FFC are quoted on the Karachi, Lahore and Islamabad stock exchanges of Pakistan. The registered offices of FFC and FFCEL are situated in Rawalpindi. The registered office of FFFL is situated in Lahore, Pakistan.
The principal activity of FFC is manufacturing, purchasing and marketing of fertilizers and chemicals including
investment in chemical, other manufacturing and banking operations. FFCEL has setup a 49.5 MW wind energy power project. FFFL will principally be engaged in the business of processing fresh, frozen fruit, vegetables, fresh meat, frozen cooked and semi cooked food.
1.2 During the year 1% equity of Fauji Fertilizer Bin Qasim Limited (FFBL) aggregating to 9,341,100 ordinary shares,
held by FFC, were sold to Fauji Foundation (FF) on October 3, 2014 at the closing market price. Further, FFC irrevocably appointed FF as its proxy, to represent FFC in the general meetings of FFBL and Askari Bank Limited (AKBL) allowing FF to vote for and on behalf of FFC and resolved that representatives of FF may be elected or co-opted or appointed on the Board of Directors of FFBL and AKBL, as nominated by FF. This has resulted in loss of control over FFBL and AKBL accordingly, the status of FFBL and AKBL has been changed to associated companies of FFC and therefore the group has classified FFBL and AKBL as discontinued operations.
2. STATEMENT OF COMPLIANCE
These consolidated financial statements have been prepared in accordance with the approved accounting standards as applicable in Pakistan. Approved accounting standards comprise of such International Financial Reporting Standards (IFRS) issued by the International Accounting Standards Board as are notified under the Companies Ordinance, 1984, provisions of and directives issued under the Companies Ordinance, 1984. In case requirements differ, the provisions or directives of the Companies Ordinance, 1984 shall prevail.
Pursuant to exemption from the Securities and Exchange Commission of Pakistan, the financial results of AKBL
have not been consolidated till October 3, 2014 when it’s status was changed to an associated company. 3. USE OF ESTIMATES AND JUDGEMENTS
The preparation of financial statements in conformity with the approved accounting standards requires management to make judgments, estimates and assumptions that affect the application of accounting policies and the reported amounts of assets and liabilities, income and expenses. The estimates and associated assumptions are based on historical experience and various other factors that are believed to be reasonable under the circumstances, the results of which form the basis of making the judgments about carrying values of assets and liabilities that are not readily apparent from other sources. Actual results may differ from these estimates.
The estimates and underlying assumptions are reviewed on an ongoing basis. Revisions to accounting estimates
are recognised in the period in which the estimates are revised if the revision affects only that period, or in the period of the revision and future periods. Judgments made by management in application of the approved accounting standards that have significant effect on the financial statements and estimates with a significant risk of material adjustment in the next year are discussed in respective policy notes. The areas where various assumptions and estimates are significant to the Group’s financial statements or where judgment was exercised in application of accounting policies are as follows:
(i) Retirement benefits - note 11 (ii) Estimate of useful life of property, plant and equipment - note 15 (iii) Estimate of useful life of intangible assets - note 16 (iv) Estimate of recoverable amount of goodwill - note 16 (v) Estimate of recoverable amount of investment in associated companies - note 17 (vi) Provision for taxation - note 34
Notes to and forming part of the Consolidated Financial Statementsfor the year ended December 31, 2014

Consolidated Financial Statements of Fauji Fertilizer Company Limited 2014
139
139
4. SUMMARY OF SIGNIFICANT ACCOUNTING POLICIES
The accounting policies set out below have been applied consistently to all periods presented in these consolidated financial statements.
4.1 Basis of measurement
These financial statements have been prepared under the historical cost convention except for certain financial instruments, which are carried at their fair values and staff retirement gratuity and pension which are carried at present value of defined benefit obligation net of fair value of plan assets.
4.2 Functional and presentation currency
Items included in the financial statements are measured using the currency of the primary economic environment in which the Company operates. These financial statements are presented in Pak Rupees, which is the Company’s functional currency.
4.3 Basis of consolidation
These financial statements include the financial statements of FFC and its subsidiary companies, FFCEL 100% owned (2013: 100% owned) and FFFL 100% owned (2013: 100% owned). FFBL’s results till October 3, 2014, have been consolidated as discontinued operations.
Subsidiaries
Subsidiaries are all entities over which the Group has the power to govern the financial and operating policies generally accompanying a shareholding of more than one half of the voting rights. The existence and effect of potential voting rights that are currently exercisable or convertible are considered when assessing whether the Group controls another entity. Subsidiaries are fully consolidated from the date on which control is transferred to the Group. They are derecognized from the date the control ceases. These consolidated financial statements include Fauji Fertilizer Company Limited (FFC/Parent Company) and all companies in which it directly or indirectly controls, beneficially owns or holds more than 50% of the voting securities or otherwise has power to elect and appoint more than 50% of its directors (the Subsidiaries).
The Group uses the acquisition method of accounting to account for business combinations. The consideration
transferred for the acquisition of a subsidiary is the fair values of the assets transferred, the liabilities incurred and the equity interests issued by the Group. The consideration transferred includes the fair value of any asset or liability resulting from a contingent consideration arrangement. Identifiable assets acquired and liabilities (including contingent liabilities) assumed in a business combination are measured initially at their fair values at the acquisition date. On an acquisition-by-acquisition basis, the Group recognises any non-controlling interest in the acquiree either at fair value or at the non-controlling interest’s proportionate share of the acquiree’s identifiable net assets.
Acquisition related cost are expensed as incurred
If the business combination is achieved in stages, the acquisition date carrying value of the acquirer’s previously held equity interest in the acquiree is remeasured to fair value at the acquisition date; any gains or losses arising from such remeasurement are recognised in profit or loss.
Any contingent consideration to be transferred by the group is recognised at fair value at the acquisition date.
Subsequent changes to the fair value of the contingent consideration that is deemed to be an asset or liability is recognised in accordance with IAS 39 either in profit or loss or as a change to other comprehensive income. Contingent consideration that is classified as equity is not re-measured, and its subsequent settlement is accounted for within equity.
Inter-company transactions, balances and unrealised gains on transactions between group companies are
eliminated. Unrealised losses are also eliminated. When necessary, amounts reported by subsidiaries have been adjusted to conform with the group’s accounting policies.
Notes to and forming part of the Consolidated Financial Statementsfor the year ended December 31, 2014

140
140
Changes in ownership interests in subsidiaries without change of control
Transactions with non-controlling interests that do not result in loss of control are accounted for as equity transactions i.e. as transactions with the owners in their capacity as owners. The difference between fair value of any consideration paid and the relevant share acquired of the carrying value of net assets of the subsidiary is recorded in equity. Gains or losses on disposals to non - controlling interests are also recorded in equity.
Disposal of subsidiaries
When the Group ceases to have control or significant influence, any retained interest in the entity is remeasured to its fair value, with the change in carrying amount recognised in profit and loss account. The fair value is the initial carrying amount for the purposes of subsequently accounting for the retained interest as an associate, joint venture or financial asset. In addition, any amounts previously recognised in other comprehensive income in respect of that entity are accounted for as if the Group had directly disposed off the related assets or liabilities. This means that amounts previously recognised in other comprehensive income are reclassified to profit and loss account.
Investments in associates and jointly control entities (equity accounted investees)
Associates are those entities in which the Group has significant influence, but not control, over the financial and operating policies. Joint ventures are those entities over whose activities the Group has joint control, established by contractual agreement and requiring unanimous consent for strategic financial and operating decisions.
Associates and jointly controlled entities are accounted for using the equity method (equity accounted investees)
and are recognised initially at cost. The Group companies investment includes goodwill identified on acquisition, net of any accumulated impairment losses. The consolidated financial statements include the Group companies share of the income and expenses and equity movements of equity accounted investees, after adjustments to align the accounting policies with those of the Group companies, from the date that significant influence or joint control commences until the date that significant influence or joint control ceases. When the Group companies share of losses exceeds their interest in an equity accounted investee, the carrying amount of that interest (including any long-term investments) is reduced to nil and the recognition of further losses is discontinued except to the extent that the Group companies have an obligation or have made payments on behalf of the investee.
Unrealised gains arising from transactions with equity accounted investees are eliminated against the investment
to the extent of the Group companies’ interest in the investee. Unrealised losses are eliminated in the same way as unrealised gains, but only to the extent that there is no evidence of impairment.
4.4 Retirement Benefits
FFC operate the following retirement benefit fund: Funded Gratuity Fund
Defined benefit funded gratuity for all eligible employees who complete qualifying period of service and age. Contributory Provident Fund
Defined contributory provident fund for all eligible employees for which contributions are charged to profit and loss account.
Funded Pension Fund
FFC has defined benefit funded pension for eligible employees who complete qualifying period of service and age.
These funds are administered by trustees. Annual contributions to the gratuity and management staff pension funds are based on actuarial valuation using Projected Unit Credit Method, related details of which are given in note 11 to the consolidated financial statements. All contributions are charged to profit and loss account for the year.
Notes to and forming part of the Consolidated Financial Statementsfor the year ended December 31, 2014

Consolidated Financial Statements of Fauji Fertilizer Company Limited 2014
141
141
Calculation of gratuity and pension requires assumptions to be made of future outcomes which mainly includes increase in remuneration, expected long-term return on plan assets and the discount rate used to convert future cash flows to current values. Calculations are sensitive to changes in the underlying assumptions.
Compensated absences
FFC has the policy to provide for compensated absences of its employees in accordance with respective entitlement on cessation of service; related expected cost thereof has been included in the consolidated financial statements.
4.5 Taxation
Income tax expense comprises current and deferred tax. Current tax
Provision for current taxation is based on taxable income at the applicable rate of taxation after taking into account tax credits and tax rebates, if any. Income tax expense is recognised in profit or loss except to the extent that it relates to items recognised directly in equity or in other comprehensive income.
. Deferred tax
Deferred tax is accounted for using the balance sheet liability method in respect of all taxable temporary differences arising from differences between the carrying amount of assets and liabilities in the consolidated financial statements and the corresponding tax bases used in the computation of taxable profit. Deferred tax liabilities are recognised for all taxable temporary differences and deferred tax assets are recognised to the extent that it is probable that taxable profits will be available against which the deductible temporary differences, unused tax losses and tax credits can be utilised. Deferred tax assets are reviewed at each reporting date and are reduced to the extent that it is no longer probable that the related tax benefit will be realised.
Deferred tax is not recognised on temporary differences arising from the initial recognition of assets or liabilities
in a transaction that is not a business combination and that affects neither accounting nor taxable profit or loss, and differences relating to investment in jointly controlled entities to the extent that it is probable that they will not reverse in a foreseeable future. In addition, deferred tax is not recognised for taxable temporary differences arising on the initial recognition of goodwill.
Deferred tax is calculated at the rates that are expected to apply to the period when the differences reverse, based
on tax rates that have been enacted. Deferred tax assets and liabilities are offset if there is a legally enforceable right to offset current tax liabilities and assets, and they relate to income taxes levied by the same tax authority on the same taxable entity, or on different tax entities, but they intend to settle current tax liabilities and assets on a net basis or their tax assets and liabilities will be realised simultaneously.
The Group companies take into account the current income tax law and decisions taken by the taxation authorities. Instances where the Group company’s view differs from the income tax department at the assessment stage and where the Group companies consider that their view on items of material nature is in accordance with law, the amounts are shown as contingent liabilities.
4.6 Property, plant and equipment and capital work in progress
Property, plant and equipment including those acquired on Pak Saudi Fertilizer Company Limited (PSFL) acquisition, are stated at cost less accumulated depreciation and impairment loss, if any except for freehold land and capital work in progress, which are stated at cost less impairment, if any. Cost comprises acquisition and other directly attributable costs. Property, plant and equipment acquired on PSFL acquisition are stated at their cost to FFC, which represents their fair value on acquisition, less accumulated depreciation.
Depreciation is provided on the straight-line basis and charged to profit and loss account to write off the
depreciable amount of each asset over its estimated useful life at the rates specified in note 15. Depreciation on addition in property, plant and equipment is charged from the date when the asset becomes available for use upto the date of it disposal.
Notes to and forming part of the Consolidated Financial Statementsfor the year ended December 31, 2014

142
142
The cost of replacing part of an item of property, plant and equipment is recognised in the carrying amount of the item if it is probable that the future economic benefits embodied within the part will flow to the Group companies and its cost can be measured reliably. The carrying amount of the replaced part is derecognised. The costs of the day-to-day servicing of property, plant and equipment are recognised in profit or loss as incurred.
Gains and losses on disposal of an item of property, plant and equipment are determined by comparing the proceeds from disposal with the carrying amount of property, plant and equipment, and are recognised net within “other income” in profit and loss account.
The Group companies review the useful life and residual value of property, plant and equipment on a regular basis.
Any change in estimates in future years might affect the carrying amounts of the respective items of property, plant and equipment with a corresponding effect on the depreciation charge and impairment.
4.7 Impairment
The carrying amount of the Group companies’ assets are reviewed at each balance sheet date to determine whether there is any indication of impairment. If such indications exist, the asset’s recoverable amount is estimated in order to determine the extent of the impairment loss, if any. Impairment loss is recognised as expense in the profit and loss account. An impairment loss is reversed only to the extent that the asset’s carrying amount does not exceed the carrying amount that would have been determined, net of depreciation or amortisation, if no impairment loss had been recognised. For non-financial assets and available-for-sale financial assets that are debt securities, the reversal is recognised in profit and loss account. For available-for-sale financial assets that are equity securities, the reversal is recognised directly in comprehensive income.
4.8 Intangible assets
Goodwill
Goodwill arises on the acquisition of subsidiaries and represents the excess of the consideration transferred, the amount of any non-controlling interest in the acquiree and the acquisition-date fair value of any previous equity interest in the acquiree over the fair value of the identifiable net assets acquired. If the total of consideration transferred, non-controlling interest recognised and previously held interest measured at fair value is less than the fair value of the net assets of the subsidiary acquired, in the case of a bargain purchase, the difference is recognised directly in the income statement.
For the purpose of impairment testing, goodwill acquired in a business combination is allocated to each of
the cash generating units (CGUs), or groups of CGUs, that is expected to benefit from the synergies of the combination. Each unit or group of units to which the goodwill is allocated represents the lowest level within the entity at which the goodwill is monitored for internal management purposes. Goodwill is monitored at the operating segment level.
Goodwill impairment reviews are undertaken annually or more frequently if events or changes in circumstances
indicate a potential impairment. The carrying value of the CGU containing the goodwill is compared to the recoverable amount, which is the higher of value in use and the fair value less costs of disposal. Any impairment is recognised immediately as an expense and is not subsequently reversed.
Computer software
These are stated at the cash price equivalent of the consideration given i.e., cash and cash equivalent paid less accumulated amortisation and impairment loss, if any. These are amortised over the period of their useful lives. Amortisation is charged on a straight line basis over the estimated useful life and is included in the profit and loss account.
Others
Other intangibles are stated at the cash price equivalent of the consideration given, i.e., cash and cash equivalent paid less accumulated amortization and impairment loss, if any. Intangibles with finite useful lives are amortized over the period of their useful lives. Amortization is charged on a straight line basic over the estimated useful life and is included in the profit and loss account.
Notes to and forming part of the Consolidated Financial Statementsfor the year ended December 31, 2014

Consolidated Financial Statements of Fauji Fertilizer Company Limited 2014
143
143
4.9 Investments
4.9.1 Investments available for sale
These are initially recognised at cost and at subsequent reporting dates measured at fair values. Gains or losses from changes in fair values are taken to statement of comprehensive income until disposal at which time these are recycled to profit and loss account.
4.9.2 Investments at fair value through profit or loss
Investments which are acquired principally for the purpose of selling in the near term or the investments that are part of a portfolio of financial instruments exhibiting short term profit taking, are classified as held for trading and designated as such upon initial recognition. These are stated at fair values with any resulting gains or losses recognized directly in the profit and loss account.
The Group companies recognize the regular way purchase or sale of financial assets using settlement date accounting.
4.9.3 Loans and receivables
Investments are classified as loans and receivables which have fixed or determinable payments and are not quoted in an active market. These investments are measured at amortised cost using the effective interest method, less any impairment losses.
4.9.4 Acquisition under common control
Acquisition under common control of the shareholders are initially recognised using a fair value accounting basis applying the requirements of IFRS 3 “Business Combinations”. All the acquisitions under common control are accounted for from the year in which the acquisition takes place without restating the Group companies (acquirer) comparative financial statements.
4.10 Stores, spares and loose tools
These are valued at lower of weighted average cost and net realisable value less impairment. The Group companies review the carrying amount of stores and spares on a regular basis and provision is made for obsolescence if there is any change in usage pattern and physical form of related stores, spares and loose tools. Impairment is also made for slow moving items.
4.11 Stock in trade
Stocks are valued at the lower of cost and net realisable value.
Cost is determined as follows:
Raw materials at weighted average purchase cost and directly attributable expenses Work in process and finished goods at weighted average cost of purchase, raw materials and related manufacturing expenses
Net realisable value signifies the estimated selling price in the ordinary course of business less the estimated costs
of completion and the estimated costs necessary to make the sale. The Group companies review the carrying amount of stock in trade and stores, spares and loose tools (note 4.10)
on a regular basis and as appropriate, inventory is written down to its net realizable value or provision is made for obsolescence if there is any change in usage pattern and physical form of related inventory. 4.12 Foreign currency transaction and translation
Transactions in foreign currencies are recorded in the books at the rates of exchange ruling on the date of the transaction. Assets and liabilities in foreign currencies at the year end are translated into rupees at the rates prevailing on the balance sheet date. Exchange differences are included in the profit or loss for the year.
Notes to and forming part of the Consolidated Financial Statementsfor the year ended December 31, 2014

144
144
Investment in foreign joint venture
The results and financial position of joint venture that have a functional currency different from Pak Rupees are translated into Pak Rupees as follows:
- assets and liabilities for each balance sheet presented are translated at the closing rate at the date of the balance sheet.
- income and expenses are translated at the average exchange rates for the period. - share capital is translated at historical exchange rate. All resulting exchange differences are recognised in other comprehensive income within statement of
comprehensive income. The Group companies have been recognising such differences in translation reserve over the years. When a foreign investment is sold, in part or in full, the relevant amount in the translation reserve is transferred to profit and loss account as part of the profit or loss on sale.
4.13 Revenue recognition
Sales revenue is recognised when the goods are dispatched and significant risks and rewards of ownership are transferred to the customer. Revenue from sale of goods is measured at the fair value of consideration received or receivable, net of returns and trade discounts. Scrap sales and miscellaneous receipts are recognised on realised amounts.
4.14 Borrowing costs
Borrowing costs which are directly attributable to the acquisition, construction or production of a qualifying asset are capitalised as part of the cost of that asset. Borrowing cost includes exchange differences arising from foreign currency borrowings to the extent these are regarded as an adjustment to borrowing costs. All other borrowing costs are charged to profit or loss.
4.15 Research and development costs
Research and development costs are charged to profit or loss as and when incurred. 4.16 Provisions
Provisions are recognised when the Group companies have a present legal or constructive obligation as a result of past events, it is probable that an outflow of resources embodying economic benefits will be required to settle the obligation and a reliable estimate can be made of the amount of obligation. Provisions are determined by discounting the expected future cash flows at a pre-tax rate that reflects current market assessments of the time value of money and the risks specific to the liability. Provisions are reviewed at each balance sheet date and adjusted to reflect current best estimate.
4.17 Dividend and reserve appropriation
Dividend is recognised as a liability in the period in which it is declared. Movement in reserves is recognised in the year in which it is approved.
4.18 Cash and cash equivalents
Cash and cash equivalents comprise cash in hand, cash with banks on current, saving and deposit accounts, short term running finances and other short term highly liquid investments that are readily convertible to known amounts of cash which are subject to insignificant risk of change in value.
4.19 Financial instruments
Financial assets and financial liabilities are recognised when the Group companies become a party to the contractual provisions of the instrument and assets and liabilities are stated at fair value and amortised cost respectively. The Group companies derecognise the financial assets and liabilities when they cease to be a party to such contractual provisions of the instruments. The Group companies recognise the regular way purchase or sale of financial assets using settlement date accounting.
Notes to and forming part of the Consolidated Financial Statementsfor the year ended December 31, 2014

Consolidated Financial Statements of Fauji Fertilizer Company Limited 2014
145
145
4.20 Mark-up bearing borrowings
Mark-up bearing borrowings are recognised initially at cost being the fair value of consideration received, less attributable transaction costs. Subsequent to initial recognition, mark-up bearing borrowings are stated at their amortised cost less subsequent repayments.
4.21 Trade and other payables
Liabilities for trade and other amounts payable are carried at amortised cost which approximates the fair value of the consideration to be paid in the future for goods and services received.
4.22 Trade debts and other receivables
Trade debts and other receivables are recognised and carried at amortised cost less an allowance for any uncollectible amounts. Carrying amounts of trade and other receivables are assessed on a regular basis and if there is any doubt about the realisability of these receivables, appropriate amount of provision is made.
4.23 Earnings per share
The Company presents basic and diluted earnings per share (EPS) data for its ordinary shares. Basic EPS is calculated by dividing the profit or loss attributable to ordinary shareholders of the Company by the weighted average number of ordinary shares outstanding during the year. Diluted EPS is determined by adjusting the profit or loss attributable to ordinary shareholders and the weighted average number of ordinary shares outstanding for the effects of all dilutive potential ordinary shares.
4.24 Off-setting of financial assets and liabilities
A financial asset and a financial liability is offset and the net amount is reported in the balance sheet if the Group companies have a legally enforceable right to set-off the recognized amounts and intend either to settle on a net basis or to realize the asset and settle the liability simultaneously.
4.25 Finance income and finance costs
Finance income comprises interest income on funds invested (including available-for-sale financial assets), dividend income, gains on disposal of available-for-sale financial assets and changes in the fair value of investments held for trading. Interest income is recognised as it accrues in profit or loss, using the effective interest method. Dividend income is recognised in profit or loss on the date that the Group companies right to receive payment is established, which in the case of quoted securities is the ex-dividend date.
Finance costs comprise interest expense on borrowings, changes in the fair value of held for trading investments
and impairment losses recognised on financial assets. Borrowing costs that are not directly attributable to the acquisition, construction or production of a qualifying asset are recognised in profit or loss using the effective interest method.
Foreign currency gains and losses are reported on a net basis.
4.26 Leases
Finance Leases
Leases that transfer substantially all the risks and rewards incidental to ownership of an asset are classified as finance leases. Assets on finance lease are capitalized at the commencement of the lease term at the lower of fair value of leased assets and the present value of minimum lease payments, each determined at the inception of the lease. Each lease payment is allocated between the liability and finance cost so as to achieve a constant rate on the finance balance outstanding. The finance cost is charged to consolidated profit and loss account and is included under finance costs. The assets acquired under finance lease are depreciated over the shorter of the useful life of the asset or the lease term.
Operating Leases
Rentals payable under operating leases are charged to profit and loss account on a straight line basis over the term of the relevant lease.
Notes to and forming part of the Consolidated Financial Statementsfor the year ended December 31, 2014

146
146
4.27 Contingent Liabilities
A contingent liability is disclosed when the Group has a possible obligation as a result of past events, whose existence will be confirmed only by the occurrence or non-occurrence, of one or more uncertain future events not wholly within the control of the Group; or the Group has a present legal or constructive obligation that arises from past events, but it is not probable that an outflow of resources embodying economic benefits will be required to settle the obligation, or the amount of the obligation cannot be measured with sufficient reliability.
4.28 Assets held for sale and discontinued operations
Non-current assets held for sale (and disposal groups) are presented separately in the current section of the balance sheet. Immediately before the initial classification of the assets (and disposal groups) as held for sale the carrying amount of the assets (or all the assets and liabilities in the disposal groups) are measured in accordance with their applicable accounting policy. Non-current assets held for sale (and disposal groups) are subsequently measured at the lower of their carrying amount and fair value less cost to sell. Non-current assets held for sale (and disposal groups) are no longer depreciated.
Upon occurrence of discontinued operations, results for the period related to discontinued operations are
presented separately in the consolidated income statement. Comparative information is re-presented accordingly. Balance sheet and cash flows information related to discontinued operations are disclosed separately in the notes.
4.29 Segment reporting
Segment reporting is based on the operating (business) segments of the Group. An operating segment is a component of the Group that engages in business activities from which it may earn revenues and incur expenses, including revenues and expenses that relate to transactions with any of the Group’s other components. An operating segment’s operating results are reviewed regularly by the CE&MD to make decisions about resources to be allocated to the segment and assess its performance, and for which discrete financial information is available. Segment results that are reported to the CE&MD include items directly attributable to a segment as well as those that can be allocated on a reasonable basis.
The business segments are engaged in providing products or services which are subject to risks and rewards
which differ from the risk and rewards of other segments. Segments reported are fertilizer, power project and food. 4.30 New accounting standards, amendments and IFRIC interpretations that are not yet effective
Standards, amendments and interpretations to existing standards that are not yet effective and have not been early adopted by the Company:
Effective date (annual reporting periods beginning on or after)
IAS 27 Separate financial statements (Amendments) January 1, 2015 IAS 39 Financial instruments: Recognition and measurement (Amendments) January 1, 2015 IFRS 10 Consolidated financial statements (Amendments) January 1, 2015 IFRS 11 Joint Arrangements January 1, 2015 IFRS 12 Disclosure of interests in other entities (Amendments) January 1, 2015 IFRS 13 Fair value measurement January 1, 2015
The management anticipate that the adoption of the above standards, amendments and interpretations in future periods, will have no material impact on the financial statements other than in presentation / disclosures.
Notes to and forming part of the Consolidated Financial Statementsfor the year ended December 31, 2014

Consolidated Financial Statements of Fauji Fertilizer Company Limited 2014
147
147
Further, the following new standards and interpretations have been issued by the International Accounting Standards Board (IASB), which are yet to be notified by the Securities and Exchange Commission of Pakistan
(SECP), for the purpose of their applicability in Pakistan: Effective date (annual reporting periods beginning on or after)
IFRS 1 First-time adoption of International Financial Reporting standards July 1, 2009 IFRS 9 Financial instruments January 1, 2015 IFRS 14 Regulatory Deferral accounts January 1, 2014 IFRS 15 Revenue from customers January 1, 2014 IFRIC 21 Levies January 1, 2014 The following interpretations issued by the IASB have been waived off by SECP effective January 16, 2012: IFRIC 4 Determining whether an arrangement contains lease IFRIC 12 Service concession arrangements
5. SHARE CAPITAL
AUTHORISED SHARE CAPITAL
This represents 1,500,000,000 (2013: 1,500,000,000) ordinary shares of Rs 10 each amounting to Rs 15,000,000 thousand (2013: Rs 15,000,000 thousand).
ISSUED, SUBSCRIBED AND PAID UP CAPITAL
2014 2013 2014 2013
(Numbers) (Rupees ‘000)
256,495,902 256,495,902 Ordinary shares of Rs 10 each issued for consideration in cash 2,564,959 2,564,959 1,015,742,345 1,015,742,345 Ordinary shares of Rs 10 each issued as fully paid bonus shares 10,157,423 10,157,423 1,272,238,247 1,272,238,247 12,722,382 12,722,382
5.1 Fauji Foundation held 44.35% (2013: 44.35%) ordinary shares of the FFC at the year end.
2014 2013 Note (Rupees ‘000)
6. CAPITAL RESERVES
Share premium 6.1 40,000 156,184
Capital redemption reserve 6.2 120,000 120,000
Translation reserve 451,592 1,048,107
Statutory reserve – 6,436
611,592 1,330,727
6.1 Share premium
This represents premium of Rs 5 per share received on public issue of 8,000,000 ordinary shares of Rs 10 each in 1991.
6.2 Capital redemption reserve
This represents reserve setup on redemption of preference shares of Rs 120,000 thousand in 1996.
Notes to and forming part of the Consolidated Financial Statementsfor the year ended December 31, 2014

148
148
2014 2013 Note (Rupees ‘000)
7. REVENUE RESERVES
General reserve 6,802,360 6,802,360
Unappropriated profit 23,230,168 7,574,207
30,032,528 14,376,567
8. LONG TERM BORROWINGS
Loans from banking companies - secured
FFC 8.1
Al - Baraka Bank (Pakistan) Limited (AIBL) 25,000 75,000
Dubai Islamic Bank (Pakistan) Limited (DIBL - 1) 30,000 90,000
Dubai Islamic Bank (Pakistan) Limited (DIBL - 2) 350,000 450,000
Meezan Bank Limited (MBL) 250,000 500,000
Bank of Punjab (BOP - 1) 125,000 250,000
Bank of Punjab (BOP - 2) 750,000 1,000,000
Allied Bank Limited (ABL) 1,250,000 1,875,000
United Bank Limited (UBL) 1,500,000 1,500,000
4,280,000 5,740,000
FFBL 35
Government of Pakistan loan – 2,514,867
Deferred Government assistance – 77,935
– 2,592,802
FFCEL 8.2
Long term financing from financial institutions 9,157,138 9,500,642
Less: Transaction cost
Initial transaction cost (269,797) (269,797)
Accumulated amortisation 75,934 49,634
8,963,275 9,280,479
FFFL 8.3
MCB Bank Limited (MCB) 1,220,000 593,910
Less: Transaction cost
Initial transaction cost (4,000) (4,000)
Accumulated amortisation 928 187
1,216,928 590,097
14,460,203 18,203,378
Less: Current portion shown under current liabilities 3,054,000 3,812,186
11,406,203 14,391,192
Notes to and forming part of the Consolidated Financial Statementsfor the year ended December 31, 2014
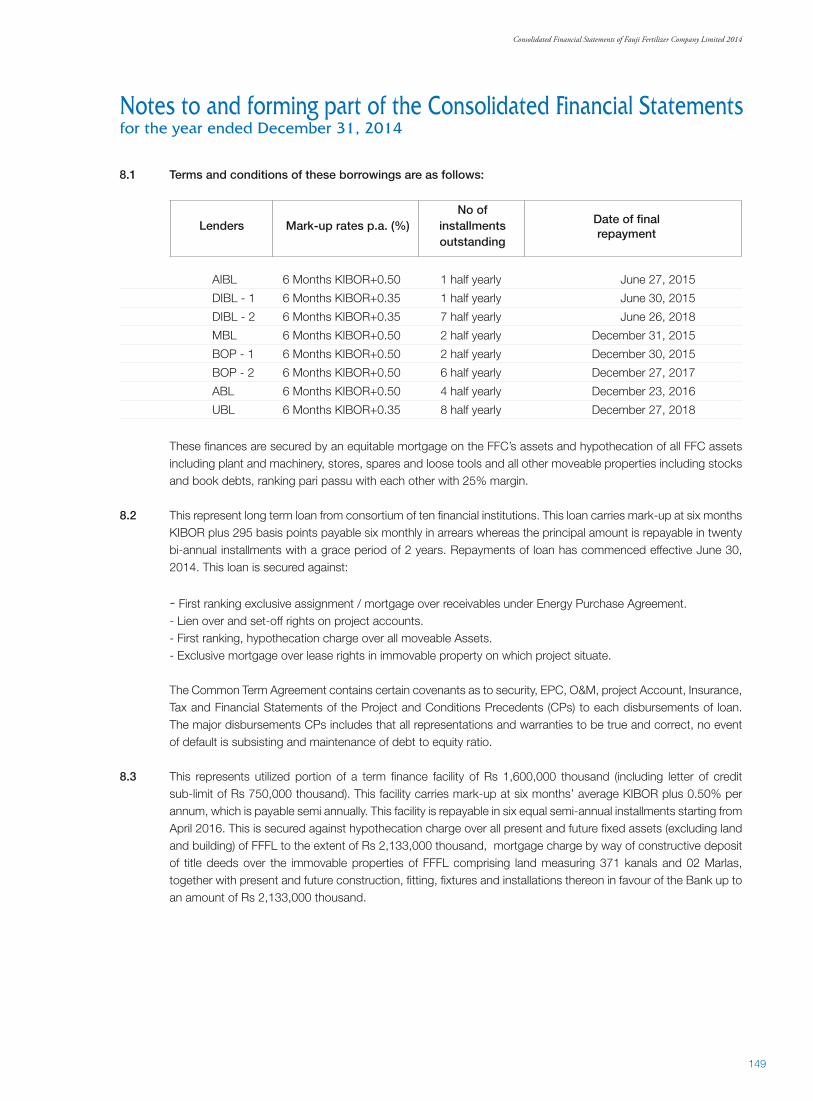
Consolidated Financial Statements of Fauji Fertilizer Company Limited 2014
149
149
8.1 Terms and conditions of these borrowings are as follows: No of Lenders Mark-up rates p.a. (%) installments Date of final outstanding
repayment
AIBL 6 Months KIBOR+0.50 1 half yearly June 27, 2015
DIBL - 1 6 Months KIBOR+0.35 1 half yearly June 30, 2015
DIBL - 2 6 Months KIBOR+0.35 7 half yearly June 26, 2018
MBL 6 Months KIBOR+0.50 2 half yearly December 31, 2015
BOP - 1 6 Months KIBOR+0.50 2 half yearly December 30, 2015
BOP - 2 6 Months KIBOR+0.50 6 half yearly December 27, 2017
ABL 6 Months KIBOR+0.50 4 half yearly December 23, 2016
UBL 6 Months KIBOR+0.35 8 half yearly December 27, 2018
These finances are secured by an equitable mortgage on the FFC’s assets and hypothecation of all FFC assets including plant and machinery, stores, spares and loose tools and all other moveable properties including stocks and book debts, ranking pari passu with each other with 25% margin.
8.2 This represent long term loan from consortium of ten financial institutions. This loan carries mark-up at six months
KIBOR plus 295 basis points payable six monthly in arrears whereas the principal amount is repayable in twenty bi-annual installments with a grace period of 2 years. Repayments of loan has commenced effective June 30, 2014. This loan is secured against:
- First ranking exclusive assignment / mortgage over receivables under Energy Purchase Agreement. - Lien over and set-off rights on project accounts. - First ranking, hypothecation charge over all moveable Assets. - Exclusive mortgage over lease rights in immovable property on which project situate. The Common Term Agreement contains certain covenants as to security, EPC, O&M, project Account, Insurance,
Tax and Financial Statements of the Project and Conditions Precedents (CPs) to each disbursements of loan. The major disbursements CPs includes that all representations and warranties to be true and correct, no event of default is subsisting and maintenance of debt to equity ratio.
8.3 This represents utilized portion of a term finance facility of Rs 1,600,000 thousand (including letter of credit
sub-limit of Rs 750,000 thousand). This facility carries mark-up at six months’ average KIBOR plus 0.50% per annum, which is payable semi annually. This facility is repayable in six equal semi-annual installments starting from April 2016. This is secured against hypothecation charge over all present and future fixed assets (excluding land and building) of FFFL to the extent of Rs 2,133,000 thousand, mortgage charge by way of constructive deposit of title deeds over the immovable properties of FFFL comprising land measuring 371 kanals and 02 Marlas, together with present and future construction, fitting, fixtures and installations thereon in favour of the Bank up to an amount of Rs 2,133,000 thousand.
Notes to and forming part of the Consolidated Financial Statementsfor the year ended December 31, 2014

150
150
2014 2013 Note (Rupees ‘000)
9. DEFERRED LIABILITIES
Deferred taxation 9.1 3,650,872 6,361,908
Provision for compensated leave absences 9.2 923,156 1,176,858
4,574,028 7,538,766
9.1 Deferred taxation
The balance of deferred tax is in respect of the following
major temporary differences:
Accelerated depreciation / amortisation 3,765,586 6,694,906
Provision for slow moving spares, doubtful debts,
other receivables and investments (139,565) (169,561)
Retirement benefit obligations (132,949) (163,437)
Remeasurement of investment available for sale 157,800 –
3,650,872 6,361,908
The gross movement in the deferred tax liability during the
year is as follows:
Balance at the beginning 6,361,908 6,593,232
Tax charge / (credit) recognised in profit and loss account
Continuing operations 203,021 89,000
Discontinued operations 35 (104,258) (342,925)
98,763 (253,925)
Tax charge recognised in other comprehensive income
Continuing operations 188,287 22,601
Discontinued operations 35 – –
188,287 22,601
Discontinued operations 35 (2,998,086) –
Balance at the end 3,650,872 6,361,908
9.2 Movement of provision for compensated leave absences:
Balance at the beginning 1,176,858 994,666
Provision during the year 254,538 311,133
1,431,396 1,305,799
Encashed during the year (67,934) (128,941)
Discontinued operations 35 (440,306) –
Balance at the end 923,156 1,176,858
Actuarial valuation has not been carried out as the impact is considered to be immaterial.
Notes to and forming part of the Consolidated Financial Statementsfor the year ended December 31, 2014

Consolidated Financial Statements of Fauji Fertilizer Company Limited 2014
151
151
2014 2013
(Rupees ‘000)
10. TRADE AND OTHER PAYABLES
Creditors 25,464,059 13,678,058
Accrued liabilities 2,421,200 5,078,342
Consignment account with
Fauji Fertilizer Bin Qasim Limited - unsecured 131,667 –
Sales tax payable - net 1,580,749 814,939
Deposits 215,453 196,107
Retention money 162,956 123,418
Advances from customers 6,378,845 6,944,513
Workers’ Welfare Fund 1,191,661 2,022,640
Payable to gratuity fund – 609,936
Unclaimed dividend 866,481 750,119
Other liabilities 112,998 248,424
38,526,069 30,466,496
Creditors includes Rs 24,740,966 thousand (2013: Rs 8,532,062 thousand) on account of Gas Infrastructure
Development Cess (GIDC). In accordance with GIDC Act, 2011 FFC was required to pay GIDC at the rates
specified in the second schedule. During the year the Honorable Supreme Court dismissed appeals against
an earlier decision of the Honorable Peshawar High Court which declared GIDC Act, 2011 Ultra Vires to
the Constitution. The President of Pakistan promulgated the GIDC Ordinance, 2014 on September 25,
2014 with retrospective effect, this ordinance is yet to be passed by the National Assembly. The Honorable
Islamabad High Court has granted stay against recovery of GIDC through a stay order in December 2014.
Notes to and forming part of the Consolidated Financial Statementsfor the year ended December 31, 2014

152
152
Funded Funded 2014 2013 gratuity pension Total Total (Rupees ‘000)
11. RETIREMENT BENEFIT FUNDS
i) The amounts recognized in the balance sheet
are as follows:
Present value of defined benefit obligation 1,818,169 2,491,821 4,309,990 4,381,921
Fair value of plan assets (1,846,259) (2,550,840) (4,397,099) (3,781,744)
(Assets) / Liabilities (28,090) (59,019) (87,109) 600,177
ii) Amount recognised in the profit and loss
account is as follows:
Current service cost 96,564 101,942 198,506 214,629
Past Service Cost – – – (5,278)
Net interest cost 53,354 1,884 55,238 63,496
149,918 103,826 253,744 272,847
iii) Movement in the present value of defined
benefit obligaion:
Present value of defined benefit obligation at beginning 2,076,036 2,305,885 4,381,921 3,978,300
Current service cost 96,564 101,942 198,506 214,629
Past Service cost – – – (5,278)
Interest cost 201,411 294,552 495,963 469,744
Benefits paid (118,692) (115,654) (234,346) (327,399)
Remeasurement of defined benefit obligation 29,467 (94,904) (65,437) 51,925
Discontinued operations - note 35 (466,617) – (466,617) –
Present value of defined benefit obligation at end 1,818,169 2,491,821 4,309,990 4,381,921
iv) Movement in fair value of plan assets:
Fair value of plan assets at beginning 1,466,100 2,315,644 3,781,744 3,436,119
Expected return on plan assets 148,057 292,668 440,725 406,248
Contributions 586,201 94,067 680,268 181,716
Benefits paid (118,692) (115,654) (234,346) (327,399)
Remeasurement of plan assets 57,557 (35,885) 21,672 85,060
Discontinued operations - note 35 (292,964) – (292,964) –
Fair value of plan assets at end 1,846,259 2,550,840 4,397,099 3,781,744
v) Actual return on plan assets 205,614 256,783 462,397 491,308
vi) Contributions expected to be paid to the plan
during the next year 102,983 100,199 203,182 325,676
vii) Plan assets comprise of:
Investment in debt securities 621,981 1,594,151 2,216,132 2,039,539
Investment in equity securities 800,646 802,931 1,603,577 1,227,771
Deposits with banks 256,635 125,568 382,203 366,053
Mutual Funds 166,997 28,190 195,187 148,381
1,846,259 2,550,840 4,397,099 3,781,744
Notes to and forming part of the Consolidated Financial Statementsfor the year ended December 31, 2014

Consolidated Financial Statements of Fauji Fertilizer Company Limited 2014
153
153
viii) The expected return on plan assets is based on the market expectations and depends upon the asset portfolio
of the Funds, at the beginning of the year, for returns over the entire life of the related obligations.
Funded gratuity Funded pension 2014 2013 2014 2013 (Rupees ‘000) (Rupees ‘000)
ix) Movement in (asset) / liability recognised in
balance sheet:
Opening liability 609,936 491,838 (9,759) 50,343
Cost for the year recognised in profit or loss 149,918 178,466 103,826 94,381
Employer’s contribution during the year (586,201) (134,525) (94,067) (47,191)
Total amount of remeasurement recognised in Other
Comprehensive Income (OCI) during the year (28,090) 74,157 (59,019) (107,292)
Discontinued operations - note 35 (173,653) – – –
Closing (asset) / liability (28,090) 609,936 (59,019) (9,759)
x) Remeasurements recognised in OCI during
the year:
Remeasurment (loss) / gain on obligation (29,467) (103,716) 94,904 51,791
Remeasurment gain / (loss) on plan assets 57,557 29,559 (35,885) 55,501
Remeasurment gain / (loss) recognised in OCI 28,090 (74,157) 59,019 107,292
2014 2013 Funded Funded Funded Funded gratuity pension gratuity pension
(Percentage)
xi) Principal actuarial assumptions used in
the actuarial valuations :
Discount rate 11.5 11.5 13 13
Expected rate of salary growth
Management 11.5 11.5 13 13
Non - Management 10.5 – 12 –
Expected rate of return on plan assets 11.5 11.5 13 13
Expected rate of increase in post retirement pension – 5.5 – 7
Demographic assumptions
Mortality rates (for death in service) SLIC SLIC SLIC SLIC (2001-05)-1 (2001-05)-1 (2001-05) (2001-05) Rates of employee turnover Management Moderate Moderate Moderate Moderate Non - Management Light – Light –
Notes to and forming part of the Consolidated Financial Statementsfor the year ended December 31, 2014

154
154
Defined benefit obligation Effect of 1 Effect of 1 percent percent increase decrease (Rupees ‘000)
Discount rate (346,853) 409,786
Future salary growth 138,515 (127,863)
Future pension 187,001 (160,730)
The impact of changes in financial assumptions has been determined by revaluation of the obligations on different rates.
xiii) The weighted average number of years of defined benefit obligation is given below: Gratuity Pension (Years)
Plan Duration December 31, 2014 6.50 7.00
xiv) The Group contributes to the pension and gratuity funds on the advice of the fund’s actuary. The contributions are equal to the current service cost with adjustment for any deficit. If there is a surplus, the Group takes a contribu-tion holiday.
xv) Projected benefit payments from funds are as follows: Gratuity Pension (Rupees ‘000)
FY 2015 153,782 185,543
FY 2016 332,651 193,880
FY 2017 207,577 207,691
FY 2018 284,307 248,255
FY 2019 232,016 209,189
FY 2020 - FY 2024 1,456,111 1,507,877
FY 2025 - FY 2029 1,926,038 2,179,571
xvi) “Salaries, wages and benefits” expense, stated in notes 29 and 30 include retirement benefits in respect of gratuity, provident fund, pension plans and compensated absences amounting to Rs 149,918 thousand, Rs 112,607 thousand, Rs 103,826 thousand and Rs 172,284 thousand respectively (2013: Rs 178,466 thousand, Rs 156,662 thousand, Rs 94,381 thousand and Rs 311,133 thousand respectively).
xii) Sensitivity analysis
The calculation of the defined benefit obligation is sensitive to assumptions set out above. The following table summarizes how the impact on the defined benefit obligation at the end of the reporting period would have increased / (decreased) as a result of a change in respective assumptions by one percent.
Notes to and forming part of the Consolidated Financial Statementsfor the year ended December 31, 2014

Consolidated Financial Statements of Fauji Fertilizer Company Limited 2014
155
155
2014 2013
Total Total
(Rupees ‘000)
11.1 Defined contribution plans
Details of Employees’ Provident Funds based on un-audited financial statements for the year ended December 31, 2014 are as follows: Size of the fund (total assets) 5,273,006 5,307,850 Cost of investments made 4,533,096 4,517,525 Fair value of investments made 4,737,691 4,813,362 % % Percentage of investments made 90 91
2014 2013 (Rupees ‘000) % age (Rupees ‘000) % age
Breakup of investment - at cost Term deposits and funds with scheduled banks 2,697,876 60 2,619,440 58 Government securities 276,299 6 37,908 1 Listed securities, mutual funds and term finance certificates 1,558,921 34 1,860,177 41 4,533,096 100 4,517,525 100
Investments out of provident fund have been made in accordance with the provisions of section 227 of the Companies Ordinance, 1984 and the rules formulated for the purpose, except for the prescribed limit for listed securities.
2014 2013
Note (Rupees ‘000)
12. INTEREST AND MARK - UP ACCRUED On long term borrowings 93,107 41,856 On short term borrowings 22,784 248,928 115,891 290,78413. SHORT TERM BORROWINGS FFC Short term running finance facilities from banking companies - secured 13.1 MCB Bank Limited (MCB - 1) 1,300,000 1,200,000 MCB Bank Limited (MCB - 2) 100,000 – Allied Bank Limited (ABL) 2,000,000 2,000,000 Bank Al-Habib Limited (BAHL) 989,393 – United Bank Limited (UBL) 750,000 – Askari Bank Limited (AKBL) 491,576 – Bank Alfalah Limited (BAFL) 499,985 – Habib Bank Limited (HBL) 1,596,489 – Istisna facilities Meezan Bank Limited (MBL - 1) 2,925,000 1,200,000 Meezan Bank Limited (MBL - 2) 500,000 2,000,000 Bank Islami Pakistan Limited (BIPL) – 600,000 Dubai Islamic Bank (Pakistan) Limited (DIBL) 450,000 – FFBL From banking companies and financial institutions 35 – 7,985,128 11,602,443 14,985,128
Notes to and forming part of the Consolidated Financial Statementsfor the year ended December 31, 2014

156
156
13.1 Terms and conditions of these borrowings are as follows:
Lender
Mark-up rate p.a. Maturity date
(%)
MCB Bank Limited (MCB - 1) 1 month KIBOR + 0.08 May 31, 2015
MCB Bank Limited (MCB - 2) 1 month KIBOR + 0.35 May 31, 2015
Allied Bank Limited (ABL) 3 month KIBOR + 0.15 July 31, 2015
Bank Al-Habib Limited (BAHL) 1 month KIBOR + 0.05 June 30, 2015
United Bank Limited (UBL) 1 month KIBOR + 0.25 January 31, 2015
Askari Bank Limited (AKBL) 1 month KIBOR + 0.20 June 30, 2015
Bank Alfalah Limited (BAF) 3 month KIBOR + 0.10 March 31, 2015
Habib Bank Limited (HBL) 1 month KIBOR + 0.30 April 30, 2015
Meezan Bank Limited (MBL - 1) 3 month KIBOR + 0.10 May 31, 2015
Meezan Bank Limited (MBL - 2) 3 month KIBOR + 0.05 March 26, 2015
Dubai Islamic Bank (Pakistan) Limited (DIBL) 1 month KIBOR + 0.10 June 30, 2015
These represent amounts available against facilities available from various banking companies under mark-up /
profit arrangements amounting to Rs 13.30 billion (2013: Rs 10.35 billion) which represent the aggregate of sale
prices of all mark-up / profit agreements between the Company and respective banks.
The facilities are secured by pari passu and ranking hypothecation charges on assets of the Company. Facilities
amounting to Rs 1.0 billion (2013: Rs 2.0 billion) are secured against lien over Term Deposit Receipts / PIBs.
2014 2013
(Rupees ‘000)
14. CONTINGENCIES AND COMMITMENTS
a) Contingencies:
i) Guarantees issued by banks on behalf of the Group companies 50,997 88,979
ii) Claims against FFC and / or potential exposure not acknowledged as debt 50,696 50,696
iii) The delay in the payment of sales tax on supply of electricity to NTDC
for the period from September 2013 to November 2014 could result in
levy of additional tax and penalties on FFCEL. FFCEL has already taken
up the matter at High Court and the consultants are of the opinion that
since the matter was sub judice, therefore, probability of levy of additional
tax and penalties are remote. 56,123 –
iv) The Competition Commission of Pakistan has imposed a penalty of Rs 5.5 billion on FFC for alleged
unreasonable increase in urea prices during the year 2011. However, the fact remains that price increase
was essentially caused by extended gas curtailment and delayed urea imports by the Government of
Pakistan resulting in product shortage leading to market imbalance and price hike. FFC has filed an appeal
against the above penalty before the Competition Appellate Tribunal. Based on legal advice from the FFC’s
legal advisor, the FFC is confident that there are reasonable grounds for a favourable decision.
Notes to and forming part of the Consolidated Financial Statementsfor the year ended December 31, 2014

Consolidated Financial Statements of Fauji Fertilizer Company Limited 2014
157
157
2014 2013
(Rupees ‘000)
b) Commitments in respect of:
i) Capital expenditure 2,994,277 1,916,960
ii) Purchase of fertilizer, stores, spares and other operational items 2,869,125 3,527,402
iii) Letter of credit issued by bank on behalf of FFCEL in ordinary
course of business, outstanding at year end – 468,107
iv) Investment in Fauji Fresh n Freeze Limited (formerly Al - Hamd
Foods Limited) 100,000 550,000
v) Group’s share of commitments of PMP as at September 30, 2014 – 271,442
vi) Rentals under lease agreements:
Premises- not later than one year 71,398 88,464
- later than one year and not later than:
two years 31,740 47,878
three years 52,054 23,740
four years 27,262 26,395
five years 46,587 879
Vehicles - not later than one year 33,538 33,292
- later than one year and not later than:
two years 23,263 21,596
three years 15,376 18,695
four years 12,592 11,679
five years 10,691 6,363
Notes to and forming part of the Consolidated Financial Statementsfor the year ended December 31, 2014

158
158
As
at J
anua
ry 1
, 201
3 C
ost
6
54,8
11
392
,100
4
,888
,462
2
,137
,540
2
6,51
7 4
9,85
4,22
5
1,47
5,84
1
532
,187
2
06,3
59
707
,327
1
,675
,908
2
2,28
0 1
3,35
5,59
6
–
75,
929,
153
Accu
mul
ated
Dep
reci
atio
n –
(189
,712
) (1
,808
,180
) (6
24,2
57)
(26,
517)
(27,
750,
235)
(7
21,7
96)
(323
,260
) (1
08,1
49)
(426
,656
) (1
,251
,566
) (1
9,77
8)
–
–
(3
3,25
0,10
6)N
et B
ook
Valu
e 6
54,8
11
202
,388
3
,080
,282
1
,513
,283
–
2
2,10
3,99
0
754
,045
2
08,9
27
98,
210
2
80,6
71
424
,342
2
,502
13
,355
,596
–
4
2,67
9,04
7 Ye
ar e
nded
Dec
embe
r 31,
201
3 O
peni
ng N
et B
ook
Valu
e 6
54,8
11
202
,388
3
,080
,282
1
,513
,283
–
2
2,10
3,99
0
754
,045
2
08,9
27
98,
210
2
80,6
71
424
,342
2
,502
13
,355
,596
–
4
2,67
9,04
7 Ad
ditio
ns
68,
709
4
1,40
4
418
,168
–
–
1,0
56,5
89
312
,601
4
49,7
62
111
,330
1
66,7
86
237
,379
1
,902
4
,947
,444
2
,439
7
,814
,513
D
ispo
sals
Cos
t –
–
(1
7,12
7)
–
–
(122
) –
(19,
901)
(4
,207
) (7
6,47
6)
(12,
892)
–
–
–
(130
,725
)
Dep
reci
atio
n –
–
–
–
–
50
–
15,
335
3
,573
6
9,60
7
12,
638
–
–
–
101
,203
–
–
(1
7,12
7)
–
–
(72)
–
(4,5
66)
(634
) (6
,869
) (2
54)
–
–
–
(2
9,52
2)Tr
ansf
ers
/ adj
ustm
ents
–
–
–
211
,537
–
1
2,26
4,87
5
–
–
16,
022
–
–
–
(1
5,24
7,83
8)
–
(2,
755,
404)
Dep
reci
atio
n C
harg
e –
(19,
730)
(2
09,7
65)
(69,
700)
–
(2
,397
,137
) (2
88,0
94)
(96,
105)
(2
8,30
6)
(109
,689
) (1
73,5
66)
(1,4
18)
–
(2
44)
(3,3
93,7
54)
Clo
sing
Net
Boo
k Va
lue
723
,520
2
24,0
62
3,2
71,5
58
1,6
55,1
20
–
33,
028,
245
7
78,5
52
558
,018
1
96,6
22
330
,899
4
87,9
01
2,9
86
3,0
55,2
02
2,1
95
44,
314,
880
As
at J
anua
ry 1
, 201
4 C
ost
72
3,52
0
433
,504
5
,289
,503
2
,349
,077
2
6,51
7 6
3,17
5,56
7
1,78
8,44
2
962
,048
3
29,5
04
797
,637
1
,900
,395
2
4,18
2
3,0
55,2
02
2,4
39
80,
857,
537
Accu
mul
ated
dep
reci
atio
n –
(209
,442
) (2
,017
,945
) (6
93,9
57)
(26,
517)
(30,
147,
322)
(1,
009,
890)
(4
04,0
30)
(132
,882
) (4
66,7
38)
(1,4
12,4
94)
(21,
196)
–
(244
) (3
6,54
2,65
7)N
et B
ook
Valu
e 7
23,5
20
224
,062
3
,271
,558
1
,655
,120
–
3
3,02
8,24
5
778
,552
5
58,0
18
196
,622
3
30,8
99
487
,901
2
,986
3
,055
,202
2
,195
4
4,31
4,88
0 Ye
ar e
nded
Dec
embe
r 31,
201
4 O
peni
ng N
et B
ook
Valu
e 7
23,5
20
224
,062
3
,271
,558
1
,655
,120
–
3
3,02
8,24
5
778
,552
5
58,0
18
196
,622
3
30,8
99
487
,901
2
,986
3
,055
,202
2
,195
4
4,31
4,88
0 Ad
ditio
ns
435
,083
–
306
,957
2
33,2
68
–
1,3
55,7
66
586
,343
1
21,1
61
54,
611
2
03,4
08
268
,718
1
,434
4
,262
,883
–
7,82
9,63
2 D
ispo
sals
Cos
t
–
–
(1
,578
) –
–
(8
,696
) (2
13,7
69)
(18,
607)
(1
,516
) (8
4,86
1)
(17,
449)
–
–
–
(346
,476
)
Dep
reci
atio
n –
–
1
,051
–
–
2
,197
2
13,7
69
18,
049
1
,348
7
5,81
8
17,
085
–
–
–
329
,317
–
–
(5
27)
–
–
(6,4
99)
–
(5
58)
(168
) (9
,043
) (3
64)
–
–
–
(17,
159)
Tran
sfer
s –
–
–
–
–
–
–
–
–
–
–
–
(2,2
70,7
57)
–
(2,
270,
757)
Adju
stm
ents
Cos
t –
–
(1,
733,
407)
1
,733
,407
–
–
–
–
–
3,0
06
–
–
–
(3
,006
) –
Accu
mul
ated
dep
reci
atio
n –
–
1
08,4
59
(108
,459
) –
–
–
–
–
(1,9
48)
–
–
–
1
,948
–
–
–
(1,
624,
948)
1
,624
,948
–
–
–
–
–
1,0
58
–
–
–
(1
,058
) –
D
epre
ciat
ion
Cha
rge
–
(1
9,74
9)
(145
,194
) (1
39,4
41)
–
(2,3
80,6
83)
(305
,824
) (1
15,3
27)
(31,
120)
(1
14,2
69)
(218
,271
) (1
,491
) –
(379
) (3
,471
,748
)D
isco
ntin
ued
oper
atio
ns –
not
e 35
C
ost
(5
41,3
31)
(254
,754
) –
(2
,104
,372
) –
(2
3,79
4,96
3)
(353
,078
) (9
5,82
6)
(29,
344)
(3
32,7
31)
(181
,649
) (2
,086
) (1
,196
,441
) –
(2
8,88
6,57
5)
Accu
mul
ated
dep
reci
atio
n –
94,
450
–
692
,991
–
1
4,17
3,69
0
238
,325
5
2,27
6
6,9
53
185
,754
1
59,8
38
2,0
70
–
–
15
,606
,347
(541
,331
) (1
60,3
04)
–
(1,4
11,3
81)
–
(9,6
21,2
73)
(114
,753
) (4
3,55
0)
(22,
391)
(1
46,9
77)
(21,
811)
(1
6)
(1,1
96,4
41)
–
(13,
280,
228)
Bal
ance
as
at D
ecem
ber 3
1, 2
014
617
,272
4
4,00
9
1,8
07,8
46
1,9
62,5
14
–
22,
375,
556
9
44,3
18
519
,744
1
97,5
54
265
,076
5
16,1
73
2,9
13
3,8
50,8
87
758
3
3,10
4,62
0A
s at
Dec
embe
r 31,
201
4 C
ost
6
17,2
72
178
,750
3
,969
,934
2
,102
,921
2
6,51
7 4
0,72
7,67
4
1,80
7,93
8
968
,776
3
53,2
55
584
,511
1
,970
,015
2
3,53
0
3,8
50,8
87
1,3
81
57,
183,
361
Accu
mul
ated
dep
reci
atio
n –
(134
,741
) (2
,162
,088
) (1
40,4
07)
(26,
517)
(18,
352,
118)
(8
63,6
20)
(449
,032
) (1
55,7
01)
(319
,435
) (1
,453
,842
) (2
0,61
7)
–
(6
23)
(24,
078,
741)
Net
Boo
k Va
lue
617
,272
4
4,00
9
1,8
07,8
46
1,9
62,5
14
–
22,
375,
556
9
44,3
18
519
,744
1
97,5
54
265
,076
5
16,1
73
2,9
13
3,8
50,8
87
758
3
3,10
4,62
0 R
ate
of d
epre
ciat
ion
/ am
ortis
atio
n in
%
–
61/4
to 9
1/4
5 to
10
5 5
5 20
15
10
20
15
– 3
3 1/
3 30
–
–
–
Fre
ehol
d Le
aseh
old
Build
ing
and
Build
ing
and
Railw
ay
Plan
t and
Ca
talys
ts
Offic
e an
d Fu
rnitu
re
Vehi
cles
Main
tena
nce
Li
brar
y
Capi
tal w
ork
Leas
e
Tota
l
lan
d lan
d
stru
ctur
es o
n st
ruct
ures
on
sidin
g
mac
hine
ry
ele
ctric
al an
d
an
d ot
her
book
s in
pro
gres
s ve
hicle
s
fre
ehol
d lan
d lea
shol
d lan
d
equi
pmen
t fix
ture
s
equi
pmen
t
(not
e 15
.3)
(R
upee
s ‘0
00)
15.
PR
OP
ER
TY,
PLA
NT
AN
D E
QU
IPM
EN
T
Notes to and forming part of the Consolidated Financial Statementsfor the year ended December 31, 2014

Consolidated Financial Statements of Fauji Fertilizer Company Limited 2014
159
159
2014 2013
Note (Rupees ‘000)
15.1 Depreciation charge has been allocated as follows:
Continuing operations
Cost of sales 29 2,329,025 1,926,004
Administrative and distribution expenses 30 77,988 68,590
Charged to FFBL 7,378 –
Discontinued operations
Cost of sales 35 1,015,698 1,360,967
Administrative and distribution expenses 35 41,659 38,193
3,471,748 3,393,754
15.2 Details of property, plant and equipment disposed off:
Mode of Original Book Sale
Description disposal Cost value proceeds
( Rupees ‘000 )
Office and electrical equipment, furniture and
fixture and maintenance and other equipment
Mr Chaudhry Khurshid Through negotiation 950 418 450
M/s EFU Insurance Insurance claim 16,989 11,282 22,115
Vehicles
Mr Chaudhry Khurshid Through negotiation 1,839 577 1,500
Aggregate of other items of property, plant
and equipment with individual book values
not exceeding Rs 50 thousand 283,065 930 23,195
Continuing operations 302,843 13,207 47,260
Discontinued operations 43,633 3,952 17,999
2014 346,476 17,159 65,259
Continuing operations 100,271 24,631 51,639
Discontinued operations 30,454 4,891 17,716
2013 130,725 29,522 69,355
2014 2013
Note (Rupees ‘000)
15.3 Capital Work in Progress
Civil works including mobilization advance 770,814 997,105
Plant and machinery including advances to suppliers 3,080,073 2,052,557
Intangible assets under development – 5,540
3,850,887 3,055,202
16. INTANGIBLE ASSETS
Computer software 16.1 41,970 82,358
Goodwill 16.2 1,932,561 1,932,561
1,974,531 2,014,919
Notes to and forming part of the Consolidated Financial Statementsfor the year ended December 31, 2014

160
160
2014 2013
Note (Rupees ‘000)
16.1 Computer Software
Balance at beginning 82,358 118,685
Additions during the year 8,802 19,304
Amortisation charged for the year (49,190) (55,631)
Balance at end 41,970 82,358
Amortisation rate 33 1/3% 33 1/3%
Amortisation charge has been allocated as follows:
Cost of sales 29 37,484 31,762
Administrative and distribution expenses 30 11,706 23,869
49,190 55,631
16.2 Goodwill
Goodwill on acquisition of PSFL 16.3 1,569,234 1,569,234
Goodwill on acquisition of FFFL 16.4 363,327 363,327
1,932,561 1,932,561
16.3 This represents excess of the amount paid by FFC over fair value of net assets of Pak Saudi Fertilizer Company
Limited (PSFL) on its acquisition. The recoverable amount of goodwill was tested for impairment by allocating
the amount of goodwill to respective assets on which it arose, based on value in use in accordance with
IAS-36 “Impairment of Assets”. The value in use calculations are based on cash flow projections. These are
then extrapolated for a period of 5 years using a steady long term expected demand growth of 2% and terminal
value determined based on long term earning multiples. The cash flows are discounted using a discount rate of
16.4%. Based on this calculation no impairment is required to be accounted for against the carrying amount of
goodwill.
16.4 This represents excess of the amount paid by FFC over fair value of net assets of Fauji Fresh n Freeze Limited
(formerly Al-Hamd Foods Limited) on its acquisition. The recoverable amount of goodwill was tested for
impairment by allocating the amount of goodwill to respective cash generating unit on which it arose, based on
value in use in accordance with IAS-36 “Impairment of Assets”. The value in use calculations are based on cash
flow projections. The cash flows are discounted using a discount rate of 16.4%. Based on this calculation no
impairment is required to be accounted for against the carrying amount of goodwill.
2014 2013
Note (Rupees ‘000)
17. LONG TERM INVESTMENTS
Equity accounted investments 17.1 34,453,126 7,567,355
Askari Bank Limited 17.4 – 15,692,911
Other long term investments 17.2 7,334,005 218,606
41,787,131 23,478,872
Notes to and forming part of the Consolidated Financial Statementsfor the year ended December 31, 2014
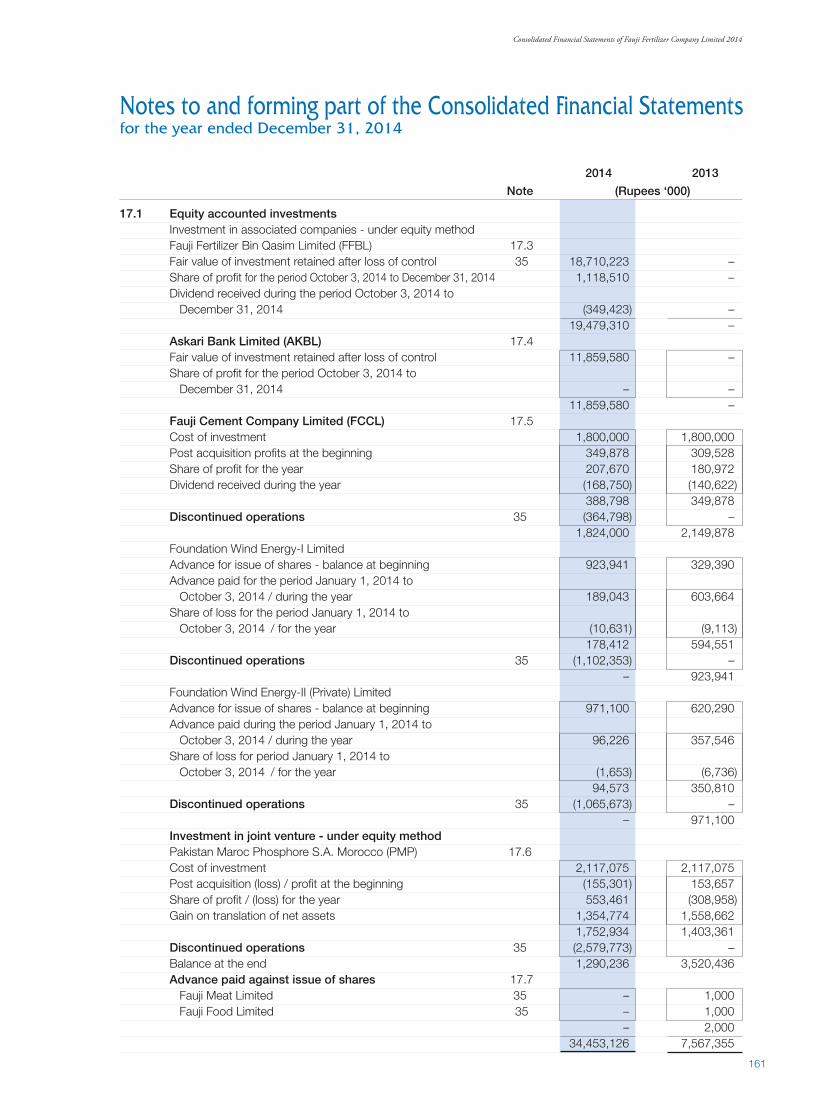
Consolidated Financial Statements of Fauji Fertilizer Company Limited 2014
161
161
2014 2013
Note (Rupees ‘000)
17.1 Equity accounted investments Investment in associated companies - under equity method Fauji Fertilizer Bin Qasim Limited (FFBL) 17.3 Fair value of investment retained after loss of control 35 18,710,223 – Share of profit for the period October 3, 2014 to December 31, 2014 1,118,510 – Dividend received during the period October 3, 2014 to December 31, 2014 (349,423) – 19,479,310 – Askari Bank Limited (AKBL) 17.4 Fair value of investment retained after loss of control 11,859,580 – Share of profit for the period October 3, 2014 to December 31, 2014 – – 11,859,580 – Fauji Cement Company Limited (FCCL) 17.5 Cost of investment 1,800,000 1,800,000 Post acquisition profits at the beginning 349,878 309,528 Share of profit for the year 207,670 180,972 Dividend received during the year (168,750) (140,622) 388,798 349,878 Discontinued operations 35 (364,798) – 1,824,000 2,149,878 Foundation Wind Energy-I Limited Advance for issue of shares - balance at beginning 923,941 329,390 Advance paid for the period January 1, 2014 to October 3, 2014 / during the year 189,043 603,664 Share of loss for the period January 1, 2014 to October 3, 2014 / for the year (10,631) (9,113) 178,412 594,551 Discontinued operations 35 (1,102,353) – – 923,941 Foundation Wind Energy-II (Private) Limited Advance for issue of shares - balance at beginning 971,100 620,290 Advance paid during the period January 1, 2014 to October 3, 2014 / during the year 96,226 357,546 Share of loss for period January 1, 2014 to October 3, 2014 / for the year (1,653) (6,736) 94,573 350,810 Discontinued operations 35 (1,065,673) – – 971,100 Investment in joint venture - under equity method Pakistan Maroc Phosphore S.A. Morocco (PMP) 17.6 Cost of investment 2,117,075 2,117,075 Post acquisition (loss) / profit at the beginning (155,301) 153,657 Share of profit / (loss) for the year 553,461 (308,958) Gain on translation of net assets 1,354,774 1,558,662 1,752,934 1,403,361 Discontinued operations 35 (2,579,773) – Balance at the end 1,290,236 3,520,436 Advance paid against issue of shares 17.7 Fauji Meat Limited 35 – 1,000 Fauji Food Limited 35 – 1,000 – 2,000 34,453,126 7,567,355
Notes to and forming part of the Consolidated Financial Statementsfor the year ended December 31, 2014

162
162
2014 2013
Note (Rupees ‘000)
17.2 Other long term investments
Investments available for sale 17.8
Certificates of Investment 113,868 118,239
Pakistan Investment Bonds 7,178,198 59,497
Term Finance Certificates 99,500 96,000
Arabian Sea Country Club Limited (ASCCL) 35
(300,000 shares of Rs 10 each) – 3,000
Less: Impairment in value of investment – (3,000)
– –
7,391,566 273,736
Less: Current portion shown under short term investments
Certificates of Investment 27,094 26,005
Pakistan Investment Bonds 30,467 29,125
Term Finance Certificates – –
26 57,561 55,130
7,334,005 218,606
17.3 Investment in FFBL - at equity method
As explained in note 1.2, FFC has lost control over FFBL and investment of 465,892 thousand fully paid ordinary
shares of Rs 10 each representing 49.88% of FFBL’s share capital retained in FFBL as at December 31, 2014 is
remeasured to its fair value at the date when control is lost. FFBL became associated company and investment
is accounted for under equity method. Market value of the FFC’s investment in FFBL as at December 31, 2014
was Rs 21,062,973 thousand.
17.4 Investment in AKBL - at equity method
As explained in note 1.2, FFC has lost control over AKBL and investment retained in AKBL of 543,768 thousand
fully paid ordinary shares of Rs 10 each representing 43.15% (2013: 43.15%) of AKBL’s share capital as at
December 31, 2014 is remeasured to its fair value at the date when control is lost. AKBL became associated
company and investment is accounted for under equity method. Market value of FFC’s investment in AKBL as at
December 31, 2014 was Rs 12,544,728 thousand.
17.5 Investment in FCCL - at equity method
Investment in FCCL represents 93,750 thousand fully paid ordinary shares of Rs 10 each representing 6.79%
of its share capital as at December 31, 2014. FFC is committed not to dispose off its investment in FCCL so
long as the loan extended to FCCL by Faysal Bank Limited, remains outstanding or without prior consent of
FCCL. Market value of the FFC’s investment as at December 31, 2014 was Rs 2,422,500 thousand (2013:
Rs 1,495,313 thousand).
Notes to and forming part of the Consolidated Financial Statementsfor the year ended December 31, 2014
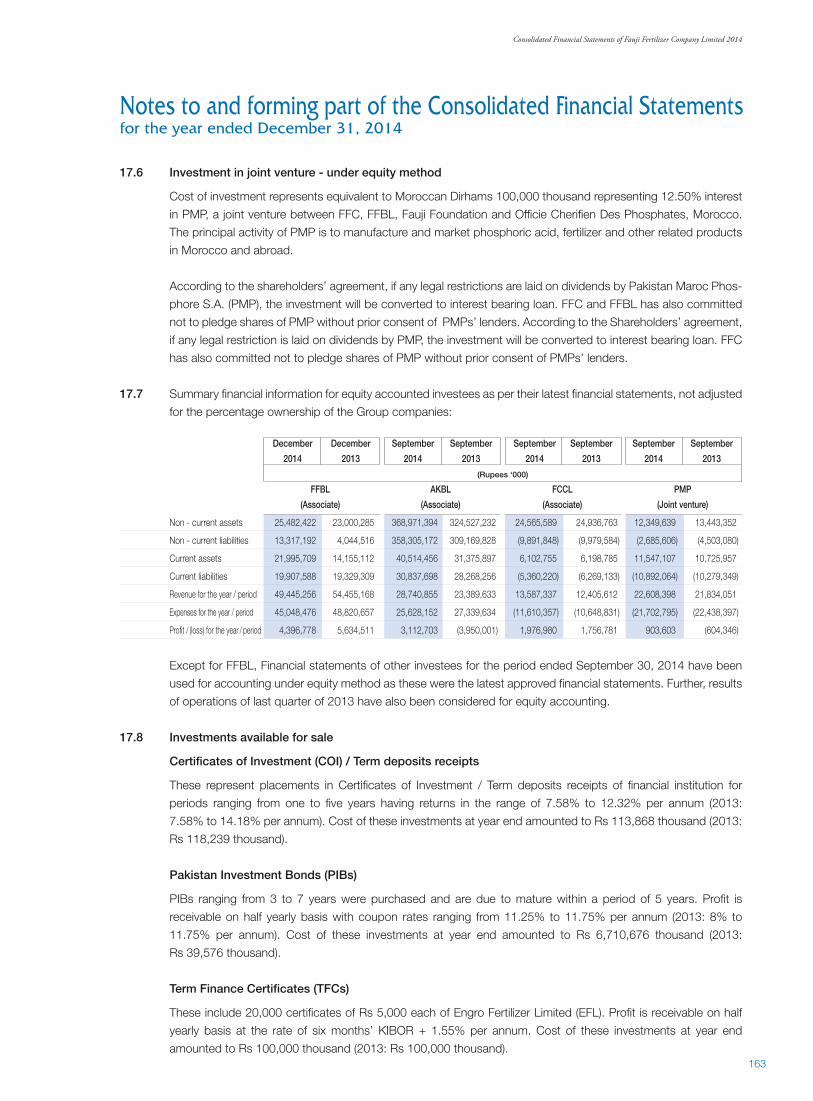
Consolidated Financial Statements of Fauji Fertilizer Company Limited 2014
163
163
December December September September September September September September
2014 2013 2014 2013 2014 2013 2014 2013
(Rupees ‘000)
FFBL AKBL FCCL PMP
(Associate) (Associate) (Associate) (Joint venture)
Non - current assets 25,482,422 23,000,285 368,971,394 324,527,232 24,565,589 24,936,763 12,349,639 13,443,352
Non - current liabilities 13,317,192 4,044,516 358,305,172 309,169,828 (9,891,848) (9,979,584) (2,685,606) (4,503,080)
Current assets 21,995,709 14,155,112 40,514,456 31,375,897 6,102,755 6,198,785 11,547,107 10,725,957
Current liabilities 19,907,588 19,329,309 30,837,698 28,268,256 (5,360,220) (6,269,133) (10,892,064) (10,279,349)
Revenue for the year / period 49,445,256 54,455,168 28,740,855 23,389,633 13,587,337 12,405,612 22,608,398 21,834,051
Expenses for the year / period 45,048,476 48,820,657 25,628,152 27,339,634 (11,610,357) (10,648,831) (21,702,795) (22,438,397)
Profit / (loss) for the year / period 4,396,778 5,634,511 3,112,703 (3,950,001) 1,976,980 1,756,781 903,603 (604,346)
Except for FFBL, Financial statements of other investees for the period ended September 30, 2014 have been
used for accounting under equity method as these were the latest approved financial statements. Further, results
of operations of last quarter of 2013 have also been considered for equity accounting.
17.8 Investments available for sale
Certificates of Investment (COI) / Term deposits receipts
These represent placements in Certificates of Investment / Term deposits receipts of financial institution for
periods ranging from one to five years having returns in the range of 7.58% to 12.32% per annum (2013:
7.58% to 14.18% per annum). Cost of these investments at year end amounted to Rs 113,868 thousand (2013:
Rs 118,239 thousand).
Pakistan Investment Bonds (PIBs)
PIBs ranging from 3 to 7 years were purchased and are due to mature within a period of 5 years. Profit is
receivable on half yearly basis with coupon rates ranging from 11.25% to 11.75% per annum (2013: 8% to
11.75% per annum). Cost of these investments at year end amounted to Rs 6,710,676 thousand (2013:
Rs 39,576 thousand).
Term Finance Certificates (TFCs)
These include 20,000 certificates of Rs 5,000 each of Engro Fertilizer Limited (EFL). Profit is receivable on half
yearly basis at the rate of six months’ KIBOR + 1.55% per annum. Cost of these investments at year end
amounted to Rs 100,000 thousand (2013: Rs 100,000 thousand).
17.6 Investment in joint venture - under equity method
Cost of investment represents equivalent to Moroccan Dirhams 100,000 thousand representing 12.50% interest
in PMP, a joint venture between FFC, FFBL, Fauji Foundation and Officie Cherifien Des Phosphates, Morocco.
The principal activity of PMP is to manufacture and market phosphoric acid, fertilizer and other related products
in Morocco and abroad.
According to the shareholders’ agreement, if any legal restrictions are laid on dividends by Pakistan Maroc Phos-
phore S.A. (PMP), the investment will be converted to interest bearing loan. FFC and FFBL has also committed
not to pledge shares of PMP without prior consent of PMPs’ lenders. According to the Shareholders’ agreement,
if any legal restriction is laid on dividends by PMP, the investment will be converted to interest bearing loan. FFC
has also committed not to pledge shares of PMP without prior consent of PMPs’ lenders.
17.7 Summary financial information for equity accounted investees as per their latest financial statements, not adjusted
for the percentage ownership of the Group companies:
Notes to and forming part of the Consolidated Financial Statementsfor the year ended December 31, 2014

164
164
2014 2013 Note (Rupees ‘000)
18. LONG TERM LOANS AND ADVANCES - SECURED
Loans and advances - considered good, to: 18.1
Executives 769,788 693,808
Other employees 338,839 285,950
1,108,627 979,758
Less: Amount due within twelve months, shown
under current loans and advances 23 285,439 239,350
823,188 740,408
18.1 Reconciliation of carrying amount of loans and advances:
Other 2014 2013
Executives employees Total Total
(Rupees ‘000)
Balance at January 1 693,808 285,950 979,758 939,698
Disbursements 346,518 127,156 473,674 427,975
1,040,326 413,106 1,453,432 1,367,673
Repayments 270,538 74,267 344,805 387,915
Balance at December 31 769,788 338,839 1,108,627 979,758 These represent secured house building loans, house rent advances and advances pursuant to agreement with
employees which are repayable within one to ten years. House building loans carry mark-up at 7% per annum. The maximum amount of loans and advances to executives outstanding at the end of any month during the year
was Rs 772,804 thousand (2013: Rs 769,035 thousand).
2014 2013 Note (Rupees ‘000)
19. LONG TERM DEPOSITS AND PREPAYMENTS
Deposits 14,568 82,493
Prepayments 3,236 562
17,804 83,055
20. STORES, SPARES AND LOOSE TOOLS Stores 266,801 619,128 Spares 3,127,230 4,846,761 Provision for slow moving spares 20.1 (390,866) (497,722) 2,736,364 4,349,039 Loose tools 132 108 Items in transit 311,526 383,863 3,314,823 5,352,138
20.1 Movement of provision for slow moving spares Balance at the beginning 497,722 467,714 Provision during the year 58,694 30,008 Discontinued operations 35 (165,550) – Balance at the end 390,866 497,722
Notes to and forming part of the Consolidated Financial Statementsfor the year ended December 31, 2014

Consolidated Financial Statements of Fauji Fertilizer Company Limited 2014
165
165
2014 2013 Note (Rupees ‘000)
21. STOCK IN TRADE
Raw materials 227,227 354,496
Work in process 64,860 94,839
Finished goods - manufactured urea 584,930 619,020
- purchased fertilizer 21,504 –
Stocks in transit 86,826 362,859
985,347 1,431,214
22. TRADE DEBTS
Considered good:
Secured
against bank guarantees 772,417 2,226,368
against guarantee issued by the Government of Pakistan 22.1 1,394,381 567,071
Unsecured 54,465 77,816
Considered doubtful 1,758 1,758
2,223,021 2,873,013
Provision for doubtful debts (1,758) (1,758)
2,221,263 2,871,255
22.1 These are secured by way of Guarantee issued by the Government of Pakistan under the Implementation
Agreement dated February 18, 2011. Further these are subject to mark-up on delay payments under Energy Purchase Agreement dated April 5, 2011 at the rate of 3 month Kibor plus 4.5% per annum.
Included in trade debts is an amount of Rs 715,051 thousand receivable from NTDC on account of sales tax
invoices raised for the period from May 2013 to December 2014. Earlier the matter relating to chargeability of sales tax on supply of electricity generated through wind was under litigation, because of the reason that settlement of sales tax due from NTDC was disallowed by NTDC on the understanding that tariff structure for wind power companies represents only fixed component and accordingly not subject to sales tax under the Sales Tax Act, 1990 read with allied rules. However during the year the Appellate Tribunal Inland Revenue (ATIR) has decided that supply and distribution of electricity generated through wind is chargeable to sales tax, accordingly FFCEL has issued sales tax invoices to NTDC.
2014 2013 Note (Rupees ‘000)
23. LOANS AND ADVANCES
Current portion of long term loans and advances 18 285,439 239,350
Loans and advances - unsecured - considered good
- Executives 55,019 386,821
- Others 28,905 165,324
Advances to suppliers - considered good 162,016 708,552
531,379 1,500,047
Notes to and forming part of the Consolidated Financial Statementsfor the year ended December 31, 2014

166
166
2014 2013
Note (Rupees ‘000)
24. DEPOSITS AND PREPAYMENTS
Deposits 1,824 12,193
Prepayments 25,765 62,062
27,589 74,255
25. OTHER RECEIVABLES
Accrued income on investments and bank deposits 534,778 185,948
Sales tax receivable 42,486 233,177
Advance tax 25.1 322,475 325,957
Receivable from Workers’ Profit Participation
Fund - unsecured 25.2 55,300 10,032
Due from government agencies 37,953 –
Due from Gratuity Fund 28,090 –
Due from Pension Fund 59,019 9,759
Other receivables
considered good 102,126 291,325
considered doubtful 2,232 2,232
Provision for doubtful receivables (2,232) (2,232)
102,126 291,325
1,182,227 1,056,198
25.1 This represents tax paid by PSFL in excess of admitted tax liabilities net of adjustments of determined refunds. FFC
intends to adjust the remaining amount after finalisation of pending re-assessments by the taxation authorities.
2014 2013
Note (Rupees ‘000)
25.2 Workers’ Profit Participation Fund (WPPF)
Balance at beginning 10,032 53,095
Allocation for the year (1,409,278) (2,029,763)
Adjustment for prior years – (6,790)
Receipt from fund 25.2.1 (69,917) (73,552)
Payment to fund 1,475,000 2,067,042
Discontinued operations 35 49,463 –
55,300 10,032
25.2.1 This represents amount paid to WPPF in prior years’ in excess of obligation.
Notes to and forming part of the Consolidated Financial Statementsfor the year ended December 31, 2014

Consolidated Financial Statements of Fauji Fertilizer Company Limited 2014
167
167
2014 2013
Note (Rupees ‘000)
26. SHORT TERM INVESTMENTS
Term deposits with banks and financial institutions
Loans and receivables 26.1
Local currency - Net of provision for doubtful recovery
Rs 3,900 thousand (2013: Rs 3,900 thousand) 25,400,000 18,620,000
Foreign currency 1,309,818 1,335,731
26,709,818 19,955,731
Investments at fair value through profit or loss 26.2
Market treasury bills / money market funds 665,458 4,272,570
Current maturity of long term investments
Available for sale 17 57,561 55,130
27,432,837 24,283,431
26.1 These represent investments having maturities ranging between 1 to 12 months and are being carried at cost as
management expects there would be insignificant change in the rate of returns on comparable investments. Term
deposits receipts amounting to Rs 500,000 thousand (2013: Rs 2,000,000 thousand) are under lien of an Islamic
financial institution in respect of Istisna facility availed.
26.2 Fair values of these investments are determined using quoted market / repurchase price.
2014 2013
(Rupees ‘000)
27. CASH AND BANK BALANCES
At banks
Deposit accounts
Local currency 2,048,137 3,852,524
Foreign currency (US $ 29,000 : 2013 ; US $ 26,154) 2,919 2,806
2,051,056 3,855,330
Current accounts
Local currency (2,052) 335,586
Cash in hand 1,598 3,013
2,050,602 4,193,929
27.1 Balances with banks include Rs 653,943 thousand (2013: Rs 567,735 thousand) in respect of security deposits
received.
27.2 Balances with banks carry markup ranging from 5% to 10% (2013: 5% to 10.25%) per annum.
Notes to and forming part of the Consolidated Financial Statementsfor the year ended December 31, 2014

168
168
(Re-presented) 2014 2013 Note (Rupees ‘000)
29. COST OF SALES
Raw materials consumed 24,372,474 18,614,731
Fuel and power 7,713,599 6,820,526
Chemicals and supplies 366,674 377,799
Salaries, wages and benefits 5,023,955 4,080,120
Training and employees welfare 833,770 708,160
Rent, rates and taxes 16,099 23,248
Insurance 255,119 242,076
Travel and conveyance 29.1 479,802 391,572
Repairs and maintenance (includes stores and spares consumed
of Rs 1,239,353 thousand; (2013: Rs 1,267,633 thousand)) 1,371,026 1,411,405
Depreciation 15.1 2,329,025 1,926,004
Amortisation 16.1 37,484 31,762
Communication and other expenses 29.2 1,641,817 1,844,199
44,440,844 36,471,602
Opening stock - work in process 67,903 45,216
Closing stock - work in process (64,860) (67,903)
3,043 (22,687)
Cost of goods manufactured 44,443,887 36,448,915
Opening stock of manufactured urea 71,424 80,055
Closing stock of manufactured urea (584,930) (71,424)
(513,506) 8,631
Cost of sales - own manufactured urea 43,930,381 36,457,546
Opening stock of purchased fertilizers – 274,029
Purchase of fertilizers for resale 6,969,361 3,685,595
6,969,361 3,959,624
Closing stock of purchased fertilizers (21,504) –
Cost of sales - purchased fertilizers 6,947,857 3,959,624
50,878,238 40,417,170
29.1 These include operating lease rentals amounting to Rs 45,478 thousand (2013: Rs 41,670 thousand).
29.2 This includes provision for slow moving spares amounting to Rs 58,694 thousand (2013: Rs 30,008 thousand).
28. SALES
Sales include Rs 8,734,079 thousand (2013: Rs 4,774,850 thousand) in respect of sale of purchased fertilizers
and are exclusive of sales tax of Rs 22,555,150 thousand (2013: Rs 22,660,856 thousand).
Notes to and forming part of the Consolidated Financial Statementsfor the year ended December 31, 2014

Consolidated Financial Statements of Fauji Fertilizer Company Limited 2014
169
169
(Re-presented) 2014 2013 Note (Rupees ‘000)
30. ADMINISTRATIVE AND DISTRIBUTION EXPENSES Administrative expenses 30.1 163,521 69,371 Product transportation 3,970,241 3,797,513 Salaries, wages and benefits 1,322,121 1,271,875 Training and employees welfare 80,924 82,640 Rent, rates and taxes 105,131 81,768 Technical services to farmers 14,795 10,558 Travel and conveyance 30.2 198,186 162,629 Sale promotion and advertising 208,218 113,027 Communication and other expenses 394,452 490,979 Warehousing expenses 69,757 64,736 Depreciation 15.1 77,988 68,590 Amortisation 16.1 11,706 23,869 6,617,040 6,237,555 30.1 Administrative expenses
These represents administrative and general expenses of FFCEL and FFFL (Re-presented) 2014 2013 (Rupees ‘000)
Salaries, wages and benefits 83,895 31,229 Travel and conveyance 10,154 1,325 Utilities 8,923 898 Printing and stationery 2,036 17 Repairs and maintenance 1,119 659 Communication, advertisement and other expenses 4,144 (4,655) Rent, rates and taxes 9,725 9,614 Legal and professional 19,413 14,777 Miscellaneous 24,112 15,507 163,521 69,371 30.2 These include operating lease rentals amounting to Rs 130,420 thousand (2013: Rs 110,477 thousand).
(Re-presented) 2014 2013 (Rupees ‘000)
31. FINANCE COST Mark-up on long term borrowings 1,822,512 1,119,627 Mark-up on short term borrowings 218,782 168,689 Exchange loss - net 87,897 – Bank charges 20,071 85,109 2,149,262 1,373,425
Notes to and forming part of the Consolidated Financial Statementsfor the year ended December 31, 2014

170
170
(Re-presented) 2014 2013 (Rupees ‘000)
32. OTHER EXPENSES Research and development 355,424 372,447 Workers’ Profit Participation Fund (WPPF) 1,409,278 1,580,082 Workers’ Welfare Fund 535,526 603,028 Auditors’ remuneration Audit fee 1,650 1,500 Fee for half yearly review, audit of consolidated financial statements and review of Code of Corporate Governance 804 30 Out of pocket expenses 255 35 2,709 1,565 Others 625 740 2,303,562 2,557,862 32.1 In addition to the auditor’s remuneration above, communication and other expenses stated in note 29 and
note 30 include Rs 28,434 thousand (2013: Rs 14,545 thousand) on account of taxation services and audit of employees funds.
(Re-presented) 2014 2013 (Rupees ‘000)
33. OTHER INCOME Income from financial assets Income on loans, deposits and investments 1,667,099 1,347,926 Gain on remeasurement of investments classified as fair value through profit and loss 34,622 231,194 Dividend income – 92,692 Exchange gain 37,634 119,313 1,739,355 1,791,125 Income from non-financial assets Gain on disposal of property, plant and equipment 34,054 27,008 Commission on sale of FFBL products 7,166 – 41,220 27,008 Other income Scrap sales 19,373 10,689 Others 113,674 63,161 133,047 73,850 1,913,622 1,891,983
Notes to and forming part of the Consolidated Financial Statementsfor the year ended December 31, 2014

Consolidated Financial Statements of Fauji Fertilizer Company Limited 2014
171
171
35. DISCONTINUED OPERATIONS
35.1 As explained in note 1.2, during the year 1% equity of Fauji Fertilizer Bin Qasim Limited (FFBL) aggregating to 9,341,100 ordinary shares, held by FFC, were sold to FF on October 3, 2014 at the closing market price. Further, FFC irrevocably appointed FF as its proxy, to represent FFC in the general meetings of FFBL and AKBL allowing FF to vote for and on behalf of FFC and resolved that representatives of FF may be elected or co-opted or appointed on the Board of Directors of FFBL and AKBL, as nominated by FF. This has resulted in loss of control over FFBL and AKBL and accordingly, the status of FFBL and AKBL has been changed to associated companies of FFC. The group has classified FFBL and AKBL as discontinued operations. The results of the discontinued operations are presented below:
Jan 1, 2014 Jan 1, 2013 to Oct 03, to Dec 31, 2014 2013 Note (Rupees ‘000)
35.2 Profit and loss account Sales 28,934,570 54,455,168 Cost of sales 22,646,846 39,942,664 Gross profit 6,287,724 14,512,504 Administrative and distribution expenses 3,361,691 4,507,316 2,926,033 10,005,188 Finance cost 1,044,603 1,514,931 Other expenses 188,217 629,474 1,693,213 7,860,783 Other income Gain on loss of control - FFBL 35.3 13,246,045 – - AKBL 35.4 1,397,659 – Dividend from AKBL 543,768 – Others 758,361 657,448 15,945,833 657,448 Share in profit / (loss) of equity accounted investments 391,301 (135,053) Profit before taxation 18,030,347 8,383,178 Provision for taxation - (charge) / credit - Current (874,861) (3,091,592) - Deferred 104,258 342,925 (770,603) (2,748,667) Net profit from discontinued operations 17,259,744 5,634,511
Comparative figures in the consolidated profit and loss account have been re-presented to separately disclose discontinued operations.
(Re-presented) 2014 2013 (Rupees ‘000)
34. PROVISION FOR TAXATION Current tax 7,873,860 9,194,995 Deferred tax 203,021 52,995 8,076,881 9,247,990 Reconciliation between tax expense and accounting profit Profit before taxation from continuing operations and share in profit of equity accounted investments 24,523,287 27,283,404
2014 2013 % %
Applicable tax rate 33.00 34.00 Tax effect of income that is not taxable or taxable at reduced rates 0.51 0.08 Effect of change in tax rate 0.13 (0.55) Others (0.70) 0.37 Average effective tax rate charged on income 32.94 33.90
Notes to and forming part of the Consolidated Financial Statementsfor the year ended December 31, 2014

172
172
October 03, 2014 Note (Rupees ‘000)
35.3 Gain on loss of control of FFBL Sale proceed from sale of shares 375,139 Non - controlling interest 6,209,953 Reserves recycled to profit and loss 582,015 Fair value of equity interest retained 18,710,223 25,877,330 Value of net assets as at October 3, 2014 35.8 (12,631,285) Gain on loss of control 13,246,045 35.4 Gain on loss of control of AKBL Fair value of equity interest retained 11,859,580 Cost of equity interest retained as at October 3, 2014 (10,461,921) Gain on loss of control 1,397,659 Jan 1, 2014 Jan 1, 2013 to Oct 03, to Dec 31, 2014 2013 (Rupees ‘000)
35.5 Other comprehensive income Exchange difference on translating foreign investment (135,925) 326,903 Loss on remeasurement of staff retirement benefit plans - net of tax (26,514) (39,275) (162,439) 287,628
35.6 Earnings per share from discontinued operations 13.57 4.43
October 03, 2014 (Rupees ‘000)
35.7 The cash outflow on FFBL disposal is as follows: Consideration received 375,139 Cash and cash equivalents disposed of (585,607) Cash outflow on FFBL disposal (210,468)
Notes to and forming part of the Consolidated Financial Statementsfor the year ended December 31, 2014

Consolidated Financial Statements of Fauji Fertilizer Company Limited 2014
173
173
35.8 Details of the assets and liabilities of discontinued operations as at October 3, 2014 and included in consolidated financial statements for the year ended December 31, 2014 are as follows:
October 03, December 31, 2014 2013 (Rupees ‘000)
Assets
Non - Current Assets
Property, plant and equipment 13,280,228 13,059,509
Long term investments 10,343,588 9,831,069
Long term deposits and prepayments 78,643 78,643
23,702,459 22,969,221
Current Assets
Stores, spares and loose tools 2,244,206 2,107,493
Stock in trade 6,813,564 1,129,257
Trade debts 1,244,908 1,603,643
Loans and advances 766,971 577,966
Deposits and prepayments 59,210 29,877
Other receivables 486,515 904,192
Short term investments 6,608,935 5,323,136
Cash and bank balances 3,411,098 2,479,548
21,635,407 14,155,112
Total Assets 45,337,866 37,124,333
Liabilities
Non - Current Liabilities
Long term borrowings 10,000,000 584,119
Deferred liabilities
- Compensated leave absences 440,306 358,052
- Deferred tax 2,998,086 3,102,345
3,438,392 3,460,397
13,438,392 4,044,516
Current Liabilities
Trade and other payables 11,253,812 8,371,863
Interest and mark - up accrued 253,060 236,052
Short term borrowings 5,602,571 7,985,128
Current portion of long term borrowings 1,944,600 2,008,683
Taxation 214,146 727,583
19,268,189 19,329,309
Total liabilities 32,706,581 23,373,825
Net Assets 12,631,285 13,750,508
Notes to and forming part of the Consolidated Financial Statementsfor the year ended December 31, 2014

174
174
2014 2013 (Rupees ‘000)
36. EARNINGS PER SHARE - Basic and diluted
Profit after tax attributable to Equity holders of Fauji Fertilizer
Company Limited
Continuing operations 17,378,695 18,026,633
Discontinued operations 17,259,744 5,634,511
34,638,439 23,661,144
Weighted average number of shares in issue (‘000) 1,272,238 1,272,238
Basic and diluted earnings per share (Rupees)
Continuing operations 13.66 14.17
Discontinued operations 13.57 4.43
27.23 18.60
There is no dilutive effect on the basic earnings per share of the Group.
37. REMUNERATION OF CHIEF EXECUTIVE, DIRECTORS AND EXECUTIVES
The aggregate amounts charged in these financial statements in respect of remuneration including benefits
applicable to the chief executive, directors and executives of the Group are given below:
2014 2013 Chief Executive Chief Executive Executive Executive
(Rupees ‘000) (Rupees ‘000)
Managerial remuneration 8,561 1,486,652 7,510 1,253,607
Contribution to provident fund 615 91,310 518 78,322
Bonus and other awards 3,703 1,766,538 5,261 1,350,706
Allowances and contribution to retirement benefit plans 6,398 1,130,354 8,738 956,761
Total 19,277 4,474,854 22,027 3,639,396
No. of person(s) 1 743 1 660
The above were provided with medical facilities; the chief executive and certain executives were also provided
with some furnishing items and vehicles in accordance with the Group’s policy. Gratuity is payable to the
chief executive in accordance with the terms of employment while contributions for executives in respect of
gratuity and pension are based on actuarial valuations. Leave encashment of Rs thousand (2013: Rs Nil) and
Rs thousand (2013: Rs 65,921 thousand) were paid to the chief executive and executives respectively on
separation, in accordance with the Group’s policy.
In addition, 18 (2013: 14) directors were paid aggregate fee of Rs 5,570 thousand (2013: Rs 5,125 thousand).
Notes to and forming part of the Consolidated Financial Statementsfor the year ended December 31, 2014

Consolidated Financial Statements of Fauji Fertilizer Company Limited 2014
175
175
(Re-presented) 2014 2013 (Rupees ‘000)
38. CASH GENERATED FROM OPERATIONS
Net profit before taxation from continuing operations 25,455,576 27,274,623
Adjustments for:
Depreciation and amortisation 2,456,203 2,050,225
Provision for slow moving spares 58,694 30,008
Finance cost 2,149,262 1,373,425
Income on loans, deposits and investments (1,667,099) (1,347,926)
Gain on remeasurement of investments at fair value
through profit or loss (34,622) (231,194)
Dividend income – (92,692)
Exchange gain (37,634) (119,313)
Share of (profit) / loss of associate and joint venture (1,476,057) 8,781
Gain on disposal of property, plant and equipment (34,054) (27,008)
1,414,693 1,644,306
26,870,269 28,918,929
Changes in working capital
(Increase) / decrease in current assets
Stores and spares (128,872) (175,715)
Stock in trade (683,390) 140,182
Trade debts (953,651) 2,343,864
Loans and advances 395,702 (249,104)
Deposits and prepayments 16,789 (18,214)
Other receivables (239,152) 170,415
Increase in current liabilities
Trade and other payables 15,721,618 6,491,183
14,129,044 8,702,611
Changes in long term loans and advances (82,780) (39,622)
Changes in long term deposits and prepayments (13,392) 3,038
Changes in deferred liabilities 104,350 51,509
41,007,491 37,636,465
38.1 CASH AND CASH EQUIVALENTS
Cash and bank balances 2,050,602 4,193,929
Short term running finance (11,602,443) (7,635,128)
Short term highly liquid investments 25,709,818 19,850,951
16,157,977 16,409,752
Notes to and forming part of the Consolidated Financial Statementsfor the year ended December 31, 2014

176
176
39. FINANCIAL INSTRUMENTS AND RISK MANAGEMENT
39.1 Financial instruments by category
December 31, 2014 Loans and Available Fair value receivables for sale through Total investments profit or loss
(Rupees ‘000)
Financial assets Maturity up to one year Trade debts - net of provision 2,221,263 – – 2,221,263 Loans and advances 369,363 – – 369,363 Deposits 1,824 – – 1,824 Other receivables 636,904 – – 636,904 Short term investments 26,709,818 57,561 665,458 27,432,837 Cash and bank balances 2,050,602 – – 2,050,602 Maturity after one year Long term investments – 7,334,005 – 7,334,005 Long term loans and advances 823,188 – – 823,188 Deposits 14,568 – – 14,568 32,827,530 7,391,566 665,458 40,884,554
Other financial Total liabilities
(Rupees ‘000)
Financial liabilities Maturity up to one year Trade and other payables 29,374,814 29,374,814 Interest and mark up accrued 115,891 115,891 Current portion of liability against assets subject to finance lease 238 238 Short term borrowings 11,602,443 11,602,443 Current portion of long term borrowings 3,054,000 3,054,000 Maturity after one year Long term borrowings 11,406,203 11,406,203 Liability against assets subject to finance lease 2,893 2,893 55,556,482 55,556,482 December 31, 2013 Loans and Available Fair value receivables for sale through Total investments profit or loss
(Rupees ‘000)
Financial assets Maturity up to one year Trade debts - net of provision 2,871,255 – – 2,871,255 Loans and advances 791,495 – – 791,495 Deposits 12,193 – – 12,193 Other receivables 477,273 – – 477,273 Short term investments 19,955,731 55,130 4,272,570 24,283,431 Cash and bank balances 4,193,929 – – 4,193,929 Maturity after one year Long term investments – 218,606 – 218,606 Long term loans and advances 740,408 – – 740,408 Deposits 82,493 – – 82,493 29,124,777 273,736 4,272,570 33,671,083
Notes to and forming part of the Consolidated Financial Statementsfor the year ended December 31, 2014

Consolidated Financial Statements of Fauji Fertilizer Company Limited 2014
177
177
Other financial Total liabilities
(Rupees ‘000)
Financial liabilities Maturity up to one year Trade and other payables 20,074,468 20,074,468 Interest and mark-up accrued 290,784 290,784 Current portion of liability against assets subject to finance lease 849 849 Short term borrowings 14,985,128 14,985,128 Current portion of long term borrowings 3,812,186 3,812,186 Maturity after one year Long term borrowings 14,391,192 14,391,192 Liability against assets subject to finance lease 564 564 53,555,171 53,555,171
39.2 Credit quality of financial assets
The credit quality of group companies financial assets have been assessed below by reference to external credit rating of counterparties determined by the Pakistan Credit Rating Agency Limited (PACRA) and JCR - VIS Credit Rating Company Limited (JCR - VIS). The counterparties for which external credit ratings were not available have been assessed by reference to internal credit ratings determined based on their historical information for any default in meeting obligations.
2014 2013 Rating (Rupees ‘000)
Trade Debts Counterparties without external credit ratings Existing customers with no default in the past 2,221,263 2,871,255 Loans and advances Counterparties without external credit ratings Loans and advances to employees 369,363 791,495 Deposits Counterparties without external credit ratings Others 1,824 12,193 Other receivables Counterparties with external credit ratings A1 + 438,517 147,727 A1 96,260 38,291 Counterparties without external credit ratings Others 102,127 291,255 636,904 477,273 Short term investments Counterparties with external credit ratings A1 + 23,824,739 15,418,578 A1 3,608,098 2,741,717 A2 – 800,000 Others A2 – 5,323,136 27,432,837 24,283,431 Bank balances Counterparties with external credit ratings A1 + 1,699,805 3,356,101 A1 350,797 837,828 2,050,602 4,193,929
Notes to and forming part of the Consolidated Financial Statementsfor the year ended December 31, 2014

178
178
2014 2013 Rating (Rupees ‘000)
Long term investments Counterparties with external credit ratings AA - 6,722,322 96,000 AA 611,683 92,234 AA + – 30,372 7,334,005 218,606 Long term loans and advances Counterparties without external credit ratings Loans and advances to employees 823,188 740,408
39.3 Financial risk factors
The Group Companies have exposure to the following risks from its use of financial instruments:
- Credit risk; - Liquidity risk; and - Market risk.
The Board of Directors has overall responsibility for the establishment and oversight of the Group company’s risk management framework. The Board is also responsible for developing and monitoring the Group Company’s risk management policies.
The Group company’s risk management policies are established to identify and analyze the risks faced by
the company’s, to set appropriate risk limits and controls, and to monitor risks and adherence to limits. Risk management policies and systems are reviewed regularly to reflect changes in market conditions and the Group company’s activities. The Group Company’s, through their training and management standards and procedures, aim to develop a disciplined and constructive control environment in which all employees understand their roles and obligations.
The Audit Committee oversees how management monitors compliance with the Group company’s risk
management policies and procedures, and reviews the adequacy of the risk management framework in relation to the risks faced by the Group Company’s. The Audit Committee is assisted in its oversight role by Internal Audit. Internal Audit undertakes both regular and ad hoc reviews of risk management controls and procedures, the results of which are reported to the Audit Committee.
39.4 Credit risk
Credit risk is the risk of financial loss to the Group Companies if a customer or counterparty to a financial instrument fails to meet its contractual obligations, and arises principally from investments, loans and advances, deposits, trade debts, other receivables, short term investments and bank balances. The carrying amount of financial assets represents the maximum credit exposure. The maximum exposure to credit risk at the reporting date was:
2014 2013 (Rupees ‘000)
Long term investments 7,334,005 218,606
Loans and advances 1,192,551 1,531,903
Deposits 16,747 94,686
Trade debts - net of provision 2,221,263 2,871,255
Other receivables - net of provision 636,904 477,273
Short term investments 27,432,837 24,283,431
Bank balances 2,049,004 4,190,916
40,883,311 33,668,070
Notes to and forming part of the Consolidated Financial Statementsfor the year ended December 31, 2014

Consolidated Financial Statements of Fauji Fertilizer Company Limited 2014
179
179
Geographically there is no concentration of credit risk. The maximum exposure to credit risk for trade debts at the reporting date is with dealers within the country. The Group’s most significant amount receivable is from a bank which amounts to Rs 6,000,000 thousand (2013:
Rs 6,220,038 thousand). This is included in total carrying amount of investments as at reporting date. Trade debts are secured against letter of guarantee. The Group companies have placed funds in financial
institutions with high credit ratings. The Group companies assess the credit quality of the counter parties as satisfactory. The Group companies do not hold any collateral as security against any of their financial assets other than trade debts.
The Group companies limit their exposure to credit risk by investing only in liquid securities and only with
counterparties that have high credit rating. Management actively monitors credit ratings and given that the Group companies only have invested in securities with high credit ratings, management does not expect any counterparty to fail to meet its obligations.
Impairment losses
The aging of trade debts at the reporting date was: Gross Impairment Gross Impairment
2014 2014 2013 2013
(Rupees ‘000)
Not yet due 752,693 – 2,282,189 – Past due 1-30 days 1,415,651 – 90,032 – Past due 31-60 days 52,919 – 497,276 – Past due 61-90 days – – – – Over 90 days 1,758 1,758 1,758 1,758 2,223,021 1,758 2,871,255 1,758 Based on past experience, the management believes that no impairment allowance is necessary in respect of
trade debts.
39.5 Liquidity risk
Liquidity risk is the risk that the Group companies will not be able to meet their financial obligations as they fall due. The Group companies approach to managing liquidity is to ensure, as far as possible, that they will always have sufficient liquidity to meet their liabilities when due, under both normal and stressed conditions, without incurring unacceptable losses or risking damage to the Group company’s reputation. The Group companies use different methods which assists them in monitoring cash flow requirements and optimising their cash return on investments. Typically the Group companies ensure that they have sufficient cash on demand to meet expected operational expenses for a reasonable period, including the servicing of financial obligation; this excludes the potential impact of extreme circumstances that cannot reasonably be predicted, such as natural disasters. In addition, the Group companies maintain lines of credit as mentioned in note 13 to the financial statements.
Notes to and forming part of the Consolidated Financial Statementsfor the year ended December 31, 2014

180
180
The following are the contractual maturities of financial liabilities, including expected interest payments and excluding the impact of netting agreements:
Carrying Contractual Six months Six to twelve One to Two to Five year
amount cash flow or less months two years five years onwards
2014 (Rupees ‘000)
Long term borrowings 14,556,203 21,190,002 3,626,675 1,065,226 3,863,977 12,634,124 –
Trade and other payables 29,374,814 29,374,814 29,374,814 – – – –
Short term borrowings
including mark-up 11,625,465 12,348,214 10,228,404 2,119,810 – – –
55,556,482 62,913,030 43,229,893 3,185,036 3,863,977 12,634,124 –
Carrying Contractual Six months Six to twelve One to Two to Five year
amount cash flow or less months two years five years onwards
2013 (Rupees ‘000)
Long term borrowings 18,245,798 35,444,788 4,649,862 1,045,412 4,466,615 16,998,084 8,284,815
Trade and other payables 20,074,468 20,074,468 20,074,468 – – – –
Short term borrowings
including mark-up 15,234,905 15,234,905 15,234,905 – – – –
53,555,171 70,754,161 39,959,235 1,045,412 4,466,615 16,998,084 8,284,815
It is not expected that the cash flows included in the maturity analysis could occur significantly earlier or at
significantly different amounts. 39.5.1 The contractual cash flow relating to long and short term borrowings have been determined on the basis of
expected mark-up rates. The mark-up rates have been disclosed in notes 8 and 13 to these consolidated financial statements.
39.6 Market risk
Market risk is the risk that the value of the financial instrument may fluctuate as a result of changes in market interest rates or the market price due to change in credit rating of the issuer or the instrument, change in market sentiments, speculative activities, supply and demand of securities and liquidity in the market. The Group companies incur financial liabilities to manage their market risk. All such activities are carried out with the approval of the Board. The Group companies are exposed to interest rate risk and currency risk.
39.6.1 Currency risk
Currency risk is the risk that the fair value or future cash flows of a financial instrument will fluctuate because of changes in foreign exchange rates. Currency risk arises mainly from future commercial transactions of receivables and payables that exists due to transactions in foreign currency.
Exposure to Currency Risk
The Group companies are exposed to currency risk on creditors, bank balance and investment in term deposit receipts which are denominated in currency other than the functional currency of the Group companies. The Group companies exposure to foreign currency risk is as follows:
2014 2013 Rupees US Dollar Rupees US Dollar ‘000 ‘000 ‘000 ‘000
Bank balance 2,919 29 2,806 27
Investments (Term deposit receipts) 1,309,818 13,046 1,335,731 12,748
Notes to and forming part of the Consolidated Financial Statementsfor the year ended December 31, 2014

Consolidated Financial Statements of Fauji Fertilizer Company Limited 2014
181
181
The following significant exchange rate applied during the year: Average rate Balance sheet date rate 2014 2013 2014 2013
US Dollars 100.19 100.71 100.40 104.78
Sensitivity analysis
A 10% strengthening of the functional currency against USD at December 31 would have decreased profit and loss by Rs 88,017 thousand (2013: Rs 139,799 thousand). A 10% weakening of the functional currency against USD at December 31 would have had the equal but opposite effect of these amounts. The analysis assumes that all other variables remain constant.
39.6.2 Interest rate risk
The interest rate risk is the risk that the fair value or the future cash flows of a financial instrument will fluctuate because of changes in market interest rates. Majority of the interest rate exposure arises from short term borrowings and long term borrowings, long term investments, loans and advances and short term deposits with banks. At the balance sheet date the interest rate risk profile of the Group company’s interest bearing financial instruments is:
Carrying Amount
2014 2013
(Rupees ‘000)
Fixed rate instruments
Financial assets 36,050,888 21,675,610
Financial liabilities – 7,350,000
Variable rate instruments
Financial assets 99,500 2,237,404
Financial liabilities 26,065,777 22,655,607
Fair value sensitivity analysis for fixed rate instruments
The Group companies do not hold any fixed rate financial asset or liability at fair value through profit and
loss.
Cash flow sensitivity analysis for variable rate instruments
A change of 100 basis points in interest rates at the reporting date would have increased / (decreased) profit
or loss by the amounts shown below. This analysis assumes that all other variables, in particular foreign
currency rates, remain constant. The analysis is performed on the same basis for 2013.
100 basis 100 basis points points increase decrease
(Rupees ‘000)
December 31, 2014
Cash flow sensitivity - Variable rate instruments (174,620) 174,620
December 31, 2013
Cash flow sensitivity - Variable rate instruments (50,730) 50,730
Notes to and forming part of the Consolidated Financial Statementsfor the year ended December 31, 2014

182
182
Sensitivity analysis – price risk
For quoted investments classified as available for sale, a 1 percent increase in market price at reporting date would have increased equity by Rs 48,761 thousand after tax (2013: Rs 1,026 thousand); an equal change in the opposite direction would have decreased equity after tax by the same amount. For investments classified as at fair value through profit or loss, the impact on profit or loss would have been an increase or decrease by Rs 4,459 thousand after tax (2013: Rs 1,012 thousand). The analysis is performed on the same basis for 2013 and assumes that all other variables remain the same.
39.7 Fair values
Fair value versus carrying amounts
The fair values of financial assets and liabilities, together with the carrying amounts shown in the balance sheet, are as follows:
December 31, 2014 December 31, 2013 Carrying Fair Carrying Fair amount value amount value Note (Rupees ‘000) Assets carried at amortised cost Trade debts - net of provision 22 2,221,263 2,221,263 2,871,255 2,871,255 Loans and advances 18 and 23 1,192,551 1,192,551 1,531,903 1,531,903 Deposits 19 and 24 16,392 16,392 94,686 94,686 Other receivables 25 636,904 636,904 477,273 477,273 Short term investments 26 26,709,818 26,709,818 19,955,731 19,955,731 Cash and bank balances 27 2,050,602 2,050,602 4,193,929 4,193,929 32,827,530 32,827,530 29,124,777 29,124,777 Assets carried at fair value Long term investments 17 7,334,005 7,334,005 218,606 218,606 Short term investments 26 723,019 723,019 4,327,700 4,327,700 8,057,024 8,057,024 4,546,306 4,546,306 Liabilities carried at amortised cost Long term borrowings 8 14,553,310 14,553,310 18,245,234 18,245,234 Trade and other payables 10 29,374,814 29,374,814 20,074,468 20,074,468 Liability against assets subject to finance lease 3,131 3,131 1,413 1,413 Short term borrowings 13 11,625,227 11,625,227 15,233,912 15,233,912 55,556,482 55,556,482 53,555,027 53,555,027
The basis for determining fair values is as follows:
Interest rates used for determining fair value
The interest rates used to discount estimated cash flows, when applicable, are based on the government yield curve at the reporting date plus an adequate credit spread. For instruments carried at amortised cost, since majority of the interest bearing instruments are variable rate based instruments, there is no change in carrying amount and the fair value. Further for fixed rate instruments, since there is no significant difference in market rate and the rate of instrument and therefore most of the fixed rate instruments are of short term in nature, fair value significantly approximates to carrying value.
Notes to and forming part of the Consolidated Financial Statementsfor the year ended December 31, 2014

Consolidated Financial Statements of Fauji Fertilizer Company Limited 2014
183
183
Fair value hierarchy
The table below analyses financial instruments carried at fair value, by valuation method. The different levels have been defined as follows:
Level 1: quoted prices (unadjusted) in active markets for identical assets or liabilities.
Level 2: inputs other than quoted prices included within Level 1 that are observable for the asset or liability, either directly (i.e. as prices) or indirectly (i.e. derived from prices).
Level 3: inputs for the asset or liability that are not based on observable market data (unobservable inputs).
Level 1 Level 2 Level 3 (Rupees ‘000) December 31, 2014 Assets carried at fair value Available for sale investments 99,500 7,292,066 – Investments at fair value through profit or loss 665,458 – – 764,958 7,292,066 – December 31, 2013 Assets carried at fair value Available for sale investments 96,000 – – Investments at fair value through profit or loss 4,272,570 177,736 – 4,368,570 177,736 – The carrying value of financial assets and liabilities reflected in financial statements approximate their respective
fair values.
39.8 Determination of fair values
A number of Group company’s accounting policies and disclosures require the determination of fair value, for both financial and non-financial assets and liabilities. Fair values have been determined for measurement and / or disclosure purposes based on the following methods.
Investment at fair value through profit and loss
The fair value of investment at fair value through profit and loss is determined by reference to their quoted closing repurchase price at the reporting date.
Available for sale investments
The fair value of available for investment is determined by reference to their quoted closing repurchase price at the reporting date and where applicable it is estimated as the present value of future cash flows, discounted at the market rate of interest at the reporting date.
Investment in associate and subsidiary
The fair value of investment in associate is determined by reference to its quoted closing bid price at the reporting date. The fair value is determined for disclosure purposes.
Non - derivative financial assets
The fair value of non-derivative financial assets is estimated as the present value of future cash flows, discounted at the market rate of interest at the reporting date. This fair value is determined for disclosure purposes.
Non - derivative financial liabilities
Fair value, which is determined for disclosure purposes, is calculated based on the present value of future principal and interest cash flows, discounted at the market rate of interest at the reporting date.
39.9 Capital management
The Board’s policy is to maintain a strong capital base so as to maintain investor, creditor and market confidence and to sustain future development of the business. The Board of Directors monitors the return on capital, which Group companies define as net profit after taxation divided by total shareholders’ equity. The Board of Directors also monitors the level of dividend to ordinary shareholder. There were no changes to the Group company’s approach to capital management during the year and the Group companies are not subject to externally imposed capital requirements.
Notes to and forming part of the Consolidated Financial Statementsfor the year ended December 31, 2014

184
184
40. OPERATING SEGMENT RESULTS
Fertilizer Power generation Food Banking operations Total 2014 2013 2014 2013 2014 2013 2014 2013 2014 2013 (Rupees ‘000) (Rupees ‘000) (Rupees ‘000) (Rupees ‘000) (Rupees ‘000)
Sales 81,251,463 74,500,590 2,762,536 1,476,843 – – – – 84,013,999 75,977,433
Cost of sales 50,136,748 39,948,572 741,490 468,598 – – – – 50,878,238 40,417,170
Gross profit 31,114,715 34,552,018 2,021,046 1,008,245 – – – – 33,135,761 35,560,263
Administrative and distribution expenses 6,431,042 6,160,540 32,588 49,314 153,410 27,701 – – 6,617,040 6,237,555
Finance cost / (income) 848,940 756,215 1,300,232 802,485 90 (185,275) – – 2,149,262 1,373,425
Other expenses 2,303,562 2,557,862 – – – – – – 2,303,562 2,557,862
Other income 1,849,543 1,854,595 53,793 35,289 10,286 2,099 – – 1,913,622 1,891,983
Share in profit / (loss) of equity
accounted investments 1,476,057 (8,781) – – – – – – 1,476,057 (8,781)
Net profit / (loss) before taxation 24,856,771 26,923,215 742,019 191,735 (143,214) 159,673 – – 25,455,576 27,274,623
Provision for taxation 8,070,001 9,247,990 6,880 – – – – – 8,076,881 9,247,990
Net profit / (loss) after taxation 16,786,770 17,675,225 735,139 191,735 (143,214) 159,673 – – 17,378,695 18,026,633
Discontinued operations
Operating profit from discontinued
operations – note 35 15,318,317 5,634,511 – – – – 1,941,427 – 17,259,744 5,634,511
Profit for the year 32,105,087 23,309,736 735,139 191,735 (143,214) 159,673 1,941,427 – 34,638,439 23,661,144
Material non–cash items 12,185,361 (455,552) (37,634) (733) – 5,388 1,397,659 – 13,545,386 (450,897)
Depreciation and amortisation 2,897,168 3,045,553 612,231 403,178 4,161 655 – – 3,513,560 3,449,386
Capital expenditure 4,696,398 3,229,801 617 784,165 861,860 7,716 – – 5,558,875 4,021,682
Segment assets
Property, plant and equipment 20,093,898 31,503,697 11,160,749 11,889,327 1,849,973 921,856 – – 33,104,620 44,314,880
Stores, spares and loose tools 3,314,823 5,352,138 – – – – – – 3,314,823 5,352,138
Stock in trade 981,750 1,431,214 – – 3,597 – – – 985,347 1,431,214
Trade debts 822,460 2,304,184 1,394,381 567,071 4,422 – – – 2,221,263 2,871,255
Cash and bank balances 1,173,767 3,839,184 816,832 182,862 60,003 171,883 – – 2,050,602 4,193,929
Total segment assets 26,386,698 44,430,417 13,371,962 12,639,260 1,917,995 1,093,739 – – 41,676,655 58,163,416
Segment liabilities
Long term borrowings 4,280,000 8,332,801 8,963,275 9,280,480 1,216,928 590,097 – – 14,460,203 18,203,378
Trade and other payables 37,904,434 29,602,246 578,636 749,242 42,999 115,008 – – 38,526,069 30,466,496
Short term borrowings 11,602,443 14,985,128 – – – – – – 11,602,443 14,985,128
Total segment liabilities 53,786,877 52,920,175 9,541,911 10,029,722 1,259,927 705,105 – – 64,588,715 63,655,002
Notes to and forming part of the Consolidated Financial Statementsfor the year ended December 31, 2014
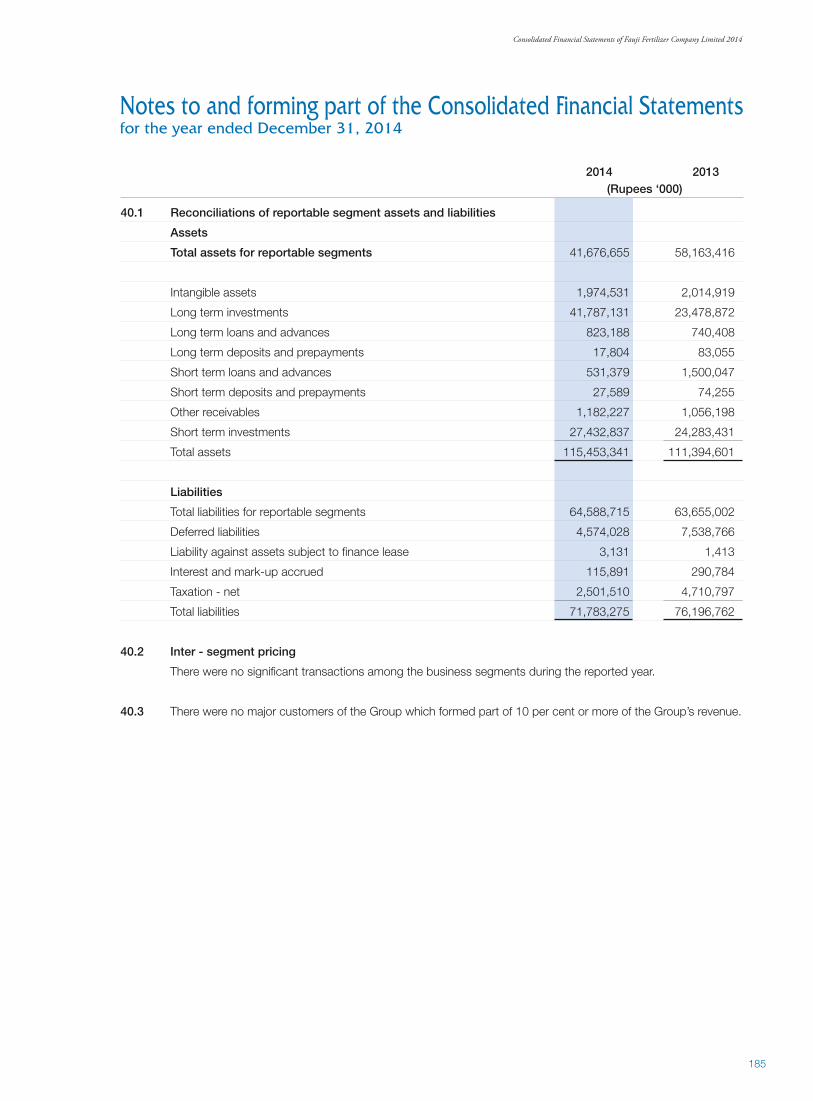
Consolidated Financial Statements of Fauji Fertilizer Company Limited 2014
185
185
2014 2013 (Rupees ‘000)
40.1 Reconciliations of reportable segment assets and liabilities
Assets
Total assets for reportable segments 41,676,655 58,163,416
Intangible assets 1,974,531 2,014,919
Long term investments 41,787,131 23,478,872
Long term loans and advances 823,188 740,408
Long term deposits and prepayments 17,804 83,055
Short term loans and advances 531,379 1,500,047
Short term deposits and prepayments 27,589 74,255
Other receivables 1,182,227 1,056,198
Short term investments 27,432,837 24,283,431
Total assets 115,453,341 111,394,601
Liabilities
Total liabilities for reportable segments 64,588,715 63,655,002
Deferred liabilities 4,574,028 7,538,766
Liability against assets subject to finance lease 3,131 1,413
Interest and mark-up accrued 115,891 290,784
Taxation - net 2,501,510 4,710,797
Total liabilities 71,783,275 76,196,762
40.2 Inter - segment pricing
There were no significant transactions among the business segments during the reported year.
40.3 There were no major customers of the Group which formed part of 10 per cent or more of the Group’s revenue.
Notes to and forming part of the Consolidated Financial Statementsfor the year ended December 31, 2014

186
186
41. RELATED PARTY TRANSACTIONS
Fauji Foundation holds 44.35% (2013: 44.35%) shares of the Company at the year-end. Therefore all subsidiaries and associated undertakings of Fauji Foundation are related parties of the Company. The related parties also comprise of directors, major shareholders, key management personnel, entities over which the directors are able to exercise influence, entities under common directorship and employees’ funds. Transactions with related parties and the balances outstanding at the year end are given below. Loans and advances to executives and remuneration of chief executive, directors and executives are disclosed in notes 18, 23 and 36 to the consolidated financial statements respectively.
2014 2013 (Rupees ‘000)
Transactions with associated undertakings / companies due to common directorship Long term investment 285,269 961,210 Sale of fertilizer 2,162 4,825 Services provided - 1,331 Dividend paid 8,508,840 10,032,792 Purchase of gas as feed and fuel stock 30,476,475 23,915,067 Expenses charged on account of marketing of fertilizer 326,791 - Commission on sale of products 7,281 - Donations 95,371 445,558 Payment under consignment account 25,125,468 - Services received 371,989 358,494 Balance payable 26,119,281 9,262,274 Balance receivable 3,275,428 8,726 Transactions with joint venture company Raw material purchased 17,325,157 23,168,097 Expenses incurred on behalf of joint venture company 13,142 14,933 Balance payable - 3,370,005 Balance receivable 8,353 19,989 Other related parties Payments to: Employees’ Provident Fund Trust 363,367 337,196 Employees’ Gratuity Fund Trust 639,734 134,525 Employees’ Pension Fund Trust 94,067 47,191 Others: Balance receivable / (payable) to Employee’s Fund Trusts 28,090 (609,936) Balance receivable from Employee’s Fund Trusts 59,019 9,759
42. POST BALANCE SHEET EVENT
The Board of Directors of FFC in its meeting held on January 30, 2015 has proposed a final dividend of Rs 3.50 per share.
Notes to and forming part of the Consolidated Financial Statementsfor the year ended December 31, 2014

Consolidated Financial Statements of Fauji Fertilizer Company Limited 2014
187
187
2014 2013
(Tonnes ‘000)
43. GENERAL
43.1 Production capacity
Design capacity
Urea 2,048 2,599
DAP – 650
Production
Urea 2,403 2,633
DAP – 744
43.2 Facilities of letters of guarantee and letters of credit
Facilities of letters of guarantee and letters of credit amounting to Rs 100,000 thousand and Rs 11,230,000 thousand (2013: Rs 216,000 thousand and Rs 7,930,000 thousand) respectively are available to the Company against lien on shipping / title documents and charge on assets of the Company alongwith corporate guarantee of the Company in a particular case.
43.3 Donations
Cost of Sales and Distribution Cost includes donations amounting to Rs 137,992 thousand (2013: Rs 145,208 thousand) and Rs 50,026 thousand (2013: Rs 189,175 thousand) respectively. These include Rs 95,371 thousand (2013: Rs 90,558 thousand), paid to Sona Welfare Foundation, Sona Tower, 156 - The Mall, Rawalpindi (associated undertaking). Interest of Lt Gen Naeem Khalid Lodhi, HI (M) (Retd) in Sona Welfare Foundation is limited to the extent of his involvement in Sona Welfare Foundation as Chairman.
Further, an amount of Rs Nil (2013: Rs 355,000 thousand) was donated for the projects of Fauji Foundation, Fauji
Towers Tipu Road Rawalpindi (associated undertaking). Directors’ interest in the projects of Fauji Foundation is limited to the extent of their involvement in Fauji Foundation as management personnel:
2014 2013
Lt Gen Khalid Nawaz Khan, HI (M) (Retd) Lt Gen Muhammad Mustafa Khan, HI (M) (Retd) Mr. Qaiser Javed Mr. Qaiser Javed Dr. Nadeem Inayat Dr. Nadeem Inayat Maj Gen Ghulam Haider, HI (M) (Retd) Maj Gen Zahid Parvez, HI (M) (Retd) Maj Gen Muhammad Farooq Iqbal, HI (M) (Retd) Brig Agha Ali Hassan, SI (M) (Retd)
Brig Dr. Gulfam Alam, SI (M) (Retd) Brig Dr. Gulfam Alam, SI (M) (Retd)
2014 2013
43.4 Number of employees
Total number of employees at end of the year 2,412 2,392 Average number of employees for the year 2,402 2,369
43.5 Rounding off
Figures have been rounded off to the nearest thousand of rupees unless otherwise stated. 43.6 Date of authorisation
These consolidated Financial Statements have been authorised for issue by the Board of Directors of FFC on
January 30, 2015.
Notes to and forming part of the Consolidated Financial Statementsfor the year ended December 31, 2014
Chairman Chief Executive Director

188
188
Pattern of Shareholdingas at December 31, 2014
Number of Shareholding Shares Percentage
Shareholders From To Held
1356 1 100 73254 0.0058
2369 101 500 796468 0.0626
1766 501 1000 1527380 0.1201
4650 1001 5000 12556657 0.9870
1548 5001 10000 11768581 0.9250
730 10001 15000 9215830 0.7244
490 15001 20000 8789882 0.6909
301 20001 25000 6904570 0.5427
282 25001 30000 7852414 0.6172
173 30001 35000 5677956 0.4463
147 35001 40000 5590596 0.4394
111 40001 45000 4752269 0.3735
151 45001 50000 7354193 0.5781
103 50001 55000 5416876 0.4258
75 55001 60000 4362780 0.3429
53 60001 65000 3301695 0.2595
49 65001 70000 3322193 0.2611
62 70001 75000 4566156 0.3589
30 75001 80000 2343599 0.1842
25 80001 85000 2067179 0.1625
40 85001 90000 3525552 0.2771
29 90001 95000 2693494 0.2117
76 95001 100000 7540256 0.5927
31 100001 105000 3167391 0.2490
14 105001 110000 1515483 0.1191
15 110001 115000 1686157 0.1325
14 115001 120000 1656729 0.1302
19 120001 125000 2329564 0.1831
19 125001 130000 2440818 0.1919
15 130001 135000 1996238 0.1569
8 135001 140000 1115005 0.0876
9 140001 145000 1290979 0.1015
15 145001 150000 2229647 0.1753
14 150001 155000 2133126 0.1677
15 155001 160000 2368074 0.1861
14 160001 165000 2281671 0.1793
7 165001 170000 1171436 0.0921
8 170001 175000 1381352 0.1086
6 175001 180000 1062815 0.0835
3 180001 185000 552716 0.0434

189
189Annual Report of Fauji Fertilizer Company Limited 2014
Pattern of Shareholdingas at December 31, 2014
Number of Shareholding Shares Percentage
Shareholders From To Held
5 185001 190000 939191 0.0738
3 190001 195000 578408 0.0455
24 195001 200000 4773890 0.3752
5 200001 205000 1009042 0.0793
2 205001 210000 418000 0.0329
7 210001 215000 1487715 0.1169
2 215001 220000 436764 0.0343
8 220001 225000 1782814 0.1401
8 225001 230000 1818036 0.1429
5 230001 235000 1157360 0.0910
4 235001 240000 954371 0.0750
3 240001 245000 727250 0.0572
12 245001 250000 2987333 0.2348
1 250001 255000 250170 0.0197
7 255001 260000 1803757 0.1418
9 260001 265000 2367890 0.1861
2 265001 270000 538885 0.0424
2 270001 275000 549617 0.0432
1 275001 280000 275600 0.0217
3 280001 285000 849654 0.0668
3 285001 290000 861377 0.0677
1 290001 295000 290380 0.0228
17 295001 300000 5095097 0.4005
9 300001 305000 2739885 0.2154
3 305001 310000 928120 0.0730
2 320001 325000 646508 0.0508
2 325001 330000 655974 0.0516
2 335001 340000 675215 0.0531
1 340001 345000 342445 0.0269
4 345001 350000 1397191 0.1098
1 350001 355000 354961 0.0279
4 355001 360000 1431009 0.1125
2 365001 370000 740000 0.0582
3 370001 375000 1123198 0.0883
3 375001 380000 1133664 0.0891
4 385001 390000 1555800 0.1223
1 390001 395000 391500 0.0308
3 395001 400000 1200000 0.0943
2 405001 410000 811049 0.0638
1 410001 415000 411600 0.0324

190
190
1 435001 440000 437427 0.0344
1 440001 445000 442124 0.0348
2 445001 450000 896397 0.0705
1 450001 455000 451212 0.0355
2 465001 470000 937700 0.0737
2 470001 475000 948250 0.0745
1 475001 480000 476750 0.0375
1 480001 485000 480724 0.0378
1 485001 490000 490000 0.0385
4 490001 495000 1972266 0.1550
3 495001 500000 1498233 0.1178
1 500001 505000 503500 0.0396
1 515001 520000 516848 0.0406
1 530001 535000 531858 0.0418
1 535001 540000 539500 0.0424
1 540001 545000 544593 0.0428
3 545001 550000 1650000 0.1297
2 555001 560000 1115500 0.0877
1 560001 565000 562600 0.0442
1 570001 575000 572745 0.0450
1 590001 595000 590500 0.0464
3 595001 600000 1798130 0.1413
2 620001 625000 1241312 0.0976
1 625001 630000 626450 0.0492
1 635001 640000 640000 0.0503
1 645001 650000 649500 0.0511
2 650001 655000 1307200 0.1027
3 655001 660000 1972738 0.1551
1 665001 670000 670000 0.0527
2 670001 675000 1344192 0.1057
1 675001 680000 678852 0.0534
3 680001 685000 2045618 0.1608
2 695001 700000 1400000 0.1100
1 700001 705000 702700 0.0552
1 705001 710000 708300 0.0557
3 710001 715000 2139011 0.1681
3 725001 730000 2183738 0.1716
1 730001 735000 733704 0.0577
1 745001 750000 750000 0.0590
1 750001 755000 750010 0.0590
Number of Shareholding Shares Percentage
Shareholders From To Held
Pattern of Shareholdingas at December 31, 2014

191
191Annual Report of Fauji Fertilizer Company Limited 2014
1 760001 765000 762717 0.0600
1 765001 770000 770000 0.0605
1 790001 795000 790584 0.0621
4 795001 800000 3200000 0.2515
1 815001 820000 817327 0.0642
1 820001 825000 822385 0.0646
2 825001 830000 1650864 0.1298
1 875001 880000 879700 0.0691
2 900001 905000 1807235 0.1421
2 915001 920000 1836357 0.1443
1 925001 930000 928378 0.0730
1 935001 940000 937442 0.0737
1 940001 945000 943700 0.0742
1 960001 965000 963928 0.0758
1 985001 990000 987500 0.0776
2 990001 995000 1981625 0.1558
4 995001 1000000 4000000 0.3144
1 1005001 1010000 1007250 0.0792
1 1015001 1020000 1019337 0.0801
1 1020001 1025000 1020730 0.0802
1 1055001 1060000 1059599 0.0833
1 1085001 1090000 1088796 0.0856
1 1110001 1115000 1111039 0.0873
1 1115001 1120000 1118079 0.0879
1 1120001 1125000 1124985 0.0884
1 1125001 1130000 1125068 0.0884
2 1155001 1160000 2317062 0.1821
1 1160001 1165000 1161000 0.0913
1 1185001 1190000 1187000 0.0933
1 1210001 1215000 1214414 0.0955
2 1270001 1275000 2542101 0.1998
1 1295001 1300000 1300000 0.1022
2 1305001 1310000 2613923 0.2055
1 1330001 1335000 1332500 0.1047
1 1355001 1360000 1360000 0.1069
1 1400001 1405000 1403790 0.1103
1 1425001 1430000 1426700 0.1121
1 1445001 1450000 1449630 0.1139
1 1460001 1465000 1464010 0.1151
1 1465001 1470000 1467174 0.1153
Number of Shareholding Shares Percentage
Shareholders From To Held
Pattern of Shareholdingas at December 31, 2014

192
192
1 1515001 1520000 1519407 0.1194
1 1550001 1555000 1551849 0.1220
2 1555001 1560000 3114500 0.2448
1 1660001 1665000 1661643 0.1306
1 1690001 1695000 1692500 0.1330
1 1765001 1770000 1768610 0.1390
1 1795001 1800000 1800000 0.1415
1 1845001 1850000 1846022 0.1451
3 1995001 2000000 5995200 0.4712
3 2000001 2005000 6008948 0.4723
1 2020001 2025000 2025000 0.1592
1 2045001 2050000 2050000 0.1611
1 2085001 2090000 2089142 0.1642
1 2130001 2135000 2130958 0.1675
1 2190001 2195000 2192300 0.1723
2 2195001 2200000 4400000 0.3458
1 2255001 2260000 2255859 0.1773
1 2275001 2280000 2278559 0.1791
1 2325001 2330000 2325509 0.1828
1 2450001 2455000 2451800 0.1927
1 2615001 2620000 2618887 0.2058
1 2745001 2750000 2750000 0.2162
1 2945001 2950000 2948041 0.2317
1 3070001 3075000 3071279 0.2414
1 3105001 3110000 3107900 0.2443
1 3220001 3225000 3224800 0.2535
1 3310001 3315000 3313959 0.2605
1 3950001 3955000 3951518 0.3106
1 4190001 4195000 4191700 0.3295
1 4255001 4260000 4255750 0.3345
1 4340001 4345000 4343250 0.3414
1 4465001 4470000 4466749 0.3511
1 4755001 4760000 4757400 0.3739
1 5040001 5045000 5040099 0.3962
1 5140001 5145000 5140515 0.4041
1 6660001 6665000 6664140 0.5238
1 7245001 7250000 7248863 0.5698
1 7380001 7385000 7382700 0.5803
1 8725001 8730000 8726512 0.6859
1 8945001 8950000 8945913 0.7032
Number of Shareholding Shares Percentage
Shareholders From To Held
Pattern of Shareholdingas at December 31, 2014

193
193Annual Report of Fauji Fertilizer Company Limited 2014
1 9670001 9675000 9670522 0.7601
1 10235001 10240000 10238800 0.8048
1 10810001 10815000 10810949 0.8498
1 11580001 11585000 11584300 0.9105
1 14390001 14395000 14391903 1.1312
1 15480001 15485000 15481600 1.2169
1 20895001 20900000 20900000 1.6428
1 27525001 27530000 27528886 2.1638
1 28730001 28735000 28732655 2.2584
1 116020001 116025000 116022735 9.1196
1 129515001 129520000 129516412 10.1802
1 434685001 434690000 434687842 34.1672
15199 Company Total 1272238247 100.00
Number of Shareholding Shares Percentage
Shareholders From To Held
Pattern of Shareholdingas at December 31, 2014

194
194
Pattern of Shareholdingas at December 31, 2014
Financial CalendarThe Company follows the period of January 01 to December 31 as the financial year.
Financial Results will be announced as per the following tentative schedule:
Annual General Meeting March 17, 2015
1st Quarter ending March 31, 2015 Last Week of April, 2015
2nd Quarter ending June 30, 2015 Last Week of July, 2015
3rd Quarter ending September 30, 2015 Last Week of October, 2015
Year ending December 31, 2015 Last Week of January, 2016
Serial Categories of Shareholders No of No of Percentage No. Shareholders Shares held %
1 NIT & ICP 2 28,732,905 2.26
2 Bank, DFI & NBFI 30 75,700,527 5.95
3 Insurance Companies 21 138,599,259 10.89
4 Modarabas & Mutuals Funds 55 13,544,770 1.07
5 Foreign Investors 90 122,064,436 9.59
6 Chariatable Trust & Others 195 602,975,745 47.39
7 Others 192 22,059,400 1.74
8 Individuals 14614 268,561,205 21.11
Total Shares 15199 1,272,238,247 100.00
No of SharesNIT & ICP National Investment Trust 28,732,655 Investment Corporation of Pakistan 250 Executives 996,513
Directors 800,000 Public Sector Companies and Corporations 13,986,012 Banks, Development Finance Institutions, Non-Banking 227,844,556 Finance Institutions, Insurance Companies, Modarabas, Mutual Funds Shareholders Holding Five percent or more voting interest Fauji Foundation 564,204,254 State Life Insurance Corporation of Pakistan 116,022,735

195
195Annual Report of Fauji Fertilizer Company Limited 2014
Definitions & Glossary of Terms
Glossary of terms
AGM Annual General Meeting
AKBL Askari Bank Limited
BCP Business Continuity Planning
BI&T Banking, Industries and Trading
BoD Board of Directors
BTU British Thermal Unit
CBA Collective Bargaining Agent
CCP Competition Commission of Pakistan
CE & MD Chief Executive & Managing Director
CEO Chief Executive Officer
CFO Chief Financial Officer
CILT Chartered Institute of Logistics and
Transportation
CPIs Critical Performance Indicators
CSR Corporate Social Responsibility
CTO Chief Technical Officer
CCO Chief Coordinating Officer
DAP Di Ammonium Phosphate
DPS Dividend Per Share
DR Disaster Recovery
EBITDA Earnings Before Interest, Tax, Depreciation, and
Amortization
EPS Earnings Per Share
ERP Enterprise Resource Planning
Definitions
Profitability Ratios
Profitability Ratios are used to assess the Company’s ability to generate profits in relation to its sales, assets and equity.
Liquidity Ratios
Liquidity ratios determine the Company’s ability to meet its short-term financial obligations. A higher ratio indicates a greater
margin of safety to cover current liabilities.
Activity/Turnover Ratios
Activity/Turnover ratios evaluate the operational efficiency of the Company to convert inventory & receivables into cash against
time taken to pay creditors, measured in terms of revenue and cost of sales.
Investment/Market Ratios
Investment ratios measure the capability of the Company to earn an adequate return for its shareholders.
Market Ratios evaluate the current market price of a share versus an indicator of the company’s ability to generate profits.
Capital Structure Ratios
Capital Structure ratios provide an indication of the long term solvency of the Company and its cost of debt, in relation to equity
and profits.
FAC Farm Advisory Centre
FCCL Fauji Cement Company Limited
FDI Foreign Direct Investments
FFBL Fauji Fertilizer Bin Qasim Limited
FFC Fauji Fertilizer Company
FFCEL FFC Energy Limited
FFF Fauji Fresh n Freeze
FOB Free on Board
GDP Gross Domestic Product
GGM-MKT Group General Manager - Marketing
GM-HR General Manager - Human Resource
GM-IS General Manager - Information Systems
GHQ General Head Quarter
GIDC Gas Infrastructure Development Cess
GOP Government of Pakistan
GRI Global Reporting Initiative
GST General Sales Tax
GWh Gigawatt hour
HBL Habib Bank Limited
HI(M) Hilal-e-Imtiaz (Military)
ICAP Institute of Chartered Accountants Pakistan
ICMAP Institute of Chartered Management Accountants
Pakistan

196
196
IFA International Fertilizer Association
IMF International Monetary Fund
IMS Integrated Management System
INSEAD Institute European d’Administration des Affaires
(European Institute of Business Administration)
IQF Individually Quick Freeze
ISC2 Information Security Certification Consortium
ISLA Information Security Leadership
ISO International Organization for Standardization
IT Information Technology
KIBOR Karachi Inter Bank Offer Rate
KSE Karachi Stock Exchange
KT Thousand Tonnes
KW Kilo Watt
LUMS Lahore University of Management Sciences
M-CC Manager - Corporate Communication
M-LLA Manager - Legal and Labour Affairs
MAP Management Association of Pakistan
MMBTU Million British Thermal Units
MMSCF Million Standard Cubic Feet
MOIPI Maintenance of Central Peace Incentives
MWs Mega Watts
NFDC National Fertilizer Development Centre
NFEH National Forum of Environment and Health
NIT National Investment Trust Limited
NPO National Productivity Corporation
NTDC National Transmission & Dispatch Company
NUST National University of Sciences and Technology
OHS Occupational Health & Safety
OHSAS Occupational Health & Safety Advisory Services
PASDAC Pakistan Stone Development Company
PICG Pakistan Institute of Corporate Governance
PIDC Pakistan Industrial Development Centre
PIDE Pakistan Institute of Development Economics
PITAC Pakistan Industrial Technical Assistance Centre
PMP Pakistan Maroc Phosphore
R&D Research & Development
RCCI Rawalpindi Chamber of Commerce & Industry
Retd Retired
ROE Return On Equity
SAFA South Asian Federation of Accountants
SAP Systems, Applications and Products
SECP Securities and Exchange Commission of
Pakistan
SI(M) Sitara-e-Imtiaz (Military)
SM-A Senior Manager - Administration
SM-CW Senior Manager - Civil Works
SM-CO Senior Manager - Coordination
SM-P Senior Manager - Procurement
SM-CSR Senior Manager - Corporate Social Responsibility
SM-E Senior Manager - Engineering
SOP Sulfate of Potash
SWF Sona Welfare Foundation
SWOT Strength, Weakness, Opportunity, Threat
TUESDEC Technology Up-gradation and Skill Development
Company
USC Utility Stores Corporation
WWF Workers’ Welfare Fund / World Wide Fund for
Nature

Form of Proxy37th Annual General Meeting
I /We
of
being a member(s) of Fauji Fertilizer Company Limited hold
Ordinary Shares hereby appoint Mr / Mrs / Miss
of or failing him / her
of as my/our proxy in my / our absence to attend and vote for me /us and on my/our behalf
at the 37th Annual General Meeting of the Company to be held on Tuesday March 17, 2015 and / or any adjournment thereof.
As witness my / our hand / seal this day of March 2015.
Signed by
in the presence of
Folio No. CDC Account No.
Participant I.D. Account No.
Signature onFive Rupees
Revenue Stamp
The Signature shouldagree with the
specimen registeredwith the Company
IMPORTANT:
1. This Proxy Form, duly completed and signed, must be received at the Registered Office of the Company, 156 - The Mall,
Rawalpindi not less than 48 hours before the time of holding the meeting.
2. If a member appoints more than one proxy and more than one instruments of proxies are deposited by a member with the
Company, all such instruments of proxy shall be rendered invalid.
3. For CDC Account Holders/Corporate Entities
In addition to the above the following requirements have to be met.
(i) Attested copies of CNIC or the passport of the beneficial owners and the proxy shall be provided with the proxy form.
(ii) The proxy shall produce his original CNIC or original passport at the time of the meeting.
(iii) In case of a corporate entity, the Board of Directors resolution/power of attorney with specimen signature shall be
submitted (unless it has been provided earlier alongwith proxy form to the Company).

AFFIXCORRECTPOSTAGE
Company SecretaryFAUJI FERTILIZER COMPANY LIMITED
156 - The Mall, Rawalpindi Cantt
Website: www.ffc.com.pk
Tel No. 92-51-111-332-111, 8450001