
Content market dynamics in the UK: outcomes and...
24
BBC Content market dynamics in the UK: outcomes and implications 2 November 2017 Final Report Mediatique Limited 65 Chandos Place London WC2N 4HG www.mediatique.co.uk
Transcript of Content market dynamics in the UK: outcomes and...

BBC Content market dynamics in the UK: outcomes and implications 2 November 2017 Final Report Mediatique Limited 65 Chandos Place London WC2N 4HG www.mediatique.co.uk

Content market dynamics in the UK: outcomes & implications
1
Contents of this report
1. Introduction ............................................................................................................................ 2
2. Technology developments ....................................................................................................... 3
3. Platform developments ........................................................................................................... 3
4. Viewing patterns ..................................................................................................................... 6
5. Revenue streams and business models .................................................................................... 8
6. Implications for the upstream content market: historical perspective .................................... 10
7. Implications for the upstream content market: current trends ............................................... 15
8. Future market trends ............................................................................................................. 17
9. Key conclusions ..................................................................................................................... 21
List of Figures Figure 1: Device take-up as a % of the UK adult population, 2010-2016 ....................................................................................................................................... 3
Figure 2: Take-up of pay TV among UK TV population, 2006-2016 ................................................................................................................................................ 4
Figure 3: Pay TV penetration & ARPU: UK vs US (% of homes, £/year) .......................................................................................................................................... 5
Figure 4: Take-up of SVOD services in the UK, 2012-2016.............................................................................................................................................................. 5
Figure 5: Proportion of viewing activities, by age (% viewing time) ............................................................................................................................................... 6
Figure 6: Average total TV viewing, by type (minutes per day, individuals 4+) .............................................................................................................................. 6
Figure 7: Share of linear viewing, all population 4+ ....................................................................................................................................................................... 7
Figure 8: Long-form viewing minutes per day, by category (mins, forecast) .................................................................................................................................. 7
Figure 9: TV revenues by category, 2006-2016 (£Bn) ..................................................................................................................................................................... 8
Figure 10: Content and adjacent markets diagram........................................................................................................................................................................ 9
Figure 11: Evolution of the independent production sector (1995 to 2015 – latest available year) ............................................................................................. 10
Figure 12: Key indie takeovers leading to loss of qualifying status .............................................................................................................................................. 11
Figure 13: Total indie sector revenues – qualifying and non-qualifying (£m) (all figures nominal) .............................................................................................. 12
Figure 14: PSB network spend on first-run UK originations, by genre – 2006-2016 (£m, all figures expressed in 2016 money) .................................................. 14
Figure 15: TV content expenditure by PSBs (excluding sport, news and film), by category (£bn, 2016) ....................................................................................... 14
Figure 16: Average cost/episode of key content titles ($m, title & original channel) ................................................................................................................... 16
Figure 17: Hours of co-produced Netflix original content, 2013–2017 ......................................................................................................................................... 17
Figure 18: Investment prospects for major genres/categories ..................................................................................................................................................... 20
Contact details
Mediatique Limited 65 Chandos Place London WC2N 4HG 020 7836 5050 www.mediatique.co.uk
Mathew Horsman Director [email protected] Jack Genovese Consultant [email protected]
Mediatique Limited is a registered Limited company in England and Wales, Company No. 4575079. Registered Office: 130 Shaftesbury Avenue, London, W1D 5AR

Content market dynamics in the UK: outcomes & implications
2
1. Introduction
1.1 Over the past decade, the UK and global content markets have been characterised by the entry of a range of
financially powerful players, of which Netflix, Amazon and now Apple are the best known among the recent
new entrants.
1.2 Taking advantage of developments in technology, faster network performance, higher device penetration
and shifting consumer preferences, these companies have disrupted traditional media markets for funding,
resources, talent and consumer attention. The changes have been evident across the value chain in the audio-
visual content market, from content creation, production and aggregation, to distribution and consumption.
1.3 In the light of these dynamics, we have identified key trends that have characterised and will continue to
affect the UK content markets recently:
▪ Increasingly crowded and competitive markets: as a result of reduced barriers to entry and shifts in
consumer preferences, existing broadcasters now compete against a range of traditional and new
players to secure content and attract audiences (other channels, pay TV platforms, SVOD providers,
network operators, retailers, equipment manufacturers), which can now forge new and direct
relationships with viewers in ways that were not possible before.
▪ New business models: traditional routes to service the end consumer have been disrupted by
technology, enabling new business models to emerge – notably, over the top (“OTT”) services that do
not require a broadcast signal or a channel. The resultant multiple points of availability (scheduled TV,
on-demand from pay TV operators, over the top delivery) have meant multiple revenue models – e.g.,
subscription video on demand (“SVOD”), bundled packages, ad-funded content – in addition to the TV
licence fee.
▪ Traditional revenue streams under pressure: with lower barriers to entry, traditional distribution and
aggregation models are seriously challenged, with consequent effects on revenues. The TV advertising
market faces a challenging long-term outlook and traditional pay TV subscription revenues are under
considerable pressure, as consumers increasingly switch to lower-priced pay TV propositions and SVOD.
One response to the maturing of traditional pay TV and advertising markets has been increased
investment by channel and network operators in production assets – ITV, Discovery, Liberty Media, Sky,
NBC and Sony have all invested in UK and international production companies.
▪ Expenditure clustered around more premium, more global content: new entrants are typically global
players and their content investment tends to be directed toward more expensive programming; they
are more likely to seek global audiences of size. High-end UK talent (writers, creatives and format
originators) has also seen more bidders emerge in the form of new entrants, attracted by the UK’s
evident strengths in creating valuable intellectual property in a globally appealing language.
▪ Proliferation of co-productions and multinational partnerships: in order to be able to effectively
compete with new entrants, traditional players increasingly rely on co-production with international
players (e.g., BBC-AMC, Channel 4-Amazon-Sony) for the funding of more expensive content.
1.4 We look at some of the changing dynamics in greater detail here, before considering the implications on the
UK content market. The main areas we cover are technology, consumer behaviour (pay TV take-up SVOD use,
viewing), revenue models and corporate strategies.

Content market dynamics in the UK: outcomes & implications
3
2. Technology developments
2.1. The increasing availability and take-up of broadband, together with a growth in the number of connected
devices owned by UK consumers, has led to increasing opportunities for viewers to access a wide range of
content, “anytime, anywhere” – in the home and on the move.
2.2. As a result, viewers are now able to manage their behaviours and preferences in a more flexible manner,
watching live broadcasts, recording content for delayed playback and selecting content on-demand for
viewing at a time (and increasingly at a place and on a device) of their choosing.
2.3. More than 80% of UK adults now have a broadband connection, while three quarters have a mobile, nearly
60% a tablet and around one third of adults have a smart TV1.
2.4. At the same time, ownership of the traditional TV set has remained remarkably robust over time, and indeed
additional functionality including PVRs and on-demand are increasingly available to the TV set.
Figure 1: Device take-up as a % of the UK adult population, 2010-2016 Source: Ofcom’s Communications Market Report 2017
3. Platform developments
3.1. Since the UK launch of digital TV in the late 1990s, there has been a steady growth in the number of
households paying incrementally for TV. Initially, this growth was driven by consumers seeking greater choice
of channels. From the mid-2000s, pay TV operators offered higher quality (i.e., high definition) and greater
functionality to encourage subscriber growth and to lock in payments from existing customers. Such
functionality included personal video recorders and – increasingly – IP connectivity to the set-top box,
enabling consumers to record and play back TV content and to order TV shows and movies on demand.
3.2. Over the past five years, the growth has been further underpinned by the appeal of “lite” (or “skinny”) pay
TV from BT, TalkTalk and Now TV and a clear preference for bundled services where TV, broadband and
telephony are sold together. Increasingly, IP connectivity to the TV is the rule rather than the exception.
3.3. Overall traditional pay TV penetration has risen to around 60% today from around 45% in 2006, with the
remainder using free-to-air (“FTA”) services Freeview and Freesat. Pay TV services are now available across
all major distribution networks including satellite, cable and hybrid IP-broadcast platforms such as YouView
1 This does not include subscribers who have connected set-top boxes from pay TV operators such as Sky or Virgin but who do not have a smart TV. BARB estimates the number of UK individuals who have access to a connected TV – either a smart TV or a connected set-top box – to be around 60% of the UK population (see: http://www.barb.co.uk/tv-landscape-reports/tracker-device-access/).
94%
60%
83%
76%
58%
36%
0%
10%
20%
30%
40%
50%
60%
70%
80%
90%
100%
2010 2011 2012 2013 2014 2015 2016 2017 Digital TV PVR Broadband Smartphone Tablet Smart TV
Content market dynamics in the UK: outcomes & implications
4
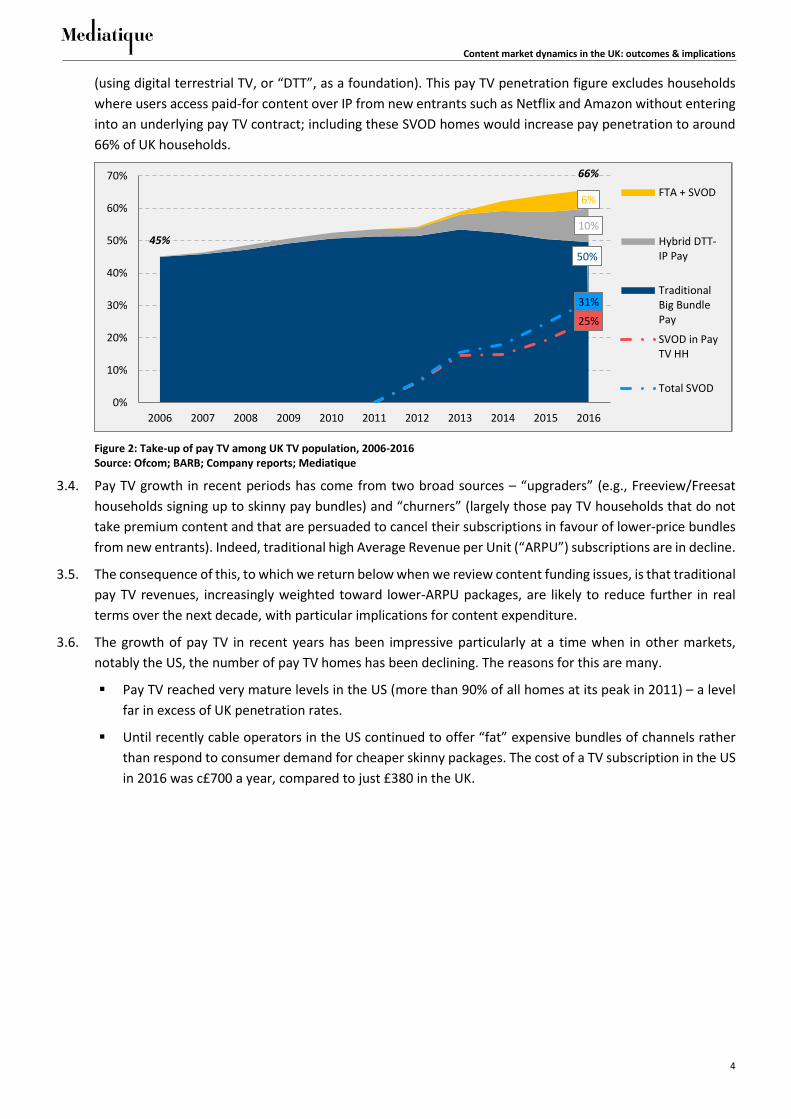
(using digital terrestrial TV, or “DTT”, as a foundation). This pay TV penetration figure excludes households
where users access paid-for content over IP from new entrants such as Netflix and Amazon without entering
into an underlying pay TV contract; including these SVOD homes would increase pay penetration to around
66% of UK households.
Figure 2: Take-up of pay TV among UK TV population, 2006-2016 Source: Ofcom; BARB; Company reports; Mediatique
3.4. Pay TV growth in recent periods has come from two broad sources – “upgraders” (e.g., Freeview/Freesat
households signing up to skinny pay bundles) and “churners” (largely those pay TV households that do not
take premium content and that are persuaded to cancel their subscriptions in favour of lower-price bundles
from new entrants). Indeed, traditional high Average Revenue per Unit (“ARPU”) subscriptions are in decline.
3.5. The consequence of this, to which we return below when we review content funding issues, is that traditional
pay TV revenues, increasingly weighted toward lower-ARPU packages, are likely to reduce further in real
terms over the next decade, with particular implications for content expenditure.
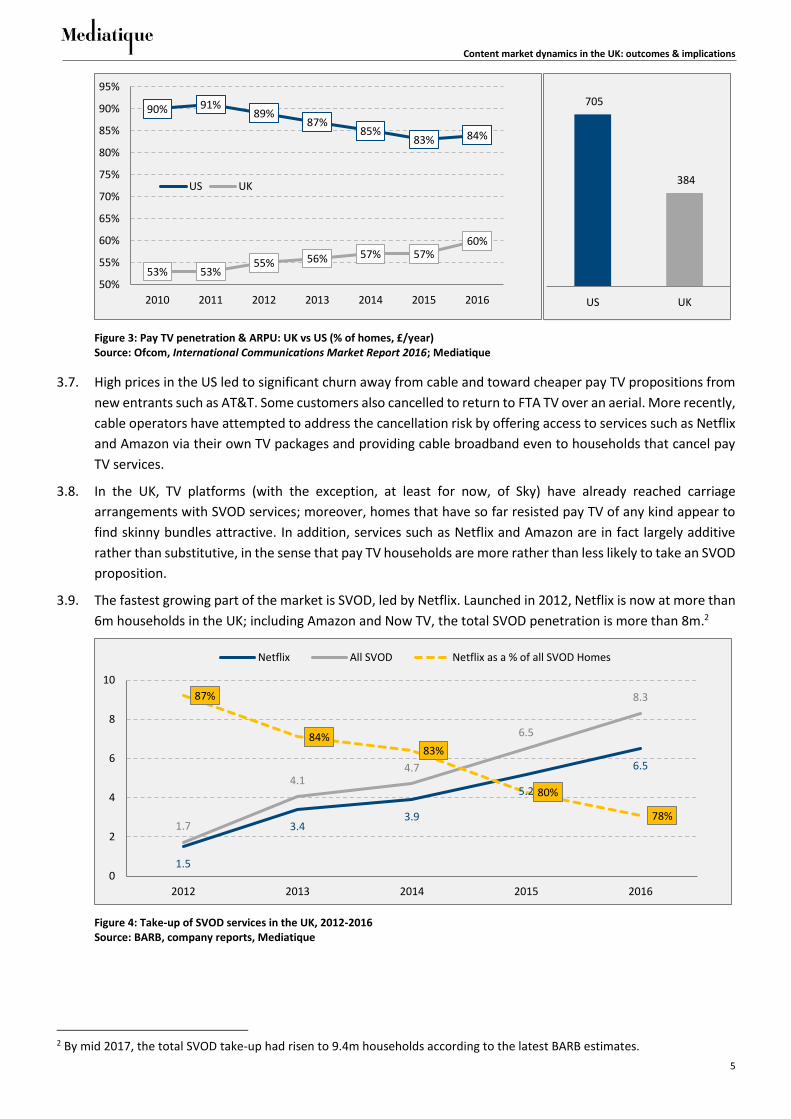
3.6. The growth of pay TV in recent years has been impressive particularly at a time when in other markets,
notably the US, the number of pay TV homes has been declining. The reasons for this are many.
▪ Pay TV reached very mature levels in the US (more than 90% of all homes at its peak in 2011) – a level
far in excess of UK penetration rates.
▪ Until recently cable operators in the US continued to offer “fat” expensive bundles of channels rather
than respond to consumer demand for cheaper skinny packages. The cost of a TV subscription in the US
in 2016 was c£700 a year, compared to just £380 in the UK.
50%
10%
6%
25%
31%
45%
66%
0%
10%
20%
30%
40%
50%
60%
70%
2006 2007 2008 2009 2010 2011 2012 2013 2014 2015 2016
FTA + SVOD
Hybrid DTT-IP Pay
TraditionalBig BundlePay
SVOD in PayTV HH
Total SVOD
Content market dynamics in the UK: outcomes & implications
5
Figure 3: Pay TV penetration & ARPU: UK vs US (% of homes, £/year) Source: Ofcom, International Communications Market Report 2016; Mediatique
3.7. High prices in the US led to significant churn away from cable and toward cheaper pay TV propositions from
new entrants such as AT&T. Some customers also cancelled to return to FTA TV over an aerial. More recently,
cable operators have attempted to address the cancellation risk by offering access to services such as Netflix
and Amazon via their own TV packages and providing cable broadband even to households that cancel pay
TV services.
3.8. In the UK, TV platforms (with the exception, at least for now, of Sky) have already reached carriage
arrangements with SVOD services; moreover, homes that have so far resisted pay TV of any kind appear to
find skinny bundles attractive. In addition, services such as Netflix and Amazon are in fact largely additive
rather than substitutive, in the sense that pay TV households are more rather than less likely to take an SVOD
proposition.
3.9. The fastest growing part of the market is SVOD, led by Netflix. Launched in 2012, Netflix is now at more than
6m households in the UK; including Amazon and Now TV, the total SVOD penetration is more than 8m.2
Figure 4: Take-up of SVOD services in the UK, 2012-2016 Source: BARB, company reports, Mediatique
2 By mid 2017, the total SVOD take-up had risen to 9.4m households according to the latest BARB estimates.
90% 91%89%
87%85%
83% 84%
53% 53%55% 56% 57% 57%
60%
50%
55%
60%
65%
70%
75%
80%
85%
90%
95%
2010 2011 2012 2013 2014 2015 2016
US UK
705
384
US UK
1.5
3.43.9
5.2
6.5
1.7
4.14.7
6.5
8.387%
84%83%
80%
78%
0
2
4
6
8
10
2012 2013 2014 2015 2016
Netflix All SVOD Netflix as a % of all SVOD Homes

Content market dynamics in the UK: outcomes & implications
6
4. Viewing patterns
4.1. The increasing mix of functionality and take-up of new services are having profound impacts on the nature
of content consumption in UK households. Consumption of video content is now characterised by different
formats and ways of viewing. This is particularly noticeable among younger age groups, who are more likely
than the average to subscribe to SVOD services, to use portable connected devices and to view content other
than at the time of the broadcaster’s choosing.
4.2. Across all viewing (including VOD, physical DVDs, and short-form video), linear TV continues to deliver the
majority of consumption across all categories of adults – 63% in 2015; however, for those aged below 35, the
majority of viewing is now to categories other than live broadcast.
Figure 5: Proportion of viewing activities, by age (% viewing time) Source: Ofcom
4.3. Within long-form TV content only (i.e., discounting short-form and physical video), linear live TV still secured
nearly 80% of all viewing in 2016 across all age groups, and more than 90% when PVR consumption is
included. Again, younger people are more likely to view non-broadcast content on a TV.
Figure 6: Average total TV viewing, by type (minutes per day, individuals 4+) Source: BARB; Ofcom
4.4. Within both linear broadcast and catch-up TV, the primary Public Service Broadcaster (“PSB”) services (from
the BBC, ITV, Channel 4 and Channel 5) continue to deliver half of all viewing, even before the incremental
63%
36%48%
55%63%
72%83%
0%
10%
20%
30%
40%
50%
60%
70%
80%
90%
100%
Adults 16+ 16-24 25-34 35-44 45-54 55-64 65+
TV Recorded Free VOD or films Paid VOD or films DVD Short clips
225 220 217 206 193 190 184
17 22 2426
27 26 26
3 3 4 815 19 19
0
50
100
150
200
250
2010 2011 2012 2013 2014 2015 2016
On-demand
PVR playback
Live TV
4:16 5:15 4:52 4:04 3:40 3:39 3:54 Ave time
spent/day

Content market dynamics in the UK: outcomes & implications
7
viewing secured by the commercial PSB portfolio channels (e.g., E4, ITV3, etc.). This is an impressive feat:
many households now have access to hundreds of channels, even before considering on demand services,
and yet the PSBs have maintained salience. Part of this resilience is owed to the continued protections
afforded to PSBs in terms of prominence on TV platforms. Changing patterns of consumption may make these
protections less relevant over time.
Figure 7: Share of linear viewing, all population 4+ Source: BARB; Ofcom
4.5. Despite the shifting behaviours of viewers and the increased level of connectivity for the average UK
consumer, viewing across all groups is likely to remain weighted in favour of scheduled TV in the medium
term. This reflects a number of dynamics. “Destination” TV (sports, results-based entertainment shows,
special events) is still a powerful draw. But of arguably greater importance in the medium term is the impact
of an ageing population. Even if the younger age groups take their current consumption patterns with them
unchanged into later life (unlikely to be the case when careers and children intervene), the growing number
of older people within the total population will compensate to a degree and for a time.
4.6. We predict that even by as late as 2026, viewing of live TV channels will still account for more than 60% of all
TV consumption.
Figure 8: Long-form viewing minutes per day, by category (daily minutes viewed, forecast) Source: BARB; Ofcom; Mediatique
23% 22% 22% 21% 21% 21% 21% 21% 22% 22% 22%
9% 9% 8% 7% 7% 7% 6% 6% 6% 6% 6%
20% 19% 18% 18% 17% 16% 15% 15% 15% 14% 15%
10%9%
7% 7% 6% 6% 6% 5% 5% 5% 5%
6%5%
5% 5%5% 4% 4% 4% 4% 4% 4%
9%12%
14% 16% 18% 20% 21% 21% 21% 20% 19%
23% 24% 26% 26% 27% 26% 27% 28% 28% 30% 30%
0%
10%
20%
30%
40%
50%
60%
70%
80%
90%
100%
2006 2007 2008 2009 2010 2011 2012 2013 2014 2015 2016
All otherchannels
PSBportfolios
Channel 5
Channel 4
ITV
BBC Two
BBC One
184 182 180 178 175 173 170 167 163 160 156
26 27 27 28 28 29 29 30 31 32 33
19 22 26 29 32 36 40 44 47 51 55
0%
10%
20%
30%
40%
50%
60%
70%
80%
90%
100%
2016 2017 2018 2019 2020 2021 2022 2023 2024 2025 2026
On-demand
PVRplayback
Live TV
Content market dynamics in the UK: outcomes & implications
8
4.7. For younger age groups, this will be markedly lower; however, live TV will still be a major category of viewing
behaviour among 16-34s even in ten years’ time, suggesting a strong ongoing role for platforms that deliver
live TV.
4.8. The implications for network delivery are potentially more complex: live TV is not the same as broadcast TV.
For example, there is a case that a significant number of traditional live “channels” will be delivered in time
not via broadcast but over IP. This will depend ultimately on the economics of delivery, and the incentives of
content owners and distributers in the value chain.
5. Revenue streams and business models
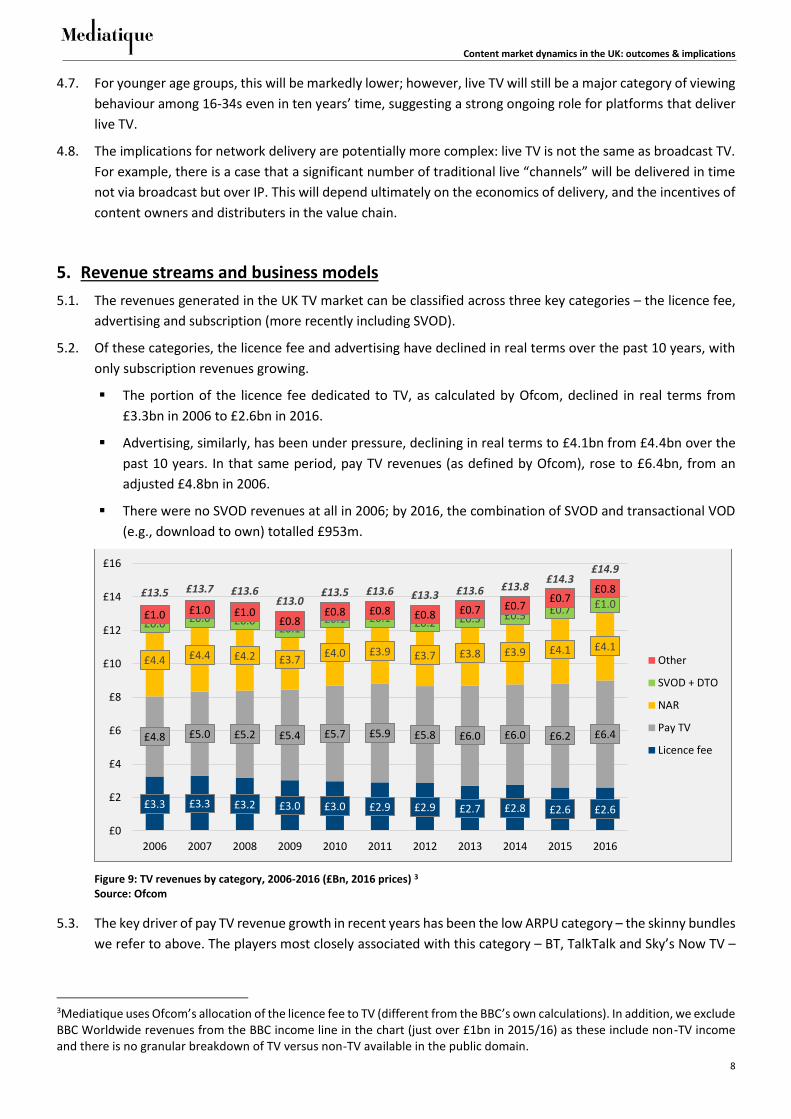
5.1. The revenues generated in the UK TV market can be classified across three key categories – the licence fee,
advertising and subscription (more recently including SVOD).
5.2. Of these categories, the licence fee and advertising have declined in real terms over the past 10 years, with
only subscription revenues growing.
▪ The portion of the licence fee dedicated to TV, as calculated by Ofcom, declined in real terms from
£3.3bn in 2006 to £2.6bn in 2016.
▪ Advertising, similarly, has been under pressure, declining in real terms to £4.1bn from £4.4bn over the
past 10 years. In that same period, pay TV revenues (as defined by Ofcom), rose to £6.4bn, from an
adjusted £4.8bn in 2006.
▪ There were no SVOD revenues at all in 2006; by 2016, the combination of SVOD and transactional VOD
(e.g., download to own) totalled £953m.
Figure 9: TV revenues by category, 2006-2016 (£Bn, 2016 prices) 3 Source: Ofcom
5.3. The key driver of pay TV revenue growth in recent years has been the low ARPU category – the skinny bundles
we refer to above. The players most closely associated with this category – BT, TalkTalk and Sky’s Now TV –
3Mediatique uses Ofcom’s allocation of the licence fee to TV (different from the BBC’s own calculations). In addition, we exclude BBC Worldwide revenues from the BBC income line in the chart (just over £1bn in 2015/16) as these include non-TV income and there is no granular breakdown of TV versus non-TV available in the public domain.
£3.3 £3.3 £3.2 £3.0 £3.0 £2.9 £2.9 £2.7 £2.8 £2.6 £2.6
£4.8 £5.0 £5.2 £5.4 £5.7 £5.9 £5.8 £6.0 £6.0 £6.2 £6.4
£4.4 £4.4 £4.2 £3.7£4.0 £3.9 £3.7 £3.8 £3.9 £4.1 £4.1
£0.0 £0.0 £0.0£0.1
£0.1 £0.1 £0.2 £0.3 £0.5 £0.7 £1.0£1.0 £1.0 £1.0
£0.8£0.8 £0.8 £0.8 £0.7 £0.7
£0.7£0.8£13.5 £13.7 £13.6
£13.0£13.5 £13.6 £13.3 £13.6 £13.8
£14.3£14.9
£0
£2
£4
£6
£8
£10
£12
£14
£16
2006 2007 2008 2009 2010 2011 2012 2013 2014 2015 2016
Other
SVOD + DTO
NAR
Pay TV
Licence fee

Content market dynamics in the UK: outcomes & implications
9
have all pursued bundled strategies, eager to generate income not only from TV but from phone and
broadband services.
5.4. Traditional pay TV operators (Sky and Virgin) are all offering bundled propositions, later entrants BT and
TalkTalk have added TV to their original network offering, and new entrants such as Netflix are exploring a
mixture of OTT distribution (e.g., to tablets, PCs and connected TVs) and deals with platforms (e.g., Virgin
and BT).
5.5. In terms of distribution models for channel groups, these too have evolved over time. Traditional pay TV
channel groups are more likely today to be exploring a hybrid free and pay model (e.g., UKTV, Sony,
Discovery). The traditional commercial PSBs are also exploring multiple routes to market and new business
models – unsurprisingly, given pressures on advertising. These include advertising-funded VOD and their own
SVOD propositions such as the ITV-BBC Britbox – currently available only in the US.
5.6. The emergence of these new players, offering on-demand access to large libraries of content, has obliged all
legacy operators to respond. This has led to a more complex and diverse landscape involving, in addition to
traditional players, manufacturers, telecoms operators, online retailers and even (in recent developments)
social networks, which are also seeking to play a role in the distribution of video content, including movies
and TV.
Figure 10: Content and adjacent markets diagram Source: Mediatique
5.7. The key players are affected in different ways:
▪ PSBs remain domestically focused and based on a free model – they now compete directly for content
with a range of new providers, including globally focused pay operators; those with production arms
are facing intensifying competition from increasingly big, consolidated and global external producers.
▪ Major US content players (e.g., Fox, NBC-U, Discovery) have long been active in the UK pay TV market,
but have recently explored hybrid FTA and pay propositions, exclusive arrangements (e.g., AMC-BT),
and direct supply to new entrants such as Amazon and Netflix. These groups have also been investing

Content market dynamics in the UK: outcomes & implications
10
vertically, taking a position in the UK production sector to secure a content pipeline and to diversify
revenues.
▪ The UK platform operators complicate this picture further: Sky is a major aggregator of global content
from HBO, Starz and others, which are made available directly to its subscribers via on-demand box
sets; Netflix itself is also offered as part of a bundle or discrete payments on Virgin and BT. But Sky is
also an increasingly important commissioner of original UK content, over and above its traditional focus
on premium sports.
5.8. Meanwhile, niche SVOD players are emerging (e.g., Mubi, Curzon), some of them already being offered in
bundles via Amazon Channels, and some likely to migrate to smart TVs (if they are not already available there)
and/or pay TV platforms.
6. Implications for the upstream content market: historical perspective
6.1. The market developments we have identified here have already had an effect on the ways in which content
is created, funded and distributed in major media markets including the UK. Some of these changes resulted
from the internationalisation of the UK independent production sector and the impact (certainly since 2010)
of the investments made by multi-channel operators. Most recently, the significant investments from new
entrants such as Netflix and Amazon (often jointly with UK commissioners) have had a serious impact on the
UK market – not least in terms of pushing up the price of certain key genres for original content and for the
acquisitions market generally.
6.2. Before considering the impact of these developments, it worth considering in greater detail how the content
production and distribution markets have changed over recent decades.
6.3. By 2005, the independent production sector had already grown into a professionalised, consolidated but
largely domestic or European affair. That year, there were roughly 800 independent companies generating
£1.8bn of revenues, with the top ten companies generating around 60% of all sector revenues.
Figure 11: Evolution of the independent production sector (1995 to 2015 – latest available year) Source: Mediatique; Pact UK
6.4. According to figures compiled for Ofcom, around 83% of companies in 2007 were either UK or European
owned. By 2016, following significant mergers and acquisitions activity (led by the likes of NBC-Universal,
Sony, Discovery, Liberty Media and Fox), less than 40% fell into these categories, with the rest owned by US
0.5
1.0
1.8
2.1
2.81,100
970
800
650
500
-
0.5
1.0
1.5
2.0
2.5
3.0
0
200
400
600
800
1,000
1,200
1995 2000 2005 2010 2015
Sector revenues- TV only
Number ofindies
Transition from cottage industry and early consolidation of small players
City investment,consolidation and funding
Private equity investment, vertical integration and international consolidation
Stage of development
# indies £bn

Content market dynamics in the UK: outcomes & implications
11
multinationals. In 2014, the last year where full data is available, international companies generated around
60% of all revenues in the “external” production sector. This is likely to be even higher today, given the impact
of relatively recent transactions (Shine-Endemol re-structured under Fox/Apollo, and the joint purchase of
indie giant All3Media by Discovery and Liberty Media).
6.5. The extent of this “internationalisation” is testimony to the advantages of vertical integration between
producers and distributors but also to the attractions of the UK production market in particular, with its
world-class programming and format reputation and its increasing integration into a creative axis linking Los
Angeles, New York and London. 4
Figure 12: Key indie takeovers leading to loss of qualifying status5 Source: Mediatique; Pact UK
6.6. The favourable position of the UK broadcasting market is the product of several factors:
▪ The establishment of London as a “Global TV Hub”, concentrating on-screen and off-screen talent,
production facilities and related infrastructure.
▪ A tradition of innovation, investment, and experimentation in television partly as a result of a long-
standing tradition for public service broadcasting.
▪ Easy access to financial markets and external capital.
▪ The reputation for transparency and predictability of British courts.
▪ The availability of subsidies and tax credits for the UK creative industries.
▪ The presence of a developed and vibrant production sector – as a result of a very favourable regulatory
environment (summarised in Figure 13 below), including quotas for European and independent works,
the availability of key talent (in front of and behind the camera) and the ability to retain or be
compensated for intellectual property rights on content commissioned by PSBs for future
commercialisation.
4 London has established itself over time as one of the global centres of TV and film production, a major digital advertising player, and home to key content brands. The UK TV sector supports major two-way traffic in content, with UK companies (and international players) buying and selling formats, finished programmes and VOD assets to and from major European markets. 5External content suppliers with no links to UK broadcasters are “qualifying” irrespective of size. See Figure 13 below for full details of the definition of “qualifying” for the purposes of UK regulation.

Content market dynamics in the UK: outcomes & implications
12
Figure 13: Summary of the regulatory regime around PSBs’ commissioning of programming from independent producers Source: Mediatique; Pact UK
6.7. A professionalised external supply sector has enabled production companies to diversify their revenues,
including to international markets.
Revenue stream (£m) 2006 2016
UK primary commissions as % of total 62% 59%
Direct international* as % of total 14% 23%
Figure 14: Total indie sector revenues – qualifying and non-qualifying (£m) (all figures nominal). *Direct international revenues include primary commissions from overseas broadcasters “other international” and “pre-production” Source: Mediatique; Pact UK
•Under the Communications Act 2003, Public Service Broadcasters are subject to a 25% quota of qualifying hours of broadcast to be supplied from independent, external providers (in excess of the 10% now applied at European level) – effectively targeting the BBC and ITV as producer-broadcasters
•As initially defined in the Broadcasting Act of 1990, and subsequently amended, a qualifying independent production company is one that:
•Is not employed by a broadcaster;
•Does not have a shareholding greater than 25% in a broadcaster; or
•One In which any UK broadcaster does not have a shareholding greater than 25% or in which any two or more UK broadcasters do not have an aggregate shareholding greater than 50%
•The definition of an “independent” producer was most recently amended in 2014 to clarify that owners with broadcasters outside the UK could own qualifying companies as long as they did not own a UK-based broadcaster
Indie production quota
•Under the Communications Act 2003, the PSBs were asked by Ofcom to draw up Codes of Practice to govern their relationship with independent companies; under these, broadcasters agreed Terms of Trade (“ToT”) which specified the terms by which broadcasters would secure content from external suppliers
•These are subject to periodic review by Ofcom and were specifically updated at Ofcom’s insistence following the TPS Review to cover “digital” rights as the market for non-linear developed from 2006 onward
•These ToT are agreed by the broadcasters and suppliers (led by trade association Pact) and are not prescriptively defined by Ofcom; the terms typically include tariffs by genre and day part, extent of holdbacks, and “back-end” revenue shares; parties may choose to trade outside the ToT
Terms of Trade
1,191 1,347 1,508 1,395 1,356 1,247 1,539 1,668 1,586 1,550 1,503
107 118
107 115 154
165
185 147 184 193 168
36 28
62 67 79 116
142 120 140 166 166 57 76 77 151 150
279 247 161 248 217 364
324 301 289 430 468
199 242 175 225 193 167
200 236 179 134 82
0
500
1,000
1,500
2,000
2,500
3,000
2006 2007 2008 2009 2010 2011 2012 2013 2014 2015 2016
Primary UK commissions UK rights income
Int'l sales of completed UK programmes Int'l sales of UK formats
Other UK revenue Direct int'l revenue*
Non-TV revenue

Content market dynamics in the UK: outcomes & implications
13
6.8. The internationalisation and consolidation of the external supply chain has reduced the number of companies
qualifying as truly “independent” under regulation, putting pressure on PSBs’ quotas for commissions from
independents. It has also led to a far greater level of integration between the US and the UK in upstream
markets, with implications for commissioning, co-productions and finance, as we explore below.
6.9. For the rest of the UK market, the key players in TV production have been the BBC and ITV.
▪ Under its “Window of Creative Competition”, the BBC had already put out to external competition a
significant proportion of its schedule; in the latest Charter, it was agreed that the remaining in-house
guarantee would be removed entirely (excepting news) and the whole of the BBC’s requirements met
in open competition with external suppliers. As part of this fundamental re-structuring, a new entity,
BBC Studios, has been formed to bid for BBC commissions (and ultimately able to supply content to
other broadcasters too).
▪ ITV’s response to changing dynamics of upstream production and specifically the evolution of rights
windows has been to acquire a string of independent production companies, both in the UK and
(increasingly in recent years) overseas, particularly in the US.
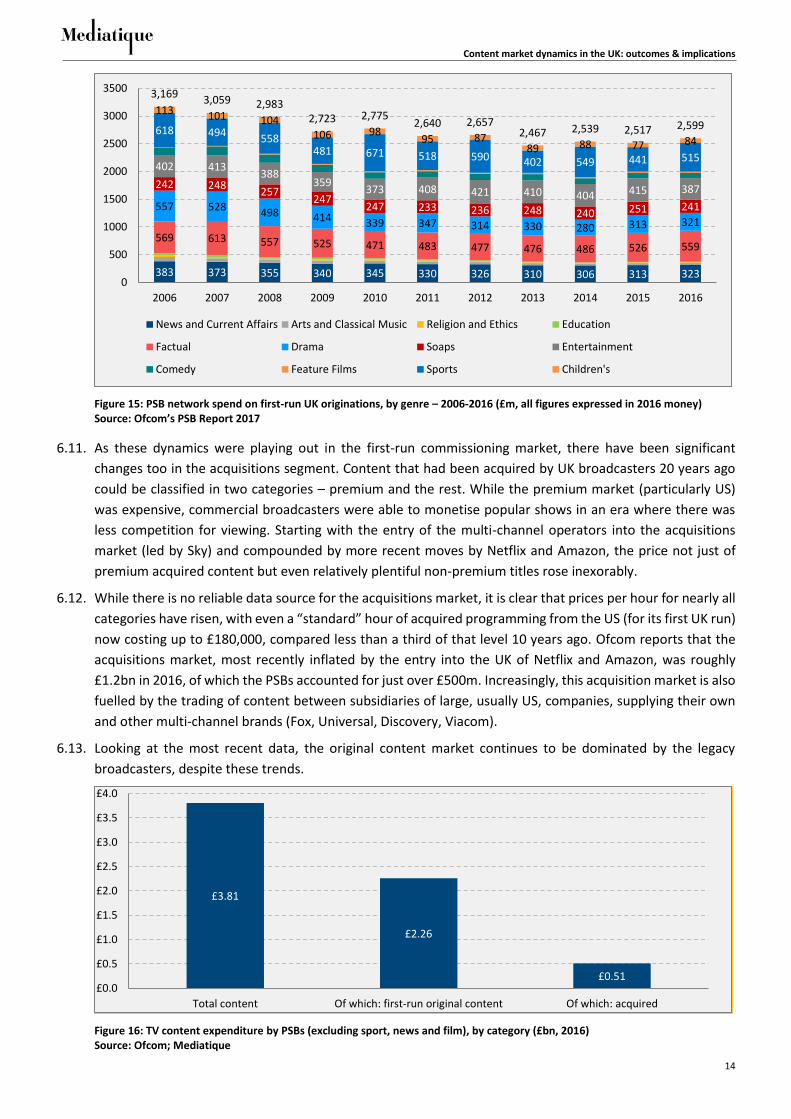
6.10. In terms of expenditure, the PSBs have invested significantly less in first-run UK originations since the high
reached in real terms in 2004 (an adjusted £3.3bn in that year). By 2016, this was around £2.6bn (see Figure
14 below), partly reflects underlying commercial and strategic pressures, but also shifts in strategy and
content economics:
▪ Genre splits tell some of the story here, with mainstream broadcasters favouring cheaper factual
entertainment over certain drama categories.
▪ Overall technical production costs have moderated, especially for studio-bound productions.
Digitisation has also reduced the costs of post-production and aspects of location filming.
▪ Independent producers have also taken on some of the margin squeeze on commissions, in return for
the ability to re-coup in ancillary markets. The consolidation of the external market, and the higher risk
appetite of global owners, has encouraged this trend of deficit funding by suppliers.
▪ Tax credits have also played a role in reducing the net cost of certain content. Notwithstanding changes
possible post-Brexit (e.g., in country of origin rules and the impact of quotas (or their removal), we
assume that tax credits for high-end production will continue to be available, having the effect of
permitting commissioners and producers to stretch budgets.
Content market dynamics in the UK: outcomes & implications
14
Figure 15: PSB network spend on first-run UK originations, by genre – 2006-2016 (£m, all figures expressed in 2016 money) Source: Ofcom’s PSB Report 2017
6.11. As these dynamics were playing out in the first-run commissioning market, there have been significant
changes too in the acquisitions segment. Content that had been acquired by UK broadcasters 20 years ago
could be classified in two categories – premium and the rest. While the premium market (particularly US)
was expensive, commercial broadcasters were able to monetise popular shows in an era where there was
less competition for viewing. Starting with the entry of the multi-channel operators into the acquisitions
market (led by Sky) and compounded by more recent moves by Netflix and Amazon, the price not just of
premium acquired content but even relatively plentiful non-premium titles rose inexorably.
6.12. While there is no reliable data source for the acquisitions market, it is clear that prices per hour for nearly all
categories have risen, with even a “standard” hour of acquired programming from the US (for its first UK run)
now costing up to £180,000, compared less than a third of that level 10 years ago. Ofcom reports that the
acquisitions market, most recently inflated by the entry into the UK of Netflix and Amazon, was roughly
£1.2bn in 2016, of which the PSBs accounted for just over £500m. Increasingly, this acquisition market is also
fuelled by the trading of content between subsidiaries of large, usually US, companies, supplying their own
and other multi-channel brands (Fox, Universal, Discovery, Viacom).
6.13. Looking at the most recent data, the original content market continues to be dominated by the legacy
broadcasters, despite these trends.
Figure 16: TV content expenditure by PSBs (excluding sport, news and film), by category (£bn, 2016) Source: Ofcom; Mediatique
383 373 355 340 345 330 326 310 306 313 323
569 613 557 525 471 483 477 476 486 526 559
557 528 498 414 339 347 314 330 280 313 321
242 248257
247247 233 236 248 240 251 241
402 413388
359373 408 421 410 404 415 387
618 494558
481 671 518 590 402 549 441 515
113 101 104106 98
95 8789 88 77 84
3,1693,059 2,983
2,723 2,7752,640 2,657
2,467 2,539 2,517 2,599
0
500
1000
1500
2000
2500
3000
3500
2006 2007 2008 2009 2010 2011 2012 2013 2014 2015 2016
News and Current Affairs Arts and Classical Music Religion and Ethics Education
Factual Drama Soaps Entertainment
Comedy Feature Films Sports Children's
£3.81
£2.26
£0.51£0.0
£0.5
£1.0
£1.5
£2.0
£2.5
£3.0
£3.5
£4.0
Total content Of which: first-run original content Of which: acquired

Content market dynamics in the UK: outcomes & implications
15
7. Implications for the upstream content market: current trends
7.1. As we have seen, shifting technology, changing consumer preferences, evolving business models and
increasing new entry have led to a more complex and crowded content market in the UK.
7.2. Traditionally, PSBs have been responsible for the vast majority of first-run UK originations, while non-PSB
channels were more likely to offer acquired content from outside the UK – mostly from the US – and UK
repeats. In the past few years, however, non-PSBs have increased their UK-originations budget, especially in
key genres such as drama and factual.
▪ For instance, Ofcom estimates that all non-PSB broadcasters in the UK spent £4.4bn on content in 20166;
however, it estimates c75% of this was film and sport content which was available largely behind a
premium pay wall.
▪ In its third PSB Review7, Ofcom estimates £350m was spent on non-sport UK origination by key multi-
channel providers; this is up 43% in real terms since 2008, and includes origination spend by the
commercial PSB extension channels such as ITV2 and E4. In 2013, Ofcom estimated this expenditure to
be 15% of total UK first-run origination (excluding sport).
7.3. The market for originations has been disrupted by the emergence of high-end international drama as a driver
for new services (e.g., Netflix) and as the prime content to populate new channels (e.g., Sky Atlantic and AMC
from BT).8 There is now a distinct category of “super premium” content – largely drama, high-end
documentaries and some comedy – which has attracted the attention of new entrants and many premium
TV producers in the US (e.g., AMC, HBO, Showtime, Starz). In the UK, Sky has attempted to date to co-opt
these large US premium producers by securing long-term output deals, and these have been the foundation
of the success of Sky Atlantic.9
7.4. These trends point towards an increasingly competitive market – for content, talent and resources. As a
result, both legacy players and new entrants have focused recent attention on boosting control over their
content, including: investments in original content by the global SVOD players; further investments by TV
studios in production assets (e.g., Liberty/Discovery’s purchase of All3Media or the Fox/Apollo consolidation
of Shine-Endemol); increasing budgets at Sky original TV series in its key territories, including UK and
Germany; and a shift towards international ownership of production entities by ITV.
7.5. New entrants Netflix and Amazon have joined pay TV commissioners such as HBO, Showtime, AMC and Sky
in bidding up the cost of certain genres – high-end drama in particular. The recent announcement by Apple
that it will spend c$1bn on long-form content is likely to fuel price inflation. A decade ago, premium high-end
drama might have cost the equivalent in today’s money of £1m an hour; in 2016, HBO was spending a
reported $10m (£7.5m) per hour on Game of Thrones – sustained by underlying business models (i.e., pay,
global audiences, co-productions).
7.6. This compares with far lower budgets for content produced for the domestic market by the UK broadcasters,
with typical high-end series budgeted at around £m per episode (supplemented by co-production funds);
6 Ofcom’s Communications Market Report 2017 (TV and Audio-Visual) is available at the following link: https://www.ofcom.org.uk/__data/assets/pdf_file/0016/105442/uk-television-audio-visual.pdf 7 Ofcom’s 3rd Review of Public Service Broadcasting is available at the following link: https://www.ofcom.org.uk/consultations-and-statements/category-1/psb-review-3 8 It is worth noting that Netflix will spend around $1.2bn on original content in 2016 – globally – out of total content budget of c$6bn (covering films and previously broadcast TV). 9 By definition, this has not included content from Netflix or Amazon, although Netflix is now bundled with BT and Virgin (and could be bundled with Sky in the medium term).

Content market dynamics in the UK: outcomes & implications
16
however, the volume of content produced by these broadcasters is far in excess of the targeted output of
players such as Netflix and HBO.
Figure 17: Average cost/episode of key content titles ($m, title & original channel) Source: Variety; Forbes; ITV; trade press; Mediatique
7.7. Until recently most new entrant original commissions have been sourced from the US, leaving little scope for
incremental revenue for UK producers. This has started to shift, however, as evidenced by Netflix’s recent
UK commissions for The Crown and Our Planet, and Amazon’s commissions for The Collection and from the
exiting Top Gear team. There is every prospect for increased sourcing of content from the vibrant UK creative
market – either directly from external production companies or in co-production with UK broadcasters. To
date, however, these new digital entrants have funded only a handful of UK-themed programmes.
7.8. Competition for key content categories/titles has placed pressures on commissioners in certain genres to
secure rights. In addition, global players have struggled to secure talent and resources in domestic markets
without the ability to leverage the relationships and skills of existing aggregators. As a result, original
commissions are increasingly characterised by joint commissioning and co-production partnerships which
leverage respective skills/resources – for example, the global reach/financial resources of Amazon alongside
the local know-how/valuable brand of Channel 4.
7.9. Netflix is increasingly relying on co-productions to make content in non-US markets. This is partly because it
needs a domestic partner – for access to talent, production expertise, appeal to domestic audiences; in the
UK context, it is also seeking to tap into the UK talent and production base (as part of the lucrative Los Angeles
– New York – London axis).
16
10
9
8
7
6
6
5
5
4
4
3
3
2
2
2
1
0 2 4 6 8 10 12 14 16 18
The Get Down (Netflix)
Game of Thrones (HBO)
Philip K Dick (Amazon, C4, Sony)
The Defenders (Netflix)
Friends (NBC -final season)
The Crown (Netflix, Left Bank)
Big Bang Theory (NBC)
House of Cards (Netflix, Media Rights)
Night Manager (BBC, AMC)
Orange is the New Black (Amazon)
Breaking Bad (AMC)
Walking Dead (AMC)
Sherlock (BBC, Hartswood, PBS)
Netflix (average/hour)
Downton Abbey (ITV, NBCU)
ITV (average/hour - peak)
Vera (ITV)

Content market dynamics in the UK: outcomes & implications
17
Figure 18: Hours of co-produced Netflix original content, 2013–2017 Hours predicted or announced include both co-pros and those labelled as “Netflix Originals” Source: Mediatique
7.10. These trends are mirrored by the increasing reliance of PSBs on external finance and co-productions – this is
particularly true for drama, with the BBC, ITV and Channel 4 all sourcing significant co-production funding in
this genre. In 2016, around 65% of all BBC drama titles were co-produced with an external party; for Channel
4, the figure was 90%. Partners included AMC, Amazon, Netflix and Sony.
7.11. A critical issue here will be the way in which rights are shared between producing partners. While there is an
attraction in the short term to retaining early-window broadcast rights in the UK, trading other rights away
in order to reduce costs, this may prove damaging over time. Broadcasters have traditionally been able to
monetise returns over the lifecycle of the content, optimising distribution and income. This flexibility may be
traded away to production partners who, over time, become less reliant on the broadcaster and able to
proceed on their own.
8. Future market trends
8.1. Our review of the market suggests that existing pay TV operators, mobile networks, SVOD players (and the
traditional PSBs and pay TV channels) will all continue to play a role in the UK TV market; these players will
be joined by Apple, with other well-funded companies (Google and Facebook) likely to enter the market soon.
8.2. There will be an evolution even in traditional business models, incorporating shifts to lower ARPU
propositions and a blend of linear and non-linear consumption; new entrants will inevitably focus on
exclusive, original content in addition to deep libraries, and are likely to continue to seek the benefits arising
from integrating production and distribution. Content cost trends will be a major factor in determining
content choices and supply relationships. And traditional content producers are likely to have to offset
financial pressures by partnering with third parties and continuing to evolve their schedules to adjust to
available revenues, cost pressures and audience expectations.
Business models, revenues and the impact on content expenditure
8.3. As bundling of content and network services becomes more prevalent, the bundled revenues accruing to
network providers will become a more important driver of content expenditure than “stand-alone” pay TV
subscription or advertising revenues.
24 39131
296 345
4470
189
309
377
278
0
200
400
600
800
1000
1200
2013 2014 2015 2016 2017
Predicted to-be-announced
Co-production
Claimed original

Content market dynamics in the UK: outcomes & implications
18
8.4. Although we predict traditional pay TV subscription revenues to decrease over time, we expect total pay TV
revenues – including SVOD and bundled revenues where relevant – to grow in real terms over the next 10
years. This dynamic is driven by a higher proportion of the UK population taking up pay TV services –
predominantly skinny bundles such as BT and Now TV, and SVOD services, which however enjoy smaller
margins than traditional, big-bundle pay TV providers. Players in these adjacent sectors (including Netflix,
Amazon, BT) are set to invest some of these additional revenues in UK content, thereby potentially offsetting
declines in traditional revenues and subsequent investment in content.
8.5. So what might the next 10 years bring in terms of content expenditure, given these trends and dynamics?
8.6. If traditional TV players (the BBC, commercial PSBs and multi-channels) continue to invest the same
percentage of their revenues in original content as currently, then any decline in these revenues will
inexorably lead to a fall in content investment.
8.7. We estimate that traditional TV players spent in the aggregate about 20% of their TV revenues on UK
originations in 2016. Of this, the PSBs (the BBC, ITV, Channel 4 and Channel 5) actually spent an even higher
share of relevant revenues on original content – 35% in 2016. Taken as category, traditional content funders
are forecast to see a decline in revenues over the next decade; in our analysis, the decline is wholly delivered
by downward pressure in the pay TV market, with both advertising and the licence fee assume to be flat. This
reflects our view that PSBs in particular are less susceptible to the key market forces that will drive down
overall TV revenues in real terms over the next decade (such as cord-shaving or cord-cutting).
8.8. Assuming a constant ratio of UK originations spend to revenues of 20% for traditional funders, we therefore
identify a potential gap in real terms of more than £500m in expenditure on original content by 2026, or 21%
of total current first-run TV content expenditure (enough to fund 230 episodes of Sherlock or 700 episodes
of Vera). Note that this assumption is in fact quite conservative. The gap would be even greater were TV
advertising and/or the licence fee to decline rather than to deliver flat performance.
8.9. Even at constant levels of investment buoyed by flat revenue growth, the PSBs may well find it difficult to
maintain their current UK first-run originations output in terms of hours, given the likelihood of further
inflation in content costs (particularly for drama and high-end entertainment). Hence, a relatively constant
level of expenditure may well go to fund a schedule with less drama and more lifestyle programming, for
example. Adding to challenges for PSBs, it is worth recalling that commercial PSBs (and BBC JV group UKTV)
are also exposed to weakness in pay TV subscriptions, given the income stream they receive from pay TV
operators for certain of their services.
8.10. If the traditional providers of original TV content are constrained, is there any prospect for incremental
investment from other market segments? A question that is often asked is whether any gap might be bridged
by those players whose revenues are expected to grow in future years – the triple play providers of lower
cost TV services such as BT, TalkTalk and Now TV and, more significantly, the SVOD providers such as Netflix
and Amazon. This may be a tall order.
▪ The telecommunications providers which have entered the TV platform market by bundling TV services
with their network propositions – e.g. TalkTalk, BT, and EE – have concentrated on aggregating pre-
existing content rather than investing in new original content. The only exception is BT, but this has been
in relation to sports rights and production, not multi-genre TV programming.
▪ Any future entrant – Vodafone, for instance, which has long considered launching its own TV platform
in the UK – would also be unlikely to commission original British programming.
▪ As a result, with the exception of sports, new entrant triple-play providers are unlikely to contribute to
filling the gap in expenditure on originated British content.

Content market dynamics in the UK: outcomes & implications
19
8.11. The SVOD market segment appears, on the surface, to be more likely to fund UK content – indeed, the SVOD
new entrants have already invested in UK content, often alongside UK producers. However, a surface reading
might be misleading.
▪ For example, pro-rated expenditure on global original content by the two key SVOD players (Netflix and
Amazon), adjusted for the UK’s share of international SVOD markets in 2016, was £115m. In that year,
revenues for SVOD in the UK were £664m, according to Ofcom. This is a ratio of 17% – not all that far
from the ratio of original content expenditure by “traditional” funders, at around 20%.
▪ But the figure of £115m is actually generous to the SVOD providers, as it includes all the original content
(whether made in the UK or not), adjusted for the size of the UK subscribing base as a proportion of the
international market. We estimate the actual expenditure by Netflix and Amazon in original
programming made in the UK was £101m in 2016, or just 15% of relevant revenues. Even this may not
be reflective of underlining dynamics, as it includes the expensive anomaly of The Grand Tour, Amazon’s
Top Gear successor show. Taking this programme out of the calculation, the ratio drops to 12%.
Moreover, of the shows that are jointly funded by the new entrants for initial distribution via UK TV
channels, nearly all are “global” rather than “domestic” in character (with a heavy emphasis on Sci Fi).
▪ Still, even assuming that SVOD players match the traditional players’ proportion of revenue invested in
UK originations of 20%, that would bring their contribution to UK original programming spend to
c£350m in 2026 (based on our ten-year revenue projections), still short of our estimated gap of £500m.
Only by spending 28% of relevant revenues on original content (as projected by Mediatique) could the
gap be plugged – and there is no incentive for these players to do so, especially given their global
nature10.
8.12. Moreover, short of legislation, there is no guarantee that any incremental revenues accruing to new entrants
would be spread across all the key genres supported currently by traditional content funders; any content
produced or commissioned by global players is likely to favour global content attributes (in fantasy and Sci Fi
drama, for example, and natural history) rather than domestic tastes.
8.13. Furthermore, it must be recognised that, at present, the vast majority of UK originated content is shown on
public-service channels that are FTA and therefore available to the widest possible audience. Even though
we expect take-up of SVOD and skinny TV services to rise in the next decade or so, there is a genuine risk
that, even if the gap in UK original content spend by traditional players is counterbalanced by increased
investment in first-run originations by new entrants, such content would not be available to a large
proportion of the UK population.
Content investment – implications of the underlying trends
8.14. The market drivers we identify above suggest that the UK content market will become increasingly polarised,
with an increasing focus on high-end content characterised by competitive tension and cost inflation.
10 We note that moves at the European Commission to make SVOD providers contribute to local production could be helpful – but even here, a 20% target would already appear to be on the high side.

Content market dynamics in the UK: outcomes & implications
20
Figure 19: Investment prospects for major genres/categories Source: Mediatique
8.15. The UK content market will see a greater role for international players as commissioners, aggregators and
partners. However, the share of consumption secured by global players will be always be constrained by a
reliance on international content and lack of domestic content. A truly global proposition has its limitations
– it cannot, for example, displace local content easily, and it is likely to incur additional costs as they,
inevitably, are obliged to refine their content libraries to reflect differences in taste, language and
competition in different markets.
8.16. As a result, access to local content remains crucial to engaging with viewers, a dynamic seen in almost all
markets and particularly those with a track record of large domestic players. In the UK, for example, even
against the range of competing content (e.g., multi-channel content, a number of SVOD propositions) the
mainstream PSBs continue to enjoy a dominant share of total viewing. At least for the foreseeable future,
the UK networks will be attractive partners for global players.
8.17. This will result in an increasing role for co-productions in the UK market, not least as a way of sharing the
impact of cost inflation among partners. In addition, as the content market becomes ever more crowded,
competitive and complex, we would expect domestic broadcasters to consider new ways of operating, with
as much integration as possible among commissioning, production and distribution.
8.18. As audience behaviours increasingly favour non-linear viewing over time11, some genres that are currently
commercially attractive will become less so over time. Those genres that are most reliant on live viewing are
11 As more content is consumed on demand, traditional broadcasters will see their linear prominence decline in importance – creating a potentially vicious circle of declining share. Despite calls for new rules, the Government has not yet supported extending prominence protections to on demand platforms. As a consequence of innovations in search and navigation, and new home page propositions where traditional channel brand positioning is diluted, the prior advantages afforded mainstream broadcasters will inevitably reduce.

Content market dynamics in the UK: outcomes & implications
21
potentially challenged, although this may render a few destination programmes even more valuable than
before. More worryingly, those genres that are more likely to be watched on a non-linear basis may not
deliver value reliably as business models do not currently allow time-shifted or on-demand content to be
monetised on similar or better terms to live TV.
8.19. As competition for audiences intensifies, broadcasters may be incentivised to rely on proven formats or
programme brands that have established track records of generating positive returns – this may also favour
repeats or re-commissions and international sales potential. Content outcomes may be polarised further via
a focus on higher quality alongside reduced output (“fewer better”) and a shift towards lower cost genres.
These trends may well be amplified by the degree of vertical integration between US and UK production and
distribution entities, and the degree to which the UK becomes an integral part of a supply chain that is truly
global. In this scenario, addressing the specific requirements of domestic audiences may be a second-order
consideration.
8.20. At risk in this outlook is the extent of domestic commissioning and production in a range of key market
segments, with “global” tastes trumping domestic story-telling in high cost genres such as drama, natural
history, and high-end entertainment.
9. Key conclusions
9.1. The robustness of key revenue markets will determine the availability of funds to support the
origination/acquisition of UK content – and the trends lines are moderately negative. A confluence of factors
(economic conditions, business models, public policy) will reduce the availability of funds for content, even
assuming a growing offsetting contribution from SVOD and new entrants from adjacent markets.
9.2. Common to both legacy players and new entrants is the belief that competitive advantage can be secured
most effectively via rights exclusivity or ownership (delivered via outright ownership or via joint venturing);
the alternative is to hope to secure market share via the aggregation of non-exclusive rights, which requires
competing largely on brand, scale and/or price.
9.3. A major impact of market entry by large international players is continuing inflationary pressures on high-
end content (notably drama, comedy and factual), even if other TV genres may see prices moderate. This
might be most obviously seen in spiralling talent costs, both in front of and behind the camera.
9.4. Furthermore, distinctions between scripted TV and movies have already been blurred for example, with TV
production increasingly taking on the attributes and talent of film. This is likely to crowd out certain
production entities that do not have the resource base or relationships with talent to sustain such high-
budget productions.
9.5. One answer to the dilemma of spiralling premium content costs is co-production. Already, the contribution
of international revenues to UK-based production companies has been growing, offsetting sluggish domestic
primary commission revenues. This suggests there will be pressures on broadcasters to access more third-
party funding –and a struggle to maintain optimality around rights – thereby threatening a loss of control
over creative input and rights/returns in secondary windows (in certain genres).
9.6. Broadcasters themselves may also seek to maximise revenues in secondary windows by focusing on genres
with international appeal, with a potentially damaging impact on UK distinctiveness and innovation –
compounded by the fact that the majority of output from global players such as Netflix will need to cater for
a global audience.
9.7. Thus, intensifying global trends could lead to significant changes in the nature of UK content provision –
potentially resulting in less content being made in certain genres, a shift in focus toward global tastes,
reduced plurality of supply, and a polarisation in quality between premium and low cost. The overall effect

Content market dynamics in the UK: outcomes & implications
22
may be an increased role for global funders and commissioners and a concomitant decline in the ability of
UK creatives to tell distinctively UK stories.
9.8. For now, the dangers of these disruptive forces remain limited. New players – particularly those with global
reach – are likely to require access to high-quality domestic content in order to succeed.
9.9. UK broadcasters therefore still have a window to ensure a role in the emerging new content market. They
have a large share of viewing, strong brands that attract interest from global partners, and enviable track
records for commissioning and/or producing quality content. They would do well to consider new ways of
operating, including changes to the roles of commissioners/schedulers, increased resources for negotiators
to ensure a fair share of secondary market upside and closer integration of commissioning, production and
distribution. As content preferences continue to evolve, as business models are adapted in response and as
the market globalises further, that window may not remain open for much longer.

Content market dynamics in the UK: outcomes & implications
23
Important information
Mediatique is a research and advisory firm based in London working across the media and communications sector, and it may work or have worked for companies and organisations mentioned in this report.
This report represents Mediatique’s view of the relevant companies, platforms and markets at the current time. Any opinions, forecasts or estimates herein constitute a judgement as at the date of this document. There can be no assurance that future results or events will be consistent with any such opinions, forecasts or estimates; no representation or warranty, express or implied, is made regarding future performance.
In preparing this report, Mediatique reviewed a number of public sources, including reports and reviews published by the BBC, Ofcom, BARB and Pact UK. The sources used by Mediatique in the compilation of this report are believed to be accurate but Mediatique takes no responsibility for the accuracy of information derived from third-party sources.
Mediatique has not undertaken legal, contractual or technical due diligence of any kind for the purposes of completing this report. The information contained in this document is subject to change without notice, its accuracy is not guaranteed, it may be incomplete or condensed, and it may not contain all material information concerning the relevant markets in the UK and other territories.
The client for this work is the BBC. While Mediatique have consented to allow this report to be made public, it has not in so consenting extended its duty of care beyond that owing to the BBC.
The views, analyses and conclusions expressed herein are those of Mediatique and no other party, and should not be construed as representing, in whole or in part, the opinions the BBC.


