CONTAX PARTICIPAÇÕES S.A. Contax Holding...
21
6-K 1 contax20110414_6k.htm ACQUISITION OF GRUPO ALLUS UNITED STATES SECURITIES AND EXCHANGE COMMISSION Washington, D.C. 20549 FORM 6-K REPORT OF FOREIGN ISSUER PURSUANT TO RULE 13a-16 OR 15d-16 OF THE SECURITIES EXCHANGE ACT OF 1934 For the month of April, 2011 Commission File Number 000-5149 CONTAX PARTICIPAÇÕES S.A. (Exact name of Registrant as specified in its Charter) Contax Holding Company (Translation of Registrant's name in English) Rua do Passeio, 56 – 16th floor Rio de Janeiro, RJ Federative Republic of Brazil (Address of principal executive office) Indicate by check mark whether the registrant files or will file annual reports under cover Form 20-F or Form 40-F. Form 20-F Form 40-F Indicate by check mark whether the registrant by furnishing the information contained in this Form is also thereby furnishing the information to the Commission pursuant to Rule 12g3-2(b) under the Securities Exchange Act of 1934. Yes No
-
Upload
truongthien -
Category
Documents
-
view
223 -
download
1
Transcript of CONTAX PARTICIPAÇÕES S.A. Contax Holding...

6-K 1 contax20110414_6k.htm ACQUISITION OF GRUPO ALLUS
UNITED STATES
SECURITIES AND EXCHANGE COMMISSION Washington, D.C. 20549
FORM 6-K
REPORT OF FOREIGN ISSUER PURSUANT TO RULE 13a-16 OR 15d-16 OF THE SECURITIES
EXCHANGE ACT OF 1934
For the month of April, 2011
Commission
File Number 000-5149
CONTAX PARTICIPAÇÕES S.A.
(Exact name of Registrant as specified in its Charter)
Contax Holding Company
(Translation of Registrant's name in English)
Rua do Passeio, 56 – 16th floor
Rio de Janeiro, RJ Federative Republic of Brazil
(Address of principal executive office)
Indicate by check mark whether the registrant files or will file annual reports under cover Form 20-F or Form 40-F.
Form 20-F � Form 40-F �
Indicate by check mark whether the registrant by furnishing the information contained in this Form is also thereby furnishing the information to the Commission pursuant to Rule 12g3-2(b) under
the Securities Exchange Act of 1934.
Yes � No �

APSIS CONSULTORIA EMPRESARIAL
EXECUTIVE SUMMARY
APSIS was appointed by CONTAX to determine the value of GRUPO ALLUS, in accordance with Article 256 of Law 6,404/76 (Brazilian Law of Corporations), with regard to the acquisition of GRUPO ALLUS by CONTAX, to serve as the basis for the amount paid. The valuation is made using the methodologies described in Article 256, section II of said Law:
a) The average price of shares on the stock exchange or the organized OTC market, in the ninety (90) days prior to the agreement;
b) Net value of the shares according to market price;
c) Net earnings per share.
REPORT: RJ-0089/11-01
REFERENCE DATE: December 31, 2010
CLIENT:
CONTAX S.A., with headquarters at Rua do Passeio nº 48 ao 56 - parte, Centro, in the city and state of Rio de Janeiro, inscribed in the corporate taxpayers register (CNPJ/MF) under number 02.757.614/0001-48; and
CONTAX COLOMBIA SAS, registered with the Bogotá Chamber of Commerce under commercial registry no. 2080300, henceforth jointly known as CONTAX.
OBJECTS:
MULTIENLACE S.A. with headquarters at Calle 49 # 50 - 21 Ed. Del Café, piso 31, in the city of Medellin, Colombia;
STRATON ARGENTINA S.A. with headquarters at Rua Rosário de Santa Fé, 71 – 2º piso – Oficina 210, in the city of Cordoba, Argentina;
ALLUS ARGENTINA S.A. with headquarters at Rua Rosário de Santa Fé, 89, X5000ACA, in the city of Cordoba, Argentina;
ALLUS COLOMBIA S.A. with headquarters at Cra 37, “A”, nº 8-43, Of. 701, Edifício Rose Street, in the city of Medellin, Colombia; and
ALLUS PERU S.A. with headquarters at Jr. Carabaya, nº 933, Edifício Sudamericana, in the city of Lima, Peru, henceforth jointly known as GRUPO ALLUS.
PURPOSE:
Preparation of the valuation report to determine the economic value of GRUPO ALLUS, in accordance with Article 256 of Law 6,404/76 (Brazilian Law of Corporations), with regard to the acquisition of GRUPO ALLUS by CONTAX, to serve as the basis for theamount paid.
Report RJ-0089/11-01 Base Date: 12/31/2010 1
To determine the highest of the three values mentioned above.
The technical procedures employed in this report are in accordance with the criteria established by the rules for valuation.
APSIS CONSULTORIA EMPRESARIAL
ACQUISITION OF GRUPO ALLUS: SUMMARY OF THE TRANSACT ION
CONTAX PARTICIPAÇÕES S.A., through its subsidiaries Contax S.A. and Contax Colômbia S.A.S, will enter into Stock Purchase Agreements to acquire 100% of the shares issued by Stratton Spain S.L., Allus Spain S.L., Stratton Argentina S.A., Stratton Peru S.A. and Multienlace S.A., (which jointly make up Grupo Allus). Grupo Allus is indirectly controlled by Eton Park, a global, multidisciplinary investment corporation.
The acquisition of Grupo Allus is directly in line with the Company’s strategy of global expansion, with the focus on Latin America. For Contax, the acquisition represents an important step in becoming one of the most complete global providers of Business Process Outsourcing (BPO) services, dedicated to assisting its clients throughout the entire consumer relationship chain.
APSIS CONSULTORIA EMPRESARIAL
TABLE OF CONTENTS
APSIS CONSULTORIA EMPRESARIAL
1. INTRODUCTION
Report RJ-0089/11-01 Base Date: 12/31/2010 2
Report RJ-0089/11-01 Base Date: 12/31/2010 3
1.INTRODUCTION 52.PRINCIPLES AND RESERVATIONS 63.LIMITS OF RESPONSIBILITY 74.VALUATION METHODOLOGIES 85.ABOUT GRUPO ALLUS 106.VALUATION – AVERAGE SHARE PRICE IN STOCK EXCHANGE 117.VALUATION – MARKET VALUE OF SHAREHOLDERS’ EQUITY PER SHARE 128.VALUATION – NET INCOME PER SHARE 139.VALUATION – ACQUISITION VALUE OF GRUPO ALLUS 1410.CONCLUSION 1511.LIST OF EXHIBITS 16
Report RJ-0089/11-01 Base Date: 12/31/2010 4

APSIS CONSULTORIA EMPRESARIAL Ltda., henceforth known as APSIS, with headquarters at Rua da Assembléia, nº 35, 12º andar, Centro, in the city and state of Rio de Janeiro, inscribed in the corporate taxpayers registry (CNPJ/MF) under number 27.281.922/0001-70, was appointed by CONTAX to value ALLUS in accordance with Article 256 of Law 6,404/76 (Brazilian Law of Corporations), as part of the acquisition of ALLUS by CONTAX.
To prepare this report, the company used data and information provided by third parties in the form of documents and personal meetings with the client. The estimates used in this process are based on documents and information that include, among others, the following:
• The balance sheets of GRUPO ALLUS’ subsidiaries for 2008 and 2009 and on the reference date; and
• Multi-year projections of GRUPO ALLUS’ subsidiaries.
The APSIS team engaged in this task consists of the following professionals:
APSIS CONSULTORIA EMPRESARIAL
• AMILCAR DE CASTRO Project Manager
• ANA CRISTINA FRANÇA DE SOUZA Civil Engineer Graduate Degree in Accounting (CREA/RJ 91.1.03043-4)
• BETINA DENGLER Project Manager
• CLAUDIO MARÇAL DE FREITAS Accountant (CRC/RJ 55029/O-1)
• FLAVIO LUIZ PEREIRA Accountant (CRC/RJ 022016-O-9)
• CARLOS MAGNO SANCHES Project Manager
• LUIZ PAULO CESAR SILVEIRA Mechanical Engineer MBA (CREA/RJ 89.1.00165-1)
• MARGARETH GUIZAN DA SILVA OLIVEIRA Civil Engineer (CREA/RJ 91.1.03035-3)
• RICARDO DUARTE CARNEIRO MONTEIRO Civil Engineer Graduate Degree in Economic Engineering (CREA/RJ 30137-D)
• SÉRGIO FREITAS DE SOUZA Economist (CORECON/RJ 23521-0)
Report RJ-0089/11-01 Base Date: 12/31/2010 5

2. PRINCIPLES AND RESERVATIONS
This report, numbered, calculated and tailored to the client’s requirements, strictly follows the following basic principles:
• The consultants have no personal interest in the matters covered by this report nor will they benefit from it in any way and, therefore, there is no conflict of interest preventing them from preparing this report.
• To the best of the consultants’ knowledge, the analyses, opinions and conclusions stated in this report are based on true and accurate data, diligence, researches and surveys.
• The report presents all the limiting conditions imposed by the methodologies adopted that may affect its analyses, opinions and conclusions.
• The fees of APSIS professionals will not, in any way, be subject to the conclusions of this report.
• APSIS takes full responsibility for the matter relating to Valuation Engineering, including those implied, exercising its duties, duly established by laws, codes or own regulations.
• Information received from third parties is assumed to be correct, and sources of said information are mentioned in the report.
• The report was prepared by APSIS and nobody, except its own consultants, prepared the analyses and respective conclusions.
• For projection purposes, we assumed that there is no lien or encumbrance of any nature, either judicial or extrajudicial, on the properties in question, other than those listed in this report.
• This report meets the specifications and criteria established by the Uniform Standards of Professional Appraisal Practice (USPAP) and the requirements of other bodies, such as Brazil’s Ministry of Finance and Central Bank, Banco do Brasil, Securities and Exchange Commission of Brazil (CVM), Superintendence of Private Insurance (SUSEP), Income tax Regulations (RIR), etc.
APSIS CONSULTORIA EMPRESARIAL
3. LIMITS OF RESPONSIBILITY
• To prepare this report, APSIS used information and historical data audited by third parties or unaudited data, as well as unaudited projections provided in writing or orally by the company’s management or obtained from said sources. Thus, APSIS assumed that such data and information obtained for this report were true and takes no responsibility for their veracity.
• The scope of this work does not include auditing the financial statements or reviewing the work of its auditors.
• Our work was carried out for the exclusive use of the CLIENT and the other properties involved in the project for the purpose mentioned earlier.
• We are not responsible for any losses incurred by the CLIENT, its shareholders, executive officers, creditors or other parties, caused by the use of the data and information provided by the company and included in this report.
Report RJ-0089/11-01 Base Date: 12/31/2010 6

• The analyses and conclusions in this report are based on diverse assumptions, on this date, relating to operational projections for the future, such as prices, quantities, market share, revenues, taxes, investments, operating margins, etc. Thus, the company’s future operating results may differ from any projection or estimate in this report.
APSIS CONSULTORIA EMPRESARIAL
4. VALUATION METHODOLOGIES
MARKET APPROACH: STOCK EXCHANGE PRICE
This methodology values a company by the sum of all its shares at the market price. Given that the price of a share is defined at present value of future dividends and a sale price at the end of the period, at a required rate of return, in an Ideal Financial Market, this approach would show investors the company’s correct value.
ASSET-BASED APPROACH – SHAREHOLDERS’ EQUITY AT MARK ET VALUE
This methodology is derived from the generally accepted accounting principles (GAAP), according to which financial statements are prepared based on historical cost, or acquisition cost. According to this principle and the basic principle of accounting, the net book value of a company is the book value of its assets minus the book value of its liabilities.
On the other hand, basic economic principles allow us to create the following valuation technique: the value defined for assets minus the value defined for liabilities is equal to the value defined for a company's shareholders' equity. From the valuation perspective, the relevant definitions of value are those that are appropriate to the purpose of the valuation.
Thus, the asset-based approach values a company by adjusting the book value (net balance) of its assets to their respective fair market values. Assets and liabilities considered relevant are valued at their fair market value, and a comparison is provided of this value and their book value (net balance).
These adjustments, duly analyzed, are added to the net book value, thus determining the company’s market value according to the asset-based approach. The company’s fair market value will be Shareholders’ Equity after considering the adjustments found for the valued assets and liabilities.
INCOME APPROACH: FUTURE PROFITABILITY
This methodology determines the company’s future profitability based on projected net income and bringing it to present value.
The net income projection period is determined taking into consideration the period necessary for the company to achieve stable operations, i.e., without any significant operational variations. Net income is then calculated to present value using a discount rate that will reflect the risks associated to the market, the company and its capital structure.
PROJECTION OF FUTURE RESULTS
In order to calculate future profitability, we used Net Income as a measure, where:
Report RJ-0089/11-01 Base Date: 12/31/2010 7
Income before non -cash items, interest and taxes (EBITDA) ( - ) Non-cash items (depreciation and amortization) ( = ) Net income before taxes (EBIT)

APSIS CONSULTORIA EMPRESARIAL
RESIDUAL VALUE
After the end of the projection period, we consider perpetuity, which includes all the flows to be generated after the last year of projection and their respective growth. The company’s residual value (perpetuity) is usually estimated using the constant growth model, which assumes that, after the end of the projection period, net income will constantly grow in perpetuity. It calculates the value of perpetuity in the last year of the projection period through the geometric progression model and then transporting result to the first year of projection.
DISCOUNT RATE
The discount rate to be used for calculating the present value of determined earnings in the projected cash flow represents the minimum return required by investors, assuming that the company will partially be financed by its own capital, which will require higher returns than those obtained in a standard risk investment, and partially by debt.
This rate is calculated using the Weighted Average Cost of Capital (WACC) methodology by which the cost of capital is determined by the weighted average of the economic value of the components in the capital structure (equity and debt), described below:
( - ) Income and Social Contribution Taxes (IR/CSSL) ( = ) Net income after taxes
Report RJ-0089/11-01 Base Date: 12/31/2010 8
Cost of equity Re = Rf + beta*(Rm – Rf) + Rp
Rf Risk-free rate – based on the annual interest rate of the 30-year U.S. Treasury bonds, considering the country’slong-term inflation.
Rp Sovereign risk - represents the risk of investing in an asset in the country in question, compared to a similarinvestment in a country considered safe.
Rm Market risk - measures the appreciation of a fully diversified share portfolio over a 30 year-period.
beta Adjusts the market risk for the risk of a specific sector. Leveraged beta Adjusts the sector’s beta for the company’s risk. Cost of debt Rd = Rf (*) + alfa + Rp
Rf (*) Risk-free rate – based on the annual interest rate of the 10-year U.S. Treasury bonds, considering the country’sinflation.
Alfa Specific risk – represents the risk of investing in the company being analyzed.
Discount rate WACC = (Re x We) + Rd (1 –t) x Wd Re = Cost of equity. Rd = Cost of debt. We = Percentage of equity in the capital structure. Wd = Percentage of debt in the capital structure. T = The company’s effective rate of income and social contribution taxes.

APSIS CONSULTORIA EMPRESARIAL
5. ABOUT GRUPO ALLUS
Allus Global BPO Center is the leader in BPO solutions in Latin America.
The company’s management is based on a proprietary high performance model that combines specialized human resources, technological support, continuous improvement of practices and operational flexibility, all of which is customized to clients' needs to offer solutions from anywhere, anytime.
Allus operates in Colombia, Argentina and Peru, countries with attractive opportunities, thanks to the availability of qualified workforce, technology, competitive costs, convenient time zone and a favorable regulatory framework.
In addition to its Latin American operations, the company has sales offices in Spain and the USA, which allow it access to global clients.
Allus Colômbia
Allus Colômbia is the national leader, with market share of 18%. It is present in the country’s two most important cities: Medellin and Bogotá.
Allus has been in Colombia for more than 12 years, developing, testing and implementing successful practices in Customer Service, Telemarketing, Debt Collection and BPO.
Allus Argentina
Allus Argentina has eight operational sites and offices in Cordoba and Mendoza. It has been operating in the country for more than 12 years, developing, testing and implementing successful practices in Customer Service, Telemarketing and BPO.
Allus Peru
Allus Peru is the country’s second largest company in its segment, with market share of 6%. The company started operating in the fourth quarter of 2009 and, by August 2010, had 780 workstations and more than a thousand employees.
Allus Peru is a platform for offshore services and complements the Argentina and Colombia operations, providing the flexibility to adapt to the changing macroeconomic conditions among the countries.
The Peru operations are focused on Customer Service and Telemarketing. In the coming years, the company should offer Debt Collection, Back Office and BPO services.
APSIS CONSULTORIA EMPRESARIAL
6. VALUATION – AVERAGE SHARE PRICE IN STOCK EXCHANG E
GRUPO ALLUS is a limited liability company and, hence, its shares are not traded on the stock exchange or
Report RJ-0089/11-01 Base Date: 12/31/2010 9
Report RJ-0089/11-01 Base Date: 12/31/2010 10

organized OTC markets. This methodology does not apply to this analysis.
APSIS CONSULTORIA EMPRESARIAL
7. VALUATION – MARKET VALUE OF SHAREHOLDERS’ EQUITY PER SHARE
Considering the GRUPO ALLUS companies as a whole, this methodology was not applied.
APSIS CONSULTORIA EMPRESARIAL
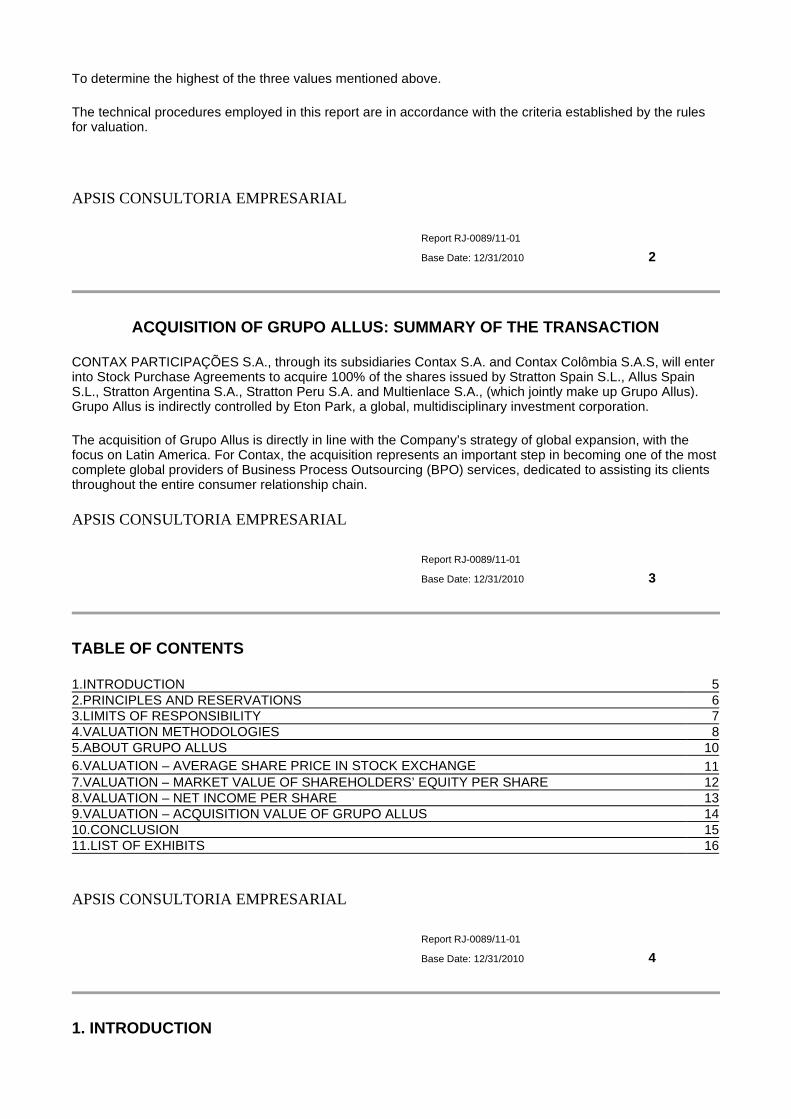
8. VALUATION – NET INCOME PER SHARE
This report used the income approach to meet the valuation criterion of Net Income per share, in accordance with Article 256, section II and item “c” of Law 6,404/76 (Brazilian Law of Corporations). Using this criterion, Net Income was determined by projecting the future net income, adjusted to present value, using an appropriate discount rate (see item 2.1).
The projected net income is more than fifteen times the net income in the last two years, as shown in the table below.
APSIS CONSULTORIA EMPRESARIAL
Report RJ-0089/11-01 Base Date: 12/31/2010 11
Report RJ-0089/11-01 Base Date: 12/31/2010 12
MULTIENLANCE S.A. STRATTON PERU 2010 2009 2010 2009
Net income (COP ‘000) -1,816,689 -
10,394,577 Net income (PEN) -
1,172,000 - Restated on 12/31/10 (US$
‘000) -908 -4,989 Restated on 12/31/10 (US$) -413,100 - Number of shares 30,454,642 30,454,642 Number of shares 30,000 -
Earnings per share (US$) (0.03) (0.16) Earnings per share (US$) (13.77) - 15x (0.45) (2.46) 15x (206.55) -
Average -1.45 Average -206.55 COP = Colombian Peso PEN = Novo Sol
STRATTON ARGENTINA STRATTON SPAIN 2010 2009 2010 2009
Net income (ARS) 15,406,154 4,989,866 Net income (EUR) 9,303 - Restated on 12/31/10 (US$) 3,872,799 1,306,048 Restated on 12/31/10 (US$) 12,328 -
Number of shares 170,669 170,669 Number of shares 170,690 - Earnings per share (US$) 22.69 7.65 Earnings per share (US$) 72.22 -
15x 340.38 114.79 15x 1,083.36 - Average 227.58 Average 1,083.36
ARS = Argentine Peso EUR = Euro

9. VALUATION – ACQUISITION VALUE OF GRUPO ALLUS
CONTAX will pay US$167 million for 100% of the capital stock of GRUPO ALLUS.
APSIS CONSULTORIA EMPRESARIAL
10. CONCLUSION
After examining the documents mentioned earlier and based on the studies conducted by APSIS, the valuation experts concluded that the amount to be paid by CONTAX for GRUPO ALLUS is one and a half times higher than the three amounts calculated using the methodologies envisaged in Article 256, section II of Law 6,404/76 (Brazilian Law of Corporations), on the reference date of December 31, 2010, as shown in the adjacent chart.
The valuation report RJ-089/11-01 was prepared as a Portable Document Format (PDF) file, including the digital certification of the personnel involved, and printed by APSIS. It consists of sixteen (16) pages printed on one side only, and three (3) exhibits. APSIS Consultoria Empresarial Ltda., CREA/RJ 82.2.00620-1 and CORECON/RJ RF/2.052-4, a company specializing in asset valuation, legally represented below by its directors, is available for any clarifications deemed necessary.
Rio de Janeiro, April 7, 2011
APSIS CONSULTORIA EMPRESARIAL
11. LIST OF EXHIBITS
1. VALUATION CALCULATIONS
2. REFERENCE DOCUMENTS
3. GLOSSARY AND INFORMATION ABOUT APSIS
Report RJ-0089/11-01 Base Date: 12/31/2010 13
Report RJ-0089/11-01 Base Date: 12/31/2010 14
Director Project Manager
Report RJ-0089/11-01 Base Date: 12/31/2010 15
SÃO PAULO – SP RIO DE JANEIRO – RJ Av. Angélica, nº 2.503, Conj. 42 Rua da Assembleia, nº 35, 12º andar Consolação, CEP: 01227-200 Centro, CEP: 20011-001 Phone: + 55 11 3666.8448 Fax: + 55 11 3662-5722 Phone: + 55 21 2212.6850 Fax: + 55 21 2212.6851

APSIS CONSULTORIA EMPRESARIAL
Allus Argentina
APSIS CONSULTORIA EMPRESARIAL
Allus Argentina
Report RJ-0089/11-01 Base Date: 12/31/2010 16
DATA - Stratton Argentina YEAR
1 YEAR
2 YEAR
3 YEAR
4 YEAR
5 YEAR
6 YEAR
7 YEAR
8 YEAR
9 YEAR
10 (US$ million) % growth 4.0% 4.0% 4.0% 4.0% 4.0% 4.0% 4.0% 4.0% 4.0% 4.0% Service Yield 67 70 72 75 78 81 85 88 92 95 Customer Service 45.1 46.9 48.8 50.8 52.8 54.9 57.1 59.4 61.8 64.2 Sales 15.8 16.4 17.0 17.7 18.4 19.2 19.9 20.7 21.6 22.4 Recovery 0.3 0.4 0.4 0.4 0.4 0.4 0.4 0.5 0.5 0.5 Office 3.0 3.1 3.2 3.4 3.5 3.6 3.8 3.9 4.1 4.2 BPO 0.1 0.2 0.2 0.2 0.2 0.2 0.2 0.2 0.2 0.2 Other 2.5 2.7 2.8 2.9 3.0 3.1 3.2 3.4 3.5 3.6 COST OF GOODS SOLD (53.1) (55.2) (57.4) (59.7) (62.1) (64.6) (67.2) (69.9) (72.6) (75.6) Selling Costs (3.14) (3.26) (3.39) (3.53) (3.67) (3.82) (3.97) (4.13) (4.29) (4.46) Payroll and charges (0.21) (0.22) (0.23) (0.24) (0.25) (0.26) (0.27) (0.28) (0.29) (0.30) Social Contribution (0.01) (0.01) (0.01) (0.01) (0.01) (0.01) (0.01) (0.02) (0.02) (0.02) Human Resources management and training (0.07) (0.08) (0.08) (0.08) (0.09) (0.09) (0.09) (0.10) (0.10) (0.11) Freight and transport expenses (0.55) (0.57) (0.59) (0.61) (0.64) (0.66) (0.69) (0.72) (0.75) (0.78) Tax and contributions (1.35) (1.41) (1.46) (1.52) (1.58) (1.64) (1.71) (1.78) (1.85) (1.92) Marketing and advertising (0.32) (0.34) (0.35) (0.36) (0.38) (0.39) (0.41) (0.43) (0.44) (0.46) Contingency Expenses (0.62) (0.64) (0.67) (0.69) (0.72) (0.75) (0.78) (0.81) (0.84) (0.88) Management Costs (4.82) (4.21) (4.38) (4.55) (4.74) (4.93) (5.12) (5.33) (5.54) (5.76) Managements Fees (0.06) (0.07) (0.07) (0.07) (0.08) (0.08) (0.08) (0.09) (0.09) (0.09) Telephone and internet (0.09) (0.09) (0.10) (0.10) (0.11) (0.11) (0.12) (0.12) (0.12) (0.13) Payment of services (0.17) (0.18) (0.19) (0.19) (0.20) (0.21) (0.22) (0.23) (0.24) (0.25) Payroll and charges (1.87) (1.94) (2.02) (2.10) (2.19) (2.27) (2.36) (2.46) (2.56) (2.66) Social Contribution (0.50) (0.52) (0.54) (0.56) (0.58) (0.60) (0.63) (0.65) (0.68) (0.70) Human Resources management and training (0.03) (0.03) (0.03) (0.03) (0.03) (0.03) (0.03) (0.03) (0.04) (0.04) Maintenance costs (0.68) (0.15) (0.15) (0.16) (0.16) (0.17) (0.18) (0.18) (0.19) (0.20) Computer expenses (0.30) (0.06) (0.07) (0.07) (0.07) (0.08) (0.08) (0.08) (0.08) (0.09) Infrastructure expenses (0.48) (0.50) (0.52) (0.54) (0.57) (0.59) (0.61) (0.64) (0.66) (0.69) Other expenses (0.65) (0.67) (0.70) (0.73) (0.76) (0.79) (0.82) (0.85) (0.88) (0.92)
Report RJ-0089/11-01 Base Date: 12/31/2010 17
YEAR YEAR YEAR YEAR YEAR YEAR YEAR YEAR YEAR YEAR

APSIS CONSULTORIA EMPRESARIAL
Allus Argentina
APSIS CONSULTORIA EMPRESARIAL
Allus Argentina
PROPERTY, PLANT AND EQUIPMENT 1 2 3 4 5 6 7 8 9 10 (US$ million) 12/31/2009
Investments - 1.3 1.3 1.3 1.3 1.3 1.3 1.3 1.3 1.3 1.3 Accumulated Investment - 1.3 2.6 3.9 5.1 6.4 7.7 9.0 10.3 11.6 12.9 Investment depreciation - 0.1 0.3 0.4 0.5 0.6 0.8 0.9 1.0 1.2 Original cost 12.9 12.9 12.9 12.9 12.9 12.9 12.9 12.9 12.9 12.9 12.9 Residual cost 12.9 11.6 10.3 9.0 7.7 6.4 5.1 3.9 2.6 1.3 0.0
Property, plant and equipment
depreciation 1.3 1.3 1.3 1.3 1.3 1.3 1.3 1.3 1.3 1.3 TOTAL DEPRECIATION 1.3 1.4 1.5 1.7 1.8 1.9 2.1 2.2 2.3 2.4
Report RJ-0089/11-01 Base Date: 12/31/2010 18
WORKING CAPITAL - STRATTON
ARGENTINA YEAR
1 YEAR
2 YEAR
3 YEAR
4 YEAR
5 YEAR
6 YEAR
7 YEAR
8 YEAR
9 YEAR
10 (US$ million) 12/31/2009
USES 17 17 18 19 20 20 21 22 23 24 25 Customers 17 17 18 19 20 20 21 22 23 24 25 Inventories - - - - - - - - - - - ORIGINS 8 9 9 9 10 10 10 11 11 12 12 Suppliers 8 9 9 9 10 10 10 11 11 12 12 WORKING CAPITAL 8 9 9 10 10 10 11 11 12 12 13 WORKING CAPITAL VARIATION 0 0 0 0 0 0 0 0 0 0
Report RJ-0089/11-01 Base Date: 12/31/2010 19
STRATTON ARGENTINA YEAR
1 YEAR
2 YEAR
3 YEAR
4 YEAR
5 YEAR
6 YEAR
7 YEAR
8 YEAR
9 YEAR
10 (US$ million)
growth 4.0% 4.0% 4.0% 4.0% 4.0% 4.0% 4.0% 4.0% 4.0% NET OPERATING REVENUE (NOR) 66.9 69.6 72.4 75.3 78.3 81.4 84.7 88.0 91.6 95.2
COST OF GOODS SOLD ( - ) (53.1) (55.2) (57.4) (59.7) (62.1) (64.6) (67.2) (69.9) (72.6) (75.6) GROSS PROFIT (GP) (=) 13.8 14.4 15.0 15.6 16.2 16.8 17.5 18.2 18.9 19.7
gross margin (GP/NOR) 0.2 0.2 0.2 0.2 0.2 0.2 0.2 0.2 0.2 0.2 GENERAL AND ADMINISTRATIVE EXPENSES( - ) (8.0) (7.5) (7.8) (8.1) (8.4) (8.7) (9.1) (9.5) (9.8) (10.2)
EBITDA ( = ) 5.9 6.9 7.2 7.5 7.8 8.1 8.4 8.7 9.1 9.5
APSIS CONSULTORIA EMPRESARIAL
Allus Argentina
net margin (Ebitda/NOR) 0.1 0.1 0.1 0.1 0.1 0.1 0.1 0.1 0.1 0.1 DEPRECIATION( - ) (1.3) (1.4) (1.5) (1.7) (1.8) (1.9) (2.1) (2.2) (2.3) (2.4)
EBIT ( = ) 4.6 5.5 5.6 5.8 6.0 6.2 6.3 6.6 6.8 7.0 INCOME AND SOCIAL CONTRIBUTION TAXES( - ) (1.6) (1.9) (1.9) (2.0) (2.0) (2.1) (2.2) (2.2) (2.3) (2.4)
NET INCOME(=) 3.0 3.6 3.7 3.8 3.9 4.1 4.2 4.3 4.5 4.6 ACCUMULATED NET INCOME 3.0 6.7 10.4 14.2 18.1 22.2 26.4 30.7 35.2 39.8
net margin (NI/NOR) 0.0 0.1 0.1 0.1 0.1 0.0 0.0 0.0 0.0 0.0
CASH FLOW (R$ thousand) YEAR
1 YEAR
2 YEAR
3 YEAR
4 YEAR
5 YEAR
6 YEAR
7 YEAR
8 YEAR
9 YEAR
9 INFLOW 4.3 5.0 5.3 5.5 5.7 6.0 6.2 6.5 6.8 7.1
NET INCOME FOR THE YEAR 3.0 3.6 3.7 3.8 3.9 4.1 4.2 4.3 4.5 4.6 DEPRECIATION 1.3 1.4 1.5 1.7 1.8 1.9 2.1 2.2 2.3 2.4
OUTFLOW 1.3 1.3 1.3 1.3 1.3 1.3 1.3 1.3 1.3 1.3 INVESTMENT 1.3 1.3 1.3 1.3 1.3 1.3 1.3 1.3 1.3 1.3
SIMPLE BALANCE 3.0 3.8 4.0 4.2 4.5 4.7 5.0 5.2 5.5 5.8 WORKING CAPITAL VARIATION 0.3 0.4 0.4 0.4 0.4 0.4 0.4 0.4 0.5 0.5
BALANCE FOR THE PERIOD 2.7 3.4 3.6 3.8 4.1 4.3 4.5 4.8 5.0 5.3
Report RJ-0089/11-01 Base Date: 12/31/2010 20
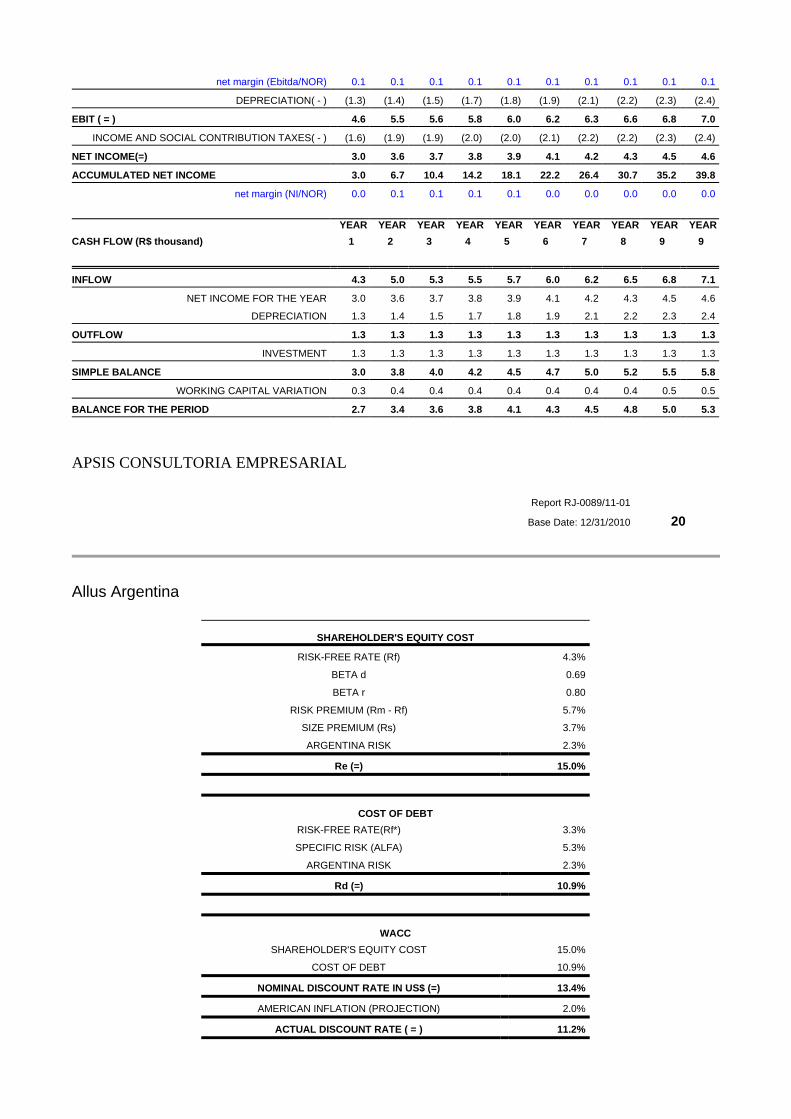
SHAREHOLDER'S EQUITY COST
RISK-FREE RATE (Rf) 4.3% BETA d 0.69 BETA r 0.80
RISK PREMIUM (Rm - Rf) 5.7% SIZE PREMIUM (Rs) 3.7% ARGENTINA RISK 2.3%
Re (=) 15.0%
COST OF DEBT
RISK-FREE RATE(Rf*) 3.3% SPECIFIC RISK (ALFA) 5.3%
ARGENTINA RISK 2.3% Rd (=) 10.9%
WACC SHAREHOLDER'S EQUITY COST 15.0%
COST OF DEBT 10.9% NOMINAL DISCOUNT RATE IN US$ (=) 13.4% AMERICAN INFLATION (PROJECTION) 2.0%
ACTUAL DISCOUNT RATE ( = ) 11.2%

APSIS CONSULTORIA EMPRESARIAL
Allus Argentina
APSIS CONSULTORIA EMPRESARIAL
Allus Colombia
Report RJ-0089/11-01 Base Date: 12/31/2010 21
discount rate 10.7% 11.2% 11.7% growth rate perpetuity 2.5% 2.5% 2.5%
ECONOMIC VALUE OF ALLUS ARGENTINA (US$ million)DISCOUNTED NET INCOME 23.0 22.5 22.0 DISCOUNTED RESIDUAL VALUE 21.0 18.9 17.1 DISCOUNTED NET INCOME 44.0 41.4 39.1
Report RJ-0089/11-01 Base Date: 12/31/2010 22
DATA - Allus Colômbia YEAR
1 YEAR
2 YEAR
3 YEAR
4 YEAR
5 YEAR
6 YEAR
7 YEAR
8 YEAR
9 YEAR
10 (US$ million) % growth 4.0% 4.0% 4.0% 4.0% 4.0% 4.0% 4.0% 4.0% 4.0% 4.0% Operating revenues 85.4 88.8 92.4 96.1 99.9 103.9 108.1 112.4 116.9 121.6 Automated services 8.9 9.3 9.7 10.1 10.5 10.9 11.3 11.8 12.2 12.7 Customer Service 49.0 51.0 53.0 55.1 57.3 59.6 62.0 64.5 67.1 69.7 Sales 6.7 6.9 7.2 7.5 7.8 8.1 8.4 8.8 9.1 9.5 Recovery 7.7 8.0 8.3 8.6 9.0 9.3 9.7 10.1 10.5 10.9 Insourcing 1.4 1.5 1.5 1.6 1.6 1.7 1.8 1.8 1.9 2.0 Office 0.6 0.6 0.6 0.6 0.6 0.7 0.7 0.7 0.8 0.8 BPO 8.6 9.0 9.4 9.7 10.1 10.5 10.9 11.4 11.8 12.3 Other 2.6 2.7 2.8 2.9 3.0 3.1 3.2 3.4 3.5 3.6 Operating Costs (52.0) (54.1) (56.3) (58.5) (60.9) (63.3) (65.8) (68.5) (71.2) (74.0) Personnel (46.9) (48.8) (50.8) (52.8) (54.9) (57.1) (59.4) (61.8) (64.2) (66.8) Rental (3.2) (3.4) (3.5) (3.6) (3.8) (3.9) (4.1) (4.2) (4.4) (4.6) Maintenance and repairs (1.9) (1.9) (2.0) (2.1) (2.2) (2.3) (2.4) (2.5) (2.6) (2.7) Administrative expenses (16.3) (16.9) (17.6) (18.3) (19.0) (19.8) (20.6) (21.4) (22.2) (23.1) Taxes (0.8) (0.8) (0.8) (0.9) (0.9) (0.9) (1.0) (1.0) (1.0) (1.1) Payroll management (5.8) (6.1) (6.3) (6.6) (6.8) (7.1) (7.4) (7.7) (8.0) (8.3) Contributions and interest (0.1) (0.1) (0.1) (0.1) (0.1) (0.1) (0.1) (0.1) (0.1) (0.1) Insurance (0.2) (0.2) (0.3) (0.3) (0.3) (0.3) (0.3) (0.3) (0.3) (0.3) Services (7.1) (7.4) (7.6) (8.0) (8.3) (8.6) (8.9) (9.3) (9.7) (10.1)

APSIS CONSULTORIA EMPRESARIAL
Allus Colombia
APSIS CONSULTORIA EMPRESARIAL
Allus Colombia
APSIS CONSULTORIA EMPRESARIAL
Legal fees (0.0) (0.0) (0.0) (0.0) (0.0) (0.0) (0.0) (0.0) (0.0) (0.0) Charges (0.9) (0.9) (0.9) (1.0) (1.0) (1.1) (1.1) (1.1) (1.2) (1.2) Accommodation and services (0.1) (0.1) (0.1) (0.1) (0.2) (0.2) (0.2) (0.2) (0.2) (0.2) Travel expenses (0.3) (0.4) (0.4) (0.4) (0.4) (0.4) (0.4) (0.5) (0.5) (0.5) Other (0.9) (1.0) (1.0) (1.1) (1.1) (1.1) (1.2) (1.2) (1.3) (1.3)
Report RJ-0089/11-01 Base Date: 12/31/2010 23
PROPERTY, PLANT AND EQUIPMENT YEAR
1 YEAR
2 YEAR
3 YEAR
4 YEAR
5 YEAR
6 YEAR
7 YEAR
8 YEAR
9 YEAR
10 (US$ million) 12/31/2009
Investments - 1.4 1.4 1.4 1.4 1.4 1.4 1.4 1.4 1.4 1.4 Accumulated Investment - 1.4 2.8 4.2 5.6 7.0 8.4 9.8 11.1 12.5 13.9 Investment depreciation - 0.1 0.3 0.4 0.6 0.7 0.8 1.0 1.1 1.3 Original cost 13.9 13.9 13.9 13.9 13.9 13.9 13.9 13.9 13.9 13.9 13.9 Residual cost 13.9 12.5 11.1 9.8 8.4 7.0 5.6 4.2 2.8 1.4 - Property, plant and equipment depreciation 1.4 1.4 1.4 1.4 1.4 1.4 1.4 1.4 1.4 1.4 TOTAL DEPRECIATION 1.4 1.5 1.7 1.8 2.0 2.1 2.2 2.4 2.5 2.6
Report RJ-0089/11-01 Base Date: 12/31/2010 24
WORKING CAPITAL -Allus Colombia YEAR
1 YEAR
2 YEAR
3 YEAR
4 YEAR
5 YEAR
6 YEAR
7 YEAR
8 YEAR
9 YEAR
10 (US$ million) 12/31/2009
USES 9.9 10.3 10.7 11.1 11.6 12.0 12.5 13.0 13.5 14.1 14.6 Customers 9.9 10.3 10.7 11.1 11.6 12.0 12.5 13.0 13.5 14.1 14.6 ORIGINS 2.3 2.4 2.5 2.6 2.7 2.8 2.9 3.0 3.1 3.3 3.4 Suppliers 2.3 2.4 2.5 2.6 2.7 2.8 2.9 3.0 3.1 3.3 3.4 WORKING CAPITAL 7.6 7.9 8.2 8.5 8.9 9.2 9.6 10.0 10.4 10.8 11.2 WORKING CAPITAL VARIATION 0.3 0.3 0.3 0.3 0.4 0.4 0.4 0.4 0.4 0.4
Report RJ-0089/11-01 Base Date: 12/31/2010 25

Allus Colombia
APSIS CONSULTORIA EMPRESARIAL
Allus Colombia
Multienlace YEAR
1 YEAR
2 YEAR
3 YEAR
4 YEAR
5 YEAR
6 YEAR
7 YEAR
8 YEAR
9 YEAR
10 (US$ million)
growth 4.0% 4.0% 4.0% 4.0% 4.0% 4.0% 4.0% 4.0% 4.0% NET OPERATING REVENUE (NOR) 85.4 88.8 92.4 96.1 99.9 103.9 108.1 112.4 116.9 121.6
COSTS ( - ) (52.0) (54.1) (56.3) (58.5) (60.9) (63.3) (65.8) (68.5) (71.2) (74.0) GROSS PROFIT (GP) (=) 33.4 34.7 36.1 37.6 39.1 40.6 42.2 43.9 45.7 47.5
gross margin (GP/NOR) 39.1% 39.1% 39.1% 39.1% 39.1% 39.1% 39.1% 39.1% 39.1% 39.1% GENERAL AND ADMINISTRATIVE EXPENSES ( - ) (16.3) (16.9) (17.6) (18.3) (19.0) (19.8) (20.6) (21.4) (22.2) (23.1)
EBITDA ( = ) 17.1 17.8 18.5 19.3 20.0 20.8 21.7 22.5 23.4 24.4 net margin (Ebitda/NOR) 20.1% 20.1% 20.1% 20.1% 20.1% 20.1% 20.1% 20.1% 20.1% 20.1%
DEPRECIATION ( - ) (1.4) (1.5) (1.7) (1.8) (2.0) (2.1) (2.2) (2.4) (2.5) (2.6) EBIT ( = ) 15.7 16.3 16.9 17.5 18.1 18.8 19.4 20.2 20.9 21.7
INCOME AND SOCIAL CONTRIBUTION TAXES( - ) (5.4) (5.5) (5.7) (5.9) (6.2) (6.4) (6.6) (6.9) (7.1) (7.4) NET INCOME(=) 10.4 10.7 11.1 11.5 11.9 12.4 12.8 13.3 13.8 14.3
net margin (NI/NOR) 12.2% 12.1% 12.0% 12.0% 12.0% 11.9% 11.9% 11.8% 11.8% 11.8%
CASH FLOW (R$ thousand) YEAR
1 YEAR
2 YEAR
3 YEAR
4 YEAR
5 YEAR
6 YEAR
7 YEAR
8 YEAR
9 YEAR
9 INFLOW 11.8 12.3 12.8 13.3 13.9 14.5 15.1 15.7 16.3 17.0
NET INCOME FOR THE YEAR 10.4 10.7 11.1 11.5 11.9 12.4 12.8 13.3 13.8 14.3 DEPRECIATION 1.4 1.5 1.7 1.8 2.0 2.1 2.2 2.4 2.5 2.6
OUTFLOW 1.4 1.4 1.4 1.4 1.4 1.4 1.4 1.4 1.4 1.4 INVESTMENT 1.4 1.4 1.4 1.4 1.4 1.4 1.4 1.4 1.4 1.4
SIMPLE BALANCE 10.4 10.9 11.4 11.9 12.5 13.1 13.7 14.3 14.9 15.6 WORKING CAPITAL VARIATION 0.3 0.3 0.3 0.3 0.4 0.4 0.4 0.4 0.4 0.4
BALANCE FOR THE PERIOD 10.1 10.6 11.1 11.6 12.1 12.7 13.3 13.9 14.5 15.2
Report RJ-0089/11-01 Base Date: 12/31/2010 26
SHAREHOLDER'S EQUITY COST
RISK-FREE RATE (Rf) 4.3% BETA d 0.69 BETA r 0.80
RISK PREMIUM (Rm - Rf) 5.7% SIZE PREMIUM (Rs) 3.7%
COLOMBIA RISK 3.4% Re (=) 16.1%

APSIS CONSULTORIA EMPRESARIAL
Allus Colombia
APSIS CONSULTORIA EMPRESARIAL
Allus Peru and Spain
COST OF DEBT RISK-FREE RATE (Rf) 3.3% SPECIFIC RISK (ALFA) 5.3%
COLOMBIA RISK 3.4% Rd (=) 12.0%
WACC SHAREHOLDER'S EQUITY COST 16.1%
COST OF DEBT 12.0% NOMINAL DISCOUNT RATE IN US$ (=) 14.4% AMERICAN INFLATION (PROJECTION) 2.0%
ACTUAL DISCOUNT RATE ( = ) 12.2%
Report RJ-0089/11-01 Base Date: 12/31/2010 27
expected rate of return 11.7% 12.2% 12.7% growth rate perpetuity 2.5% 2.5% 2.5%
ECONOMIC VALUE OF ALLUS COLÔMBIA (US$ million)DISCOUNTED NET INCOME 67.8 66.4 65.0 DISCOUNTED RESIDUAL VALUE 53.0 48.0 43.7 DISCOUNTED NET INCOME 120.8 114.4 108.7
Report RJ-0089/11-01 Base Date: 12/31/2010 28
DATA -ALLUS PERU and SPAIN YEAR
1 YEAR
2 YEAR
3 YEAR
4 YEAR
5 YEAR
6 YEAR
7 YEAR
8 YEAR
9 YEAR
10 (US$ million) % growth 108.8% 17.1% 14.4% 14.5% 10.1% 5.7% 5.7% 5.7% 5.7% Service Yield 10.4 21.7 25.4 29.0 33.2 36.6 38.7 40.9 43.2 45.7 Offshore customer service 2.6 2.9 3.4 3.9 4.4 4.9 5.1 5.4 5.7 6.1 Customer service site 2.0 9.6 11.3 12.9 14.8 16.3 17.2 18.2 19.2 20.3 Offshore sales 5.3 8.7 10.2 11.7 13.4 14.7 15.5 16.4 17.4 18.4 Local sales 0.5 0.5 0.5 0.6 0.7 0.8 0.8 0.9 0.9 1.0

APSIS CONSULTORIA EMPRESARIAL
Allus Peru and Spain
APSIS CONSULTORIA EMPRESARIAL
Allus Peru and Spain
Operating Costs (9.4) (16.4) (19.7) (22.6) (25.9) (28.6) (30.0) (31.1) (32.2) (33.9) Total labor costs (6.7) (11.9) (14.0) (16.0) (18.3) (20.1) (21.3) (22.5) (23.8) (25.1) Other operating costs (0.1) (0.3) (0.3) (0.4) (0.4) (0.5) (0.5) (0.5) (0.5) (0.6) Other Direct Variable Costs (2.3) (3.3) (3.8) (4.4) (5.0) (5.5) (5.8) (6.1) (6.5) (6.9) Maintenance expenses (0.3) (0.9) (1.6) (1.9) (2.2) (2.5) (2.4) (1.9) (1.4) (1.3) SG&A (1.9) (2.8) (2.6) (2.9) (3.1) (3.0) (3.4) (3.9) (4.1) (4.2)
Report RJ-0089/11-01 Base Date: 12/31/2010 29
PROPERTY, PLANT AND EQUIPMENT YEAR
1 YEAR
2 YEAR
3 YEAR
4 YEAR
5 YEAR
6 YEAR
7 YEAR
8 YEAR
9 YEAR
10 (US$ million) 12/31/2009
Investments - 0.2 0.2 0.2 0.2 0.2 0.2 0.2 0.2 0.2 0.2 Accumulated Investment - 0.2 0.4 0.5 0.7 0.9 1.1 1.3 1.5 1.6 1.8
Investment depreciation - 0.0 0.0 0.1 0.1 0.1 0.1 0.1 0.1 0.2 Original cost 1.8 1.8 1.8 1.8 1.8 1.8 1.8 1.8 1.8 1.8 1.8 Residual cost 1.8 1.6 1.5 1.3 1.1 0.9 0.7 0.5 0.4 0.2 -
Property, plant and equipment
depreciation 0.2 0.2 0.2 0.2 0.2 0.2 0.2 0.2 0.2 0.2 TOTAL DEPRECIATION 0.2 0.2 0.2 0.2 0.3 0.3 0.3 0.3 0.3 0.3
Report RJ-0089/11-01 Base Date: 12/31/2010 30
ALLUS PERU and SPAIN YEAR
1 YEAR
2 YEAR
3 YEAR
4 YEAR
5 YEAR
6 YEAR
7 YEAR
8 YEAR
9 YEAR
10 (US$ million)
growth 108.8% 17.1% 14.4% 14.5% 10.1% 5.7% 5.7% 5.7% 5.7% NET OPERATING REVENUE (NOR) 10.4 21.7 25.4 29.0 33.2 36.6 38.7 40.9 43.2 45.7
OPERATING COSTS ( - ) (9.4) (16.4) (19.7) (22.6) (25.9) (28.6) (30.0) (31.1) (32.2) (33.9) GROSS PROFIT (GP) (=) 1.0 5.3 5.7 6.4 7.3 8.0 8.7 9.8 11.0 11.8
gross margin (GP/NOR) 9.3% 24.4% 22.3% 22.1% 22.1% 21.9% 22.5% 24.0% 25.5% 25.9%
GENERAL AND ADMINISTRATIVE EXPENSES ( - ) (1.9) (2.8) (2.6) (2.9) (3.1) (3.0) (3.4) (3.9) (4.1) (4.2) EBITDA ( = ) (1.0) 2.4 3.0 3.5 4.2 5.0 5.3 5.9 7.0 7.6
net margin (Ebitda/NOR) -9.5% 11.3% 11.9% 12.2% 12.7% 13.6% 13.8% 14.5% 16.1% 16.6%

APSIS CONSULTORIA EMPRESARIAL
Allus Peru and Spain
DEPRECIATION & Amortization ( - ) (0.2) (0.2) (0.2) (0.2) (0.3) (0.3) (0.3) (0.3) (0.3) (0.3) EBIT ( = ) (1.2) 2.2 2.8 3.3 4.0 4.7 5.0 5.6 6.6 7.2
INCOME AND SOCIAL CONTRIBUTION TAXES ( - ) - (0.8) (1.0) (1.1) (1.3) (1.6) (1.7) (1.9) (2.3) (2.5) NET INCOME(=) (1.2) 1.5 1.8 2.2 2.6 3.1 3.3 3.7 4.4 4.8
net margin (NI/NOR) -
11.3% 6.8% 7.3% 7.5% 7.8% 8.5% 8.6% 9.1% 10.1% 10.5%
CASH FLOW (R$ thousand) YEAR
1 YEAR
2 YEAR
3 YEAR
4 YEAR
5 YEAR
6 YEAR
7 YEAR
8 YEAR
9 YEAR
9 INFLOW (1.0) 1.7 2.1 2.4 2.9 3.4 3.6 4.0 4.7 5.1
NET INCOME FOR THE YEAR (1.2) 1.5 1.8 2.2 2.6 3.1 3.3 3.7 4.4 4.8 DEPRECIATION 0.2 0.2 0.2 0.2 0.3 0.3 0.3 0.3 0.3 0.3
OUTFLOW 0.2 0.2 0.2 0.2 0.2 0.2 0.2 0.2 0.2 0.2 INVESTMENT 0.2 0.2 0.2 0.2 0.2 0.2 0.2 0.2 0.2 0.2
SIMPLE BALANCE (1.2) 1.5 1.9 2.2 2.7 3.2 3.4 3.8 4.5 4.9 WORKING CAPITAL VARIATION 0.2 0.1 0.1 0.1 0.1 0.0 0.0 0.0 0.0 0.0
BALANCE FOR THE PERIOD (1.4) 1.4 1.8 2.2 2.6 3.2 3.4 3.8 4.5 4.9
Report RJ-0089/11-01 Base Date: 12/31/2010 31
SHAREHOLDER'S EQUITY COST
RISK-FREE RATE (Rf) 4.3% BETA d 0.69 BETA r 0.80
RISK PREMIUM (Rm - Rf) 5.7% SIZE PREMIUM (Rs) 3.7%
PERU RISK 2.5% Re (=) 15.2%
COST OF DEBT
RISK-FREE RATE (Rf) 3.3% SPECIFIC RISK (ALFA) 5.3%
PERU RISK 2.5% Rd (=) 11.1%
WACC SHAREHOLDER'S EQUITY COST 15.2%
COST OF DEBT 11.1% NOMINAL DISCOUNT RATE IN US$ (=) 13.6% AMERICAN INFLATION (PROJECTION) 2.0%
ACTUAL DISCOUNT RATE ( = ) 11.4%

APSIS CONSULTORIA EMPRESARIAL
Allus Peru and Spain
APSIS CONSULTORIA EMPRESARIAL
Report RJ-0089/11-01 Base Date: 12/31/2010 32
expected rate of return 10.9% 11.4% 11.9% growth rate perpetuity 2.0% 2.0% 2.0%
ECONOMIC VALUE OF ALLUS PERU AND SPAIN (US$ million)DISCOUNTED NET INCOME 12.9 12.5 12.1 DISCOUNTED RESIDUAL VALUE 19.6 17.8 16.1 DISCOUNTED NET INCOME 32.5 30.2 28.2
Report RJ-0089/11-01 Base Date: 12/31/2010 33

SIGNATURE Pursuant to the requirements of the Securities Exchange Act of 1934, the registrant has duly caused this report to be signed on its behalf by the undersigned, thereunto duly authorized. Date: April 15, 2011
FORWARD-LOOKING STATEMENTS
This press release may contain forward-looking statements. These statements are statements that are not historical facts, and are based on management's current view and estimates of future economic circumstances, industry conditions, company performance and financial results. The words "anticipates", "believes", "estimates", "expects", "plans" and similar expressions, as they relate to the company, are intended to identify forward-looking statements. Statements regarding the declaration or payment of dividends, the implementation of principal operating and financing strategies and capital expenditure plans, the direction of future operations and the factors or trends affecting financial condition, liquidity or results of operations are examples of forward-looking statements. Such statements reflect the current views of management and are subject to a number of risks and uncertainties. There is no guarantee that the expected events, trends or results will actually occur. The statements are based on many assumptions and factors, including general economic and market conditions, industry conditions, and operating factors. Any changes in such assumptions or factors could cause actual results to differ materially from current expectations.
CONTAX PARTICIPAÇÕES S.A.
By: /S/ Michel Neves Sarkis
Name: Michel Neves Sarkis Title: Investor Relations Officer


![· 2009. 5. 8. · CONTAX Contax 137 Contax 139 MARTINI' PORSCHE CONTAX diametro eccezionaimente ampia una pit] elevata qualitá di rioroduzione dell"mmagine. questa montatura garantisce](https://static.fdocuments.net/doc/165x107/6116776cae21fb5d0c391aa3/2009-5-8-contax-contax-137-contax-139-martini-porsche-contax-diametro-eccezionaimente.jpg)