Contagion and the global equity market collapse of the ... and the global equity market collapse of...
44
Contagion and the global equity market collapse of the 2007-09 financial crisis Michael Ehrmann, Marcel Fratzscher and Arnaud Mehl European Central Bank VII VII th th Workshop on Emerging Markets Workshop on Emerging Markets Madrid, 21 Madrid, 21 - - 22 September 2009 22 September 2009 Views are those of the authors, and not necessarily those of the Views are those of the authors, and not necessarily those of the ECB. ECB.
Transcript of Contagion and the global equity market collapse of the ... and the global equity market collapse of...
Contagion and the global equity market collapse of the 2007-09 financial crisis
Michael Ehrmann, Marcel Fratzscher and Arnaud MehlEuropean Central Bank
VIIVIIthth Workshop on Emerging MarketsWorkshop on Emerging MarketsMadrid, 21Madrid, 21--22 September 200922 September 2009
Views are those of the authors, and not necessarily those of theViews are those of the authors, and not necessarily those of the ECB.ECB.

Severity of the 2007-09 financial crisis …
-80
-60
-40
-20
020
% c
umul
ated
retu
rns
1995w1 2000w1 2005w1 2010w1.
World USA

1. Motivation
• What explains transmission and discrimination?– Even markets with little financial leverage affected– Was the spread of the crisis “predictable” or different?
• Three hypotheses1. Financial integration (with US markets)
– transmission reflecting “usual” mechanism “predictable”
2. Idiosyncratic risk: macro factors vs. micro factors– macro policies & fundamentals vs. risk at firm level (leverage,
financial constraints, etc.)
3. Contagion – “transmission above and beyond existing fundamentals” in 1. and 2.– E.g. herd behaviour, “wake-up call” hypothesis, etc.

Motivation
• Mechanisms and implications1. “retrenchment” or “repatriation” hypothesis
– role of financial globalisation, integration, other exposure– But is retrenchment indiscriminate?
2. “global de-leveraging” hypothesis– macro risk at country level, e.g. policies & fundamentals– calls for macroprudential analysis and surveillance, also globally
3. “liquidity squeeze” hypothesis: micro risk– specific liquidity needs and exposure at firm level– stresses role for microprudential regulation and supervision
• Scope and limitations– Focus on global equity markets– Says nothing about source or severity, but transmission

Methodological contribution
• Controversy in literature on contagion (e.g. Forbes & Rigobon 2002, Dungey et al. 2004, 2005, &
others): common shocks vs. idiosyncratic shocks
• Two-factor asset-pricing model– Establish benchmark & contagion of what equity market
comovements should be based on existing fundamentals– But can say nothing about causality of linkages
• Unanticipated shock model– Identification of well-identified macro shocks (US and
foreign markets)– Key strength: allows identifying causality– Determinants of contagion; channels of transmission

Main findings
1. No contagion from US markets, on average2. But significant contagion from domestic markets3. Lots of heterogeneity across portfolios4. Channels that explain global equity exposure to crisis:
– External exposure only played limited role: mainly via financialintegration with US (US beta) crisis transmission to that extent “predictable”
– Macro/country risk key explanations: portfolios in countries with strong fundamentals declined by one third less
– Financial policies – esp. debt and deposit guarantees – played major role in shielding economies
Macro policies & vulnerabilities at country level had key role

2. Literature
• Current financial crisis– Focus on US policy responses (Calomiris 2008, Taylor 2009)– Role of liquidity (Heider, Hoerova and Holthausen 2009)– Financial constraints rather than demand in US (Tong & Wei
2008)– Little on global transmission: IMF (2009) on financial stress
transmission, Fratzscher (2009) on global FX markets
• Crisis and role of contagion for transmission– Contagion and related channels (Bae et al. 2003, Karolyi 2003, De
Gregorio and Valdes, 2001, Dungey et al. 2004, 2005)– Transmission channels (Forbes and Rigobon 2002, Bekaert, et al.
2005)– Time-varying global market integration (Bekaert & Harvey 1995,
2000)

Literature
• International transmission of specific events/shocks– Financial linkages and trade account for part of cross-country equity
returns (Forbes and Chinn 2004)– Transmission of specific monetary policy or macro news shocks to
global equity and FX markets (Hausman and Wongswan 2006, Wongswan 2006, Ehrmann and Fratzscher 2006, Ammer, Vega and Wongswan 2009)

3. Data: 64 countries, 2000 firms, 455 portfolios
Australia S&P ASX 30 China Shanghai SE 50 50 Bahrain BHSE 24Austria ATX 20 Hong Kong Hang Seng 42 Botswana Gaborone 16Belgium BEL20 20 India BSE Sensex 30 30 Egypt CASE 30Canada S&P TSE 60 60 Indonesia Jakarta LQ-45 45 Israel Tel Aviv-25 25Denmark OMX20 20 Korea Kospi 50 50 Lebanon BLOM 19Finland OMX25 25 New Zealand NZX 15 15 Oman MSM30 30France CAC 40 40 Pakistan Karachi 30 Index 30 Qatar DSM20 20Germany DAX 30 Singapore Strait Times 30 Tunisia SE BVMT 32Ireland ISEQ 60 Taiwan TSEC Taiwan 50 50 UAE DFM 29Italy MIB 30 30 Thailand SET 50 50Japan Topix 70 70Luxembourg LuxX 9Netherlands AEX 25 Argentina Merval 22Portugal PSI 20 20 Bosnia BIRS 13 Bermuda BSX 21Slovenia SBI20 15 Bulgaria SOFIX 20 Brazil Bovespa 66Spain IBEX 35 35 Croatia CROBEX 28 Chile IPSA 40Sweden OMX 30 30 Czech Republic PSE 14 Colombia IGBC General 28Switzerland SMI 30 20 Estonia OMX 18 Costa Rica BCT 6UK Footsie 100 100 Hungary BSE 14 Jamaica JSE 39
Iceland OMX ICEX 11 Mexico Bolsa 36Latvia OMX 35 Venezuela IBC 17Lithuania OMX 32Malta MSE 17Norway OBX 24Poland WIG 20 20Romania BET 10Russia MICEX 30Serbia Belex 15 15Turkey ISE National 30 30Ukraine PFTS 19
Middle-East and Africa
Latin AmericaEmerging Europe
Industrialised Asia-Pacific
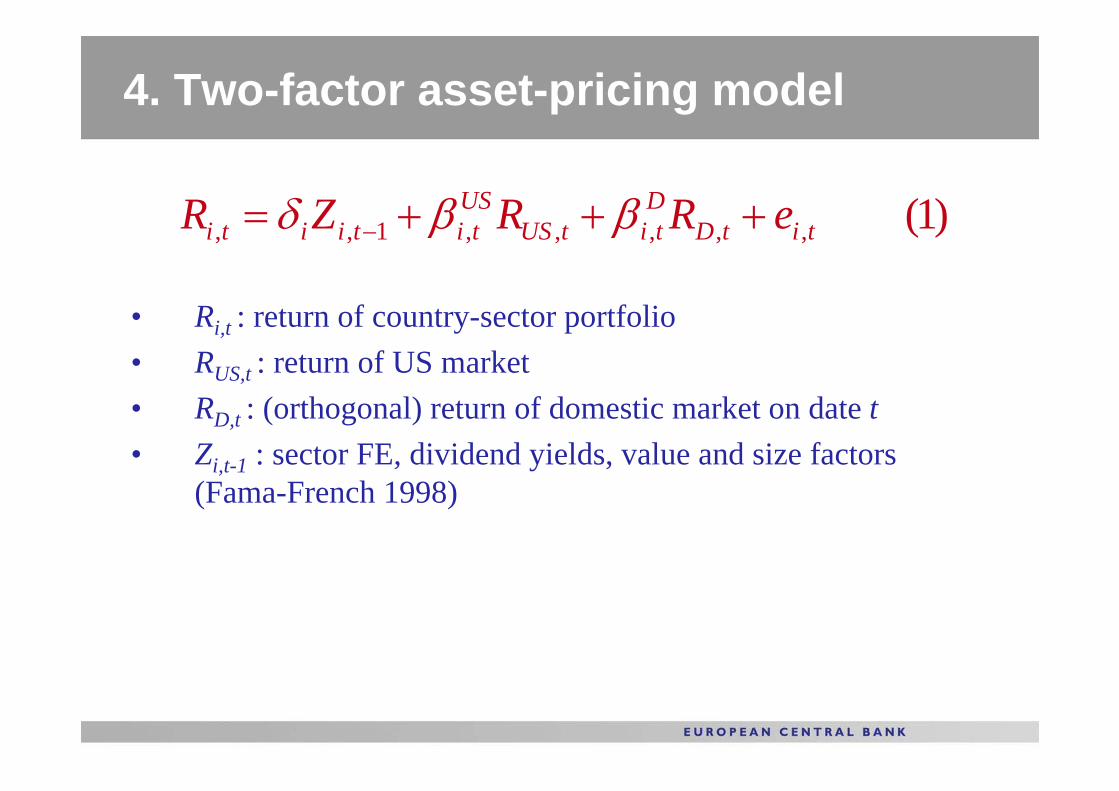
4. Two-factor asset-pricing model
• Ri,t : return of country-sector portfolio• RUS,t : return of US market• RD,t : (orthogonal) return of domestic market on date t• Zi,t-1 : sector FE, dividend yields, value and size factors
(Fama-French 1998)
)1(,,,,,1,, titDDtitUS
UStitiiti eRRZR +++= − ββδ

Time-varying factor loadings
• Key feature: time-varying factor loadings1. Time-varying factor model
• sequential 6-month windows, weekly data fequency• Info about what comovement exists “actual” betas/factor loadings
2. Conditional factor model• Conditioning on exposure variables Xi,t-k
• Info about what comovement ought to be based on fundamentals “expected” betas/factor loadings
• See Bekaert, Harvey & Ng (2005), Bekaert, Hodrick & Zhang (2009)
Wti
Di
Dti
Di
Di
Dti
Wti
USi
USti
USi
USi
USti
XpXpp
XpXpp
1,2,1,1,0,,
1,2,1,1,0,,
−−
−−
++=
++=
β
β
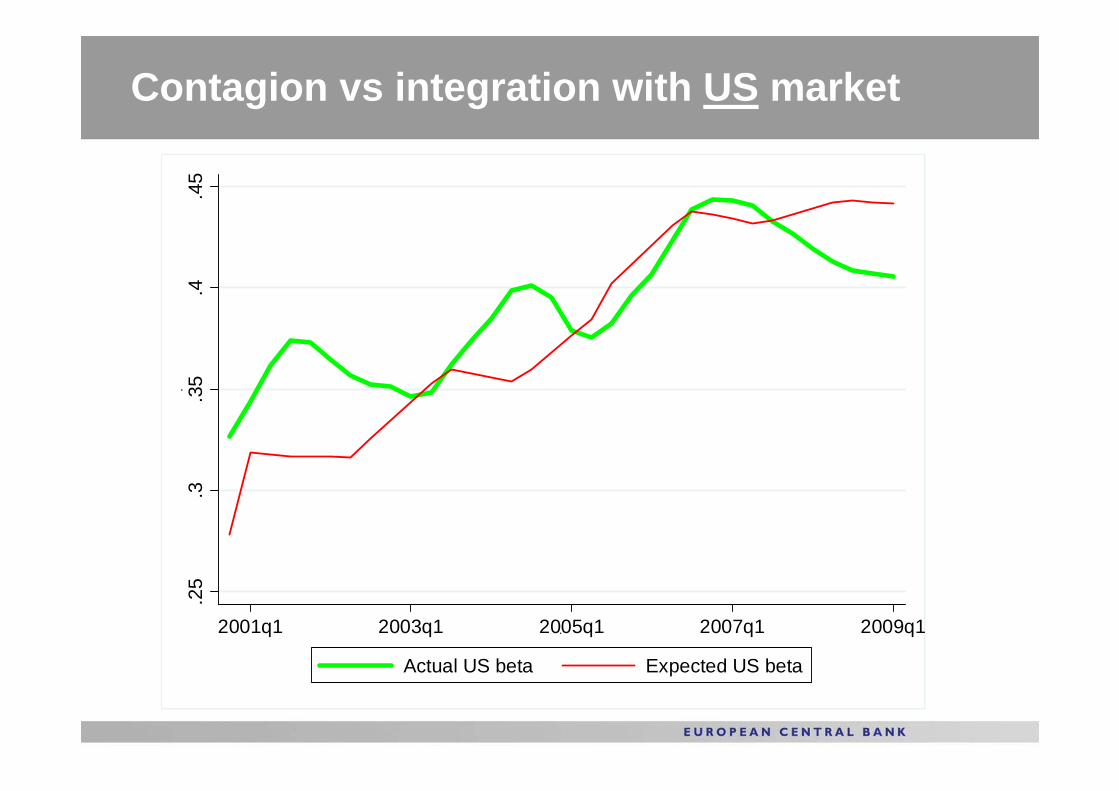
Contagion vs integration with US market
.25
.3.3
5.4
.45
.
2001q1 2003q1 2005q1 2007q1 2009q1.
Actual US beta Expected US beta

Contagion vs integration with domesticmarket
.25
.3.3
5.4
.45
.
2001q1 2003q1 2005q1 2007q1 2009q1.
Actual domestic beta Expected domestic beta

Definition of contagion
• Contagion: unexplained component of comovement = difference between actual and expected factor loadings
• It an indicator for 2007-09 financial crisis Contagion test:
• Key strengths of approach:– No arbitrary benchmark for measuring contagion– Allows distinction between integration and contagion– Takes into account natural evolution of integration– Distinction US contagion vs domestic contagion
0;0:0 == Di
USiH γγ
tititDtDi
DCtitUSt
USi
USCtitiiti eIRIRIZR ,,,,,1,, )()( ++++++= − ϕγβγβδ
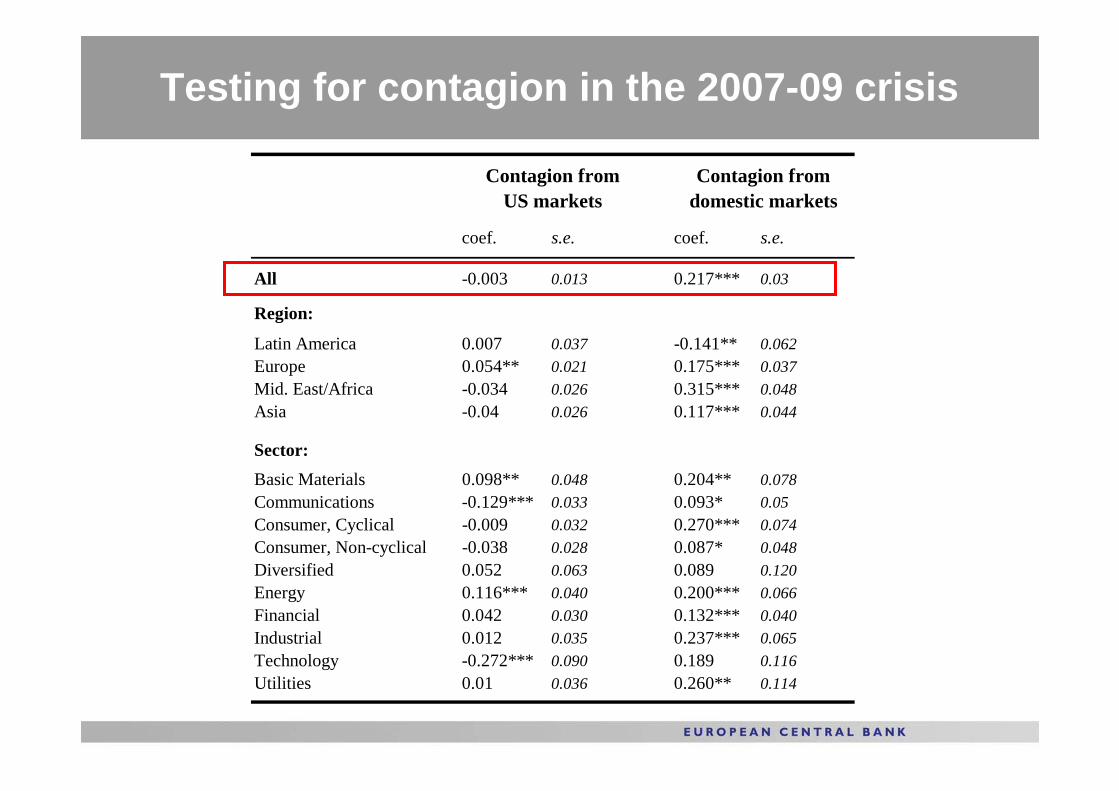
Testing for contagion in the 2007-09 crisis
coef. s.e. coef. s.e.
All -0.003 0.013 0.217*** 0.03
Region:
Latin America 0.007 0.037 -0.141** 0.062Europe 0.054** 0.021 0.175*** 0.037Mid. East/Africa -0.034 0.026 0.315*** 0.048Asia -0.04 0.026 0.117*** 0.044
Sector:
Basic Materials 0.098** 0.048 0.204** 0.078Communications -0.129*** 0.033 0.093* 0.05Consumer, Cyclical -0.009 0.032 0.270*** 0.074Consumer, Non-cyclical -0.038 0.028 0.087* 0.048Diversified 0.052 0.063 0.089 0.120Energy 0.116*** 0.040 0.200*** 0.066Financial 0.042 0.030 0.132*** 0.040Industrial 0.012 0.035 0.237*** 0.065Technology -0.272*** 0.090 0.189 0.116Utilities 0.01 0.036 0.260** 0.114
Contagion from Contagion fromUS markets domestic markets

Contagion from US market (factor model)
010
2030
4050
Freq
uenc
y
-2 -1 0 1 2

Contagion from domestic market (factor model)
010
2030
4050
Freq
uenc
y
-2 -1 0 1 2

Methodological issue
• Controversy in literature on contagion (e.g. Forbes & Rigobon 2002, Dungey et al. 2004, 2005, & others): common shocks vs. idiosyncratic shocks
• Two-factor asset-pricing model– Establish benchmark & contagion of what equity market
comovements should be based on existing fundamentals– But can say nothing about causality of linkages
• Unanticipated shock model– Identification of well-identified macro shocks (US and
foreign markets)– Key strength: allows identifying causality
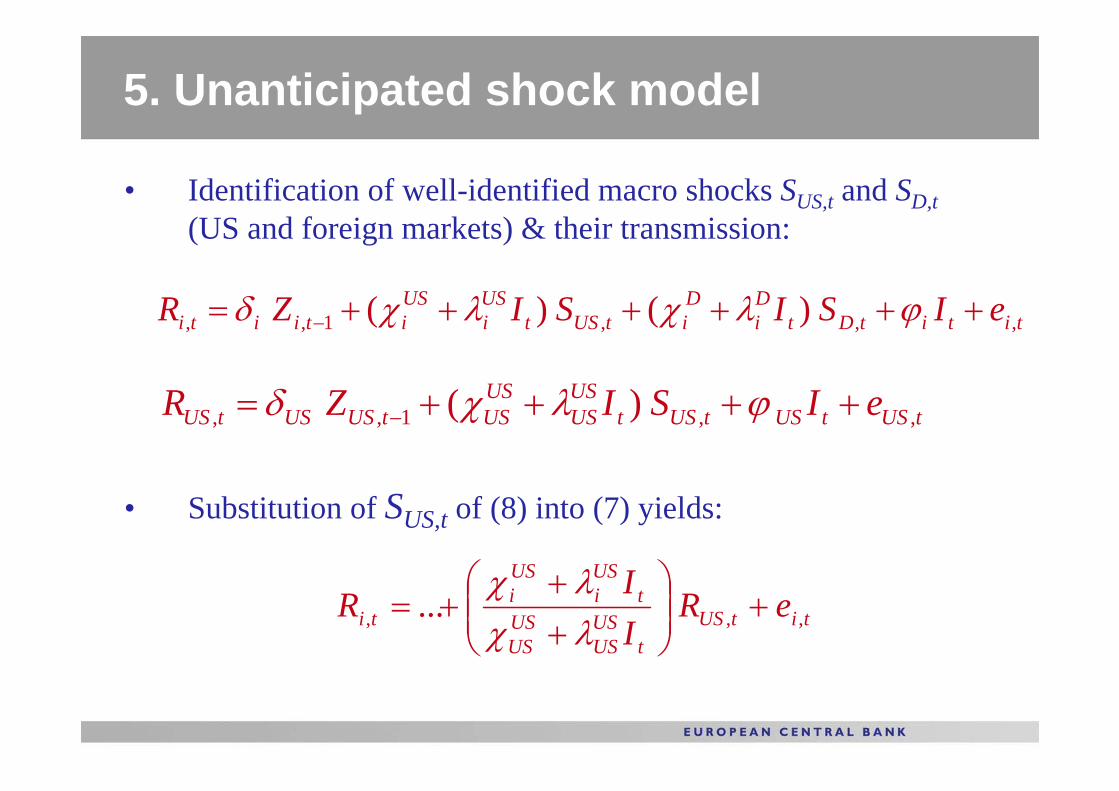
5. Unanticipated shock model
• Substitution of SUS,t of (8) into (7) yields:
• Identification of well-identified macro shocks SUS,t and SD,t(US and foreign markets) & their transmission:
tititDtDi
DitUSt
USi
USitiiti eISISIZR ,,,1,, )()( ++++++= − ϕλχλχδ
tUStUStUStUSUS
USUStUSUStUS eISIZR ,,1,, )( ++++= − ϕλχδ
titUSt
USUS
USUS
tUSi
USi
ti eRII
R ,,, ... +⎟⎟⎠
⎞⎜⎜⎝
⎛++
+=λχλχ

Definition of contagion
• US contagion: increase in transmission of shock to foreign market more strongly than increase for US market
• Analogously for domestic contagion:
0:0 =⎟⎟⎠
⎞⎜⎜⎝
⎛−⎟⎟
⎠
⎞⎜⎜⎝
⎛++
USUS
USi
USUS
USUS
USi
USiH
χχ
λχλχ
0:0 =⎟⎟⎠
⎞⎜⎜⎝
⎛−⎟⎟
⎠
⎞⎜⎜⎝
⎛++
DD
Di
DD
DD
Di
DiH
χχ
λχλχ

US and foreign macroeconomic news shocks
Variable Definition / Unit Obs. Mean std. dev.
US macro news:GDP Quarterly YoY % change 56 0.071 0.407Consumer confidence index (around 100) 174 0.009 0.193Housing starts Monthly, in 1000 169 0.037 0.269Industrial production MoM % change 150 -0.031 0.765NAPM / ISM index (around 50) 172 -0.018 0.382NF payroll employment MoM change (100,000) 175 -0.001 0.007Retail sales in % 152 -0.024 0.842Trade balance in USD billion 175 0.001 0.138Unemployment in % 111 -0.018 0.115
Domestic macro news:Trade balance in USD billion 2021 0.007 1.429GDP Quarterly YoY % change 983 0.015 0.392Industrial production MoM % change 2129 -0.029 0.416Unemployment in % 1675 -0.009 0.112
Surprise / shock

Increase in transmission in the 2007-09 crisis
coef. s.e. coef. s.e. signific. coef. s.e. coef. s.e. signific.
US macro news:GDP 0.223*** 0.048 2.209*** 0.405 0.00 0.071 0.124 0.703* 0.362 0.09Consumer confidence 0.275*** 0.079 1.891*** 0.314 0.00 0.384** 0.158 2.960*** 0.932 0.01Housing starts -0.031 0.04 1.237*** 0.269 0.00 -0.210** 0.101 1.464 1.034 0.11Industrial production 0.010 0.018 0.418*** 0.051 0.00 0.182*** 0.042 -0.446*** 0.137 0.00NAPM / ISM 0.060** 0.028 0.496*** 0.177 0.01 -0.031 0.086 2.388*** 0.426 0.00NF payroll employment 0.090*** 0.02 0.805*** 0.14 0.00 -0.013 0.054 1.195*** 0.329 0.00Retail sales 0.023 0.015 1.036*** 0.098 0.00 -0.024 0.028 2.003*** 0.22 0.00Trade balance 0.251** 0.097 0.406* 0.206 0.56 1.148*** 0.245 2.437** 1.038 0.23Unemployment -0.056 0.087 1.171*** 0.371 0.00 -0.301 0.363 4.046*** 1.186 0.00
Domestic macro news:Trade balance 0.017*** 0.003 1.430*** 0.475 0.00GDP 0.212 0.159 -0.12 0.644 0.61Industrial production 0.054 0.091 -0.141 0.324 0.54Unemployment 0.151 0.226 1.413** 0.702 0.09
ObservationsR-squared
Non-US returns US market returns
during crisisbefore crisisduring crisisbefore crisis
141505512800.120.02

Contagion in the 2007-09 crisis
mean s.e. mean s.e. mean s.e. mean s.e.
All -0.061 0.049 -0.235 *** 0.048 0.084 * 0.048 0.137 *** 0.047
Region:
Latin America -0.081 0.136 -0.029 0.116 -0.035 0.040 0.100 *** 0.000Europe 0.040 0.062 -0.306 *** 0.068 -0.003 0.032 0.186 ** 0.094Mid. East/Africa 0.272 *** 0.076 0.095 0.128 0.654 * 0.374 0.100 0.089Asia -0.460 *** 0.126 -0.319 *** 0.110 0.057 ** 0.025 0.071 *** 0.017
Sector:
Basic Materials 0.035 0.119 -0.034 0.150 -0.160 0.155 0.123 0.099Communications -0.254 ** 0.109 -0.335 ** 0.131 0.040 0.121 0.132 *** 0.031Consumer, Cyclical 0.005 0.157 -0.370 ** 0.171 0.349 0.302 0.248 ** 0.117Consumer, Non-cyclica -0.117 0.132 -0.179 0.145 0.153 0.107 -0.135 0.325Diversified -0.312 0.331 -0.424 * 0.213 0.016 0.061 0.086 *** 0.017Energy 0.260 0.176 -0.302 ** 0.133 0.151 0.147 0.174 *** 0.059Financial 0.058 0.131 -0.162 0.110 0.081 0.068 0.136 0.117Industrial -0.131 0.163 -0.083 0.152 0.073 ** 0.036 0.201 ** 0.075Technology -0.407 ** 0.194 -0.755 ** 0.268 0.060 0.085 0.195 0.153Utilities -0.010 0.113 -0.081 0.122 0.004 0.089 0.241 ** 0.110
Contagion fromdomestic markets
Contagion fromUS markets
Trade balanceGDPGDP Trade balance

Contagion from US market (shock model)
010
2030
4050
Freq
uenc
y
-2 -1 0 1 2
GDP
010
2030
4050
Freq
uenc
y
-2 -1 0 1 2
Industrial production0
1020
3040
50Fr
eque
ncy
-2 -1 0 1 2
Trade balance
020
4060
80Fr
eque
ncy
-2 -1 0 1 2
Unemployment

Contagion from domestic market (shock model)
020
4060
80Fr
eque
ncy
-1 -.5 0 .5 1
GDP
020
4060
Freq
uenc
y
-2 -1 0 1 2
Industrial production
010
2030
40Fr
eque
ncy
-1 0 1 2
Trade balance
010
2030
40Fr
eque
ncy
-2 -1 0 1 2
Unemployment

Confirmation from shock model
• The crisis is different! 3- to 4-fold increase in the strengths of the shock transmission
• Yet also US returns have become more sensitive to a given shock during crisis
explains why US beta from asset-pricing model has been rather stable, yet return dispersion has increased
• Role of idiosyncratic, country-specific shocks key

6. Explaining contagion
• with γi = γiUS for the test for US contagion and
γi = γiD for domestic contagion
• Z: portfolio i country risk and sector-level risk (incl. value and size factors as Fama-French controls)
• βUS: portfolio i US betaCross-section: 455 country-sector portfolios
iD
iDUS
iUS
ii eZ +++= βκβκδγ ˆˆ

A. External exposureUS beta -0.223** -0.182 -0.116 -0.126 -0.063 -0.086Domestic beta 0.042 0.013 -0.009 0.126 0.204*** 0.215***Trade integration w. US -0.002 -0.013***Financial integration w. US 0.010 0.000Trade openness -0.002* 0.002***Financial openness 0.010 0.000Exchange rate exposure -0.002 0.000Interest rate exposure 0.012 -0.011
B. Country riskPolitical country risk -0.098*** -0.087*** -0.009** -0.008*Financial country risk 0.007 0.006Sovereign rating -1.986*** -0.328* -0.260** -0.433***
C. Financial policiesDebt guarantees -0.167 -0.097 -0.431*** -0.427***Deposit guarantees -0.510*** -0.484*** 0.401*** 0.425***Capital injections -1.330*** -0.912** 0.148 0.188
D. Macroeconomic fundamentalsFX reserves -0.009*** -0.009*** 0.001 0.001Current account position -0.010* -0.011* -0.006 -0.009*Government budget -0.011 -0.014 -0.014* -0.009
E. Financial constraintsFinancial constraint 0.001 -0.001Value factor -0.003** -0.001Size factor 0.015 0.006
Domestic contagionUS contagion
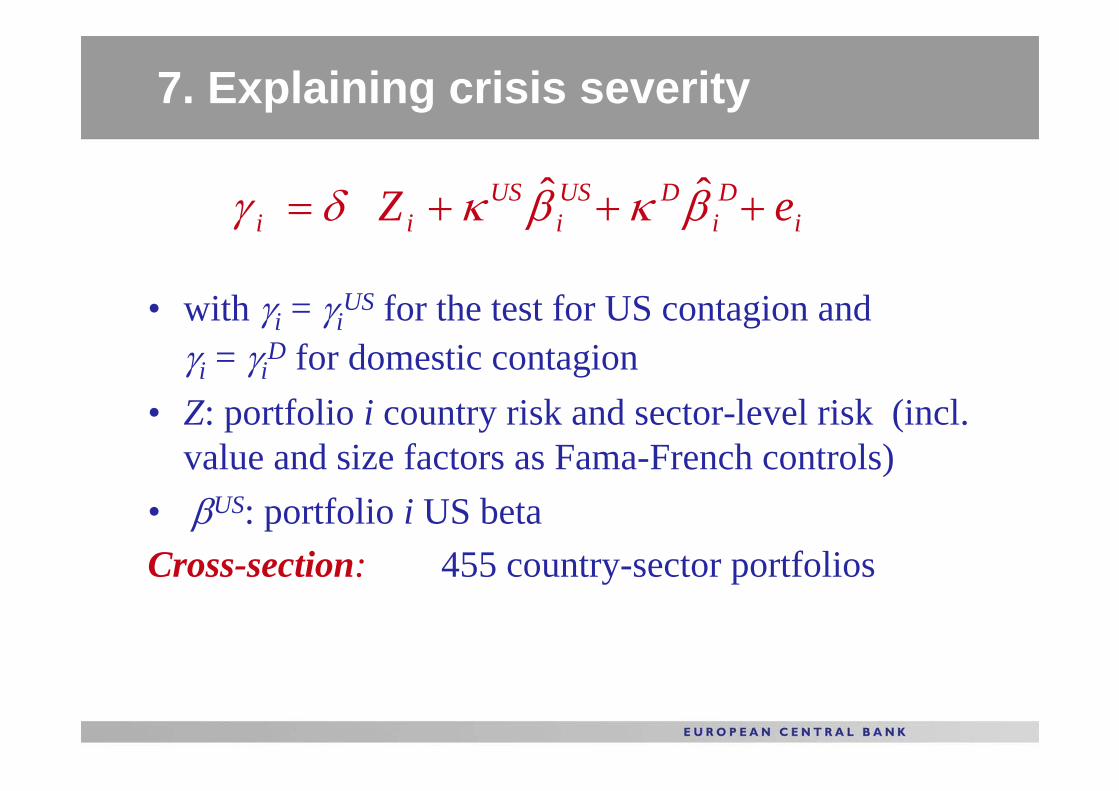
7. Explaining crisis severity
• with γi = γiUS for the test for US contagion and
γi = γiD for domestic contagion
• Z: portfolio i country risk and sector-level risk (incl. value and size factors as Fama-French controls)
• βUS: portfolio i US betaCross-section: 455 country-sector portfolios
iD
iDUS
iUS
ii eZ +++= βκβκδγ ˆˆ

Role of financial policies
• What has made the crisis different – why is country risk priced and micro risk less so?
• Significant extensions & introductions of financial policies (Pi)
– Debt guarantees– Deposit guarantees– Capital injections
• Not all countries implemented such policies, and important differences across countries

Role of country risk and macro fundamentals
Variable: Composite political
country risk
Composite financial
country risk
Sovereign rating
FX reserves Current account position
Unemploy- ment rate
Government budget
A. During the crisis: 7 August 2007 – 15 March 2009
Variable: 0.371 1.205* 1.043** 0.820** 0.603** -1.038** 0.523
US beta -0.304*** -0.246*** -0.327*** -0.269*** -0.246*** -0.270*** -0.255***Domestic beta -0.139** -0.147** -0.135** -0.170*** -0.149** -0.152*** -0.134**
Interdecile difference 10.56 13.86 12.52 7.55 8.85 -14.68 4.42
R-squared 0.21 0.22 0.22 0.21 0.22 0.21 0.19
B. Before the crisis: 1 January 2005 -- 6 August 2007
Variable: -1.118*** -0.217 -2.129** -1.324* -0.668 1.807*** -1.009US beta 0.389*** 0.278** 0.385*** 0.299** 0.274** 0.295** 0.267**Domestic beta 0.038 0.079 0.048 0.104 0.060 0.065 0.038
Interdecile difference -31.86 -2.49 -25.55 -12.18 -9.81 25.55 -8.51R-squared 0.14 0.11 0.13 0.12 0.11 0.13 0.10
C. Whole sample period: 1 January 1995 -- 6 August 2007
Variable: 0.503 0.226 2.267* -0.796 -0.808 0.235 2.122US beta 0.733*** 0.812*** 0.639*** 0.836*** 0.801*** 0.807*** 0.790***Domestic beta 0.249 0.220 0.276 0.231 0.220 0.219 0.266Interdecile difference 14.35 2.60 27.21 -7.33 -11.87 3.32 17.90R-squared 0.10 0.10 0.10 0.10 0.10 0.10 0.10
D. Macroeconomic fundamentalsB. Country risk

Role of micro risk and financial policies
E. Fin. constraints
Variable: Debt guarantees
Deposit guarantees
Capital injections
Financial constraint
Value factor
A. During the crisis: 7 August 2007 – 15 March 2009
Variable: 10.233** 9.737** 2.772 10.572 -0.076
US beta -0.349*** -0.360*** -0.360*** -0.248** -0.258***Domestic beta -0.142** -0.146** -0.151** -0.153** -0.149**
Interdecile difference 16.92 8.26 3.15 2.38 -0.36
R-squared 0.22 0.22 0.22 0.23 0.19
B. Before the crisis: 1 January 2005 -- 6 August 2007
Variable: -- -- -- 0.612 -0.056US beta 0.393*** 0.269**Domestic beta 0.052 0.046
Interdecile difference 0.14 -0.27R-squared 0.18 0.10
C. Whole sample period: 1 January 1995 -- 6 August 2007
Variable: -- -- -- 2.322** -0.242US beta 0.531* 0.785***Domestic beta 0.396 0.203Interdecile difference 0.52 -1.15R-squared 0.12 0.10
C. Financial policies

Role of country-level macro fundamentals for crisis severity
-50
-40
-30
-20
-10
0%
cum
ulat
ed re
turn
s
2005w1 2006w1 2007w1 2008w1 2009w1.
strong CA position weak strong CA position
Current account
-50
-40
-30
-20
-10
0%
cum
ulat
ed re
turn
s
2005w1 2006w1 2007w1 2008w1 2009w1.
high FX reserves low FX reserves
FX reserves-5
0-4
0-3
0-2
0-1
00
% c
umul
ated
retu
rns
2005w1 2006w1 2007w1 2008w1 2009w1.
strong rating weak rating
Sovereign rating
-50
-40
-30
-20
-10
0%
cum
ulat
ed re
turn
s
2005w1 2006w1 2007w1 2008w1 2009w1.
high market cap low market cap
Equity market capitalisation
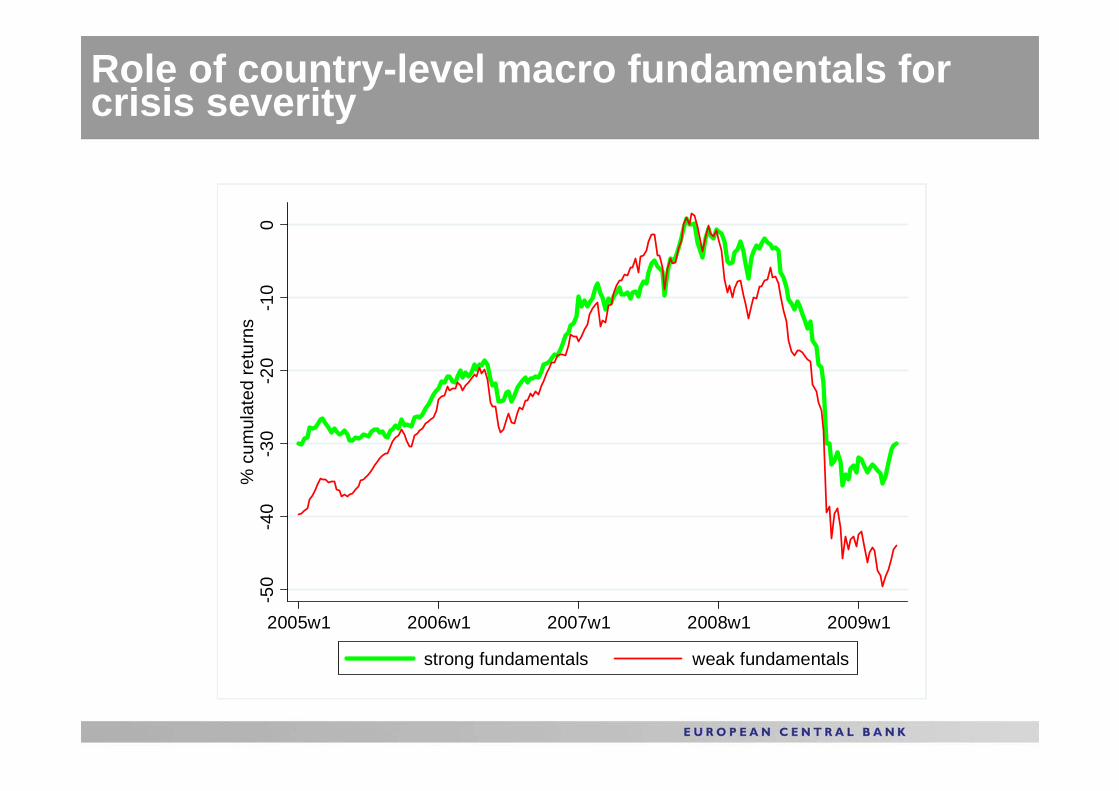
Role of country-level macro fundamentals for crisis severity
-50
-40
-30
-20
-10
0%
cum
ulat
ed re
turn
s
2005w1 2006w1 2007w1 2008w1 2009w1.
strong fundamentals weak fundamentals

8. Summing up
1. No contagion from US markets, on average2. But significant contagion from domestic markets3. Lots of heterogeneity across portfolios4. Channels that explain global equity exposure to crisis:
– External exposure only played limited role: mainly via financialintegration with US (US beta) crisis transmission to that extent “predictable”
– Macro/country risk key explanations: portfolios in countries with strong fundamentals declined by one third less
– Financial policies – esp. debt and deposit guarantees – played major role in shielding economies
Macro policies & vulnerabilities at country level had key role
Implications for policy
• Focus on reform of international financial architecture
• Emphasis on microprudential reforms: regulation and supervision of institutions and markets
• But: findings suggest that macroprudential risks dwarfed micro / firm-level risks during crisis – at least when analysing global transmission of crisis
• Role of macroprudential analysis & risk at country level

APPENDIX

Portfolio equity returns and their dispersion
510
1520
25.
-20
-10
010
.
1995q1 2000q1 2005q1 2010q1.
Average return (lhs) Portfolio dispersion (rhs)

Summary stats: macro & micro determinants
Variables Definition mean std. dev. min. max.
Macroeconomic fundamentals:Composite country risk ICRG composite country index 76.48 7.73 54.30 91.80Composite economic country risk ICRG country economic risk index 38.89 4.39 28 49Composite financial country risk ICRG country financial risk index 38.92 4.79 28 50FX reserves Ratio of FX reserves to GDP 18.35 4.69 4.80 100.70Sovereign rating Rating of country's sovereign debt 16.29 4.75 6 22Current account position Ratio of current account to GDP 0.68 7.59 -17.11 27.98Government budget Ratio of fiscal balance to GDP -0.18 4.24 -7.80 19.61Interest rate 3-month money market, in % 0.82 3.60 -13.03 13.39Inflation rate CPI inflation rate, in % 4.30 3.47 -1.20 17.12Unemployment rate in % 7.81 6.18 2.10 38.71
External exposure:Trade openness Ratio of exports plus imports to GDP 108.39 76.43 28.17 455.40Financial openness Ratio of portfolio assets & liab. to GDP -1.19 9.87 4.42 64.41Equity market capitalisation Ratio of equity market cap. To GDP 71.86 90.59 4.60 593.90Exchange rate exposure exposure coefficient, see section 2 -0.71 7.08 -17.93 27.50
Firm-specific characteristics:Exchange rate exposure exposure coefficient, see section 2 -8.42 93.56 -690.75 808.82Interest rate exposure exposure coefficient, see section 2 3.99 126.88 -833.46 577.24Financial constraint based on Whited and Wu (2006), see section 2 60.83 43.22 0.087 99.57Value factor Price-to-Book ratio 4.46 19.64 0.04 359.26Size Total assets (log) 9.42 3.11 0.68 18.10
Financial policy variables:Deposit guarantees BIS, Bloomberg timeline, national sources 0.44 0.50 0 1Debt guarantees BIS, Bloomberg timeline, national sources 0.32 0.47 0 1Capital injections BIS, Bloomberg timeline, national sources 0.26 0.44 0 1
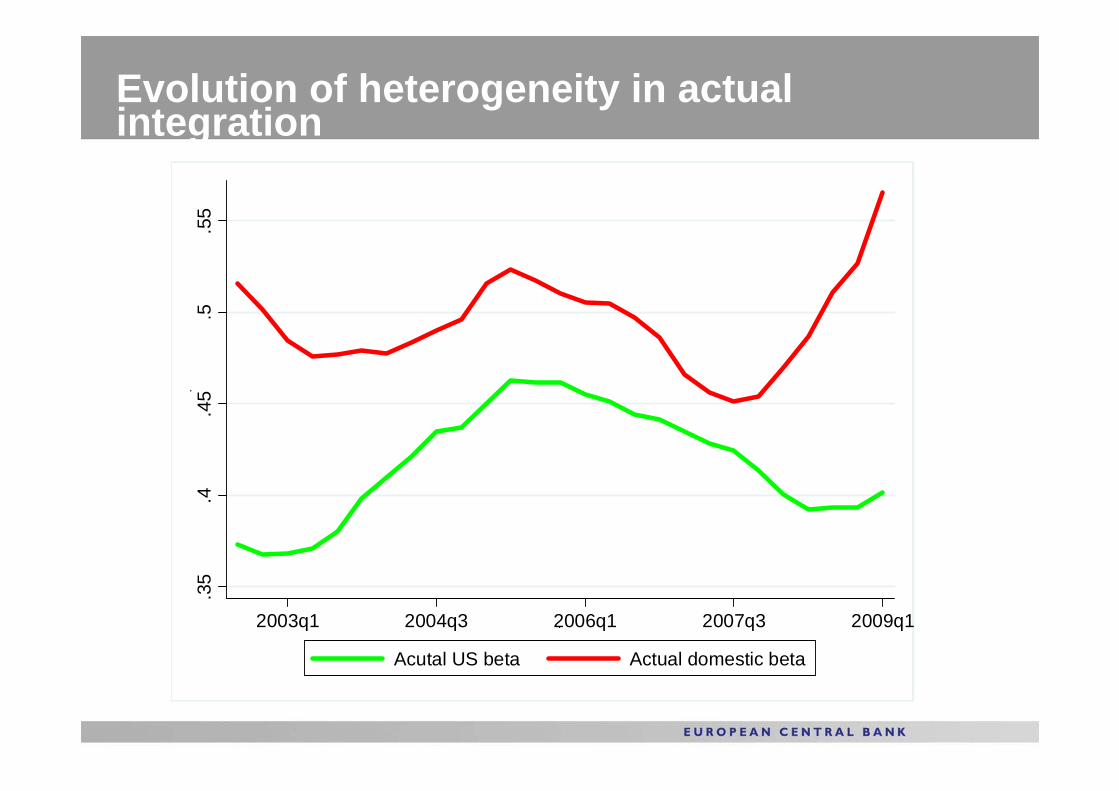
Evolution of heterogeneity in actual integration
.35
.4.4
5.5
.55
.
2003q1 2004q3 2006q1 2007q3 2009q1.
Acutal US beta Actual domestic beta

Role of integration with US markets for crisis severity
-60
-40
-20
0%
cum
ulat
ed re
turn
s
2005w1 2006w1 2007w1 2008w1 2009w1.
high US beta low US beta

Role of country-level macro fundamentals for crisis severity
-50
-40
-30
-20
-10
0%
cum
ulat
ed re
turn
s
2005w1 2006w1 2007w1 2008w1 2009w1.
strong fundamentals weak fundamentals

Estimation of exchange rate & interest rate exposures
• Ri,t : return of country-sector portfolio i on date t• Rus
t : return of US stock market on date t• Si,t : bilateral exchange rate change vs. USD on date t• ri,t : change in domestic 3-month interest rate on date t
(Dominguez and Tesar, 2001 & 2006; Amer et al. 2009)
tiUStitiiti eRsR ,,0, ++∆+= κδδ
tiUStitiiti eRrR ,,0, ++∆+= κηη

Decomposition of cross-section return dispersion
Dispersion in beta-fitted returns vs. idiosyncratic component
.2.4
.6.8
1.
02
46
810
.
1995q1 2000q1 2005q1 2010q1.
Fitted (lhs) Idiosyncratic (rhs)