Contactless Infrared Point Thermometers Commonly Used ...
28
sensors Article Reliability of Body Temperature Measurements Obtained with Contactless Infrared Point Thermometers Commonly Used during the COVID-19 Pandemic Filippo Piccinini 1, * , Giovanni Martinelli 1 and Antonella Carbonaro 2 Citation: Piccinini, F.; Martinelli, G.; Carbonaro, A. Reliability of Body Temperature Measurements Obtained with Contactless Infrared Point Thermometers Commonly Used during the COVID-19 Pandemic. Sensors 2021, 21, 3794. https:// doi.org/10.3390/s21113794 Academic Editors: Begoña Garcia-Zapirain and Arcangelo Merla Received: 24 March 2021 Accepted: 28 May 2021 Published: 30 May 2021 Publisher’s Note: MDPI stays neutral with regard to jurisdictional claims in published maps and institutional affil- iations. Copyright: © 2021 by the authors. Licensee MDPI, Basel, Switzerland. This article is an open access article distributed under the terms and conditions of the Creative Commons Attribution (CC BY) license (https:// creativecommons.org/licenses/by/ 4.0/). 1 IRCCS Istituto Romagnolo per lo Studio dei Tumori (IRST) “Dino Amadori”, 47014 Meldola, Italy; [email protected] 2 Department of Computer Science and Engineering (DISI), University of Bologna, 40126 Bologna, Italy; [email protected] * Correspondence: fi[email protected]; Tel.: +39-054-373-9921 Abstract: During the COVID-19 pandemic, there has been a significant increase in the use of non- contact infrared devices for screening the body temperatures of people at the entrances of hospitals, airports, train stations, churches, schools, shops, sports centres, offices, and public places in general. The strong correlation between a high body temperature and SARS-CoV-2 infection has motivated the governments of several countries to restrict access to public indoor places simply based on a person’s body temperature. Negating/allowing entrance to a public place can have a strong impact on people. For example, a cancer patient could be refused access to a cancer centre because of an incorrect high temperature measurement. On the other hand, underestimating an individual’s body temperature may allow infected patients to enter indoor public places where it is much easier for the virus to spread to other people. Accordingly, during the COVID-19 pandemic, the reliability of body temperature measurements has become fundamental. In particular, a debated issue is the reliability of remote temperature measurements, especially when these are aimed at identifying in a quick and reliable way infected subjects. Working distance, body–device angle, and light conditions and many other metrological and subjective issues significantly affect the data acquired via common contactless infrared point thermometers, making the acquisition of reliable measurements at the entrance to public places a challenging task. The main objective of this work is to sensitize the community to the typical incorrect uses of infrared point thermometers, as well as the resulting drifts in measurements of body temperature. Using several commercial contactless infrared point thermometers, we performed four different experiments to simulate common scenarios in a triage emergency room. In the first experiment, we acquired several measurements for each thermometer without measuring the working distance or angle of inclination to show that, for some instruments, the values obtained can differ by 1 ◦ C. In the second and third experiments, we analysed the impacts of the working distance and angle of inclination of the thermometers, respectively, to prove that only a few cm/degrees can cause drifts higher than 1 ◦ C. Finally, in the fourth experiment, we showed that the light in the environment can also cause changes in temperature up to 0.5 ◦ C. Ultimately, in this study, we quantitatively demonstrated that the working distance, angle of inclination, and light conditions can strongly impact temperature measurements, which could invalidate the screening results. Keywords: sensors for medical applications; body temperature; infrared devices; triage emergency rooms; COVID-19 1. Introduction Coronavirus disease-2019 (COVID-19) is the most significant illness in recent years. This disease is characterized by high transmissibility and significant morbidity and mortal- ity. After the first officially reported case in Wuhan, China, in December 2019 [1], severe Sensors 2021, 21, 3794. https://doi.org/10.3390/s21113794 https://www.mdpi.com/journal/sensors
Transcript of Contactless Infrared Point Thermometers Commonly Used ...
sensors
Article
Reliability of Body Temperature Measurements Obtained withContactless Infrared Point Thermometers Commonly Usedduring the COVID-19 Pandemic
Filippo Piccinini 1,* , Giovanni Martinelli 1 and Antonella Carbonaro 2
�����������������
Citation: Piccinini, F.; Martinelli, G.;
Carbonaro, A. Reliability of Body
Temperature Measurements Obtained
with Contactless Infrared Point
Thermometers Commonly Used
during the COVID-19 Pandemic.
Sensors 2021, 21, 3794. https://
doi.org/10.3390/s21113794
Academic Editors:
Begoña Garcia-Zapirain and
Arcangelo Merla
Received: 24 March 2021
Accepted: 28 May 2021
Published: 30 May 2021
Publisher’s Note: MDPI stays neutral
with regard to jurisdictional claims in
published maps and institutional affil-
iations.
Copyright: © 2021 by the authors.
Licensee MDPI, Basel, Switzerland.
This article is an open access article
distributed under the terms and
conditions of the Creative Commons
Attribution (CC BY) license (https://
creativecommons.org/licenses/by/
4.0/).
1 IRCCS Istituto Romagnolo per lo Studio dei Tumori (IRST) “Dino Amadori”, 47014 Meldola, Italy;[email protected]
2 Department of Computer Science and Engineering (DISI), University of Bologna, 40126 Bologna, Italy;[email protected]
* Correspondence: [email protected]; Tel.: +39-054-373-9921
Abstract: During the COVID-19 pandemic, there has been a significant increase in the use of non-contact infrared devices for screening the body temperatures of people at the entrances of hospitals,airports, train stations, churches, schools, shops, sports centres, offices, and public places in general.The strong correlation between a high body temperature and SARS-CoV-2 infection has motivatedthe governments of several countries to restrict access to public indoor places simply based on aperson’s body temperature. Negating/allowing entrance to a public place can have a strong impacton people. For example, a cancer patient could be refused access to a cancer centre because ofan incorrect high temperature measurement. On the other hand, underestimating an individual’sbody temperature may allow infected patients to enter indoor public places where it is mucheasier for the virus to spread to other people. Accordingly, during the COVID-19 pandemic, thereliability of body temperature measurements has become fundamental. In particular, a debatedissue is the reliability of remote temperature measurements, especially when these are aimed atidentifying in a quick and reliable way infected subjects. Working distance, body–device angle,and light conditions and many other metrological and subjective issues significantly affect the dataacquired via common contactless infrared point thermometers, making the acquisition of reliablemeasurements at the entrance to public places a challenging task. The main objective of this workis to sensitize the community to the typical incorrect uses of infrared point thermometers, as wellas the resulting drifts in measurements of body temperature. Using several commercial contactlessinfrared point thermometers, we performed four different experiments to simulate common scenariosin a triage emergency room. In the first experiment, we acquired several measurements for eachthermometer without measuring the working distance or angle of inclination to show that, forsome instruments, the values obtained can differ by 1 ◦C. In the second and third experiments,we analysed the impacts of the working distance and angle of inclination of the thermometers,respectively, to prove that only a few cm/degrees can cause drifts higher than 1 ◦C. Finally, inthe fourth experiment, we showed that the light in the environment can also cause changes intemperature up to 0.5 ◦C. Ultimately, in this study, we quantitatively demonstrated that the workingdistance, angle of inclination, and light conditions can strongly impact temperature measurements,which could invalidate the screening results.
Keywords: sensors for medical applications; body temperature; infrared devices; triage emergencyrooms; COVID-19
1. Introduction
Coronavirus disease-2019 (COVID-19) is the most significant illness in recent years.This disease is characterized by high transmissibility and significant morbidity and mortal-ity. After the first officially reported case in Wuhan, China, in December 2019 [1], severe
Sensors 2021, 21, 3794. https://doi.org/10.3390/s21113794 https://www.mdpi.com/journal/sensors
Sensors 2021, 21, 3794 2 of 28
acute respiratory syndrome coronavirus 2 (SARS-CoV-2) became a global phenomenon inonly a few months. In March 2020, over 200 countries had reported SARS-CoV-2 cases, andthe World Health Organization (WHO) officially declared the COVID-19 outbreak to be apandemic [2].
COVID-19-related deaths are associated with several factors, primarily includingadvanced age, diabetes, severe asthma, and various other medical conditions. Olderindividuals, particularly those over 50 years old, are at high risk of contracting COVID-19and have a poor prognosis compared to those from younger age groups, possibly due to thepatho/physiological changes associated with aging. As a result, the mortality rate tendsto be higher among the older population [3]. Furthermore, while men and women havethe same prevalence of the disease, men with COVID-19 are at greater risk of sufferingworse outcomes and death, independent of age [4]. In addition, compared with thoseof a white ethnicity, black and south Asian individuals are at greater risk of death [5].Frequent symptoms include cough, sore throat, diarrhoea, headache, muscle/joint pain,fatigue, and loss of smell and taste [6]. However, the most common symptom is fever(i.e., a body temperature >37.5 ◦C). Accordingly, temperature is used as a key parameterto determine whether patients might have COVID-19 [7]. For instance, in the four-classsystem created by the Daegu Medical Association for the rapid classification of patientswith COVID-19, patients are termed asymptomatic if they are COVID-19-infected but havea body temperature <37.5 ◦C; mild if they have a body temperature ≥37.5 ◦C, but O2supply is not required; moderate if their body temperature is ≥37.5 ◦C, and O2 supplyis required; and severe if the body temperature is ≥38 ◦C, and high-flow O2 supply ormechanical ventilation is needed [8].
The correlation between high temperature and COVID-19 infection is so strong thatseveral governments have imposed screening protocols involving a body temperaturecheck at the entrances to hospitals, airports, train stations, churches, schools, shops, sportscentres, offices, etc. [9]. From a practical standpoint, emergency triage rooms and generalcheckpoints have been established at the entrances to most crowded places, and, in theevent that a person is identified to have a high temperature, access is denied to reduce therisk of transmitting the virus [10]. For this reason, contactless devices to measure bodytemperature have rapidly become popular all over the world [11].
Among the different systems available for temperature screenings, the most widelyused are contactless infrared cameras and point thermometers [12]. These systems measurethe infrared radiation emitted by different bodies. Infrared cameras use a grid of thermaldetectors and can be used to construct a 2D temperature map. Instead, contactless infraredpoint thermometers use a single thermal detector per device and, accordingly, give a singletemperature value as their output. A physical body with a temperature above absolutezero (i.e., –273.15 ◦C; 0 Kelvin) emits electromagnetic radiation proportional to its intrinsicbody temperature. Infrared radiation is a part of this intrinsic temperature. Technically,infrared radiation covers a portion of the whole range of the electromagnetic spectrum,starting at the visible range of about 0.78 µm and ending at wavelengths of approximately1 mm. In general, thermal detectors are broadband, meaning that they collect all infraredradiation from the source. However, wavelengths ranging from 3 to 14 µm are typicallyused for measuring body temperature. Recently, Chen et al. mathematically described howbody temperature can be measured using a contactless infrared point-thermometer [13].Briefly, infrared radiation is emitted from the body surface and penetrates the atmosphere.With the help of a lens (i.e., input optics), the radiation beam is focused onto a detectorthat generates an electrical signal proportional to the input radiation. Thanks to thisphenomenon, contactless infrared point thermometers are commonly used for measuringbody temperature in a rapid, non-destructive, non-interactive, and non-invasive manner.Contactless infrared point thermometers are generally composed of a lens, a detector, asignal amplifier, a source of digital signal processing, and a display. Today, the marketoffers a wide range of contactless infrared point thermometers, sometimes called infraredcontactless thermal guns [14]. In general, these devices are fairly inexpensive (typically
Sensors 2021, 21, 3794 3 of 28
less than €100) and do not differ significantly in terms of hardware and software. Mostcommonly, 2 ◦C is reported in the relevant datasheets as being generally accurate within arange of 36–39 ◦C. Furthermore, these devices can be used to measure body temperature atdifferent body sites [15]. However, the forehead is the most typical site of measurement [16].
During the COVID-19 pandemic, there has been a substantial increase in the avail-ability of different models of non-contact infrared point thermometers and in courses forteaching operators how to use and maintain these instruments. From a practical viewpoint,in a very short space of time, all shops, workplaces, and public buildings employed opera-tors mainly equipped with contactless infrared devices to screen people at entrances bymeasuring their body temperatures, thus reducing the risk of viral transmission throughasymptomatic carriers [17]. Although such a practice incurs substantial costs, the key issuehere is not the expense but the reliability of the measurements, as misclassifying healthypeople or missing infected individuals can have serious consequences [18]. For example, acancer patient going to a hospital for treatment could be denied entry due to a erroneoushigh temperature measured at the entrance [19]. On the other hand, an infected individualwith an underestimated temperature reading could have a serious health impact if allowedinto a crowded public place such as a supermarket [20]. Previous studies reported metro-logical experiments to evaluate the performance of contactless infrared point thermometersusing tuneable artificial heat sources. For instance, Fletcher et al. [21] recently analysedthree non-contact infrared point thermometers using blackbody sources with temperaturedetermined using calibrated platinum resistance thermometers. Based on analyses per-formed in the laboratory using these artificial heat sources, the authors concluded thattwo out of the three devices suffered from large measurement errors falling far outside theaccuracy range stated by their manufacturers, as well as the medical standard to whichthese devices are intended to adhere. Finally, in a very recent paper, Dell’Isola et al. [22]carefully analysed the effects of many metrological and subjective issues on the reliabilityof the body temperature measurement. They clarified that the body temperature measure-ment is influenced by the unavoidable instrumental uncertainties and by the operator’sability, but also by numerous other quantities such as: (a) the emissivity and the reflectioncoefficient of the emitting skin surface; (b) the transmission coefficient of the mediumbetween the sensor and the target; (c) the average radiant temperature of the measurementenvironment (i.e., the reflected temperature); (d) the distance and consequent size of thetarget (effect of the size of the source). In addition, they explained how the measurementis affected by the intrinsic complexity and variability of the subjective measurand and tothe homeostatic mechanisms of body thermoregulation, mainly under the hypothalamiccontrol and conditioned by (I) several individual factors (e.g., comorbidities, age, physicalactivity, digestion, stress, use of drugs and smoking); (II) temporal variables (e.g., circadianrhythm, menstrual cycle); (III) spatial variables (e.g., body and skin); (IV) environmentalconditions (e.g., indoor/outdoor). They also provided illustrations to show the (i) rootof the causes of noncontact temperature measurement uncertainty; (ii) body temperaturevariability at different body sites; (iii) body temperature variability after meals. Finally, theyproposed a two-step screening decision protocol to better prevent the spread of COVID-19.The protocol takes into account both the traditional instrumental uncertainty sources andclinical–medical ones related to the subjectivity of the measurand. The first step is basedon a deterministic temperature threshold (generally set at 37.5 ◦C to avoid a large numberof false positives). In this step, the body temperature is estimated from the forehead usinga simple and quick noncontact temperature thermometer. The second step (performedwhen the first-step noncontact measurement falls within an uncertainty zone) is based on astatistical threshold value determined on the basis of the sample-measured temperaturesat real measurement conditions and the adopted procedure. Practically, in the second step,the temperature assessment is performed by means of an axillary contact temperature mea-surement and after the subject has been at rest to thermally stabilize for at least 15 min inan indoor environment. The availability of data acquired in different real-world scenariosto assess the de facto reliability of non-contact infrared point thermometers for estimating
Sensors 2021, 21, 3794 4 of 28
the body temperature of human subjects, together with the extensive analysis provided byDell’Isola et al. and the designed protocol, may represent a great help to support nationalauthorities to better set up the obligation to measure body temperature for limiting the riskof contagion.
In the present study, we collected and then shared quantitative data under severalreal scenarios to highlight the most typical incorrect uses of infrared point thermometersand the resulting drifts in measurements of body temperature. In particular, we tested fourdifferent commercial contactless infrared point thermometers used on a daily basis at ourcancer institute (IRST, Meldola, Italy) and performed five different tests to report the defacto: (a) intra- and (b) inter-rater reliability, as well as the dependence of the measurementson the (c) working distance, (d) angle of inclination of the device, and (e) spurious infraredradiation (i.e., ambient radiation). We considered representative problems affecting thereal measurements taken in an emergency triage room and at a temperature checkpoint, asthe operators performing this task typically do not use a ruler or goniometer and visuallyevaluate the forehead–device distance when acquiring the measurement.
The quantitative data obtained from the present experiments show that even a slightlyincorrect use of contactless infrared point thermometers can lead to substantial inaccura-cies in the measurement of body temperature. Our data confirm that several factors caninvalidate temperature screening. This is important information for temperature screeningoperators and for organisations planning temperature checks at the entrances of stores,workplaces, and public buildings. In general, it is recommended that the body temper-ature be measured a second time after individuals have become acclimatized to beingindoors [19]. However, a better understanding of the de facto limits of non-contact infrareddevices among the devices’ operators and the individuals being screened could help obtainmore reliable data to protect people from the spread of SARS-CoV-2 infection during thisdifficult time.
2. Materials and Methods2.1. Devices Used in the Experiments
In the experiments, we simulated an operator stationed at the entrance to a publicplace to assess the body temperatures of people interested in accessing the building. Fourdifferent commercial models of non-contact infrared point thermometers used daily in ourcancer centre (IRST, Meldola, Italy) were tested in the experiments:
• Company: TECNIMED (Varese, Italy), model: VisioFocus PRO 06480; working dis-tance automatically suggested in real-time (approximately 5–10 cm; Figure 1a);
• Company: Medek (Shenzhen, China), model: MDI261; working distance reported inthe datasheet: 1–3 cm (Figure 1b);
• Company: FLUS (Shenzhen, China), model: IR-805B; working distance reported inthe datasheet: 5 cm (Figure 1c);
• Company: Berrcom (Guangdong, Cina), model: JXB-178; working distance reportedin the datasheet: 3–5 cm (Figure 1d).
Table 1 lists the main manufacturers’ technical specifications reported in the datasheetsof the four non-contact infrared point thermometers considered in this study. Hereafter,the four thermometers will be referenced using the acronym “Tn”, with n = 1, 2, 3, or 4.However, as our analysis was designed to formulate general considerations rather than tovalidate a specific device, we will not specify which device is being referred to as T1, T2,T3, or T4 to avoid commercial issues when reporting the quantitative data.
Sensors 2021, 21, 3794 5 of 28Sensors 2021, 21, x FOR PEER REVIEW 5 of 27
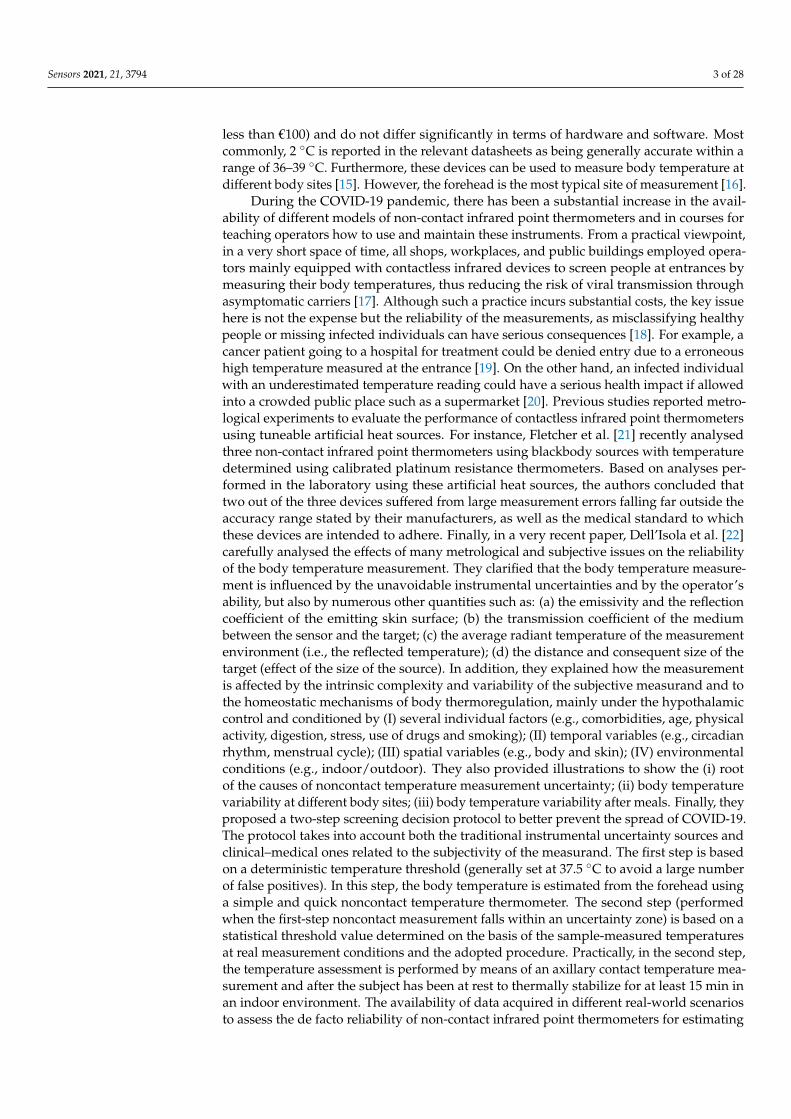
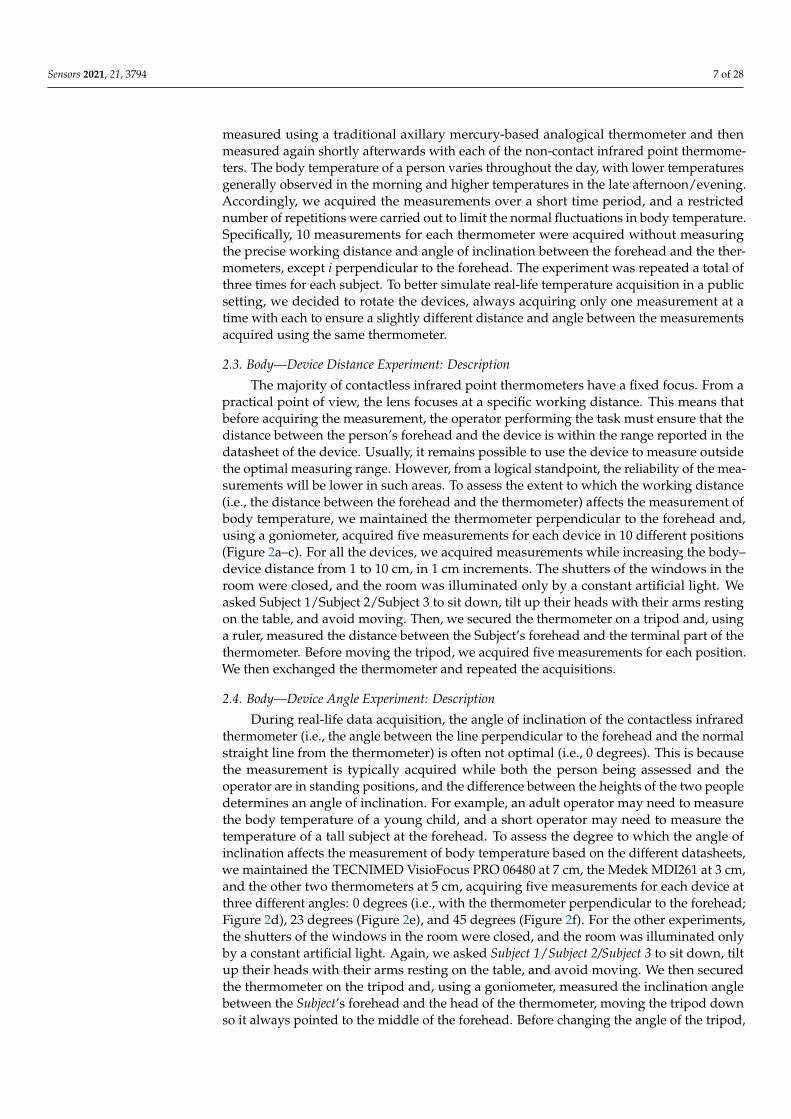
Figure 1. Contactless infrared thermometers used in this work: (a) TECNIMED VisioFocus PRO 06480; (b) Medek MDI261; (c) FLUS IR-805B; (d) Berrcom JXB-178 (T2). (e) Axillary mercury-based analogical thermometer. (f) Ruler, goniometer, and tripod used in the experiments. (g) Representative photograph acquired during the experiments. (h) Schematic representation of the detected infrared radiation composed of the emitted signal and the component of the ambient radiation reflected from the surface of the body of the person.
Table 1 lists the main manufacturers’ technical specifications reported in the datasheets of the four non-contact infrared point thermometers considered in this study. Hereafter, the four thermometers will be referenced using the acronym “Tn”, with n = 1, 2, 3, or 4. However, as our analysis was designed to formulate general considerations rather than to validate a specific device, we will not specify which device is being referred to as T1, T2, T3, or T4 to avoid commercial issues when reporting the quantitative data.
Figure 1. Contactless infrared thermometers used in this work: (a) TECNIMED VisioFocus PRO 06480; (b) Medek MDI261;(c) FLUS IR-805B; (d) Berrcom JXB-178 (T2). (e) Axillary mercury-based analogical thermometer. (f) Ruler, goniometer,and tripod used in the experiments. (g) Representative photograph acquired during the experiments. (h) Schematicrepresentation of the detected infrared radiation composed of the emitted signal and the component of the ambient radiationreflected from the surface of the body of the person.
Sensors 2021, 21, 3794 6 of 28
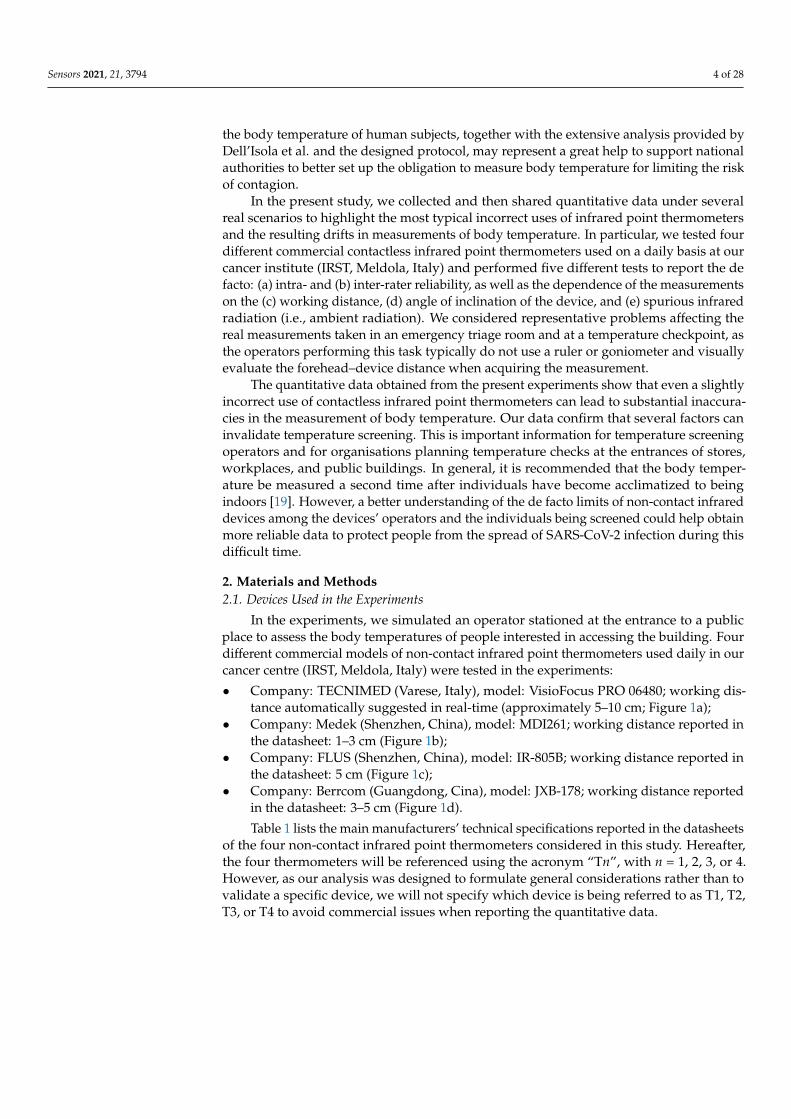
Table 1. Main manufacturer’s technical specifications for the four non-contact infrared point thermometers considered inthis study.
Company TECNIMED Medek FLUS Berrcom
Model VisioFocus PRO 06480 MDI261 IR-805B JXB-178
Manufactured in: Italy China China China
Operating roomtemperature [◦C] 16–40 10–40 10–50 10–40
Measuring range [◦C] 34–42.5 32–43 32–42 32–42.9
Resolution [◦C] 0.1 0.1 0.1 0.1
Accuracy [◦C]±0.3 from 34 to 35.9±0.2 from 36 to 39
±0.3 from 39.1 to 42.5
±0.3 from 34 to 35.4±0.2 from 35.5 to 42±0.3 from 42.1 to 42.9
±0.3 from 32 to 35.9±0.2 from 36 to 39±0.3 from 39.1 to 42
±0.3 from 32 to 34.9±0.2 from 35 to 42
±0.3 from 42.1 to 42.9
Working distance [cm] 5–10 1–3 5 3–5
Standards ASTM E1965.98 ASTM E1965.98 ASTM E1965.98 ASTM E1965.98
All the measurements were acquired in the same room under the same light condi-tions, except when explicitly reported. The temperature and humidity of the room weremonitored using a BAR208SX Weather Station (Oregon Scientific, Tualatin, OR, USA).Notably, these data were not considered in the quantitative analysis performed in thisstudy. However, both are always directly reported in the Appendix A Tables A1–A12,should future studies require them. To acquire a reference temperature, we used a classicstandard axillary mercury-based analogical thermometer for measuring body temperaturefrom the armpit (Figure 1e). Five min was the time required for each measurement withthis analogical thermometer. Before each round of data acquisition, three measurementswere acquired from the right armpits of the operators, and the average value was thenconsidered as the ground truth (GT). All measurements were acquired from the foreheadsof three healthy subjects: Subject 1 was a 65-year-old woman, Subject 2 was a 65-year-oldman, and Subject 3 was a 35-year-old man. These measurements simulated the personto be assessed in an emergency triage room. Surrounding materials can influence thetemperature measurements of self-heating objects [23]. Thus, during the acquisitions, wecarefully ensured that no sweat and/or make-up was present on the foreheads of thesubjects. Notably, all the subjects involved in the experiments simply volunteered to testthe infrared devices; no personal sensitive health data were shared in this work. However,to avoid potential disclosures, all 3 subjects involved in the experiments gave written in-formed consent to publicly authorize, without restriction, the reproduction, treatment, andanalysis of the collected data. To acquire the measurements we used a ruler, a goniometer,and a tripod (Figure 1f). We then asked Subject 1/Subject 2/Subject 3 to sit down, tilt uptheir heads with their arms resting on the table, and avoid moving (Figure 1g).
2.2. Inter- and Intra-Rater Reliability Experiment: Description
Here, we define the terms inter-rater reliability and intra-rater reliability, also knownas inter- and intra-observer variability or reproducibility and repeatability, respectively [24].Inter-rater reliability (i.e., inter-observer variability or reproducibility) is defined as thecloseness of the agreement between measurements of the same object, carried out undermodified measurement conditions; Intra-rater reliability (i.e., intra-observer variability orrepeatability) is the closeness of the agreement between successive measurements of thesame object, carried out under the same measurement conditions. In our experiments,the object was the body temperature of Subject 1/Subject 2/Subject 3, and the modifiedcondition was the contactless infrared thermometer used.
To keep the experimental settings constant, the shutters on the windows in the roomwere closed, and the room was illuminated by a constant artificial light. To avoid fluc-tuations in body temperature, the temperature of Subject 1/Subject 2/Subject 3 was first
Sensors 2021, 21, 3794 7 of 28
measured using a traditional axillary mercury-based analogical thermometer and thenmeasured again shortly afterwards with each of the non-contact infrared point thermome-ters. The body temperature of a person varies throughout the day, with lower temperaturesgenerally observed in the morning and higher temperatures in the late afternoon/evening.Accordingly, we acquired the measurements over a short time period, and a restrictednumber of repetitions were carried out to limit the normal fluctuations in body temperature.Specifically, 10 measurements for each thermometer were acquired without measuringthe precise working distance and angle of inclination between the forehead and the ther-mometers, except i perpendicular to the forehead. The experiment was repeated a total ofthree times for each subject. To better simulate real-life temperature acquisition in a publicsetting, we decided to rotate the devices, always acquiring only one measurement at atime with each to ensure a slightly different distance and angle between the measurementsacquired using the same thermometer.
2.3. Body—Device Distance Experiment: Description
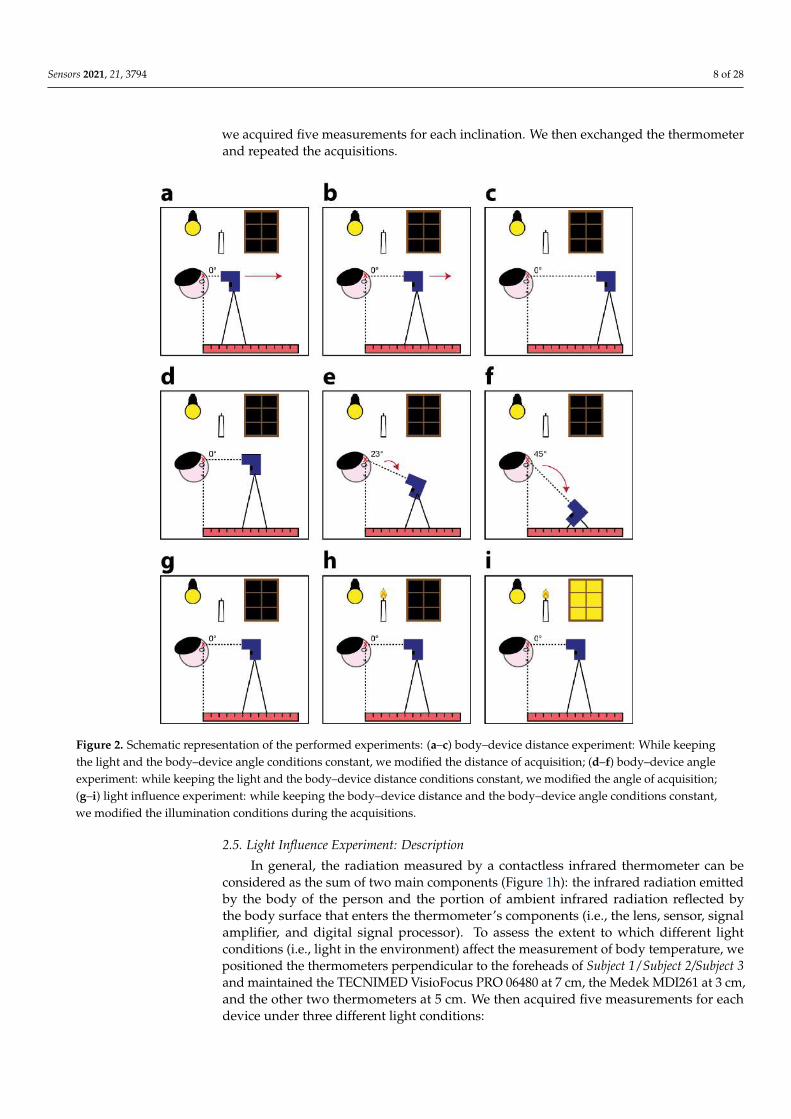
The majority of contactless infrared point thermometers have a fixed focus. From apractical point of view, the lens focuses at a specific working distance. This means thatbefore acquiring the measurement, the operator performing the task must ensure that thedistance between the person’s forehead and the device is within the range reported in thedatasheet of the device. Usually, it remains possible to use the device to measure outsidethe optimal measuring range. However, from a logical standpoint, the reliability of the mea-surements will be lower in such areas. To assess the extent to which the working distance(i.e., the distance between the forehead and the thermometer) affects the measurement ofbody temperature, we maintained the thermometer perpendicular to the forehead and,using a goniometer, acquired five measurements for each device in 10 different positions(Figure 2a–c). For all the devices, we acquired measurements while increasing the body–device distance from 1 to 10 cm, in 1 cm increments. The shutters of the windows in theroom were closed, and the room was illuminated only by a constant artificial light. Weasked Subject 1/Subject 2/Subject 3 to sit down, tilt up their heads with their arms restingon the table, and avoid moving. Then, we secured the thermometer on a tripod and, usinga ruler, measured the distance between the Subject’s forehead and the terminal part of thethermometer. Before moving the tripod, we acquired five measurements for each position.We then exchanged the thermometer and repeated the acquisitions.
2.4. Body—Device Angle Experiment: Description
During real-life data acquisition, the angle of inclination of the contactless infraredthermometer (i.e., the angle between the line perpendicular to the forehead and the normalstraight line from the thermometer) is often not optimal (i.e., 0 degrees). This is becausethe measurement is typically acquired while both the person being assessed and theoperator are in standing positions, and the difference between the heights of the two peopledetermines an angle of inclination. For example, an adult operator may need to measurethe body temperature of a young child, and a short operator may need to measure thetemperature of a tall subject at the forehead. To assess the degree to which the angle ofinclination affects the measurement of body temperature based on the different datasheets,we maintained the TECNIMED VisioFocus PRO 06480 at 7 cm, the Medek MDI261 at 3 cm,and the other two thermometers at 5 cm, acquiring five measurements for each device atthree different angles: 0 degrees (i.e., with the thermometer perpendicular to the forehead;Figure 2d), 23 degrees (Figure 2e), and 45 degrees (Figure 2f). For the other experiments,the shutters of the windows in the room were closed, and the room was illuminated onlyby a constant artificial light. Again, we asked Subject 1/Subject 2/Subject 3 to sit down, tiltup their heads with their arms resting on the table, and avoid moving. We then securedthe thermometer on the tripod and, using a goniometer, measured the inclination anglebetween the Subject’s forehead and the head of the thermometer, moving the tripod downso it always pointed to the middle of the forehead. Before changing the angle of the tripod,
Sensors 2021, 21, 3794 8 of 28
we acquired five measurements for each inclination. We then exchanged the thermometerand repeated the acquisitions.
Sensors 2021, 21, x FOR PEER REVIEW 8 of 27
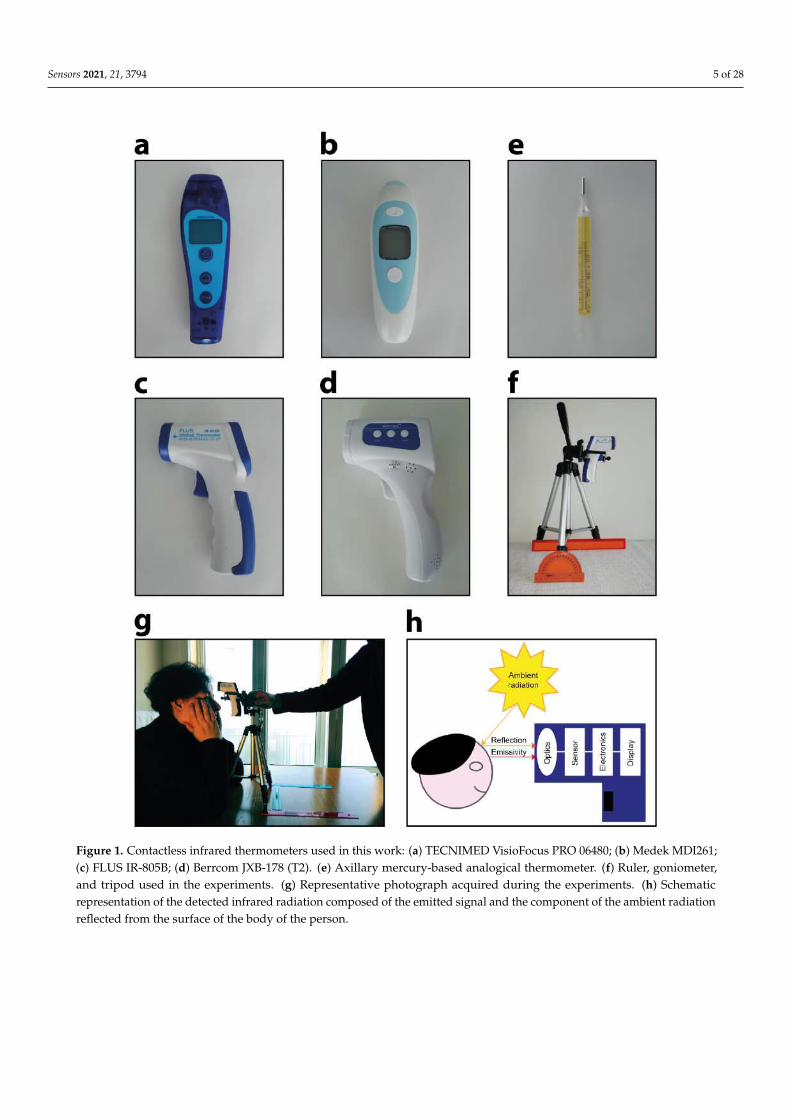
Figure 2. Schematic representation of the performed experiments: (a–c) body–device distance experiment: While keeping the light and the body–device angle conditions constant, we modified the distance of acquisition; (d–f) body–device angle experiment: while keeping the light and the body–device distance conditions constant, we modified the angle of acquisition; (g–i) light influence experiment: while keeping the body–device distance and the body–device angle conditions constant, we modified the illumination conditions during the acquisitions.
2.4. Body—Device Angle experiment: Description During real-life data acquisition, the angle of inclination of the contactless infrared
thermometer (i.e., the angle between the line perpendicular to the forehead and the normal straight line from the thermometer) is often not optimal (i.e., 0 degrees). This is because the measurement is typically acquired while both the person being assessed and the operator are in standing positions, and the difference between the heights of the two people determines an angle of inclination. For example, an adult operator may need to measure the body temperature of a young child, and a short operator may need to measure the temperature of a tall subject at the forehead. To assess the degree to which the angle of inclination affects the measurement of body temperature based on the different datasheets, we maintained the TECNIMED VisioFocus PRO 06480 at 7 cm, the Medek MDI261 at 3 cm, and the other two thermometers at 5 cm, acquiring five measurements for each device at three different angles: 0 degrees (i.e., with the thermometer perpendicular to the forehead; Figure 2d), 23 degrees (Figure 2e), and 45 degrees (Figure 2f). For the other experiments, the shutters of the windows in the room were closed, and the room was illuminated only by a constant artificial light. Again, we
Figure 2. Schematic representation of the performed experiments: (a–c) body–device distance experiment: While keepingthe light and the body–device angle conditions constant, we modified the distance of acquisition; (d–f) body–device angleexperiment: while keeping the light and the body–device distance conditions constant, we modified the angle of acquisition;(g–i) light influence experiment: while keeping the body–device distance and the body–device angle conditions constant,we modified the illumination conditions during the acquisitions.
2.5. Light Influence Experiment: Description
In general, the radiation measured by a contactless infrared thermometer can beconsidered as the sum of two main components (Figure 1h): the infrared radiation emittedby the body of the person and the portion of ambient infrared radiation reflected bythe body surface that enters the thermometer’s components (i.e., the lens, sensor, signalamplifier, and digital signal processor). To assess the extent to which different lightconditions (i.e., light in the environment) affect the measurement of body temperature, wepositioned the thermometers perpendicular to the foreheads of Subject 1/Subject 2/Subject 3and maintained the TECNIMED VisioFocus PRO 06480 at 7 cm, the Medek MDI261 at 3 cm,and the other two thermometers at 5 cm. We then acquired five measurements for eachdevice under three different light conditions:
Sensors 2021, 21, 3794 9 of 28
1) With the shutters of the windows in the room closed and the room illuminated onlyby a constant artificial light (i.e., the same conditions as those in the other experiments,Figure 2g). This condition aimed to simulate real-life acquisitions performed, forinstance, in an emergency triage room during the late afternoon/evening.
2) With the shutters of the windows in the room closed and the room illuminated only byconstant artificial light and a small candle (Figure 2h). This condition again aimed tosimulate real-life acquisitions performed in an emergency triage room during the lateafternoon/evening but with a different source of light than that of the first condition.
3) With the shutters of the windows in the room kept fully open to allow sunlight toilluminate the room. The artificial light was retained, and the candle remained lit(Figure 2i). This condition aimed to simulate real-life acquisitions performed, forinstance, in an emergency triage room in the morning/early-afternoon. We performedthese experiments only on sunny days to ensure a significant difference comparedto the other conditions featuring closed window shutters. However, the acquisi-tions were performed while ensuring that the rays of the sun did not touch thesubjects’ foreheads.
As in the other experiments, we asked Subject 1/Subject 2/Subject 3 to sit down, tiltup their heads with their arms resting on the table, and avoid moving. We then securedthe thermometer with a tripod and, using a ruler and goniometer, measured the workingdistance and inclination angle. We next modified the light settings before exchangingthe device.
3. Results3.1. Inter- and Intra-Rater Reliability Experiment: Results
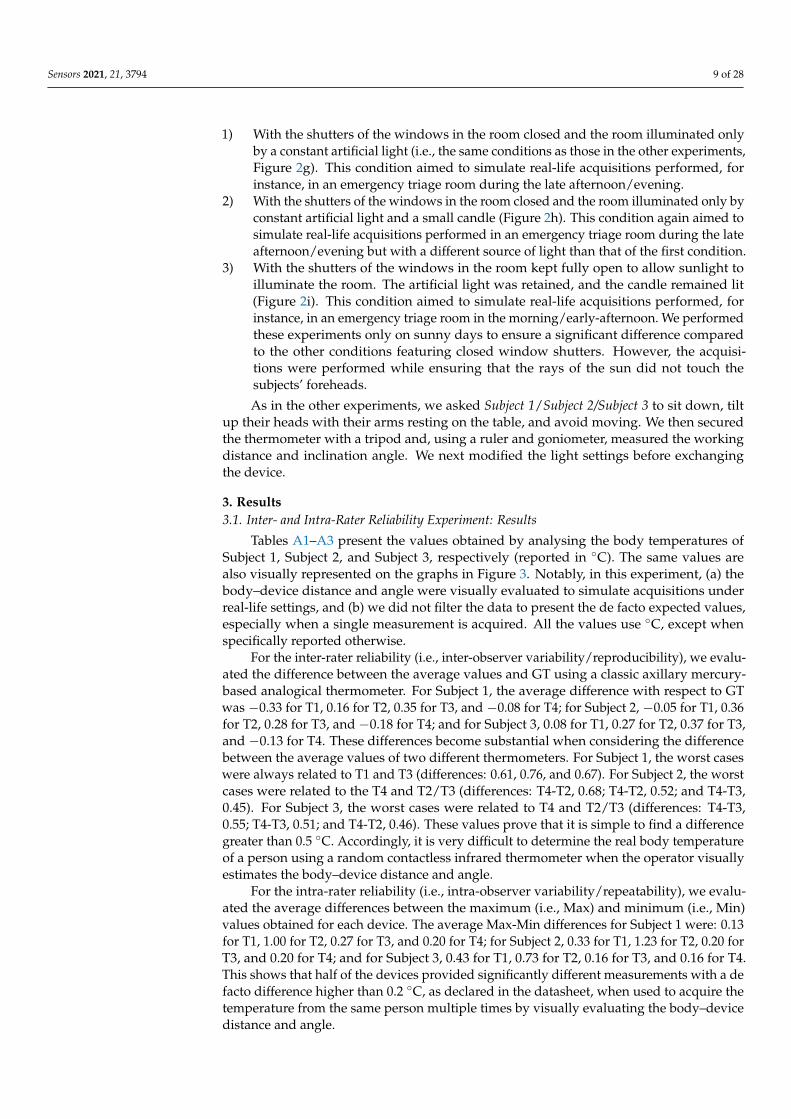
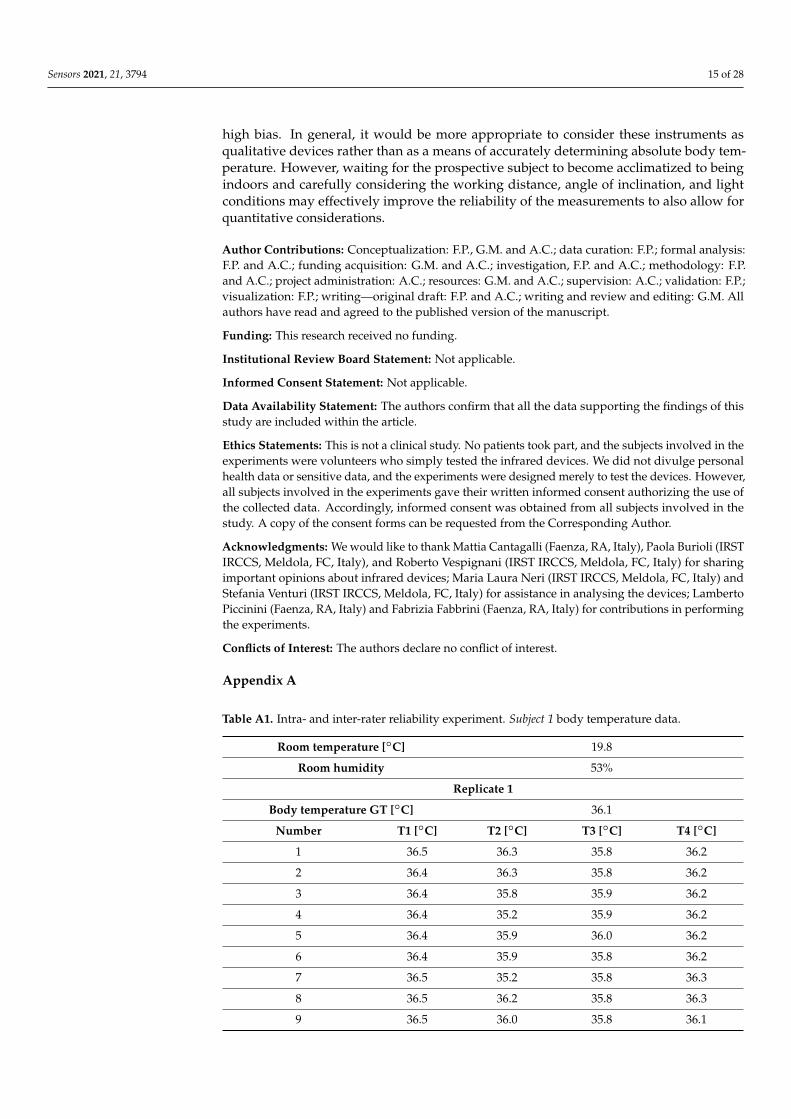
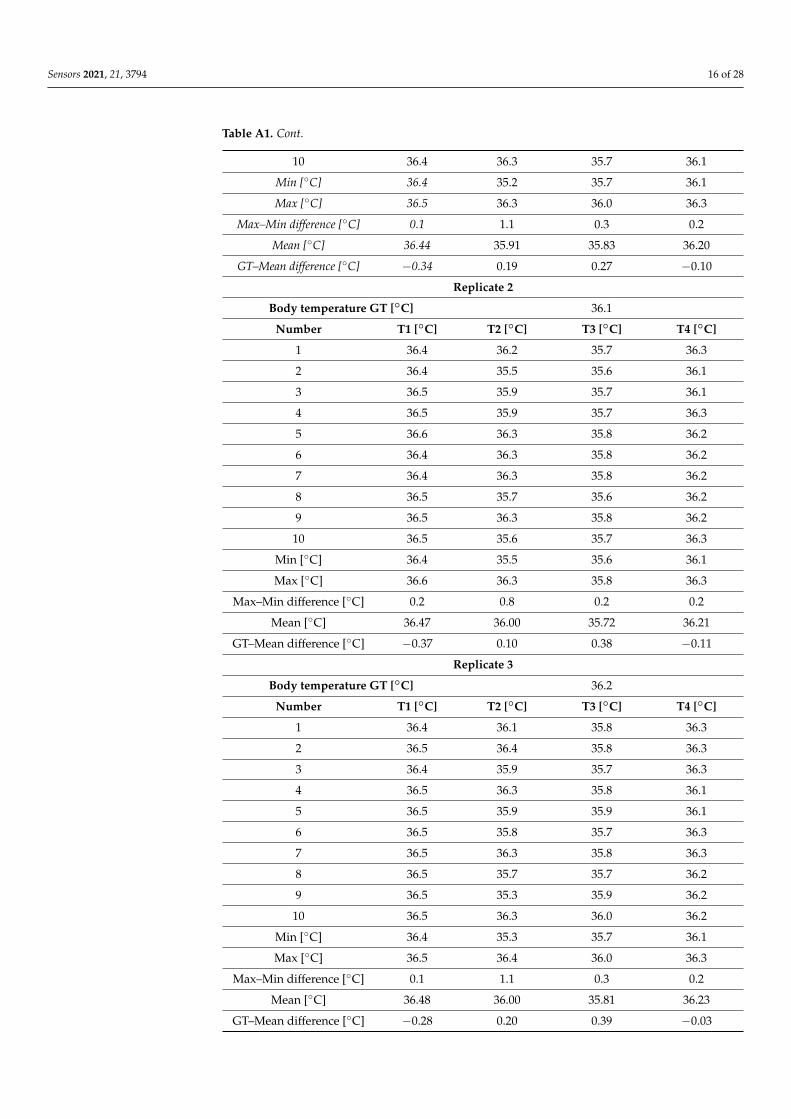
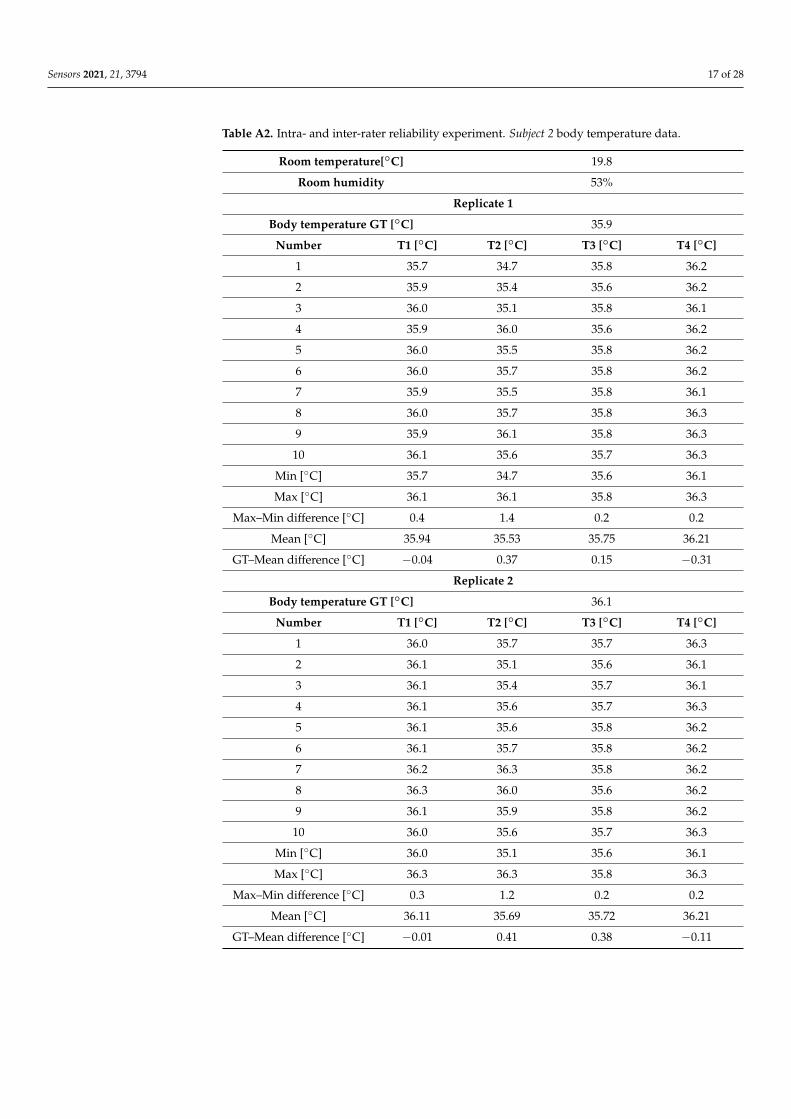
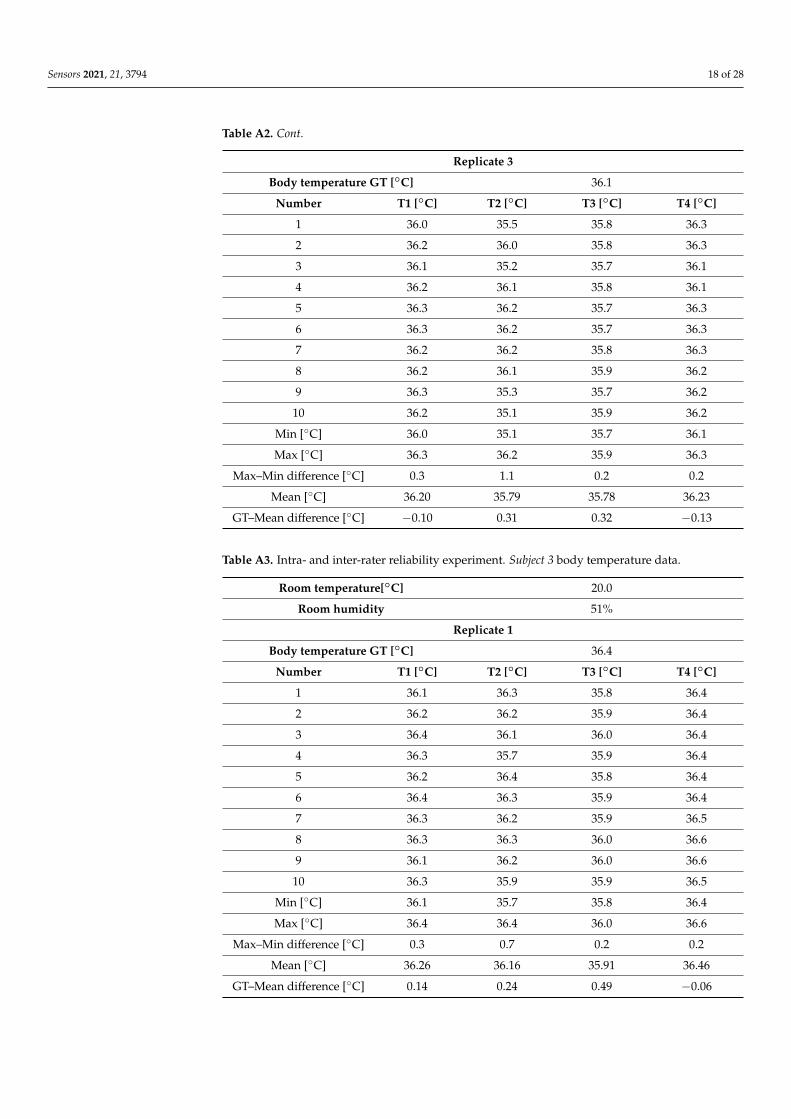
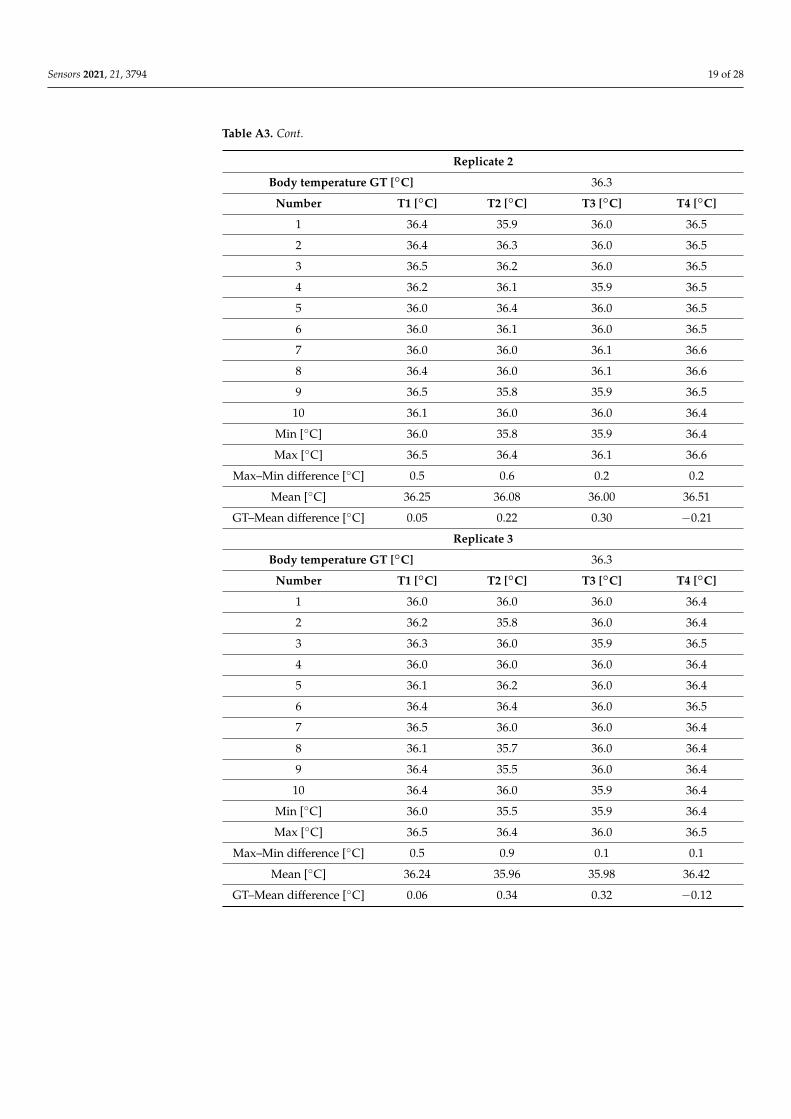
Tables A1–A3 present the values obtained by analysing the body temperatures ofSubject 1, Subject 2, and Subject 3, respectively (reported in ◦C). The same values arealso visually represented on the graphs in Figure 3. Notably, in this experiment, (a) thebody–device distance and angle were visually evaluated to simulate acquisitions underreal-life settings, and (b) we did not filter the data to present the de facto expected values,especially when a single measurement is acquired. All the values use ◦C, except whenspecifically reported otherwise.
For the inter-rater reliability (i.e., inter-observer variability/reproducibility), we evalu-ated the difference between the average values and GT using a classic axillary mercury-based analogical thermometer. For Subject 1, the average difference with respect to GTwas −0.33 for T1, 0.16 for T2, 0.35 for T3, and −0.08 for T4; for Subject 2, −0.05 for T1, 0.36for T2, 0.28 for T3, and −0.18 for T4; and for Subject 3, 0.08 for T1, 0.27 for T2, 0.37 for T3,and −0.13 for T4. These differences become substantial when considering the differencebetween the average values of two different thermometers. For Subject 1, the worst caseswere always related to T1 and T3 (differences: 0.61, 0.76, and 0.67). For Subject 2, the worstcases were related to the T4 and T2/T3 (differences: T4-T2, 0.68; T4-T2, 0.52; and T4-T3,0.45). For Subject 3, the worst cases were related to T4 and T2/T3 (differences: T4-T3,0.55; T4-T3, 0.51; and T4-T2, 0.46). These values prove that it is simple to find a differencegreater than 0.5 ◦C. Accordingly, it is very difficult to determine the real body temperatureof a person using a random contactless infrared thermometer when the operator visuallyestimates the body–device distance and angle.
For the intra-rater reliability (i.e., intra-observer variability/repeatability), we evalu-ated the average differences between the maximum (i.e., Max) and minimum (i.e., Min)values obtained for each device. The average Max-Min differences for Subject 1 were: 0.13for T1, 1.00 for T2, 0.27 for T3, and 0.20 for T4; for Subject 2, 0.33 for T1, 1.23 for T2, 0.20 forT3, and 0.20 for T4; and for Subject 3, 0.43 for T1, 0.73 for T2, 0.16 for T3, and 0.16 for T4.This shows that half of the devices provided significantly different measurements with a defacto difference higher than 0.2 ◦C, as declared in the datasheet, when used to acquire thetemperature from the same person multiple times by visually evaluating the body–devicedistance and angle.
Sensors 2021, 21, 3794 10 of 28Sensors 2021, 21, x FOR PEER REVIEW 11 of 27
Figure 3. Visual representation of the temperature data (reported on the x-axis in °C) collected during the inter- and intra-rater reliability experiment. For each replicate, 10 measurements for each thermometer were acquired while always acquiring only one measurement at a time for each to ensure a slightly different distance and angle between the measurements acquired using the same thermometer; (a) Subject 1, (b) Subject 2, and (c) Subject 3 values.
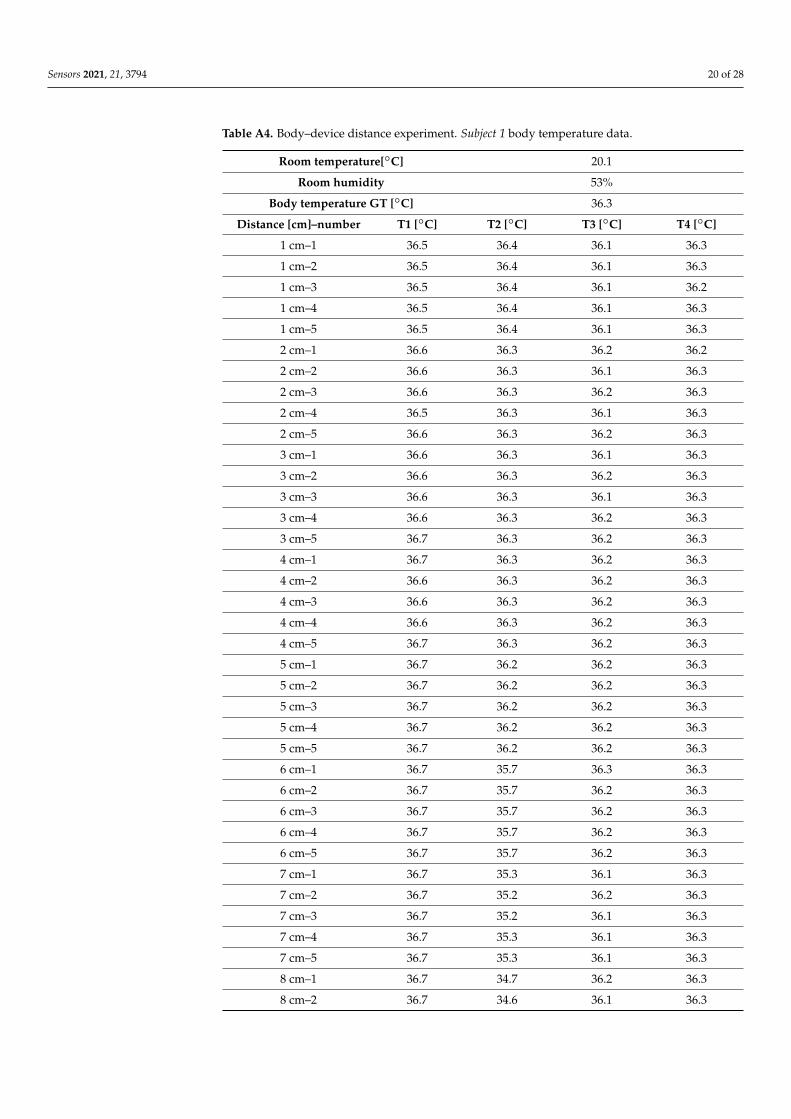
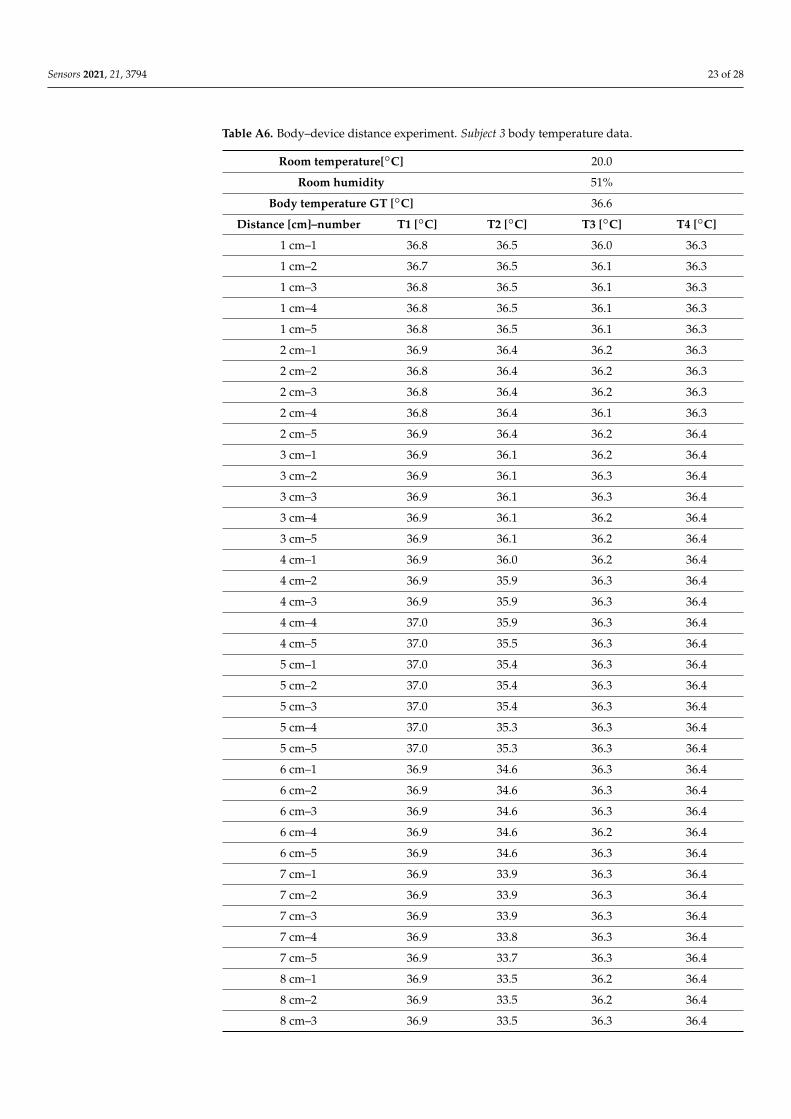
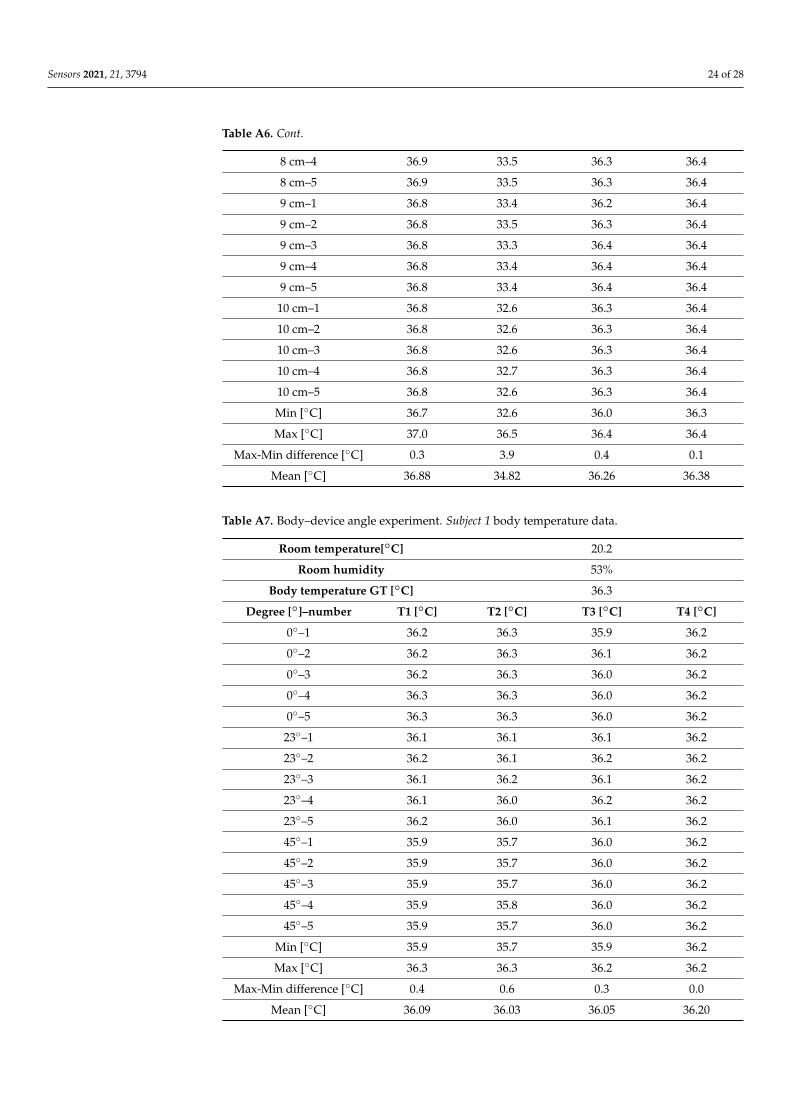
3.2. Body—Device Distance Experiment: Results Tables A4–A6 provide the values obtained by analysing the body temperatures of
Subject 1, Subject 2, and Subject 3, respectively (reported in °C). The same values are also visually represented in the graphs provided in Figure 4. Notably, during this experiment, (a) the body–device distance was modified to assess the corresponding fluctuations in measurements; moreover, (b) we did not filter the data to show the de facto expected values, especially when a single measurement was acquired. Furthermore, we again acquired measurements at 10 different distances within a range of only 10 cm to illustrate that even a small difference in position can strongly affect the measurement. All values are in °C, except when specifically reported otherwise.
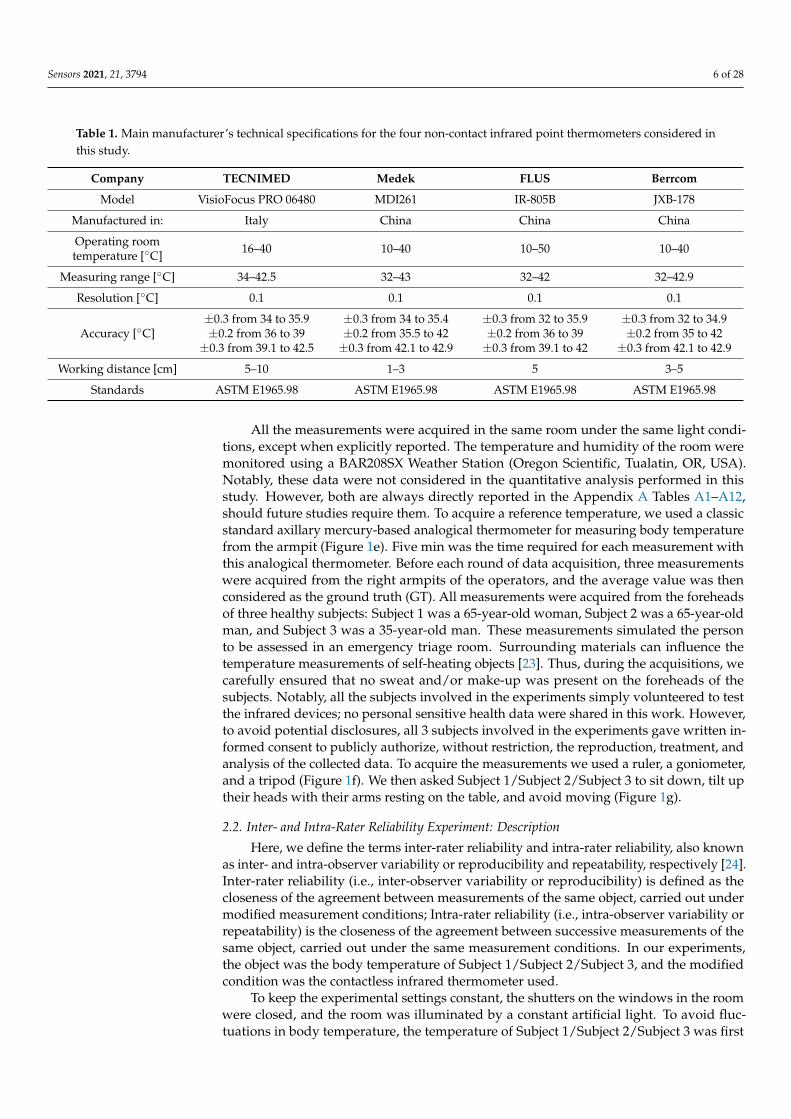
Figure 3. Visual representation of the temperature data (reported on the x-axis in ◦C) collected during the inter- and intra-rater reliability experiment. For each replicate, 10 measurements for each thermometer were acquired while always acquiringonly one measurement at a time for each to ensure a slightly different distance and angle between the measurementsacquired using the same thermometer; (a) Subject 1, (b) Subject 2, and (c) Subject 3 values.
3.2. Body—Device Distance Experiment: Results
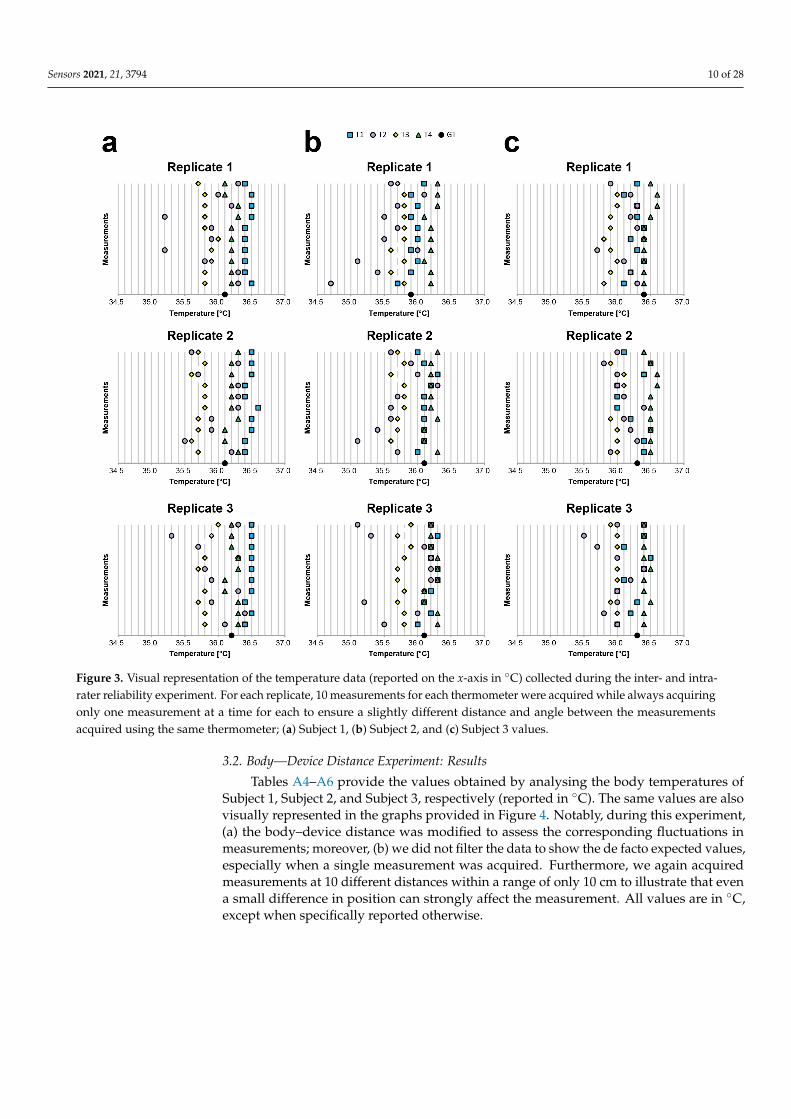
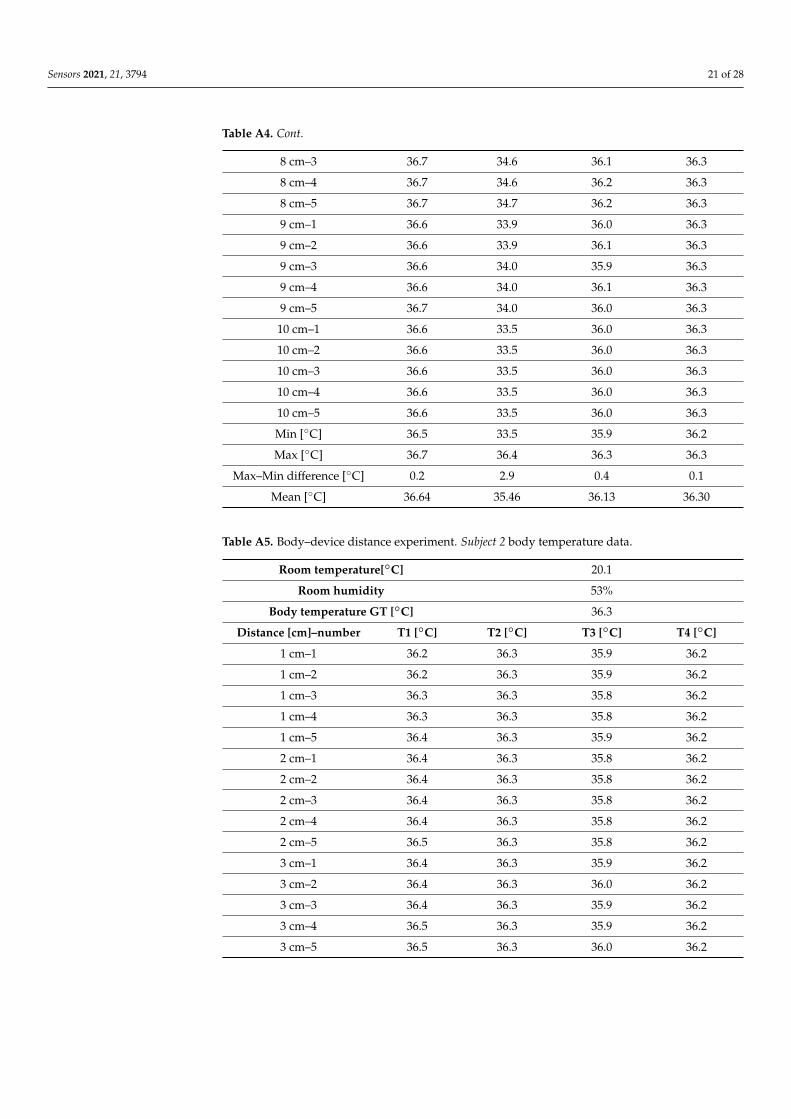
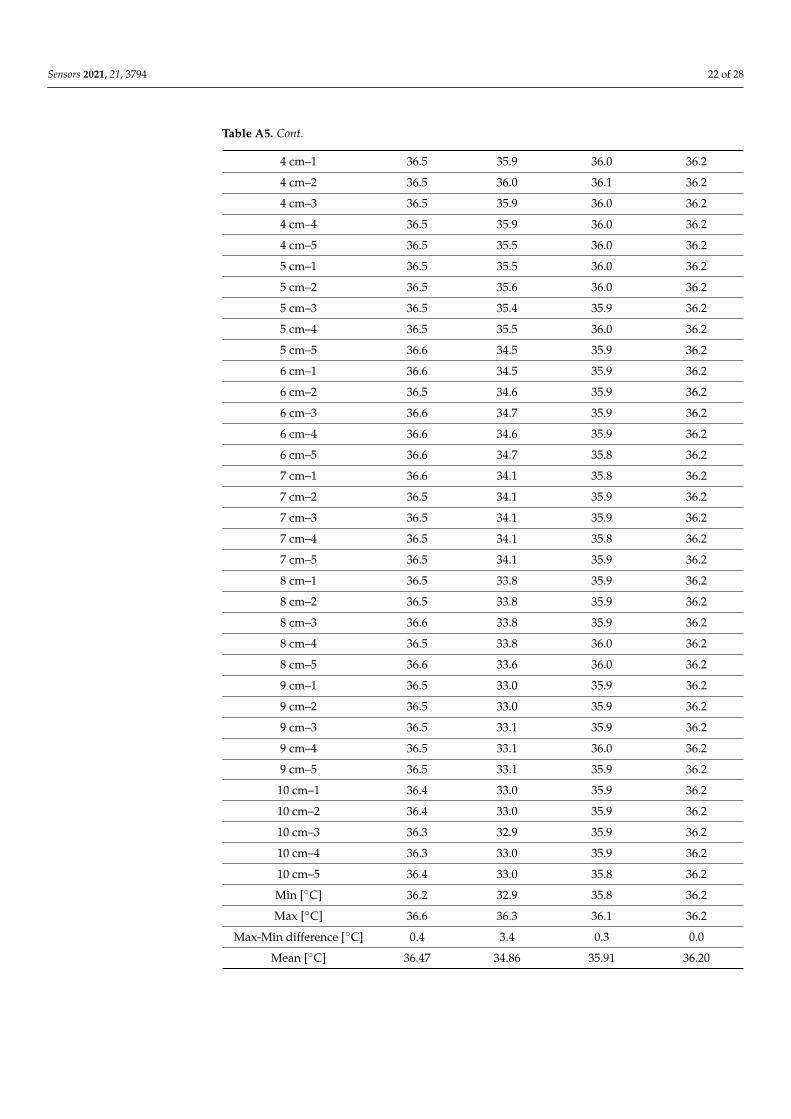
Tables A4–A6 provide the values obtained by analysing the body temperatures ofSubject 1, Subject 2, and Subject 3, respectively (reported in ◦C). The same values are alsovisually represented in the graphs provided in Figure 4. Notably, during this experiment,(a) the body–device distance was modified to assess the corresponding fluctuations inmeasurements; moreover, (b) we did not filter the data to show the de facto expected values,especially when a single measurement was acquired. Furthermore, we again acquiredmeasurements at 10 different distances within a range of only 10 cm to illustrate that evena small difference in position can strongly affect the measurement. All values are in ◦C,except when specifically reported otherwise.
Sensors 2021, 21, 3794 11 of 28Sensors 2021, 21, x FOR PEER REVIEW 12 of 27
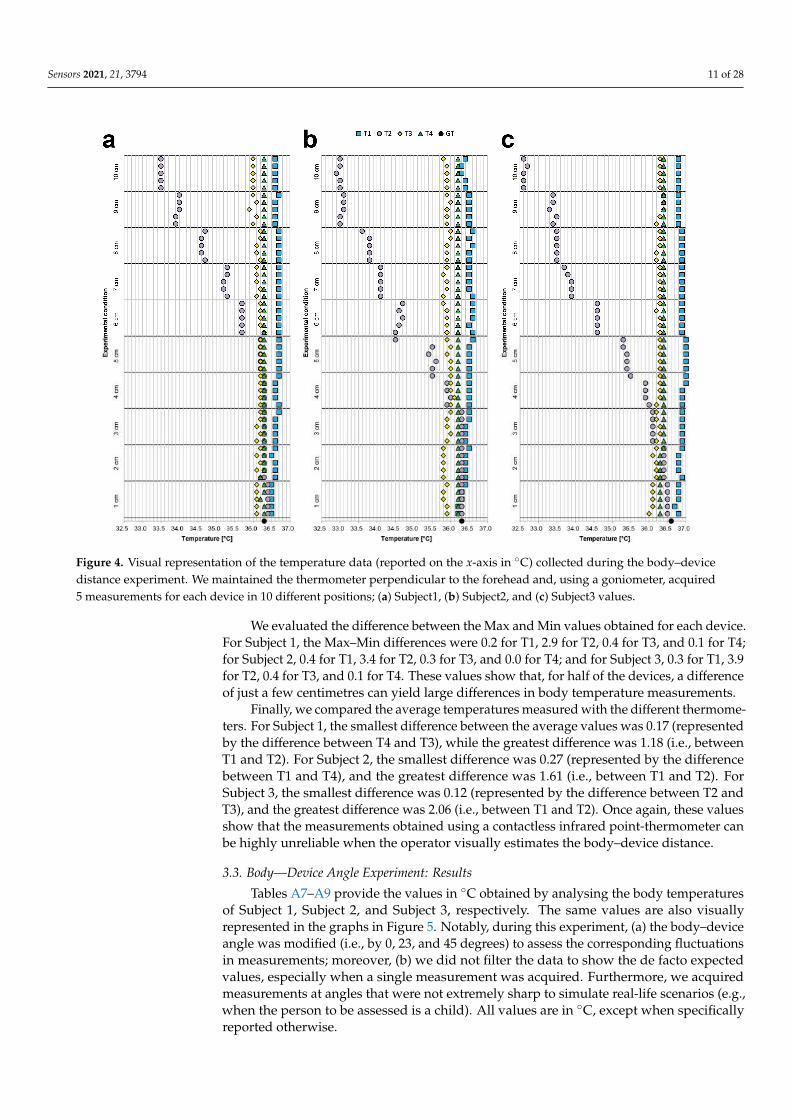
Figure 4. Visual representation of the temperature data (reported on the x-axis in °C) collected during the body–device distance experiment. We maintained the thermometer perpendicular to the forehead and, using a goniometer, acquired 5 measurements for each device in 10 different positions; (a) Subject1, (b) Subject2, and (c) Subject3 values.
We evaluated the difference between the Max and Min values obtained for each device. For Subject 1, the Max–Min differences were 0.2 for T1, 2.9 for T2, 0.4 for T3, and 0.1 for T4; for Subject 2, 0.4 for T1, 3.4 for T2, 0.3 for T3, and 0.0 for T4; and for Subject 3, 0.3 for T1, 3.9 for T2, 0.4 for T3, and 0.1 for T4. These values show that, for half of the devices, a difference of just a few centimetres can yield large differences in body temperature measurements.
Finally, we compared the average temperatures measured with the different thermometers. For Subject 1, the smallest difference between the average values was 0.17 (represented by the difference between T4 and T3), while the greatest difference was 1.18 (i.e., between T1 and T2). For Subject 2, the smallest difference was 0.27 (represented by the difference between T1 and T4), and the greatest difference was 1.61 (i.e., between T1 and T2). For Subject 3, the smallest difference was 0.12 (represented by the difference between T2 and T3), and the greatest difference was 2.06 (i.e., between T1 and T2). Once again, these values show that the measurements obtained using a contactless infrared point-thermometer can be highly unreliable when the operator visually estimates the body–device distance.
3.3. Body—Device Angle Experiment: Results Tables A7–A9 provide the values in °C obtained by analysing the body temperatures
of Subject 1, Subject 2, and Subject 3, respectively. The same values are also visually represented in the graphs in Figure 5. Notably, during this experiment, (a) the body–device angle was modified (i.e., by 0, 23, and 45 degrees) to assess the corresponding fluctuations in measurements; moreover, (b) we did not filter the data to show the de facto expected values, especially when a single measurement was acquired. Furthermore, we acquired measurements at angles that were not extremely sharp to simulate real-life
Figure 4. Visual representation of the temperature data (reported on the x-axis in ◦C) collected during the body–devicedistance experiment. We maintained the thermometer perpendicular to the forehead and, using a goniometer, acquired5 measurements for each device in 10 different positions; (a) Subject1, (b) Subject2, and (c) Subject3 values.
We evaluated the difference between the Max and Min values obtained for each device.For Subject 1, the Max–Min differences were 0.2 for T1, 2.9 for T2, 0.4 for T3, and 0.1 for T4;for Subject 2, 0.4 for T1, 3.4 for T2, 0.3 for T3, and 0.0 for T4; and for Subject 3, 0.3 for T1, 3.9for T2, 0.4 for T3, and 0.1 for T4. These values show that, for half of the devices, a differenceof just a few centimetres can yield large differences in body temperature measurements.
Finally, we compared the average temperatures measured with the different thermome-ters. For Subject 1, the smallest difference between the average values was 0.17 (representedby the difference between T4 and T3), while the greatest difference was 1.18 (i.e., betweenT1 and T2). For Subject 2, the smallest difference was 0.27 (represented by the differencebetween T1 and T4), and the greatest difference was 1.61 (i.e., between T1 and T2). ForSubject 3, the smallest difference was 0.12 (represented by the difference between T2 andT3), and the greatest difference was 2.06 (i.e., between T1 and T2). Once again, these valuesshow that the measurements obtained using a contactless infrared point-thermometer canbe highly unreliable when the operator visually estimates the body–device distance.
3.3. Body—Device Angle Experiment: Results
Tables A7–A9 provide the values in ◦C obtained by analysing the body temperaturesof Subject 1, Subject 2, and Subject 3, respectively. The same values are also visuallyrepresented in the graphs in Figure 5. Notably, during this experiment, (a) the body–deviceangle was modified (i.e., by 0, 23, and 45 degrees) to assess the corresponding fluctuationsin measurements; moreover, (b) we did not filter the data to show the de facto expectedvalues, especially when a single measurement was acquired. Furthermore, we acquiredmeasurements at angles that were not extremely sharp to simulate real-life scenarios (e.g.,when the person to be assessed is a child). All values are in ◦C, except when specificallyreported otherwise.
Sensors 2021, 21, 3794 12 of 28
Sensors 2021, 21, x FOR PEER REVIEW 13 of 27
scenarios (e.g., when the person to be assessed is a child). All values are in °C, except when specifically reported otherwise.
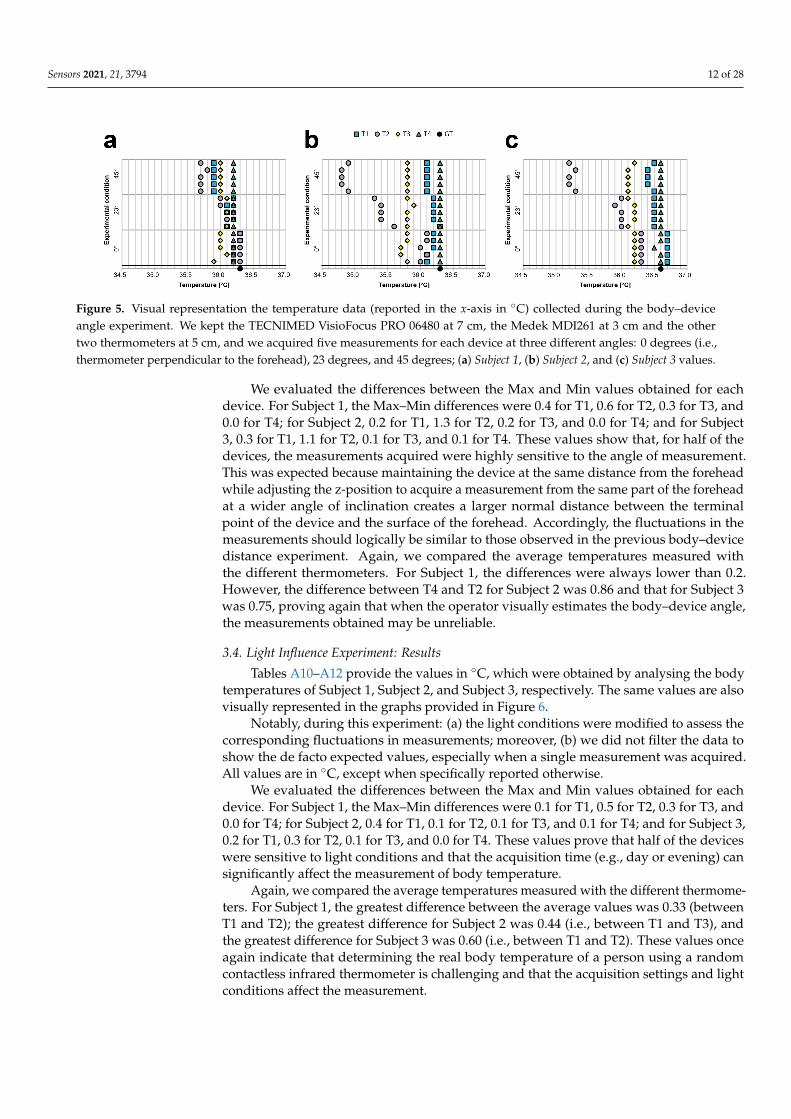
Figure 5. Visual representation the temperature data (reported in the x-axis in °C) collected during the body–device angle experiment. We kept the TECNIMED VisioFocus PRO 06480 at 7 cm, the Medek MDI261 at 3 cm and the other two thermometers at 5 cm, and we acquired five measurements for each device at three different angles: 0 degrees (i.e., thermometer perpendicular to the forehead), 23 degrees, and 45 degrees; (a) Subject 1, (b) Subject 2, and (c) Subject 3 values.
We evaluated the differences between the Max and Min values obtained for each device. For Subject 1, the Max–Min differences were 0.4 for T1, 0.6 for T2, 0.3 for T3, and 0.0 for T4; for Subject 2, 0.2 for T1, 1.3 for T2, 0.2 for T3, and 0.0 for T4; and for Subject 3, 0.3 for T1, 1.1 for T2, 0.1 for T3, and 0.1 for T4. These values show that, for half of the devices, the measurements acquired were highly sensitive to the angle of measurement. This was expected because maintaining the device at the same distance from the forehead while adjusting the z-position to acquire a measurement from the same part of the forehead at a wider angle of inclination creates a larger normal distance between the terminal point of the device and the surface of the forehead. Accordingly, the fluctuations in the measurements should logically be similar to those observed in the previous body–device distance experiment. Again, we compared the average temperatures measured with the different thermometers. For Subject 1, the differences were always lower than 0.2. However, the difference between T4 and T2 for Subject 2 was 0.86 and that for Subject 3 was 0.75, proving again that when the operator visually estimates the body–device angle, the measurements obtained may be unreliable.
3.4. Light Influence Experiment: Results Tables A10–A12 provide the values in °C, which were obtained by analysing the
body temperatures of Subject 1, Subject 2, and Subject 3, respectively. The same values are also visually represented in the graphs provided in Figure 6.
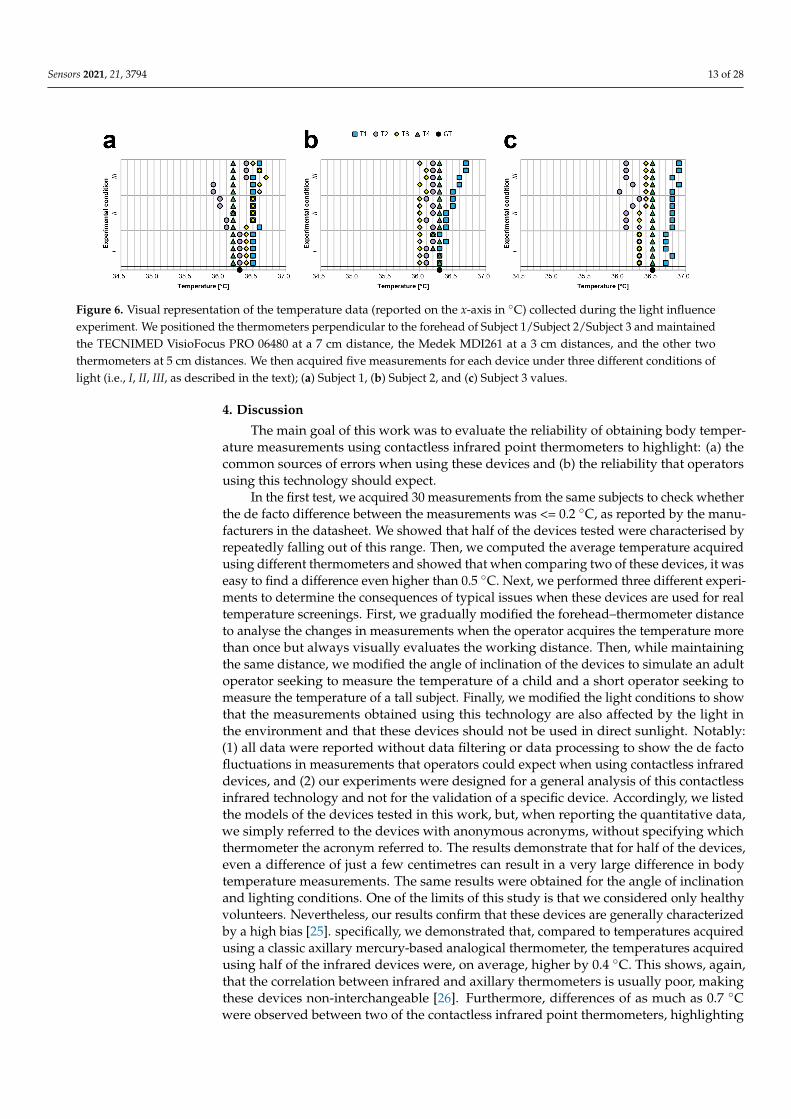
Figure 6. Visual representation of the temperature data (reported on the x-axis in °C) collected during the light influence experiment. We positioned the thermometers perpendicular to the forehead of Subject 1/Subject 2/Subject 3 and maintained the TECNIMED VisioFocus PRO 06480 at a 7 cm distance, the Medek MDI261 at a 3 cm distances, and the other two thermometers at 5 cm distances. We then acquired five measurements for each device under three different conditions of light (i.e., I, II, III, as described in the text); (a) Subject 1, (b) Subject 2, and (c) Subject 3 values.
Figure 5. Visual representation the temperature data (reported in the x-axis in ◦C) collected during the body–deviceangle experiment. We kept the TECNIMED VisioFocus PRO 06480 at 7 cm, the Medek MDI261 at 3 cm and the othertwo thermometers at 5 cm, and we acquired five measurements for each device at three different angles: 0 degrees (i.e.,thermometer perpendicular to the forehead), 23 degrees, and 45 degrees; (a) Subject 1, (b) Subject 2, and (c) Subject 3 values.
We evaluated the differences between the Max and Min values obtained for eachdevice. For Subject 1, the Max–Min differences were 0.4 for T1, 0.6 for T2, 0.3 for T3, and0.0 for T4; for Subject 2, 0.2 for T1, 1.3 for T2, 0.2 for T3, and 0.0 for T4; and for Subject3, 0.3 for T1, 1.1 for T2, 0.1 for T3, and 0.1 for T4. These values show that, for half of thedevices, the measurements acquired were highly sensitive to the angle of measurement.This was expected because maintaining the device at the same distance from the foreheadwhile adjusting the z-position to acquire a measurement from the same part of the foreheadat a wider angle of inclination creates a larger normal distance between the terminalpoint of the device and the surface of the forehead. Accordingly, the fluctuations in themeasurements should logically be similar to those observed in the previous body–devicedistance experiment. Again, we compared the average temperatures measured withthe different thermometers. For Subject 1, the differences were always lower than 0.2.However, the difference between T4 and T2 for Subject 2 was 0.86 and that for Subject 3was 0.75, proving again that when the operator visually estimates the body–device angle,the measurements obtained may be unreliable.
3.4. Light Influence Experiment: Results
Tables A10–A12 provide the values in ◦C, which were obtained by analysing the bodytemperatures of Subject 1, Subject 2, and Subject 3, respectively. The same values are alsovisually represented in the graphs provided in Figure 6.
Notably, during this experiment: (a) the light conditions were modified to assess thecorresponding fluctuations in measurements; moreover, (b) we did not filter the data toshow the de facto expected values, especially when a single measurement was acquired.All values are in ◦C, except when specifically reported otherwise.
We evaluated the differences between the Max and Min values obtained for eachdevice. For Subject 1, the Max–Min differences were 0.1 for T1, 0.5 for T2, 0.3 for T3, and0.0 for T4; for Subject 2, 0.4 for T1, 0.1 for T2, 0.1 for T3, and 0.1 for T4; and for Subject 3,0.2 for T1, 0.3 for T2, 0.1 for T3, and 0.0 for T4. These values prove that half of the deviceswere sensitive to light conditions and that the acquisition time (e.g., day or evening) cansignificantly affect the measurement of body temperature.
Again, we compared the average temperatures measured with the different thermome-ters. For Subject 1, the greatest difference between the average values was 0.33 (betweenT1 and T2); the greatest difference for Subject 2 was 0.44 (i.e., between T1 and T3), andthe greatest difference for Subject 3 was 0.60 (i.e., between T1 and T2). These values onceagain indicate that determining the real body temperature of a person using a randomcontactless infrared thermometer is challenging and that the acquisition settings and lightconditions affect the measurement.
Sensors 2021, 21, 3794 13 of 28
Sensors 2021, 21, x FOR PEER REVIEW 13 of 27
scenarios (e.g., when the person to be assessed is a child). All values are in °C, except when specifically reported otherwise.
Figure 5. Visual representation the temperature data (reported in the x-axis in °C) collected during the body–device angle experiment. We kept the TECNIMED VisioFocus PRO 06480 at 7 cm, the Medek MDI261 at 3 cm and the other two thermometers at 5 cm, and we acquired five measurements for each device at three different angles: 0 degrees (i.e., thermometer perpendicular to the forehead), 23 degrees, and 45 degrees; (a) Subject 1, (b) Subject 2, and (c) Subject 3 values.
We evaluated the differences between the Max and Min values obtained for each device. For Subject 1, the Max–Min differences were 0.4 for T1, 0.6 for T2, 0.3 for T3, and 0.0 for T4; for Subject 2, 0.2 for T1, 1.3 for T2, 0.2 for T3, and 0.0 for T4; and for Subject 3, 0.3 for T1, 1.1 for T2, 0.1 for T3, and 0.1 for T4. These values show that, for half of the devices, the measurements acquired were highly sensitive to the angle of measurement. This was expected because maintaining the device at the same distance from the forehead while adjusting the z-position to acquire a measurement from the same part of the forehead at a wider angle of inclination creates a larger normal distance between the terminal point of the device and the surface of the forehead. Accordingly, the fluctuations in the measurements should logically be similar to those observed in the previous body–device distance experiment. Again, we compared the average temperatures measured with the different thermometers. For Subject 1, the differences were always lower than 0.2. However, the difference between T4 and T2 for Subject 2 was 0.86 and that for Subject 3 was 0.75, proving again that when the operator visually estimates the body–device angle, the measurements obtained may be unreliable.
3.4. Light Influence Experiment: Results Tables A10–A12 provide the values in °C, which were obtained by analysing the
body temperatures of Subject 1, Subject 2, and Subject 3, respectively. The same values are also visually represented in the graphs provided in Figure 6.
Figure 6. Visual representation of the temperature data (reported on the x-axis in °C) collected during the light influence experiment. We positioned the thermometers perpendicular to the forehead of Subject 1/Subject 2/Subject 3 and maintained the TECNIMED VisioFocus PRO 06480 at a 7 cm distance, the Medek MDI261 at a 3 cm distances, and the other two thermometers at 5 cm distances. We then acquired five measurements for each device under three different conditions of light (i.e., I, II, III, as described in the text); (a) Subject 1, (b) Subject 2, and (c) Subject 3 values.
Figure 6. Visual representation of the temperature data (reported on the x-axis in ◦C) collected during the light influenceexperiment. We positioned the thermometers perpendicular to the forehead of Subject 1/Subject 2/Subject 3 and maintainedthe TECNIMED VisioFocus PRO 06480 at a 7 cm distance, the Medek MDI261 at a 3 cm distances, and the other twothermometers at 5 cm distances. We then acquired five measurements for each device under three different conditions oflight (i.e., I, II, III, as described in the text); (a) Subject 1, (b) Subject 2, and (c) Subject 3 values.
4. Discussion
The main goal of this work was to evaluate the reliability of obtaining body temper-ature measurements using contactless infrared point thermometers to highlight: (a) thecommon sources of errors when using these devices and (b) the reliability that operatorsusing this technology should expect.
In the first test, we acquired 30 measurements from the same subjects to check whetherthe de facto difference between the measurements was <= 0.2 ◦C, as reported by the manu-facturers in the datasheet. We showed that half of the devices tested were characterised byrepeatedly falling out of this range. Then, we computed the average temperature acquiredusing different thermometers and showed that when comparing two of these devices, it waseasy to find a difference even higher than 0.5 ◦C. Next, we performed three different experi-ments to determine the consequences of typical issues when these devices are used for realtemperature screenings. First, we gradually modified the forehead–thermometer distanceto analyse the changes in measurements when the operator acquires the temperature morethan once but always visually evaluates the working distance. Then, while maintainingthe same distance, we modified the angle of inclination of the devices to simulate an adultoperator seeking to measure the temperature of a child and a short operator seeking tomeasure the temperature of a tall subject. Finally, we modified the light conditions to showthat the measurements obtained using this technology are also affected by the light inthe environment and that these devices should not be used in direct sunlight. Notably:(1) all data were reported without data filtering or data processing to show the de factofluctuations in measurements that operators could expect when using contactless infrareddevices, and (2) our experiments were designed for a general analysis of this contactlessinfrared technology and not for the validation of a specific device. Accordingly, we listedthe models of the devices tested in this work, but, when reporting the quantitative data,we simply referred to the devices with anonymous acronyms, without specifying whichthermometer the acronym referred to. The results demonstrate that for half of the devices,even a difference of just a few centimetres can result in a very large difference in bodytemperature measurements. The same results were obtained for the angle of inclinationand lighting conditions. One of the limits of this study is that we considered only healthyvolunteers. Nevertheless, our results confirm that these devices are generally characterizedby a high bias [25]. specifically, we demonstrated that, compared to temperatures acquiredusing a classic axillary mercury-based analogical thermometer, the temperatures acquiredusing half of the infrared devices were, on average, higher by 0.4 ◦C. This shows, again,that the correlation between infrared and axillary thermometers is usually poor, makingthese devices non-interchangeable [26]. Furthermore, differences of as much as 0.7 ◦Cwere observed between two of the contactless infrared point thermometers, highlighting
Sensors 2021, 21, 3794 14 of 28
the difficulty in acquiring real body temperatures and suggesting that authorities shouldapprove only devices with validated accuracy for use in population screening.
This analysis appears to invalidate several temperature screening methods typicallyperformed at the entrances to indoor public places, with related costs for the relevantpublic structures. However, our findings highlight important considerations for operatorsthat could help improve the reliability of contactless infrared point thermometers: (1)It is important to inform the operator of the working distance reported in the device’sdatasheet and to emphasize the importance of carefully evaluating the forehead–devicedistance before acquiring each measurement. (2) It is important to keep the device per-fectly perpendicular to the forehead of the adult/child to be assessed. (3) As the light ofthe environment is an important factor for accuracy, it is better to acquire temperaturemeasurements in indoor areas illuminated by constant artificial lighting. If an operatorfails to account for these three factors, the data obtained should be considered only asroughly qualitative results to better understand whether a person has a high fever, ratherthan accurate quantitative values.
5. Conclusions
In this work, we tested several contactless infrared point thermometers in differentsettings that simulate real-life public scenarios. The analyses in this work are not intendedto represent a specific validation of contactless infrared devices but merely to highlightthe observation that even the slightly incorrect use of an infrared thermometer can lead tosubstantially unreliable measurements of body temperature. However, the experimentsperformed show the following:
1) Acquiring measurements without carefully monitoring the working distance andangle of inclination can lead to a large discrepancy between subsequent body temper-ature estimations;
2) Light conditions influence the measurements, and, accordingly, the ambient radiationin the assessment room should be monitored, e.g., by using constant artificial lights.
The data obtained in this work can thus support authorities in better organisingemergency triage rooms and temperature checkpoints in the following ways:
1) By suggesting that operators use only thermometers from a list of approved devices;2) By using public information methods (e.g., advertisements) to inform operators about
the correct working distance, angle of inclination, and light conditions to obtain morereliable measurements.
The knowledge of these cautions give both operators and the individuals beingscreened a better understanding of the de facto limits of non-contact infrared devices. Inaddition, our data support the conclusions of Dell’Isola et al. [22] that, to improve thereliability of screenings to prevent the spread of COVID-19 disease, proposed the following:
• To punctually establish the measurement conditions and method;• To set a fixed temperature threshold reference, by considering an assigned measure-
ment body site;• To accurately estimate the measurement uncertainty, taking into account the main
contributions at the real operative measurement conditions;• To transpose the threshold reference value as a function of the body site used;
To perform a double-step measurement protocol consisting of (a) a first step, with anoncontact body temperature measurement, and (b) a second step, with a further contactbody temperature measurement when the measured value falls within the uncertainty zone.
This procedure would help the relevant authorities to obtain more reliable bodytemperature data to protect people from the spread of the SARS-CoV-2 virus and fu-ture infections.
In conclusion, although our findings show that contactless infrared point thermome-ters are a highly useful tool to screen the body temperatures of subjects, the data obtainedconfirm that such thermometers must be used with caution because of their generally
Sensors 2021, 21, 3794 15 of 28
high bias. In general, it would be more appropriate to consider these instruments asqualitative devices rather than as a means of accurately determining absolute body tem-perature. However, waiting for the prospective subject to become acclimatized to beingindoors and carefully considering the working distance, angle of inclination, and lightconditions may effectively improve the reliability of the measurements to also allow forquantitative considerations.
Author Contributions: Conceptualization: F.P., G.M. and A.C.; data curation: F.P.; formal analysis:F.P. and A.C.; funding acquisition: G.M. and A.C.; investigation, F.P. and A.C.; methodology: F.P.and A.C.; project administration: A.C.; resources: G.M. and A.C.; supervision: A.C.; validation: F.P.;visualization: F.P.; writing—original draft: F.P. and A.C.; writing and review and editing: G.M. Allauthors have read and agreed to the published version of the manuscript.
Funding: This research received no funding.
Institutional Review Board Statement: Not applicable.
Informed Consent Statement: Not applicable.
Data Availability Statement: The authors confirm that all the data supporting the findings of thisstudy are included within the article.
Ethics Statements: This is not a clinical study. No patients took part, and the subjects involved in theexperiments were volunteers who simply tested the infrared devices. We did not divulge personalhealth data or sensitive data, and the experiments were designed merely to test the devices. However,all subjects involved in the experiments gave their written informed consent authorizing the use ofthe collected data. Accordingly, informed consent was obtained from all subjects involved in thestudy. A copy of the consent forms can be requested from the Corresponding Author.
Acknowledgments: We would like to thank Mattia Cantagalli (Faenza, RA, Italy), Paola Burioli (IRSTIRCCS, Meldola, FC, Italy), and Roberto Vespignani (IRST IRCCS, Meldola, FC, Italy) for sharingimportant opinions about infrared devices; Maria Laura Neri (IRST IRCCS, Meldola, FC, Italy) andStefania Venturi (IRST IRCCS, Meldola, FC, Italy) for assistance in analysing the devices; LambertoPiccinini (Faenza, RA, Italy) and Fabrizia Fabbrini (Faenza, RA, Italy) for contributions in performingthe experiments.
Conflicts of Interest: The authors declare no conflict of interest.
Appendix A
Table A1. Intra- and inter-rater reliability experiment. Subject 1 body temperature data.
Room temperature [◦C] 19.8
Room humidity 53%
Replicate 1
Body temperature GT [◦C] 36.1
Number T1 [◦C] T2 [◦C] T3 [◦C] T4 [◦C]
1 36.5 36.3 35.8 36.2
2 36.4 36.3 35.8 36.2
3 36.4 35.8 35.9 36.2
4 36.4 35.2 35.9 36.2
5 36.4 35.9 36.0 36.2
6 36.4 35.9 35.8 36.2
7 36.5 35.2 35.8 36.3
8 36.5 36.2 35.8 36.3
9 36.5 36.0 35.8 36.1
Sensors 2021, 21, 3794 16 of 28
Table A1. Cont.
10 36.4 36.3 35.7 36.1
Min [◦C] 36.4 35.2 35.7 36.1
Max [◦C] 36.5 36.3 36.0 36.3
Max–Min difference [◦C] 0.1 1.1 0.3 0.2
Mean [◦C] 36.44 35.91 35.83 36.20
GT–Mean difference [◦C] −0.34 0.19 0.27 −0.10
Replicate 2
Body temperature GT [◦C] 36.1
Number T1 [◦C] T2 [◦C] T3 [◦C] T4 [◦C]
1 36.4 36.2 35.7 36.3
2 36.4 35.5 35.6 36.1
3 36.5 35.9 35.7 36.1
4 36.5 35.9 35.7 36.3
5 36.6 36.3 35.8 36.2
6 36.4 36.3 35.8 36.2
7 36.4 36.3 35.8 36.2
8 36.5 35.7 35.6 36.2
9 36.5 36.3 35.8 36.2
10 36.5 35.6 35.7 36.3
Min [◦C] 36.4 35.5 35.6 36.1
Max [◦C] 36.6 36.3 35.8 36.3
Max–Min difference [◦C] 0.2 0.8 0.2 0.2
Mean [◦C] 36.47 36.00 35.72 36.21
GT–Mean difference [◦C] −0.37 0.10 0.38 −0.11
Replicate 3
Body temperature GT [◦C] 36.2
Number T1 [◦C] T2 [◦C] T3 [◦C] T4 [◦C]
1 36.4 36.1 35.8 36.3
2 36.5 36.4 35.8 36.3
3 36.4 35.9 35.7 36.3
4 36.5 36.3 35.8 36.1
5 36.5 35.9 35.9 36.1
6 36.5 35.8 35.7 36.3
7 36.5 36.3 35.8 36.3
8 36.5 35.7 35.7 36.2
9 36.5 35.3 35.9 36.2
10 36.5 36.3 36.0 36.2
Min [◦C] 36.4 35.3 35.7 36.1
Max [◦C] 36.5 36.4 36.0 36.3
Max–Min difference [◦C] 0.1 1.1 0.3 0.2
Mean [◦C] 36.48 36.00 35.81 36.23
GT–Mean difference [◦C] −0.28 0.20 0.39 −0.03
Sensors 2021, 21, 3794 17 of 28
Table A2. Intra- and inter-rater reliability experiment. Subject 2 body temperature data.
Room temperature[◦C] 19.8
Room humidity 53%
Replicate 1
Body temperature GT [◦C] 35.9
Number T1 [◦C] T2 [◦C] T3 [◦C] T4 [◦C]
1 35.7 34.7 35.8 36.2
2 35.9 35.4 35.6 36.2
3 36.0 35.1 35.8 36.1
4 35.9 36.0 35.6 36.2
5 36.0 35.5 35.8 36.2
6 36.0 35.7 35.8 36.2
7 35.9 35.5 35.8 36.1
8 36.0 35.7 35.8 36.3
9 35.9 36.1 35.8 36.3
10 36.1 35.6 35.7 36.3
Min [◦C] 35.7 34.7 35.6 36.1
Max [◦C] 36.1 36.1 35.8 36.3
Max–Min difference [◦C] 0.4 1.4 0.2 0.2
Mean [◦C] 35.94 35.53 35.75 36.21
GT–Mean difference [◦C] −0.04 0.37 0.15 −0.31
Replicate 2
Body temperature GT [◦C] 36.1
Number T1 [◦C] T2 [◦C] T3 [◦C] T4 [◦C]
1 36.0 35.7 35.7 36.3
2 36.1 35.1 35.6 36.1
3 36.1 35.4 35.7 36.1
4 36.1 35.6 35.7 36.3
5 36.1 35.6 35.8 36.2
6 36.1 35.7 35.8 36.2
7 36.2 36.3 35.8 36.2
8 36.3 36.0 35.6 36.2
9 36.1 35.9 35.8 36.2
10 36.0 35.6 35.7 36.3
Min [◦C] 36.0 35.1 35.6 36.1
Max [◦C] 36.3 36.3 35.8 36.3
Max–Min difference [◦C] 0.3 1.2 0.2 0.2
Mean [◦C] 36.11 35.69 35.72 36.21
GT–Mean difference [◦C] −0.01 0.41 0.38 −0.11
Sensors 2021, 21, 3794 18 of 28
Table A2. Cont.
Replicate 3
Body temperature GT [◦C] 36.1
Number T1 [◦C] T2 [◦C] T3 [◦C] T4 [◦C]
1 36.0 35.5 35.8 36.3
2 36.2 36.0 35.8 36.3
3 36.1 35.2 35.7 36.1
4 36.2 36.1 35.8 36.1
5 36.3 36.2 35.7 36.3
6 36.3 36.2 35.7 36.3
7 36.2 36.2 35.8 36.3
8 36.2 36.1 35.9 36.2
9 36.3 35.3 35.7 36.2
10 36.2 35.1 35.9 36.2
Min [◦C] 36.0 35.1 35.7 36.1
Max [◦C] 36.3 36.2 35.9 36.3
Max–Min difference [◦C] 0.3 1.1 0.2 0.2
Mean [◦C] 36.20 35.79 35.78 36.23
GT–Mean difference [◦C] −0.10 0.31 0.32 −0.13
Table A3. Intra- and inter-rater reliability experiment. Subject 3 body temperature data.
Room temperature[◦C] 20.0
Room humidity 51%
Replicate 1
Body temperature GT [◦C] 36.4
Number T1 [◦C] T2 [◦C] T3 [◦C] T4 [◦C]
1 36.1 36.3 35.8 36.4
2 36.2 36.2 35.9 36.4
3 36.4 36.1 36.0 36.4
4 36.3 35.7 35.9 36.4
5 36.2 36.4 35.8 36.4
6 36.4 36.3 35.9 36.4
7 36.3 36.2 35.9 36.5
8 36.3 36.3 36.0 36.6
9 36.1 36.2 36.0 36.6
10 36.3 35.9 35.9 36.5
Min [◦C] 36.1 35.7 35.8 36.4
Max [◦C] 36.4 36.4 36.0 36.6
Max–Min difference [◦C] 0.3 0.7 0.2 0.2
Mean [◦C] 36.26 36.16 35.91 36.46
GT–Mean difference [◦C] 0.14 0.24 0.49 −0.06
Sensors 2021, 21, 3794 19 of 28
Table A3. Cont.
Replicate 2
Body temperature GT [◦C] 36.3
Number T1 [◦C] T2 [◦C] T3 [◦C] T4 [◦C]
1 36.4 35.9 36.0 36.5
2 36.4 36.3 36.0 36.5
3 36.5 36.2 36.0 36.5
4 36.2 36.1 35.9 36.5
5 36.0 36.4 36.0 36.5
6 36.0 36.1 36.0 36.5
7 36.0 36.0 36.1 36.6
8 36.4 36.0 36.1 36.6
9 36.5 35.8 35.9 36.5
10 36.1 36.0 36.0 36.4
Min [◦C] 36.0 35.8 35.9 36.4
Max [◦C] 36.5 36.4 36.1 36.6
Max–Min difference [◦C] 0.5 0.6 0.2 0.2
Mean [◦C] 36.25 36.08 36.00 36.51
GT–Mean difference [◦C] 0.05 0.22 0.30 −0.21
Replicate 3
Body temperature GT [◦C] 36.3
Number T1 [◦C] T2 [◦C] T3 [◦C] T4 [◦C]
1 36.0 36.0 36.0 36.4
2 36.2 35.8 36.0 36.4
3 36.3 36.0 35.9 36.5
4 36.0 36.0 36.0 36.4
5 36.1 36.2 36.0 36.4
6 36.4 36.4 36.0 36.5
7 36.5 36.0 36.0 36.4
8 36.1 35.7 36.0 36.4
9 36.4 35.5 36.0 36.4
10 36.4 36.0 35.9 36.4
Min [◦C] 36.0 35.5 35.9 36.4
Max [◦C] 36.5 36.4 36.0 36.5
Max–Min difference [◦C] 0.5 0.9 0.1 0.1
Mean [◦C] 36.24 35.96 35.98 36.42
GT–Mean difference [◦C] 0.06 0.34 0.32 −0.12
Sensors 2021, 21, 3794 20 of 28
Table A4. Body–device distance experiment. Subject 1 body temperature data.
Room temperature[◦C] 20.1
Room humidity 53%
Body temperature GT [◦C] 36.3
Distance [cm]–number T1 [◦C] T2 [◦C] T3 [◦C] T4 [◦C]
1 cm–1 36.5 36.4 36.1 36.3
1 cm–2 36.5 36.4 36.1 36.3
1 cm–3 36.5 36.4 36.1 36.2
1 cm–4 36.5 36.4 36.1 36.3
1 cm–5 36.5 36.4 36.1 36.3
2 cm–1 36.6 36.3 36.2 36.2
2 cm–2 36.6 36.3 36.1 36.3
2 cm–3 36.6 36.3 36.2 36.3
2 cm–4 36.5 36.3 36.1 36.3
2 cm–5 36.6 36.3 36.2 36.3
3 cm–1 36.6 36.3 36.1 36.3
3 cm–2 36.6 36.3 36.2 36.3
3 cm–3 36.6 36.3 36.1 36.3
3 cm–4 36.6 36.3 36.2 36.3
3 cm–5 36.7 36.3 36.2 36.3
4 cm–1 36.7 36.3 36.2 36.3
4 cm–2 36.6 36.3 36.2 36.3
4 cm–3 36.6 36.3 36.2 36.3
4 cm–4 36.6 36.3 36.2 36.3
4 cm–5 36.7 36.3 36.2 36.3
5 cm–1 36.7 36.2 36.2 36.3
5 cm–2 36.7 36.2 36.2 36.3
5 cm–3 36.7 36.2 36.2 36.3
5 cm–4 36.7 36.2 36.2 36.3
5 cm–5 36.7 36.2 36.2 36.3
6 cm–1 36.7 35.7 36.3 36.3
6 cm–2 36.7 35.7 36.2 36.3
6 cm–3 36.7 35.7 36.2 36.3
6 cm–4 36.7 35.7 36.2 36.3
6 cm–5 36.7 35.7 36.2 36.3
7 cm–1 36.7 35.3 36.1 36.3
7 cm–2 36.7 35.2 36.2 36.3
7 cm–3 36.7 35.2 36.1 36.3
7 cm–4 36.7 35.3 36.1 36.3
7 cm–5 36.7 35.3 36.1 36.3
8 cm–1 36.7 34.7 36.2 36.3
8 cm–2 36.7 34.6 36.1 36.3
Sensors 2021, 21, 3794 21 of 28
Table A4. Cont.
8 cm–3 36.7 34.6 36.1 36.3
8 cm–4 36.7 34.6 36.2 36.3
8 cm–5 36.7 34.7 36.2 36.3
9 cm–1 36.6 33.9 36.0 36.3
9 cm–2 36.6 33.9 36.1 36.3
9 cm–3 36.6 34.0 35.9 36.3
9 cm–4 36.6 34.0 36.1 36.3
9 cm–5 36.7 34.0 36.0 36.3
10 cm–1 36.6 33.5 36.0 36.3
10 cm–2 36.6 33.5 36.0 36.3
10 cm–3 36.6 33.5 36.0 36.3
10 cm–4 36.6 33.5 36.0 36.3
10 cm–5 36.6 33.5 36.0 36.3
Min [◦C] 36.5 33.5 35.9 36.2
Max [◦C] 36.7 36.4 36.3 36.3
Max–Min difference [◦C] 0.2 2.9 0.4 0.1
Mean [◦C] 36.64 35.46 36.13 36.30
Table A5. Body–device distance experiment. Subject 2 body temperature data.
Room temperature[◦C] 20.1
Room humidity 53%
Body temperature GT [◦C] 36.3
Distance [cm]–number T1 [◦C] T2 [◦C] T3 [◦C] T4 [◦C]
1 cm–1 36.2 36.3 35.9 36.2
1 cm–2 36.2 36.3 35.9 36.2
1 cm–3 36.3 36.3 35.8 36.2
1 cm–4 36.3 36.3 35.8 36.2
1 cm–5 36.4 36.3 35.9 36.2
2 cm–1 36.4 36.3 35.8 36.2
2 cm–2 36.4 36.3 35.8 36.2
2 cm–3 36.4 36.3 35.8 36.2
2 cm–4 36.4 36.3 35.8 36.2
2 cm–5 36.5 36.3 35.8 36.2
3 cm–1 36.4 36.3 35.9 36.2
3 cm–2 36.4 36.3 36.0 36.2
3 cm–3 36.4 36.3 35.9 36.2
3 cm–4 36.5 36.3 35.9 36.2
3 cm–5 36.5 36.3 36.0 36.2
Sensors 2021, 21, 3794 22 of 28
Table A5. Cont.
4 cm–1 36.5 35.9 36.0 36.2
4 cm–2 36.5 36.0 36.1 36.2
4 cm–3 36.5 35.9 36.0 36.2
4 cm–4 36.5 35.9 36.0 36.2
4 cm–5 36.5 35.5 36.0 36.2
5 cm–1 36.5 35.5 36.0 36.2
5 cm–2 36.5 35.6 36.0 36.2
5 cm–3 36.5 35.4 35.9 36.2
5 cm–4 36.5 35.5 36.0 36.2
5 cm–5 36.6 34.5 35.9 36.2
6 cm–1 36.6 34.5 35.9 36.2
6 cm–2 36.5 34.6 35.9 36.2
6 cm–3 36.6 34.7 35.9 36.2
6 cm–4 36.6 34.6 35.9 36.2
6 cm–5 36.6 34.7 35.8 36.2
7 cm–1 36.6 34.1 35.8 36.2
7 cm–2 36.5 34.1 35.9 36.2
7 cm–3 36.5 34.1 35.9 36.2
7 cm–4 36.5 34.1 35.8 36.2
7 cm–5 36.5 34.1 35.9 36.2
8 cm–1 36.5 33.8 35.9 36.2
8 cm–2 36.5 33.8 35.9 36.2
8 cm–3 36.6 33.8 35.9 36.2
8 cm–4 36.5 33.8 36.0 36.2
8 cm–5 36.6 33.6 36.0 36.2
9 cm–1 36.5 33.0 35.9 36.2
9 cm–2 36.5 33.0 35.9 36.2
9 cm–3 36.5 33.1 35.9 36.2
9 cm–4 36.5 33.1 36.0 36.2
9 cm–5 36.5 33.1 35.9 36.2
10 cm–1 36.4 33.0 35.9 36.2
10 cm–2 36.4 33.0 35.9 36.2
10 cm–3 36.3 32.9 35.9 36.2
10 cm–4 36.3 33.0 35.9 36.2
10 cm–5 36.4 33.0 35.8 36.2
Min [◦C] 36.2 32.9 35.8 36.2
Max [◦C] 36.6 36.3 36.1 36.2
Max-Min difference [◦C] 0.4 3.4 0.3 0.0
Mean [◦C] 36.47 34.86 35.91 36.20
Sensors 2021, 21, 3794 23 of 28
Table A6. Body–device distance experiment. Subject 3 body temperature data.
Room temperature[◦C] 20.0
Room humidity 51%
Body temperature GT [◦C] 36.6
Distance [cm]–number T1 [◦C] T2 [◦C] T3 [◦C] T4 [◦C]
1 cm–1 36.8 36.5 36.0 36.3
1 cm–2 36.7 36.5 36.1 36.3
1 cm–3 36.8 36.5 36.1 36.3
1 cm–4 36.8 36.5 36.1 36.3
1 cm–5 36.8 36.5 36.1 36.3
2 cm–1 36.9 36.4 36.2 36.3
2 cm–2 36.8 36.4 36.2 36.3
2 cm–3 36.8 36.4 36.2 36.3
2 cm–4 36.8 36.4 36.1 36.3
2 cm–5 36.9 36.4 36.2 36.4
3 cm–1 36.9 36.1 36.2 36.4
3 cm–2 36.9 36.1 36.3 36.4
3 cm–3 36.9 36.1 36.3 36.4
3 cm–4 36.9 36.1 36.2 36.4
3 cm–5 36.9 36.1 36.2 36.4
4 cm–1 36.9 36.0 36.2 36.4
4 cm–2 36.9 35.9 36.3 36.4
4 cm–3 36.9 35.9 36.3 36.4
4 cm–4 37.0 35.9 36.3 36.4
4 cm–5 37.0 35.5 36.3 36.4
5 cm–1 37.0 35.4 36.3 36.4
5 cm–2 37.0 35.4 36.3 36.4
5 cm–3 37.0 35.4 36.3 36.4
5 cm–4 37.0 35.3 36.3 36.4
5 cm–5 37.0 35.3 36.3 36.4
6 cm–1 36.9 34.6 36.3 36.4
6 cm–2 36.9 34.6 36.3 36.4
6 cm–3 36.9 34.6 36.3 36.4
6 cm–4 36.9 34.6 36.2 36.4
6 cm–5 36.9 34.6 36.3 36.4
7 cm–1 36.9 33.9 36.3 36.4
7 cm–2 36.9 33.9 36.3 36.4
7 cm–3 36.9 33.9 36.3 36.4
7 cm–4 36.9 33.8 36.3 36.4
7 cm–5 36.9 33.7 36.3 36.4
8 cm–1 36.9 33.5 36.2 36.4
8 cm–2 36.9 33.5 36.2 36.4
8 cm–3 36.9 33.5 36.3 36.4
Sensors 2021, 21, 3794 24 of 28
Table A6. Cont.
8 cm–4 36.9 33.5 36.3 36.4
8 cm–5 36.9 33.5 36.3 36.4
9 cm–1 36.8 33.4 36.2 36.4
9 cm–2 36.8 33.5 36.3 36.4
9 cm–3 36.8 33.3 36.4 36.4
9 cm–4 36.8 33.4 36.4 36.4
9 cm–5 36.8 33.4 36.4 36.4
10 cm–1 36.8 32.6 36.3 36.4
10 cm–2 36.8 32.6 36.3 36.4
10 cm–3 36.8 32.6 36.3 36.4
10 cm–4 36.8 32.7 36.3 36.4
10 cm–5 36.8 32.6 36.3 36.4
Min [◦C] 36.7 32.6 36.0 36.3
Max [◦C] 37.0 36.5 36.4 36.4
Max-Min difference [◦C] 0.3 3.9 0.4 0.1
Mean [◦C] 36.88 34.82 36.26 36.38
Table A7. Body–device angle experiment. Subject 1 body temperature data.
Room temperature[◦C] 20.2
Room humidity 53%
Body temperature GT [◦C] 36.3
Degree [◦]–number T1 [◦C] T2 [◦C] T3 [◦C] T4 [◦C]
0◦–1 36.2 36.3 35.9 36.2
0◦–2 36.2 36.3 36.1 36.2
0◦–3 36.2 36.3 36.0 36.2
0◦–4 36.3 36.3 36.0 36.2
0◦–5 36.3 36.3 36.0 36.2
23◦–1 36.1 36.1 36.1 36.2
23◦–2 36.2 36.1 36.2 36.2
23◦–3 36.1 36.2 36.1 36.2
23◦–4 36.1 36.0 36.2 36.2
23◦–5 36.2 36.0 36.1 36.2
45◦–1 35.9 35.7 36.0 36.2
45◦–2 35.9 35.7 36.0 36.2
45◦–3 35.9 35.7 36.0 36.2
45◦–4 35.9 35.8 36.0 36.2
45◦–5 35.9 35.7 36.0 36.2
Min [◦C] 35.9 35.7 35.9 36.2
Max [◦C] 36.3 36.3 36.2 36.2
Max-Min difference [◦C] 0.4 0.6 0.3 0.0
Mean [◦C] 36.09 36.03 36.05 36.20
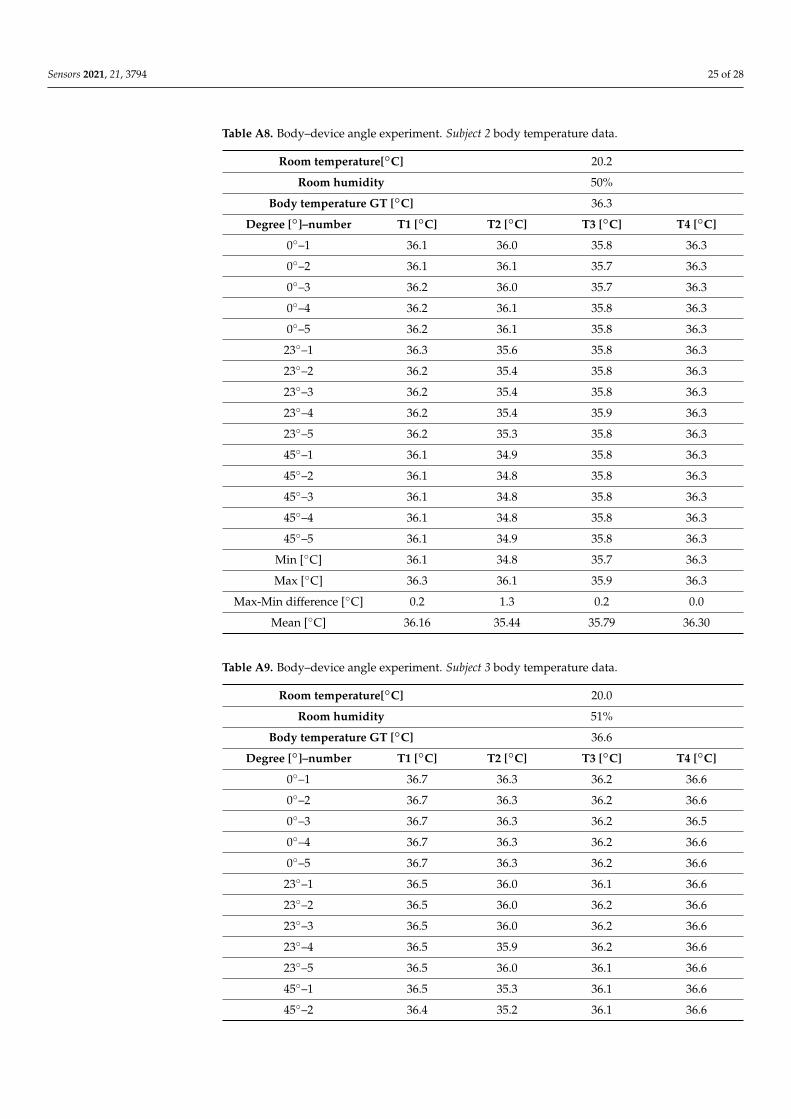
Sensors 2021, 21, 3794 25 of 28
Table A8. Body–device angle experiment. Subject 2 body temperature data.
Room temperature[◦C] 20.2
Room humidity 50%
Body temperature GT [◦C] 36.3
Degree [◦]–number T1 [◦C] T2 [◦C] T3 [◦C] T4 [◦C]
0◦–1 36.1 36.0 35.8 36.3
0◦–2 36.1 36.1 35.7 36.3
0◦–3 36.2 36.0 35.7 36.3
0◦–4 36.2 36.1 35.8 36.3
0◦–5 36.2 36.1 35.8 36.3
23◦–1 36.3 35.6 35.8 36.3
23◦–2 36.2 35.4 35.8 36.3
23◦–3 36.2 35.4 35.8 36.3
23◦–4 36.2 35.4 35.9 36.3
23◦–5 36.2 35.3 35.8 36.3
45◦–1 36.1 34.9 35.8 36.3
45◦–2 36.1 34.8 35.8 36.3
45◦–3 36.1 34.8 35.8 36.3
45◦–4 36.1 34.8 35.8 36.3
45◦–5 36.1 34.9 35.8 36.3
Min [◦C] 36.1 34.8 35.7 36.3
Max [◦C] 36.3 36.1 35.9 36.3
Max-Min difference [◦C] 0.2 1.3 0.2 0.0
Mean [◦C] 36.16 35.44 35.79 36.30
Table A9. Body–device angle experiment. Subject 3 body temperature data.
Room temperature[◦C] 20.0
Room humidity 51%
Body temperature GT [◦C] 36.6
Degree [◦]–number T1 [◦C] T2 [◦C] T3 [◦C] T4 [◦C]
0◦–1 36.7 36.3 36.2 36.6
0◦–2 36.7 36.3 36.2 36.6
0◦–3 36.7 36.3 36.2 36.5
0◦–4 36.7 36.3 36.2 36.6
0◦–5 36.7 36.3 36.2 36.6
23◦–1 36.5 36.0 36.1 36.6
23◦–2 36.5 36.0 36.2 36.6
23◦–3 36.5 36.0 36.2 36.6
23◦–4 36.5 35.9 36.2 36.6
23◦–5 36.5 36.0 36.1 36.6
45◦–1 36.5 35.3 36.1 36.6
45◦–2 36.4 35.2 36.1 36.6
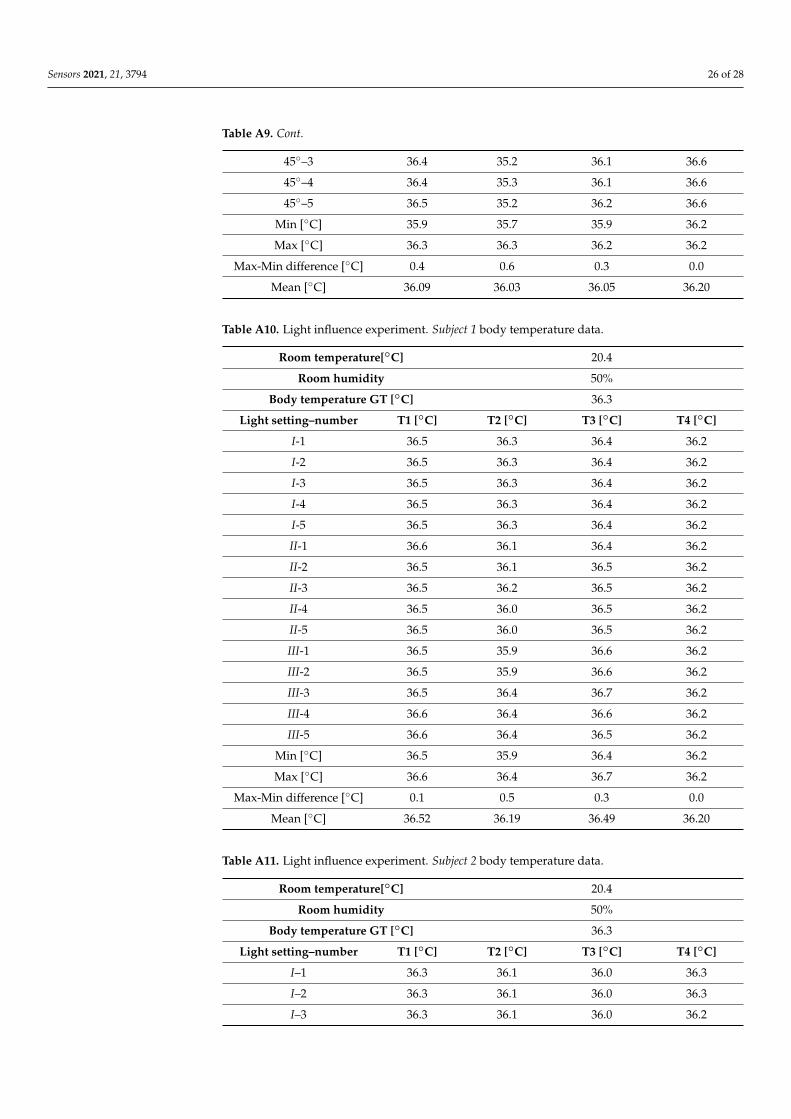
Sensors 2021, 21, 3794 26 of 28
Table A9. Cont.
45◦–3 36.4 35.2 36.1 36.6
45◦–4 36.4 35.3 36.1 36.6
45◦–5 36.5 35.2 36.2 36.6
Min [◦C] 35.9 35.7 35.9 36.2
Max [◦C] 36.3 36.3 36.2 36.2
Max-Min difference [◦C] 0.4 0.6 0.3 0.0
Mean [◦C] 36.09 36.03 36.05 36.20
Table A10. Light influence experiment. Subject 1 body temperature data.
Room temperature[◦C] 20.4
Room humidity 50%
Body temperature GT [◦C] 36.3
Light setting–number T1 [◦C] T2 [◦C] T3 [◦C] T4 [◦C]
I-1 36.5 36.3 36.4 36.2
I-2 36.5 36.3 36.4 36.2
I-3 36.5 36.3 36.4 36.2
I-4 36.5 36.3 36.4 36.2
I-5 36.5 36.3 36.4 36.2
II-1 36.6 36.1 36.4 36.2
II-2 36.5 36.1 36.5 36.2
II-3 36.5 36.2 36.5 36.2
II-4 36.5 36.0 36.5 36.2
II-5 36.5 36.0 36.5 36.2
III-1 36.5 35.9 36.6 36.2
III-2 36.5 35.9 36.6 36.2
III-3 36.5 36.4 36.7 36.2
III-4 36.6 36.4 36.6 36.2
III-5 36.6 36.4 36.5 36.2
Min [◦C] 36.5 35.9 36.4 36.2
Max [◦C] 36.6 36.4 36.7 36.2
Max-Min difference [◦C] 0.1 0.5 0.3 0.0
Mean [◦C] 36.52 36.19 36.49 36.20
Table A11. Light influence experiment. Subject 2 body temperature data.
Room temperature[◦C] 20.4
Room humidity 50%
Body temperature GT [◦C] 36.3
Light setting–number T1 [◦C] T2 [◦C] T3 [◦C] T4 [◦C]
I–1 36.3 36.1 36.0 36.3
I–2 36.3 36.1 36.0 36.3
I–3 36.3 36.1 36.0 36.2
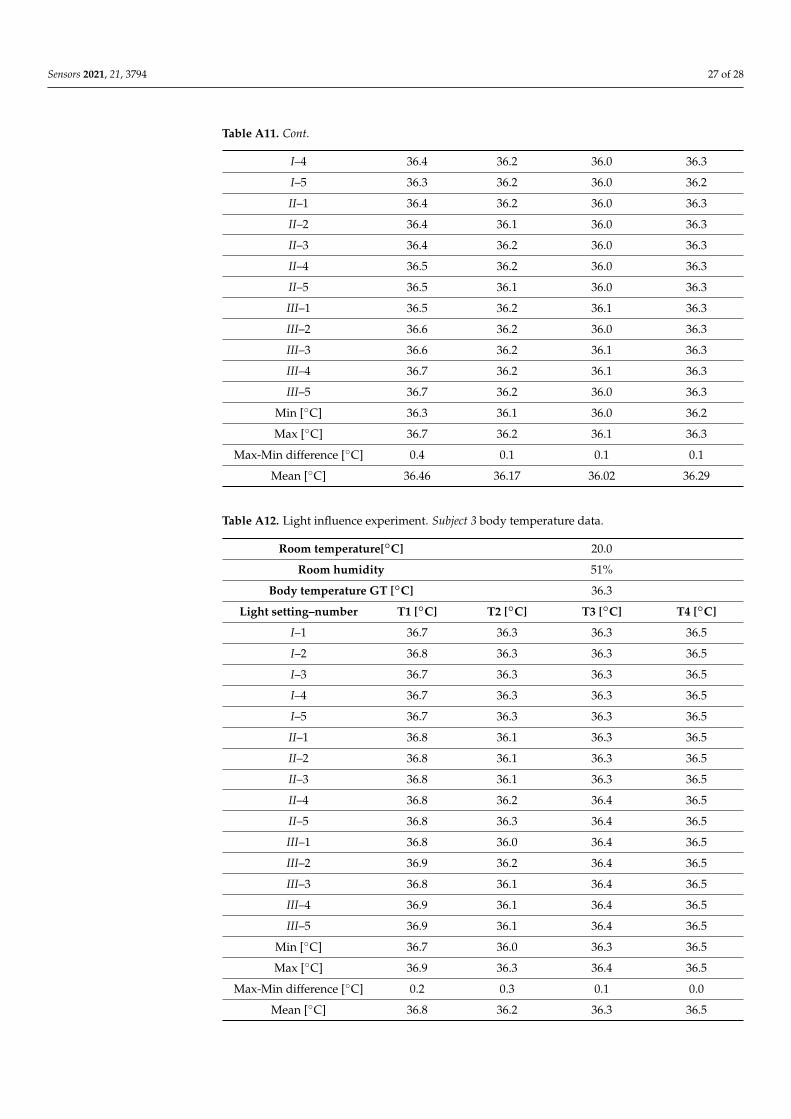
Sensors 2021, 21, 3794 27 of 28
Table A11. Cont.
I–4 36.4 36.2 36.0 36.3
I–5 36.3 36.2 36.0 36.2
II–1 36.4 36.2 36.0 36.3
II–2 36.4 36.1 36.0 36.3
II–3 36.4 36.2 36.0 36.3
II–4 36.5 36.2 36.0 36.3
II–5 36.5 36.1 36.0 36.3
III–1 36.5 36.2 36.1 36.3
III–2 36.6 36.2 36.0 36.3
III–3 36.6 36.2 36.1 36.3
III–4 36.7 36.2 36.1 36.3
III–5 36.7 36.2 36.0 36.3
Min [◦C] 36.3 36.1 36.0 36.2
Max [◦C] 36.7 36.2 36.1 36.3
Max-Min difference [◦C] 0.4 0.1 0.1 0.1
Mean [◦C] 36.46 36.17 36.02 36.29
Table A12. Light influence experiment. Subject 3 body temperature data.
Room temperature[◦C] 20.0
Room humidity 51%
Body temperature GT [◦C] 36.3
Light setting–number T1 [◦C] T2 [◦C] T3 [◦C] T4 [◦C]
I–1 36.7 36.3 36.3 36.5
I–2 36.8 36.3 36.3 36.5
I–3 36.7 36.3 36.3 36.5
I–4 36.7 36.3 36.3 36.5
I–5 36.7 36.3 36.3 36.5
II–1 36.8 36.1 36.3 36.5
II–2 36.8 36.1 36.3 36.5
II–3 36.8 36.1 36.3 36.5
II–4 36.8 36.2 36.4 36.5
II–5 36.8 36.3 36.4 36.5
III–1 36.8 36.0 36.4 36.5
III–2 36.9 36.2 36.4 36.5
III–3 36.8 36.1 36.4 36.5
III–4 36.9 36.1 36.4 36.5
III–5 36.9 36.1 36.4 36.5
Min [◦C] 36.7 36.0 36.3 36.5
Max [◦C] 36.9 36.3 36.4 36.5
Max-Min difference [◦C] 0.2 0.3 0.1 0.0
Mean [◦C] 36.8 36.2 36.3 36.5
Sensors 2021, 21, 3794 28 of 28
References1. Zhu, N.; Zhang, D.; Wang, W.; Li, X.; Yang, B.; Song, J.; Zhao, X.; Huang, B.; Shi, W.; Lu, R.; et al. A Novel Coronavirus from
Patients with Pneumonia in China, 2019. N. Engl. J. Med. 2020, 382, 727–733. [CrossRef]2. Chang, M.C.; Park, D. How Should Rehabilitative Departments of Hospitals Prepare for Coronavirus Disease 2019? Am. J. Phys.
Med. Rehabil. 2020, 99, 475–476. [CrossRef]3. Manivannan, M.; Jogalekar, M.P.; Kavitha, M.S.; Maran, B.A.V.; Gangadaran, P. A mini-review on the effects of COVID-19 on
younger individuals. Exp. Biol. Med. 2021, 246, 293–297. [CrossRef]4. Jin, J.-M.; Bai, P.; He, W.; Wu, F.; Liu, X.-F.; Han, D.-M.; Liu, S.; Yang, J.-K. Gender Differences in Patients With COVID-19: Focus
on Severity and Mortality. Front. Public Health 2020, 8, 152. [CrossRef]5. Williamson, E.J.; Walker, A.J.; Bhaskaran, K.; Bacon, S.; Bates, C.; Morton, C.E.; Curtis, H.J.; Mehrkar, A.; Evans, D.; Inglesby, P.;
et al. Factors associated with COVID-19-related death using OpenSAFELY. Nature 2020, 584, 430–436. [CrossRef]6. Struyf, T.; Deeks, J.J.; Dinnes, J.; Takwoingi, Y.; Davenport, C.; Leeflang, M.M.; Spijker, R.; Hooft, L.; Emperador, D.; Dittrich, S.;
et al. Signs and symptoms to determine if a patient presenting in primary care or hospital outpatient settings has COVID-19disease. Cochrane Database Syst. Rev. 2020, 2020, CD013665. [CrossRef]
7. Chang, M.C.; Park, Y.-K.; Kim, B.-O.; Park, D. Risk factors for disease progression in COVID-19 patients. BMC Infect. Dis. 2020,20, 1–6. [CrossRef] [PubMed]
8. Kim, J.-H.; An, J.A.-R.; Min, P.-K.; Bitton, A.; Gawande, A.A. How South Korea Responded to the Covid-19 Outbreak in Daegu.NEJM Catal. 2020, 1. [CrossRef]
9. Stella, A.B.; Manganotti, P.; Furlanis, G.; Accardo, A.; Ajcevic, M. Return to school in the COVID-19 era: Considerations fortemperature measurement. J. Med. Eng. Technol. 2020, 44, 468–471. [CrossRef] [PubMed]
10. Dadashzadeh, A.; Alamdari, N.G.; Ala, A.; Dehghannejad, J.; Jabbarzadeh, F.; Babaie, N. Triage guidelines for emergencydepartment patients with COVID-19. J. Res. Clin. Med. 2020, 8, 12. [CrossRef]
11. Lahiri, B.; Bagavathiappan, S.; Jayakumar, T.; Philip, J. Medical applications of infrared thermography: A review. Infrared Phys.Technol. 2012, 55, 221–235. [CrossRef] [PubMed]
12. Aggarwal, N.; Garg, M.; Dwarakanathan, V.; Gautam, N.; Kumar, S.S.; Jadon, R.S.; Gupta, M.; Ray, A. Diagnostic accuracy ofnon-contact infrared thermometers and thermal scanners: A systematic review and meta-analysis. J. Travel Med. 2020, 27, 193.[CrossRef] [PubMed]
13. Chen, H.-Y.; Chen, A.; Chen, C. Investigation of the Impact of Infrared Sensors on Core Body Temperature Monitoring byComparing Measurement Sites. Sensors 2020, 20, 2885. [CrossRef]
14. Diwanji, M.M.; Hisvankar, S.M.; Khandelwal, C.S. Temperature Measurement using Infrared Contactless Thermal Gun. InProceedings of the 2020 International Conference on Smart Innovations in Design, Environment, Management, Planning andComputing (ICSIDEMPC), Aurangabad, India, 30–31 October 2020; Institute of Electrical and Electronics Engineers (IEEE):Piscataway, NJ, USA, 2020; pp. 134–137.
15. Osio, C.E.; Carnelli, V. Comparative study of body temperature measured with a non-contact infrared thermometer versusconventional devices. The first Italian study on 90 pediatric patients. Minerva Pediatr. 2007, 59, 327–336.
16. Zhang, B.; Kreps, S.; McMurry, N.; McCain, R.M. Americans’ perceptions of privacy and surveillance in the COVID-19 pandemic.PLoS ONE 2020, 15, e0242652. [CrossRef] [PubMed]
17. Yu, X.; Yang, R. COVID-19 transmission through asymptomatic carriers is a challenge to containment. Influ. Other Respir. Viruses2020, 14, 474–475. [CrossRef] [PubMed]
18. Gerensea, H.; Murugan, R. Is There Significant Difference between Digital and Glass Mercury Thermometer? Adv. Nurs. 2016,2016, 1–10. [CrossRef]
19. Hsiao, S.-H.; Chen, T.-C.; Chien, H.-C.; Yang, C.-J.; Chen, Y.-H. Measurement of body temperature to prevent pandemic COVID-19in hospitals in Taiwan: Repeated measurement is necessary. J. Hosp. Infect. 2020, 105, 360–361. [CrossRef]
20. Qian, G.; Yang, N.; Ma, A.H.Y.; Wang, L.; Li, G.; Chen, X.; Chen, X. COVID-19 Transmission Within a Family Cluster byPresymptomatic Carriers in China. Clin. Infect. Dis. 2020, 71, 861–862. [CrossRef]
21. Fletcher, T.; Whittam, A.; Simpson, R.; Machin, G. Comparison of non-contact infrared skin thermometers. J. Med. Eng. Technol.2018, 42, 65–71. [CrossRef]
22. Dell’Isola, G.B.; Cosentini, E.; Canale, L.; Ficco, G.; Dell’Isola, M. Noncontact body temperature measurement: Uncertaintyevaluation and screening decision rule to prevent the dpread of COVID-19. Sensors 2021, 21, 346. [CrossRef]
23. Quattrocchi, A.; Freni, F.; Montanini, R. Self-heat generation of embedded piezoceramic patches used for fabrication of smartmaterials. Sens. Actuators A Phys. 2018, 280, 513–520. [CrossRef]
24. Piccinini, F.; Tesei, A.; Paganelli, G.; Zoli, W.; Bevilacqua, A. Improving reliability of live/dead cell counting through automatedimage mosaicing. Comput. Methods Programs Biomed. 2014, 117, 448–463. [CrossRef] [PubMed]
25. Apa, H.; Gözmen, S.; Bayram, N.; Çatkoglu, A.; Devrim, F.; Karaarslan, U.; Günay, I.; Ünal, N.; Devrim, I. Clinical accuracyof tympanic thermometer and noncontact infrared skin thermometer in pediatric practice: An alternative for axillary digitalthermometer. Pediatric Emerg. Care 2013, 29, 992–997. [CrossRef] [PubMed]
26. Patel, A.H.; Patel, M.M.; Bhavsar, R.H. Comparison of Non-Contact Forehead Infrared Thermometry with Axillary DigitalThermometry in Neonates. GCSMC J. Med. Sci. 2016, 20, 20–24.