Consumption & Savings MPC & MPS. Disposable Income (DI) Disposable Income (DI) = Gross Income –...
10
Consumption & Savings MPC & MPS
-
Upload
abel-thompson -
Category
Documents
-
view
234 -
download
9
Transcript of Consumption & Savings MPC & MPS. Disposable Income (DI) Disposable Income (DI) = Gross Income –...

Consumption & SavingsMPC & MPS

Disposable Income (DI)
• Disposable Income (DI) = Gross Income – Net Taxes• Disposable Income = income after paying taxes
• Gross income = income before taxes
• Net taxes = Taxes paid – Gov’t transfer payments received
• You have 2 choices with income: Consume or Save
– DI = Consumption + Savings
DISPOSABLE INCOME
HOUSEHOLDSFIRMS
Consumption [C]
Savings [S]
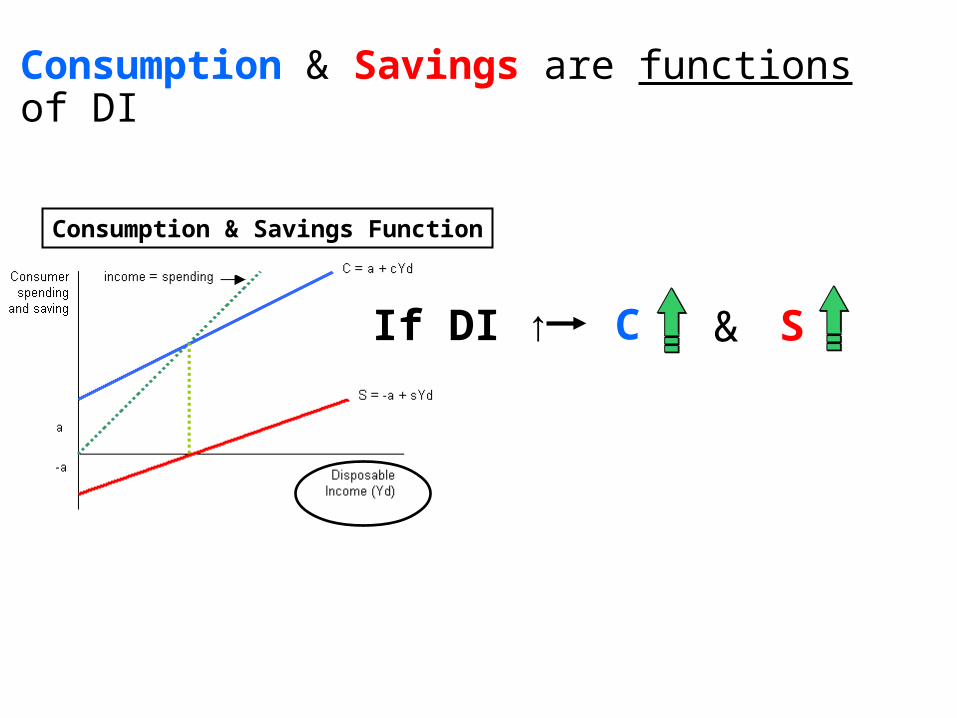
Consumption & Savings are functions of DI
If DI ↑ C S&
Consumption & Savings Function

Is the minimum amount of consumption regardless of income
At low levels of income, savings can be negative!
Autonomous Consumption (a)
C = a + MPC(DI)
S = -a + MPS(DI)

Marginal Propensity to Consume
• MPC = Slope of the consumption function
MPC = ∆C / ∆ DI
. .
DI ↑
C ↑
Consumption Function
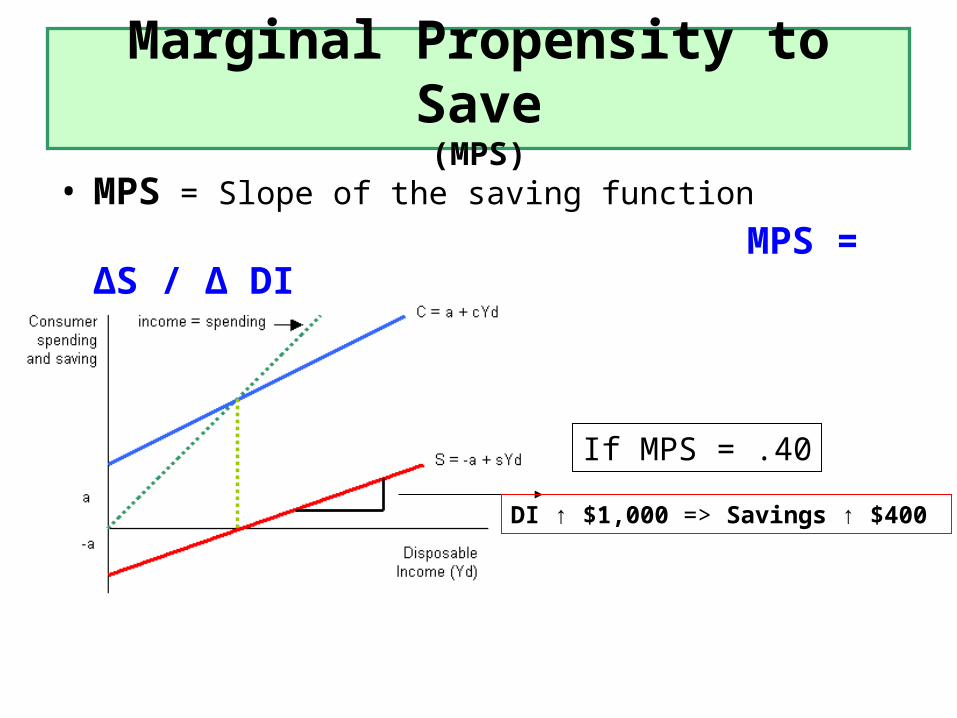
Marginal Propensity to Save(MPS)
• MPS = Slope of the saving function
MPS = ∆S / ∆ DI
DI ↑ $1,000 => Savings ↑ $400
If MPS = .40
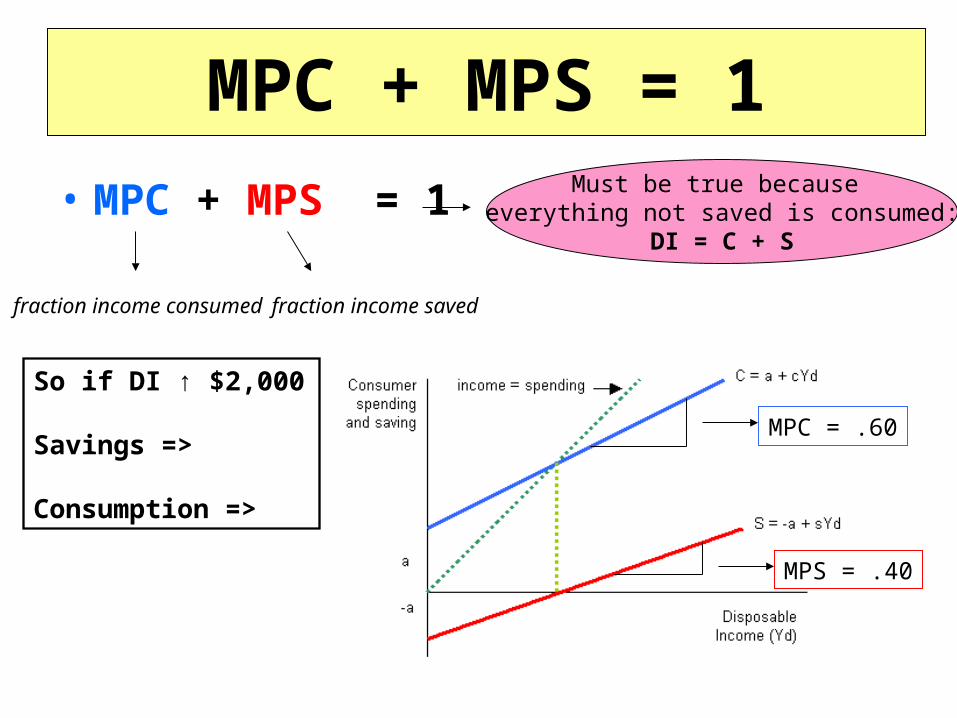
MPC + MPS = 1
• MPC + MPS = 1 Must be true because everything not saved is consumed:
DI = C + S
fraction income savedfraction income consumed
MPS = .40
MPC = .60
So if DI ↑ $2,000
Savings =>
Consumption =>

Shifts in Consumption & Savings
• A change in disposable income cause movements along curve– that means no shift!
• Shifts are caused by change in determinants of savings/consumption– C & S generally must shift in opposite directions

Determinants of Consumption & Savings
• Changes in these 4-factors cause shift in both functions– Wealth
– Expectations
– Household Debt
– Taxes & Transfers • Only time each curve shifts
in same direction

MPC/MPS Worksheet
MPS = .40
MPC = .60MPC = .60