Consumers’ perception, and experience of self … · To date Tesco has closed 50 larger Tesco...
26
LSBM Working Paper Series, Vol. 3, Issue 1, May/June 2018 Page 6 Consumers’ perception, and experience of self-checkouts in UK supermarkets Claudia Maugeri Abstract The aim of this study is to highlight consumers’ perception of self-checkout machines in UK supermarkets in order to design suitable recommendations to improve the service. Supermarkets have changed their business model by focusing on the adoption of self-checkout machines. Although reasons can range from the need to cut costs, technological advancements, and the changing social needs of society, one common factor is important – understanding consumers’ needs. This study, therefore, draws upon the Attribute Model to investigate consumers’ perception of self-checkout machines. Mixed methods have been used, starting with qualitative method (interviews) and then followed-up with the quantitative method (questionnaires). The analysis of survey data from 130 supermarkets’ consumers suggested that improvement have to be made, especially in order to address consumers who still find using self-checkout machines difficult or do not use the technology at all. Keywords: Self-service checkouts, Consumer behaviour, Business research project, Attribute models. Introduction In the last decade, supermarkets have undergone major changes (Chaudhuri, 2015). As stated by Chaudhuri (2015), large supermarkets (for example; Tesco) are closing down large stores in order to focus on smaller, like Tesco Express, shops. To date Tesco has closed 50 larger Tesco stores, including one giant store in Wolverhampton (BBC, 2015). In 2014 Tesco owned 3000 stores, of which 1600 were the smaller Tesco Express outlets. A similar pattern can be observed with Sainsbury's which according to Barford (2016) is focusing on convenience stores rather than big supermarkets. The PESTLE (political, economic, social technological, legal, and environmental), analysis suggests that technology is an external force belonging to the macro environment that businesses cannot control (Kotler, 2013). Technology can comprise computers, internet and online shopping. Employees have been replaced by Internet; as an example, it can be mentioned how, according to The Guardian’s writers Treanor & Collinson (2017), HSBC bank has planned to close down 62 branches in 2017 blaming the new technology. Technological changes have been one of the reasons why supermarkets have changed. Thanks to technology, and its application to self-service technology, supermarkets have changed their business model. Meuter et al. (2005) defined self-service technology products that enable consumers to independently use a service without the aid of employees; part of this technologies are the self-service checkout machines. Self-service checkout machines, firstly introduced in supermarkets in early 2008, are increasing in number (Evans, 2016)Tesco Metro in Liverpool Street (London) was the first supermarket to convert 20 of the 42 tills in the store to self-checkout terminals in 2009 (Financial Times, 2016) - a milestone in what has become a constant change in supermarkets. As Orel & Kara (2003) point out, supermarkets may choose to adopt self-checkout machines to provide better consumers experience, cut costs on employees, continue in line with technological process; moreover, they have refined the processes involved in delivering customer value proposition (Johnson, et al., 2008). The other side of the story is that self-checkout machines could become a big flop; as an example, it can be mentioned how, according to Kjær (2012), Netto stores had removed the self- checkout machines in the Danish market. Moreover, according to Mishra (2013), the failure can be determined by the gap between what customers expect from self-checkout machines (the new business model) and what is actually offered, in other words the gap between servers’ perception and customers’ perception. According to Luo et al. (2004), consumers’ perception of time is important and determine whether or not consumers are satisfied; moreover, according to Sjoberg (1998), people have feelings about any kind of technology that affect the perception on that particular technology.
Transcript of Consumers’ perception, and experience of self … · To date Tesco has closed 50 larger Tesco...
LSBM Working Paper Series, Vol. 3, Issue 1, May/June 2018 Page 6
Consumers’ perception, and experience of self-checkouts in UK supermarkets Claudia Maugeri Abstract The aim of this study is to highlight consumers’ perception of self-checkout machines in UK supermarkets in order to design suitable recommendations to improve the service. Supermarkets have changed their business model by focusing on the adoption of self-checkout machines. Although reasons can range from the need to cut costs, technological advancements, and the changing social needs of society, one common factor is important – understanding consumers’ needs. This study, therefore, draws upon the Attribute Model to investigate consumers’ perception of self-checkout machines. Mixed methods have been used, starting with qualitative method (interviews) and then followed-up with the quantitative method (questionnaires). The analysis of survey data from 130 supermarkets’ consumers suggested that improvement have to be made, especially in order to address consumers who still find using self-checkout machines difficult or do not use the technology at all. Keywords: Self-service checkouts, Consumer behaviour, Business research project, Attribute models.
Introduction In the last decade, supermarkets have undergone major changes (Chaudhuri, 2015). As stated by Chaudhuri (2015), large supermarkets (for example; Tesco) are closing down large stores in order to focus on smaller, like Tesco Express, shops. To date Tesco has closed 50 larger Tesco stores, including one giant store in Wolverhampton (BBC, 2015). In 2014 Tesco owned 3000 stores, of which 1600 were the smaller Tesco Express outlets. A similar pattern can be observed with Sainsbury's which according to Barford (2016) is focusing on convenience stores rather than big supermarkets. The PESTLE (political, economic, social technological, legal, and environmental), analysis suggests that technology is an external force belonging to the macro environment that businesses cannot control (Kotler, 2013). Technology can comprise computers, internet and online shopping. Employees have been replaced by Internet; as an example, it can be mentioned how, according to The Guardian’s writers Treanor & Collinson (2017), HSBC bank has planned to close down 62 branches in 2017 blaming the new technology. Technological changes have been one of the reasons why supermarkets have changed. Thanks to technology, and its application to self-service technology, supermarkets have changed their business model. Meuter et al. (2005) defined self-service technology products that enable consumers to independently use a service without the aid of employees; part of this technologies are the self-service checkout machines. Self-service checkout machines, firstly introduced in supermarkets in early 2008, are increasing in number (Evans, 2016)Tesco Metro in Liverpool Street (London) was the first supermarket to convert 20 of the 42 tills in the store to self-checkout terminals in 2009 (Financial Times, 2016) - a milestone in what has become a constant change in supermarkets. As Orel & Kara (2003) point out, supermarkets may choose to adopt self-checkout machines to provide better consumers experience, cut costs on employees, continue in line with technological process; moreover, they have refined the processes involved in delivering customer value proposition (Johnson, et al., 2008). The other side of the story is that self-checkout machines could become a big flop; as an example, it can be mentioned how, according to Kjær (2012), Netto stores had removed the self-checkout machines in the Danish market. Moreover, according to Mishra (2013), the failure can be determined by the gap between what customers expect from self-checkout machines (the new business model) and what is actually offered, in other words the gap between servers’ perception and customers’ perception. According to Luo et al. (2004), consumers’ perception of time is important and determine whether or not consumers are satisfied; moreover, according to Sjoberg (1998), people have feelings about any kind of technology that affect the perception on that particular technology.

LSBM Working Paper Series, Vol. 3, Issue 1, May/June 2018 Page 7
There are significant changes that supermarkets are experiencing that are affecting the way they are delivering customer value proposition and it is evident that without the advent of new technologies most of these changes could have not been implemented; it is evident that technology is indeed affecting their business model. Following the preface above, because of the cited problems, this study aims to answer the following research question – What is consumers’ perception of using self-checkout machines as part of their grocery shopping experience in UK supermarkets? This study explores the technological changes in supermarkets in regard to self-checkout machines that led to a new business model, in order to evaluate consumers’ perception of these changes and recommend a suitable strategy. Two main objectives drive the study: First is to evaluate existing models on consumers’ perception of self-checkout machines throughout primary research. Second, it to suggest how supermarkets can benefit from consumers’ perception of the changes in order to further improve their services.
Literature Review Organisations that operate in a business environment have to deal with external forces that will affect them in their process of delivering products and services to consumers (Jobber, 2013). Truthfully, as Kotler (2013) stated, in the external environment threats and opportunities can be found for organisations to survive in a competitive environment. Whilst the micro environment includes forces nearer to the organisations that can be controlled (such as consumers, competitors, suppliers), the macro environment comprises forces that are not under organisational control (Brassington, 2007). Macro environment forces can be identified under the acronym of PESTEL (political, economic, social, technological, legal and environmental) framework. The literature review is undertaken following these dimensions in order to identify the key or main drivers of changes leading to the use of self-checkout machines at UK supermarkets. The discussion kicks off with the economic factor and then moves on to the technological factors with a view to linking both of these to the business models of the marketers. Economic Factors Economic factors include “unemployment rate, taxation, interest rate, economic growth, inflation and interest rate” (Sloman, 2014); 2008 recession experienced by businesses has definitely affected UK businesses that experienced lowered level of profits (Britton, et al., 2015); as a matter of fact, supermarkets too. Andrews (2009) asserted that self-checkout machines were invented in order to cut costs and reduce labour costs after the economic crisis that also touched supermarkets’ industry. Thanks to self-checkout machines, one employee can control up to six self-checkout lanes whilst customers now perform the job usually performed by the cashier; moreover, the space occupied by self-checkout machines is smaller than the space occupied by a regular till by allowing to add other shelves with products or other machines and cut costs (NCR Corporation, 2008); UK recession has been one of the driver that pushed supermarkets in finding cutting costs solutions like self-service technology. Technological Factors According to Sloman (2014) technological factors strongly affect individuals’ life. In addition to that, Koumparoulis (2013) stated that technology development has changed the way businesses operate including supermarkets. Nowadays businesses are stimulated by a competition which is based on innovative services, IT technology and global communication. But first, it is important to identify which technological changes helped the creation of self-checkout machines (SCM). Self-checkout technology is defined by Meuter et al. (2005) as the technology that enables consumers to use a service without employees’ help; as part of this technology there are the self-checkout machines. Self-service technologies include for example airline self-check-in machines, gasoline self-checkout machines and grocery self-checkout machines (Orel & Kara, 2013). Customers are able to scan barcodes or input items, such as bread and croissants by using the touch screen display; a voice will accompany the steps; once finished, items will be placed into the bagging

LSBM Working Paper Series, Vol. 3, Issue 1, May/June 2018 Page 8
area where weight is verified in comparison with stored data (Orel & Kara, 2013). Once customers finished scanning the items, payments methods will be chosen from selected choices, for example cards or cash options (ibid.). Technologies such as barcode scanners, mobile computers, barcode printers, barcode software, and inbound package tracker, point of sale system, stock control software & management system and complete asset tracker system are just few of the technologies needed in order to enable self-checkout machines (Wasp, 2017). It is clear that changes in the industry are often linked with new technologies. It is true that new technologies are the main features, but in order for them to transform the industry, change has to happen into the business model which is able to connect the new technology with new market needs (Kavadias, et al., 2016). Social Factors Taken from a societal perspective, it is worth highlighting that the social actors – notably societal factors impacting upon businesses such as change in demographics, attitudes and trends (Brassington, 2007). Freedman (2016) added that nowadays there is an increased number of buyers choosing to do their shopping daily in opposition to previous shoppers being used to shop once a month or once a week. As a consequence, shoppers will reach satisfaction in self-checkout machines (Demirci, 2014); therefore, the reason behind supermarkets focusing on new technologies and self-service machines is to increase customer’s loyalty (Demirci, 2014) – they are changing because consumers’ behaviour is changing. Supermarket’s Business Model Business model is defined as the way a company create and delivers customers’ value (Kavadias, et al., 2016). According to Johnson et al. (2008) the first step in creating a successful business model is by focusing on satisfying consumers’ needs. As shown in Figure 1, the elements of a business model according to Johnson et al. (2008) are interconnected, and the most important element is Customer value proposition (CVP). The higher customers’ satisfaction the better the company will succeed (Johnson, et al., 2008); customers’ satisfaction is achieved when their needs are understood and problems are solved; hence, once needs are identified, the tailored offering can be created - according to the profit formula. The profit formula is a formula that defines how companies can create value for customers by also creating value for themselves. The profit formula consists into the revenue model, cost structure, the margin model and the resource velocity. Revenue model is about how much profit can be made. Cost structure, driven by the cost of the main resources, consists in the cost allocation (for example economy of scale, indirect or direct costs). Margin model is about how much each transaction contributes in order to achieve aimed profit levels. Resource velocity is about how quick resources need to be used in order to achieve desired profits. The other components of the business model are key resources and key processes. Key resources are assets such as technology, people, buildings and/or products that will deliver the value proposition to customers (Johnson, et al., 2008). Key processes are managerial and operational processes that enable the company to deliver customers’ value in a successful way that can be easily repeated (ibid.). Key processes include for example training, budgeting, sales and services. Overall it can be said that value proposition is about creating value for customers whilst profit formula is about creating value for the company; both values are achieved through the use of key resources and processes. NCR Corporation asserted that self-checkout machines have been installed due to customers’ request in speeding up the process on the till (NCR Corporation, 2008); therefore, customers’ value proposition is achieved by refining the key processes - introducing the self-checkout machines, driven by resources such as technology; the profit formula is created by cutting costs.

LSBM Working Paper Series, Vol. 3, Issue 1, May/June 2018 Page 9
Figure 1. The elements of a successful business model
Source: (Johnson, et al., 2008)
Consumers’ perception of self-checkout machines Perception is defined as “the process by which people translate sensory impressions into a coherent and unified view of the world around them” (Business Dictionary, 2015); furthermore Martin (2005) explained the definition by considering it a psychological process that involves stimuli selected by consumers in a way that creates sense for them. Ho (2012) stated that when consumers shop, they do take into consideration the experience of shopping such as atmosphere and environment. Therefore, analysing consumers’ perception of self-checkout machines is fundamental for supermarkets in order to understand consumers’ needs and satisfy them. Langrehr (1979) stated that since 1974 supermarkets have started adopting price scanning check out. According to a study conducted by Dermirci (2014), self-service technologies (SSTs) are constantly increasing in number and consumers are facing everyday new technologies when shopping. In order to understand consumers’ perceptions of self-service, two models developed by Dabholkar (1996) will be used, “The Attribute-Based Model” (Figure 2). The Attribute-Based Model The Attribute-Based Model was the starting point for several studies on consumers’ perception on self-service technologies. This model (see Figure 1) seeks to highlight the reasoning behind decision making when using self-service technologies. According to the Attribute-Based Model, five attributes of delivery

LSBM Working Paper Series, Vol. 3, Issue 1, May/June 2018 Page 10
are important to possible clients: speed of delivery, ease of use, reliability, enjoyment and control (Dabholkar, 1996).
Figure 2. The Attribute-Based Model
Source: (Dabholkar, 1996, p. 31)
Speed of delivery is about the time consumers assume the service should be completed (Dabholkar, 1996). The time in regards of the process excluding the waiting time. Ease of use refers to the ease of using the service; moreover, consumers could be having difficulties when using the process, perhaps due to the lack of clarity of the service. If the service is not easy to use, this can concern consumers and stop them for using the machine in the future (Dabholkar, 1996). According to Dabholkar (1996), reliability is about the perception of consumers on how the service will be fully fulfilled without any external issue. Enjoyment comes when interacting with the machine (Dabholkar, 1996).Control measure how much control customers think they have over the self-service technology. Consumers in fact can use the self-checkout machine simply because they feel they are in control, without the need of employees’ help. The attribute model was the starting point for more studies on consumers’ perceptions when using self-service technology. Linked to that model there is a study conducted by Dabholkar et al. (2003). This research wanted to look at consumers’ preferences when using the machines. Results showed that only ease of use was determinant attribute of consumers’ preference (Dabholkar, et al., 2003). Confirming this thesis there are Walker et al. (2006); according to the authors, consumers’ perception in using self-checkout machines are fundamental for the ability of using that particular technology. In fact, Walker et al. asserted that the perceived user-friendliness and difficulty of the machine will affect the ability of consumers in using it. Another finding was that another main reason for using self-checkout machines was due to the ability to make the process quicker; moreover, they found that one of the reasons why consumers were not using self-checkout machines was to have interactions with employees on the till. But more importantly, they did find out that age did not affect the perception of self-checkout machines because there were no difference among groups (Dabholkar, et al., 2003). On the other hand, a study conducted by Orel & Kara (2013) showed that there is a difference between age groups because young people were using self-checkout machines more than other age groups, perhaps due to their confidence in using Internet and technologies. Orel & Kara (2013) also found that self-checkout machines were considered difficult to use perhaps due to not clear on-screen directions. Walker et al. (2006) asserted that the perceived user-friendliness and difficulty of the machine will affect the ability of consumers in using it. When using the self-checkout machines, there are perceived factors that have to be taken into consideration, when evaluating consumers’ perception on the self-checkout machines. One factor is perception of risk (Walker & Johnson, 2006), or in other words, the uncertainty created by the action of purchasing a product. For example, consumers can be afraid that the self-checkout machine does not work and this can affect their positive perception of the overall service. Weijters et al. (2007) showed that the reasons behind using the self-checkout machines was ease of use, reliability and quick service. Marques (2016) added that there is a constant seek for satisfaction whilst shopping that is achieved when consumers can succeed in having a quick and smooth buying experience. Furthermore, Zielke et al. (2008), using the same Attribute Model (1996) discovered that employees’ support, the quick response from the personnel when needed, was an attribute that influenced satisfaction.

LSBM Working Paper Series, Vol. 3, Issue 1, May/June 2018 Page 11
Methodology This research use a deductive approach – an approach that starts off with the theory (in this case a model) – i.e. The Attribute Model (Dabholkar, 1996), and through the collection of data (interviews & questionnaires) to evaluate and test this model (Saunders, et al., 2015). With this approach this research wants to look at the previous research from a different perspective and try to find gaps. In order to further understand the method, the following paragraphs breaks down the steps of the methodology. In order to achieve a coherent research project, there are different methods that can be used; the research in fact can use qualitative, quantitative or use mix methods (Saunders, et al., 2015). Qualitative research differs from quantitative research because the latter uses numeric data whilst qualitative research makes use of words and images and other non-numeric data (Saunders, et al., 2015). Quantitative is a term that also address a data collection method that involves questionnaires, graphs that are able to generate data that can be analysed (Saunders, et al., 2015). On the other hand, qualitative research method will make use of non-numeric data such as interviews or open questions (ibid.). This research has used a multiple method, qualitative and quantitative, with the correspondent quantitative analytical procedure (Saunders, et al., 2015); this method is called mixed method (simple) study. Figure 3 illustrates different methodological choices available for business research purposes.
Figure 3 Methodological choice
Source: (Saunders, et al., 2015)
This research has used a sequential mixed methods research (Figure 4 shows the steps involved in this research chosen method). The research can be “exploratory, descriptive, explanatory, evaluative or a combination of these” (Saunders, et al., 2015). This study is descriptive because it wants to describe changes experienced in supermarkets but also exploratory, because it wants to seek the consumers’ perception of supermarkets changes (Saunders, et al., 2015). The reason behind a mixed method is because of the successful study conducted by Jenkins et al. (2012) that used both methods. In order to answer the research question(s), this project has made use of both secondary and primary data. Secondary data includes published data, journal articles and reports (Saunders, et al., 2015). According to Bulmer et al. (2009), secondary data will link to a different knowledge, once analysed.
Figure 4 Sequential exploratory
Source: (Saunders, et al., 2015)
This research project collected and analysed data from scholarly online platforms such as ResearchGate and GoogleScholar, published articles, library books. Into specific, secondary data have been collected in order to answer the first objective of the research and identify drivers of changes that led to the new business model based on the use of self-checkout machines; the reason behind that lays on the resource saving quality intrinsic into their nature (Vartanian, 2011).

LSBM Working Paper Series, Vol. 3, Issue 1, May/June 2018 Page 12
Data sources Primary data have been collected by means of interviews and a questionnaire and the results of the qualitative and quantitative data have been analysed to identify possible trends related to the research question. Interviews According to Saunders et al. (2016) interview is a focused conversation between two or more individuals; it requires the interviewer to create a relationship with the interviewee who is asked precise and concise questions that he is willing to answer. This research used semi-structured interviews; the interviewer has a list of topics or questions that may need to be covered; the main reason for using interviews was to gather respondents’ vocabulary in order to design the questionnaire and having a broader perception about the topic (Saunders, et al., 2015). In order to gather data the conversation was recorded. Questionnaire According to Vaus (2014), questionnaire is the term used to address all data collection methods that involve a person asked to respond the same “set of questions” in an established way. This data collection method is because it is one of the most used method in the survey strategy when doing a descriptive or explanatory research (Saunders, et al., 2015). The questionnaire used in this research to collect data it is referred to as Self-completed questionnaires (Saunders, et al., 2015); moreover, one type as Delivery collection questionnaire and the other type Web Questionnaire. Figure 5 below shows the different types or questionnaire.
Figure 5 Types of questionnaires
Source: (Saunders, et al., 2015)
Participants were asked to answer on a Likert-type rating. This rating scale asks respondents how strongly she/he agrees or disagree with a statement on a five-point rating scale (Saunders, et al., 2015). The questionnaire comprised two parts. The first part was devoted to demographic data such as gender and age. The second part devoted to self-checkout machines. Agreement and disagreement will be rated using 5-point Likert-type scale including ‘Strongly disagree’, ‘Disagree’, ‘Neutral’, ‘Agree’, ‘Strongly agree’ (Saunders, et al., 2015). The questionnaire results are anonymous and confidential. Once the data was entered into a spreadsheet, completed questionnaires have been destroyed. The online or “web” questionnaires were prepared using the “Google Form” tool and distributed via the internet accessed through a hyperlink sent out to the research participants on this platform. The delivery and collection of the questionnaire, were initiated following-on from a pre-tested pilot of an initial pilot of 5 potential respondents in order to ascertain some indication of the time consumed in the survey completions and the alignment of these to the research question and responses derived from these. Sampling Sampling technique can be divided into two groups: Probability sampling; and Non-probability sampling (see Figure 6). For probability sampling each sample is selected from the target population and it is known and equal to each other (Saunders, et al., 2015). On the other hand, for non-probability sample the chance that each case is selected from the population is not known but there is the possibility to generalise about the population.

LSBM Working Paper Series, Vol. 3, Issue 1, May/June 2018 Page 13
Figure 6. Non-probability sampling
Source: (Saunders, et al., 2015)
For the purpose of this research, convenience sampling was used. Convenience sampling is part of the Haphazard sampling; this particular technique is used when the sampling is selected without any particular principle but just because it is easy to obtain (Saunders, et al., 2015); therefore, the sampling was selected by mean of a Facebook pool whilst another selected among family and friends; the aim is to conduct analysis on different perception groups. As shown in Figure 5, this research used Haphazard convenience sampling technique called convenience or availability sampling. The data from questionnaires was collected from 130 supermarkets consumers older than 18 years of age. The sample was non-random with regard to gender, and participants did not belong to any particular occupation. 100 from online (Facebook and emails), 30 from family and friends. According to Paraskevas & Saunders (2012), in order to conduct Semi-structured/In-depth interviews, the minimum sample size should be 5-25. Therefore, the interviews were conducted on 5 individuals among family and friends. This approach is different to the proposal; the number of the sample has increased from 120 to 130. The reason for that is to try to gather a bigger sample and to be more accurate. The layout also changed from the proposal – from only quantitative, this research has become qualitative and quantitative; in fact, originally it did not include the interviews that have been subsequently used in order to learn the respondents’ vocabulary and to prepare the questionnaire. Originally, the proposal sought to explore the perception of online shopping, self-checkout machines and the switch from bigger supermarkets to smaller convenience store; because of time constraint and the limitation of words, this research has focused only on self-checkout machines. In order for this research to succeed and the research question to be answered, resources were needed. Due to the nature of the research, time was needed. The project needed to be accomplished within 3 months. The first month has been dedicated to research, by analysing secondary data. The second month has been spent in creating the questionnaire and conduct interviews. In the third month data has been entered into a spread sheet and analysed. SPSS software was needed to analyse data obtained with the questionnaire.
Data analysis and discussion In order to answer the research question, descriptive and inferential statistics were used. Descriptive statistics were used in order to describe the demographic of the sample as well as the frequency of usage of self-checkout machines. Data were also analysed using SPSS software with ANOVA tests; these tests were performed in order to identify whether there are statistically significance difference between groups. Table 1 shows the results of the descriptive analysis of data in regard to the demographic of the sample.

LSBM Working Paper Series, Vol. 3, Issue 1, May/June 2018 Page 14
Table 1. Demographic characteristics of the sample (N=130) Variable Categories Count %
Gender Male Female
52 78
40 60
Age 18 – 30 years 31 – 40 years 41+
34 45 51
26 35 39
Employment status Full-time Part-time Not-employed Retired
55 28 19 28
42 22 15 21
The questionnaire was distributed to 130 people. Each questionnaire was completed and there were no case of incomplete. The low rate of rejection may be due to the connection with the author of the questionnaire. The usage of self-checkout machines The following Table 2 illustrates the results from the questionnaire. The result shows that 78% of the respondents use self-checkout machines in opposition to 22% that have never used it. This result is impressive, and a suitable strategy will be recommended in order to increase the number of users. Moreover, the results show that the majority of users is 41+ (37%) in opposition of 30% of users whose age is 18-30. This result contradicts to Orel & Kara (2013) findings that confirmed that younger people were the highest users of self-checkout machines.
Table 2. The usage of self-checkout machines Variable Categories Count %
Usage of self-checkout machines
Yes No
102 28
78 22
Gender Female Male
58 44
57 43
Age 18 – 30 years 31 – 40 years 41+
30 34 38
30 33 37
Ease of use In regard to self-checkout machines ease of use, the results are widely spread as Table 3 shows. A further analysis shows that there is statistically difference between different age consumer groups (see Figure 6 and Appendix I for descriptive statistics).
Table 3. The ease of use
Variable Value label Count % Easy to use
Strongly disagree Disagree Neutral Agree Strongly agree
36 10 12 23 21
35 10 12 22 21
According to previous research (Dabholkar, 1996) (Dabholkar, et al., 2003) (Weijters, et al., 2007) ease of use is one of the main reasons for using the self-checkout machine. This result on the other hand, shows that the age group of 41+ do not find self-checkout machines easy to use; the previous research stated that ease of use is the reason for satisfaction, therefore this is an interesting and alarming finding that has to be taken into account. The following findings will show why self-checkout machines are not considered easy to use.

LSBM Working Paper Series, Vol. 3, Issue 1, May/June 2018 Page 15
Figure 7 Self-checkout machines are easy to use according to different age groups
Anova statistics showed that there are significance differences between the age groups (see Figure 8 for descriptive statistics). Again, 41+ respondents think that instructions are not clear as shown in Figure 7. This is an important results because as stated in previous research, (Dabholkar, 1996) (Dabholkar, et al., 2003) (Weijters, et al., 2007), ease of use and the clarity of the screen directions should help customers being in control hence being satisfied. This could be linked to the previous result of how 41+ age group do not find the technology easy to use. According to Walker & Johnson (2006), consumers are satisfied when they are in control and they do not need employees but can-do things alone when using the self-checkout technology; therefore, it is important to take into consideration this finding.
Figure 8. Clear on-screen directions
Faster checkout processes According to Dabholkar et al. (2003) and Weijters et al. (2007) one of the reasons for using self-checkout machines is because they make the checkout process quicker. Results shown in Table 4 confirms previous researches.
Table 4 Make the checkout process quicker
0
5
10
15
20
25
30
35
18-30 31-40 41+
Self-checkout machines are easy to use
Strongly disagree Disagree Neutral Agree Strongly agree
02468
1012141618
18-30 31-40 41+
There are clear on screen directions
Strongly disagree Disagree Neutral Agree Strongly agree

LSBM Working Paper Series, Vol. 3, Issue 1, May/June 2018 Page 16
Attributes Variable Value label Count % Reasons for using self-checkout machines
Make the checkout process quicker
Strongly disagree Disagree Neutral Agree Strongly agree
18 14 17 25 28
18 14 17 24 27
Figure 9. Make the checkout process quicker
On the other hand, although previous research stated that there is no difference between groups (Dabholkar, et al., 2003), results show the opposite. According to Anova results, there is a significance difference between age groups. As clearly visible in Figure 9, there is a difference in perception between 31-40 age groups and 41+. According to the Figure 9, there is more disagreement from consumers 41+ than 31-40. This data should be taken into consideration because shows that 41+ disagree with the statement that self-checkout machines are able to speed up the checkout process, maybe because as shown in the previous results, they believe that this technology is not easy to use and there are not clear on-screen directions. Avoiding contact with the cashier Table 5 shows that consumers’ perception of self-checkout machines regarding the statement “avoiding contact with the cashier” as one of the reason to use it revealed a general disagreement in the response. This result contradicts with Dabholkar at al. (2003), who stated that one reason for using self-checkout machines was from the enjoyment coming from avoiding the employees. Moreover, although Dabholkar at al. (2003) confirmed that there was no difference in perception between groups, Anova shows that there is a statistical significance difference between 18-30 and 31-40 against 41+.
Table 5 Avoiding contact with the cashier Attributes Variable Value label Count % Reasons for using self-checkout machines
Avoiding contact with the cashier
Strongly disagree Disagree Neutral Agree Strongly agree
29 20 17 14 22
28 20 17 14 21
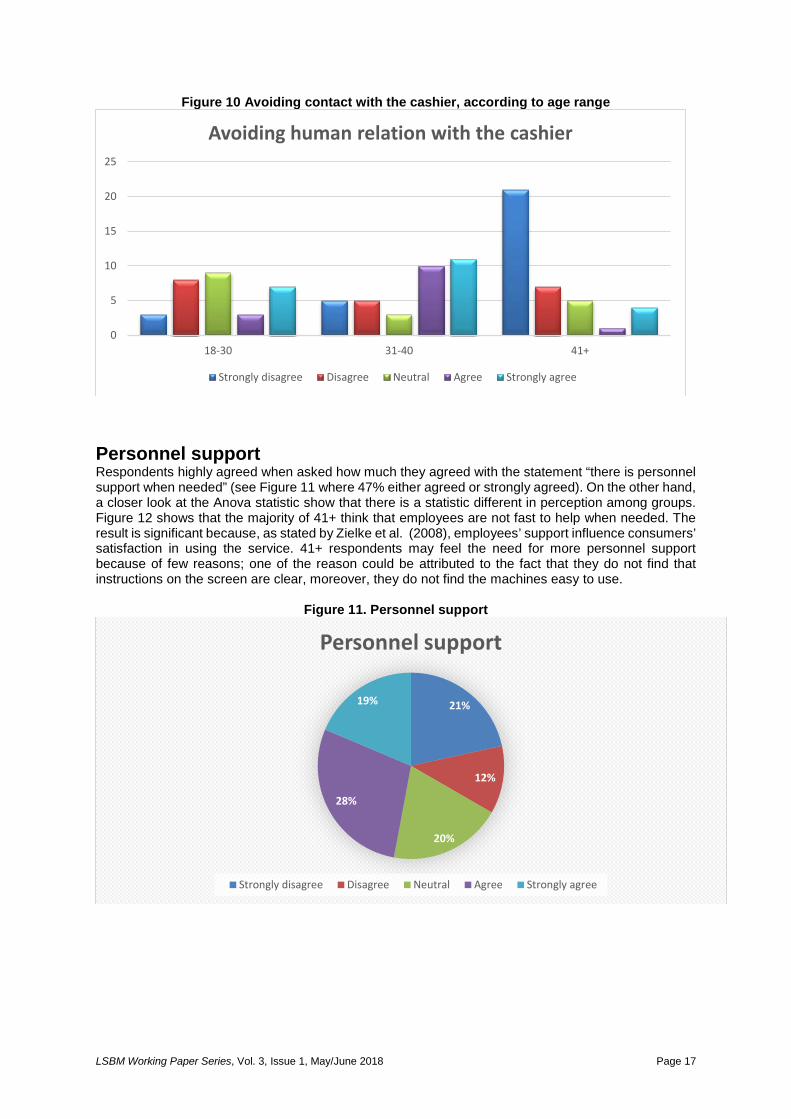
As shown in Figure 10, the majority of 41+ consumers confirmed that they do not use self-checkout machines to avoid the cashiers. This result is very important because it means that 41+ consumers may feel the need to have relation with the cashiers, maybe because the machines are not easy to use.
02468
1012141618
18-30 31-40 41+
Make the checkout process quicker
Strongly disagree Disagree Neutral Agree Strongly agree
LSBM Working Paper Series, Vol. 3, Issue 1, May/June 2018 Page 17
Figure 10 Avoiding contact with the cashier, according to age range
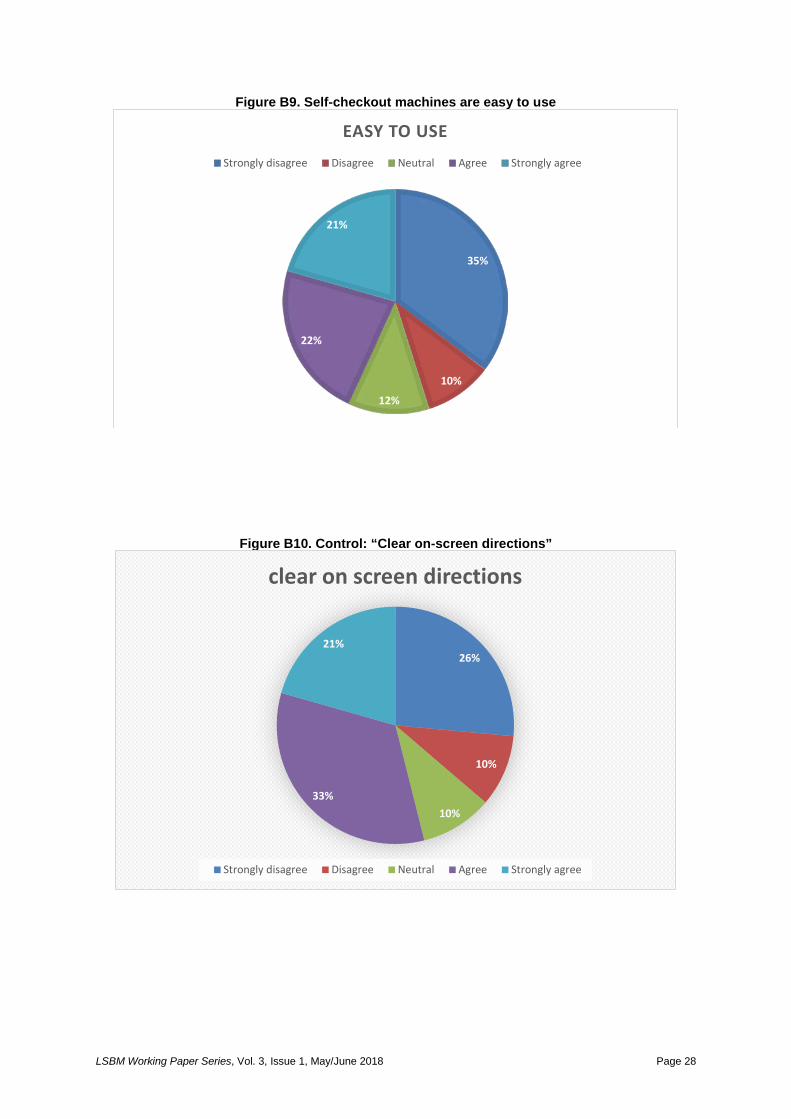
Personnel support Respondents highly agreed when asked how much they agreed with the statement “there is personnel support when needed” (see Figure 11 where 47% either agreed or strongly agreed). On the other hand, a closer look at the Anova statistic show that there is a statistic different in perception among groups. Figure 12 shows that the majority of 41+ think that employees are not fast to help when needed. The result is significant because, as stated by Zielke et al. (2008), employees’ support influence consumers’ satisfaction in using the service. 41+ respondents may feel the need for more personnel support because of few reasons; one of the reason could be attributed to the fact that they do not find that instructions on the screen are clear, moreover, they do not find the machines easy to use.
Figure 11. Personnel support
0
5
10
15
20
25
18-30 31-40 41+
Avoiding human relation with the cashier
Strongly disagree Disagree Neutral Agree Strongly agree
21%
12%
20%
28%
19%
Personnel support
Strongly disagree Disagree Neutral Agree Strongly agree

LSBM Working Paper Series, Vol. 3, Issue 1, May/June 2018 Page 18
Figure 12. Personnel support speed of response
Conclusions and Implications Although there are significant global changes in the sector, this research was limited to the UK supermarket sector and took only into account self-checkout machines, mainly due to a timing issue. Another limitation is that the majority data were collected by Google Form that has limited the interaction between researcher and respondents. Although the questionnaire was shared on different social media platforms, the questionnaire grasped more females perhaps due to the fact that the author has more females’ contacts. The difference between male and female respondents could be attributed to the demography that consisted in a larger number of females. 33% respondent users are 31-40 years old, a minority of 30% age category of 18-30 years old and the majority with 37% belonging to the category of 41 + years old. It is fundamental to keep in mind the way the sample has been selected; in fact, this result contrasts with Orel & Kara (2013) who asserted that younger people tend to use technology as self-checkout machines because of the fact that they are knowledgeable with internet and technologies. This research aimed to analyse consumers’ perception of UK supermarkets’ self-checkout machines. The first part showed how things have changed in the industry with the introduction of the self-service technology caused by external drivers of change such as economy, technology and change in the society. Thanks to a secondary research the Attribute-Based Model (1996) was used as a starting point for the research on consumers’ perception on self-service technology (SST) over the years. The model showed how speed of delivery, ease of use, reliability, enjoyment and control affected consumers’ perception when using the self-checkout machines. The model was the starting point for several studies that confirmed these factors determinant when using the SST (Dabholkar, et al., 2003). Although this research confirmed part of the previous research such as the Attribute-Based Model (1996), there are also differences and new findings that will be discussed below. One of the main findings was that 22% of the respondents have never used SST. A close look showed that 47% of respondents who never used SST were 41+, 39% were 31-40 and only 14% were 18-30 years old (see Figure 12). Although previous research confirmed that (Dabholkar, et al., 2003) there was no difference on perception according to age groups, this research findings showed the opposite. The results shows that the highest proportion of respondents that have never used self-checkout machines are 41, therefore supermarkets should focus on improving their services in order to gather this missing market share. In fact, the other results showed that 41+ respondents are the one in need of more support. 41+ respondents did confirm that SST are not easy to use, one of the main reasons being ‘difficult on-screen directions’. As a consequence of that, the same age group (41+) does not find SST as a way to speed up the checkout process; previous research showed that one of the main reasons for using the SST was due to the ability to speed up the process (Dabholkar, et al., 2003), therefore, according to 41+
02468
101214161820
18-30 31-40 41+
Fast employees' help when needed
Strongly disagree Disagree Neutral Agree Strongly agree

LSBM Working Paper Series, Vol. 3, Issue 1, May/June 2018 Page 19
respondents, SST do not speed up the process therefore this can be a reason for not using it. Although the majority of the respondents age groups (18-40) use SST to avoid tills’ employees, 41+ do not, which means that they still need employees contacts when going grocery shopping; at the same time, they do not consider having fast personnel support when needed, which can be due to the frustration caused by not being able to independently use the machines. This research showed that there is a difference in perception in using SST between different age groups, result that contrast with previous research (Dabholkar, et al., 2003); because of that, supermarkets are recommended to focus on this age group in order to facilitate their experience when using the SST and in order to also gather the missing 22% who have never used the technology. In terms of implications from this study, these can be broken into three components: (i) training employees near the self-checkout machines; (ii) improving self-checkout machines on screen directions; and (iii) creating an aid software that demo how to use the self-checkout machine. Firstly, supermarkets should train employees near the self-checkout machines, in order to encourage consumers using them. The employees could educate new users that are reluctant in using the machines. The key is training employees whilst running the lanes to keep an eye on needing customers. Once customers are educated, it will be easier for them doing it alone. Moreover, self-checkout machines should improve their on-screen directions, being more intuitive especially for mature consumers that are not technology-friendly. Secondly, there is a need to create a software to be installed in the SST that customers could easily access by simply pressing a button; the software should be a demo to demonstrate how to use the self-checkout machines. Supermarkets should only buy the software once and install in all the machines. SST is a way for supermarkets to cut costs, by using machines that could replace human work. Thirdly, creating aid demo software for consumers that are not able to use the machine is an innovative strategy. According to Bessant & Tidd (2011) innovation is about repositioning a product in the mind of consumers. The main strategic goal is to reposition the idea of self-checkout machines in the mind of 41+ consumers, in order to change their perception and meeting their needs and most of all, having a positive response from all consumers’ age groups. The main recommendation is to continue the research on self-checkout machines perception by focusing on people who do not use the technology. Although a lot of research focused on users, there is a gap in the research for people who have never used the machines.
References Andrews, 2009. ‘DO-IT-YOURSELF’: SELF-CHECKOUTS, SUPERMARKETS, AND THE SELF
SERVICE TREND. University of Maryland, pp. 1-273. Barford, V., 2016. The rise, fall and rise of the mini-supermarket. [Online]
Available at: http://www.bbc.co.uk/news/magazine-25762466 Barnet, V., 2002. Sample Survey Principles and Methods. Chirchester: Wiley. Ba, S. and Pavlou, P.A., 2002. Evidence of the effect of trust building technology in electronic
markets: Price premiums and buyer behavior. MIS quarterly, 26(3), pp.243-268. BBC, 2015. Tesco names 43 UK store closures. [Online]
Available at: http://www.bbc.co.uk/news/business-31023136 [Accessed 20 February 2017].
Bell, J. & Waters, S., 2014. Doing Your Research Project. 6th ed. Maidenhead: Open University Press.
Bessant, J. & Tidd, J., 2011. Innovation and Entrepreneurship. 2nd ed. Chichester: John, Wiley and Sons. Ltd.
Brassington, P., 2007. Principles of Marketing. 2nd ed. Harlow: Pearson Education Limited. Britton, Worthington, I. & Chris, 2015. The business environment. In: Business Study Guide.
s.l.:Pearson, pp. 1-114. Bulmer, M., Sturgis, P. & ad Allum, N., 2009. Editors’ introduction’, in M. Bulmer, P.J. Sturgis and N.
Allum (eds) Secondary Analysis of Survey Data. Los Angeles: Sage. Business Dictionary, 2015. Perception. [Online]
Available at: The process by which people translate sensory impressions into a coherent and unified view of the world around them. [Accessed 20 May 2015].

LSBM Working Paper Series, Vol. 3, Issue 1, May/June 2018 Page 20
Chaudhuri, S., 2015. Changing Customer Habits Leave Supermarkets With Property Dilemma. The Wall Street Journal, 23 April.
Creswell, J. & Plano Clark, V., 2011. Designing and Conducting Mixed Methods Research. 2nd ed. Thousand Oaks: Sage.
Dabholkar, P. A., 1996. Consumer Evaluations of New Technology-based Self-service Options: An Investigation of Alternative Models of Service Quality. International Journal of Research in Marketing, 3(13), pp. 29-51.
Dabholkar, P. A., Bobbitt, L. M. & Lee, E. J., 2003. Understanding consumer motivation and behavior related to self-scanning in retailing - Implications for strategy and research on technology-based self-service. International Journal of Service Industry Management, 14(1), pp. 59-95.
De Vaus, D., 2014. Surveys in Social Research. 6th ed. Abingdon: Routledge. Demirci, F., 2014. Supermarket self-checkout service quality, customer satisfaction, and loyalty:
Empirical evidence from an emerging market. Journal of Retailing and Consumer Services, p. 118–129.
Department for Business, Innovation and Skills. 2011. Trade and Investment Analytical Papers. [Online] Available at: https://www.gov.uk/government/uploads/system/uploads/attachment_data/file/43313/11-720-uk-trade-performance.pdf [Accessed 4 April 2015].
Dillman, D., Smyth, J. & Christian, J., 2014. Internet, Phone, Mail and Mixed Mode Surveys: The Tailored Design Method. 4th ed. Hoboken: Wiley.
Evans-Cowley, J., 2016. The Changing Nature of Retail: The Impact of Online Shopping on Cities. Planetizen.
Evans, T., 2016. How to silence the supermarket self-service checkout’s irritating ‘unexpected item in bagging area’ warning. [Online] Available at: https://www.thesun.co.uk/living/1755312/unexpected-item-in-the-bagging-area-how-to-silence-the-supermarket-self-service-checkout/
Financial Times, 2016. Supermarkets increase self-checkouts. [Online] Available at: https://www.ft.com/content/a49db04c-ac52-11de-a754-00144feabdc0
Freedman, M., 2016. Top-Up Shoppers: Satisfaction Guaranteed?. [Online] Available at: https://igd.com/Research/Shopper-Insight/Top-up-shoppers-satisfaction-guaranteed/ [Accessed 19 4 2016].
Goel, A., 2015. The evolution of grocery segment. ACADEMICIA: An International Multidisciplinary Research Journal, 5(11), pp.190-196.
Hannagan, T. R., 2008. Management:Concepts & Practices. 5th ed. Harlow: Pearson Education Limited.
Ho, C.-W., 2012. An Exploratory Study on Relationships between Factors that Influence Consumers' Perceptions of Retail Branding and Purchase Behaviour. Journal of Business and Economics, 4(2), pp. 143-176.
Jenkins, M., Zapf, D., Winefield & H. and Sarris, A., 2012. Bullying allegations from the accused bully’s perspective. British Journal of Management, 23(4), p. 489–501.
Jobber, E.-C., 2013. Principles and Practice of Marketing. 7th ed. New York: McGraw-Hill Education. Johnson, M., Christensen, C. & Kagermann, H., 2008. Reinventing Your Business Model. Harvard
Business Review, pp. 51-55. Kallweit, K., Spreer, P. & Toporowski, W., 2014. Why do Customers use Self-service. Journal of
Retailing and Consumer Services, 22, pp. 268-276. Kavadias, K., Kostas, L. & Loch, C., 2016. The Transformative Business Model. [Online]
Available at: https://hbr.org/2016/10/the-transformative-business-model [Accessed 4 April 2017].
Kjær, J., 2012. Supermarkeder skrotter selvbetjeningskasser. [Online] Available at: http://politiken.dk/oekonomi/privatoekonomi/art5050241/Supermarkeder-skrotter-selvbetjeningskasser [Accessed 7 February 2017].
Kotler, A. ,. L. C. H. N. P., 2013. In: Principles of Marketing. Harlow: Pearson Education Limited, p. 221.
Kotler, A. ,. L. C. H. N. P., 2013. Principles of Marketing. 6th European Edition ed. Harlow: Pearson Education Limited.
Koumparoulis, D., 2013. PEST Analysis: The case of E-shop. International Journal of Economy, Management and Social Sciences, 2(2), pp. 31-36.
Langrehr, Frederick, W., Robinson & Richard, K., 1979. Shoppers' Reactions to Supermarket Price Scanning and Shopper Price Marking. The Journal of Consumer Affairs, pp. 370-380.

LSBM Working Paper Series, Vol. 3, Issue 1, May/June 2018 Page 21
Luo, W. et al., 2004. Impact of process change on customer perception of waiting time: a field study. Omega, 32(1), pp. 77-83.
Madichie, N. (2011). Self-service at UAE petrol forecourts: marketing in unfamiliar terrain? International Journal of Business and Globalisation, 6(1), 104-116.
Marques, S., Trinidade, G. & Santos, M., 2016. The importance of atmospherics in the choice of hypermarkets and supermarkets. The International Review of Retail, Distribution and Consumer Research, 26(1), pp. 17-34.
Martin, J., 2005. Organisational Behaviour and Management. 3rd ed. London: Thomson Learning. Meuter, M., Bitner, M., Ostrom, A. & Brown, S., 2005. Choosing Among Alternative Service Delivery
Modes: An Investigation of Customer Trial of Self-service Technologies.. Journal of Marketing, 69, pp. 61-83.
Mishra, H., 2013. A study on consumers perception towards online grocery store. [Online] Available at: https://issuu.com/sanjaykumarguptaa/docs/a_study_on_consumer_perception_towa [Accessed 6th March 2017].
Mutaz, M., 2015. Consumer attitudes towards online shopping: The effects of trust, perceived benefits, and perceived web quality. Internet Research, pp. 707 - 733.
NCR Corporation, 2008. NCR FastLane. [Online] Available at: http://docs.legacy.ncr.mxmcloud.com/NCR_FastLane.pdf
Orel, F. D., & Kara, A. (2014). Supermarket self-checkout service quality, customer satisfaction, and loyalty: Empirical evidence from an emerging market. Journal of Retailing and Consumer Services, 21(2), 118-129.
Paraskevas, A. & Saunders, M., 2012. Beyond consensus: An alternative use of Delphi enquiry in hospitality research. International Journal of Contemporary Hospitality Management, 24(6), p. 907–24.
Perlusz, S., 2004. Emotions and Technology Acceptance: Development and Validation of a Technology Affect Scale. Engineering Management Conference, 2, pp. 845-847.
Saunders, M., Lewis & P., T. A., 2015. Research Methods for Business Students. 7th ed. Harlow: Pearson.
Saunders, M., Lewis, P. & Thornhill, A., 2016. Research Methods for Business Students. 7th ed. Harlow: Pearson.
Sjoberg, L., 1998. Worry and risk perception. Risk Analysis, 18(1), pp. 85-93. Sloman, J., 2014. Essential Economics for Business. 4th ed. Harlow: Pearson Education Limited . Starbucks, 2015. Delicious Drinks Under 200 Calories. [Online]
Available at: http://www.starbucks.com/menu/nutrition/20-under-200 [Accessed 5 March 2015].
Treanor, J. & Collinson, P., 2017. HSBC to close 62 more branches this year, blaming online banking. [Online] Available at: https://www.theguardian.com/business/2017/jan/24/hsbc-close-branches-online-banking-unions-jobs [Accessed 2017 February 20].
Vartanian, T., 2011. Secondary Data Analysis. Oxford: Oxford University Press. Walker, R. H. & Johnson, L. W., 2006. Why consumers use and do not use technology enabled
services. Journal of Services Marketing, 20(2), pp. 125-135. Wasp, 2017. Track, Trace and Report Accurately and Efficiently. [Online]
Available at: https://www.waspbarcode.co.uk/ [Accessed 4 April 2017]. Weijters, B., Rangarajan, D., Falk, T. & Schillewaert, N., 2007. Determinants and outcomes of
customers' use of self-service technology in a retail setting. Journal of Service Research, 10(1), pp. 3-21.
Zielke, S., Lietke, B., Toporowski, W. & Boslau, M., 2008. Self-service and Traditional Check-outs in a Retail Setting. An Analysis of Perceptual Differences and Satisfaction Drivers. Marketing. Journal of Research and Management, 30(1), pp. 24-37.

LSBM Working Paper Series, Vol. 3, Issue 1, May/June 2018 Page 22
Appendix I – Data Sets
Figure A1. Anova – Self-checkout and cashier Contact
Figure A2. Make the process quicker

LSBM Working Paper Series, Vol. 3, Issue 1, May/June 2018 Page 23
Figure A3. Self-checkout machines are easy to use
Figure A4. Personnel support

LSBM Working Paper Series, Vol. 3, Issue 1, May/June 2018 Page 24
Figure A5. Clear on-screen directions

LSBM Working Paper Series, Vol. 3, Issue 1, May/June 2018 Page 25
Figure B2. Never used SST
Figure B3. Self-checkout machines
Figure B4. Age of respondents
14%
39%
47%
NEVER USED SELF-CHECKOUT MACHINES
18-30 31-40 41+
Man43%Woman
57%
Self-checkout machines
Man
Woman
34, 26%
45, 35%
51, 39%
Age of the respondents
18-30 31-40 41+

LSBM Working Paper Series, Vol. 3, Issue 1, May/June 2018 Page 26
Figure B5. Employment status of the respondents
Figure B6. Usage of self-checkout machines (by age range)
55, 42%
28, 21%
19, 15%
28, 22%
Employment status of the respondents
Full-time Part-time Not-employed Retired
30, 30%
34, 33%
38, 37%
USAGE OF SELF-CHECKOUT MACHINES PER AGE RANGE
18-30 31-40 41+

LSBM Working Paper Series, Vol. 3, Issue 1, May/June 2018 Page 27
Figure B7. Avoid contact with the cashier
Figure B8. Making the checkout process quicker
28%
20%17%
14%
21%
AVOID HUMAN RELATIONSHIP WITH THE CASHIER
Strongly disagree Disagree Neutral Agree Strongly agree
18%
14%
17%24%
27%
Make the checkout process quicker
Strongly disagree Disagree Neutral Agree Strongly agree
LSBM Working Paper Series, Vol. 3, Issue 1, May/June 2018 Page 28
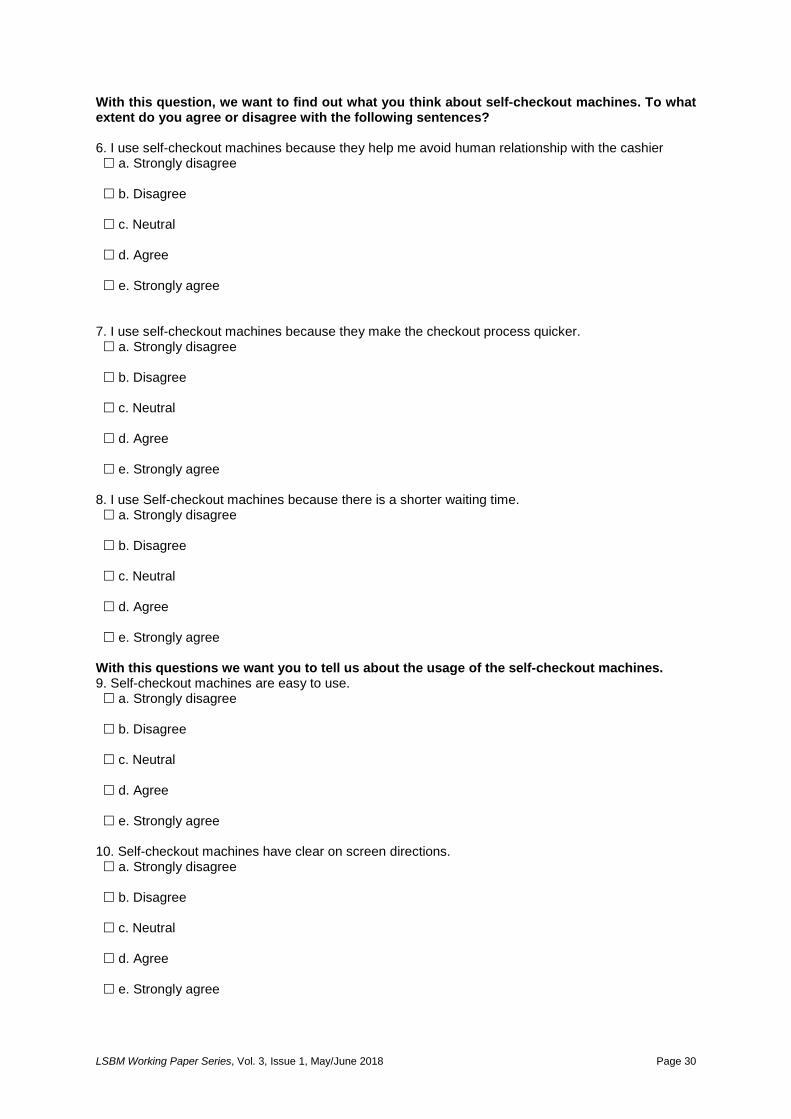
Figure B9. Self-checkout machines are easy to use
Figure B10. Control: “Clear on-screen directions”
35%
10%
12%
22%
21%
EASY TO USE
Strongly disagree Disagree Neutral Agree Strongly agree
26%
10%
10%33%
21%
clear on screen directions
Strongly disagree Disagree Neutral Agree Strongly agree

LSBM Working Paper Series, Vol. 3, Issue 1, May/June 2018 Page 29
Appendix II – Questionnaire Consumers’ perception on self-checkout machines.
Thank you for agreeing on taking part in this survey. The questionnaire has been created for data collection purpose in order to analyse consumers’ perception on self-checkout machines in UK supermarkets’ industry. Please answer the following questions, to finish the questionnaire 3-4 minutes will be needed. Be assured that all your answers will be kept confidential and anonymous. To begin our survey, we have some questions about yourself. 1. What is your gender? a. Male b. Female
2. What is your age? a. 18-30 b. 31-40 c. 41+
3. What is your employment status? a. Full Time b. Part Time c. Not employed d. Retired
Now, we have questions on the use of self-checkout machines. 4. Have you ever used self-checkout machine? a. Yes b. No (hand back the questionnaire)
5. In which supermarket have you used the self-checkout machine more often? a. Tesco b. Sainsbury's c. Waitrose d. Marks & Spencer e. Other (please specify) ___________
LSBM Working Paper Series, Vol. 3, Issue 1, May/June 2018 Page 30
With this question, we want to find out what you think about self-checkout machines. To what extent do you agree or disagree with the following sentences? 6. I use self-checkout machines because they help me avoid human relationship with the cashier a. Strongly disagree b. Disagree c. Neutral d. Agree e. Strongly agree
7. I use self-checkout machines because they make the checkout process quicker. a. Strongly disagree b. Disagree c. Neutral d. Agree e. Strongly agree
8. I use Self-checkout machines because there is a shorter waiting time. a. Strongly disagree b. Disagree c. Neutral d. Agree e. Strongly agree
With this questions we want you to tell us about the usage of the self-checkout machines. 9. Self-checkout machines are easy to use. a. Strongly disagree b. Disagree c. Neutral d. Agree e. Strongly agree
10. Self-checkout machines have clear on screen directions. a. Strongly disagree b. Disagree c. Neutral d. Agree e. Strongly agree

LSBM Working Paper Series, Vol. 3, Issue 1, May/June 2018 Page 31
11. If I make mistakes using self-checkout machines, knowledgeable employees are ready to help. a. Strongly disagree b. Disagree c. Neutral d. Agree e. Strongly agree
12. If bags runs out whilst using self-checkout machines, someone is there to quickly replace them. a. Strongly disagree b. Disagree c. Neutral d. Agree e. Strongly agree
About the Author Claudia Maugeri graduated with a BA (Hons) Business Management from the London School of Business and Management (LSBM) in July 2017. She currently works in the registry department of her alma Mater as an Academic Administrator responsible for two courses i.e. the top-up BA Business and Management and the MBA. She finds her current role rewarding considering that it involves putting to measurable practice, her interpersonal skills developed in the course of her study at LSBM.