Consumer's Attitude towards Store Image and Private Label Brand ...
45
Consumer’s Attitude towards Store Image and Private Label Brand Image Jason Ji A dissertation submitted to Auckland University of Technology In partial fulfilment of the requirements for the degree of Master of Business (MBus) 2011 Faculty of Business and Law Primary Supervisor: Dr. Jungkeun Kim Second Supervisor: Dr. Andrew G Parsons
Transcript of Consumer's Attitude towards Store Image and Private Label Brand ...
Consumer’s Attitude towards Store Image and
Private Label Brand Image
Jason Ji
A dissertation submitted to Auckland University of Technology
In partial fulfilment of the requirements for the degree of
Master of Business (MBus)
2011
Faculty of Business and Law
Primary Supervisor: Dr. Jungkeun Kim
Second Supervisor: Dr. Andrew G Parsons
I
LIST OF FIGURES
Figure 1. The interaction between levels of store image and (in)consistency of all private label brands images on private label brand 3 image beliefs………………….22 Figure 2. The interaction between levels of store image and (in)consistency of all private label brands images on attitudes toward the store……………………………26 Figure 3. The interaction between levels of store image and (in)consistency of all private label brands images on attitudes toward all private label brand image beliefs ………………………………………………………………………………………..28

II
LIST OF TABLES
Table 1. Image attributes of stimulus materials……………………………………...19 Table 2. Mean rating comparison of all underlying mechanisms……………………25 Table 3. Independent variables under different image store conditions………..........31
III
ATTESTATION OF AUTHORSHIP
I hereby declare that this submission is my own work and that, to the best of my
knowledge and belief, it contains no material previously published or written by
another person (except where explicitly defined in the acknowledgements), nor
material which to a substantial extent has been submitted for the award of any other
degree or diploma of a university or other institution of higher learning.
_______________ Jason Ji

IV
ACKNOWLEDGEMENTS
I would like to gratefully and sincerely thank my primary and secondary supervisors,
Dr. Jungkeun Kim and Dr. Andrew G Parsons, whose encouragement, supervision
and support from the preliminary to the concluding level enabled me to develop an
understanding of the subject. I feel honoured and privileged to have both of you as my
supervisors.
I would also like to thank I'u Tuagalu, Pacifica Learning Development Senior
Lecturer, for helping me with editing of the dissertation.
Finally, and most importantly, I would like to thank my wife Emily. Her support,
encouragement and unwavering love give me the strength. I thank my parents,
Yisheng and Sumei, for their faith in me and allowing me to be as ambitious as I
wanted.

V
ETHICS APPROVAL
This research was approved by the Auckland University of Technology Ethics
Committee (AUTEC) on October 4th, 2011, Ethics application number 11/231.
Table of Contents LIST OF FIGURES…………………………………………………………………………………………I LIST OF TABLES………………………………………………………………………………………….II ATTESTATION OF AUTHORSHIP……………………………………………………………….III ACKNOWLEDGEMENTS……………………………………………………………………………..IV ETHICS APPROVAL……………………………………………………………………………………..V ABSTRACT ............................................................................................................................ 1 1 INTRODUCTION .............................................................................................................. 3 1.1 Private label brands image and store image .............................................................. 5 1.2 The Same Private Label Brand model and Different Private Label Brand model .............................................................................................................................................. 6
2 RESEARCH QUESTION ................................................................................................... 7 3 THEORETICAL BACKGROUND .................................................................................... 8 3.1 Averaging Process View ..................................................................................................... 8 3.2 Category-‐based Process view I ...................................................................................... 10 3.3 Category based process view II ..................................................................................... 11 3.4 Variety-‐seeking Process .................................................................................................. 13
4 LABORATORY EXPERIMENT .................................................................................... 15 4.1 Methodology ........................................................................................................................ 16 4.1.1 Respondents and Design .......................................................................................................... 16 4.1.2 Stimulus Material ......................................................................................................................... 16 4.1.3 Procedure ........................................................................................................................................ 17
4.2 Reliability ............................................................................................................................. 18 4.3 Manipulation Checks ........................................................................................................ 19 4.3.1 Beliefs about overall store image, private label brand 1 and private label brand 2 ...................................................................................................................................................................... 19 4.3.2 Belief about the image of private label brand 3, images of stores and (in)consistency of private label brands images ......................................................................... 19 4.3.3 Attitude ratings for all private label brands ..................................................................... 21
4.4 Results ................................................................................................................................... 21 4.4.1 Overall store image ..................................................................................................................... 21 4.4.2 Overall private label brand images ...................................................................................... 24 4.4.3 Schema (in)congruity ................................................................................................................. 26 4.4.4 Perceived variety ......................................................................................................................... 27 4.4.5 Additional analysis for perceived variety ......................................................................... 27
5 CONCLUSION AND LIMITATION .............................................................................. 30 6 REFERENCE ................................................................................................................... 32
1
ABSTRACT
Nowadays two major private label development models are often applied to the retail
industry. They are same private label brand name (SPLB) model and different private
label brand name (DPLB) model. On the one hand, in the SPLB model, the brand
names between retail stores and the private label products are same. On the other
hand, retailers from some countries are likely to adopt the DPLB model where they
name their private label brands differently. However, the above private label brand
strategies raise two issues.
Firstly, how do consumers change their attitudes toward a store and its private label
brands, especially when a high image store carries high image private label brands
only versus a high image store carries both high and low image private label brands?
Similarly, how do consumers change their attitudes toward a store and its private label
brands, especially when a low image store carries low image private label brands only
versus a low image store carries both low and high image private label brands?
Secondly, how do consumers change their attitudes toward a store and its private
label brands, especially under the SPLB model versus the DPLB model?
Therefore, the aim of this paper is to investigate the impact of consistent (vs.
inconsistent) images between a store and its private label brands on consumers’
attitudes toward the store with its private label brands under the SPLB and the DPLB
models.
Our empirical findings revealed that consumers generated more (or less) favourable
attitudes toward a low (or high) image store that not only carried its low (or high)
image private label brands but also high (or low) image private label brands. This
finding was generally consistent with the implications of the averaging process view.

2
The study provided an additional result which indicated that perceived private label
brand variety seem to have a significant positive impact on consumers’ attitudes
toward the low image store. Results did not provide any significant moderating effects
of private label brand models on consumers’ attitudes toward a store with its private
label brands.
3
1 INTRODUCTION
Private label bands are owned, managed and sold by retailers and wholesalers (Tsung-
Chi & Chung-Yu, 2008), and this brand strategy has often been applied in most of
Western countries. The initial ideal of private label brands was established and
examined in the North America around early 19th century, and it became an
innovative brand strategy which was developed rapidly in the American retail
industry during the last 100 years. According to Hyman, Kopf and Dongdae (2009),
20 percent of products sold in American supermarkets were private label brands in
1990; however this number raised dramatically to 50 percent with a resulting $50
billion of net profit in the year 2000. Over past one decade, the concept of private
label bands has been adopted by European retailers, where the average of market
share in private label brands reached 23 percent. However, there was quite a bit of
variance in market share; for example, in 2005 the market share varied from 4 percent
in Greece to 45 percent in Switzerland.
During the initial stage, the private label brands were only applied to a small
number of merchandise categories in consumer-packaged-goods industry (Raju,
Sethuraman, & Dhar, 1995a). Nowadays, the private label brands are widely applied
to the majority of product categories, ranging from basic consumer goods (e.g. milk
or bread) to various chemical product lines (such as shampoo or cosmetics) (Fraser,
2009). Martenson (2007) reveals that national brands have less effect on determining
store image and store differentiation. Contrarily, private label brands can play a
facilitating role in improving store image and store differentiation.
From the perspective of retailers, private labels can help to differentiate store
images, allow flexibility to retailers or wholesalers to adjust pricing strategies in order
to gain higher revenue, enable retailers to offer massive product options to customers
4
as well as improving customer patronages and allegiance (Chen, 2005; Coriolis
Research, 2002; Fraser, 2009; Hyman et al., 2009; Nandan & Dickinson, 1994;
Robert, 2004). Moreover, adopting the private label brand strategy could help retailers
to react quicker to any rapid changes in markets, and ultimately to better satisfy
various needs from the market (Au-Yeung & Lu, 2009).
In general, private label brand strategy can be categorized into either the same
private label brand (SPLB) model or the different private label brand (DPLB) model.
In the SPLB model, the brand names between retailers and the private label products
are consistent. For instance, Tesco applies the consistent brand and logo to name its
private label products as “Tesco Organic” and “Tesco Kids” in the UK. By contrast,
some retailers are more likely to adopt the DPLB model. So they tend to name their
private label products inconsistently. For example, “Pams”, “Fresh express” and
“Budget” are the three typical private label brands which belong to “Foodstuffs New
Zealand” (Coriolis Research, 2002).
Mazursky and Jacoby (1986) convey that brand image can be seen as a substantial
variable which has stronger effect on customer perception than store image. The
perception of a store image could either be enhanced by carrying high image brand
products, or be destroyed by associating with low image brand merchandises.
Moreover, stores with a high image could help to enhance the perception of a brand
with a low image. Correspondingly, a store with a low image could decrease the
perception of a brand with a high image.
From the perspective of brand retailers, Pettijohn, Mellott and Pettijohn (1992) note
that brand images seem to be more crucial than store images. For example, a high
image brand maintains a positive perception to the customers no matter if it associates
5
with a low image store. However, the perception of a low image stores will be
enhanced by associating it with high image brands.
From the perspective of store retailers, there is little research that examines the
unique effects between brand image and store image. When a high image store carries
high image brands, the perceptions amongst the store and brands are not affecting
each other. However, when a low image store carries low image brands, the
perception of a low image store could be dramatically enhanced (Pettijohn, Mellott, &
Pettijohn, 1992).
To some extent, the perception of a store image is influenced by the price and
quality of the brand products that are offered in the store, and consumers always
believe that high price equates high brand equities and excellent store services (Baker,
Parasuraman, Grewal, & Voss, 2002).
1.1 Private label brands image and store image
Recent literature provides extensive discussion on the relationship between private
label brands image and store image. Some scholars point out that when the
phenomenon of inconsistent images between retailer and the private label brand
occurred consumers are always confused to perceive the images among them
(Collins-Dodd & Lindley, 2003; Daniel & Janet, 2003; Lee & Hyman, 2008). Some
scholars further claim that store image can be seen as the minor factor which has less
affect on the consumer’s perception in terms of private label brand image (Lee &
Hyman, 2008). Collins-Dodd and Lindley (2003) reveal that the diversified
perceptions of private label brands could be the result of different positioning
strategies adopted by the retailers. Moreover, a number of scholars suggest that the
perception of private labels image could have a direct influence on the perception of
its related store image from the customers. In detail, Daniel and Janet (2003) clearly
6
state that selling a bundle of private label brand products under a discount price in a
high image store might result in decreasing the store’s perceived image by the
customers and shrinking the net profits of the retailer. Daniel and Janet believe the
phenomenon occurred mainly because that low price relates to low risk category.
Once the low image products are carried by a retail store, customers are always
perceive the low store image regardless the inherent store image (high or low).
Apart from private label brands, the empirical findings of Corstjens and Lal (2000),
imply that store differentiation can be improved by building up the retailers’ own
labelling. They further advocate that retailers should develop strategic plans to
enlarge their products assortment in order to effectively enhance the store
differentiation.
1.2 The Same Private Label Brand model and Different Private Label Brand
model
Fraser (2009) reveals that once the retailer’s name and logo are printed on the
packaging of private label products, the products are perceived to be partially
representing the store. Sayman and Raju (2004) found that numerous products with
private labels help to enhance customer satisfaction successfully, because private
label products can enlarge the brand assortment of a store and consequently to fulfil
the different needs of the customers. Anselmsson and Johansson (2007) indicate that
one of the major purposes for retailers to launch private label products is to help with
improving store image. Moreover, Burt (2000) found that in UK grocery stores, the
UK retailers were more likely to sell products which had printed their names and
logos on them; subsequently, the perceptions of the private label products sold in the
store always reflect the perception of its store image to UK customers. They further
state that the image of a retail store has a positive influence on the images of private
7
label brands. Therefore, from the vantage point of consumers, the perception of the
private label brand image will be equivalent to the perception of retail store image.
The majority of key retailers in the United States of America apply co-branding
strategy to name their private label brands (Alex, 1997; Au-Yeung & Lu, 2009). Co-
branding can be defined as a brand strategy, which combines together two or more
branded merchandise, in order to form a new product. Within the new product, the
brand names of sub products are different (Park, Jun, & Shocker, 1996). The
advantages of adopting the co-branding strategy are to gain more market shares as
well as to minimize the impact caused by any sub-brand failure. Nevertheless, the
disadvantage of deploying this strategy is the large amount of advertising costs that
the strategy necessitates (Washburn, Till, & Priluck, 2000).
2 RESEARCH QUESTION
The above private label brand strategies raised up two issues. Firstly, how do
consumers change their attitudes toward a store and its private label brands, especially
when a high image store carries high image private label brands only (HH) versus a
high image store carries both high and low image private label brands (HH+HL)?
Likewise, how do consumers change their attitudes toward a store and its private label
brands, especially when a low image store carries low image private label brands only
(LL) versus a low image store which carries both low and high image private label
brands (LL+LH)? Secondly, how do consumers change their attitudes toward a store
and its private label brands, especially under the SPLB model versus the DPLB
model?
8
The purpose of this paper is to turn a spotlight on inconsistent images between retail
stores and private label brands under the SPLB model, and then to compare with the
DPLB model, eventually to contrast the various consumer attitudes toward stores and
their private label brands. The research question is showed as following:
Ø What is the impact of consistent (vs. inconsistent) images between a store and its
private label brands on consumers’ attitudes toward the store and its private
label brands under the SPLB and the DPLB models?
3 THEORETICAL BACKGROUND
3.1 Averaging Process View
According to the averaging model (Anderson, 1971), the impact of individual
informational stimulus on considerable attitude change is substantially reliant upon
the entire informational attributes. To be more specific, each informational item is
measured by two parameters, namely “scale value” and “weight”. Measurement
results are used to draw an overall evaluation of the target object. Anderson (1971)
further indicates that the “weight” implies the psychological importance of each
informational attribute. From the perspective of “averaging process view”, the weight
of each informational attribute varies based on the weight of the rest of the attributes
being assessed. In other words, appending novel informational stimulus tends to
reduce the effects of the existing informational stimulus on overall target evaluation.
Averaging connotes a cognitive equilibrium analogous to mixing two fluids with
uneven temperatures into one container where the commingling of the two fluids
enables the moderation of temperature. Thus, adding novel information to target
merchandise will lead to the creation of a less favourable evaluation (Troutman &
9
Shanteau, 1976). Since image-attributes are defined as one of the key product
attribute types (Lefkoff-Hagius & Mason, 1993), offering low private label brands
with low image-attributes to a high image store that carries high image private label
brands, is likely to diminish the impact of high image-attributes on the overall store
evaluation. Correspondingly, providing high private label brands with high image-
attributes to a low image store, that deals in low image private label brands, tends to
decrease the impact of low image-attributes on the overall evaluation.
Results of past research also support the averaging process view. Pettijohn, Mellott and
Pettijohn (1992) point out that from the perspective of low image brands, low image
brands will remain low image despite associating with a high image store.
Nevertheless, from the perspective of a high image store, an image of the store will be
decreased by low image brands, especially when a high image store becomes
associated with low image brands. Accordingly, the above notion leads to the
following hypotheses:
Hypothesis 1a: Based on the averaging process, consumers’ evaluations of a high
image store will be higher when the store carries high image private label brands
only than when the store carries both high and low image private label brands. (HH
>HH+HL)
Hypothesis 1b: Based on the averaging process, consumers’ evaluations of a low
image store will be lower when the store carries low image private label brands only
than when the store carries both low and high image private label brands.
(LL <LL+LH)
10
3.2 Category-based Process view I
Past consumer studies indicate that category-based processing can be defined as an
alternative method of forming product evaluations (Meyers-Levy & Alice, 1989; Rao
& Kent, 1988; Sujan, 1985; Sujan & Christine, 1987). Furthermore, some scholars
convey that store image perceptions of consumer rely on a category-based
information processing system, in which, novel information is merged with existing
information through schemas held in the memory (Keaveney & Hunt, 1992).
Specifically, consumers attempt firstly to classify an item by analysing the existing
clues that could connote a specific social category to which it belongs. Subsequently,
the initial perceptions with the specific category are used, as a basis for analysing the
item without moving into a specified evaluation of additional characters. Finally,
consumers may be involved in specified evaluation processing on additional
characters (Kim, Park, & Ryu, 2006). Moreover, Mandler (1982) theorizes that
merchandise always emerge either an attributes congruence or incongruence to their
product category schema. Incongruence between merchandise and their category
schema can be classified into moderate incongruence and complete incongruence.
Moderate incongruence relating to attributes partial matches between merchandise
and the relevant category schema. Correspondingly, complete incongruence is where
an attribute perfectly matches between merchandise and their associated category
schema. Furthermore, the empirical findings of Meyers-Levy and Alice (1989)
suggest that novel attributes of the target item amplify arousal, and better cognitive
elaboration could be elicited by resolving the incongruence. The findings further
indicate that moderate incongruence could successfully resolve the incongruence.
Therefore, moderate incongruence induces a more favourable judgement towards the
target object comparing with either congruence or complete incongruence. According
11
to this paper, the incongruent relationship between store image and private label
image can be resolved without activating an essential change in the perceivers’
inherent cognitive configuration. The resolution could be achieved through sub-
typing. For example, it is a high (or low) image store, but one that not only carries
high (or low) but also low (or high) image private label brands. Consequently, the
above notion forms our following hypothesis.
Hypothesis 2a Based on the category-based process view I, consumers’ evaluations
of a high image store will be lower when the store carries high image private label
brands only (a congruent relationship) than when the store carries both high and low
image private label brands (a moderate incongruent relationship). (HH<HH+HL)
Hypothesis 2b Based on the category-based process view I, consumers’ evaluations
of a low image store will be lower when the store carries low image private label
brands only (a congruent relationship) than when the store carries both low and high
image private label brands (a moderate incongruent relationship). (LL<LL+LH)
3.3 Category based process view II
Schema studies posit that consumers analysing novel information mainly based on
its congruence with a relevant schema (Goldstein & June, 1980; Schank & Robert,
1977). Associating an item to a schema requires integrating attributes of the item to the
characteristics of the schema (Schank & Robert, 1977; Walton & Bower, 1993). The
magnitude of schema congruity determines the probability to which beliefs shift from
a schema to an item (Goldstein & June, 1980; Walton & Bower, 1993). The higher
level of schema congruity, the more fluid beliefs shift from schema to an item. A low
12
level of schema congruity indicates a comprehensive failure of the target item.
Therefore, the schema beliefs cannot be transferred to the item.
According to the schema theory, matching a product category to its store schema can
be considered as the antecedent of evaluating a new private label brand. Consumers
will perceive a high level of consistency between a store and its private label brand if
the schema congruence is good (e.g. HH or LL). Correspondingly, consumers will
perceive a great level of inconsistency between a store and the private label brands
schema, if the congruence is poor (e.g. HH+HL or LL+LH).
From the perspective of category theory, it is postulated that category holders with
more ordinary features are defined by more characteristics (Mervis & Rosch, 1981). A
characteristic holder of a category associates with numerous outstanding attributes
which correlate to the goal could be more extremely satisfying of consumer needs
(Barsalou, 1985; Loken & James, 1990).
In this paper, consumers will concentrate on the high (or low) image characteristics
of products that are sold by a high (or low) image store, because a higher level of
congruence is generated, and more high (or low) image characteristics will be
perceived. However, in the case of high (or low) image characteristics of products that
are sold by a low (or high) image store, a poor level of congruence can occur.
From the perspective of cognitive consistency theory, consumers tend to sustain
consistent attitudes, beliefs and behaviours (Festinger, 1957; Heider, 1946). Thus,
consumers are more likely to accept novel information which corresponds to their
inherent stereotype (Newman, Stem, & Sprott, 2004; Simon & Holyoak, 2002). By
sustaining consistent beliefs toward items, consumers are able to protect their
fundamental core value system (Heider, 1946). A high (or low) image store carrying a
high (or low) image private label brands generates no cognitive dissonance. Since
13
dissonance leads to activate psychological discomfort, consumers will hold favourable
attitudes toward a store and its private label bands with a high level of schema
congruity rather than incongruity. Therefore, the following hypotheses regarding
category based process view II are suggested:
Hypothesis 3a: Based on the category-based process view II, consumers’
evaluations of a high image store will be higher when the store carries high image
private label brands only (a congruent relationship) than when the store carries both
high and low image private label brands (a incongruent relationship). (HH>HH+HL)
Hypothesis 3b: Based on the category-based process view II, consumers’
evaluations of a low image store will be higher when the store carries low image
private label brands only (a congruent relationship) than when the store carries both
low and high image private label brands (a incongruent relationship). (LL>LL+LH)
3.4 Variety-seeking Process
Kahn (1995) states that variety-seeking could be defined as the propensity of
consumers to look for diversity when they are choosing goods or services. McAlister
and Pessemier (1982) categorize variety-seeking behaviour into being direct and
derived. Direct variety-seeking includes psychological drives: “desire for change”,
“novelty” and “satiation with product/service attributes”. Under direct variety-seeking
circumstance, each brand has its inherent attribute stimulus. Variety-seeking process
will not be elicited until the optimum level of an attribute stimulus has been met after
a certain period of time. Consequently, consumers might feel satiated and be willing
to consume different attributes on the following shopping occasion (Coombs &
Avrunin, 1977). In another circumstance, consumers are seeking variety only because
14
of desire for novel and new stimuli. They tend to choose and try different brands just
for fun or thrill of it regardless the feeling of satiation (Berlyne, 1963, 1970) . Thus,
offering different private label-brands provide more shopping options to consumers
especially when they feel satiated with current brands or they desire for novelty.
Moreover, Gle´met and Mira (1993) convey that by offering diversified private label
brands, consumers are able to sample all of the options offered which to better satisfy
their needs. Simonson (1990) articulates that by providing larger assortment of
products /services, the time and effort required to accomplish a decision making
process is decreased and hence consumers are more willing to buy. Thus, the
following hypotheses are derived:
Hypothesis 4a: Based on the variety-seeking process, consumers’ evaluations of a
high image store will be lower when the store carries high image private label brands
only than when the store carries both high and low image private label brands, by
way of enlarging the variety of goods. (HH <HH+HL)
Hypothesis 4b: Based on the variety-seeking process, consumers’ evaluations of a
low image store will be lower when the store carries low image private label brands
only than when the store carries both low and high image private label brands, by
way of enlarging the variety of goods. (LL <LL+LH)
It is expected that private label brand models should have a significant moderating
effect on consumers’ attitudes toward a store with its private label brands. In order to
investigate the effect, our hypotheses were tested separately on both the DPLB model
and the SPLB model. In the DPLB experimental condition, different private label
15
brand names (i.e. Healthy-Life, Good-Life and Lifestyle) were used. However, in the
SPLB experimental condition, store names were added in front of each private label
brand (e.g. T-mart’s Healthy-Life, T-mart’s Good-Life and T-mart’s Lifestyle),
therefore the labels gave consumers the cue that all brands were private label brands of
the target store.
4 LABORATORY EXPERIMENT
A laboratory experiment with regular grocery shoppers was carried out to
investigate mediating effects about averaging processing, category based process
view I, category based process view II and variety seeking. Meanwhile, the
moderating effects regarding the SPLB model and the DPLB model were also tested.
In order to do so, a hypothetical grocery store T-Mart with its private label brand
biscuit category was used in the experiment. Initially, two types of questionnaires
were designed (the SPLB type and the DPLB type). In the SPLB type questionnaire,
names of store and its private label brands were manipulated into T-mart’s Healthy-
Life, T-Mart’s Good-Life and T-mart’s Lifestyle. Correspondingly, in the DPLB
questionnaire type, names of store and its private label brands were manipulated
independently into Healthy-life, Good-life and Lifestyle. Subsequently, high and low
levels of store images were manipulated by two different versions of cover stories.
Meanwhile, numerous studies on the price and quality relationship support the
postulation that shoppers use price as an informational signal to form up beliefs about
high or low merchandise's images (for a review, see Daniel & Janet, 2003; Rao &
Monroe, 1989; Volkner & Hofmann, 2007). Therefore, private label brand images
were mainly manipulated by different price ranges as well as the store quality
16
indexes. For example, “$5.59” or “5-stars” revealed the highest positive perception
image. In contrast, “$1.49” or “1-star” indicated the lowest perception image.
Eventually, a high or low (T-Mart’s) Lifestyle biscuit image were used to
manipulate schema (in)congruity and the consumer perception of all T-Mart’s biscuits
variety in this empirical study.
4.1 Methodology
4.1.1 Respondents and Design
The sample consisted of one hundred and sixty Auckland grocery shoppers who
ranged in age from 18 to 76 with the average age being 31.36 and had grocery
shopping experiences at least once in last four weeks. In terms of respondent gender,
33.8 percent were male and 66.3 percent were female. Because the proportion of
female grocery shoppers is much larger in New Zealand, than male grocery shoppers,
this gender ratio amongst the respondent cohort is logical and representative of the
‘real life’ situation. Furthermore, a random ordering of experimental packets
assigned respondents to one of eight experimental conditions in a 2 (private label
brand models: SPLB model vs. DPLB model) x 2 (images of stores: high image store
vs. low image store) x 2 (consistency of private label brand images: consistency vs.
inconsistency) between-subjects factorial design.
4.1.2 Stimulus Material
Different image stores were manipulated by initially telling respondents that T-mart
as a grocery retailer provides higher (or lower) price and superior (or inferior) quality
groceries, a tidy (or messy) and comfortable (or uncomfortable) shopping
atmosphere, outstanding (or poor) customer services, and convenient (or
inconvenient) locations. Meanwhile, T-mart with its private label brands were used
17
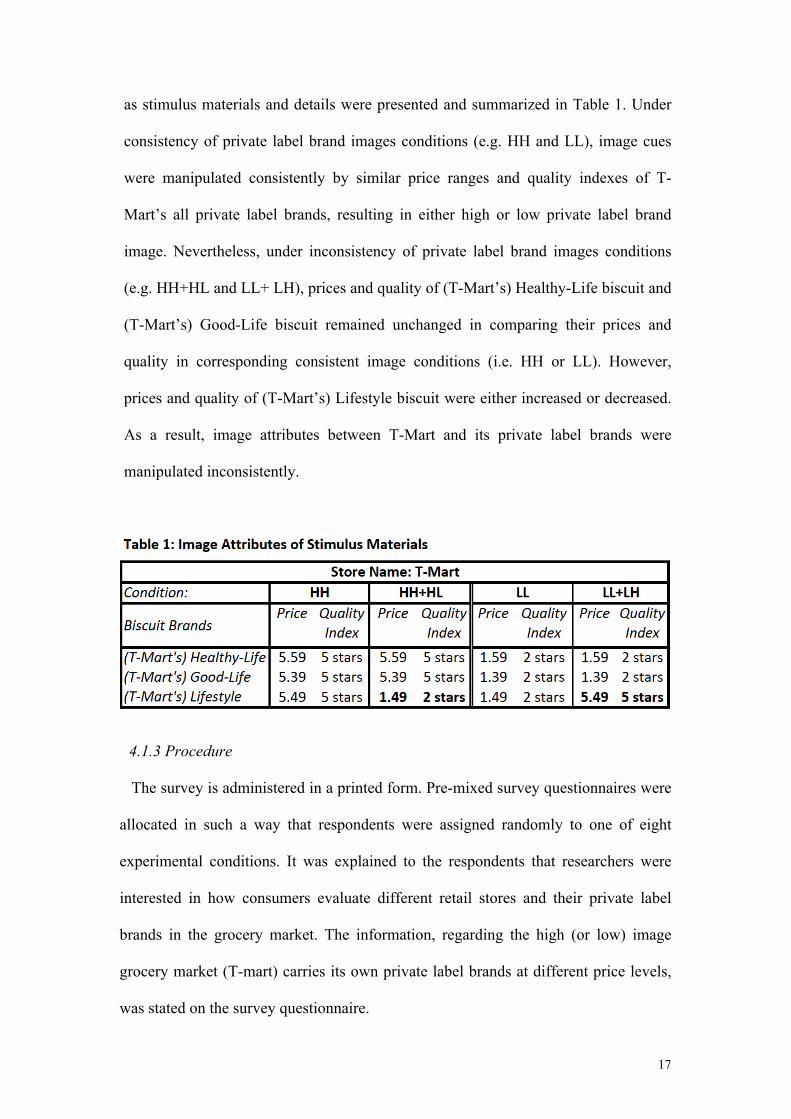
as stimulus materials and details were presented and summarized in Table 1. Under
consistency of private label brand images conditions (e.g. HH and LL), image cues
were manipulated consistently by similar price ranges and quality indexes of T-
Mart’s all private label brands, resulting in either high or low private label brand
image. Nevertheless, under inconsistency of private label brand images conditions
(e.g. HH+HL and LL+ LH), prices and quality of (T-Mart’s) Healthy-Life biscuit and
(T-Mart’s) Good-Life biscuit remained unchanged in comparing their prices and
quality in corresponding consistent image conditions (i.e. HH or LL). However,
prices and quality of (T-Mart’s) Lifestyle biscuit were either increased or decreased.
As a result, image attributes between T-Mart and its private label brands were
manipulated inconsistently.
4.1.3 Procedure
The survey is administered in a printed form. Pre-mixed survey questionnaires were
allocated in such a way that respondents were assigned randomly to one of eight
experimental conditions. It was explained to the respondents that researchers were
interested in how consumers evaluate different retail stores and their private label
brands in the grocery market. The information, regarding the high (or low) image
grocery market (T-mart) carries its own private label brands at different price levels,
was stated on the survey questionnaire.
18
Respondents were asked to imagine that they were buying biscuits in the T-mart.
Primarily, they were asked to rate their overall attitudes toward the store and their
private label brands on a seven point likert scale anchored as 1 (= very bad / very
unfavourable) and 7 (= very good / very favourable). Subsequently, the evaluation on
individual biscuit brands which contained a 7-point likert scale anchored as 1 (= very
bad / very unfavourable) and 7 (= very good / very favourable) was used to measure a
store and its private label brands attitudes. Meanwhile, by answering “how likely is it
that all three T-mart’s biscuit brands are high quality brands?” Respondents evaluated
the schema congruity along a scale from 1 (= extremely unlikely) to 7 (= extremely
likely). The perceived private label brand variety was specified by respondents along
a scale anchored as 1 (= low variety) and 7 (= high variety). Finally, four questions,
which were concerned with whether respondents agreed that the store and its private
label brand being high image were used to check the manipulation of this study. The
relevant scale was anchored as 1 (= strongly disagree) and 7 (= strongly agree).
4.2 Reliability
The reliability of evaluating overall store image and its overall biscuit category
image scales was measured by using Cronbach’s alpha coefficient (Nunnally, 1978).
Results suggested that the reliability of the above two scales had a strong internal
consistency (Cronbach’s α = 0. 99). Also, Cronbach’s alpha for the (T-Mart’s)
Healthy-Life attitude scale, (T-Mart’s) Good-Life attitude scale and (T-Mart’s)
Lifestyle attitude scale were all around 0.99. This correlates with a high degree of
reliability.
19
4.3 Manipulation Checks
4.3.1 Beliefs about overall store image, private label brand 1 and private label
brand 2
In order to check the manipulation on overall store image (T-Mart), we compared
respondent’s beliefs of overall store image between high and low image store
conditions. The result indicated that respondents’ beliefs were higher when the store
image is high (mean_high = 5.78) rather than when it is low (mean_low = 2.36; F (1,
158) = 442.19, p < 0.001). The manipulations on private label brand 1 (Healthy-Life)
and private label brand 2 (Good-Life) were also checked. Results showed that
respondents were more likely to believe that private label brand 1 and private label
brand 2 were high image brands under a high image store condition (mean_brand1 high =
6.18; F (1, 158) = 604.18) (mean_brand2 high = 5.96; F (1, 158) = 573.81) than a low
image store condition (mean_brand1 low = 2.42)(mean_brand2 low = 2.17).
4.3.2 Belief about the image of private label brand 3, images of stores and
(in)consistency of private label brands images
A 2 (images of stores: high image vs. low image) x 2 (consistency of private label
brand image: consistency vs. inconsistency) factorial analysis of variance, examined the
impacts of images of stores and (in)consistency of all private label brand images on
beliefs about the image of private label brand 3 (Lifestyle). Results indicated a
significant main effect for the images of stores (F (1, 156) = 16.38, p < 0.001).
Specifically, respondents generated more favourable beliefs toward image of private
label brand 3 under a high image store condition (mean_high = 4.20) rather than a low
image store condition (mean_high = 3.56). Meanwhile, results revealed that there were no
main effects between (in)consistency of private label brands images and beliefs about the
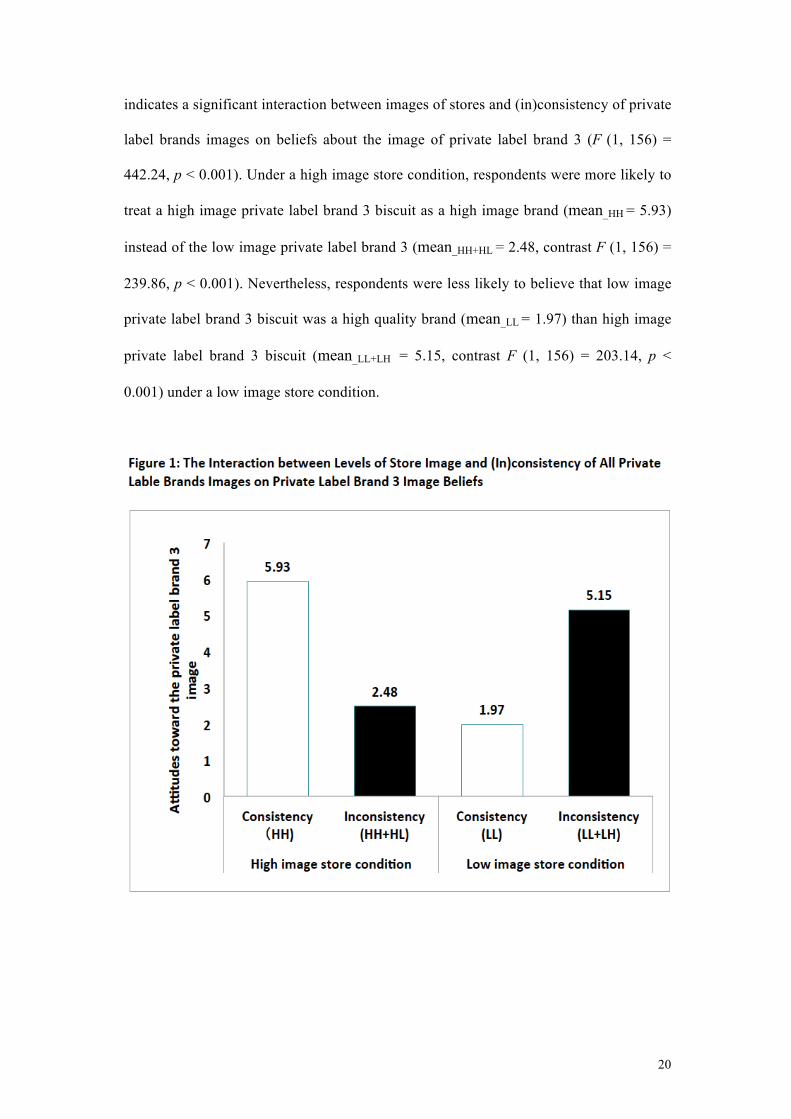
image of private label brand 3 (p = 0.384). As predicted and more importantly, Figure 1
20
indicates a significant interaction between images of stores and (in)consistency of private
label brands images on beliefs about the image of private label brand 3 (F (1, 156) =
442.24, p < 0.001). Under a high image store condition, respondents were more likely to
treat a high image private label brand 3 biscuit as a high image brand (mean_HH = 5.93)
instead of the low image private label brand 3 (mean_HH+HL = 2.48, contrast F (1, 156) =
239.86, p < 0.001). Nevertheless, respondents were less likely to believe that low image
private label brand 3 biscuit was a high quality brand (mean_LL = 1.97) than high image
private label brand 3 biscuit (mean_LL+LH = 5.15, contrast F (1, 156) = 203.14, p <
0.001) under a low image store condition.
21
4.3.3 Attitude ratings for all private label brands
In order to check manipulation on attitude ratings for all private label brands, factorial
ANOVA treating private label brand 1 (Healthy-Life), private label brand 2 (Good-Life)
and private label brand 3 (Lifestyle) as the dependent variable individually. Results
revealed that images of stores had a significant main effect on attitudes toward private
label brand 1 biscuit (F (1, 152) = 309.44, p < 0.001) and private label 2 biscuit (F (1,
152) = 340.71, p < 0.001). Specifically, under a high image store condition, mean ratings
regarding attitudes toward private label brand 1 (mean_high = 6.03) and brand 2
(mean_high = 5.90) were much higher than mean ratings under a low image store
condition (mean_low = 2.92; mean_low = 2.64). However, images of stores had no effect
on attitudes toward private label brand 3 biscuit (p = 0.065). As the key manipulation
variable, the attitude towards private label brand 3 biscuit was only affected by the
interaction between images of stores and (in)consistency of private label brands images
(F (1,152) = 306.57, p < 0.001). Respondents had more favourable attitudes toward the
high image private label brand 3 biscuit (mean_HH = 5.81) rather than the low image
private label brand 3 biscuit (mean_HH+HL = 2.45) that was sold in a high image store. In
contrarily, respondents generated less favourable attitudes toward the private label brand
3 biscuit with low image (mean_LL = 2.49) rather than the private label brand 3 biscuit
with high image (mean_LL+LH = 5.14) which was carried by a low image store.
4.4 Results
4.4.1 Overall store image
A 2 (private label brand models: SPLB model vs. DPLB model) x 2 (images of stores:
high image store vs. low image store) x 2 (consistency of private label brands images:
consistency vs. inconsistency) between-subjects ANOVA was used to analyse the overall
store image. With attitudes toward the store as a dependent variable, variables of private
22
label brand models (F (1, 152) = 4.28, p < 0.05) and images of stores (F (1, 152) =
518.13, p < 0.001) had a significant main effect on it. Specifically, respondents generated
more favourable attitudes toward the store by using the SPLB model (mean_SPLB = 4.36)
rather than the DPLB model (mean_DPLB = 4.04). Respondents were also more likely to
prefer a high image store (mean_high = 5.95) than a low image store (mean_low = 2.44)
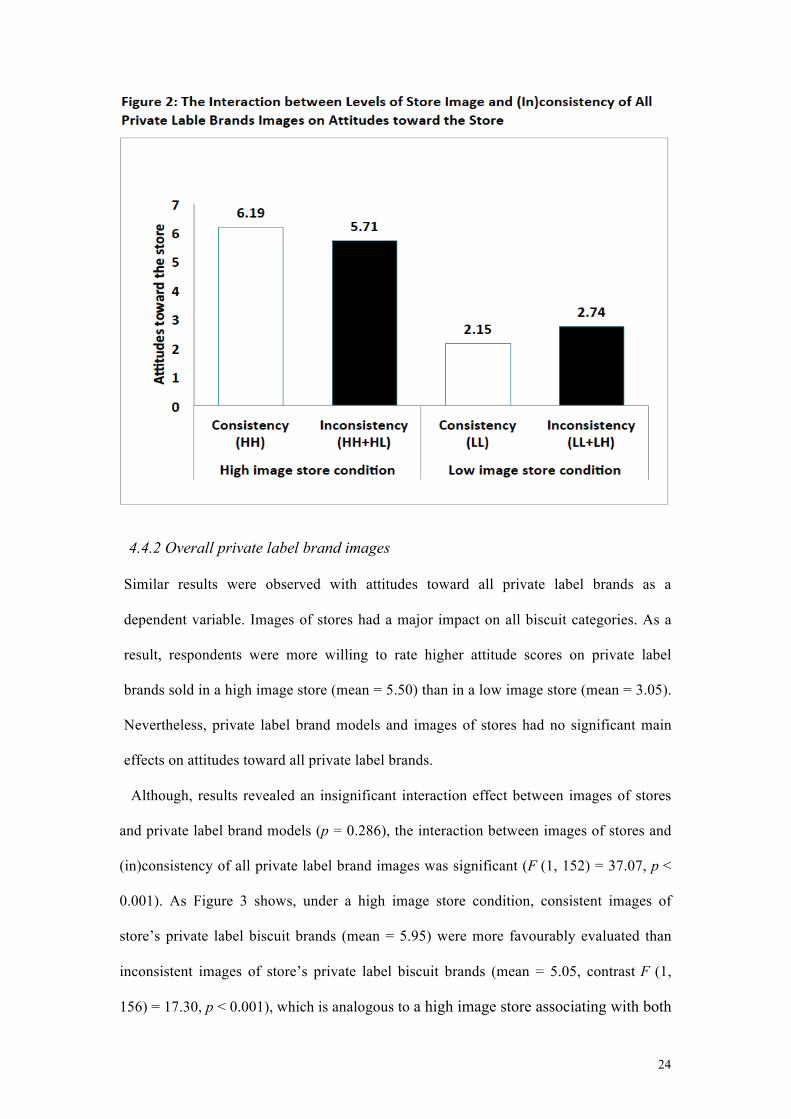
More importantly, the interaction between images of stores and (in)consistency of
private label brand images is significant (F (1, 152) = 11.90, p < 0.001). As Figure 2
shows, under a high image store condition, higher mean scores of attitudes on T-mart
were rated, when respondents were evaluating T-mart with its consistent images of
private label brands (mean_HH = 6.19), as opposed to a store that has inconsistent images
of private label brands (mean_HH+HL = 5.71, contrast F (1, 156) = 4.71, p < 0.05), namely,
a high image store associating with both high and low image private label brands
leads to a decrease in consumers’ attitudes toward the high image store. Nevertheless,
under a low image store condition, the mean score of attitudes on T-mart was lower when
T-mart associated with its consistent images of private label brands (mean_LL = 2.15), as
compared to low image store with inconsistent images of private label brands
(mean_LL+LH = 2.74, contrast F (1, 156) = 17.21, p < 0.01). By way of illustration, a low
image store associating with both low and high image private label brands leads to an
increase in consumers’ attitudes toward the low image store.
Discussion
The pattern of results supports Hypothesis 1a and Hypothesis 1b implying that
providing low (or high) image private label brands to a high (or low) image store that
associating with high (or low) image private label brands is more likely to diminish
the impact of high (or low) image-attributes on overall evaluation towards the store.
As a result, consumers generate less (or more) favourable attitudes toward a high (or
low) image store carrying both high and low image private label brands than a high
23
(or low) image store carrying high (or low) image private label brands only. Thus, the
notion of average process view is fully supported under both high and low image
conditions. Moreover, results also support Hypothesis 2b and Hypothesis 4b under a
low image store condition, however mediating effects regarding perceived variety and
category-based process view I under high image store conditions remain unclear.
Therefore, further analysis based on former mediating effects would be investigated
in later studies. To some extent, the present study shows that consumers are more
likely to prefer the SPLB model than the DPLB model. However, there are no
interaction effects regarding the SPLB model versus the DPLB model. Therefore, the
moderating role of private label brand models remains insignificant.
24
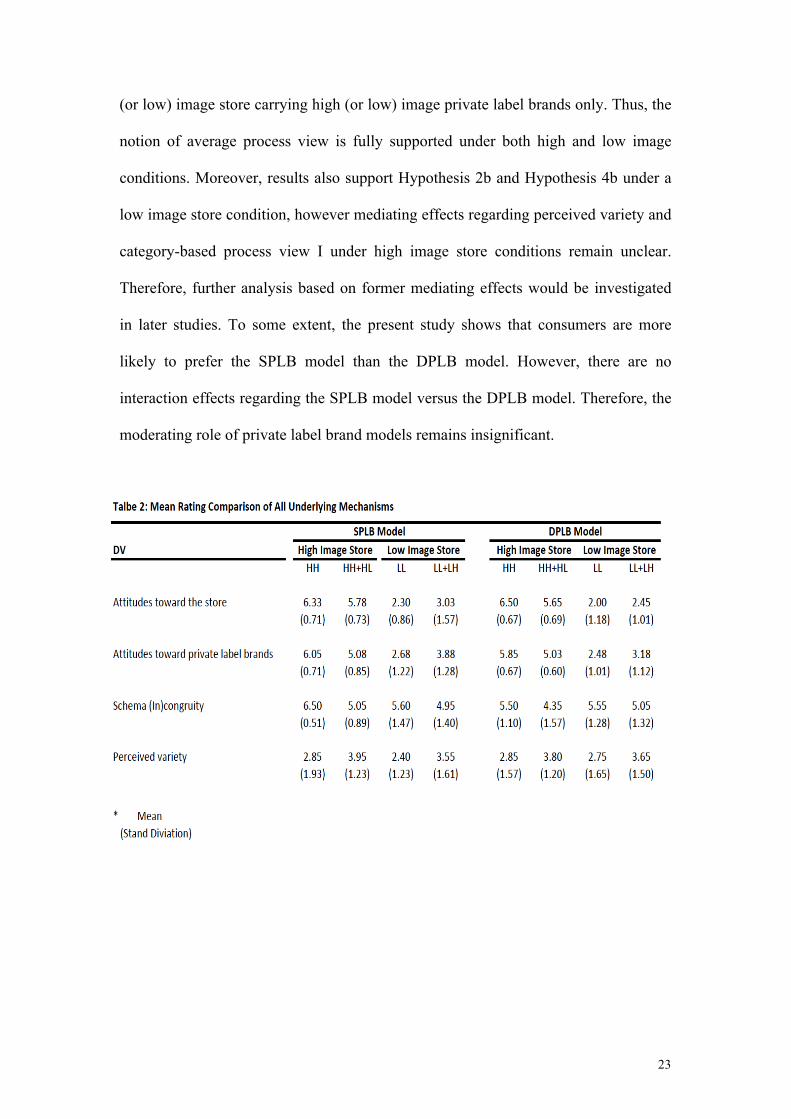
4.4.2 Overall private label brand images
Similar results were observed with attitudes toward all private label brands as a
dependent variable. Images of stores had a major impact on all biscuit categories. As a
result, respondents were more willing to rate higher attitude scores on private label
brands sold in a high image store (mean = 5.50) than in a low image store (mean = 3.05).
Nevertheless, private label brand models and images of stores had no significant main
effects on attitudes toward all private label brands.
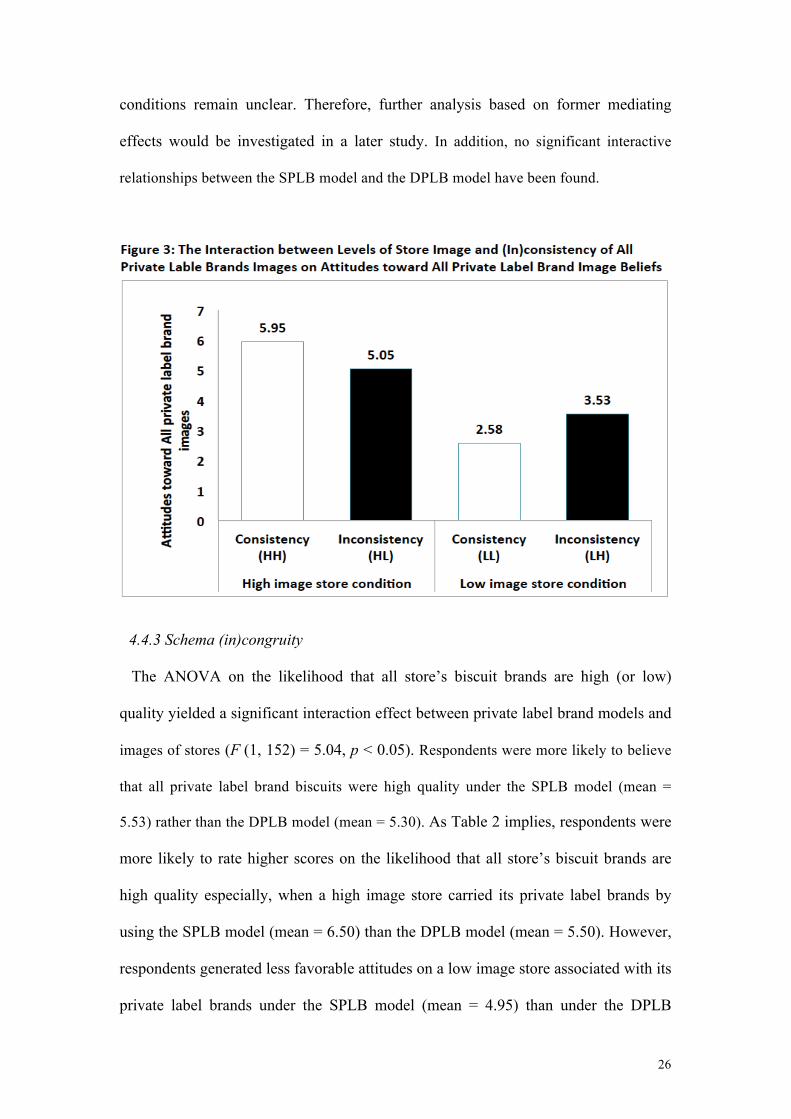
Although, results revealed an insignificant interaction effect between images of stores
and private label brand models (p = 0.286), the interaction between images of stores and
(in)consistency of all private label brand images was significant (F (1, 152) = 37.07, p <
0.001). As Figure 3 shows, under a high image store condition, consistent images of
store’s private label biscuit brands (mean = 5.95) were more favourably evaluated than
inconsistent images of store’s private label biscuit brands (mean = 5.05, contrast F (1,
156) = 17.30, p < 0.001), which is analogous to a high image store associating with both
25
high and low image private label brands, resulting in a decrease in consumers’
attitudes toward the high image private label brands. Contrarily, under a low image
store condition, the mean attitude score regarding consistent images of store’s private
label biscuit brands (mean = 2.58), tended to be lower than the mean attitude score
regarding inconsistent images of store’s private label biscuit bands (mean = 3.53, contrast
F (1, 156) = 19.28, p < 0.001) which is analogous to a low image store associating with
both low and high image private label brands, resulting in an increase in consumers’
attitudes toward the low image private label brands. In addition, there were no
significant interactions between private label brand models and (in)consistency of all
private label brand images (p = 0.565)
Discussion
The study provides additional evidence to support Hypotheses 1a and Hypotheses 1b
suggesting that offering low (or high) image private label brands to a high (or low)
image store that carrying high (or low) image private label brands tends to moderate the
impact of high (or low) image-attributes on overall evaluations toward private label
brands. In other words, consumers hold less (or more) favourable attitudes toward all
private label brands especially, when a high (or low) image store carries both high and
low image private label brands rather than a high (or low) image store carries high (or
low) image private label brands only. Furthermore, results also support Hypothesis 2b
and Hypothesis 4b under a low image store condition.
The aforementioned results of overall store image and overall private label band images
reveal sufficient evidence that averaging process view mediated the effects on consumers’
attitudes toward a store with its private label brands under both a high and low image
store conditions; as such H1a and H1b are supported. Results also support Hypothesis
2b and Hypothesis 4b under a low image store condition, however mediating effects
regarding perceived variety and category-based process view I under high image store
26
conditions remain unclear. Therefore, further analysis based on former mediating
effects would be investigated in a later study. In addition, no significant interactive
relationships between the SPLB model and the DPLB model have been found.
4.4.3 Schema (in)congruity
The ANOVA on the likelihood that all store’s biscuit brands are high (or low)
quality yielded a significant interaction effect between private label brand models and
images of stores (F (1, 152) = 5.04, p < 0.05). Respondents were more likely to believe
that all private label brand biscuits were high quality under the SPLB model (mean =
5.53) rather than the DPLB model (mean = 5.30). As Table 2 implies, respondents were
more likely to rate higher scores on the likelihood that all store’s biscuit brands are
high quality especially, when a high image store carried its private label brands by
using the SPLB model (mean = 6.50) than the DPLB model (mean = 5.50). However,
respondents generated less favorable attitudes on a low image store associated with its
private label brands under the SPLB model (mean = 4.95) than under the DPLB
27
model (mean = 5.05). Unfortunately, there was a marginal interaction effect between
images of stores and (in)consistency of all private label brand images on the likelihood
that all T-mart’s biscuit brands are high (or low) quality (F (1, 152) = 3.46, p =
0.065).
Discussion
The study indicates that consumers are more (or less) likely to believe that all
private label brands are high (or low) image brands sold in a high (or low) image store
by adopting the SPLB model than the DPLB model.
However, there are no interaction effects regarding store images and (in)consistency
of private label brand images on the schema (in)congruity. Thus, notions of category
based process view I and II are not supported in this study.
4.4.4 Perceived variety
A similar 2 x 2 x 2 between-subjects ANOVA suggested that there was a significant
main effect of (in)consistency of private label brand images on perceived store’s
biscuit variety (F (1, 152) = 18.50, p < 0.001). As a result, respondents tended to
perceived more biscuit variety when private label brand images were inconsistent
with the store image (mean = 3.74) rather than consistent with the store image (mean
= 2.71). However, there were no significant interaction effects between images of
stores and (in)consistency of private label brand images on perceived biscuit variety
(p = 1.00). Therefore, the perceived variety could be an underlying mechanism for
previous results of overall store image and overall private label brand images.
4.4.5 Additional analysis for perceived variety
In order to further investigate the role of perceived variety, additional regression
analyses were carried out. Results indicated that the regression model was significant
(F (3, 156) = 16.43, p < 0.01). More specifically: there was a significant positive
28
relationship between consumer attitudes toward private label brand 3 (Beta = 0.22, t =
2.82, p < 0.01), the perceived store’s biscuit variety (Beta = 0.17, t = 2.05, p < 0.05)
and consumer attitudes toward the store (this last being the dependent variable).
However, the perceived schema congruity had no significant influences on the
consumer attitudes toward the store (p = 0.862). Consequently, Hypothesis 2b was not
supported for attitudes toward the store.
Meanwhile, with attitudes toward all private label brand biscuits as a dependent
variable, analogous results were obtained. The regression model was significant (F (3,
156) = 24.81, p < 0.001), as the independent variables: attitudes toward private label
brand 3 (Beta = 0.38, t = 5.23, p < 0.001) and the perceived store’s biscuit variety
(Beta = 0.17, t = 2.24, p < 0.05), seem to have significant positive impacts on attitudes
toward all private label brand biscuits. However, with the perceived schema congruity
as an independent variable indicated an insignificant influence on attitudes toward all
private label brand biscuits (p = 0.995). As a result, Hypothesis 2b was not supported
for attitudes toward all private label brands
From the perspective of a high image store condition, the regression model was
significant (F (4, 75) = 8.42, p < 0.001). Nevertheless, results in Table 3 indicated that
perceived store’s biscuit variety (p = 0.433) and attitudes toward private label brand 3
(p = 0.052) did not have any significant influences on the dependent variable (i.e.
attitudes toward the store) under a high image store condition. Meanwhile, compared
to attitudes toward private label brand 2 (Beta = 0.21, t = 2.12, p < 0.05), private label
brand 1 (Beta = 0.37, t = 3.66, p < 0.001) had the strongest predictive power on the
dependent variable. Thus, the results above support Hypothesis 1a.
From the perspective of a low image store condition, the regression model was also
significant (F (4, 75) = 11.78, p < 0.001). Although, results revealed insignificant
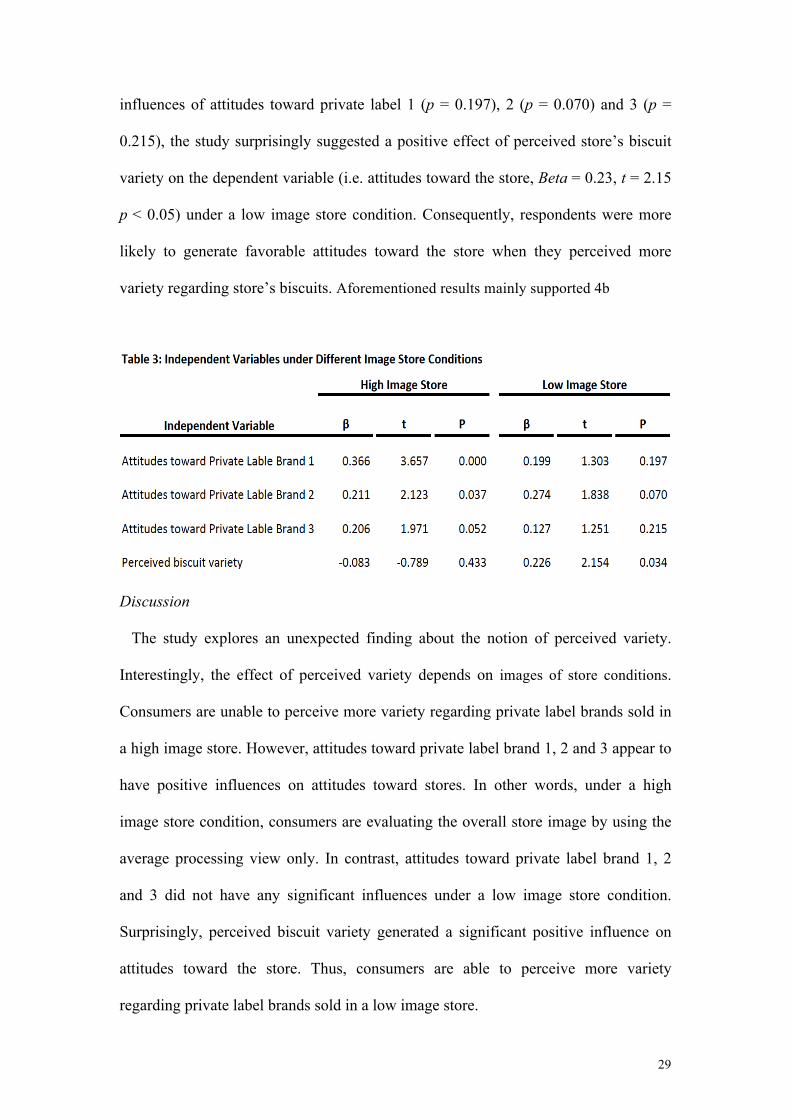
29
influences of attitudes toward private label 1 (p = 0.197), 2 (p = 0.070) and 3 (p =
0.215), the study surprisingly suggested a positive effect of perceived store’s biscuit
variety on the dependent variable (i.e. attitudes toward the store, Beta = 0.23, t = 2.15
p < 0.05) under a low image store condition. Consequently, respondents were more
likely to generate favorable attitudes toward the store when they perceived more
variety regarding store’s biscuits. Aforementioned results mainly supported 4b
Discussion
The study explores an unexpected finding about the notion of perceived variety.
Interestingly, the effect of perceived variety depends on images of store conditions.
Consumers are unable to perceive more variety regarding private label brands sold in
a high image store. However, attitudes toward private label brand 1, 2 and 3 appear to
have positive influences on attitudes toward stores. In other words, under a high
image store condition, consumers are evaluating the overall store image by using the
average processing view only. In contrast, attitudes toward private label brand 1, 2
and 3 did not have any significant influences under a low image store condition.
Surprisingly, perceived biscuit variety generated a significant positive influence on
attitudes toward the store. Thus, consumers are able to perceive more variety
regarding private label brands sold in a low image store.
30
5 CONCLUSION AND LIMITATION
In this study, we investigated the impact of (in)consistent images between a store and
its private label brands on consumers’ attitudes toward a store with its private label
brands under the SPLB model and the DPLB model. To some extent, the study
suggests that consumers are more (or less) likely to believe that all private label
brands are high (or low) image brands sold in a high (or low) image store by adopting
the SPLB model rather than the DPLB model. Meanwhile, the study further indicates
that consumers tend to prefer grocery stores by using the SPLB model rather than the
DPLB model. However, moderating effects of private label brand models toward
consumer evaluations on a store with its private label brands have not been found.
Moreover, tests of mediating effects regarding four underlying mechanisms (i.e.
averaging process view, variety-seeking process, category-based process view I and
category-based process view II), implied that only averaging process view mediated
the effects on consumers’ attitudes toward a grocery store and its private label brands.
Specifically, when a high (or low) image store not only associates with high (or low)
image but also low (or high) image private label brands, consumers are less (or more)
likely to generate favourable consumer attitudes toward them.
Our results also provide significant evidence to support the notion that perceived
variety has a mediating effect on consumers’ attitudes toward a store with its private
label brands especially under a low image store condition. In other words, consumers
will perceive more private label brand variety if they are shopping in a low image
grocery store than a high image grocery store.
The study of Bauer, Kotouc and Rudolph (2011) posits that the assortment’s pricing
is one of the major information cues that consumers use to form perceptions about
higher-level assortment. Therefore, this research indicates that pricing is the major
31
factor that affects consumers perceiving more variety under a low image store
condition in this study. According to behavioural pricing research, results indicate that
consumers develop a general category price perception for frequently purchased, low-
involvement merchandise (Mazumdar, Raj, & Sinha, 2005) when they are shopping
groceries instead of recalling the accurate numerical prices of specific products
(Dickson & Sawyer, 1990), consumers will then use the aforementioned general price
perception to judge the expensiveness of a particular product as being “too high”, “too
expensive” or “ good value” (Desai & Talukdar, 2003; Monroe & Lee, 1999). Since
the study of Bellizzi, Kruckeberg, Hamilton and Martin (1981) conveys that private
label products have been shown to be correlated by consumers with low prices, we
believe that consumers hold “good value” attitudes toward stores carrying their
private label brands with low prices. Consequently, a high-level of assortment can be
perceived by grocery shoppers.
In addition, this study contains two limitations that indicate the direction for future
research. Firstly, more robust evidence is required to explain the unpredicted result
with respect to perceived variety, particularly emphasising on the pricing factor.
Secondly, our study focused on the view of private label brands with its biscuit
category only; it may not represent the view of general grocery categories. Therefore,
grocery stores with more private label brand categories could be tested in future
studies.
32
6 REFERENCE
Alex, H. (1997). The Changing Organization of New Product Development for
Retailers' Private Labels: A UK-US Comparison. Agribusiness, 13(2), 169.
Anderson, N. (1971). Integration theory and attitude change. Psychological Review,
78, 171-206.
Anselmsson, J., & Johansson, U., &. (2007). Are the retailer motives of private label
brands fulfilled?: Creation of brand value, brand loyalty and the effect on
store image and store loyalty: Working Paper Series. : Lund Institute of
Economic Research.
Au-Yeung, A. Y. S., & Lu, J. (2009). Development of retailers' own label products in
Taiwan. Asia Pacific Journal of Marketing and Logistics, 21(4), 540-554.
doi:10.1108/13555850910997580
Baker, J., Parasuraman, A., Grewal, D., & Voss, G. B. (2002). The Influence of
Multiple Store Environment Cues on Perceived Merchandise Value and
Patronage Intentions. Journal of Marketing, 66(2), 120-141.
Barsalou, L. W. (1985). Ideals, Central Tendency, and Frequency of Instantiation as
Determinants of Graded Structure. Journal of Experimental Psychology :
Learning, Memory, and Cognition, 11(4), 629-654.
Bauer, J. C., Kotouc, A. J., & Rudolph, T. (2011). What constitutes a "good
assortment"? A scale for measuring consumers' perceptions of an assortment
offered in a grocery category. Journal of Retailing and Consumer Services(0).
doi:10.1016/j.jretconser.2011.08.002
Bellizzi, J. A., Kruckeberg, H. F., Hamilton, J. R., & Martin, W. S. (1981). Consumer
perceptions of national, private, and generic brands. Journal of Retailing and
Consumer Services, 57(4), 56-70.
33
Berlyne, D. E. (1963). Motivational problems raised by exploratory behavior. In S.
Koch (Ed.), Psychology: A Study of a Science New York: McGraw-Hill.
Berlyne, D. E. (1970). Novelty, complexity and hedonic value. Perception and
Psychophysics, 8(5A), 279-286.
Burt, S. (2000). The strategic role of retail brands in British grocery retailing.
European Journal of Marketing, 34(8), 875-890.
Chen, S. (2005). An empirical investigation of category-level effects of consumer
factors on private label purchase. Auckland University of Technology.
Auckland. Retrieved from
http://aut.researchgateway.ac.nz/bitstream/10292/313/2/ChenS.pdf
Collins-Dodd, C., & Lindley, T. (2003). Store brands and retail differentiation: the
influence of store image and store brand attitude on store own brand
perceptions. Journal of Retailing and Consumer Services, 10(6), 345-352.
Coombs, C., & Avrunin, G. S. (1977). Single peaked preference functions and theory
of preference. Psychological Review, 84(2), 216-230.
Coriolis Research. (2002). Responding to private label. Retrieved Apir, 26, 2011,
from
http://www.coriolisresearch.com/pdfs/coriolis_responding_to_private_label_i
n_new_zealand.pdf
Corstjens, Marcel, & Rajiv, L. (2000). Building Store Loyalty Though Store Brands.
Journal of Marketing Research, 37(3), 281-291.
Daniel, A. S., & Janet, W. (2003). Pricing store brands across categories and retailers.
The Journal of Product and Brand Management, 12(4/5), 201.
34
Desai, K. K., & Talukdar, D. (2003). Relationship between product groups’ price
perceptions, shopper’s basket size,and grocery store’s overall store price
image. Psychology and Marketing 20(10), 903-933.
Dickson, P. R., & Sawyer, A. G. (1990). The price knowledge and search of
supermarket shoppers. Journal of Marketing, 54(3), 42-53.
Festinger, L. (1957). A Theory of Cognitive Dissonace. Evanston, IL: Row Peterson.
Fraser, A. (2009). Customer attitudes to private labels: the role of store image.
Auckland university of Technology. Auckland, New Zealand.
Gle´met , G., & Mira, R. (1993). The Brand Leader’s Dilemma. McKinsey Quarterly,
2(3-15).
Goldstein, A. G., & June, E. C. (1980). Memory for Faces and Schema Theory.
Journal of Psychology, 105(1), 47-59.
Heider, F. (1946). Attitudes and Cognitive Organization. Journal of Psychology,
21(1), 107-112.
Hyman, M. R., Kopf, D. A., & Dongdae, L. (2009). Review of Literature- Future
research suggestions: Private label brands: Benefits, success factors and future
Research. Journal of Brand Management, 17(5), 368-389.
Kahn, B. E. (1995). Consumer variety-seeking among goods and services : An
integrative review. Journal of Retailing and Consumer Services, 2(3), 139-
148.
Keaveney, S. M., & Hunt, K. A. (1992). Conceptualization and operationalization of
retail store image: a case of rival middle-level theories. Journal of the
Academy of Marketing Science, 20(2), 165-176.
Kim, J. K., Park, J. W., & Ryu, G. S. (2006). Decoy Effecs and Brands. Advances in
Consumer Research, 33, 683-687.
35
Lee, D., & Hyman, M. R. (2008). Hedonic/functional congruity between stores and
private label brands. Journal of Marketing Theory and Practice, 16(3), 219-
232.
Lefkoff-Hagius, R., & Mason, C. H. (1993). Characteristic, beneficial and image
attributes in consumer judgements of similarity and preference. Journal of
Consumer Research, 20(1), 100-110.
Loken, B., & James, W. (1990). Alternative Approaches to Understanding the
Determinants of Typicality. Journal of COnsumer Research, 17(2), 111-126.
Mandle, G. (1982). The Structute of Value: Accounting for Taste. In M. S. C. & S.
T.F. (Eds.), Affect and Cognition: The 17th Annual Carnegie Symposium (pp.
3-36). Hillsdale, NJ: Lawrence Erlbaum Associates.
Martenson, R. (2007). Corporate brand image, satisfaction and store loyalty: A study
of the store as a brand, store brands and manufacturer brands. International
Journal of Retail and Distribution Management, 35(7), 544-555.
Mazumdar, T., Raj, S. P., & Sinha, I. (2005). Reference price research: reviewand
propositions. Journal of Marketing Research, 69(4), 84-102.
Mazurshky, D., & Jacoby, J. (1986). Exploring he Development of Store Images.
Journal of Retailing, 62(2), 145-165.
McAlister, L., & Pessemier, E. A. (1982). Variety-seeking behavior: an
interdisciplinary review. Journal of Consumer Research, 9, 311-322.
Mervis, C., & Rosch, E. (1981). Categorization of Natural Objects. Annual Review of
Psychology, 32.
Meyers-Levy, J., & Alice, T. (1989). Schema congruity as a base for product
evaluation Journal of Consumer Research, 16(March), 39-54.
36
Monroe, K. B., & Lee, A. Y. (1999). Remembering versus knowing: issues in buyers’
processing of price information.
27 (2),207–225. Journa lof the Academy of Marketing Science, 27(2), 207-225.
Nandan, S., & Dickinson, R. (1994). Private B rands: Major Brand Perspective.
Journal of Consumer Marketing, 11, 18-28.
Newman, E. J., Stem, D. E., & Sprott, D. E. (2004). Banner Advertisement and
Website Congruity Effects on Consumer Website Perceptions. Industrial
Management & Data Systems, 104(3), 273-281.
Nunnally, J. C. (1978). Psychometric Theory (2nd ed.). New York, NY: McGraw-
Hill.
Park, C. W., Jun, S. Y., & Shocker, A. D. (1996). Composite branding alliances: an
investigation of extension and feedback effects. Journal of Marketing
Research, 33(4), 453-466.
Pettijohn, L. S., Mellott, D. W., & Pettijohn, C. E. (1992). The Relationship Between
Retailer Image and Brand Image. Psychology & Marketing, 9(4), 311-328.
Raju, J. S., Sethuraman, R., & Dhar, S. K. (1995a). The introduction and performance
of store brands. Management Science, 41(6), 957-977.
Rao, A. R., & Kent, M. (1988). The moderating effect of prior knowledge on cue
utilization in product evaluations. Journal of Consumer Research,
15(September), 253-264.
Rao, A. R., & Monroe, K. B. (1989). The effect of price,brand name, and store name
on buyers’ perceptions of product quality: an integrative review. . Journal of
Marketing Research, 26(3), 351-357.
Robert, L. S. (2004). The Nature and Benefits of National Brand/Private Label
Competition. Review of Industrial Organization, 24(2), 105.
37
Sayman, S., & Raju, J. S. (2004). How category characteristics affect the number of
store brands offered by the retailer: a model and empirical analysis. Journal of
Retailing, 80(4), 279-287.
Schank, R. C., & Robert, P. A. (1977). Scripts, Plans, Goals and Understanding.
Hillsdale, NJ: Lawrence Erlbaum.
Simon, D., & Holyoak, K. J. (2002). Strctural Dynamics of Cognition: From
Consistency Theories to Constraint Satisfaction. Personality and Social
Psychology Review, 6(6), 283-294.
Simonson, I. (1990). The effect of purchase quantity and timing on variety-seeking
behavior Journal of Markeing Research, XXVII, 150-162.
Sujan, M. (1985). Consumer Knowledge: Effects on Evaluation Strategies Mediating
Consumer Judgments. Journal of Consumer Research, 12(June), 31-46.
Sujan, M., & Christine, D. (1987). Product categorization and inference making:
Some implications for comparative advertising. Journal of Consumer
Research, 14, 372-378.
Troutman, C. M., & Shanteau, J. (1976). Do Consumers Evaluate Products by Adding
or Averaging Attribute Information? Journal of Consumer Research, 3(2),
101-106.
Tsung-Chi, L., & Chung-Yu, W. (2008). Factors affecting attitudes toward private
labels and promoted brands. Journal of Marketing Management, 24(3), 283-
298.
Volkner, F., & Hofmann, J. (2007). The price-perceived quality relationship: a meta-
analytical review and assessment of its determinants. MarketingLetters, 18(3),
181-196.
38
Walton, G., & Bower, T. G. R. (1993). Newborns Form 'Prototypes' in Less Than 1
Minute. Psychological Science, 4(3), 203-205.
Washburn, J. H., Till, B. D., & Priluck, R. (2000). Co-branding: brand equity and trial
effects. Journal of Consumer Marketing, 17, 591-640.