Consumers and energy efficiency - Turun yliopisto · Consumers and energy efficiency (Workpackage...
32
www.euforie-h2020.eu This project is supported by the European Commission Horizon2020 Research and Innovation Programme Consumers and energy efficiency (Workpackage 5) Country Report for Italy An inventory of policies, business and civil society initiatives focusing on heating & hot water and the use of electricity December, 2015
Transcript of Consumers and energy efficiency - Turun yliopisto · Consumers and energy efficiency (Workpackage...

www.euforie-h2020.eu
This project is supported by the European Commission Horizon2020 Research and Innovation Programme
Consumers and energy efficiency (Workpackage 5)
Country Report for Italy
An inventory of policies, business and civil society initiatives focusing on heating & hot water and the use of electricity
December, 2015

WP 5 Country Report Italy
2
Methodological notes:
This report has been compiled as a result of desktop search into:
i) data on energy consumption in the household sector in Spain, and
ii) policies, business and civil society initiatives mainly at the national level to promote energy efficiency in the household sector in Spain.
The report focuses on the use of energy in the household sector for the purposes of heating and the use of hot water, as well as on the use of electricity. Transport-related use of energy is excluded.
The data analysis on energy consumption is based on the ODYSSEE database on energy efficiency indicators and data (http://www.odyssee-mure.eu), using the most recent data available.
The scope of information presented in the report in the case of policies at the national level is mainly on governmental measures in effect. In the case of business and civil society initiatives the main objective of the report is to illustrate diversity and not to provide a complete overview or an exhaustive list of all existing initiatives. An attempt was made to introduce the better-known campaigns and programmes as well as to indicate the variety of the actions.
The collection of information was concluded by end of December 2015.
Please cite as:
Trotta, Gianluca; Ripa, Maddalena and Lorek, Sylvia (2015). Consumers and Energy Efficiency – Country Report Italy. An inventory of policies, business and civil society initiatives, focusing on heating, hot water and the use of electricity. EUFORIE – European Futures for Energy Efficiency

EUFORIE
3
Content Abbreviations .......................................................................................................................................... 4
List of tables ............................................................................................................................................ 5
List of figures ........................................................................................................................................... 5
1. Introduction .................................................................................................................................... 6
1.1 General socio-economic and energy data .................................................................................... 6
1.2 Specific data on residential building stock and related energy use ............................................ 10
2. Politics affecting energy consumption in households ...................................................................... 12
2.1 General policy framework..................................................................................................... 12
2.2 Energy efficiency targets ....................................................................................................... 12
2.3 Specific policies ..................................................................................................................... 13
2.3.1 Regulatory ............................................................................................................................ 13
2.3.2 Economic ............................................................................................................................. 14
2.3.3 Informational ...................................................................................................................... 20
2.4 Side effects of politics ................................................................................................................. 22
3. Private sector support complementing public policies .................................................................... 24
3.1 Energy Service Companies (ESCOs) ............................................................................................ 24
3.2 Banks and financial facilities ....................................................................................................... 24
3.2.1 Officinæ Verdi ...................................................................................................................... 25
3.2.2 Banca Etica ........................................................................................................................... 25
3.2.3 BNL ....................................................................................................................................... 25
3.3 Initiatives for households by private utility companies .............................................................. 25
3.4 Energy Efficiency Funds .............................................................................................................. 26
3.5 The Covenant of Mayors ............................................................................................................. 27
4. Initiatives targeting households behavior ........................................................................................ 28
References ............................................................................................................................................ 30

WP 5 Country Report Italy
4
Abbreviations
AEEG Autorità per l'Energia Elettrica il Gas e il Sistema Idrico
AMR Automated Meter Reading
CIG Comitato Italiano Gas
CNCU Consiglio Nazionale dei Consumatori e degli Utenti
CRESME Centro Ricerche Economiche Sociologiche e di Mercato nell'Edilizia
DSOs Distribution System Operators
EEC Energy Efficiency Certificates
EMGs Energy Management Experts
EMS Energy Management System
ENEA Ente Nazionale per l'Energia e l'Ambiente
ENEL Ente Nazionale per l'Energia Elettrica
EPC Energy Performance Contracting
EPBD Energy Performance of Buildings Directive
ERDF European Regional Development Fund
ESCOs Energy Service Companies
GHG Greenhouse Gas
GSE Gestore dei Servizi Energetici
IRES Imposta sul Reddito delle Società
IRPEF Imposta sul Reddito delle Persone Fisiche
ISPRA Istituto Superiore per la Protezione e la Ricerca Ambientale
ISTAT Istituto Nazionale di Statistica
Kwh Kilowatt hour
Mtoe Million tons of oil equivalent
NEEAP National Energy Efficiency Action Plan
NRAs National Regulatory Authorities
OECD Organisation for Economic Co-operation and Development
PIDEE Piano Integrato di Diffusione dell’Efficienza Energetica
SEAP Sustainable Energy Action Plan

EUFORIE
5
List of tables Table 1. General socio-economic data .................................................................................................... 6 Table 2. Data related residential energy consumption .......................................................................... 7 Table 3. Environmental aspects of residential energy consumption .................................................... 10 Table 4. Residential buildings in 2011 by construction period ............................................................. 11 Table 5. Policy instruments to improve energy efficiency in the residential sector and expected energy savings at 2020 (Mtoe) ............................................................................................................. 13 Table 6. Potential of final energy saving in the residential sector, years 2014-2020 ........................... 14 Table 7. Tax deductions for building rehabilitation and building renovation (2007-2013) .................. 15 Table 8. Requests for tax deductions received by type (2007-2013) ................................................... 16
List of figures Figure 1. Italy’s final residential energy consumption by source 1995 – 2012 (Mtoe) .......................... 8 Figure 2. Italy’s final residential energy consumption by end-use 2012 (%) .......................................... 8 Figure 3. Italy’s final energy consumption per dwelling 1995-2012 (toe/dwellings) ............................. 9 Figure 4. Italy’s space heating consumption per dwelling 1995-2012 (toe/dwellings) .......................... 9 Figure 5. Residential building stock by construction period ................................................................. 11

WP 5 Country Report Italy
6
1. Introduction
1.1 General socio-economic and energy data Italy is the world’s ninth biggest economy (IMF, 2015). Italy economy grew by 11.40% in the period 1995-2012; GDP and private consumption at 2005 PPP increased with an average annual rate of 0.63% and 0.7%, respectively (Table 1).
Its economic structure relies mainly on services and manufacturing. The tertiary sector accounted for almost three quarters of total GDP in 2012 (67.3%) and employed around 65% of the country’s total employed population. Within the tertiary sector, the most important contributors are the wholesale, retail sales and transportation sectors. Industry accounted for the 21% of Italy’s total production and employed around 30% of the total workforce. Manufacturing is the most important sub-sector within the industry sector. The country’s manufacturing is specialized in high-quality goods and is mainly run by small- and medium-sized enterprises. Most of them are family-owned enterprises. Agriculture contributed the 2% share of total GDP and it employed around 4.0% of the total workforce.
The population of Italy was estimated at 59.685,23 as of 2012 (60.782,67 million in 2013, Odyssee database LE), equivalent to 11.7% of the total European Union population. The population from 1995 to 2012 remained almost stable. Table 1. General socio-economic data
SOCIO-ECONOMIC
Item Unit 1995 2005 2012
GDP at exchange rate M€2005 1.288.329,77 1.490.409,36 1.435.251,19 GDP at 2005 PPP M€2005p 1.244.402,37 1.439.591,77 1.386.314,30
Population k 56.844,20 58.064,21 59.685,23 Number of households k 20.755,09 23.206,59 25.078,72 Private consumption of household at exchange rate M€2005 769.554,41 893.146,53 867.330,75
Private consumption of household at 2005 PPP M€2005p 743.315,38 862.693,45 837.757,90 Value added of agriculture at exchange rate M€2005 28688,33 30226,56 29840,38
Value added of agriculture at 2005 PPP M€2005p 27710,16 29195,94 28822,93 Value added of industry at exchange rate M€2005 320530,34 347041,69 307015,15
Value added of industry at 2005 PPP M€2005p 309601,41 335208,81 296547,04 Value added of tertiary at exchange rate M€2005 817322,56 967038,12 966361,32
Value added of tertiary at 2005 PPP M€2005p 789454,8 934065,6 933411,88 Source: Odyssee database
In 2012, Italy’s final residential energy consumption amounted to 30.21 Mtoe – a 17.82% increase compared to 1995 – reaching its peak in 2010, with 32.31 Mtoe. The household sector accounted for 24.6% of Italy’s total energy end-use in 2012, and the residential final energy consumption per capita was 0.5 Toe per inhabitant.
EUFORIE
7
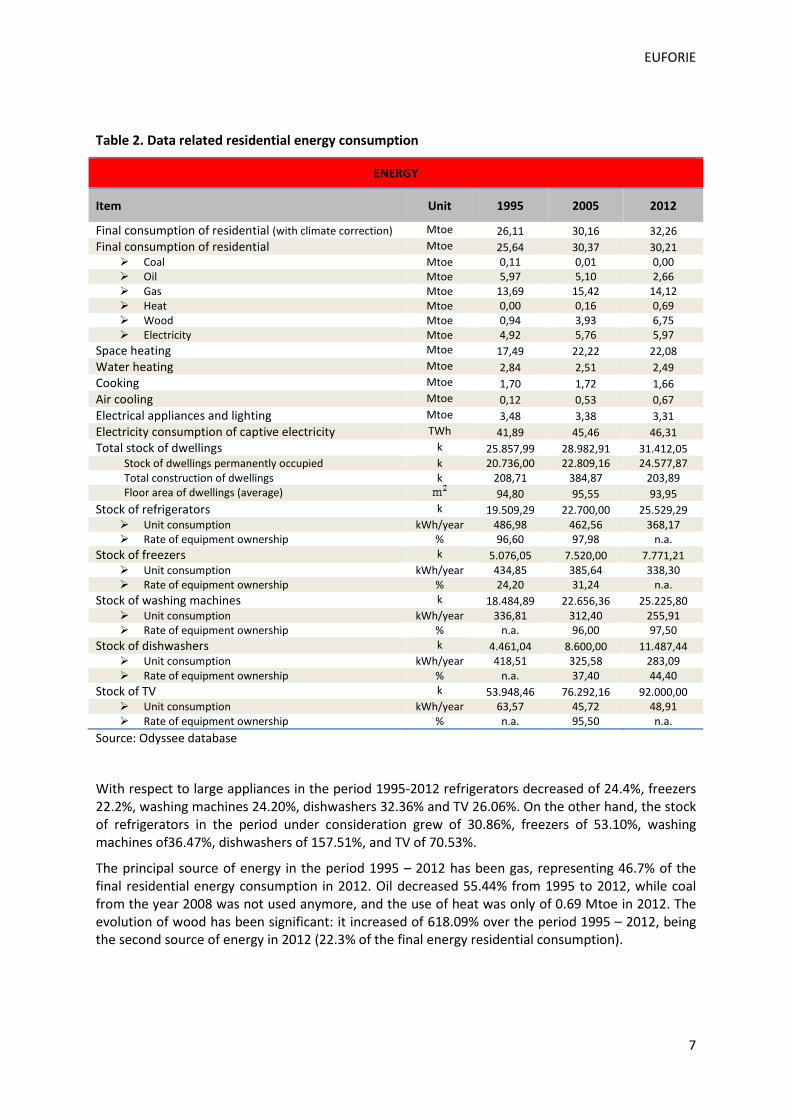
Table 2. Data related residential energy consumption
ENERGY
Item Unit 1995 2005 2012
Final consumption of residential (with climate correction) Mtoe 26,11 30,16 32,26 Final consumption of residential Mtoe 25,64 30,37 30,21
Coal Mtoe 0,11 0,01 0,00 Oil Mtoe 5,97 5,10 2,66 Gas Mtoe 13,69 15,42 14,12 Heat Mtoe 0,00 0,16 0,69 Wood Mtoe 0,94 3,93 6,75 Electricity Mtoe 4,92 5,76 5,97
Space heating Mtoe 17,49 22,22 22,08 Water heating Mtoe 2,84 2,51 2,49 Cooking Mtoe 1,70 1,72 1,66 Air cooling Mtoe 0,12 0,53 0,67 Electrical appliances and lighting Mtoe 3,48 3,38 3,31 Electricity consumption of captive electricity TWh 41,89 45,46 46,31 Total stock of dwellings k 25.857,99 28.982,91 31.412,05
Stock of dwellings permanently occupied k 20.736,00 22.809,16 24.577,87 Total construction of dwellings k 208,71 384,87 203,89 Floor area of dwellings (average) 94,80 95,55 93,95
Stock of refrigerators k 19.509,29 22.700,00 25.529,29 Unit consumption kWh/year 486,98 462,56 368,17 Rate of equipment ownership % 96,60 97,98 n.a.
Stock of freezers k 5.076,05 7.520,00 7.771,21 Unit consumption kWh/year 434,85 385,64 338,30 Rate of equipment ownership % 24,20 31,24 n.a.
Stock of washing machines k 18.484,89 22.656,36 25.225,80 Unit consumption kWh/year 336,81 312,40 255,91 Rate of equipment ownership % n.a. 96,00 97,50
Stock of dishwashers k 4.461,04 8.600,00 11.487,44 Unit consumption kWh/year 418,51 325,58 283,09 Rate of equipment ownership % n.a. 37,40 44,40
Stock of TV k 53.948,46 76.292,16 92.000,00 Unit consumption kWh/year 63,57 45,72 48,91 Rate of equipment ownership % n.a. 95,50 n.a.
Source: Odyssee database
With respect to large appliances in the period 1995-2012 refrigerators decreased of 24.4%, freezers 22.2%, washing machines 24.20%, dishwashers 32.36% and TV 26.06%. On the other hand, the stock of refrigerators in the period under consideration grew of 30.86%, freezers of 53.10%, washing machines of36.47%, dishwashers of 157.51%, and TV of 70.53%. The principal source of energy in the period 1995 – 2012 has been gas, representing 46.7% of the final residential energy consumption in 2012. Oil decreased 55.44% from 1995 to 2012, while coal from the year 2008 was not used anymore, and the use of heat was only of 0.69 Mtoe in 2012. The evolution of wood has been significant: it increased of 618.09% over the period 1995 – 2012, being the second source of energy in 2012 (22.3% of the final energy residential consumption).
WP 5 Country Report Italy
8
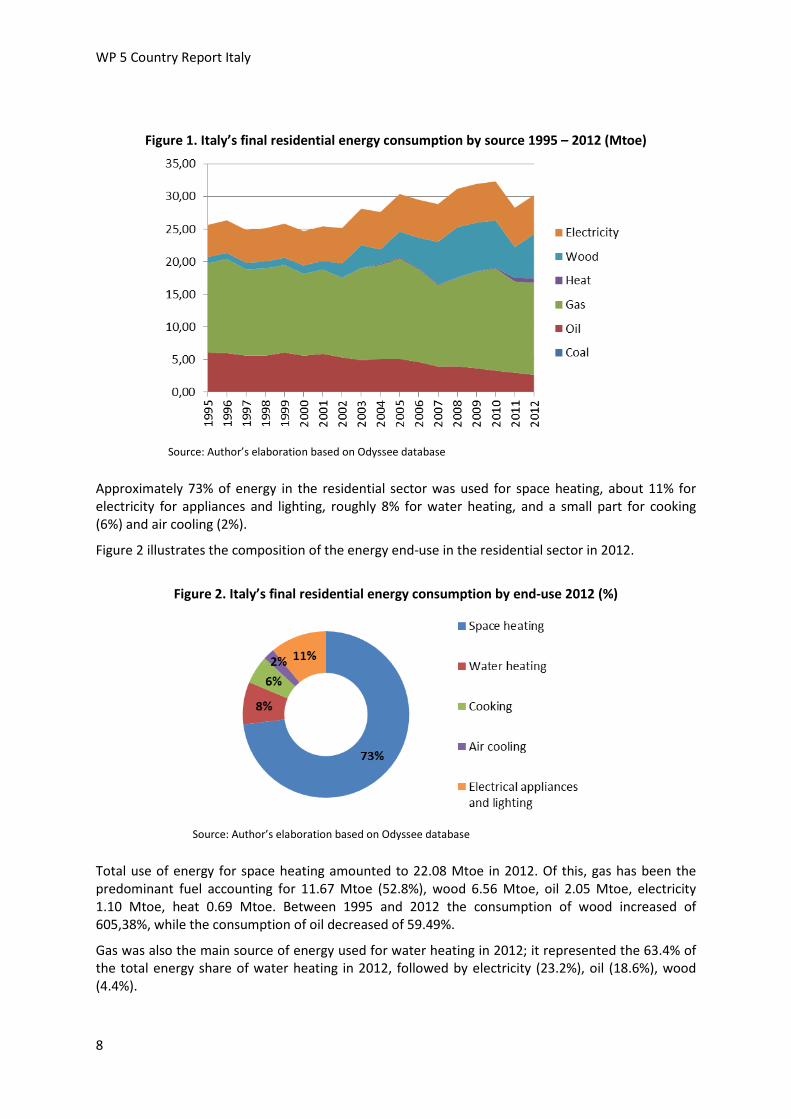
Figure 1. Italy’s final residential energy consumption by source 1995 – 2012 (Mtoe)
Source: Author’s elaboration based on Odyssee database Approximately 73% of energy in the residential sector was used for space heating, about 11% for electricity for appliances and lighting, roughly 8% for water heating, and a small part for cooking (6%) and air cooling (2%).
Figure 2 illustrates the composition of the energy end-use in the residential sector in 2012.
Figure 2. Italy’s final residential energy consumption by end-use 2012 (%)
Source: Author’s elaboration based on Odyssee database Total use of energy for space heating amounted to 22.08 Mtoe in 2012. Of this, gas has been the predominant fuel accounting for 11.67 Mtoe (52.8%), wood 6.56 Mtoe, oil 2.05 Mtoe, electricity 1.10 Mtoe, heat 0.69 Mtoe. Between 1995 and 2012 the consumption of wood increased of 605,38%, while the consumption of oil decreased of 59.49%.
Gas was also the main source of energy used for water heating in 2012; it represented the 63.4% of the total energy share of water heating in 2012, followed by electricity (23.2%), oil (18.6%), wood (4.4%).

EUFORIE
9
51.8% of energy consumed for cooking in 2012 came from gas, 24% from oil, 19.2% from electricity and the remaining 4.8% from wood.
In 2012, the average floor area of dwellings was about 93.35 m², bigger than the average of the European Member States (87.81 m²). Energy consumption of households per permanently occupied dwellings (calculated at normal climate), was 1.31 toe/dwelling and smaller than the average of the European Member States (1.41 toe/dwelling).
Figure 3 shows the household consumption at normal climate per dwelling of Italy compared to the average of the European Member States over the period 1995-2012, while Figure 4 shows the household space heating consumption at normal climate per dwelling compared to the average of the European Member States.
Figure 3. Italy’s final energy consumption per dwelling 1995-2012 (toe/dwellings)
Source: Author’s elaboration based on Odyssee database
Figure 4. Italy’s space heating consumption per dwelling 1995-2012 (toe/dwellings)
Source: Author’s elaboration based on Odyssee database

WP 5 Country Report Italy
10
Regarding CO2 emissions the residential sector’s share of total emissions (75.37 Mt CO2, Table 3) decreased of only 6.14% from 1995 to 2012 and it was more than two times the average of the European Union (27.9 Mt CO2), decreased of 11.89% in the same period. In addition, Italy is ranked in the sixteenth position for the emissions of the residential sector per capita among the European Member States in 2012 (where Estonia is in the first position and is the less efficient).
Table 3. Environmental aspects of residential energy consumption
ENVIRONMENT
Item Unit 1995 2005 2012
CO2 emissions of households (excluded electricity) Mt 50,10 57,34 47,27 Total CO2 emissions of households (included electricity)
Mt 80,31 90,51 75,37 CO2 emissions per dwelling t /dw 2,42 2,51 1,92
CO2 emissions per dwelling (with climatic corrections) t /dw 2,45 2,45 2,01 CO2 emissions per dwelling with climatic corrections (included electricity)
t /dw 3,91 3,91 3,16
CO2 emissions of space heating per dwelling t /dw 2,01 2,13 1,57 CO2 emissions of space heating (with climatic corrections)
t /dw 2,03 1,83 1,44
CO2 emissions of space heating with climatic corrections (included electricity)
t /dw 2,08 2,03 1,67
Degree-days degree 1.928,66 2.050,73 1.828,97 Source: Odyssee database
In 2012, CO2 emissions per dwelling with climatic corrections (included electricity) were 3,16 (t CO2/dwelling), below the European average (3,74). Also, CO2 emissions of space heating with climatic corrections (included electricity) were the 16.5% below the European average (t CO2/dw 2).
1.2 Specific data on residential building stock and related energy use
In the national territory there are about 13.6 million buildings, most of them for residential use; the rest is for non-residential use (hotels, offices, trade, hospitals, churches, etc.). Approximately 5.8 million of the residential buildings are concentrated in just five regions: Sicily, Lombardy, Veneto, Puglia and Piedmont. Alone, Sicily and Lombardy account for 23.9% of the country’s residential buildings.
As at 2011 buildings for residential use were 12.1 million and comprised more than 29 million dwellings. More than 60% of this building stock is over 45 years old, and more than 25% of total buildings are in the consumption band between 160 kWh/(m²*year) and over 220 kWh/(m²*year). The last nationwide census was carried out by ISTAT in 2011. The following table summarizes the situation of the residential building stock, broken down by year of construction (Table 2).

EUFORIE
11
Table 4. Residential buildings in 2011 by construction period
Construction period
<1918 1919- 1945
1946-1960
1961-1970
1971-1980
1981-1990
1991-2000
2001-2005 >2006 Total
buildings
Number of buildings
1.832.50 1.327.00 1.700.83 2.050.83 2.117.65 1.426.76 871.017 465.104 359.979 12.178.698
% 15 10.8 13.9 16.8 17.3 11.7 7.1 3.8 2.9 100
Source: ISTAT (2011) In Italy, about 72% of the residential building stock existing in 2011 was built after 1976, the year the first thermal regulation came into force (Figure 4).
Figure 5. Residential building stock by construction period
Source: ISTAT (2011)
There are approximately 24 million of dwellings permanently occupied in the national territory. Of these, 73.9% are composed by multi-family buildings with an average size of 91 m², while the single-family dwellings (26.1% of the total residential stock) have an average size of 110 m².

WP 5 Country Report Italy
12
2. Politics affecting energy consumption in households
2.1 General policy framework The main policy instruments to improve energy efficiency in the residential sector with the aim of achieving the European energy savings target and as part of Italy’s decarbonisation roadmap to 2050 are:
Regulatory: Legislative Decree No. 192/2005 (and its implementing decrees L. D. 311/2006 and L. D. 115/2008), Presidential Decree 59/2009, Ministerial Decree 26/06/2009, Legislative Decree No 28/2011, Decree Law No 104/2012, Presidential Decree No 74 of 16 April 2013, Decree Law No 63/2013 (converted by Law No 90/2013), Decree Law of 31 August 2013 (converted into Law No 124/2013), Legislative Decree No 102/2014.
Economic - Fiscal/Tariffs: Tax deductions 55%/65%. Economic - Financial: Thermal account, White certificate.
Informational: Integrated Energy Efficiency Uptake Plan (“Piano Integrato di Diffusione dell’Efficienza Energetica – PIDEE”), electricity and gas smart meters.
2.2 Energy efficiency targets In Italy, the Energy Efficiency Directive transposition (Legislative Decree 102/2014) and the 2014 National Energy Efficiency Action Plan (NEEAP 2014) further reinforce policies in this sector, with the aim of achieving the 2020 energy saving objective.
The quantitative targets pursued by the programme for the promotion of energy efficiency to 2020 are to:
Save by 2020 15.5 Mtoe of final energy per annum (20.05 Mtoe of primary energy) reaching consumption some 24% lower than the levels projected at European level under the “business as usual” scenario (Primes 2008 model);
Avoid the emission of some 55 million tonnes of CO2 per year; Avoid about EUR 8 billion per annum of fossil fuel imports.
The estimated contribution of the main efficiency measures to accomplish final energy savings target by 2020 required by Article 7 of Directive 2012/27/EU1 is: 5.45 Mtoe from white certficates (35.1%), 5.23 Mtoe from regulatory standard (33.7%), 1.97 Mtoe from measures and investments for mobility (12.7%), 1.47 Mtoe from thermal account (9.4%), and 1.38 Mtoe from tax deductions (8.9%). In terms of saved CO2 emissions, the estimated effect to 2020 of the package of measures prepared is 50-55 Mt CO2/y. The expected primary energy savings by use sector in 2020 are: 5.14 Mtoe from the residential sector, 1.72 Mtoe from services, 7.14 Mtoe from industry and 6.05 Mtoe from transport.
In the residential sector, the energy efficiency target set in the latest NEEAP for the period 2011-2020 is 5.14 Mtoe of primary energy, equivalent to 3.67 Mtoe of final energy. In particular, the new energy consumption reduction target for 2020 is based on strengthening of the measures and instruments already in place – such as the energy efficiency certificates scheme (“white certificates”), tax deductions (55%/65%), regulatory standards (Leg. Decr. 192/05) - and on the introduction of new mechanisms - such as the Renewable Energy for Heating & Cooling Supporting Scheme (“thermal account”).
1 http://eur-lex.europa.eu/legal-content/EN/TXT/?uri=CELEX:52013SC0451

EUFORIE
13
The contribution of each policy measure and instrument to the energy efficiency target of the residential sector is:
0.103 Mtoe – White certificates; 1.38 Mtoe – Tax deductions 55%/65%; 0.54 Mtoe – Thermal account; 1.60 Mtoe – Regulatory standards.
Table 5 shows the expected savings of final and primary energy for the period 2011-2020 by main energy efficiency promotion scheme and policy measure in the residential sector.
Table 5. Policy instruments to improve energy efficiency in the residential sector and expected energy savings at 2020 (Mtoe)
Planned measures for 2011-2020 Expected energy savings by 2020
White certificates
Tax deductions 55%/65%
Thermal account
Regulatory standards Final Primary
Residential 0.103 1.38 0.54 1.60 3.67 5.14
Source: NEEAP 2014; ISTAT
2.3 Specific policies
2.3.1 Regulatory
The regulatory principles and the methods to improve the energy efficiency in the Italian residential sector have been mainly settled by the Legislative Decree No. 192/2005 and its implementing decrees (L D. 311/2006 and L.D. 115/2008); it implemented into the national legislation the Directive 2002/91/EC (Energy Performance of Buildings Directive) aimed at promoting the improvement of the energy performance of buildings through cost-effective measures. While the Presidential Decree 59/2009 defines the general criteria, the calculation methods and the minimum requirements for the building energy consumption reduction as to achieve the EPBD objectives, the Ministerial Decree 26/06/2009 defines the guidelines on the building energy certification.
The Legislative Decree No 28/2011 transposed the Directive 2009/28/EC on the promotion of the use of energy from renewable sources – Thermal Account. The Decree sets specific sectoral targets in order to achieve the overall national target of 17% share of energy from renewable sources in the gross final consumption of energy in 2020.
To establish a common framework designed to communicate complex information in a clear and understandable format and to allow consumers to make informed purchasing decisions, the Decree Law No 104/2012 transposed the Directive 2010/30/EU - “Implementation of Directive 2010/30/EU on the indication of consumption of energy and other resources by energy-related products by labeling and standard product information relating to the products”.
New rules concerning the operation, management, control, maintenance and inspection of heating, cooling and hot water systems in buildings have been established by the Presidential Decree No 74 of 16 April 2013; these set of obligations and criteria are applicable to public and private buildings.

WP 5 Country Report Italy
14
Subsequently, the Italian Decree Law No 63/2013 (converted by Law No 90/2013), transposed the Energy Performance of Buildings Directive Recast (2010/31/EU) in order to strengthen the energy performance requirements of buildings.
To support social housing projects, the “Piano Casa” (Fund for home purchase and/or renovation) Decree Law of 31 August 2013, converted into Law No 124/2013, allocated EUR 2 billion to support access to home-buying loans. The fund finances through a mortgage-backed loans purchase of residential properties, preferably belonging to energy classes A, B or C, and/or supports renovation and energy efficiency improvement projects, giving priority to young couples, families with one or more physically challenged person and large families.
In 2014, the Italian Legislative Decree No 102/2014 transposed the Energy Efficiency Directive 2012/27/EU into national legislation, with the aim of achieving the 2020 energy saving objective of 20 Mtoe of primary energy, equivalent to 15.5 Mtoe of final energy. An important plan is devoted to the energy upgrading of the national stock of buildings aimed at mobilizing investments and the National Plan for Nearly Zero Energy Buildings. An estimation of the potential energy savings in the building stock related to a predefined set of energy upgrading measures has been carried out. The assessment concerned the residential existing building stock built between 1946 and 2005 (both single-family and multi-family buildings) and included two types of renovation (complete and partial). Potential consumption reduction – 48.888 GWh/year equivalents to 3.71 Mtoe - was estimated taking into account regulatory instruments and incentives, both currently in force and planned (Table 6).
Table 6. Potential of final energy saving in the residential sector, years 2014-2020
Type of building
Renovation scenario on the building stock Type of project
Total annual energy savings
by 2020
Total annual energy savings
by 2020
Floor area covered
Floor area covered by
renovation each year Ro
of
Exte
rnal
w
alls
Win
dow
s
Heat
ing
syst
em
Com
plet
e re
nova
tion
m²/y Gwh/y Gwh/y Mtoe/y
Single-family
Partial renovation
39.407.808 221 132 83 265 4.907 0.42
Complete renovation
26.551.030 2.230 15.610 1.34
Multi-family
Partial renovation
79.141.300 253 475 253 658 11.473 0.50
Complete renovation
25.142.222 2.414 16.898 1.45
Total floor area 170.242.360 Total energy savings 48.888 3.71
Source: NEEAP 2014 2.3.2 Economic
Tax deductions for the energy upgrading of buildings were introduced in Italy by the Budget Law 2007 and are still in force. These deductions have been key drivers of energy efficiency improvements in the housing sector. The total number of actions implemented (approximately 1.5 million as at 31 December 2012), have helped to generate final energy savings currently in excess of 0.86 Mtoe/y, corresponding to more than 2 Mt emissions avoided.

EUFORIE
15
Tax deductions can be claimed by all taxpayers, including natural persons, professionals, companies and undertakings incurring costs for implementing the actions in existing buildings. The deduction can also be claimed by family members living with the owner or possessor of the property and tenants holding a regular letting agreement.
Tax deductions (which are granted for both residential and commercial buildings) consist of reductions of IRPEF (personal income tax) and IRES (corporate income tax) in respect of actions to improve the energy efficiency of existing buildings, in particular for expenses incurred to:
Reduce heating demand by means of overall upgrading of the building’s energy performance;
Improve the building’s thermal insulation (replacement of windows, including blinds or shutters, and insulation of roofs, walls and floors);
Install solar thermal panels; Replace winter heating systems (with condensing boilers or heat pumps); Replace electrical water heaters with heat pump water heaters.
The Government and Parliament have extended the action through 2015 (up to June 2016 for actions on the common parts of buildings) and have raised the tax deduction rate to 65% but have already decided to revise the scheme, with a view to rationalizing expenditure, so as to transform the scheme into a structural incentive.
IEA recently mentioned this measure as a best practice at international level (Energy Policy Highlights), with specific reference to its role in the spreading of an energy efficiency culture at local level. Indeed, between 2007 and 2014, more than two millions of interventions have been realized, and in 2013 households had invested EUR 22 billion, with a cost of EUR 13 billion in terms of foregone fiscal revenue. The replacement of windows represented more than two-thirds of the total volume of intervention. In a period of strong economic crisis, especially in the housing market, these numbers take on significant importance, even more when compared with data for building rehabilitation.
Table 7 shows the tax deduction applications for building rehabilitation and building renovation in the period 2007-2013.
Table 7. Tax deductions for building rehabilitation and building renovation (2007-2013)
Building rehabilitation Building renovation Year Applications Expenses
(M€) Deductible amounts
(M€)
Tax deduction
Applications Expenses (M€)
Deductible amounts
(M€)
Tax deduction
2007 402.811 7.938 2.858 36% 106.000 1.453 799 55%
2008 391.688 7.365 2.651 36% 247.800 3.500 1.925 55%
2009 447.728 8.070 2.905 36% 236.700 2.563 1.410 55%
2010 494.006 8.705 3.134 36% 405.600 4.608 2.534 55%
2011 779.400 14.400 5.184 36% 280.700 3.099 1.704 55%
2012 883.600 16.325 7.279 36%/50% 245.200 2.891 1.590 55%
2013 1.273.800 23.535 11.768 50% 356.000 3.849 2.260 55%/65%
Source: CRESME2 for building rehabilitation; ENEA for building renovation
2 Camera dei Deputati, Servizio Studi Dipartimento Ambiente e CRESME, Il recupero e la riqualificazione energetica del patrimonio edilizio: una stima dell’impatto delle misure di incentivazione, Second edition, No 83/1 del 17 giugno 2014.

WP 5 Country Report Italy
16
The following table (8) shows the specific intervention for which the tax deductions have been claimed (building renovation).
Table 8. Requests for tax deductions received by type (2007-2013)
Type of measure 2007 2008 2009 2010 2011 2012 2013 Total
Overall renovation of building 3.1802 5.700 5.600 1.917 1.450 3.579 3.566
24.992
Replacement of windows and insulation mat surfaces
39.220 112.600 127.800 226.720 170.400 135.283 244.421
1.056.444
Replacement water boiler 20.140 37.100 35.300 47.106 29.350 33.801 26.851
229.648
Use of efficient heating system 27.560 57.700 68.000 129.883 79.500 72.571 81.123
516.337
Multiple selection 15.900 34.700 - - - - - 50.600
Total 106.000 247.800 236.700 405.626 280.700 245.234 355.961 1.878.021
Source: ENEA
In total, from 2007 to 2013, the intervention that benefited more from tax deductions has been the replacement of windows (and insulation mat surfaces), representing the 56.2% of the total incentive; it was followed by intervention for efficient heating system (27.4%), replacement water boiler (12.2%), multiple selection (2.6%) and overall renovation (1.3%).
The 356.000 requests for tax deductions made in 2013 showed a significant increase compared to the number of 2012, amounting to more than a third. This phenomenon is certainly attributable to the increased tax deductions rate to 65% for expenses incurred from June 6, 2013, also given the extend period of just six months (until 31 December 2013) for the private interventions, under the law then in force (Law No. 90 of 2013). These conditions have undoubtedly stimulated private owners to bring forward to 2013 the realization of those energy improvements that would otherwise have made in subsequent years.
Recently, the Stability Law 20153 renewed the tax deductions until 31 December 2015, with the same rate of 65% (and the same period of the deduction of 10 years) for interventions of energy improvement that relate to private buildings and condominiums. The Law confirmed the incentives for all interventions already subsidized, extending the benefit also to expenditure incurred from 1 January 2015 until 31 December 2015 for solar shading (maximum deduction of 60,000 euro) and for the purchase and installation of heating systems with systems equipped with heat generators fed by biomass fuels (maximum value of deduction of 30,000 euro).
The Thermal Account, introduced by the Ministerial Decree of 28 December 2012 (Legislative Decree No 28/2011) “Renewable Energy for Heating & Cooling Supporting Scheme”, is the first nationwide and the youngest direct incentive scheme for the generation of renewable thermal energy, as well as being the first scheme encouraging public authorities to implement energy efficiency actions in buildings and technical installations. The Thermal Account became operational in July 2013. The scheme is addressed to public administrations and private parties (i.e. individuals, apartment block owners, and parties with business or agricultural income). These beneficiaries (“responsible party”)
3 Law No 190/2014, Disposizioni per la formazione del bilancio annuale e pluriennale dello Stato.

EUFORIE
17
may implement the actions via an ESCO, by means of a third-party financing contract, an energy service contract or an energy performance contract.
The new Thermal Account, that should be fully operative by the beginning of 2016, provides incentives for energy efficiency measures, amounting to 900 million euro per year, of which 700 for private sector and 200 for public entities, over the next five years4.
The ‘Gestore dei Servizi Energetici‘ GSE is in charge of implementing and managing the scheme. It also awards, disburses and revokes incentives and it is in charge of monitoring and checks. The ‘Ente Nazionale per l'Energia e l'Ambiente’ ENEA assists GSE in preparing the technical rules for implementing the decree and takes part in the verifications and checks.
The Thermal Account supports the following energy efficiency projects:
Energy efficiency improvements in existing building envelopes (thermal insulation of walls, roofs and floors, replacement of doors, windows and shutters, installation of solar screens) – Category A.
Replacement of existing systems for winter heating with more efficient ones (condensing boilers) – Category B.
Replacement and, in some cases, construction of new renewable-energy systems (heat pumps, biomass boilers, heaters and fireplaces, solar thermal systems, including those based on the solar cooling technology) – Category B.
Public administrations can apply for both big and small-scale project (category A, B), while private parties can only apply for small-scale projects concerning systems for producing thermal energy from renewables and high-efficiency systems (category B).
This support is granted on the basis of the type of project, with reference to the increase in energy efficiency achievable by improving the energy performance of the building and concerning the energy that can be generated by systems fired by renewable sources. The incentive covers part of the costs incurred and is paid out in annual installments for a period from 2 to 5 years according to the actions implemented. The incentives may be granted only for projects that do not benefit from other forms of government support, except for guarantee funds, revolving funds and loans; for publicly-owned buildings for public use, the incentives may be cumulated with grants, in accordance with national and EU legislation.
Since its implementation in July 2013 until November 2014, eligible beneficiaries submitted around 9.000 applications, among which more than 6.000 in 2014. Several simulations have been carried out to measure the contribution of the Thermal Account to the saving targets laid down in Article 7(1) EED. The expected 1.47 Mtoe/y total savings to 2020 will come mainly from the services sector (0.93 Mtoe/y) while the remaining 0.54 Mtoe/y will come from the residential sector.
White certificates, also known as “Energy Efficiency Certificates” (EEC), represent a financial and tradable instrument giving proof of the achievement of end-use energy savings through energy efficiency improvement initiatives and projects.
Initially in force in the five-year period 2005-2009, this incentive mechanism involved the setting up of a market in Energy Performance Certificates or White Certificates; it attests to the reduction of the primary energy consumption via energy efficiency measures and actions, on the basis of the Ministerial Decrees of 20 July 2004 and of the Ministerial Decree of 28 December 2012.
4 http://www.scoop.it/t/efficienza-energetica-ultime-novita-sulle-energie-rinnovabili/p/4056785452/2015/12/14/nuovo-conto-termico-entro-natale-sara-operativo

WP 5 Country Report Italy
18
The 4.3 Mtoe/y achievable by 2020 through projects implemented in the period 2014-2020 are increased by the sum of 1.2 Mtoe/y savings from the projects implemented over the period 2011- 2013. Thus, the total expected savings by 2020 from actions over the period 2011-2020 comes to 5.45 Mtoe/y. From 2005 to the first half of 2012, monitoring data show that 60% of the savings achieved concerned electricity, 26% natural gas and 14% other fuels. These actions covered all sectors of the economy, including industry, residential, transport and services. The residential sector benefits only of 2.7% of the total incentive. In fact, the white certificate scheme will produce its most significant results in the industrial sector (93.5%). White certificates issued for projects submitted after the 3rd of January 2013 can’t be combined with other incentives charged in electricity tariffs and gas and also with other incentives, excluding the access to guarantee funds, revolving funds, interest subsidies, tax exemption of business income for the purchase of machinery and equipment.
The White Certificate scheme, is the most effective energy policy instruments in Italy because its cost effectiveness (0,0085 €/kWh) is seven times lower than that of 55/65% tax deductions (0,0682 €/kWh). However, the two measures promote interventions in different economic sectors, with specific market dynamics.
The Decree of 28 Dec. 2012 established that the activities of management, evaluation and certification of the savings associated with energy efficiency projects under the white certificates schemes shall be transferred from AEEG (Authority for Electricity Gas and Water) to GSE (Energy Service Operator) as of 3 Feb. 2013.

EUFORIE
19
Case study: SIRENA Factor20 (Lombardy, Basilicata and Sicily Region) Factor20 is a project promoted by the Lombardy Region, with the participation of the Basilicata Region and the Region of Sicily, and the support of the societies Finlombarda SpA and Sviluppo Basilicata SpA. The project is mainly funded by the European program LIFE + Environment Policy and Governance, a financial instrument set up by the European Commission for the development, implementation and updating of the environmental policy of the European Union. Factor20 is aimed at defining a set of tools to support the planning of regional and national policies for reducing greenhouse gas emissions, improving energy efficiency and disseminating renewable energy sources.
In particular the Factor20 objectives are:
To harmonize regional database systems used to collect, manage and present to a wide spectrum of stakeholders the information on energy (consumption, supply/generation, infrastructures) and related impacts in terms of GHG emissions;
To define a technically-sound method to evaluate different regional targets and scenarios consistent with EU and National Climate Action Plan’s goals;
To apply a “burden-sharing” approach to define the share of GHG reduction at regional and local level for different sectors (buildings, SMEs & other services, transports, etc.) excluded from the Emission Trading Scheme;
To validate the proposed tool for the evaluation and accounting of regional/local energy policies with respect to all the three Climate Action Plan’s targets;
To promote the adoption of Factor20’s “Local Action Plans”, ensuring a correct evaluation of opportunities, selection of most effective actions and monitoring of the implementation;
To raise stakeholders’ awareness at local and regional level on adopting CO2 emissions as core indicator to define the effectiveness of energy policies and actions.
SIRENA20 (Information System for Regional Energy and Environment), is the web tool for monitoring and evaluating the policy measures to reduce emissions and energy consumption, and the dissemination of information to the local level; it is an integrated approach to account for the effectiveness of GHG-reduction policies for non-ETS sectors. The results are delivered at inter-regional level, though a close involvement of the National level is included through the Ministry of Environment, one of “Factor20” co-financier.
In addition, SIRENA Factor20 will be used together with the Local Authorities to design, implement and monitor the Local Plans Factor20, which will coincide, in many cases, with SEAPs developed in the framework of the Covenant of Mayors initiative (see 3.4), so that activities with similar objectives mutually reinforce each other. In a nutshell, innovative aspects are linked to:
The use of integrated planning approach with declared regional and local target concerning both emission and energy;
The use of scientifically sound emission estimation method implemented in a web application available for all the Local Authorities interested;
The monitoring of local and total regional sums obtained by all the actions planned and realized.

WP 5 Country Report Italy
20
2.3.3 Informational
In order to disseminate at the national, regional and local level transparent information on energy efficiency, to transpose Article 12, 16 and 17 of Directive 2012/27/EU, and to ensure success of the actions set out in the NEAAP 2014-2016, an Integrated Energy Efficiency Uptake Plan (“Piano Integrato di Diffusione dell’Efficienza Energetica - PIDEE) is designed. The Plan addresses the provision of information and training on energy efficiency; in detail, it sets out targets, beneficiaries, strategies and contents of the information and training actions, budget, implementing agencies and provisions for post hoc assessment of the activities. The target groups of information and training actions include: public sector employees, banks and financial institutes, SMEs and the general public.
The energy efficiency uptake strategy includes the following actions:
Strengthening of communication on energy efficiency to improve the user-friendliness and transparency of information;
Initiatives promoting energy-awareness in daily behaviors targeting specific groups (e.g. home-makers’ associations, high school students, universities);
Design, implementation and testing of instruments to ensure the dissemination to all relevant market players of information on energy efficiency schemes and the financial frameworks via direct means (information from computers or smart meters combined with home-installed displays) and indirect means (smart bills containing historical and comparative energy consumption data).
Promotion of energy audits as a useful instrument to provide the information needed to take energy efficiency measures, and impact assessment of the communication campaign.
Awareness-raising in the building trade, with a focus on the real estate market; cooperation on actions to raise end-users’ awareness of the energy performance of buildings.
Cooperation with research institutes, universities and companies to assess the costs of EE systems and components, compare the different technologies available for a given energy service and examine the applicability of innovative technologies in the home;
Planning and delivery of awareness-raising initiatives on the workplace and training of the Energy Manager within public authorities.
Different type of dissemination methods to influence energy consumption behaviors are used, such as traditional communication actions, a mix of direct and indirect feedback from energy suppliers, and training on energy issues. Most pilot studies have proven that even small information actions can bring about measurable reductions in energy consumption. The energy savings achievable via individual or combined actions are: feedback (5-15%), direct feedback (smart meter, 5-15%), indirect feedback (enhanced billing, 2-10%), energy audits (5-20%), EU-based measure (5-20%), combined measures (5-20%).
Directives 2009/72/EC2 (Electricity) and 2009/73/EC3 (Gas), established that the Member States or National Regulatory Authorities (NRAs) shall strongly recommend that electricity and gas undertakings optimize the use of energy, including through the use of smart metering systems, where appropriate. Under the current EU legislation, final consumers should already be frequently informed about their energy consumption at the time of use. EU member states are also obliged to roll out smart electricity meters for at least 80% of their final consumers by 2020 and to achieve full coverage by 2022.
Smart Meters can give households clear and comprehensive information about their energy consumption and, giving them better information, can help households to become more energy efficient.
EUFORIE
21
In Italy, the replacement of the traditional electricity meters with a smart metering infrastructure started between 2001 and 2002. Initially, the adoption of smart metering in the electricity sector was on a voluntary basis, driven by the initiative of DSOs5, in particular ENEL Distribuzione; this later became a mandatory roll-out under a Decision of the Electricity, Gas and Water Authority (Decision No 292/06). The Automated Meter Reading (AMR) infrastructure was completed on the initiative of ENEL, which implemented a plan for the installation of some 36.7 million meters between 2001 and 2011. The implementation of the smart metering of electricity was originally driven by significant operating savings (500.000.000 euro per year for some 30 million meters), while the focus is now shifting towards involving customers also for energy-saving purposes. The cost-benefit analysis (CBA) carried out by major universities and the Italian experience in the use of smart electricity metering have shown that benefits far outweigh infrastructure installation and operation costs.
Gas meters are also smartening up. In fact, Italy is ahead of the other Member States also as to the regulatory framework for gas meters. The Italian Gas Committee (Comitato Italiano Gas - CIG) acting under the mandate given by the Electricity and Gas Authority (AEEG) with the Decision No 155/08 on “directives for commissioning gas meter banks, meeting minimum operating requirements and having remote reading and remote control functions, at the supply points of natural gas distribution networks”, completed the set of UNI/TS 11291 standards “Gas measurement systems. Hourly-based gas metering devices”. In this area, an ad hoc working group covered safety procedures and the description of the functional requirements of the electronic gas meter, having particular regard to physical safety and data security.
Italy, Ireland, Luxembourg, the Netherlands and the United Kingdom have planned to roll-out gas smart metering by 2020. According to preliminary estimates, this will involve the installation of about 40 million smart meters by 2020, with a cumulative investment of EUR 10 billion.
In Italy, reporting by consumers of electricity and gas readings is governed by Decision ARG/com 164/08 “Consolidated Text on the quality of electricity and natural gas sales services”. Where smart meters are installed, final customers must have access to complementary information on cumulative data for at least the three previous years or on the period from the start of the supply contract if shorter, and detailed data according to the time of use for any day, month and year.
These data are made available to the final customer via the internet or the meter interface for the period of at least the previous 24 months or the time since the start of the supply contract if this is shorter. The current metering technology in Italy is unable to supply detailed data according to the time of use for any day (including the preceding day), either via a website connected to the meter central control system or via the display on the smart meter. However, the current metering technology could already support a communication interface to show consumption data to end-users, thus empowering them to manage their energy use and to create a database of their consumption, as provided for by the EED.
5 Distribution System Operators

WP 5 Country Report Italy
22
2.4 Side effects of politics
One of the strongest assumption behind improvements of energy efficiency indicates that increasing energy efficiency naturally and automatically leads to reductions in energy consumption or that efficiency is by far the dominant determinant. However, empirical studies consistently indicate that increases in energy efficiency do not regularly lead to one-to-one reductions in energy consumption (Galvin, 2014). In fact, policies designed to reduce energy consumption through energy efficiency measures in the residential sector are typically based upon engineering calculations, which differ significantly from outcomes observed in practice. A widely acknowledged explanation for this gap between expected and realized energy savings is household behavior, as energy efficiency gains alter the perceived cost of comfort and may thereby generate shifts in consumption patterns – a “rebound effect” (Aydin et al., 2015).
Over the period 2000-2012, even though energy efficiency in the residential sector increased by 11.9%, the final energy consumption of households at normal climate increased by 14.9% in Italy. According to Odyssee, the variation of the final energy consumption of households at normal climate is influenced by:
Change in number of occupied dwelling (“more dwellings”); “More appliances per dwelling” (electrical appliances, central heating); Change in floor area of dwelling for space heating (“larger homes”); Energy savings, as measured from ODEX; Other effects (mainly change in heating behaviors).
Figure 6 shows the contribution of each variable to the overall variation of household energy consumption.
Figure 6. Variation households consumption - Italy - % (2000-2012)
Source: Odyssee In particular, “more dwellings” means the demographic effect due to the increasing number of dwellings is calculated as the variation in the number of dwellings multiplied by the energy consumption per dwelling (with climatic corrections). From 2000 to 2012 it increased by 20.5%.
The demographic effect is: = ∗

EUFORIE
23
Where, nbrlpr is the number of permantly occupied dwellings, and CU is the energy consumption per dwelling with climatic corrections.
Two lifestyle effects may also influence the energy consumption of households: the increase in the household equipment ownership (electrical appliances and central heating) and in the increasing size of dwellings (i.e. larger homes).
The increasing number of equipment per households is due on one hand to the increasing number of electrical appliances (ICT, small electrical appliances, air conditioning in Southern countries), larger homes which requires more energy and central heating which requires around 25% more energy compared to single room heating.
The increasing number of electrical appliances is approximated with the electricity consumption of large appliance (refrigerators, freezers, TV, washing machine, dish washers) per dwelling in relation with the overall index for electrical appliances (based on the evolution of the electricity consumption per appliances weighted by their energy share). The “central heating” effect is calculated as a ratio between the unit consumption per (with climatic corrections) and the unit consumption per equivalent dwelling (with climatic corrections).
In the period under investigation (2000-2012), the indicator “more appliance per dwellings” showed a decrease of 1.5%, differently from the EU average where it increased of 2.6%.
The indicator “larger homes” that shows a change in floor area of dwelling for space heating, decreased of 1.2% from 2000-2012 (in the EU it increased of 5%), while “energy savings” increased of 11.9% (in the EU it increased of 19.5%).
Energy savings are based on ODEX, expressed in Mtoe.
𝐸𝑆𝐼 = 𝐶𝑡 ∗( -1)
For ODEX, the following indicators are considered to measure efficiency progress:
Heating: unit consumption per at normal climate (koe/ ) Water heating: unit consumption per dwelling with water heating Cooking: unit consumption per dwelling Large electrical appliances: specific electricity consumption, in kWh/year/appliance
In conclusion, the 11.9% of energy efficiency progress in the residential sector between 2000 and 2012, corresponding to 4.09 Mtoe, have been offset by “more dwelling” (demographic effect) and changing in heating behaviours. As for the Energy Bill, that is the various forms in which feed-in tarifs have been remodeled in the last years, various stakeholders related to the field of energy efficiency argue that government incentives have been rather unbalanced in favor of the new power plants from renewable sources (PV, etc.), and too little aimed at effecttively reduding the waste of energy through adequate energy efficiency improvements. Recognising that it is not easy to establish the optimal balance how to stimulate on the one hand the production of new clean energy and, on the other hand, the most efficient use of the power already installed is rather widely accepted that governments of the recent past have overfacilitated the former, and now should somehow try to regain on the latter.

WP 5 Country Report Italy
24
3. Private sector support complementing public policies
3.1 Energy Service Companies (ESCOs)
The recourse to the energy service companies (ESCOs) and Energy Performance Contracting (EPC) is deemed as fundamental to finance renovations in the building sector and to implement plans for improving energy efficiency in the long term. Under the EPC model, ESCOs perform energy efficiency projects, take on the performance risk of energy-saving improvements, guarantee cost savings to the end user, and use the energy bill savings resulting from the projects to pay off the initial investment at no up-front cost to the building owner. The Italian UNI CEI 11352 standard for the certification of ESCOs published in 2014 (replacing the UNI CEI 11325 of 2010) defines the general requirements that an energy service company must provide to its customers with services and guaranteed results aimed at improving energy efficiency according to UNI CEI EN 15900.
The ESCO sector in Italy is quite diverse, with 1.900 units registered with AEEG in 2011. The companies on this list belong to a wide range of sectors in terms of activities and target sectors: generation/distribution companies, technology manufacturers for utilities, special purpose-vehicles of manufacturing industries, etc.
A study currently in progress6 has found that not many ESCOs couple energy services with other functions: nevertheless, 50% of ESCOs report that in addition to energy services they provide other services, such as repair, installation and rental. Excluding “energy services”, the three principal functions of ESCOs are: “technologies for the generation and use of thermal energy”, “CHP and CCHP systems” and efficient buildings”. Within the “energy services” area, the most commonly offered service is the energy audit, followed by concluded EPC contracts. The main sectors covered by these businesses are residential, commercial and services, which generate 76.7% of their total turnover; the remaining share comes from the industrial sector (23.2%), and a negligible portion from the agricultural sector.
The national organization representing and promoting the energy efficiency industry is FederESCO. The non-profit association was formed to promote the culture of energy efficiency and energy-saving among public and private economic operators and citizens in order to reduce the demand for energy and the reduction of climate-altering emissions. Federesco brings together a considerable number of companies and businesses operating in the energy efficiency sector, it provides support for transformation into Energy Service Companies and protects their interests through forms of representation and/or legislative initiatives designed to increase market opportunities. It offers consulting service for forming new Energy Service Companies.
3.2 Banks and financial facilities
In Italy banks are in a phase of turmoil regarding the structuring of loans for energy efficiency improvements. This was primarily due to the instability of the regulatory framework, where the inertia of the financial sector is increased by the slow timing with which the legislature take definitive action on the matter. For example, the operative decrees of the Fund for energy efficiency until now has been delayed for more than a year.
6 Activities in progress under a Memorandum of Understanding between ENEA and Confindustria.

EUFORIE
25
Another issue is the credibility of the customers that require loans. However, there are already many cases in which private banks have started to use tools targeted for this type of interventions. According to a survey conducted by ABILab7, in the first half of 2014, 86% of surveyed banks provided specific products for energy efficiency financing. All banks surveyed are involved in private property refurbishing projects, and 67% also invest in the industrial sector. In contrast, the percentage is rather low for funding dedicated to projects concerning the Public Administration (33%); even lower the amount related to projects implemented by ESCOs (17%).
3.2.1 Officinæ Verdi
Officinæ Verdi is an Energy Efficiency Group originally created by UniCredit in cooperation with the World Wide Fund for Nature (WWF). In two years of activity has arranged green energy operations in Italy with investments of about 93,4M€, consolidating a high level of know-how and an integrated approach in energy efficiency for key sectors of the real economy. Beside infrastructure, large-scale trade, manufacturing Officinæ Verdi also supports families and households to reduce their energy costs and produce their own clean energy in small equipment’s8.
3.2.2 Banca Etica
Banca Etica has developed various products related to energy efficiency. Relevant for individuals and families are:
Mutui prima casa "energetici": offers favorable mortgage conditions if the purchase and/or renovation of a building is combined with fulfillment of specific energy efficiency criteria;
Mutuo Chirografario Ristrutturazione Efficiente: Restructuring of residential property according to energy efficiency criteria;
Mutuo Micro Energia: supports photovoltaic systems with a capacity of less than 20 kWp, small plants using other renewable energy sources and small energy efficiency measures at the household / family level.
3.2.3 BNL
Through its programme Green Famiglie the Banca Nazionale del Lavoro BNL provides credits up to € 100,000 for projects on energy efficiency. Consumers can benefit from reduced interest rates as well as from existing tax advantages for such investments. To support families in this change, BNL offers a free energy checkup to quantify the economic benefits over the current costs. The pay back time for the credits is up to 120 months.
3.3 Initiatives for households by private utility companies
Private utility companies generally do not appear proactive in Italy. One of the few es A2A, a utility company in northern Italy, which in some municipalities (e.g. Brescia) provides funding for energy efficiency projects allowing repaying the loan in installments on the same energy bill.
7 http://www.abilab.it/efficienza-energetica-2015 8 http://www.wwf.it/chi_siamo/partners/officinae_verdi/; http://www.ovaerdi.com/en/

WP 5 Country Report Italy
26
3.4 Energy Efficiency Funds
Financial facilities dedicated to energy efficiency at national and regional level has been provided by the European Union in the last years. For example, the Legislative Decree No 102/2014 that transposed the Directive 2012/27/EU on energy efficiency provides for the creation of the National Energy Efficiency Fund at the Ministry of Economic Development. The aim of the Fund is to support energy efficiency projects implemented by public authorities, ESCOs and businesses to increase the energy efficiency of the buildings, industrial installations and production processes. The Fund will receive resources amounting to EUR 490 million in the period 2014-2020. In detail, the actions financed by the Fund will aim to improve the energy performance of buildings owned by the public authorities, create district heating and/or district cooling networks, improve the efficiency of public services and infrastructure including street lighting, improve the energy efficiency of entire buildings including social housing buildings and reduce energy consumption in industrial processes.
The Kyoto fund established with the Law No 296/2006 (but it entered into force only the 16th of February 2012), is a revolving fund for the subsidised financing of GHG emission reduction projects, set up at the Cassa Depositi e Prestiti (Deposit and Loan Fund) having a total budget of some EUR 600 million, to be paid out in three one-year cycles of EUR 200 million each. The actions funded under the first programming cycle concerned 7 national or regional measures, but only three actions are referred to energy efficiency. The subsidised projects obtained loans with a duration of 3 to 6 years (3 to 15 for Public authorities) with six-monthly instalments at a fixed annual interest rate of 0.5%. The fund covers the 70% of the total investment for private individuals, while the 90% for public bodies. The overall interest on the Kyoto fund has mainly been on renewable energies, while requests for energy efficiency funding have been scarce.
The European Structural Funds programme, and in particular the European Regional Development Fund (ERDF) and the European Social Fund (ESF), earmarked for Italy under the 2014-2020 programming period total almost EUR 32 billion; of these almost EUR 23 billion will go to the less developed Regions (Campania, Puglia, Calabria, Sicily and Basilicata), 1.1 to transition Regions (Abruzzo, Molise and Sardinia) and the remaining 7.8 to the more developed Regions. Even though funds for the overall cohesion policies have been significantly reduced as a whole (22 billion less than those allocated for the period 2007-2013) those intended to finance projects related to renewable energy, and especially those related to the energy efficiency improvements of buildings, have increased. Since the last funding period, in fact, they should more than double to an estimated minimum of 23 billion euro.
The 2014-2020 Structural Funds have been designed with some major conceptual and regulatory innovations, proposed by the Commission to the Member States in response to the lessons learnt in the previous programming period. The theme of energy efficiency falls under thematic objective 4 “Sustainable energy and quality of life (supporting the transition towards a low-carbon economy in all sectors)”. The main action lines are four:
1. Energy efficiency and energy saving actions in public or public-use buildings and facilities, for residential or other uses, owned by the central government; 2. Actions on the networks: upgrading of smart networks mainly as part of urban development projects, which may also be associated with sustainable collective mobility projects and infomobility services; 3. Actions to support the sustainable energy and energy efficiency industry; 4. Outreach, support, training and promotion of employment in the sustainable energy sector.

EUFORIE
27
3.5 The Covenant of Mayors
The Covenant of Mayors, launched in 2008, is a unique model of multi-level governance in which local and regional authorities take the lead in increasing energy efficiency and the use of renewable energy sources in their territories through the Sustainable Energy Action Plan (SEAP). Among the 6.569 signatories of the Covenant of Mayors, 54.8% are Italian, showing the sensitivity of Italian local governments to the issues of energy efficiency and renewable energy sources. The SEAP is a powerful tool for cities and regions to plan, implement, monitor and evaluate climate and energy policies, and in doing so contribute to global mitigation and adaptation achievements (“Ways to successful sustainable energy action planning in Cities”, 2011). Through SEAPs cities can implement measures in a structured and integrated way, allowing them to systematically monitor their efforts in going beyond national legislation in these fields. A SEAP is also an instrument for cities to communicate to stakeholders – both locally and beyond – the importance of energy and climate protection, and to encourage citizens and other relevant actors to take a part in the city’s ambitions.
WP 5 Country Report Italy
28
4. Initiatives targeting households behavior
At national level, the main entities providing information on energy savings and energy efficiency to SMEs and households are ENEA, GSE and the Regulatory Authority for Electricity Gas and Water. The Office of the Prime Minister and the Competent Ministries organise periodically dedicated information campaigns. At regional and local level, information is provided by the Regions, the Provinces, the Municipal authorities, the local Energy Agencies and the Chambers of Commerce.
Below a list of the principal informational/educational initiatives targeting households behaviour in the last years in Italy:
Communication Campaign: "Il risparmio energetico è un guadagno per tutti" (Energy Saving is profitable for all); "Rimetti la casa al centro del tuo mondo" (Place the home at the centre of your world) - Ministry of Economic Development and Ministry of the Environment.
Brochures - "Obiettivo Efficienza Energetica" (Target: Energy Efficiency) – ENEA. Web TV - Videos on Energy Efficiency for the general public - ENEA ENEA Blog on White Certificates – ENEA. National Website on Energy Efficiency www.efficienzaenergetica.enea.it – ENEA. Website www.gse.it – GSE. Series "Ogni kWh conta" (Every kWh counts) – ENEA. Energy Project :"Diritti a viva voce" (Speak up for rights) – CNCU, AEEG. National Competition "Energia da Vedere" (Energy to be seen) – ENEA. Se queste mura potessero parlare...di energia (If only these walls could speak...about
energy) Use of 3D architectural mapping to raise user awareness on energy saving – ENEA Universities.
Donne di classe A+ (Class A+ women) Awareness raising program for homemakers – ENEA. Direct feedback: Pilot projects to promote the uptake of multi-service smart metering and
network innovation (Decision 393/2013/R/gas) - AEEG Indirect feedback: "La bolletta spiegata" (Explaining the energy bill) – AEEG; "Trova offerte"
(Find offers) – AEEG; Pilot implementation of a simplified bill – ENEA and Ministry of Economic Development.
Corso di Sopravvivenza Energetica per studenti fuori sede (Energy survival course for students living away from home) – ENEA Universities.
Project "No lift Days: giornate senza Ascensore" (No lift Days: days without taking the lift) – ENEA.
"Portati il risparmio a casa" (Make savings at home) Take Away Course on energy saving and energy efficiency – ISPRA.
In particular, the Energy Project Diritti a viva voce (Speak up for rights), is a set of face-to-face and electronic services for the protection of consumers and users of energy services in Italy. Its aim is to inform consumers and to raise their awareness and support them in all energy-related issues. The project has been promoted by the 18 Consumer Associations members of CNCU, the National Consumer and User Council with the support of the Electricity and Gas Authority.
Portati il risparmio a casa. Corso Take Away di risparmio ed efficienza energetica (Making savings at home. Take Away Course on energy saving and efficiency), is a course on energy saving and efficiency organised by ENEA and ISPRA targeting public sector employees to provide a series of tips to reduce daily energy consumption. The course is designed with a continuing education approach addressed to an adult public and focused on energy savings and efficiency both in the office and at home.

EUFORIE
29
The project Donne di classe A+ (Class A+ women), based on a training course held by ENEA, is addressed to housewives as “manager of the family” with the aim of making rational use of energy in order to become "ambassadors" of energy savings within their home and network.
Se queste mura potessero parlare...di energia (If only these walls could speak...about energy) is an innovative way to raise user awareness on energy saving through the use of 3D architectural mapping. To speak in a new and unconvential way of energy saving and energy efficiency, the video installations have combined art, communication and research into a series of screenings with strong visual impact created in a single night in the central area of Rome - Aventino, Prenestina , San Lorenzo and Tiburtina.
A digital project was launched by ENEA called Stati Generali dell’efficienza energetica, which celebrated its second edition on October 14, 2015. This initiative is part of a trend towards “digital democracy” or e-democracy. As many in many other sectors businessmen, citizens, NGOs, virtually meet and discuss energy efficiency issues, bring in excellence and lay perspectives and and together develop strategies for effective policies. 9 clusters (agriculture and food industry; textile, wood and paper; electrical and electronic equipment; mobility and transport; energy and waste water; construction; tourism; health and education; condominiums) were set to collect information and report final results.
As a characteristic civil society initiative the EnergoClub was founded in 2002 by a group of friends with the aim of making clear and accessible to all the fragmentary and incomplete information regarding the renewable energy sources. EnergoClub, is registered as a non-profit association since 2005. On a national level it is working for the dissemination of good practices of energy conservation, the sustainable use of renewable sources in households, businesses, public authorities, schools.
It supported a series of projects such as ‘enostra’ a cooperative that promote the active participation and involvement of citizens in the transition from fossil fuels to renewables.

WP 5 Country Report Italy
30
References
Aydin, E., Kok, N., Brounen, D. (2015). Energy Efficiency and Household Behavior: The Rebound Effect in the Residential Sector.
Decision ARG/com 164/08 (2008). Consolidated Text on the quality of electricity and natural gas sales services. Italian Regulatory Authority for Electricity Gas and Water.
Decision No 155/08 (2008). Directives for commissioning gas meter banks, meeting minimum operating requirements and having remote reading and remote control functions, at the supply points of natural gas distribution networks. Italian Gas Committee.
Decision No 292/06 (2006). Obligations for the installation of electronic meters for low voltage withdrawal points. Italian Regulatory Authority for Electricity Gas and Water.
Decree Law No 102/2014. Attuazione della direttiva 2012/27/UE sull'efficienza energetica, che modifica le direttive 2009/125/CE e 2010/30/UE e abroga le direttive 2004/8/CE e 2006/32/CE.
Decree Law No 63/2013. Disposizioni urgenti per il recepimento della Direttiva 2010/31/UE del Parlamento europeo e del Consiglio del 19 maggio 2010, sulla prestazione energetica nell'edilizia per la definizione delle procedure d'infrazione avviate dalla Commissione europea, nonché altre disposizioni in materia di coesione sociale.
Decree Law No 104/2012. Attuazione della direttiva 2010/30/UE, relativa all'indicazione del consumo di energia e di altre risorse dei prodotti connessi all'energia, mediante l'etichettatura ed informazioni uniformi relativa ai prodotti.
Decree Law No 83/2012. Misure urgenti per la crescita del Paese.
Directive 2012/27/EU of the European Parliament and of the Council of 25 October 2012 on energy efficiency, amending Directives 2009/125/EC and 2010/30/EU and repealing Directives 2004/8/EC and 2006/32/EC.
Directive 2010/31/EU of the European Parliament and of the Council of 19 May 2010 on the energy performance of buildings (EPBD recast).
Directive 2010/30/EU of the European Parliament and of the Council of 19 May 2010 on the indication by labelling and standard product information of the consumption of energy and other resources by energy-related products.
Directives 2009/72/EC2 (Electricity) and 2009/73/EC3 (Gas).
Directive 2009/28/EC of the European Parliament and of the Council of 23 April 2009 on the promotion of the use of energy from renewable sources and amending and subsequently repealing Directives 2001/77/EC and 2003/30/EC.
Directive 2002/91/EC of the European Parliament and of the Council of 16 December 2002 on the energy performance of buildings.
Factor20. www.factor20.it/home
Flanagan, K., Uyarraa, E., Laranja, M. (2011). Reconceptualising the “policy mix” for innovation. Research Policy (40), pp. 702-713.
Galvin, R. (2014). Estimating broad-brush rebound effects for household energy consumption in the EU 28 countries and Norway: some policy implications of Odyssee data. Energy Policy, 73, 323-332.

EUFORIE
31
IEA (2011). Summing up the parts, Combining Policy Instruments for Least Cost Climate Mitigation Strategies, International Energy Agency (IEA), Paris, France.
Italian Energy Efficiency Action Plan (2014).
Italian Energy Efficiency Annual Report (2015).
ISTAT (2011). Structure and competitiveness of enterprises.
Law No 190/2014, Disposizioni per la formazione del bilancio annuale e pluriennale dello Stato.
Law No 90/2013. Disposizioni urgenti per il recepimento della Direttiva 2010/31/UE del Parlamento europeo e del Consiglio del 19 maggio 2010, sulla prestazione energetica nell'edilizia per la definizione delle procedure d'infrazione avviate dalla Commissione europea, nonché altre disposizioni in materia di coesione sociale.
Law No 124/2013. Conversione in legge, con modificazioni, del decreto-legge 31 agosto 2013, n. 102, recante disposizioni urgenti in materia di IMU, di altra fiscalita' immobiliare, di sostegno alle politiche abitative e di finanza locale, nonche' di cassa integrazione guadagni e di trattamenti pensionistici.
Law No 296/2006. Disposizioni per la formazione del bilancio annuale e pluriennale dello Stato (legge finanziaria 2007).
Legislative Decree No 28/2011. Attuazione della direttiva 2009/28/CE sulla promozione dell'uso dell'energia da fonti rinnovabili, recante modifica e successiva abrogazione delle direttive 2001/77/CE e 2003/30/CE.
Legislative Decree No 115/2008. Attuazione della direttiva 2006/32/CE relativa all'efficienza degli usi finali dell'energia e i servizi energetici e abrogazione della direttiva 93/76/CEE.
Legislative Decree No 311/2006. Disposizioni correttive ed integrative al decreto legislativo 19 agosto 2005, n. 192, recante attuazione della direttiva 2002/91/CE, relativa al rendimento energetico nell'edilizia.
Legislative Decree 192/2005. Attuazione della direttiva 2002/91/CE relativa al rendimento energetico nell'edilizia.
Kemp, R., Pearson, P. (2008). Final report MEI project about measuring eco-innovation. www.merit.unu.edu\MEI
Matthes F.C. (2010). Developing an ambitious climate policy mix with a focus on cap-and-trade schemes and complementarity policies and measures. Oko-Institute, Berlin.
Ministerial Decree 26/06/2009. Linee guida nazionali per la certificazione energetica degli edifici.
Moreau F. (2004). The role of the state in evolutionary economics. Cambridge Journal of Economics, 28 (6), pp. 847-874.
Nauwelaers C., Wintjes R.(2008). Conclusions and perspectives: adapting old policy institutions to new challenges. Nauwelaers, C. and Wintjes, R. (Eds.) Innovation Policy in Europe: Measurement and Strategy. Edward Elgar, Cheltenham.
Nill, J., Kemp, R. (2009). Evolutionary approaches for sustainable innovation policies: From niche to paradigm? Research Policy, vol. 38(4), pp. 668-680.
OECD (2010). Eco-Innovation in Industry: Enabling Green Growth, OECD Publishing, Paris.
OECD (2007). Instrument Mixes for Environmental Policy, OECD Publishing.

WP 5 Country Report Italy
32
Piano Integrato di Diffusione dell’Efficienza Energetica (PIDEE), in attuazione della Direttiva 2012/27/UE (art. 12, 16 e 17), da realizzarsi in collaborazione con le Regioni e le Associazioni di Categoria.
Presidential Decree No 74/2013. Regolamento recante definizione dei criteri generali in materia di esercizio, conduzione, controllo, manutenzione e ispezione degli impianti termici per la climatizzazione invernale ed estiva degli edifici e per la preparazione dell'acqua calda per usi igienici sanitari, a norma dell'articolo 4, comma 1, lettere a) e c), del decreto legislativo 19 agosto 2005, n. 192.
Presidential Decree No 59/2009. Regolamento di attuazione dell'articolo 4, comma 1, lettere a) e b), del decreto legislativo 19 agosto 2005, n. 192, concernente attuazione della direttiva 2002/91/CE sul rendimento energetico in edilizia.
Ring, I., Schröter-Schlaack, C. (2011). Instrument Mixes for Biodiversity Policies, Helmholtz Centre for Environmental Research.
Sirena20. http://sirena20.energialombardia.eu/factor20/pages/public/index.jsf?cid=2
Stability Law 2015, Law No 190/2014.
Smith, A., Voß, J.P., Grin, J. (2010). Innovation studies and sustainability transitions: The allure of the multi-level perspective and its challenges. Research Policy, vol. 39(4), pp. 435-448.
Tax deductions 55%/65%. Legal Decree n. 63 of 6 June 2013, converted into Law no. 90 of 4 August 2013. Conversione, con modificazioni, del decreto-legge 4 giugno 2013, n. 63. Disposizioni urgenti per il recepimento della Direttiva 2010/31/UE del Parlamento europeo e del Consiglio del 19 maggio 2010, sulla prestazione energetica nell'edilizia per la definizione delle procedure d'infrazione avviate dalla Commissione europea, nonché altre disposizioni in materia di coesione sociale.
Thermal account. Ministerial Decree 28/12/2012. Incentivazione della produzione di energia termica da fonti rinnovabili ed interventi di efficienza energetica di piccole dimensioni.
UNI CEI 11352. Gestione dell'energia - Società che forniscono servizi energetici (ESCo) - Requisiti generali e lista di controllo per la verifica dei requisiti
UNI CEI 11339. Gestione dell’energia. Esperti in gestione dell'energia. Requisiti generali per la qualificazione.
UNI CEI EN 16001. Sistemi di gestione dell'energia – Requisiti e linee guida per l'uso.
UNI CEI EN 15900. Servizi di efficienza energetica - Definizioni e requisiti.
UNI CEI EN ISO 50001. Sistemi di gestione dell'energia - Requisiti e linee guida per l'uso.
UNI CEI/RT 11428. Gestione dell'energia - Diagnosi energetiche - Requisiti generali del servizio di diagnosi energetica.
UNI/TS 11291. Gas measurement systems. Hourly-based gas metering devices.
White certificates. Decree Law 28 December 2012. Incentivazione della produzione di energia termica da fonti rinnovabili ed interventi di efficienza energetica di piccole dimensioni.