Consumer Views on Plug-in Electric Vehicles – National ... · traditional gasoline vehicles. •...
38
NREL is a national laboratory of the U.S. Department of Energy Office of Energy Efficiency & Renewable Energy Operated by the Alliance for Sustainable Energy, LLC This report is available at no cost from the National Renewable Energy Laboratory (NREL) at www.nrel.gov/publications. Contract No. DE-AC36-08GO28308 Consumer Views on Plug-in Electric Vehicles – National Benchmark Report Mark Singer National Renewable Energy Laboratory Technical Report NREL/TP-5400-65279 January 2016
Transcript of Consumer Views on Plug-in Electric Vehicles – National ... · traditional gasoline vehicles. •...

NREL is a national laboratory of the U.S. Department of Energy Office of Energy Efficiency & Renewable Energy Operated by the Alliance for Sustainable Energy, LLC
This report is available at no cost from the National Renewable Energy Laboratory (NREL) at www.nrel.gov/publications.
Contract No. DE-AC36-08GO28308
Consumer Views on Plug-in Electric Vehicles – National Benchmark Report Mark Singer National Renewable Energy Laboratory
Technical Report NREL/TP-5400-65279 January 2016

NREL is a national laboratory of the U.S. Department of Energy Office of Energy Efficiency & Renewable Energy Operated by the Alliance for Sustainable Energy, LLC
This report is available at no cost from the National Renewable Energy Laboratory (NREL) at www.nrel.gov/publications.
Contract No. DE-AC36-08GO28308
National Renewable Energy Laboratory 15013 Denver West Parkway Golden, CO 80401 303-275-3000 • www.nrel.gov
Consumer Views on Plug-in Electric Vehicles – National Benchmark Report Mark Singer National Renewable Energy Laboratory
Prepared under Task No(s). VTP2.2700
Technical Report NREL/TP-5400-65279 January 2016
NOTICE
This report was prepared as an account of work sponsored by an agency of the United States government. Neither the United States government nor any agency thereof, nor any of their employees, makes any warranty, express or implied, or assumes any legal liability or responsibility for the accuracy, completeness, or usefulness of any information, apparatus, product, or process disclosed, or represents that its use would not infringe privately owned rights. Reference herein to any specific commercial product, process, or service by trade name, trademark, manufacturer, or otherwise does not necessarily constitute or imply its endorsement, recommendation, or favoring by the United States government or any agency thereof. The views and opinions of authors expressed herein do not necessarily state or reflect those of the United States government or any agency thereof.
This report is available at no cost from the National Renewable Energy Laboratory (NREL) at www.nrel.gov/publications.
Available electronically at SciTech Connect http:/www.osti.gov/scitech
Available for a processing fee to U.S. Department of Energy and its contractors, in paper, from:
U.S. Department of Energy Office of Scientific and Technical Information P.O. Box 62 Oak Ridge, TN 37831-0062 OSTI http://www.osti.gov Phone: 865.576.8401 Fax: 865.576.5728 Email: [email protected]
Available for sale to the public, in paper, from:
U.S. Department of Commerce National Technical Information Service 5301 Shawnee Road Alexandria, VA 22312 NTIS http://www.ntis.gov Phone: 800.553.6847 or 703.605.6000 Fax: 703.605.6900 Email: [email protected]
Cover Photos by Dennis Schroeder: (left to right) NREL 26173, NREL 18302, NREL 19758, NREL 29642, NREL 19795.
NREL prints on paper that contains recycled content.

iii
This report is available at no cost from the National Renewable Energy Laboratory (NREL) at www.nrel.gov/publications.
Consumer Views Quick Facts The following findings are based on a February 2015 study that covered consumer attitudes toward plug-in electric vehicles. The study covered a 1,015-household sample designed to be representative of the United States population.
Vehicle Purchasing Behaviors • 60% of respondent households owned two or more vehicles. • 53% of respondents stated their last vehicle purchases were sedans. • 48% of respondents stated their next vehicle purchases would likely be sedans. • 29% of respondent households had purchased vehicles in the last year. Plug-in Electric Vehicle Awareness • 48% of respondents were able to name a specific plug-in electric vehicle make and model. • 49% of respondents reported having seen plug-in electric vehicles in parking lots. • 52% of respondents stated plug-in hybrid electric vehicles were just as good as or better than
traditional gasoline vehicles. • 45% of respondents stated pure electric vehicles were just as good as or better than
traditional gasoline vehicles. • 24% of respondents stated they would consider or expect to purchase plug-in hybrid electric
vehicles for their next vehicle purchase or lease. • 20% of respondents stated they would consider or expect to purchase pure electric vehicles
for their next vehicle purchase or lease. Barriers to Plug-in Electric Vehicle Acceptance • A pure electric vehicle would need to be able to travel 300 miles on a single charge for 56%
of respondents to be willing to consider purchasing one. • 18% of respondents were aware of charging stations on the routes they regularly drove. • 53% of respondents could consistently park their vehicles near electrical outlets at home. • 51% of respondents would be willing to pay incremental costs for plug-in electric vehicles. Plug-in Electric Vehicle Acceptance • Respondents who were aware of plug-in electric vehicle charging stations were more likely
than respondents overall to view plug-in electric vehicles positively and be willing to consider purchasing them.
• Respondents who were able to name one of the top nine best-selling plug-in electric vehicles were more likely than respondents overall to view plug-in electric vehicles positively and be willing to consider purchasing them.
• New vehicle purchasers were more likely than used vehicle purchasers to view plug-in electric vehicles positively and be willing to consider purchasing them.

iv
This report is available at no cost from the National Renewable Energy Laboratory (NREL) at www.nrel.gov/publications.
Acronyms EV electric vehicle
mpg miles per gallon
NREL National Renewable Energy Laboratory
ORC Opinion Research Corporation
PEV plug-in electric vehicle
PHEV plug-in hybrid electric vehicle

v
This report is available at no cost from the National Renewable Energy Laboratory (NREL) at www.nrel.gov/publications.
Acknowledgments This work has been supported by the U.S. Department of Energy’s Vehicle Technologies Office. Additional support came from the National Renewable Energy Laboratory, which is a national laboratory of the U.S. Department of Energy’s Office of Energy Efficiency and Renewable Energy operated by the Alliance for Sustainable Energy, LLC.
The author would like to thank advanced vehicle technology deployment subject matter experts Alicia Birky, Aaron Brooker, Belinda Chen, Stacy Davis, David Greene, Zhenhong Lin, Changzheng Liu, Dawn Manley, Michael Nicholas, Aymeric Rousseau, Dan Santini, Tom Stephens, Joann Zhou, Caley Johnson, George Mitchell, and Margo Melendez who provided helpful insights into how vehicle technologies might be accepted into the marketplace.
The author would like to specifically thank Jake Ward at the U.S. Department of Energy’s Vehicle Technologies Office, who ensured that the resources necessary for this research would be available.
All judgments in the final analytic methodologies and interpretations are the responsibility of the author.
vi
This report is available at no cost from the National Renewable Energy Laboratory (NREL) at www.nrel.gov/publications.
Table of Contents List of Figures ........................................................................................................................................... vii Introduction ................................................................................................................................................. 1
Vehicle Purchasing Behaviors ............................................................................................................ 3 1.1 Vehicle Purchasing Behaviors....................................................................................................... 4 1.2 Household Vehicle Ownership ...................................................................................................... 5 1.3 Household Vehicle Types ............................................................................................................. 6 1.4 Time Since Last and Until Next Vehicle Purchase ....................................................................... 7 1.5 New and Used Vehicle Purchasers ................................................................................................ 8 1.6 Household Vehicle Fuel Types ..................................................................................................... 9
Plug-in Electric Vehicle Awareness .................................................................................................. 10 2.1 Plug-in Electric Vehicle Awareness and Acceptance Overview ................................................. 11 2.2 Ability To Name a Specific Plug-in Electric Vehicle Make and Model ..................................... 12 2.3 Exposure to Plug-in Electric Vehicles ......................................................................................... 13 2.4 Opinions of Plug-in Electric Vehicles ......................................................................................... 14 2.5 Consumers Considering Plug-in Electric Vehicles and Why ...................................................... 15 2.6 Reasons for Not Considering Plug-in Electric Vehicles ............................................................. 16
Barriers to Plug-in Electric Vehicle Acceptance ............................................................................. 17 3.1 Barriers to Plug-in Electric Vehicle Acceptance Overview ........................................................ 18 3.2 Required Electric Vehicle Range ................................................................................................ 19 3.3 Perceived Ability To Charge a Plug-in Electric Vehicle ............................................................. 20 3.4 Vehicle Purchase Price ................................................................................................................ 21 3.5 Willingness To Pay for a Plug-in Electric Vehicle ..................................................................... 22
Plug-in Electric Vehicle Acceptance ................................................................................................ 23 4.1 Plug-in Electric Vehicle Acceptance Overview .......................................................................... 24 4.2 Segments of Plug-in Hybrid Electric Vehicle Acceptance .......................................................... 26 4.3 Segments of Electric Vehicle Acceptance ................................................................................... 27 4.4 Willingness To Consider Plug-in Hybrid Electric Vehicles by Segment .................................... 28 4.5 Willingness To Consider Electric Vehicles by Segment ............................................................. 29
References ................................................................................................................................................. 30

vii
This report is available at no cost from the National Renewable Energy Laboratory (NREL) at www.nrel.gov/publications.
List of Figures Figure 1. Question 1: Registered vehicles per household ............................................................................. 5 Figure 2. Comparison of registered vehicles per household over time ......................................................... 5 Figure 3. Questions 2 and 3: Last and next vehicle type choices ................................................................. 6 Figure 4. Question 4: Time since last vehicle purchase ................................................................................ 7 Figure 5. Question 5: Time until next vehicle purchase ............................................................................... 7 Figure 6. Time since last or until next vehicle purchase ............................................................................... 7 Figure 7. Question 5A: Likelihood of purchasing a new versus a used vehicle ........................................... 8 Figure 8. Question 6: Household vehicle fuel types ..................................................................................... 9 Figure 9. Question 7: Ability to name a PEV make and model .................................................................. 12 Figure 10. Question 8: Exposure to PEVs .................................................................................................. 13 Figure 11. Questions 9A and 9B: Comparison of PHEVs and EVs to gasoline vehicles ........................... 14 Figure 12. Questions 10A and 10B: Willingness to consider purchasing PHEVs and EVs ....................... 15 Figure 13. Question 11: Reasons for considering PEVs ............................................................................. 15 Figure 14. Question 12: Reasons for not considering PEVs ....................................................................... 16 Figure 15. Question 13: PEV traits that could increase purchase consideration......................................... 16 Figure 16. Question 14: Required EV range for purchase consideration.................................................... 19 Figure 17. Question 15: Awareness of PEV charging stations ................................................................... 20 Figure 18. Question 16: Ability to charge a PEV at home.......................................................................... 20 Figure 19. Question 17: Expected next vehicle purchase price .................................................................. 21 Figure 20. Question 18: Willingness to pay for a PEV ............................................................................... 22 Figure 21. Segments of PHEV acceptance ................................................................................................. 26 Figure 22. Segments of EV acceptance ...................................................................................................... 27 Figure 23. Willingness to consider PHEVs by segment ............................................................................. 28 Figure 24. Willingness to consider EVs by segment .................................................................................. 29

1
This report is available at no cost from the National Renewable Energy Laboratory (NREL) at www.nrel.gov/publications.
Introduction Vehicle manufacturers, government agencies, universities, private researchers, and organizations worldwide are pursuing advanced vehicle technologies that aim to reduce the consumption of petroleum in the forms of gasoline and diesel. Plug-in electric vehicles (PEVs) are one such technology. This report details study findings of broad American public sentiments toward issues that surround PEVs and is supported by the U.S. Department of Energy’s Vehicle Technologies Office in alignment with its mission to develop and deploy these technologies to improve energy security, enhance mobility flexibility, reduce transportation costs, and increase environmental sustainability.
A PEV is broadly defined as a vehicle that can be plugged in, is powered by an electric motor, and uses energy stored in an onboard battery. The definition includes pure electric vehicles (EVs) that are powered by electric motors only and plug-in hybrid electric vehicles (PHEVs) that can also be powered by an internal combustion engine fueled by petroleum fuel. The most recent generation of PEVs has been commercially available in the United States since December 2010. A PEV is different from a hybrid electric vehicle (HEV). An HEV is similar to a PHEV, as it is powered by an internal combustion engine and an electric motor that uses energy stored in a battery. However, the battery in an HEV cannot be plugged in; it is charged through regenerative braking and/or by the internal combustion engine.
This report summarizes data captured in a February 2015 study that focused on respondents’ sentiments about factors that influence PEV adoption.
• Section 1 captures respondent vehicle purchasing behavior independent of a particular vehicle technology.
• Section 2 details current consumer awareness and acceptance of PEV technologies.
• Section 3 captures metrics associated with known barriers to PEV acceptance, including battery capacity and vehicle costs.
• Section 4 highlights segments of the respondents in which PEV acceptance may be higher than the respondent group in total.
The data detailed in this report will be similarly captured in planned subsequent annual studies allowing for tracking of public perception associated with PEV deployment efforts.
Understanding and tracking consumer sentiments can influence the prioritization of development efforts by identifying barriers to and opportunities for the broad acceptance of new technologies. It is important to acknowledge that a person’s stated preference in an interview about a hypothetical setting often does not match his or her revealed preference, which is demonstrated in an actual decision making situation (Kane and Wasi 2013). This difference makes tracking actual consumer actions ultimately more valuable in understanding potential behavior. However, when technologies are not yet available or are new to a marketplace and actual behaviors cannot be tracked, stated preferences provide some insights into how consumers may react in new circumstances. In this context, this report provides a supplemental source to validate other data and a new resource when no data are available.

2
This report is available at no cost from the National Renewable Energy Laboratory (NREL) at www.nrel.gov/publications.
Most of the data presented in this report are the results of interviews conducted by the Opinion Research Corporation (ORC) for the National Renewable Energy Laboratory (NREL). The ORC CARAVAN studies were conducted via telephone with randomly selected telephone numbers. The study in this report used a dual-frame sampling design in which the sample was drawn from independent landline and cell phone sample frames and is based on responses from individuals across the country who were at least 18 years old. Response samples were weight-adjusted to better ensure that the sample reflects the general U.S. population. The CARAVAN studies relied on ORC’s weighting mechanism, which pulls from data reported in the National Health Interview Survey and the U.S. Census Bureau’s Current Population Survey. When ORC study data are presented, the specific ORC study number is noted along with the year of the study and the study sample size. The February 2015 study included 1,015 respondents and had a margin of error of ±3% at the 95% confidence level. Smaller subgroups of the respondents will have larger error margins.
In many instances throughout this report, the response percentages in tables and figures do not sum to exactly 100% because the raw data are rounded. For the same reason, summary data points called out in the body of the report may not match the results that were obtained by summing data from the tables and figures.

3
This report is available at no cost from the National Renewable Energy Laboratory (NREL) at www.nrel.gov/publications.
Vehicle Purchasing Behaviors
Contents 1.1 Vehicle Purchasing Behaviors ...........................................................................................4 1.2 Household Vehicle Ownership ..........................................................................................5 1.3 Household Vehicle Types ..................................................................................................6 1.4 Time Since Last and Until Next Vehicle Purchase ...........................................................7 1.5 New and Used Vehicle Purchasers ....................................................................................8 1.6 Household Vehicle Fuel Types .........................................................................................9

4
This report is available at no cost from the National Renewable Energy Laboratory (NREL) at www.nrel.gov/publications.
1.1 Vehicle Purchasing Behaviors The February 2015 study began by investigating aspects of the respondents’ vehicle purchasing behaviors that are independent of a specific vehicle technology. Capturing these inherent metrics about the market might highlight a particular barrier or benefit to PEV or other advanced vehicle technology adoption.
The study began by inquiring about the current number of household vehicles. If this number decreases, the number of new purchases of any vehicle technology may also decline. Conversely, an increase in household vehicle ownership may provide additional opportunities for all vehicle technologies. Multivehicle households may be better suited for PEVs than single-vehicle households because pure EVs specifically can be limited by battery capacity on longer trips. A household with multiple vehicles might be better able to provide alternative transportation for those trips than one without multiple vehicles. This study found that 60% of respondent households own two or more vehicles. In relation to a study completed in April 2007, the percentage of zero- and single-vehicle households increased slightly.
PEV acceptance will depend, in part, on their availability in the vehicle types that consumers desire. Current PEV offerings are primarily smaller sedans. The study referred to sedans as small and large cars. More than half (53%) of respondents stated their last vehicle purchases were sedans; 48% stated their next vehicle purchases would likely be similar. Although these are large percentages of the vehicle market, either PEVs will need to become available in a broader set of vehicle types, or purchasers will need to shift their interests to PEV vehicle types if PEVs are to achieve very high percentages of vehicle purchases.
Consumers’ buying habits for vehicle purchases vary. An individual customer may purchase a new vehicle every 3 years or even more frequently; others may keep their vehicles for 10 years or longer. This study found that 39% of respondents either purchased vehicles in the last year or expected to purchase vehicles in the next year. Purchasers’ interests in new or used vehicles also vary. A majority (59%) of respondents stated they might consider a new vehicle for their next vehicle purchase; 41% stated they would be unlikely to consider a new vehicle and would likely purchase a used vehicle.
Finally, the study investigated the vehicle fuel types that respondents currently owned. As expected, the overwhelming majority of respondents (86%) owned traditional gasoline vehicles. However, 24% stated they owned alternative vehicle technologies including diesel, ethanol, compressed natural gas, HEVs, and PEVs. Very small percentages (1% each) of all respondents reported owning PHEVs or EVs. Respondent ownership rates of alternative vehicle technologies tracked closely with actual vehicle registration data. However, as shown in Figure 8, respondents consistently stated higher alternative vehicle technology ownership rates than those shown by actual vehicle registration data.

5
This report is available at no cost from the National Renewable Energy Laboratory (NREL) at www.nrel.gov/publications.
1.2 Household Vehicle Ownership
Figure 1. Question 1: Registered vehicles per household
Figure 2. Comparison of registered vehicles per household over time
Sources: For 2015: ORC for NREL (2015), Study No. 724068, n=1,015. For 2007: ORC for NREL (2007), Study No. 716159, n=1,000. U.S. Census Bureau. 2011-2013. “Household Size by Vehicles Available.” 3-Year American Community Survey, USACS_13_3YR_B08201. Washington, D.C.: U.S. Census Bureau. Accessed August 5, 2015, http://factfinder.census.gov/faces/tableservices/jsf/pages/productview.xhtml?pid=ACS_13_3YR_B08201&prodType=table. Note: Given the current study covered 1,015 households and the ACS covered more than 3.5 million households, it is not concluded that the current study identifies a clear change in household vehicle ownership rates from those captured by the ACS. Rather, the comparison is shown to put the respondent group in context with the broader general public.
In February 2015, the mean number of vehicles owned by respondent households was 1.9. A significant majority (74%) reported owning two or fewer vehicles, while 60% reported owning two or more vehicles. Compared to an April 2007 study that asked the same question, responses showed a slight decline in the number of two-vehicle households and a slight increase in zero- and single-vehicle households. Compared to the latest U.S. Census Bureau American Community Survey (ACS) data from 2013, February 2015 respondents had fewer one- and two-vehicle households and more households with four or more vehicles.

6
This report is available at no cost from the National Renewable Energy Laboratory (NREL) at www.nrel.gov/publications.
1.3 Household Vehicle Types
Figure 3. Questions 2 and 3: Last and next vehicle type choices
Source: ORC for NREL (2015), Study No. 724068, n=1,015. Note: Small cars were defined as being “smaller than the Chevy Malibu, Toyota Camry, or Ford Fusion” and large cars were defined as being the “same size or larger than the Chevy Malibu, Toyota Camry, or Ford Fusion.”
The February 2015 study asked respondents to provide the vehicle types of their last vehicle purchases and the vehicle types they expected to purchase next. Respondents showed the strongest interest in sedans, which were categorized in the study as small and large cars. When their latest purchase choices were compared to what they expect to purchase next, the responses showed that interest may have shifted slightly away from sedans and toward sport utility vehicles. However, this shift may represent the respondents’ aspirations to shift to a new vehicle type rather than what their next vehicle purchase will ultimately be.

7
This report is available at no cost from the National Renewable Energy Laboratory (NREL) at www.nrel.gov/publications.
1.4 Time Since Last and Until Next Vehicle Purchase
Figure 4. Question 4: Time since last vehicle purchase
Figure 5. Question 5: Time until next vehicle purchase
Figure 6. Time since last or until next vehicle purchase
Source: ORC for NREL (2015), Study No. 724068, n=1,015.
Respondents in February 2015 were asked how long it had been since their last vehicle purchases and how long it would be before their next vehicle purchases. A majority (59%) of respondents purchased vehicles in the last 3 years, and 50% expected to purchase vehicles within the next 3 years.
Figure 6 displays a measure pulled from the results of questions 4 and 5. Respondents that had either purchased a vehicle in the last year or intended to do so in the next year were classified to be within one year of a vehicle purchase. Of the remaining respondents, those that had purchased a vehicle in the last 1 - 3 years or intended to do so in the next 1 - 3 years were classified as being within 1 - 3 years of a vehicle purchase. The remaining segments followed similarly. Once this analysis was completed, 39% of respondents were within 1 year of vehicle purchases.
8
This report is available at no cost from the National Renewable Energy Laboratory (NREL) at www.nrel.gov/publications.
1.5 New and Used Vehicle Purchasers
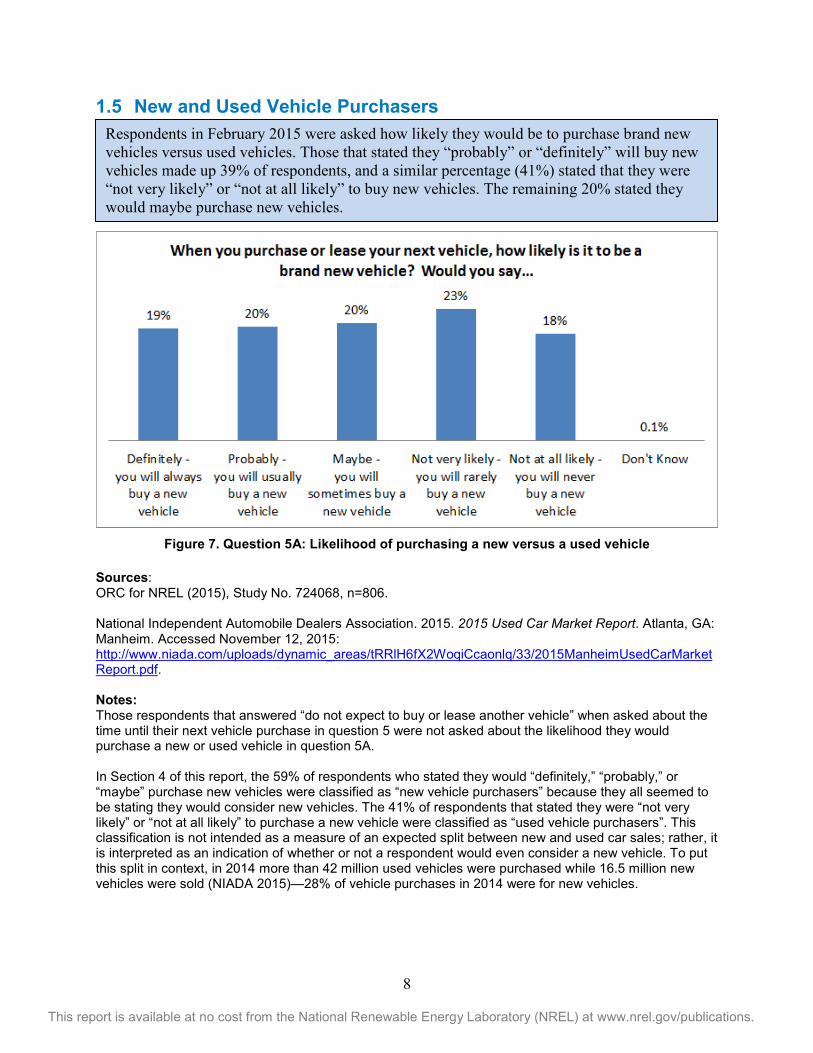
Figure 7. Question 5A: Likelihood of purchasing a new versus a used vehicle
Sources: ORC for NREL (2015), Study No. 724068, n=806. National Independent Automobile Dealers Association. 2015. 2015 Used Car Market Report. Atlanta, GA: Manheim. Accessed November 12, 2015: http://www.niada.com/uploads/dynamic_areas/tRRlH6fX2WoqiCcaonlq/33/2015ManheimUsedCarMarketReport.pdf. Notes: Those respondents that answered “do not expect to buy or lease another vehicle” when asked about the time until their next vehicle purchase in question 5 were not asked about the likelihood they would purchase a new or used vehicle in question 5A. In Section 4 of this report, the 59% of respondents who stated they would “definitely,” “probably,” or “maybe” purchase new vehicles were classified as “new vehicle purchasers” because they all seemed to be stating they would consider new vehicles. The 41% of respondents that stated they were “not very likely” or “not at all likely” to purchase a new vehicle were classified as “used vehicle purchasers”. This classification is not intended as a measure of an expected split between new and used car sales; rather, it is interpreted as an indication of whether or not a respondent would even consider a new vehicle. To put this split in context, in 2014 more than 42 million used vehicles were purchased while 16.5 million new vehicles were sold (NIADA 2015)—28% of vehicle purchases in 2014 were for new vehicles.
Respondents in February 2015 were asked how likely they would be to purchase brand new vehicles versus used vehicles. Those that stated they “probably” or “definitely” will buy new vehicles made up 39% of respondents, and a similar percentage (41%) stated that they were “not very likely” or “not at all likely” to buy new vehicles. The remaining 20% stated they would maybe purchase new vehicles.

9
This report is available at no cost from the National Renewable Energy Laboratory (NREL) at www.nrel.gov/publications.
1.6 Household Vehicle Fuel Types
Figure 8. Question 6: Household vehicle fuel types
Sources: ORC for NREL (2015), Study No. 724068, n=1,015. Polk, R.L. 2015. “POLK_VIO_DETAIL_2014.” March 17, 2015. Golden, CO: NREL.
The overwhelming majority of households (86%) owned traditional gasoline vehicles in February 2015. Ethanol-capable and diesel vehicles were owned by 10% and 8% of respondents, respectively. Compressed natural gas and EV technologies were owned by small percentages of respondents. Nearly a quarter (24%) reported owning vehicles other than traditional gasoline vehicles. However, 5% owned only vehicles of fuel type(s) other than traditional gasoline. Respondent ownership rates of technologies other than traditional gasoline were all higher than percentages of overall vehicle registrations. The comparison is not direct, as the study data percentages are of households, which may own more than one vehicle, and the registration data percentages are of total individual vehicle registrations. Additionally, it is possible respondents may have been confused or unsure of the specific vehicle technologies they own. However, the comparison shows the study respondents stated that they own gasoline-alternative technologies at a higher rate than the population captured by registration data.

10
This report is available at no cost from the National Renewable Energy Laboratory (NREL) at www.nrel.gov/publications.
Plug-in Electric Vehicle Awareness
Contents 2.1 Plug-in Electric Vehicle Awareness and Acceptance Overview .....................................11 2.2 Ability To Name a Specific Plug-in Electric Vehicle Make and Model .........................12 2.3 Exposure to Plug-in Electric Vehicles .............................................................................13 2.4 Opinions of Plug-in Electric Vehicles .............................................................................14 2.5 Consumers Considering Plug-in Electric Vehicles and Why ..........................................15 2.6 Reasons for Not Considering Plug-in Electric Vehicles .................................................16

11
This report is available at no cost from the National Renewable Energy Laboratory (NREL) at www.nrel.gov/publications.
2.1 Plug-in Electric Vehicle Awareness and Acceptance Overview For PEVs to be owned in large numbers, respondents will need to be aware of the technologies and ultimately be willing to consider purchasing PEVs. This study attempted to quantify respondent awareness and acceptance of PEVs.
The study asked respondents if they were able to name a PEV specific make and model. Nearly half (48%) were able to name a specific PEV make and model and 42% were able to name one of the top nine best-selling makes and models at the time of the study. Conversely, 52% were not able to name a specific PEV make and model.
Respondents were also asked about their levels of exposure to PEVs. The theory of diffusion of innovations (Rogers 2010) describes how new technologies become accepted. Accordingly, a measure of exposure can serve as a prerequisite and proxy measure for future vehicle purchases. Small percentages of respondents stated they had sat in or driven PEVs; 49% reported having seen PEVs in parking lots.
A possible way to track acceptance of PEVs is to track how respondents view the technology compared to the current standard technology (i.e., traditional gasoline vehicles). This study found that PHEVs are viewed by 52% of respondents as being as good as or better than gasoline vehicles. A smaller percentage (45%) said the same about EVs.
Respondents also reported their willingness to consider purchasing PEVs. A small percentage (24%) of respondents stated they expected to purchase or expected to consider purchasing PHEVs. Similarly, 20% stated the same about EVs. The top reasons given for considering PEV purchases were that they viewed the technology as being better for the environment and that it would save money on fuel. The top reason for not considering the technology was that PEVs are viewed as being too expensive.

12
This report is available at no cost from the National Renewable Energy Laboratory (NREL) at www.nrel.gov/publications.
2.2 Ability To Name a Specific Plug-in Electric Vehicle Make and Model
Figure 9. Question 7: Ability to name a PEV make and model
Source: ORC for NREL (2015), Study No. 724068, n=1,015. Note: The Toyota Prius was available at the time of the study as an HEV and a PHEV; some respondents may have confused the two versions. A follow-up question asked respondents who mentioned only the Toyota Prius in the initial question to name another make and model. Just 6% of respondents overall could name only the Toyota Prius. If all these respondents were actually unaware of the Toyota Prius Plug-in PHEV, the percentage that were unable to name a PEV make and model would climb to 58% and the percentage who were aware of the Toyota Prius Plug-in would fall from 18% to 12%.
Respondents were asked if they could name a PEV, and 48% were able to name a specific vehicle make and model. Further, 42% were able to name at least one of the nine top best-selling makes and models at the time of the study.

13
This report is available at no cost from the National Renewable Energy Laboratory (NREL) at www.nrel.gov/publications.
2.3 Exposure to Plug-in Electric Vehicles
Figure 10. Question 8: Exposure to PEVs
Source: ORC for NREL (2015), Study No. 724068, n=1,015. Note: Respondents were given the following information before being asked about their exposure to and opinion of PEVs beginning with question 8: “Plug-in electric vehicles can be charged by being plugged into a household-type outlet or specially designed charging equipment. These can be defined as plug-in hybrids or pure electric vehicles. Not included in this definition are hybrids, such as the original Toyota Prius, that cannot be plugged in. The Chevy Volt is an example of a plug-in hybrid electric vehicle that can be powered by either the battery or the gasoline engine. The Tesla Model S or the Nissan Leaf are examples of pure electric vehicles powered only by their batteries.”
Respondents were asked if and how they had been exposed to PEVs. More than half (55%) reported having been exposed to PEVs as defined by the categories in Figure 10. Low percentages reported having direct interaction with PEVs such as having owned, having sat in or driven, or having neighbors with PEVs, but 49% reported having seen the vehicles in parking lots.

14
This report is available at no cost from the National Renewable Energy Laboratory (NREL) at www.nrel.gov/publications.
2.4 Opinions of Plug-in Electric Vehicles
Figure 11. Questions 9A and 9B: Comparison of PHEVs and EVs to gasoline vehicles
Sources: Question 9A: ORC for NREL (2015), Study No. 724068, n=506. Question 9B: ORC for NREL (2015), Study No. 724068, n=509. Notes: See note about the information provided to respondents before question 8 in Section 2.3. The respondent group was split for questions 9A, 9B, 10A, and 10B. Roughly half of the respondents were asked about PHEV sentiments in questions 9A and 10A. The second half of respondents was asked about pure EV sentiments in question 9B and 10B.
When asked about their opinions of PEVs, respondents showed a preference for PHEVs over pure EVs compared to traditional gasoline vehicles. Roughly half (52%) stated PHEVs were just as good as or better than traditional gasoline vehicles; 45% stated pure EVs were just as good as or better than traditional gasoline vehicles.

15
This report is available at no cost from the National Renewable Energy Laboratory (NREL) at www.nrel.gov/publications.
2.5 Consumers Considering Plug-in Electric Vehicles and Why
Figure 12. Questions 10A and 10B: Willingness to consider purchasing PHEVs and EVs
Sources: Question 10A: ORC for NREL (2015), Study No. 724068, n=506. Question 10B: ORC for NREL (2015), Study No. 724068, n=509. Notes: See note about the information provided to respondents before question 8 in Section 2.3. See note about the respondent groups for questions 9A, 9B, 10A, and 10B in Section 2.4.
Figure 13. Question 11: Reasons for considering PEVs
Source: ORC for NREL (2015), Study No. 724068, n=223. Note: See note about the information provided to respondents before question 8 in Section 2.3.
Respondents showed a greater interest in PHEVs compared to EVs when asked if they would consider purchasing the vehicles. A small percentage (24%) stated they would consider or expect to purchase PHEVs; 20% stated they would consider or expect to purchase EVs. A majority, 51% and 58%, stated they would not purchase or lease PHEVs or EVs, respectively. Respondents who had previously stated they expected to purchase or consider purchasing PEVs were asked why. The top reasons for considering PEVs were that PEVs were viewed as better for the environment and would provide fuel cost savings. Respondents also stated in large percentages that they were interested in PEVs because they are better for national energy security, and they are a cutting edge technology.

16
This report is available at no cost from the National Renewable Energy Laboratory (NREL) at www.nrel.gov/publications.
2.6 Reasons for Not Considering Plug-in Electric Vehicles
Figure 14. Question 12: Reasons for not considering PEVs
Figure 15. Question 13: PEV traits that could increase purchase consideration
Source: ORC for NREL (2015), Study No. 724068, n=787. Note: See note about the information provided to respondents before question 8 in Section 2.3.
Respondents who stated they would not consider PEVs were asked why. The primary reason given by 55% was that the vehicles are too expensive. None of the other reasons given for not considering PEVs were given by a majority of respondents. A follow-up question asked about factors that might influence respondents to consider PEVs. A majority (60% and 59%, respectively) stated that if PEVs were truly better for the environment, or if they saved money on fuel, they would be more likely to consider PEVs. Smaller percentages (43% and 41%, respectively) stated they would be more likely to consider PEVs if they were truly better for national energy security or were a cutting edge technology.

17
This report is available at no cost from the National Renewable Energy Laboratory (NREL) at www.nrel.gov/publications.
Barriers to Plug-in Electric Vehicle Acceptance
Contents 3.1 Barriers to Plug-in Electric Vehicle Acceptance Overview ............................................18 3.2 Required Electric Vehicle Range ....................................................................................19 3.3 Perceived Ability To Charge a Plug-in Electric Vehicle .................................................20 3.4 Vehicle Purchase Price ....................................................................................................21 3.5 Willingness To Pay for a Plug-in Electric Vehicle .........................................................22

18
This report is available at no cost from the National Renewable Energy Laboratory (NREL) at www.nrel.gov/publications.
3.1 Barriers to Plug-in Electric Vehicle Acceptance Overview Differences in PEVs and conventional gasoline vehicles might prove to be barriers to broad PEV acceptance. The distance a PEV can travel on a single electric charge and the availability of charging stations may be two such PEV-specific barriers. Additionally, any new advanced vehicle technology may carry a significant incremental upfront cost that may deter purchasers.
The electric distance or range PEVs can travel on a single charge is limited by battery size or capacity. Depending on the size of the PEV battery and the type of charging equipment available, the vehicle may require considerable time to recharge. A gasoline vehicle is limited by the distance the vehicle can travel on a single tank of gasoline, but gasoline stations are relatively prevalent, and gasoline vehicles are relatively quick to refuel.
This study asked respondents to provide the vehicle range they would require of a pure EV in order for them to consider purchasing one. This question captures how respondents currently perceive the issue. The results show that a broad set of vehicle ranges would be sufficient for different respondent segments. The vehicles would need to travel 100 miles on a single charge for 27% of respondents to consider the vehicles; however, the vehicles would need to travel 300 miles for a majority (56%) of respondents to consider purchasing the vehicles.
Recharging opportunity can also influence PEV acceptance. This study found 18% of respondents were aware of charging stations that they passed regularly, were at their places of work, or were at the stores and places they frequented. A large majority (79%) of respondents were not aware of any charging stations. However, a majority (57%) stated they could park their vehicles near electrical outlets at home.
The purchase price of PEVs may deter some purchasers. This study found a range of vehicle prices respondents were expecting to pay for their next vehicles. A majority (70%) stated they expected to pay $30,000 or less for their next vehicle, and 42% expected to pay $20,000 or less. Although price is a barrier, current PEV offerings fall within the reported expected price range of 46% of respondents.
Respondents showed some willingness to pay increased upfront costs for a PEV that would reduce their fuel costs by one-third. While just 14% stated they would be willing to pay an increased vehicle cost of more than $9,000, 51% stated a willingness to pay an incremental cost. An additional 26% would consider a PEV, but would not pay an increased cost.

19
This report is available at no cost from the National Renewable Energy Laboratory (NREL) at www.nrel.gov/publications.
3.2 Required Electric Vehicle Range
Figure 16. Question 14: Required EV range for purchase consideration
Source: ORC for NREL (2015), Study No. 724068, n=1,015. Note: See note about the information provided to respondents before question 8 in Section 2.3.
Respondents provided a wide array of EV mile ranges that would be necessary to consider purchasing pure EVs. Fifty miles would be sufficient for 11% of respondents. One hundred miles would be necessary for 27% to consider an EV, and 41% would require 200 miles. For a majority (56%) of respondents to consider EVs, the vehicles would need to travel 300 miles on a single charge. A smaller percentage of respondents (9%) would not consider purchasing PEVs regardless of the vehicle range. The median required range was 250 miles.

20
This report is available at no cost from the National Renewable Energy Laboratory (NREL) at www.nrel.gov/publications.
3.3 Perceived Ability To Charge a Plug-in Electric Vehicle
Figure 17. Question 15: Awareness of PEV charging stations
Figure 18. Question 16: Ability to charge a PEV at home
Sources: For 2015: ORC for NREL (2015), Study No. 724068, n=1,015. For 2006: ORC for NREL (2006), Study No. 715168, n=480. Note: In Section 4 of this report, the 18% segment of respondents who were aware of any charging stations that were on the routes they drove regularly, were at their places of work, or were at the stores and places they frequented were classified as “aware of PEV charging stations”.
Respondents reported a low perceived availability of PEV charging stations. Overall, only 18% of respondents were aware of any charging stations that were on the routes they drove regularly, were at their places of work, or were at the stores and places they frequented. A majority stated they did park their primary vehicles near electrical outlets at home. Thus, feasibly, these vehicles could be charged at the respondents’ homes. The percentage of respondents who parked near outlets slightly declined since the question was asked in April 2006.
21
This report is available at no cost from the National Renewable Energy Laboratory (NREL) at www.nrel.gov/publications.
3.4 Vehicle Purchase Price
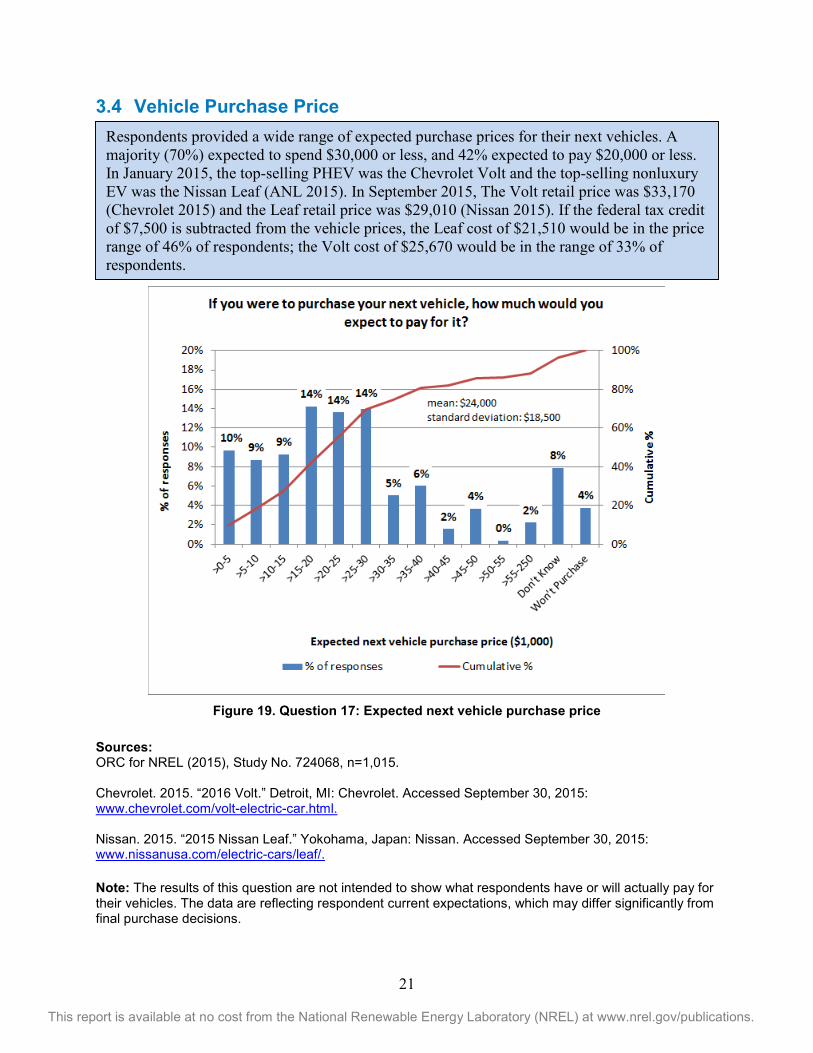
Figure 19. Question 17: Expected next vehicle purchase price
Sources: ORC for NREL (2015), Study No. 724068, n=1,015. Chevrolet. 2015. “2016 Volt.” Detroit, MI: Chevrolet. Accessed September 30, 2015: www.chevrolet.com/volt-electric-car.html. Nissan. 2015. “2015 Nissan Leaf.” Yokohama, Japan: Nissan. Accessed September 30, 2015: www.nissanusa.com/electric-cars/leaf/. Note: The results of this question are not intended to show what respondents have or will actually pay for their vehicles. The data are reflecting respondent current expectations, which may differ significantly from final purchase decisions.
Respondents provided a wide range of expected purchase prices for their next vehicles. A majority (70%) expected to spend $30,000 or less, and 42% expected to pay $20,000 or less. In January 2015, the top-selling PHEV was the Chevrolet Volt and the top-selling nonluxury EV was the Nissan Leaf (ANL 2015). In September 2015, The Volt retail price was $33,170 (Chevrolet 2015) and the Leaf retail price was $29,010 (Nissan 2015). If the federal tax credit of $7,500 is subtracted from the vehicle prices, the Leaf cost of $21,510 would be in the price range of 46% of respondents; the Volt cost of $25,670 would be in the range of 33% of respondents.

22
This report is available at no cost from the National Renewable Energy Laboratory (NREL) at www.nrel.gov/publications.
3.5 Willingness To Pay for a Plug-in Electric Vehicle
Figure 20. Question 18: Willingness to pay for a PEV
Source: ORC for NREL (2015), Study No. 724068, n=1,015.
Respondents showed a diverse willingness to pay incremental costs for PEVs that would cut their fuel costs by one-third. A majority (51%) stated they would be willing to pay an incremental cost, and an additional 26% of respondents would not pay an incremental cost, but would consider the hypothetical PEV. Finally, 14% would not buy PEVs regardless of incremental costs.

23
This report is available at no cost from the National Renewable Energy Laboratory (NREL) at www.nrel.gov/publications.
Plug-in Electric Vehicle Acceptance
Contents 4.1 Plug-in Electric Vehicle Acceptance Overview ..............................................................24 4.2 Segments of Plug-in Hybrid Electric Vehicle Acceptance ..............................................26 4.3 Segments of Electric Vehicle Acceptance .......................................................................27 4.4 Willingness To Consider Plug-in Hybrid Electric Vehicles by Segment ........................28 4.5 Willingness To Consider Electric Vehicles by Segment .................................................29

24
This report is available at no cost from the National Renewable Energy Laboratory (NREL) at www.nrel.gov/publications.
4.1 Plug-in Electric Vehicle Acceptance Overview A broad set of factors affect consumers’ willingness to purchase vehicles. Even when considering established technologies, consumers’ interest and purchase behavior varies to meet their transportation needs. For a new vehicle technology to succeed, consumers will need to become aware of the technology and accept how the new technology can meet their needs.
Questions 9A and 9B (see Section 2.4) identified segments of respondents that believe that PEVs are just as good as or better than traditional gasoline vehicles. Similarly, questions 10A and 10B (see Section 2.5) identified segments of respondents that either expect to purchase PEVs or expect to consider purchasing PEVs. These segments were used as measures of PEV acceptance.
This section identifies additional segments and compares their levels of PEV acceptance to each other and the overall respondent group. The sample sizes for these investigations are smaller than the study overall, but the comparisons highlight where stronger acceptance of PEVs originated in this study. Select segments of respondents were defined as follows:
• New or used vehicle purchasers (see Section 1.5)
• Vehicle purchasers that bought or plan to buy within one year (see Section 1.4)
• Single- or multivehicle households (see Section 1.2)
• Respondents able to name one of the top nine best-selling PEVs (see Section 2.2)
• Respondents who have seen PEVs in parking lots (see Section 2.3)
• Respondents aware of PEV charging stations (see Section 3.3)
• Respondents able to plug in at home (see Section 3.3).
Of the segments investigated, respondents who were aware of PEV charging stations were most likely to agree that PEVs are just as good as traditional gasoline vehicles and most likely to expect to consider purchasing PEVs. This was true for PHEVs and EVs. Respondents who stated they were able to plug vehicles in at home were also more likely to report positive sentiments about PHEVs and EVs.
Respondents’ awareness of PEVs was measured by their ability to name one of the top nine best-selling PEVs and whether they had seen PEVs in parking lots. Respondents who were able to name the specific PEVs were more likely to view PEVs as just as good as or better than traditional gasoline vehicles and were more likely to consider purchasing PEVs. This was true of PHEVs and EVs. Respondents who had seen PEVs in parking lots were more likely to have positive views of PEVs. However, the increase in positive views from the overall group was smaller for EVs than the increase for PHEVs.
New vehicle purchasers were consistently more likely to have positive views of PEVs than used vehicle purchasers. This was true for PHEVs and EVs.
Overall multivehicle households showed a higher acceptance of PEVs. Single-vehicle and multivehicle households reported similar percentages believing PHEVs were just as good as or better than gasoline vehicles, but a higher percentage of multivehicle households believed EVs

25
This report is available at no cost from the National Renewable Energy Laboratory (NREL) at www.nrel.gov/publications.
were just as good as or better than gasoline vehicles. A higher percentage of multivehicle households than single vehicle households reported a willingness to consider PHEVs for their next vehicle purchases, while similar percentages of single- and multivehicle households reported a willingness to consider EVs.
Finally, respondents who had either purchased vehicles in the last year or expected to purchase vehicles in the next year were slightly more likely to view PEVs as just as good as or better than traditional gasoline vehicles and were slightly more likely to consider PEVs for their next vehicle purchases.
A key finding of the study is that those respondents that have been more closely exposed to and are more aware of the new vehicle market in general and PEVs specifically were more likely to have positive views of PEVs. This is highlighted by the results of the study that show higher rates of PEV acceptance among those respondents that are new vehicle purchasers, are within one year of a vehicle purchase, are able to name a specific PEV make and model, have seen PEVs in parking lots, and are aware of PEV charging stations.

26
This report is available at no cost from the National Renewable Energy Laboratory (NREL) at www.nrel.gov/publications.
4.2 Segments of Plug-in Hybrid Electric Vehicle Acceptance
Figure 21. Segments of PHEV acceptance
Source: ORC for NREL (2015), Study No. 724068, see note for sample sizes. Note: The overall sample size for the respondents that were asked about their opinion of PHEVs in relation to traditional gasoline vehicles was n=506 (See Section 2.4). Sample sizes for the respondents that also fit in the additional segments were generally small and were as follows: new vehicle purchasers (n=233), used vehicle purchasers (n=162), bought or planned to buy within one year (n=203), single-vehicle households (n=155), multivehicle households (n=296), able to name one of the nine top-selling PEVs (n=212), aware of PEV charging stations (n=99), able to plug in at home (n=267), and have seen PEVs in parking lots (n=257).
Overall, 52% of respondents stated that PHEVs were just as good as or better than gasoline vehicles. A sampling of respondent segments is shown in Figure 21. Select segments showed an increased likelihood to agree. New vehicle purchasers were more likely to have a positive view of PHEVs than used vehicle purchasers. Respondents who bought vehicles in the previous year or planned to buy vehicles in the next year reported a more positive view of PHEVs. Single-vehicle and multivehicle households did not report higher or lower opinions of PHEVs. Respondents with a higher awareness of PEVs who could name one of the top nine best-selling PEVs or had seen PEVs in parking lots were more likely to report a positive view. Likewise, respondents who parked near electrical outlets at home were more likely to view PHEVs positively. Respondents who reported being aware of charging stations had the highest percentage (67%) reporting a positive view.

27
This report is available at no cost from the National Renewable Energy Laboratory (NREL) at www.nrel.gov/publications.
4.3 Segments of Electric Vehicle Acceptance
Figure 22. Segments of EV acceptance
Source: ORC for NREL (2015), Study No. 724068, see note for sample sizes. Note: The overall sample size for the respondents that were asked about their opinion of EVs in relation to traditional gasoline vehicles was n=509 (See Section 2.4). Sample sizes for the respondents that also fit in the additional segments were generally small and were as follows: new vehicle purchasers (n=241), used vehicle purchasers (n=169), bought or planned to buy within one year (n=197), single-vehicle households (n=139), multivehicle households (n=312), able to name one of the nine top-selling PEVs (n=217), aware of PEV charging stations (n=88), able to plug in at home (n=268), and have seen PEVs in parking lots (n=243).
Overall, 45% of respondents stated that EVs were just as good as or better than gasoline vehicles. A sampling of respondent segments is shown in Figure 22. Select segments showed an increased likelihood to agree. New vehicle purchasers were more likely to have positive views of EVs than used vehicle purchasers. Respondents who bought vehicles in the previous year or planned to buy vehicles in the next year reported more positive views of EVs. Respondents from single-vehicle households were less likely to report positive views of EVs than those from multivehicle households. Respondents with a higher awareness of PEVs who could name one of the top nine best-selling PEVs or had seen PEVs in parking lots were more likely to report positive views. Likewise, respondents who parked near electrical outlets at home were more likely to view EVs positively. Respondents who reported being aware of charging stations had the highest percentage (62%) reporting positive views.

28
This report is available at no cost from the National Renewable Energy Laboratory (NREL) at www.nrel.gov/publications.
4.4 Willingness To Consider Plug-in Hybrid Electric Vehicles by Segment
Figure 23. Willingness to consider PHEVs by segment
Source: ORC for NREL (2015), Study No. 724068, see note for sample sizes. Note: The overall sample size for the respondents that were asked if they would consider purchasing PHEVs was n=506 (See Section 2.5). Sample sizes for the respondents that also fit in the additional segments were generally small and were as follows: new vehicle purchasers (n=233); used vehicle purchasers (n=162); bought or planned to buy within one year (n=203); single-vehicle households (n=155); multivehicle households (n=296); able to name one of the nine top-selling PEVs (n=212); aware of PEV charging stations (n=99); able to plug in at home (n=267); and have seen PEVs in parking lots (n=257).
Overall, 24% of respondents stated they would purchase or consider PHEVs for their next vehicle purchases or leases. A sampling of respondent segments is shown in Figure 23. Select segments showed an increased likelihood to agree. New vehicle purchasers were more likely to consider purchasing PHEVs than used vehicle purchasers. Respondents who bought vehicles in the previous year or planned to buy vehicles in the next year were more likely to consider PHEVs than respondents overall. Multivehicle households were more likely to consider PHEVs than single-vehicle households. Respondents with a higher awareness of PEVs and who could name one of the top nine best-selling PEVs or had seen PEVs in parking lots were more likely to consider PHEVs. Respondents who were able to plug vehicles in at home or were aware of charging stations were more likely to consider PHEVs.

29
This report is available at no cost from the National Renewable Energy Laboratory (NREL) at www.nrel.gov/publications.
4.5 Willingness To Consider Electric Vehicles by Segment
Figure 24. Willingness to consider EVs by segment
Source: ORC for NREL (2015), Study No. 724068, see note for sample sizes. Note: The overall sample size for the respondents that were asked if they would consider purchasing EVs was n=509 (See Section 2.5). Sample sizes for the respondents that also fit in the additional segments were generally small and were as follows: new vehicle purchasers (n=241); used vehicle purchasers (n=169); bought or planned to buy within one year (n=197); single-vehicle households (n=139); multivehicle households (n=312); able to name one of the nine top-selling PEVs (n=217); aware of PEV charging stations (n=88); able to plug in at home (n=268); and have seen PEVs in parking lots (n=243).
Overall, 20% of respondents stated they would purchase or consider purchasing EVs for their next vehicle purchases or leases. A sampling of respondent segments is shown in Figure 24. Select segments showed an increased likelihood to agree. New vehicle purchasers were more likely to consider purchasing EVs than used vehicle purchasers. Respondents who bought vehicles in the previous year or planned to buy vehicles in the next year were slightly more likely to consider EVs than respondents overall. Multivehicle households were about as likely to consider EVs as single-vehicle households. Respondents with a higher awareness of PEVs who could name one of the top nine best-selling PEVs or had seen PEVs in parking lots were more likely to consider EVs. Respondents who were able to plug vehicles in at home were slightly more likely to consider EVs; those who were aware of PEV charging stations were most likely to consider EVs.

30
This report is available at no cost from the National Renewable Energy Laboratory (NREL) at www.nrel.gov/publications.
References Argonne National Laboratory (ANL). 2015. “Light Duty Electric Drive Vehicles Monthly Sales Updates.” Lemont, IL: ANL. Accessed September 2, 2015, www.anl.gov/energy-systems/project/light-duty-electric-drive-vehicles-monthly-sales-updates.
Kane, M.P., and N. Wasi. 2013. The Structure of Consumer Taste Heterogeneity in Revealed vs. Stated Preference Data. Oxford, U.K.: University of Oxford. Accessed August 2015, www.nuffield.ox.ac.uk/economics/papers/2013/SP_RP_data%20-%20Final.pdf.
Rogers, E.M. 2010. Diffusion of Innovations. 4th Edition. New York, NY: Simon and Schuster. Accessed July 2015, https://books.google.com/books?id=v1ii4QsB7jIC&printsec=frontcover&dq=Theory+of+Diffusion+of+Innovation+Rogers&hl=en&sa=X&ved=0CCsQ6AEwAWoVChMIlfqX9aCfyAIVihoeCh3bow_Q#v=onepage&q&f=false.